Litchville, ND Map & Demographics
Litchville Map
Litchville Overview
$27,536
PER CAPITA INCOME
$68,750
AVG FAMILY INCOME
$41,875
AVG HOUSEHOLD INCOME
22.9%
WAGE / INCOME GAP [ % ]
77.1¢/ $1
WAGE / INCOME GAP [ $ ]
0.42
INEQUALITY / GINI INDEX
152
TOTAL POPULATION
74
MALE POPULATION
78
FEMALE POPULATION
94.87
MALES / 100 FEMALES
105.41
FEMALES / 100 MALES
39.3
MEDIAN AGE
2.7
AVG FAMILY SIZE
2.1
AVG HOUSEHOLD SIZE
53
LABOR FORCE [ PEOPLE ]
39.8%
PERCENT IN LABOR FORCE
Litchville Zip Codes
Litchville Area Codes
Income in Litchville
Income Overview in Litchville
Per Capita Income in Litchville is $27,536, while median incomes of families and households are $68,750 and $41,875 respectively.
| Characteristic | Number | Measure |
| Per Capita Income | 152 | $27,536 |
| Median Family Income | 27 | $68,750 |
| Mean Family Income | 27 | $66,696 |
| Median Household Income | 71 | $41,875 |
| Mean Household Income | 71 | $57,158 |
| Income Deficit | 27 | $0 |
| Wage / Income Gap (%) | 152 | 22.86% |
| Wage / Income Gap ($) | 152 | 77.14¢ per $1 |
| Gini / Inequality Index | 152 | 0.42 |
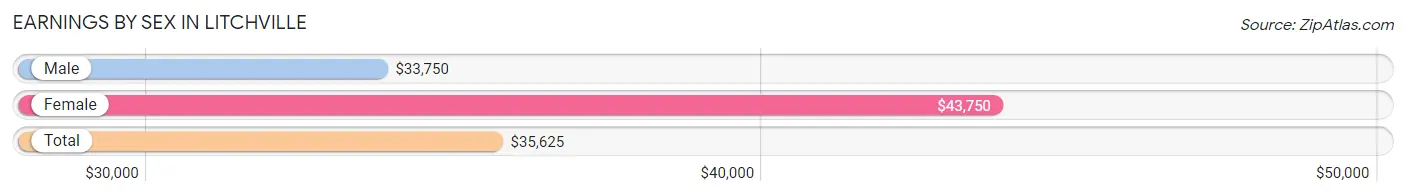
Earnings by Sex in Litchville
Average Earnings in Litchville are $35,625, $33,750 for men and $43,750 for women, a difference of 22.9%.
| Sex | Number | Average Earnings |
| Male | 49 (80.3%) | $33,750 |
| Female | 12 (19.7%) | $43,750 |
| Total | 61 (100.0%) | $35,625 |
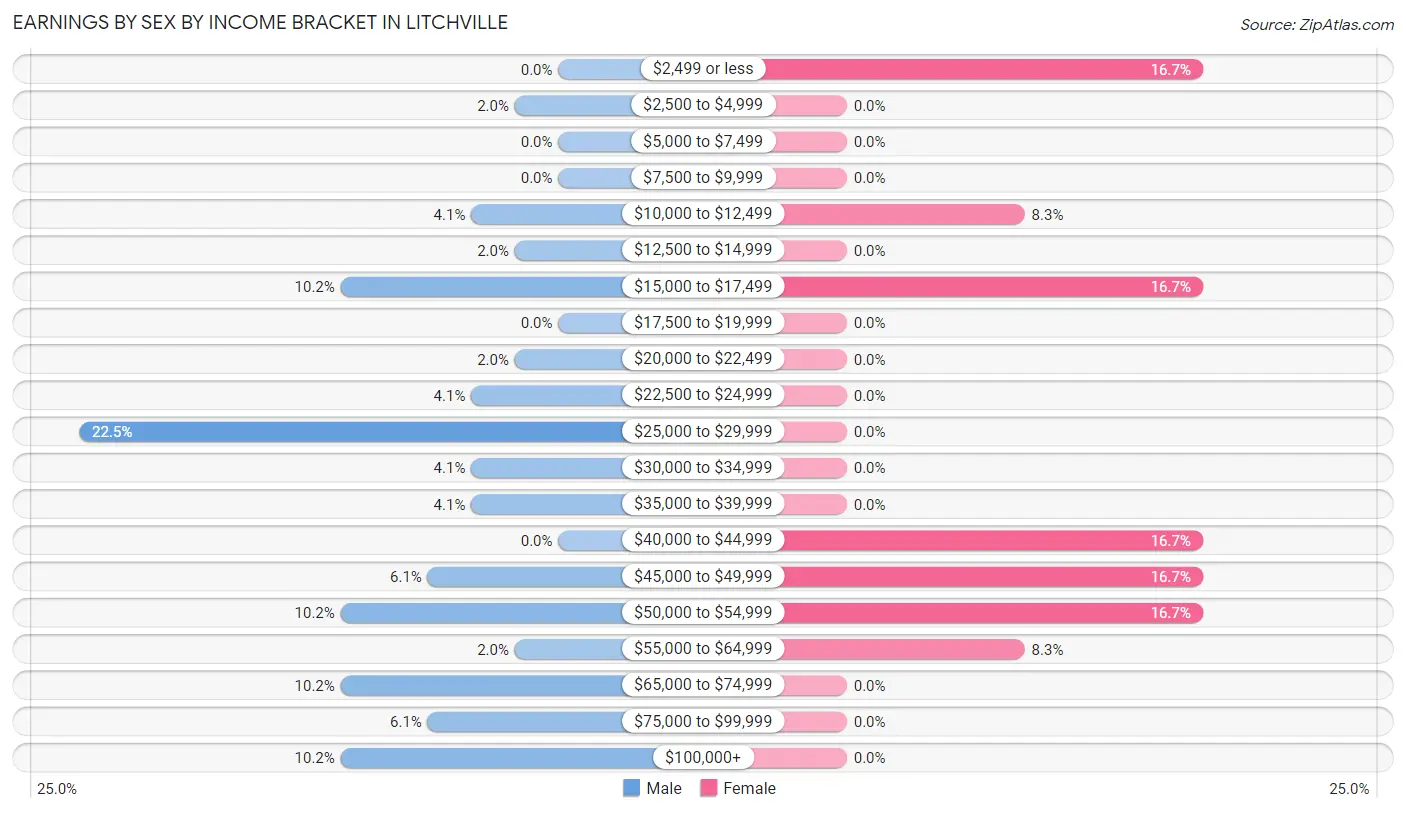
Earnings by Sex by Income Bracket in Litchville
The most common earnings brackets in Litchville are $25,000 to $29,999 for men (11 | 22.5%) and $2,499 or less for women (2 | 16.7%).
| Income | Male | Female |
| $2,499 or less | 0 (0.0%) | 2 (16.7%) |
| $2,500 to $4,999 | 1 (2.0%) | 0 (0.0%) |
| $5,000 to $7,499 | 0 (0.0%) | 0 (0.0%) |
| $7,500 to $9,999 | 0 (0.0%) | 0 (0.0%) |
| $10,000 to $12,499 | 2 (4.1%) | 1 (8.3%) |
| $12,500 to $14,999 | 1 (2.0%) | 0 (0.0%) |
| $15,000 to $17,499 | 5 (10.2%) | 2 (16.7%) |
| $17,500 to $19,999 | 0 (0.0%) | 0 (0.0%) |
| $20,000 to $22,499 | 1 (2.0%) | 0 (0.0%) |
| $22,500 to $24,999 | 2 (4.1%) | 0 (0.0%) |
| $25,000 to $29,999 | 11 (22.5%) | 0 (0.0%) |
| $30,000 to $34,999 | 2 (4.1%) | 0 (0.0%) |
| $35,000 to $39,999 | 2 (4.1%) | 0 (0.0%) |
| $40,000 to $44,999 | 0 (0.0%) | 2 (16.7%) |
| $45,000 to $49,999 | 3 (6.1%) | 2 (16.7%) |
| $50,000 to $54,999 | 5 (10.2%) | 2 (16.7%) |
| $55,000 to $64,999 | 1 (2.0%) | 1 (8.3%) |
| $65,000 to $74,999 | 5 (10.2%) | 0 (0.0%) |
| $75,000 to $99,999 | 3 (6.1%) | 0 (0.0%) |
| $100,000+ | 5 (10.2%) | 0 (0.0%) |
| Total | 49 (100.0%) | 12 (100.0%) |
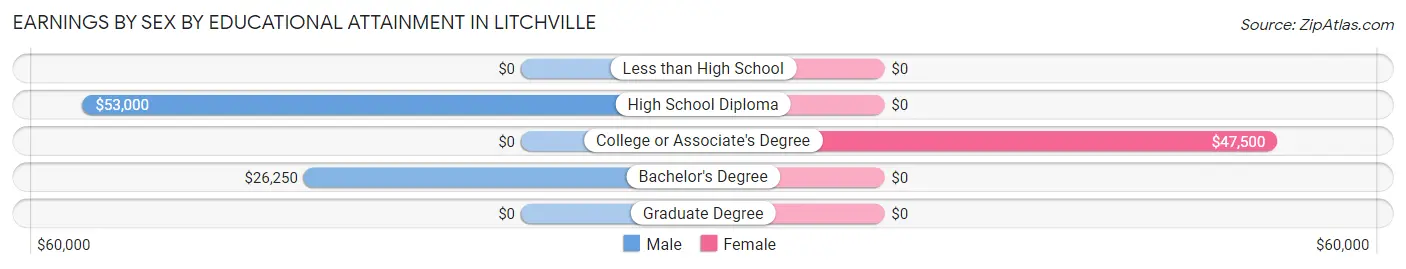
Earnings by Sex by Educational Attainment in Litchville
Average earnings in Litchville are $36,250 for men and $48,125 for women, a difference of 24.7%. Men with an educational attainment of high school diploma enjoy the highest average annual earnings of $53,000, while those with bachelor's degree education earn the least with $26,250. Women with an educational attainment of college or associate's degree earn the most with the average annual earnings of $47,500, while those with college or associate's degree education have the smallest earnings of $47,500.
| Educational Attainment | Male Income | Female Income |
| Less than High School | - | - |
| High School Diploma | $53,000 | $0 |
| College or Associate's Degree | - | - |
| Bachelor's Degree | $26,250 | $0 |
| Graduate Degree | - | - |
| Total | $36,250 | $48,125 |
Family Income in Litchville
Family Income Brackets in Litchville
According to the Litchville family income data, there are 8 families falling into the $15,000 to $24,999 income range, which is the most common income bracket and makes up 29.6% of all families.
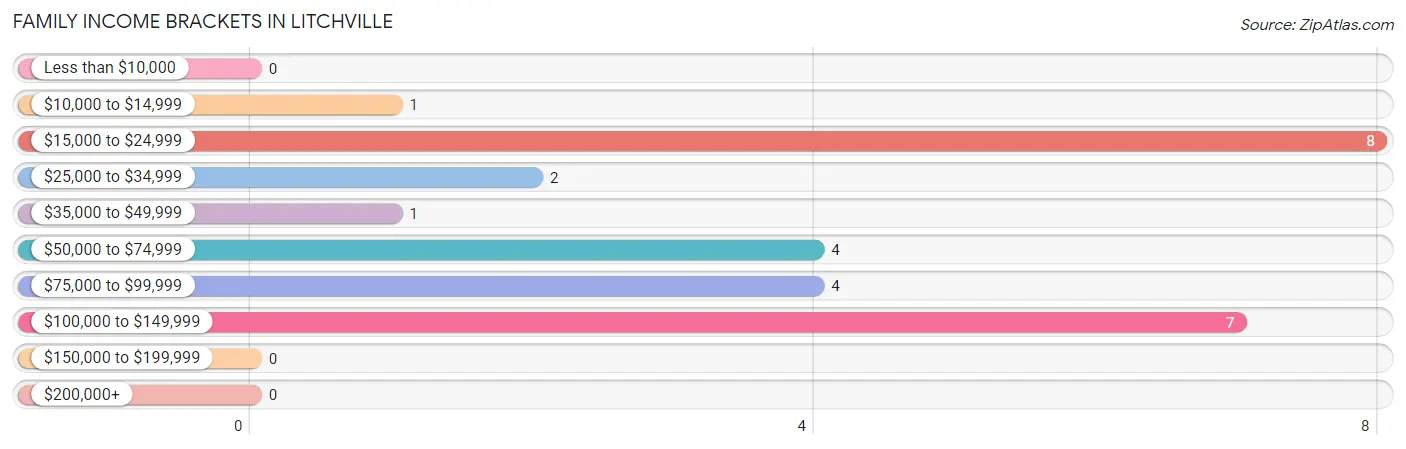
| Income Bracket | # Families | % Families |
| Less than $10,000 | 0 | 0.0% |
| $10,000 to $14,999 | 1 | 3.7% |
| $15,000 to $24,999 | 8 | 29.6% |
| $25,000 to $34,999 | 2 | 7.4% |
| $35,000 to $49,999 | 1 | 3.7% |
| $50,000 to $74,999 | 4 | 14.8% |
| $75,000 to $99,999 | 4 | 14.8% |
| $100,000 to $149,999 | 7 | 25.9% |
| $150,000 to $199,999 | 0 | 0.0% |
| $200,000+ | 0 | 0.0% |
Family Income by Famaliy Size in Litchville
2-person families (14 | 51.8%) account for the highest median family income in Litchville with $90,000 per family, while 2-person families (14 | 51.8%) have the highest median income of $45,000 per family member.
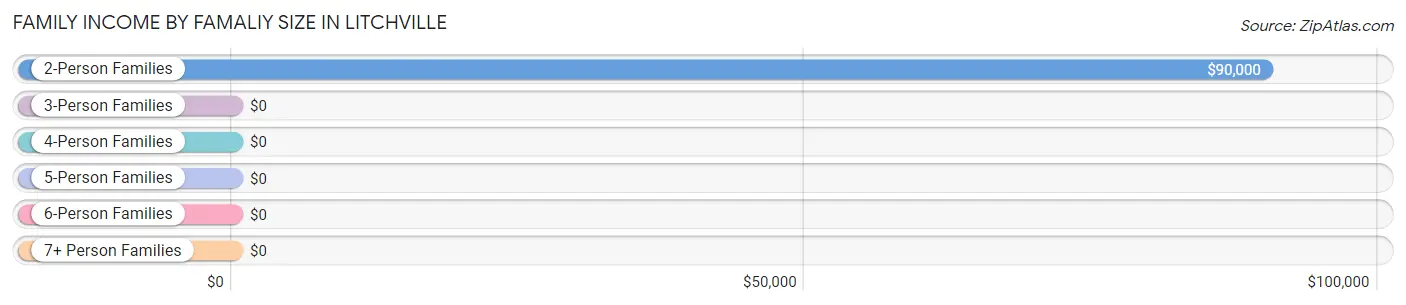
| Income Bracket | # Families | Median Income |
| 2-Person Families | 14 (51.8%) | $90,000 |
| 3-Person Families | 9 (33.3%) | $0 |
| 4-Person Families | 2 (7.4%) | $0 |
| 5-Person Families | 2 (7.4%) | $0 |
| 6-Person Families | 0 (0.0%) | $0 |
| 7+ Person Families | 0 (0.0%) | $0 |
| Total | 27 (100.0%) | $68,750 |
Family Income by Number of Earners in Litchville
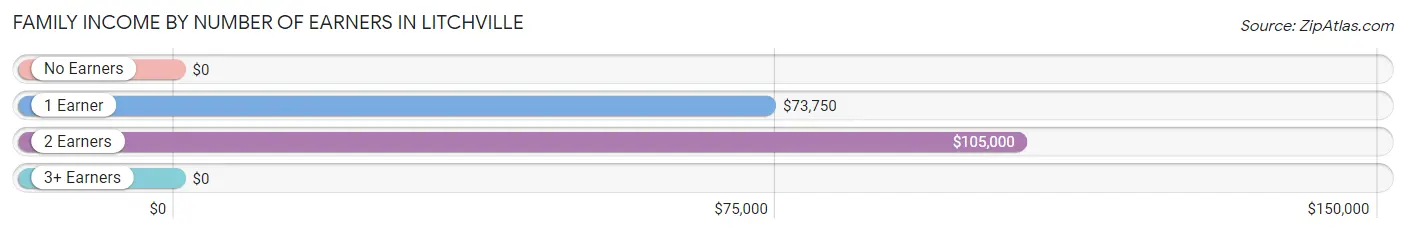
| Number of Earners | # Families | Median Income |
| No Earners | 7 (25.9%) | $0 |
| 1 Earner | 14 (51.8%) | $73,750 |
| 2 Earners | 4 (14.8%) | $105,000 |
| 3+ Earners | 2 (7.4%) | $0 |
| Total | 27 (100.0%) | $68,750 |
Household Income in Litchville
Household Income Brackets in Litchville
With 17 households falling in the category, the $25,000 to $34,999 income range is the most frequent in Litchville, accounting for 23.9% of all households.
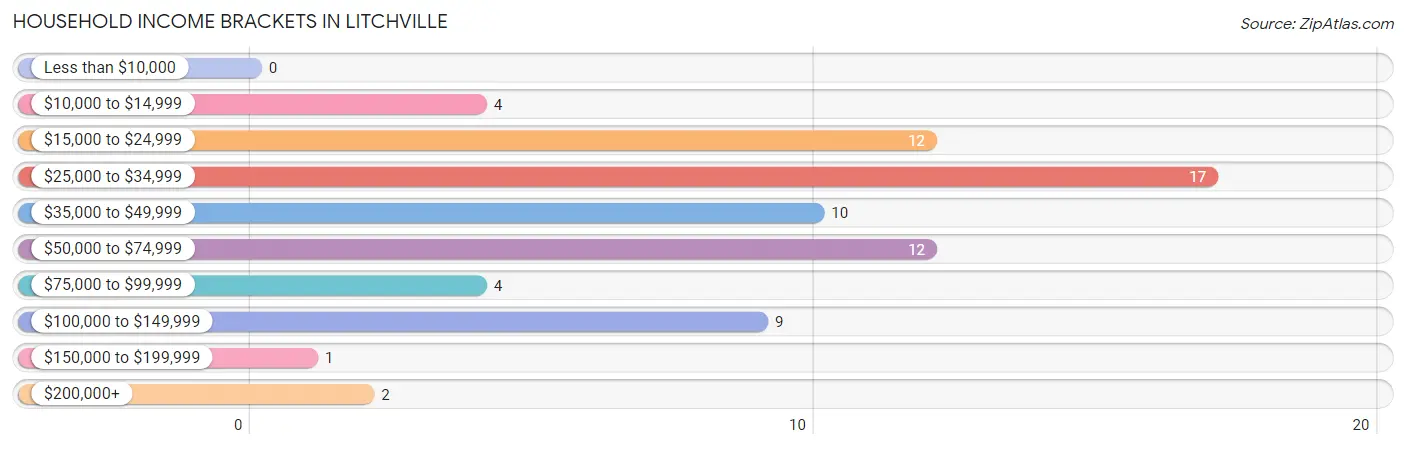
| Income Bracket | # Households | % Households |
| Less than $10,000 | 0 | 0.0% |
| $10,000 to $14,999 | 4 | 5.6% |
| $15,000 to $24,999 | 12 | 16.9% |
| $25,000 to $34,999 | 17 | 23.9% |
| $35,000 to $49,999 | 10 | 14.1% |
| $50,000 to $74,999 | 12 | 16.9% |
| $75,000 to $99,999 | 4 | 5.6% |
| $100,000 to $149,999 | 9 | 12.7% |
| $150,000 to $199,999 | 1 | 1.4% |
| $200,000+ | 2 | 2.8% |
Household Income by Householder Age in Litchville
The median household income in Litchville is $41,875, with the highest median household income of $85,625 found in the 45 to 64 years age bracket for the primary householder. A total of 25 households (35.2%) fall into this category. Meanwhile, the 15 to 24 years age bracket for the primary householder has the lowest median household income of $0, with 4 households (5.6%) in this group.
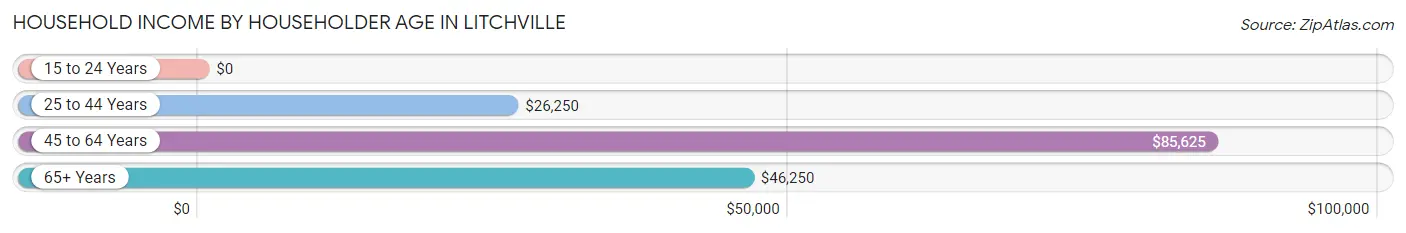
| Income Bracket | # Households | Median Income |
| 15 to 24 Years | 4 (5.6%) | $0 |
| 25 to 44 Years | 24 (33.8%) | $26,250 |
| 45 to 64 Years | 25 (35.2%) | $85,625 |
| 65+ Years | 18 (25.4%) | $46,250 |
| Total | 71 (100.0%) | $41,875 |
Poverty in Litchville
Income Below Poverty by Sex and Age in Litchville
With 24.3% poverty level for males and 69.2% for females among the residents of Litchville, under 5 year old males and under 5 year old females are the most vulnerable to poverty, with 3 males (100.0%) and 2 females (100.0%) in their respective age groups living below the poverty level.
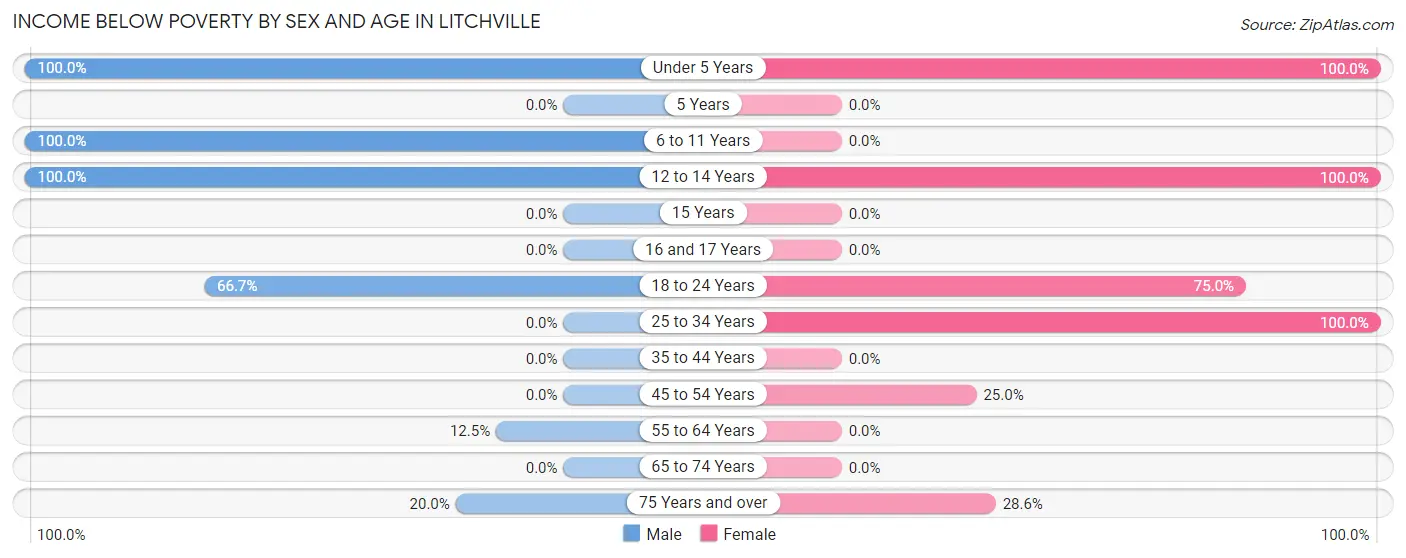
| Age Bracket | Male | Female |
| Under 5 Years | 3 (100.0%) | 2 (100.0%) |
| 5 Years | 0 (0.0%) | 0 (0.0%) |
| 6 to 11 Years | 4 (100.0%) | 0 (0.0%) |
| 12 to 14 Years | 5 (100.0%) | 2 (100.0%) |
| 15 Years | 0 (0.0%) | 0 (0.0%) |
| 16 and 17 Years | 0 (0.0%) | 0 (0.0%) |
| 18 to 24 Years | 2 (66.7%) | 6 (75.0%) |
| 25 to 34 Years | 0 (0.0%) | 40 (100.0%) |
| 35 to 44 Years | 0 (0.0%) | 0 (0.0%) |
| 45 to 54 Years | 0 (0.0%) | 2 (25.0%) |
| 55 to 64 Years | 3 (12.5%) | 0 (0.0%) |
| 65 to 74 Years | 0 (0.0%) | 0 (0.0%) |
| 75 Years and over | 1 (20.0%) | 2 (28.6%) |
| Total | 18 (24.3%) | 54 (69.2%) |
Income Above Poverty by Sex and Age in Litchville
According to the poverty statistics in Litchville, males aged 35 to 44 years and females aged 6 to 11 years are the age groups that are most secure financially, with 100.0% of males and 100.0% of females in these age groups living above the poverty line.
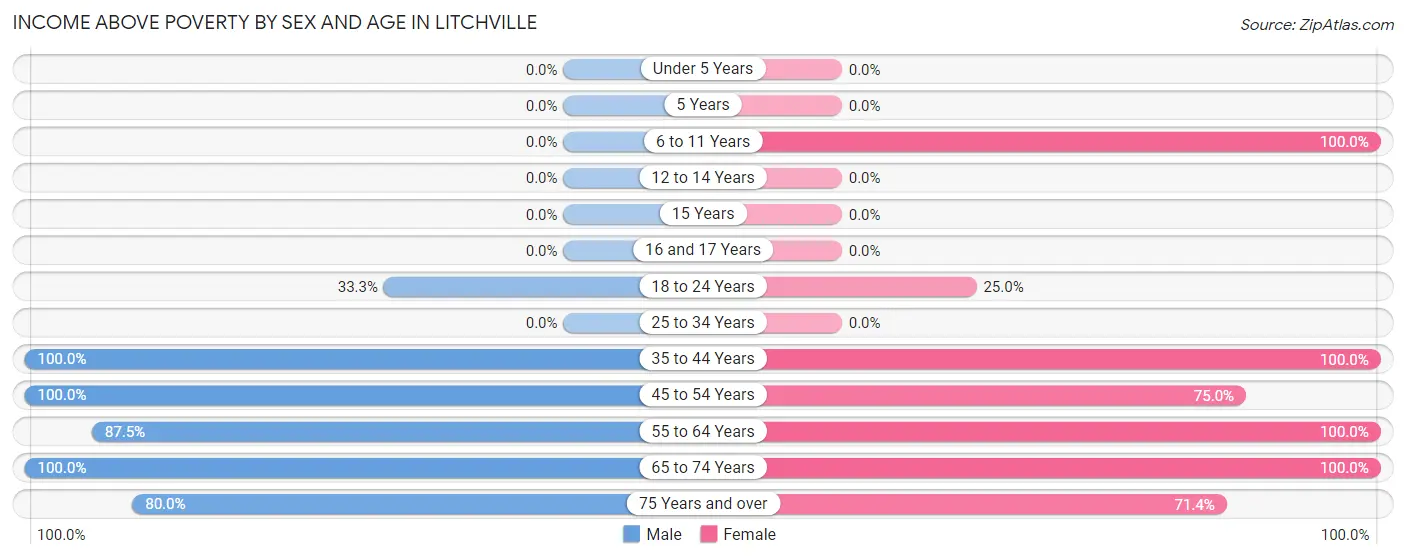
| Age Bracket | Male | Female |
| Under 5 Years | 0 (0.0%) | 0 (0.0%) |
| 5 Years | 0 (0.0%) | 0 (0.0%) |
| 6 to 11 Years | 0 (0.0%) | 3 (100.0%) |
| 12 to 14 Years | 0 (0.0%) | 0 (0.0%) |
| 15 Years | 0 (0.0%) | 0 (0.0%) |
| 16 and 17 Years | 0 (0.0%) | 0 (0.0%) |
| 18 to 24 Years | 1 (33.3%) | 2 (25.0%) |
| 25 to 34 Years | 0 (0.0%) | 0 (0.0%) |
| 35 to 44 Years | 17 (100.0%) | 1 (100.0%) |
| 45 to 54 Years | 2 (100.0%) | 6 (75.0%) |
| 55 to 64 Years | 21 (87.5%) | 6 (100.0%) |
| 65 to 74 Years | 11 (100.0%) | 1 (100.0%) |
| 75 Years and over | 4 (80.0%) | 5 (71.4%) |
| Total | 56 (75.7%) | 24 (30.8%) |
Income Below Poverty Among Married-Couple Families in Litchville
The poverty statistics for married-couple families in Litchville show that 26.3% or 5 of the total 19 families live below the poverty line. Families with 1 or 2 children have the highest poverty rate of 80.0%, comprising of 4 families. On the other hand, families with no children have the lowest poverty rate of 7.1%, which includes 1 families.
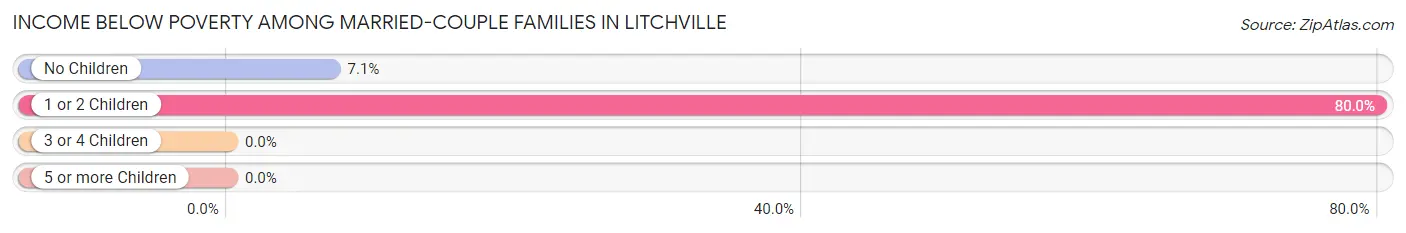
| Children | Above Poverty | Below Poverty |
| No Children | 13 (92.9%) | 1 (7.1%) |
| 1 or 2 Children | 1 (20.0%) | 4 (80.0%) |
| 3 or 4 Children | 0 (0.0%) | 0 (0.0%) |
| 5 or more Children | 0 (0.0%) | 0 (0.0%) |
| Total | 14 (73.7%) | 5 (26.3%) |
Income Below Poverty Among Single-Parent Households in Litchville
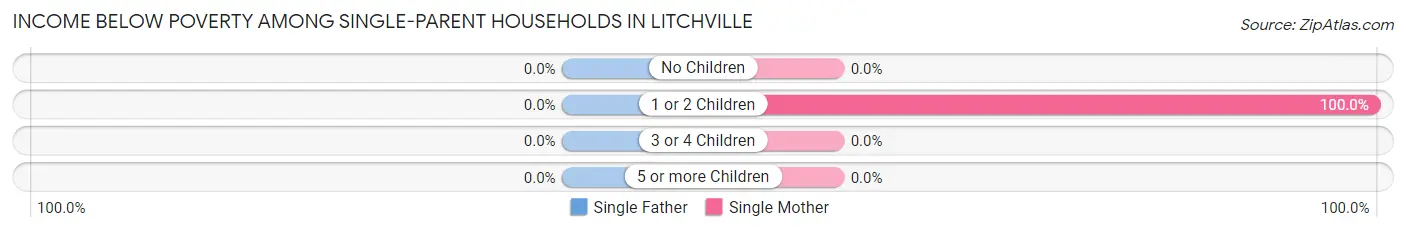
| Children | Single Father | Single Mother |
| No Children | 0 (0.0%) | 0 (0.0%) |
| 1 or 2 Children | 0 (0.0%) | 6 (100.0%) |
| 3 or 4 Children | 0 (0.0%) | 0 (0.0%) |
| 5 or more Children | 0 (0.0%) | 0 (0.0%) |
| Total | 0 (0.0%) | 6 (100.0%) |
Income Below Poverty Among Married-Couple vs Single-Parent Households in Litchville
The poverty data for Litchville shows that 5 of the married-couple family households (26.3%) and 6 of the single-parent households (75.0%) are living below the poverty level. Within the married-couple family households, those with 1 or 2 children have the highest poverty rate, with 4 households (80.0%) falling below the poverty line. Among the single-parent households, those with 1 or 2 children have the highest poverty rate, with 6 household (75.0%) living below poverty.
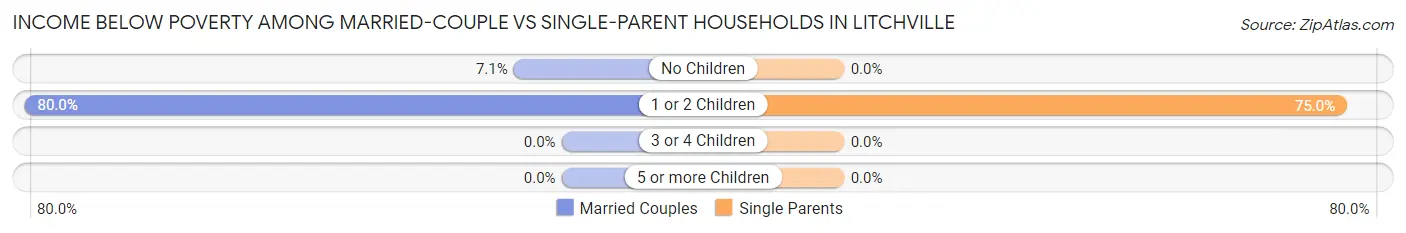
| Children | Married-Couple Families | Single-Parent Households |
| No Children | 1 (7.1%) | 0 (0.0%) |
| 1 or 2 Children | 4 (80.0%) | 6 (75.0%) |
| 3 or 4 Children | 0 (0.0%) | 0 (0.0%) |
| 5 or more Children | 0 (0.0%) | 0 (0.0%) |
| Total | 5 (26.3%) | 6 (75.0%) |
Race in Litchville
The most populous races in Litchville are White / Caucasian (137 | 90.1%), Native / Alaskan (10 | 6.6%), and Two or more Races (3 | 2.0%).
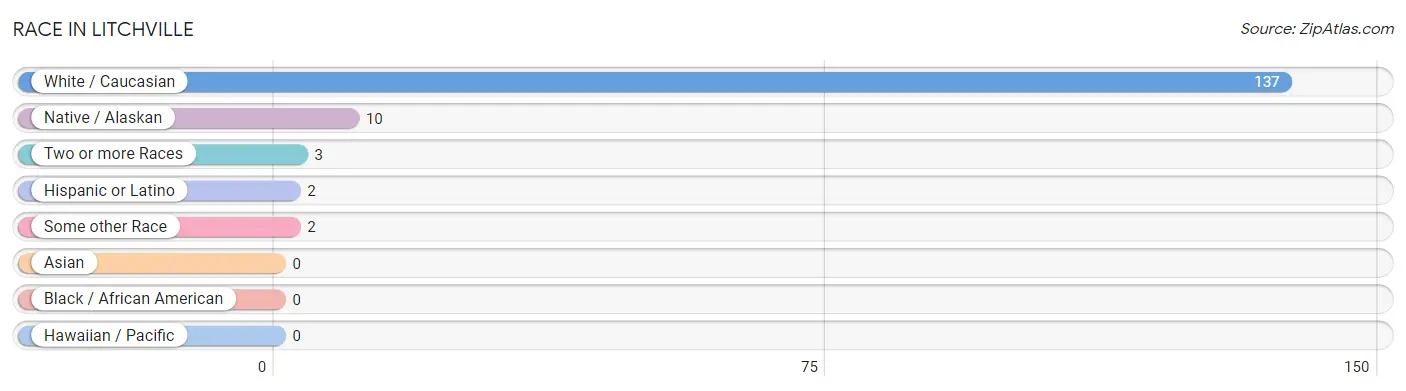
| Race | # Population | % Population |
| Asian | 0 | 0.0% |
| Black / African American | 0 | 0.0% |
| Hawaiian / Pacific | 0 | 0.0% |
| Hispanic or Latino | 2 | 1.3% |
| Native / Alaskan | 10 | 6.6% |
| White / Caucasian | 137 | 90.1% |
| Two or more Races | 3 | 2.0% |
| Some other Race | 2 | 1.3% |
| Total | 152 | 100.0% |
Ancestry in Litchville
The most populous ancestries reported in Litchville are German (33 | 21.7%), Norwegian (31 | 20.4%), Irish (14 | 9.2%), Sioux (10 | 6.6%), and Dutch (9 | 5.9%), together accounting for 63.8% of all Litchville residents.
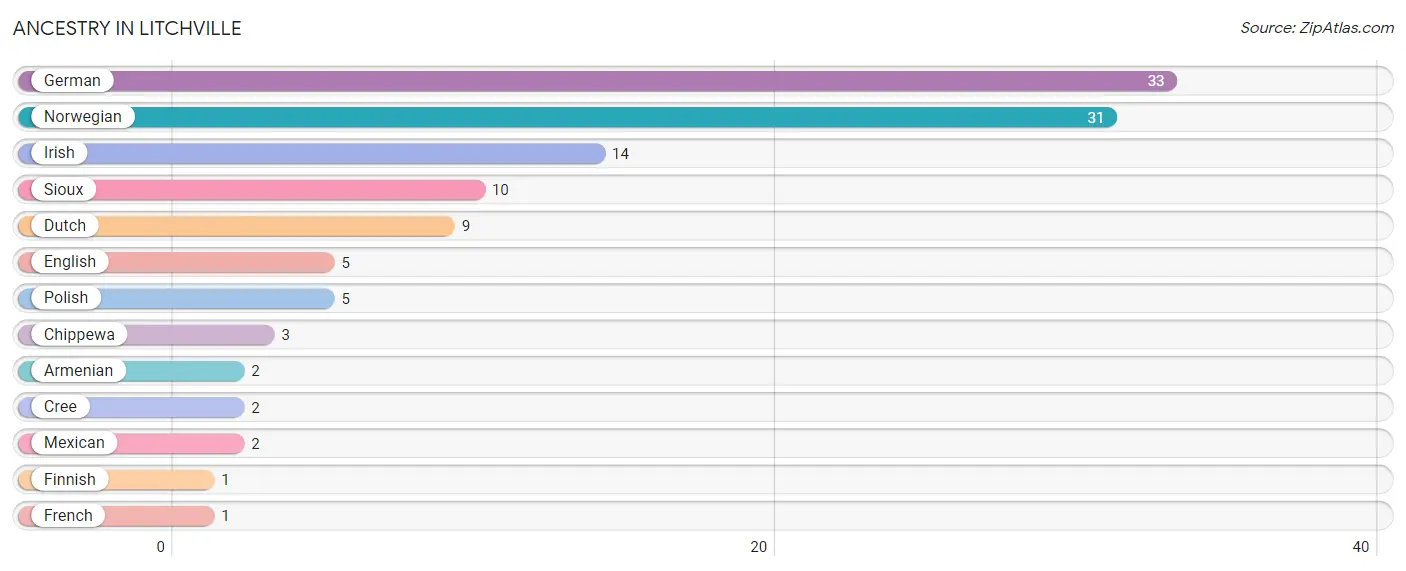
| Ancestry | # Population | % Population |
| Armenian | 2 | 1.3% |
| Chippewa | 3 | 2.0% |
| Cree | 2 | 1.3% |
| Dutch | 9 | 5.9% |
| English | 5 | 3.3% |
| Finnish | 1 | 0.7% |
| French | 1 | 0.7% |
| German | 33 | 21.7% |
| Irish | 14 | 9.2% |
| Mexican | 2 | 1.3% |
| Norwegian | 31 | 20.4% |
| Polish | 5 | 3.3% |
| Sioux | 10 | 6.6% | View All 13 Rows |
Immigrants in Litchville
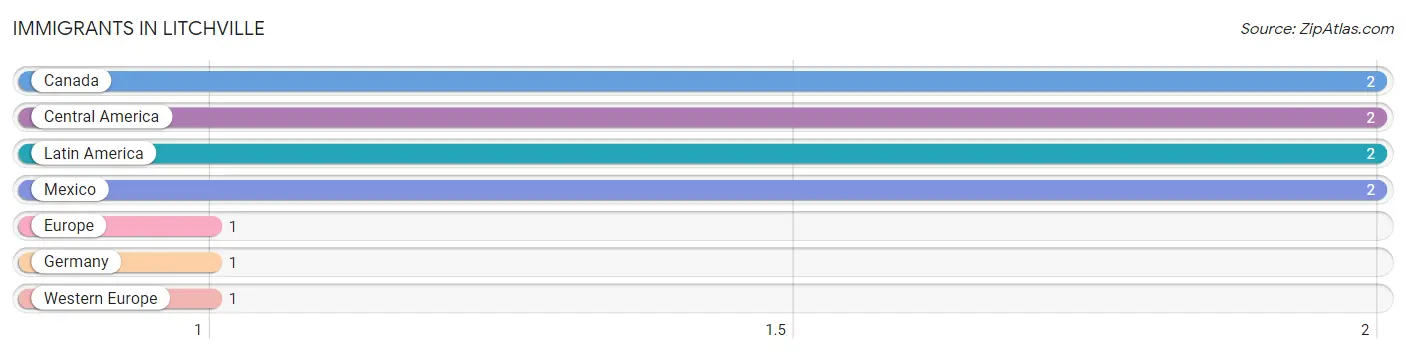
The most numerous immigrant groups reported in Litchville came from Canada (2 | 1.3%), Central America (2 | 1.3%), Latin America (2 | 1.3%), Mexico (2 | 1.3%), and Europe (1 | 0.7%), together accounting for 5.9% of all Litchville residents.
| Immigration Origin | # Population | % Population |
| Canada | 2 | 1.3% |
| Central America | 2 | 1.3% |
| Europe | 1 | 0.7% |
| Germany | 1 | 0.7% |
| Latin America | 2 | 1.3% |
| Mexico | 2 | 1.3% |
| Western Europe | 1 | 0.7% | View All 7 Rows |
Sex and Age in Litchville
Sex and Age in Litchville
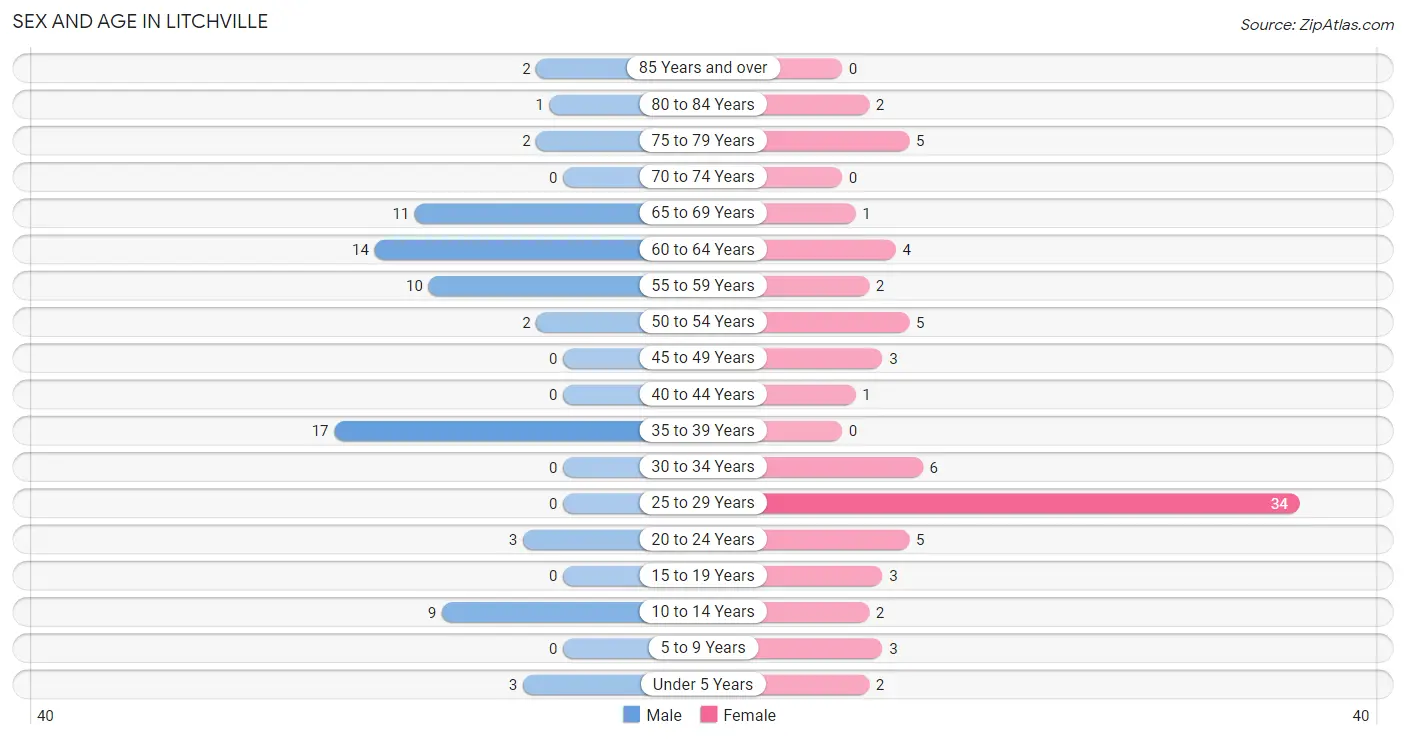
The most populous age groups in Litchville are 35 to 39 Years (17 | 23.0%) for men and 25 to 29 Years (34 | 43.6%) for women.
| Age Bracket | Male | Female |
| Under 5 Years | 3 (4.1%) | 2 (2.6%) |
| 5 to 9 Years | 0 (0.0%) | 3 (3.8%) |
| 10 to 14 Years | 9 (12.2%) | 2 (2.6%) |
| 15 to 19 Years | 0 (0.0%) | 3 (3.8%) |
| 20 to 24 Years | 3 (4.1%) | 5 (6.4%) |
| 25 to 29 Years | 0 (0.0%) | 34 (43.6%) |
| 30 to 34 Years | 0 (0.0%) | 6 (7.7%) |
| 35 to 39 Years | 17 (23.0%) | 0 (0.0%) |
| 40 to 44 Years | 0 (0.0%) | 1 (1.3%) |
| 45 to 49 Years | 0 (0.0%) | 3 (3.8%) |
| 50 to 54 Years | 2 (2.7%) | 5 (6.4%) |
| 55 to 59 Years | 10 (13.5%) | 2 (2.6%) |
| 60 to 64 Years | 14 (18.9%) | 4 (5.1%) |
| 65 to 69 Years | 11 (14.9%) | 1 (1.3%) |
| 70 to 74 Years | 0 (0.0%) | 0 (0.0%) |
| 75 to 79 Years | 2 (2.7%) | 5 (6.4%) |
| 80 to 84 Years | 1 (1.3%) | 2 (2.6%) |
| 85 Years and over | 2 (2.7%) | 0 (0.0%) |
| Total | 74 (100.0%) | 78 (100.0%) |
Families and Households in Litchville
Median Family Size in Litchville
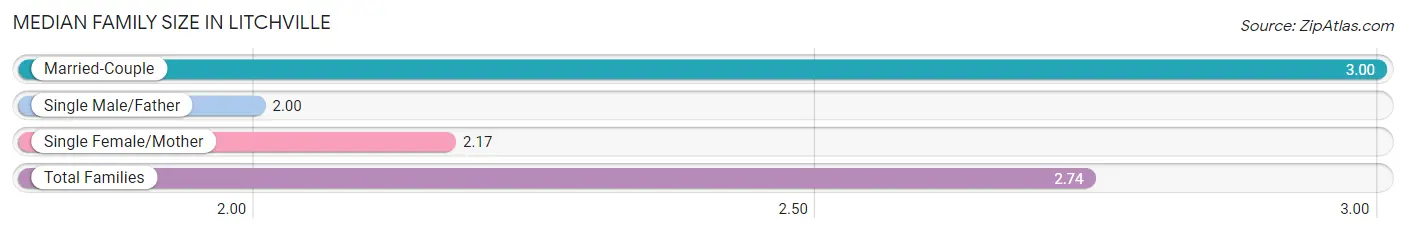
The median family size in Litchville is 2.74 persons per family, with married-couple families (19 | 70.4%) accounting for the largest median family size of 3 persons per family. On the other hand, single male/father families (2 | 7.4%) represent the smallest median family size with 2.00 persons per family.
| Family Type | # Families | Family Size |
| Married-Couple | 19 (70.4%) | 3.00 |
| Single Male/Father | 2 (7.4%) | 2.00 |
| Single Female/Mother | 6 (22.2%) | 2.17 |
| Total Families | 27 (100.0%) | 2.74 |
Median Household Size in Litchville
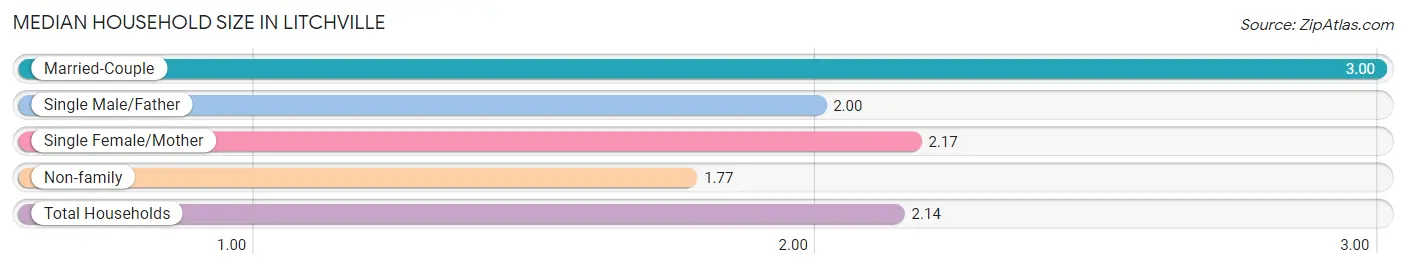
The median household size in Litchville is 2.14 persons per household, with married-couple households (19 | 26.8%) accounting for the largest median household size of 3 persons per household. non-family households (44 | 62.0%) represent the smallest median household size with 1.77 persons per household.
| Household Type | # Households | Household Size |
| Married-Couple | 19 (26.8%) | 3.00 |
| Single Male/Father | 2 (2.8%) | 2.00 |
| Single Female/Mother | 6 (8.5%) | 2.17 |
| Non-family | 44 (62.0%) | 1.77 |
| Total Households | 71 (100.0%) | 2.14 |
Household Size by Marriage Status in Litchville
Out of a total of 71 households in Litchville, 27 (38.0%) are family households, while 44 (62.0%) are nonfamily households. The most numerous type of family households are 2-person households, comprising 14, and the most common type of nonfamily households are 1-person households, comprising 33.
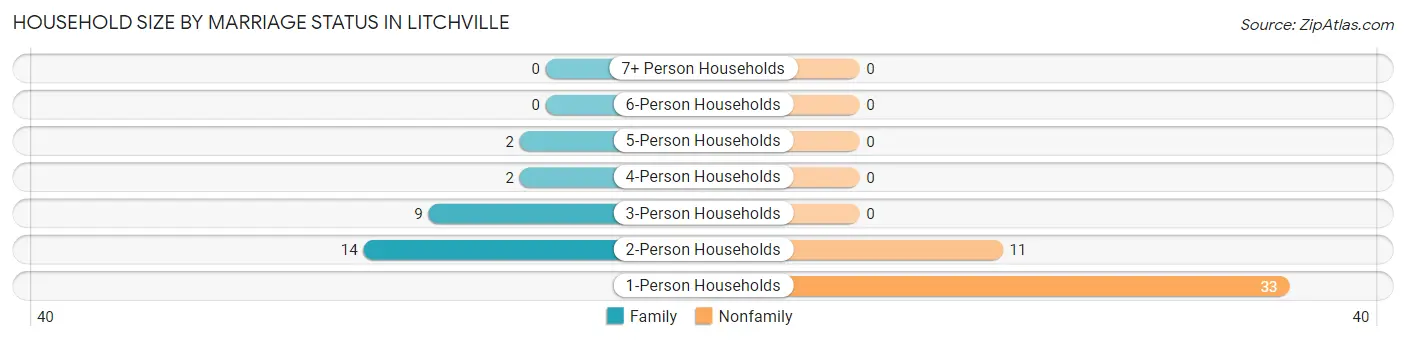
| Household Size | Family Households | Nonfamily Households |
| 1-Person Households | - | 33 (46.5%) |
| 2-Person Households | 14 (19.7%) | 11 (15.5%) |
| 3-Person Households | 9 (12.7%) | 0 (0.0%) |
| 4-Person Households | 2 (2.8%) | 0 (0.0%) |
| 5-Person Households | 2 (2.8%) | 0 (0.0%) |
| 6-Person Households | 0 (0.0%) | 0 (0.0%) |
| 7+ Person Households | 0 (0.0%) | 0 (0.0%) |
| Total | 27 (38.0%) | 44 (62.0%) |
Female Fertility in Litchville
Fertility by Age in Litchville
Average fertility rate in Litchville is 94.0 births per 1,000 women. Women in the age bracket of 20 to 34 years have the highest fertility rate with 111.0 births per 1,000 women. Women in the age bracket of 20 to 34 years acount for 100.0% of all women with births.
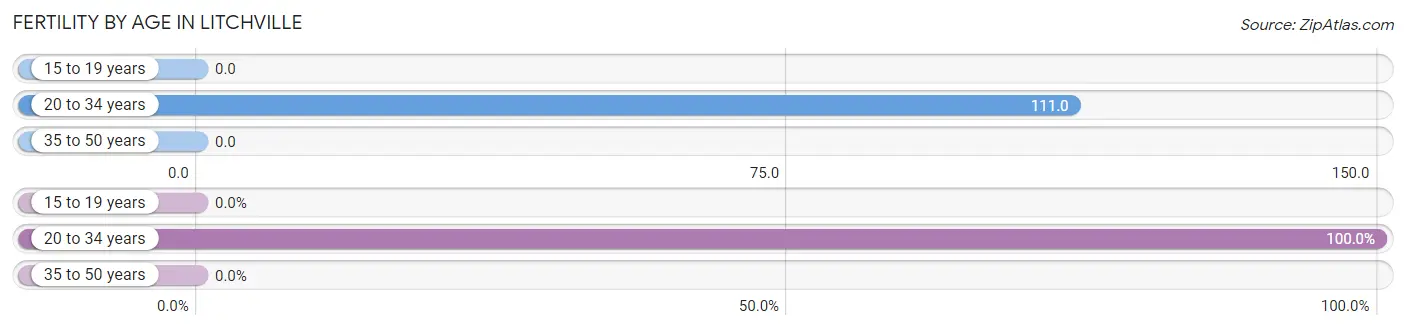
| Age Bracket | Women with Births | Births / 1,000 Women |
| 15 to 19 years | 0 (0.0%) | 0.0 |
| 20 to 34 years | 5 (100.0%) | 111.0 |
| 35 to 50 years | 0 (0.0%) | 0.0 |
| Total | 5 (100.0%) | 94.0 |
Fertility by Age by Marriage Status in Litchville
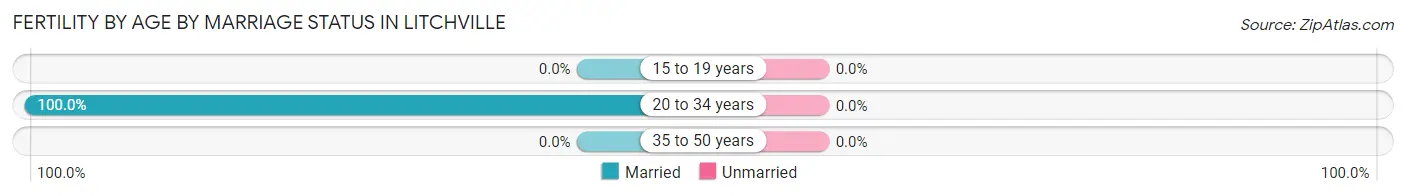
| Age Bracket | Married | Unmarried |
| 15 to 19 years | 0 (0.0%) | 0 (0.0%) |
| 20 to 34 years | 5 (100.0%) | 0 (0.0%) |
| 35 to 50 years | 0 (0.0%) | 0 (0.0%) |
| Total | 5 (100.0%) | 0 (0.0%) |
Fertility by Education in Litchville
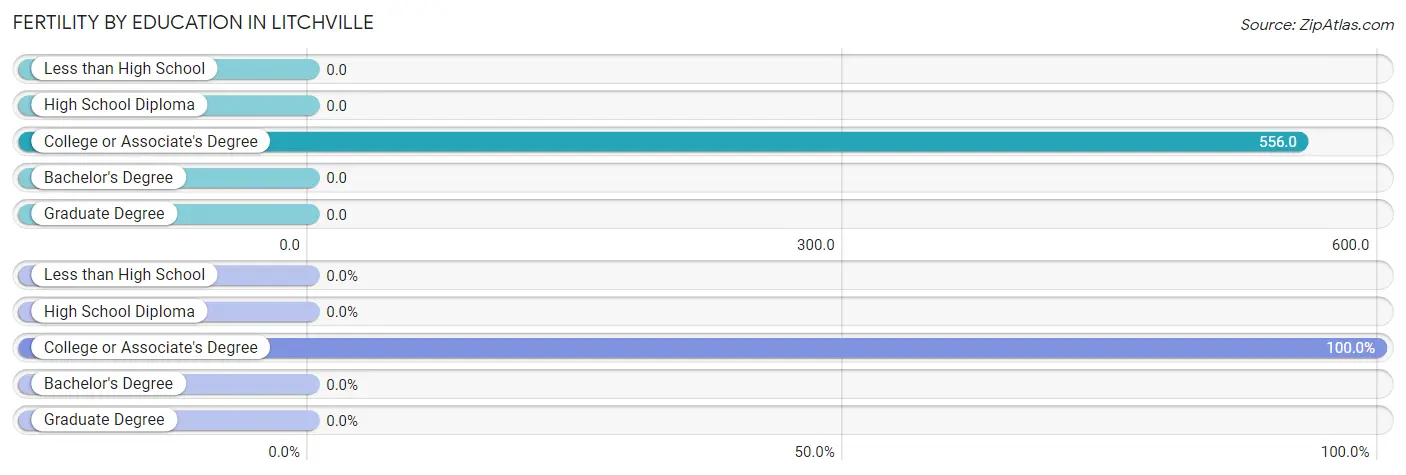
| Educational Attainment | Women with Births | Births / 1,000 Women |
| Less than High School | 0 (0.0%) | 0.0 |
| High School Diploma | 0 (0.0%) | 0.0 |
| College or Associate's Degree | 5 (100.0%) | 556.0 |
| Bachelor's Degree | 0 (0.0%) | 0.0 |
| Graduate Degree | 0 (0.0%) | 0.0 |
| Total | 5 (100.0%) | 94.0 |
Fertility by Education by Marriage Status in Litchville
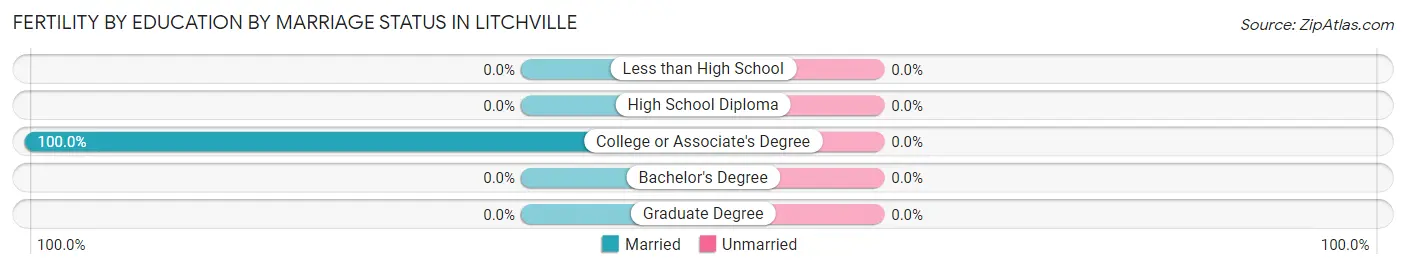
| Educational Attainment | Married | Unmarried |
| Less than High School | 0 (0.0%) | 0 (0.0%) |
| High School Diploma | 0 (0.0%) | 0 (0.0%) |
| College or Associate's Degree | 5 (100.0%) | 0 (0.0%) |
| Bachelor's Degree | 0 (0.0%) | 0 (0.0%) |
| Graduate Degree | 0 (0.0%) | 0 (0.0%) |
| Total | 5 (100.0%) | 0 (0.0%) |
Employment Characteristics in Litchville
Employment by Class of Employer in Litchville
Among the 52 employed individuals in Litchville, private company employees (24 | 46.2%), self-employed (incorporated) (14 | 26.9%), and self-employed (not incorporated) (6 | 11.5%) make up the most common classes of employment.
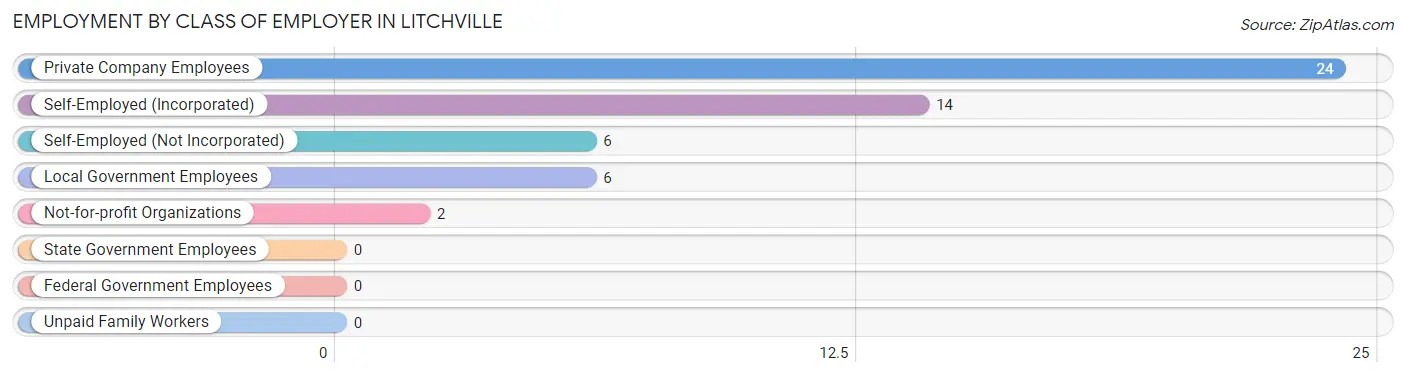
| Employer Class | # Employees | % Employees |
| Private Company Employees | 24 | 46.2% |
| Self-Employed (Incorporated) | 14 | 26.9% |
| Self-Employed (Not Incorporated) | 6 | 11.5% |
| Not-for-profit Organizations | 2 | 3.8% |
| Local Government Employees | 6 | 11.5% |
| State Government Employees | 0 | 0.0% |
| Federal Government Employees | 0 | 0.0% |
| Unpaid Family Workers | 0 | 0.0% |
| Total | 52 | 100.0% |
Employment Status by Age in Litchville
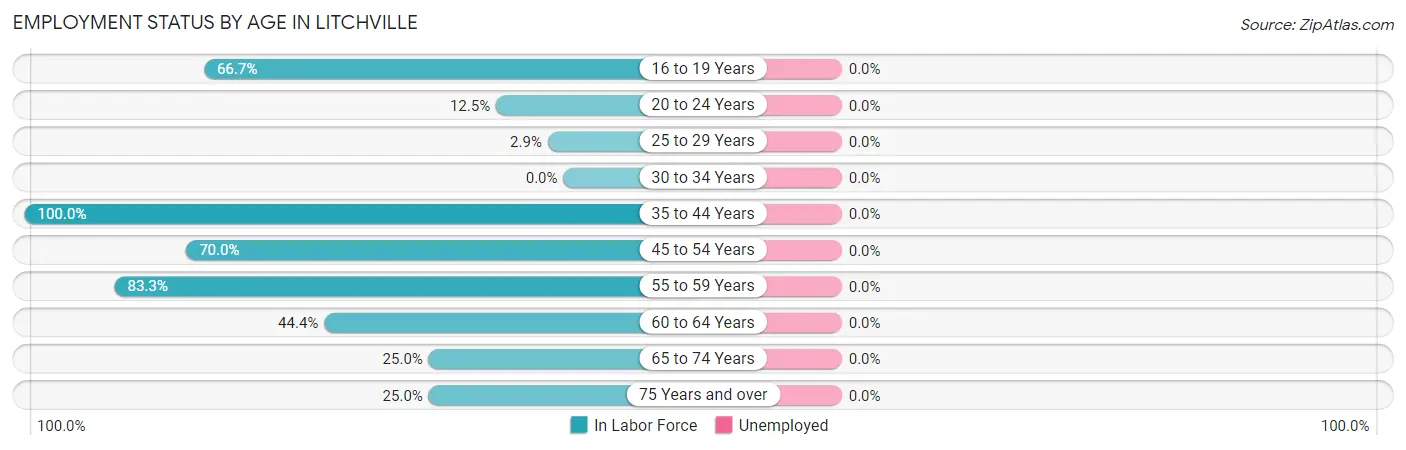
| Age Bracket | In Labor Force | Unemployed |
| 16 to 19 Years | 2 (66.7%) | 0 (0.0%) |
| 20 to 24 Years | 1 (12.5%) | 0 (0.0%) |
| 25 to 29 Years | 1 (2.9%) | 0 (0.0%) |
| 30 to 34 Years | 0 (0.0%) | 0 (0.0%) |
| 35 to 44 Years | 18 (100.0%) | 0 (0.0%) |
| 45 to 54 Years | 7 (70.0%) | 0 (0.0%) |
| 55 to 59 Years | 10 (83.3%) | 0 (0.0%) |
| 60 to 64 Years | 8 (44.4%) | 0 (0.0%) |
| 65 to 74 Years | 3 (25.0%) | 0 (0.0%) |
| 75 Years and over | 3 (25.0%) | 0 (0.0%) |
| Total | 53 (39.8%) | 0 (0.0%) |
Employment Status by Educational Attainment in Litchville
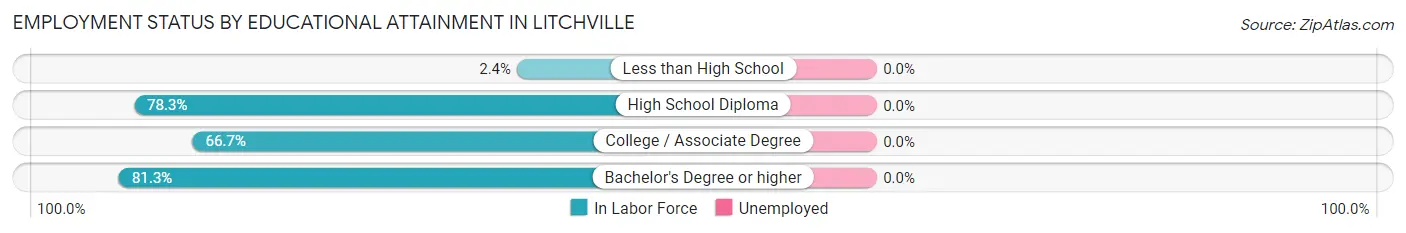
| Educational Attainment | In Labor Force | Unemployed |
| Less than High School | 1 (2.4%) | 0 (0.0%) |
| High School Diploma | 18 (78.3%) | 0 (0.0%) |
| College / Associate Degree | 12 (66.7%) | 0 (0.0%) |
| Bachelor's Degree or higher | 13 (81.3%) | 0 (0.0%) |
| Total | 44 (44.9%) | 0 (0.0%) |
Employment Occupations by Sex in Litchville
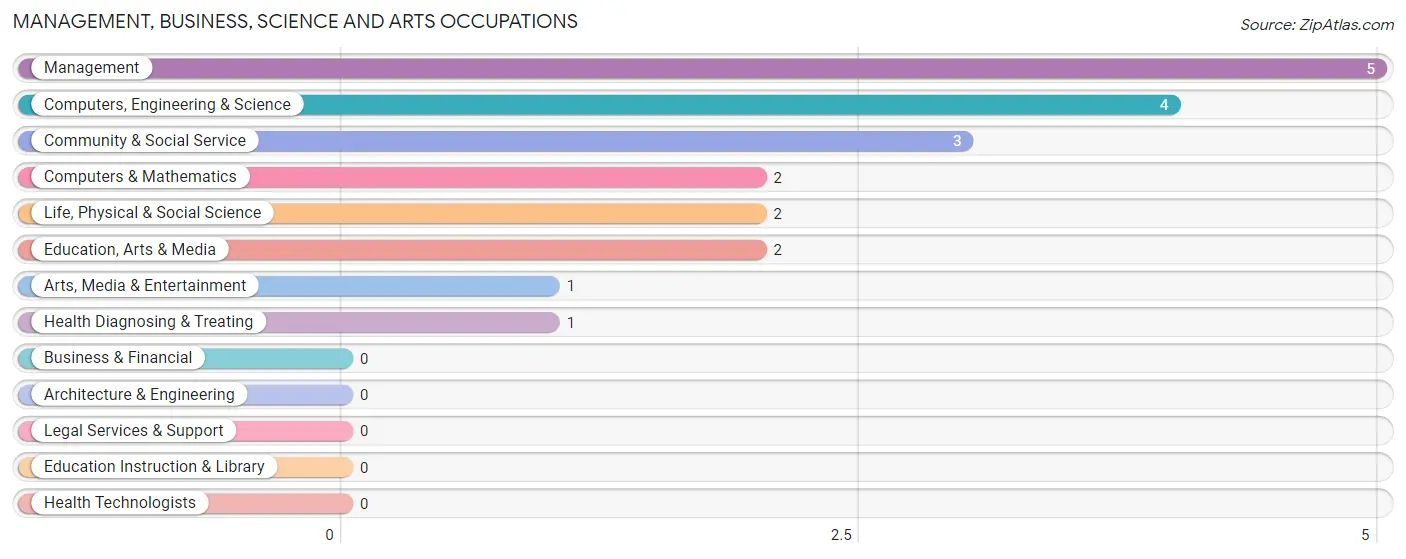
Management, Business, Science and Arts Occupations
The most common Management, Business, Science and Arts occupations in Litchville are Management (5 | 9.4%), Computers, Engineering & Science (4 | 7.5%), Community & Social Service (3 | 5.7%), Computers & Mathematics (2 | 3.8%), and Life, Physical & Social Science (2 | 3.8%).
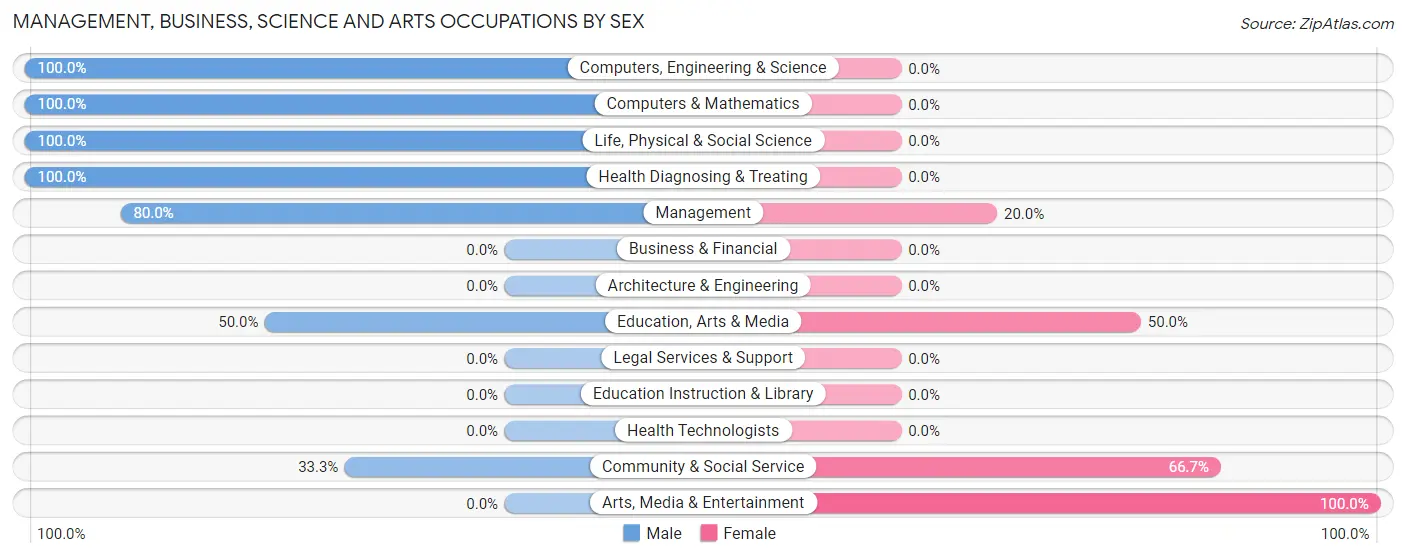
Management, Business, Science and Arts Occupations by Sex
Within the Management, Business, Science and Arts occupations in Litchville, the most male-oriented occupations are Computers, Engineering & Science (100.0%), Computers & Mathematics (100.0%), and Life, Physical & Social Science (100.0%), while the most female-oriented occupations are Arts, Media & Entertainment (100.0%), Community & Social Service (66.7%), and Education, Arts & Media (50.0%).
| Occupation | Male | Female |
| Management | 4 (80.0%) | 1 (20.0%) |
| Business & Financial | 0 (0.0%) | 0 (0.0%) |
| Computers, Engineering & Science | 4 (100.0%) | 0 (0.0%) |
| Computers & Mathematics | 2 (100.0%) | 0 (0.0%) |
| Architecture & Engineering | 0 (0.0%) | 0 (0.0%) |
| Life, Physical & Social Science | 2 (100.0%) | 0 (0.0%) |
| Community & Social Service | 1 (33.3%) | 2 (66.7%) |
| Education, Arts & Media | 1 (50.0%) | 1 (50.0%) |
| Legal Services & Support | 0 (0.0%) | 0 (0.0%) |
| Education Instruction & Library | 0 (0.0%) | 0 (0.0%) |
| Arts, Media & Entertainment | 0 (0.0%) | 1 (100.0%) |
| Health Diagnosing & Treating | 1 (100.0%) | 0 (0.0%) |
| Health Technologists | 0 (0.0%) | 0 (0.0%) |
| Total (Category) | 10 (76.9%) | 3 (23.1%) |
| Total (Overall) | 42 (79.2%) | 11 (20.7%) |
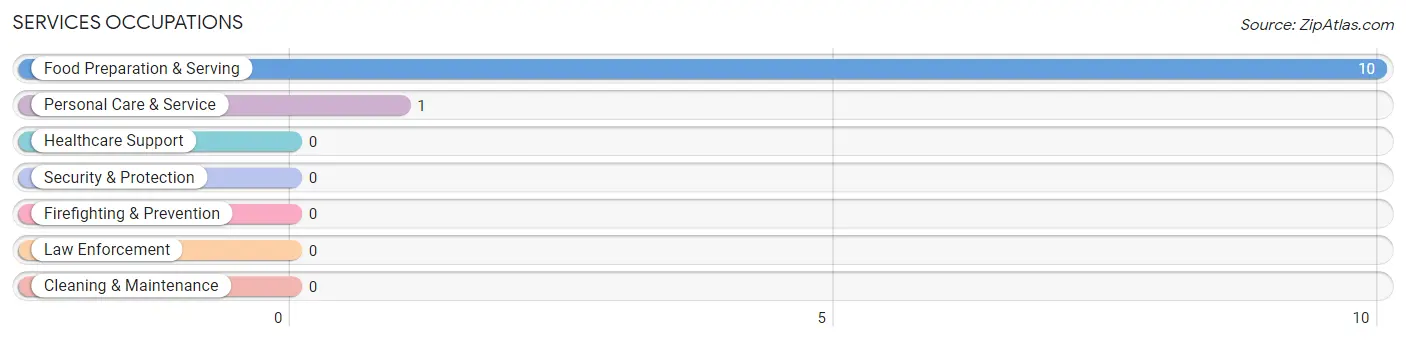
Services Occupations
The most common Services occupations in Litchville are Food Preparation & Serving (10 | 18.9%), and Personal Care & Service (1 | 1.9%).
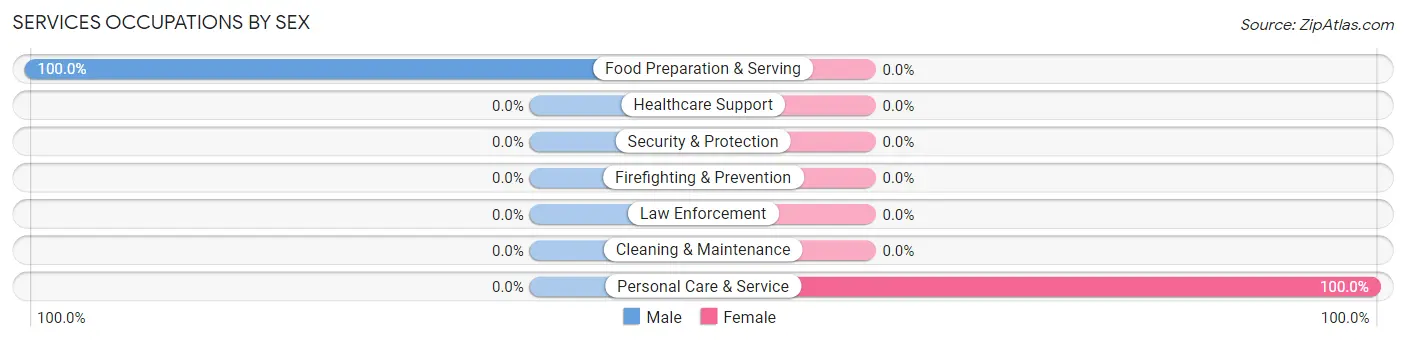
Services Occupations by Sex
| Occupation | Male | Female |
| Healthcare Support | 0 (0.0%) | 0 (0.0%) |
| Security & Protection | 0 (0.0%) | 0 (0.0%) |
| Firefighting & Prevention | 0 (0.0%) | 0 (0.0%) |
| Law Enforcement | 0 (0.0%) | 0 (0.0%) |
| Food Preparation & Serving | 10 (100.0%) | 0 (0.0%) |
| Cleaning & Maintenance | 0 (0.0%) | 0 (0.0%) |
| Personal Care & Service | 0 (0.0%) | 1 (100.0%) |
| Total (Category) | 10 (90.9%) | 1 (9.1%) |
| Total (Overall) | 42 (79.2%) | 11 (20.7%) |
Sales and Office Occupations
The most common Sales and Office occupations in Litchville are Sales & Related (4 | 7.5%), and Office & Administration (3 | 5.7%).
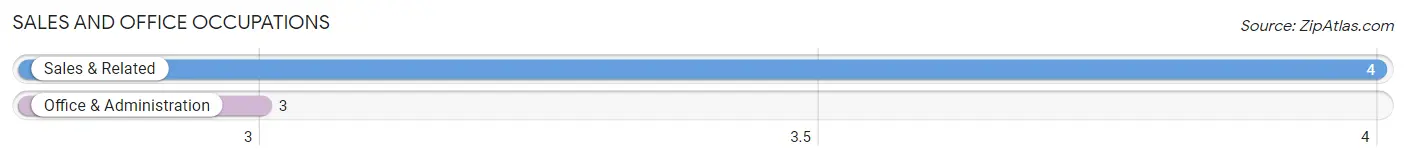
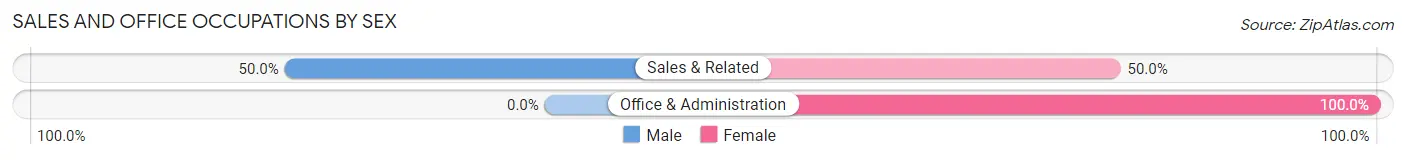
Sales and Office Occupations by Sex
| Occupation | Male | Female |
| Sales & Related | 2 (50.0%) | 2 (50.0%) |
| Office & Administration | 0 (0.0%) | 3 (100.0%) |
| Total (Category) | 2 (28.6%) | 5 (71.4%) |
| Total (Overall) | 42 (79.2%) | 11 (20.7%) |
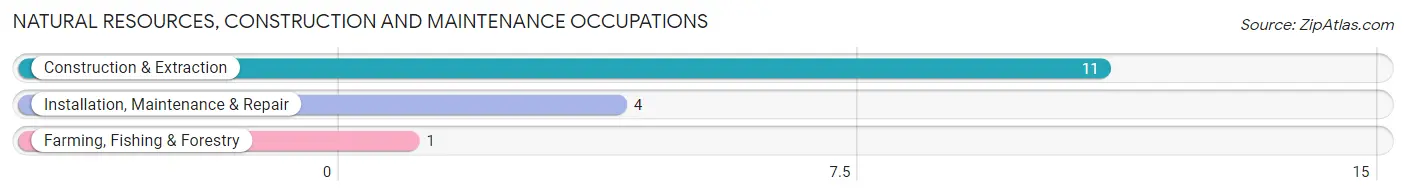
Natural Resources, Construction and Maintenance Occupations
The most common Natural Resources, Construction and Maintenance occupations in Litchville are Construction & Extraction (11 | 20.7%), Installation, Maintenance & Repair (4 | 7.5%), and Farming, Fishing & Forestry (1 | 1.9%).
Natural Resources, Construction and Maintenance Occupations by Sex
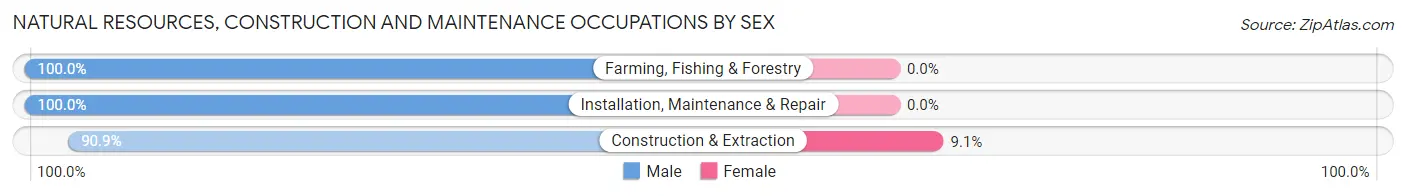
| Occupation | Male | Female |
| Farming, Fishing & Forestry | 1 (100.0%) | 0 (0.0%) |
| Construction & Extraction | 10 (90.9%) | 1 (9.1%) |
| Installation, Maintenance & Repair | 4 (100.0%) | 0 (0.0%) |
| Total (Category) | 15 (93.8%) | 1 (6.2%) |
| Total (Overall) | 42 (79.2%) | 11 (20.7%) |
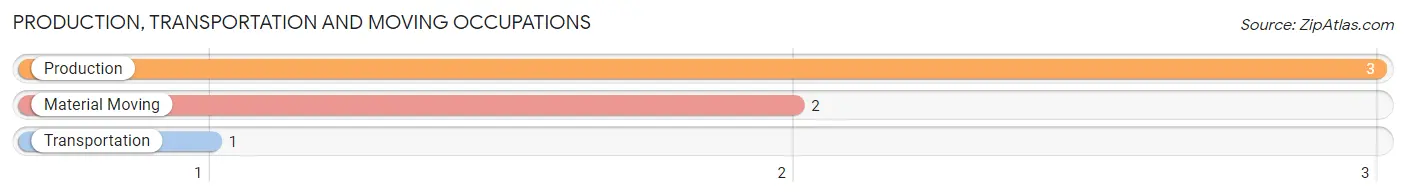
Production, Transportation and Moving Occupations
The most common Production, Transportation and Moving occupations in Litchville are Production (3 | 5.7%), Material Moving (2 | 3.8%), and Transportation (1 | 1.9%).
Production, Transportation and Moving Occupations by Sex
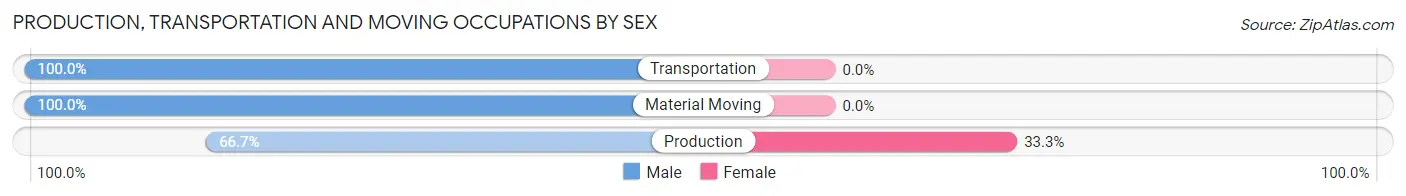
| Occupation | Male | Female |
| Production | 2 (66.7%) | 1 (33.3%) |
| Transportation | 1 (100.0%) | 0 (0.0%) |
| Material Moving | 2 (100.0%) | 0 (0.0%) |
| Total (Category) | 5 (83.3%) | 1 (16.7%) |
| Total (Overall) | 42 (79.2%) | 11 (20.7%) |
Employment Industries by Sex in Litchville
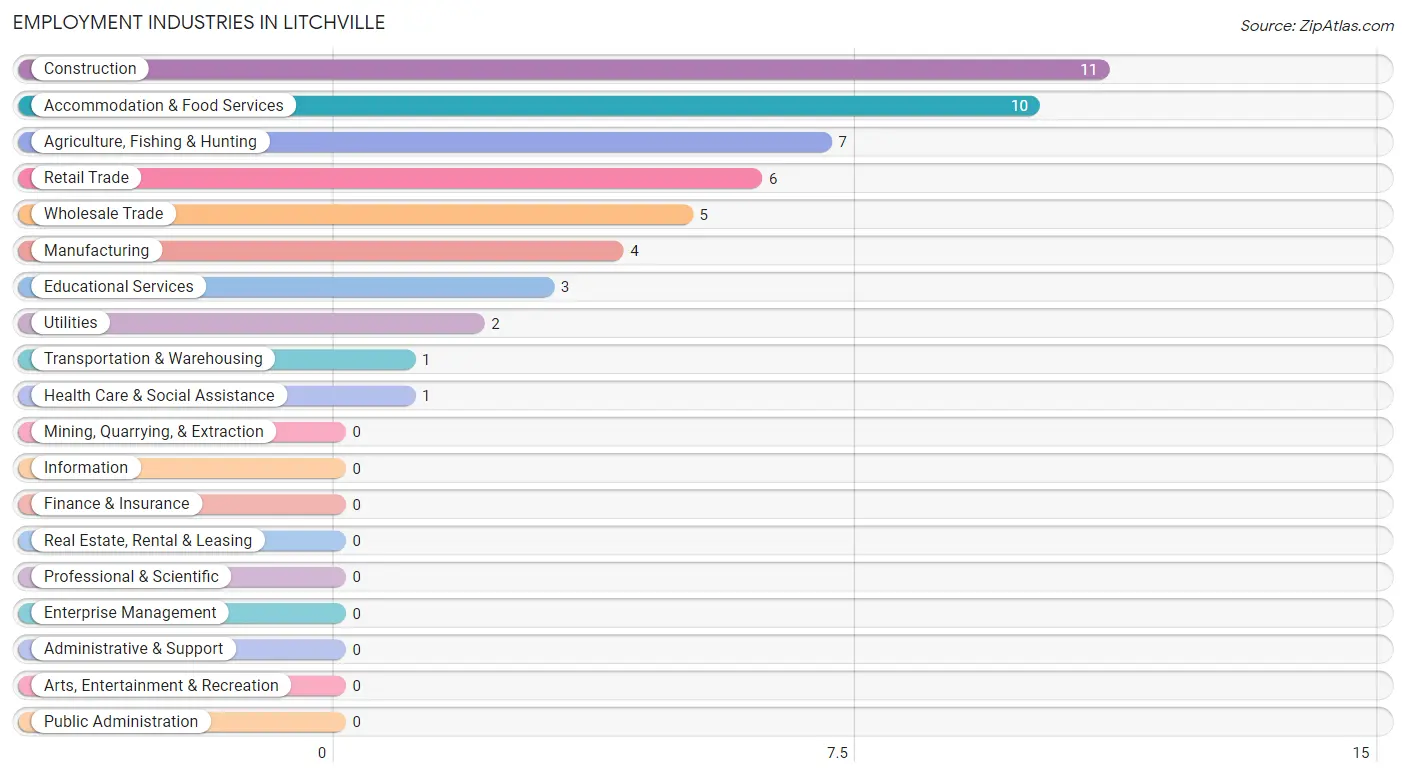
Employment Industries in Litchville
The major employment industries in Litchville include Construction (11 | 20.7%), Accommodation & Food Services (10 | 18.9%), Agriculture, Fishing & Hunting (7 | 13.2%), Retail Trade (6 | 11.3%), and Wholesale Trade (5 | 9.4%).
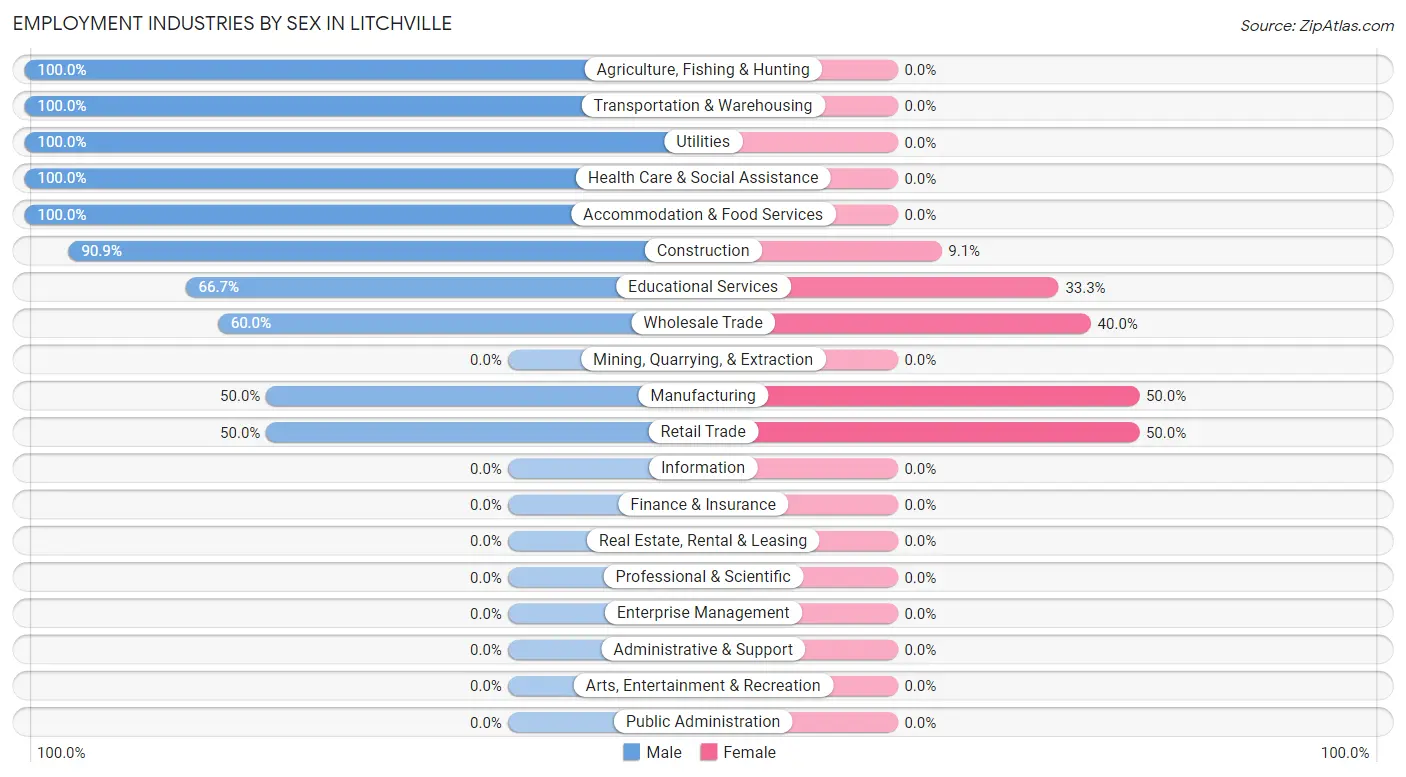
Employment Industries by Sex in Litchville
The Litchville industries that see more men than women are Agriculture, Fishing & Hunting (100.0%), Transportation & Warehousing (100.0%), and Utilities (100.0%), whereas the industries that tend to have a higher number of women are Manufacturing (50.0%), Retail Trade (50.0%), and Wholesale Trade (40.0%).
| Industry | Male | Female |
| Agriculture, Fishing & Hunting | 7 (100.0%) | 0 (0.0%) |
| Mining, Quarrying, & Extraction | 0 (0.0%) | 0 (0.0%) |
| Construction | 10 (90.9%) | 1 (9.1%) |
| Manufacturing | 2 (50.0%) | 2 (50.0%) |
| Wholesale Trade | 3 (60.0%) | 2 (40.0%) |
| Retail Trade | 3 (50.0%) | 3 (50.0%) |
| Transportation & Warehousing | 1 (100.0%) | 0 (0.0%) |
| Utilities | 2 (100.0%) | 0 (0.0%) |
| Information | 0 (0.0%) | 0 (0.0%) |
| Finance & Insurance | 0 (0.0%) | 0 (0.0%) |
| Real Estate, Rental & Leasing | 0 (0.0%) | 0 (0.0%) |
| Professional & Scientific | 0 (0.0%) | 0 (0.0%) |
| Enterprise Management | 0 (0.0%) | 0 (0.0%) |
| Administrative & Support | 0 (0.0%) | 0 (0.0%) |
| Educational Services | 2 (66.7%) | 1 (33.3%) |
| Health Care & Social Assistance | 1 (100.0%) | 0 (0.0%) |
| Arts, Entertainment & Recreation | 0 (0.0%) | 0 (0.0%) |
| Accommodation & Food Services | 10 (100.0%) | 0 (0.0%) |
| Public Administration | 0 (0.0%) | 0 (0.0%) |
| Total | 42 (79.2%) | 11 (20.7%) |
Education in Litchville
School Enrollment in Litchville
The most common levels of schooling among the 21 students in Litchville are middle school (11 | 52.4%), college / undergraduate (6 | 28.6%), and elementary school (3 | 14.3%).
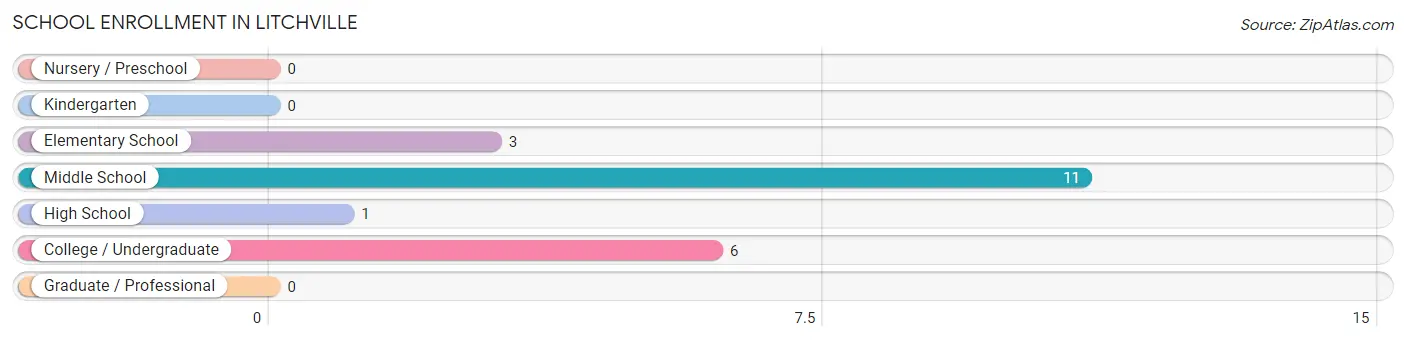
| School Level | # Students | % Students |
| Nursery / Preschool | 0 | 0.0% |
| Kindergarten | 0 | 0.0% |
| Elementary School | 3 | 14.3% |
| Middle School | 11 | 52.4% |
| High School | 1 | 4.8% |
| College / Undergraduate | 6 | 28.6% |
| Graduate / Professional | 0 | 0.0% |
| Total | 21 | 100.0% |
School Enrollment by Age by Funding Source in Litchville
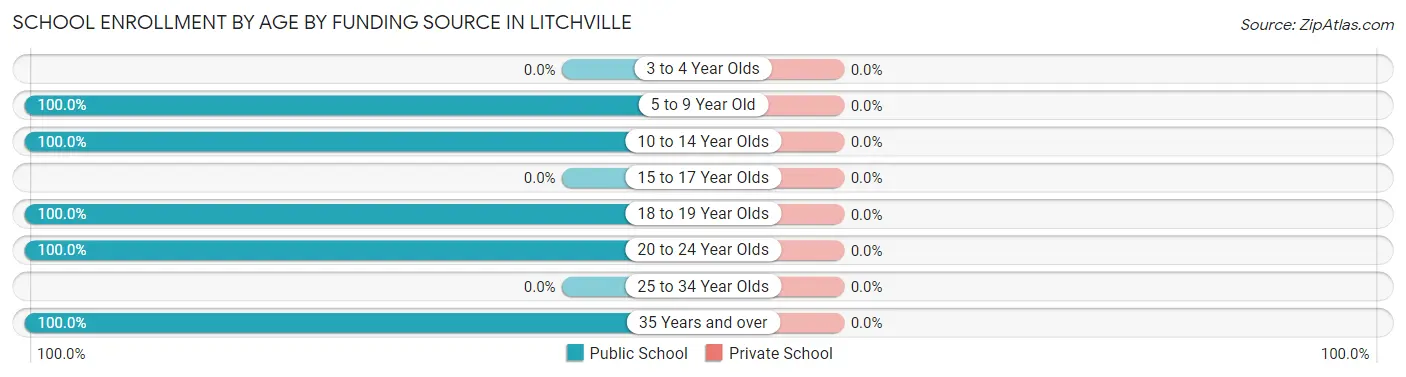
| Age Bracket | Public School | Private School |
| 3 to 4 Year Olds | 0 (0.0%) | 0 (0.0%) |
| 5 to 9 Year Old | 3 (100.0%) | 0 (0.0%) |
| 10 to 14 Year Olds | 11 (100.0%) | 0 (0.0%) |
| 15 to 17 Year Olds | 0 (0.0%) | 0 (0.0%) |
| 18 to 19 Year Olds | 1 (100.0%) | 0 (0.0%) |
| 20 to 24 Year Olds | 5 (100.0%) | 0 (0.0%) |
| 25 to 34 Year Olds | 0 (0.0%) | 0 (0.0%) |
| 35 Years and over | 1 (100.0%) | 0 (0.0%) |
| Total | 21 (100.0%) | 0 (0.0%) |
Educational Attainment by Field of Study in Litchville
Education (17 | 80.9%), computers & mathematics (1 | 4.8%), psychology (1 | 4.8%), science & technology (1 | 4.8%), and arts & humanities (1 | 4.8%) are the most common fields of study among 21 individuals in Litchville who have obtained a bachelor's degree or higher.
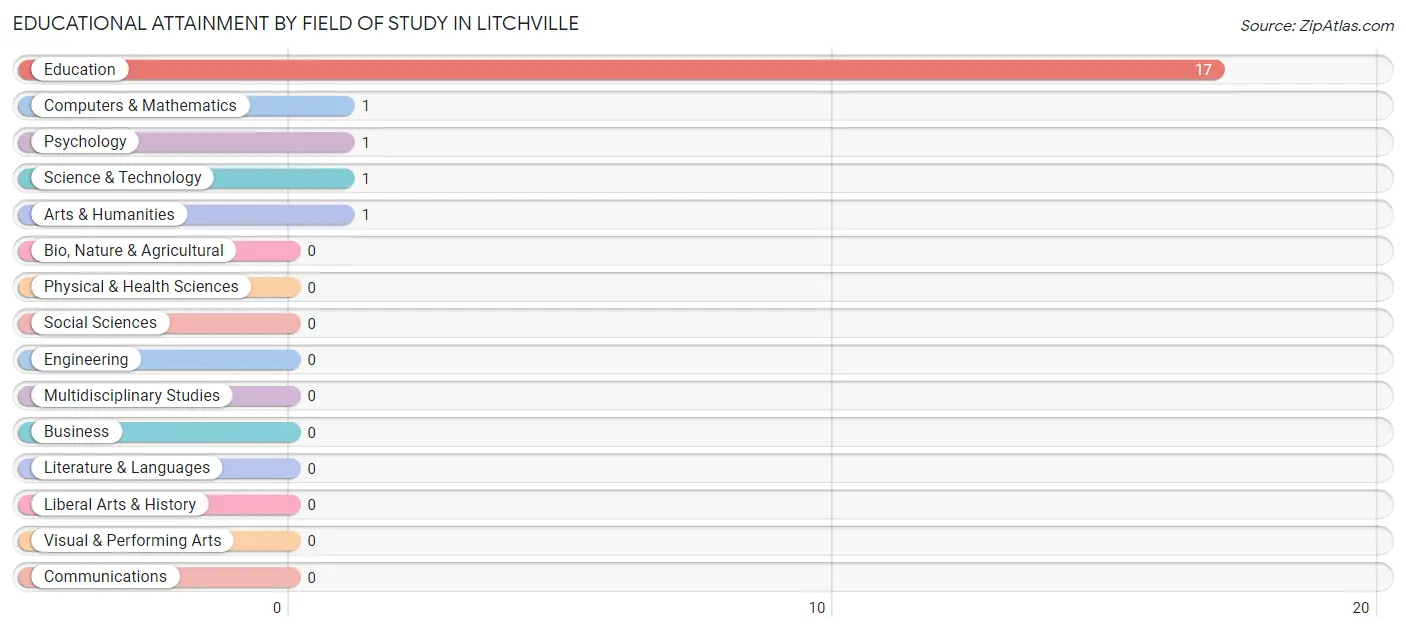
| Field of Study | # Graduates | % Graduates |
| Computers & Mathematics | 1 | 4.8% |
| Bio, Nature & Agricultural | 0 | 0.0% |
| Physical & Health Sciences | 0 | 0.0% |
| Psychology | 1 | 4.8% |
| Social Sciences | 0 | 0.0% |
| Engineering | 0 | 0.0% |
| Multidisciplinary Studies | 0 | 0.0% |
| Science & Technology | 1 | 4.8% |
| Business | 0 | 0.0% |
| Education | 17 | 80.9% |
| Literature & Languages | 0 | 0.0% |
| Liberal Arts & History | 0 | 0.0% |
| Visual & Performing Arts | 0 | 0.0% |
| Communications | 0 | 0.0% |
| Arts & Humanities | 1 | 4.8% |
| Total | 21 | 100.0% |
Transportation & Commute in Litchville
Vehicle Availability by Sex in Litchville
The most prevalent vehicle ownership categories in Litchville are males with 5 or more vehicles (12, accounting for 29.3%) and females with 5 or more vehicles (1, making up 109.1%).
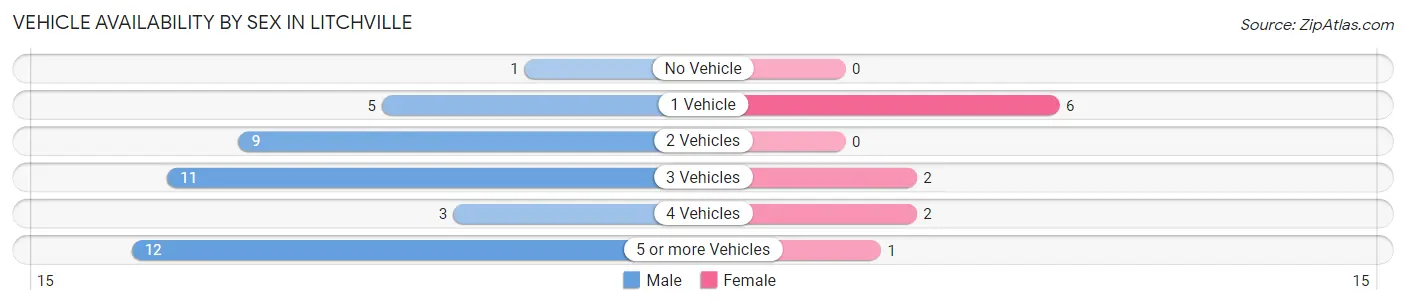
| Vehicles Available | Male | Female |
| No Vehicle | 1 (2.4%) | 0 (0.0%) |
| 1 Vehicle | 5 (12.2%) | 6 (54.5%) |
| 2 Vehicles | 9 (22.0%) | 0 (0.0%) |
| 3 Vehicles | 11 (26.8%) | 2 (18.2%) |
| 4 Vehicles | 3 (7.3%) | 2 (18.2%) |
| 5 or more Vehicles | 12 (29.3%) | 1 (9.1%) |
| Total | 41 (100.0%) | 11 (100.0%) |
Commute Time in Litchville
The most frequently occuring commute durations in Litchville are 45 to 59 minutes (21 commuters, 45.7%), 5 to 9 minutes (14 commuters, 30.4%), and 30 to 34 minutes (6 commuters, 13.0%).
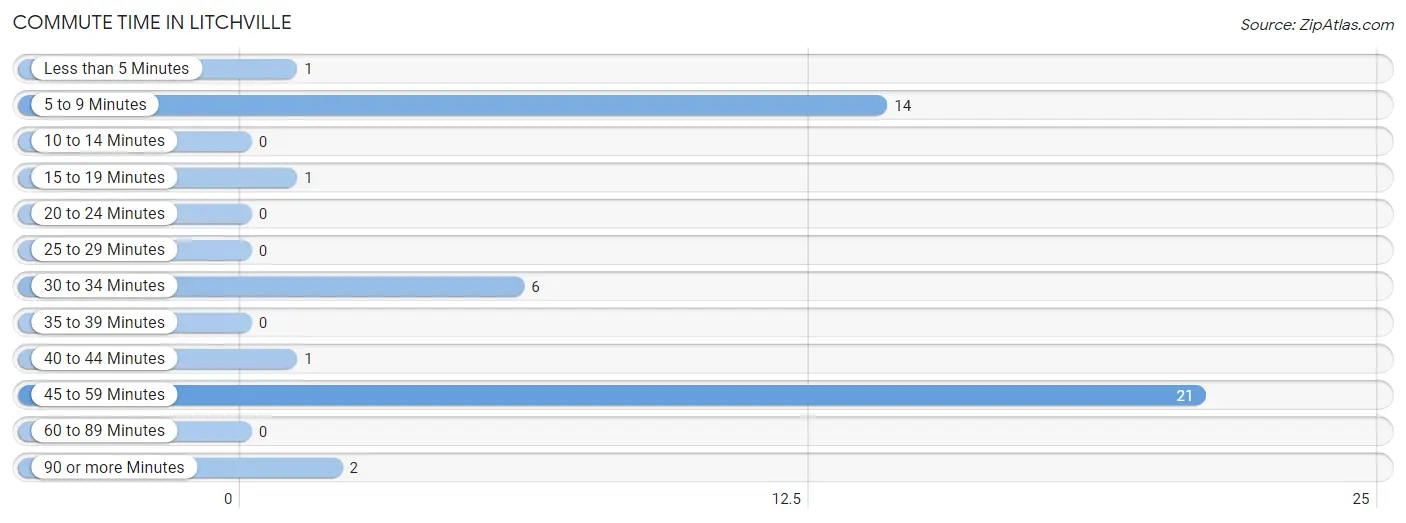
| Commute Time | # Commuters | % Commuters |
| Less than 5 Minutes | 1 | 2.2% |
| 5 to 9 Minutes | 14 | 30.4% |
| 10 to 14 Minutes | 0 | 0.0% |
| 15 to 19 Minutes | 1 | 2.2% |
| 20 to 24 Minutes | 0 | 0.0% |
| 25 to 29 Minutes | 0 | 0.0% |
| 30 to 34 Minutes | 6 | 13.0% |
| 35 to 39 Minutes | 0 | 0.0% |
| 40 to 44 Minutes | 1 | 2.2% |
| 45 to 59 Minutes | 21 | 45.7% |
| 60 to 89 Minutes | 0 | 0.0% |
| 90 or more Minutes | 2 | 4.3% |
Commute Time by Sex in Litchville
The most common commute times in Litchville are 45 to 59 minutes (18 commuters, 50.0%) for males and 45 to 59 minutes (3 commuters, 30.0%) for females.
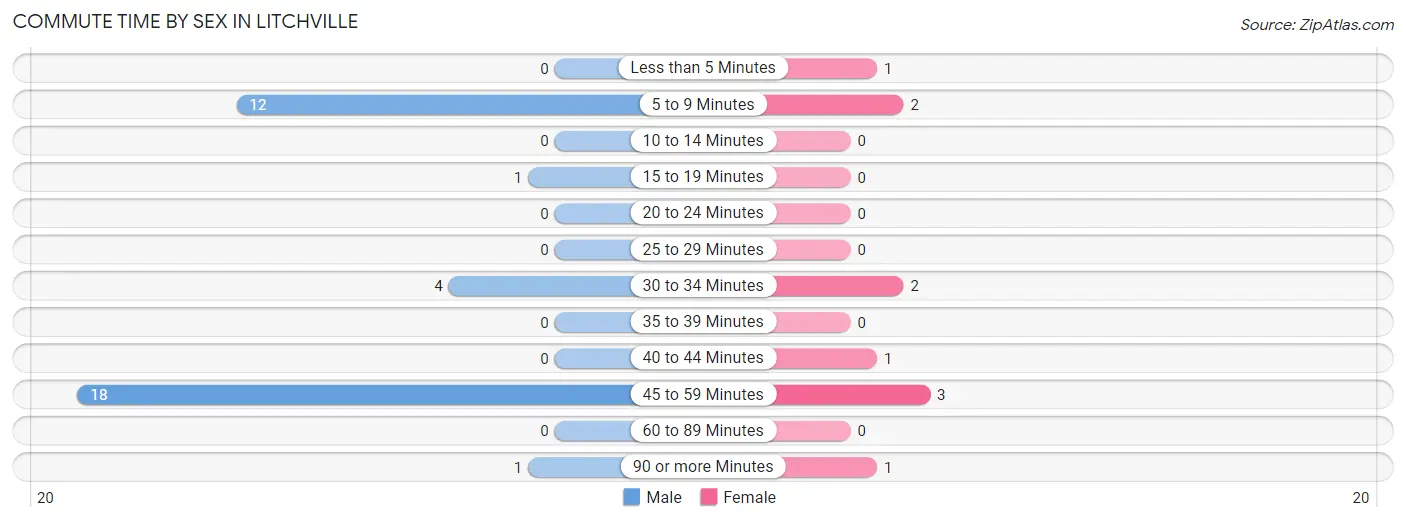
| Commute Time | Male | Female |
| Less than 5 Minutes | 0 (0.0%) | 1 (10.0%) |
| 5 to 9 Minutes | 12 (33.3%) | 2 (20.0%) |
| 10 to 14 Minutes | 0 (0.0%) | 0 (0.0%) |
| 15 to 19 Minutes | 1 (2.8%) | 0 (0.0%) |
| 20 to 24 Minutes | 0 (0.0%) | 0 (0.0%) |
| 25 to 29 Minutes | 0 (0.0%) | 0 (0.0%) |
| 30 to 34 Minutes | 4 (11.1%) | 2 (20.0%) |
| 35 to 39 Minutes | 0 (0.0%) | 0 (0.0%) |
| 40 to 44 Minutes | 0 (0.0%) | 1 (10.0%) |
| 45 to 59 Minutes | 18 (50.0%) | 3 (30.0%) |
| 60 to 89 Minutes | 0 (0.0%) | 0 (0.0%) |
| 90 or more Minutes | 1 (2.8%) | 1 (10.0%) |
Time of Departure to Work by Sex in Litchville
The most frequent times of departure to work in Litchville are 12:00 AM to 4:59 AM (22, 61.1%) for males and 5:30 AM to 5:59 AM (2, 20.0%) for females.
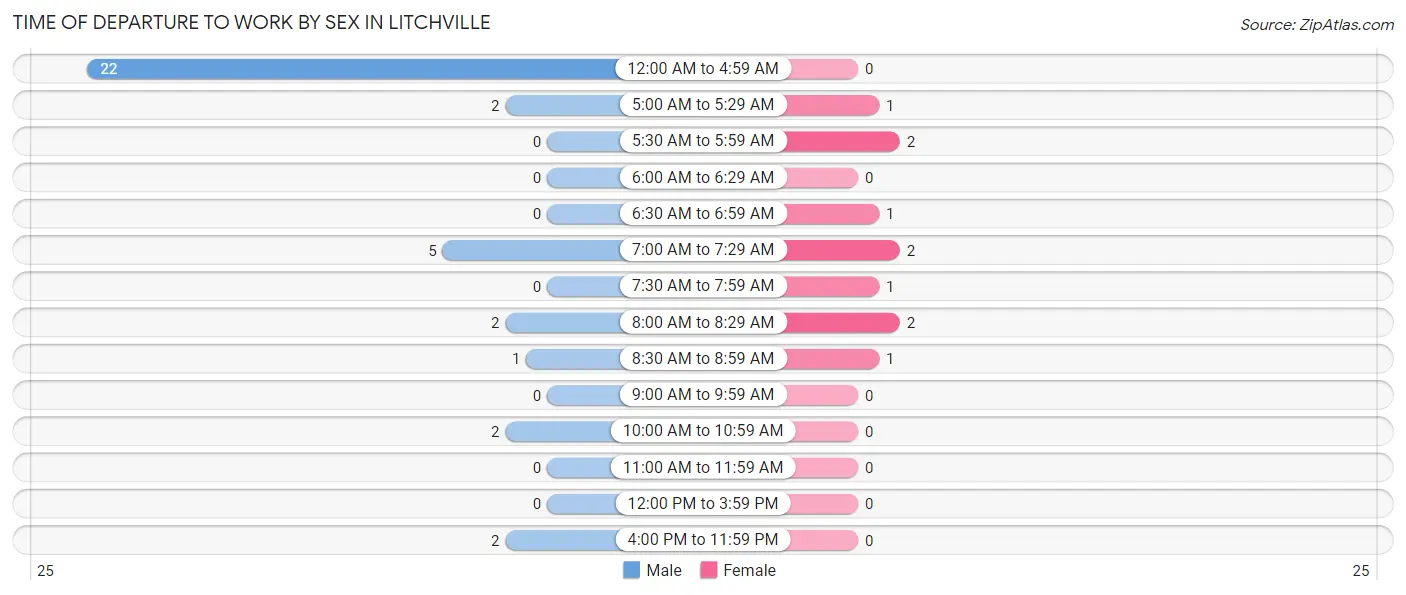
| Time of Departure | Male | Female |
| 12:00 AM to 4:59 AM | 22 (61.1%) | 0 (0.0%) |
| 5:00 AM to 5:29 AM | 2 (5.6%) | 1 (10.0%) |
| 5:30 AM to 5:59 AM | 0 (0.0%) | 2 (20.0%) |
| 6:00 AM to 6:29 AM | 0 (0.0%) | 0 (0.0%) |
| 6:30 AM to 6:59 AM | 0 (0.0%) | 1 (10.0%) |
| 7:00 AM to 7:29 AM | 5 (13.9%) | 2 (20.0%) |
| 7:30 AM to 7:59 AM | 0 (0.0%) | 1 (10.0%) |
| 8:00 AM to 8:29 AM | 2 (5.6%) | 2 (20.0%) |
| 8:30 AM to 8:59 AM | 1 (2.8%) | 1 (10.0%) |
| 9:00 AM to 9:59 AM | 0 (0.0%) | 0 (0.0%) |
| 10:00 AM to 10:59 AM | 2 (5.6%) | 0 (0.0%) |
| 11:00 AM to 11:59 AM | 0 (0.0%) | 0 (0.0%) |
| 12:00 PM to 3:59 PM | 0 (0.0%) | 0 (0.0%) |
| 4:00 PM to 11:59 PM | 2 (5.6%) | 0 (0.0%) |
| Total | 36 (100.0%) | 10 (100.0%) |
Housing Occupancy in Litchville
Occupancy by Ownership in Litchville
Of the total 71 dwellings in Litchville, owner-occupied units account for 53 (74.7%), while renter-occupied units make up 18 (25.4%).
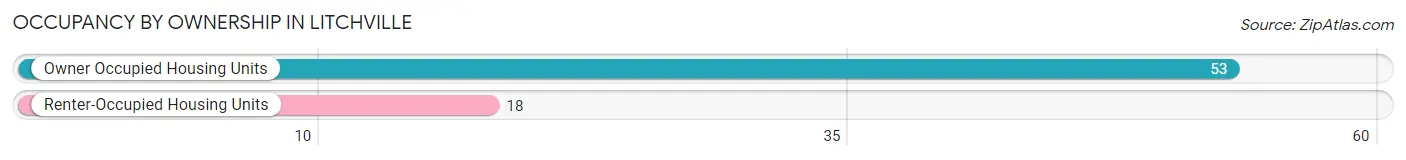
| Occupancy | # Housing Units | % Housing Units |
| Owner Occupied Housing Units | 53 | 74.7% |
| Renter-Occupied Housing Units | 18 | 25.4% |
| Total Occupied Housing Units | 71 | 100.0% |
Occupancy by Household Size in Litchville
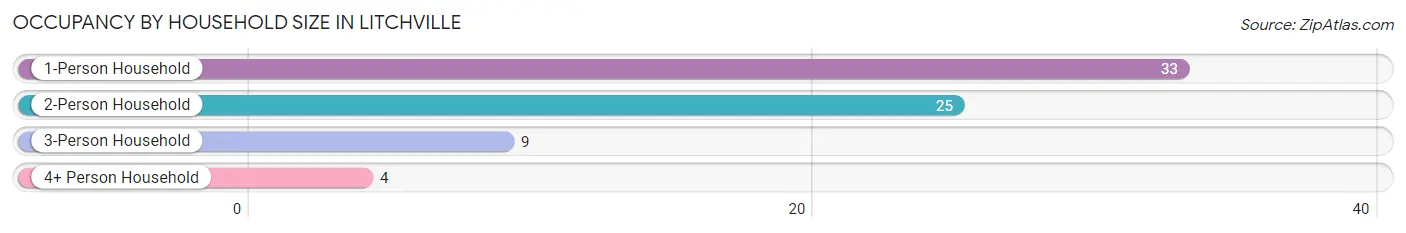
| Household Size | # Housing Units | % Housing Units |
| 1-Person Household | 33 | 46.5% |
| 2-Person Household | 25 | 35.2% |
| 3-Person Household | 9 | 12.7% |
| 4+ Person Household | 4 | 5.6% |
| Total Housing Units | 71 | 100.0% |
Occupancy by Ownership by Household Size in Litchville
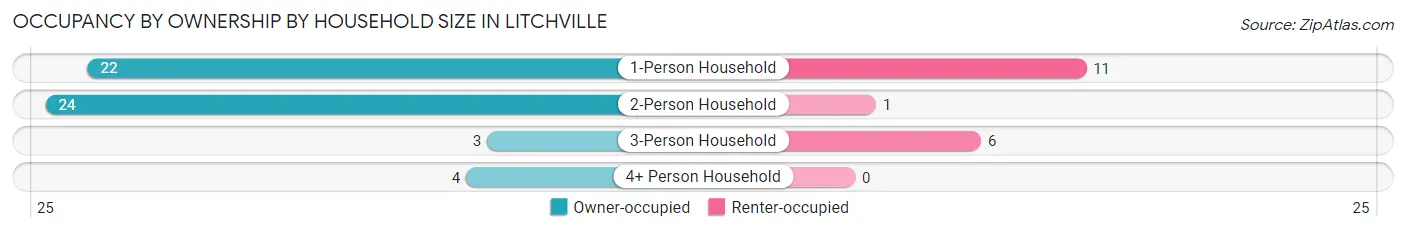
| Household Size | Owner-occupied | Renter-occupied |
| 1-Person Household | 22 (66.7%) | 11 (33.3%) |
| 2-Person Household | 24 (96.0%) | 1 (4.0%) |
| 3-Person Household | 3 (33.3%) | 6 (66.7%) |
| 4+ Person Household | 4 (100.0%) | 0 (0.0%) |
| Total Housing Units | 53 (74.7%) | 18 (25.4%) |
Occupancy by Educational Attainment in Litchville
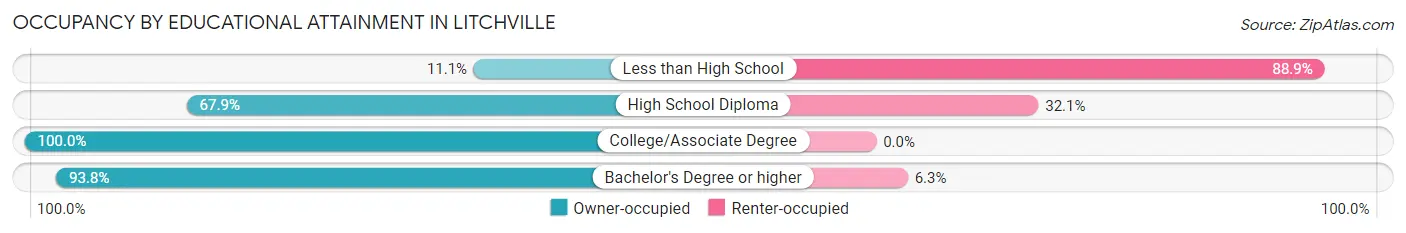
| Household Size | Owner-occupied | Renter-occupied |
| Less than High School | 1 (11.1%) | 8 (88.9%) |
| High School Diploma | 19 (67.9%) | 9 (32.1%) |
| College/Associate Degree | 18 (100.0%) | 0 (0.0%) |
| Bachelor's Degree or higher | 15 (93.8%) | 1 (6.2%) |
Occupancy by Age of Householder in Litchville
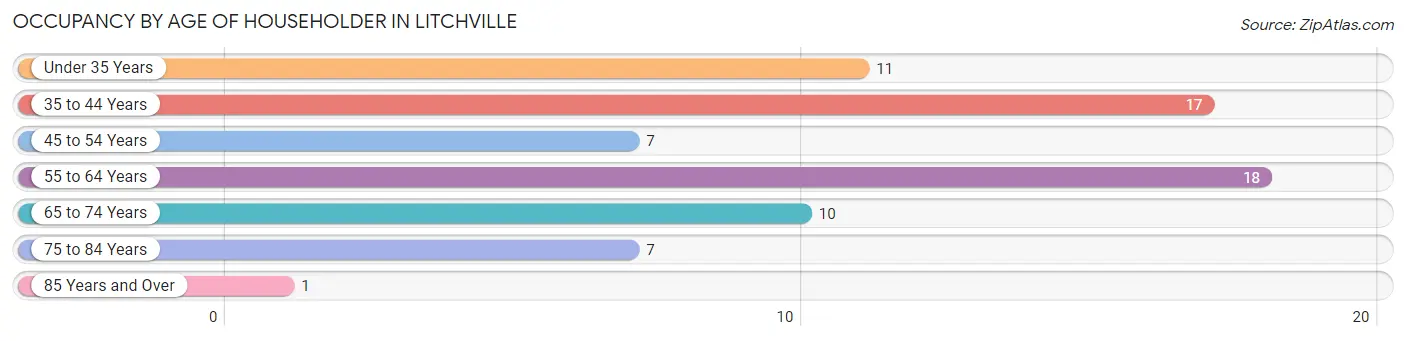
| Age Bracket | # Households | % Households |
| Under 35 Years | 11 | 15.5% |
| 35 to 44 Years | 17 | 23.9% |
| 45 to 54 Years | 7 | 9.9% |
| 55 to 64 Years | 18 | 25.4% |
| 65 to 74 Years | 10 | 14.1% |
| 75 to 84 Years | 7 | 9.9% |
| 85 Years and Over | 1 | 1.4% |
| Total | 71 | 100.0% |
Housing Finances in Litchville
Median Income by Occupancy in Litchville
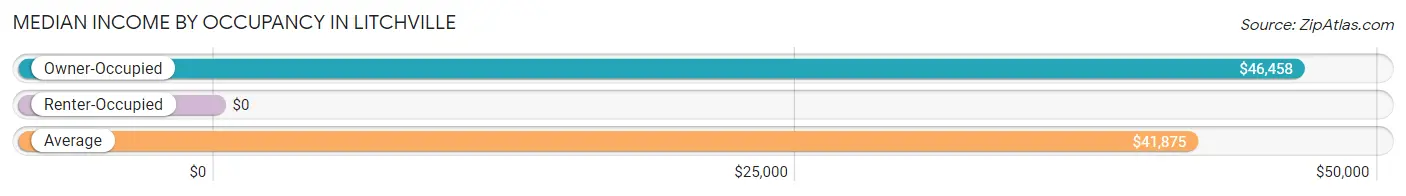
| Occupancy Type | # Households | Median Income |
| Owner-Occupied | 53 (74.7%) | $46,458 |
| Renter-Occupied | 18 (25.4%) | $0 |
| Average | 71 (100.0%) | $41,875 |
Occupancy by Householder Income Bracket in Litchville
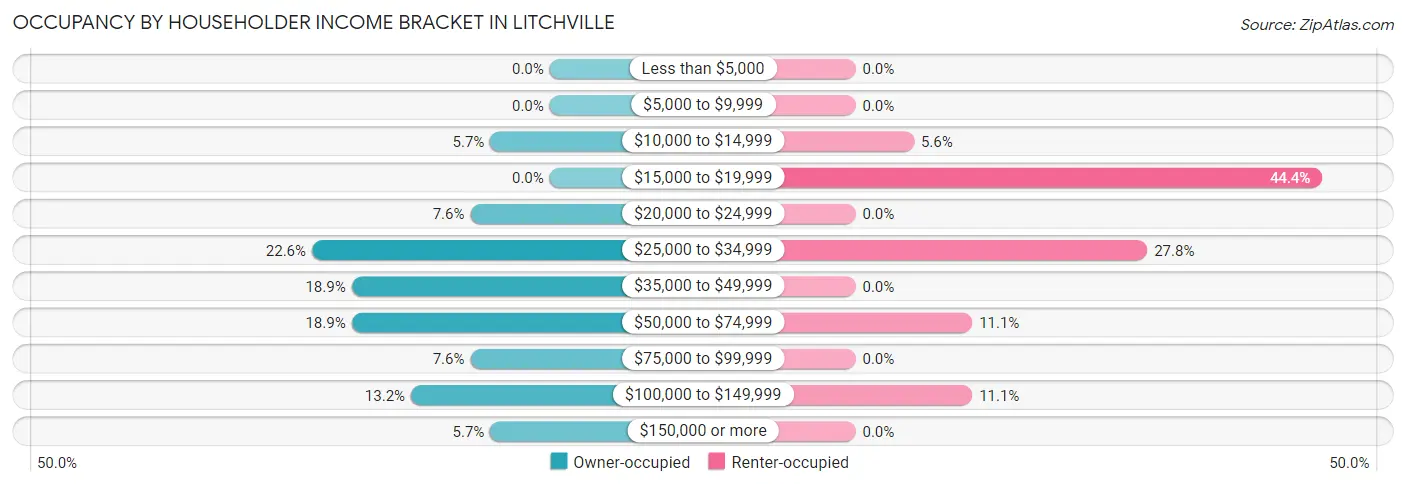
| Income Bracket | Owner-occupied | Renter-occupied |
| Less than $5,000 | 0 (0.0%) | 0 (0.0%) |
| $5,000 to $9,999 | 0 (0.0%) | 0 (0.0%) |
| $10,000 to $14,999 | 3 (5.7%) | 1 (5.6%) |
| $15,000 to $19,999 | 0 (0.0%) | 8 (44.4%) |
| $20,000 to $24,999 | 4 (7.5%) | 0 (0.0%) |
| $25,000 to $34,999 | 12 (22.6%) | 5 (27.8%) |
| $35,000 to $49,999 | 10 (18.9%) | 0 (0.0%) |
| $50,000 to $74,999 | 10 (18.9%) | 2 (11.1%) |
| $75,000 to $99,999 | 4 (7.5%) | 0 (0.0%) |
| $100,000 to $149,999 | 7 (13.2%) | 2 (11.1%) |
| $150,000 or more | 3 (5.7%) | 0 (0.0%) |
| Total | 53 (100.0%) | 18 (100.0%) |
Monthly Housing Cost Tiers in Litchville
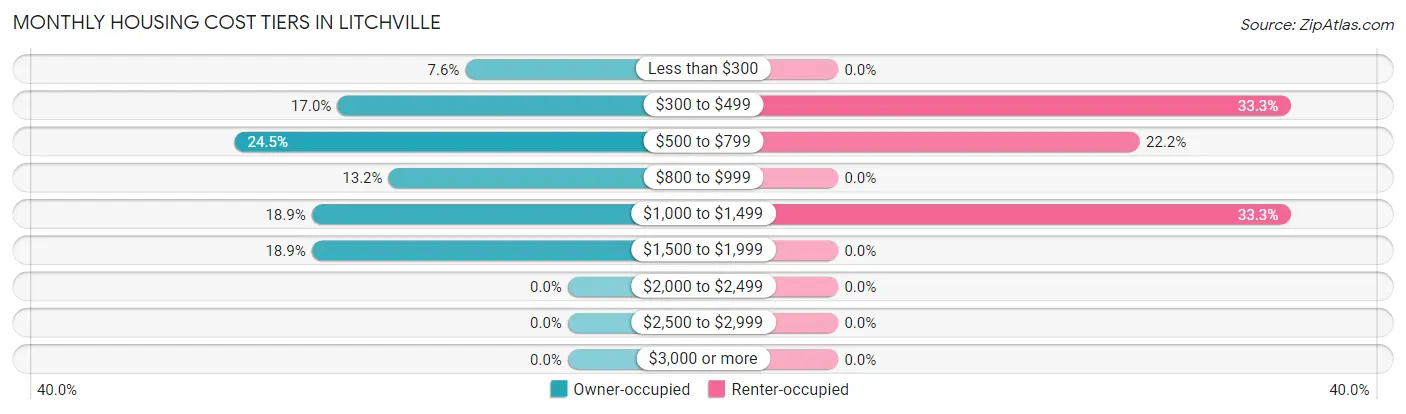
| Monthly Cost | Owner-occupied | Renter-occupied |
| Less than $300 | 4 (7.5%) | 0 (0.0%) |
| $300 to $499 | 9 (17.0%) | 6 (33.3%) |
| $500 to $799 | 13 (24.5%) | 4 (22.2%) |
| $800 to $999 | 7 (13.2%) | 0 (0.0%) |
| $1,000 to $1,499 | 10 (18.9%) | 6 (33.3%) |
| $1,500 to $1,999 | 10 (18.9%) | 0 (0.0%) |
| $2,000 to $2,499 | 0 (0.0%) | 0 (0.0%) |
| $2,500 to $2,999 | 0 (0.0%) | 0 (0.0%) |
| $3,000 or more | 0 (0.0%) | 0 (0.0%) |
| Total | 53 (100.0%) | 18 (100.0%) |
Physical Housing Characteristics in Litchville
Housing Structures in Litchville
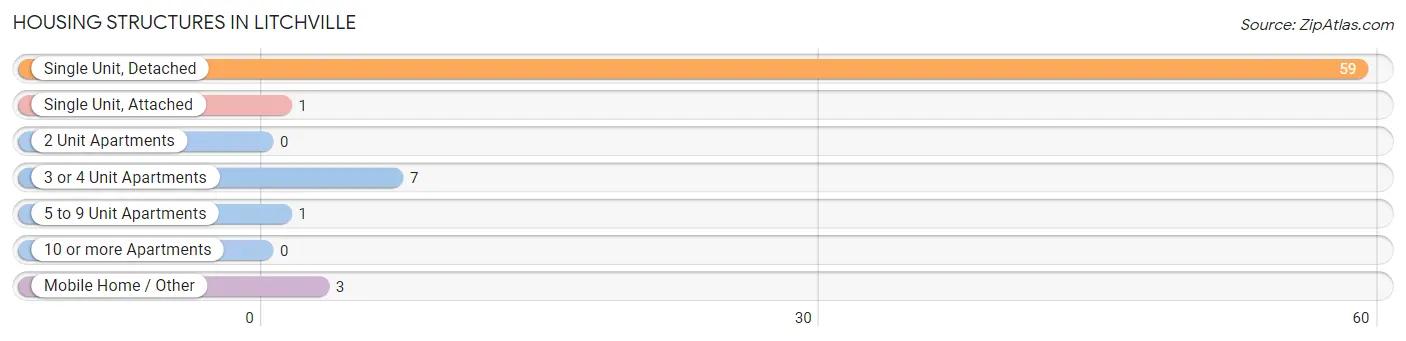
| Structure Type | # Housing Units | % Housing Units |
| Single Unit, Detached | 59 | 83.1% |
| Single Unit, Attached | 1 | 1.4% |
| 2 Unit Apartments | 0 | 0.0% |
| 3 or 4 Unit Apartments | 7 | 9.9% |
| 5 to 9 Unit Apartments | 1 | 1.4% |
| 10 or more Apartments | 0 | 0.0% |
| Mobile Home / Other | 3 | 4.2% |
| Total | 71 | 100.0% |
Housing Structures by Occupancy in Litchville
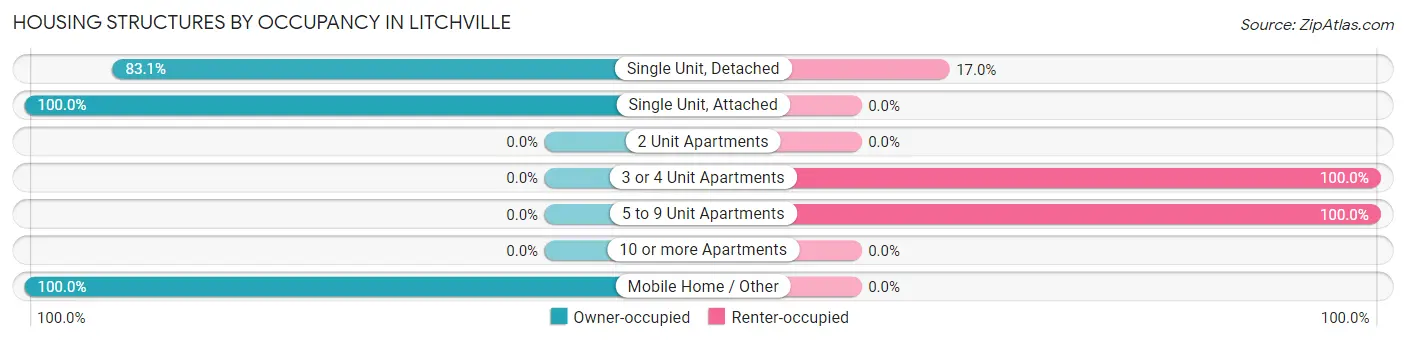
| Structure Type | Owner-occupied | Renter-occupied |
| Single Unit, Detached | 49 (83.1%) | 10 (17.0%) |
| Single Unit, Attached | 1 (100.0%) | 0 (0.0%) |
| 2 Unit Apartments | 0 (0.0%) | 0 (0.0%) |
| 3 or 4 Unit Apartments | 0 (0.0%) | 7 (100.0%) |
| 5 to 9 Unit Apartments | 0 (0.0%) | 1 (100.0%) |
| 10 or more Apartments | 0 (0.0%) | 0 (0.0%) |
| Mobile Home / Other | 3 (100.0%) | 0 (0.0%) |
| Total | 53 (74.7%) | 18 (25.4%) |
Housing Structures by Number of Rooms in Litchville
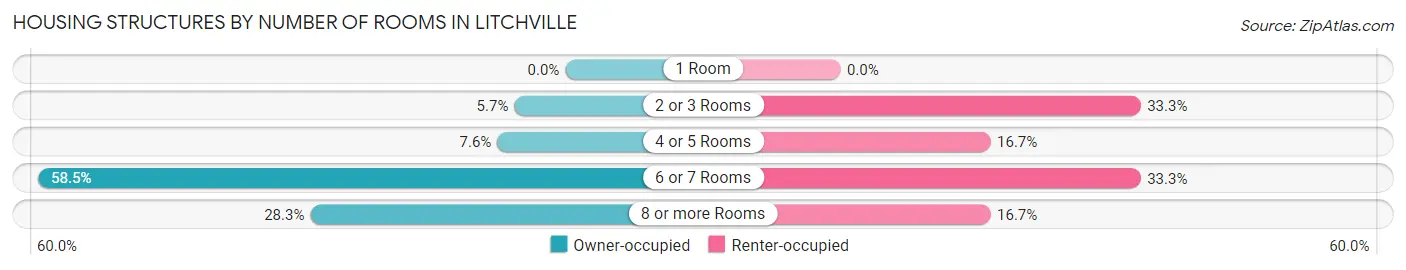
| Number of Rooms | Owner-occupied | Renter-occupied |
| 1 Room | 0 (0.0%) | 0 (0.0%) |
| 2 or 3 Rooms | 3 (5.7%) | 6 (33.3%) |
| 4 or 5 Rooms | 4 (7.5%) | 3 (16.7%) |
| 6 or 7 Rooms | 31 (58.5%) | 6 (33.3%) |
| 8 or more Rooms | 15 (28.3%) | 3 (16.7%) |
| Total | 53 (100.0%) | 18 (100.0%) |
Housing Structure by Heating Type in Litchville
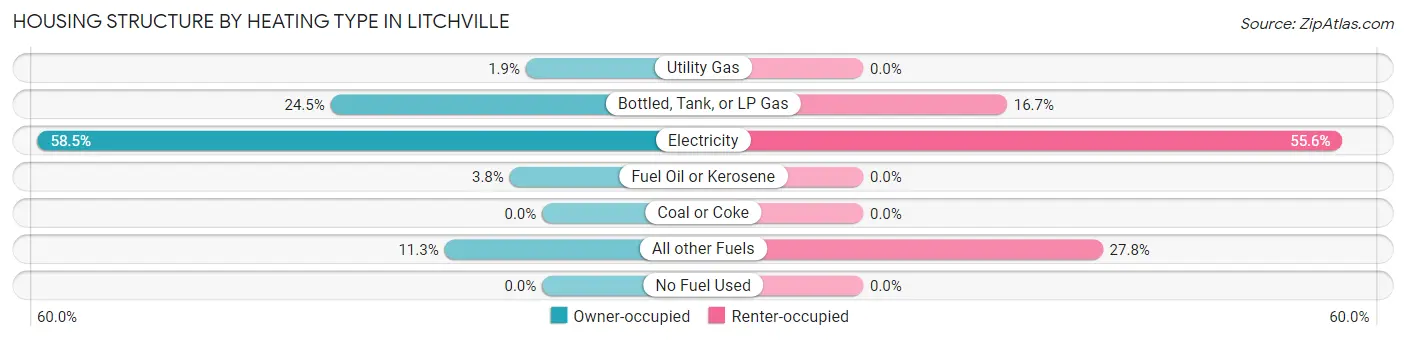
| Heating Type | Owner-occupied | Renter-occupied |
| Utility Gas | 1 (1.9%) | 0 (0.0%) |
| Bottled, Tank, or LP Gas | 13 (24.5%) | 3 (16.7%) |
| Electricity | 31 (58.5%) | 10 (55.6%) |
| Fuel Oil or Kerosene | 2 (3.8%) | 0 (0.0%) |
| Coal or Coke | 0 (0.0%) | 0 (0.0%) |
| All other Fuels | 6 (11.3%) | 5 (27.8%) |
| No Fuel Used | 0 (0.0%) | 0 (0.0%) |
| Total | 53 (100.0%) | 18 (100.0%) |
Household Vehicle Usage in Litchville
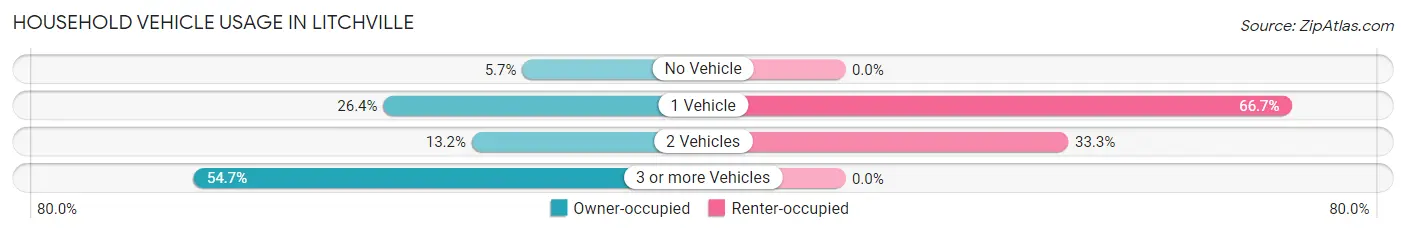
| Vehicles per Household | Owner-occupied | Renter-occupied |
| No Vehicle | 3 (5.7%) | 0 (0.0%) |
| 1 Vehicle | 14 (26.4%) | 12 (66.7%) |
| 2 Vehicles | 7 (13.2%) | 6 (33.3%) |
| 3 or more Vehicles | 29 (54.7%) | 0 (0.0%) |
| Total | 53 (100.0%) | 18 (100.0%) |
Real Estate & Mortgages in Litchville
Real Estate and Mortgage Overview in Litchville
| Characteristic | Without Mortgage | With Mortgage |
| Housing Units | 25 | 28 |
| Median Property Value | $82,500 | $158,300 |
| Median Household Income | $56,250 | $2 |
| Monthly Housing Costs | $490 | $0 |
| Real Estate Taxes | - | - |
Property Value by Mortgage Status in Litchville
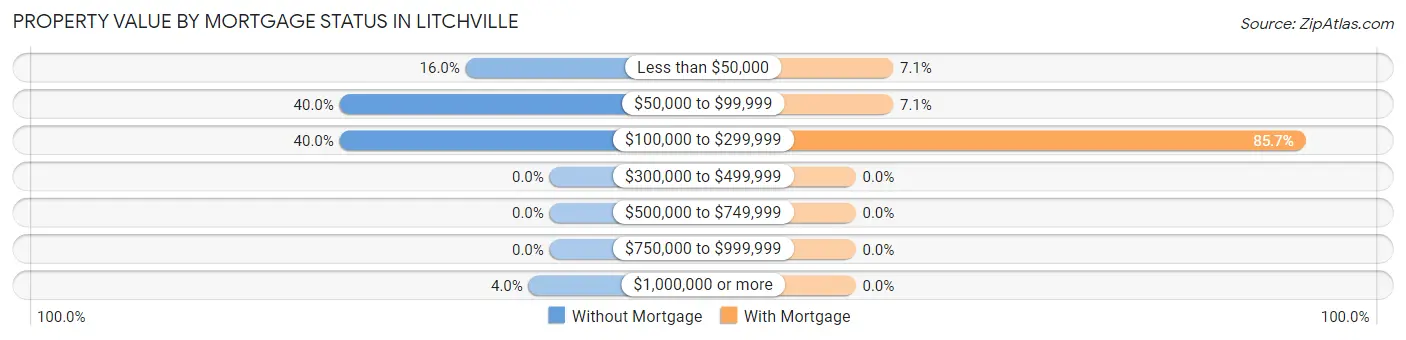
| Property Value | Without Mortgage | With Mortgage |
| Less than $50,000 | 4 (16.0%) | 2 (7.1%) |
| $50,000 to $99,999 | 10 (40.0%) | 2 (7.1%) |
| $100,000 to $299,999 | 10 (40.0%) | 24 (85.7%) |
| $300,000 to $499,999 | 0 (0.0%) | 0 (0.0%) |
| $500,000 to $749,999 | 0 (0.0%) | 0 (0.0%) |
| $750,000 to $999,999 | 0 (0.0%) | 0 (0.0%) |
| $1,000,000 or more | 1 (4.0%) | 0 (0.0%) |
| Total | 25 (100.0%) | 28 (100.0%) |
Household Income by Mortgage Status in Litchville
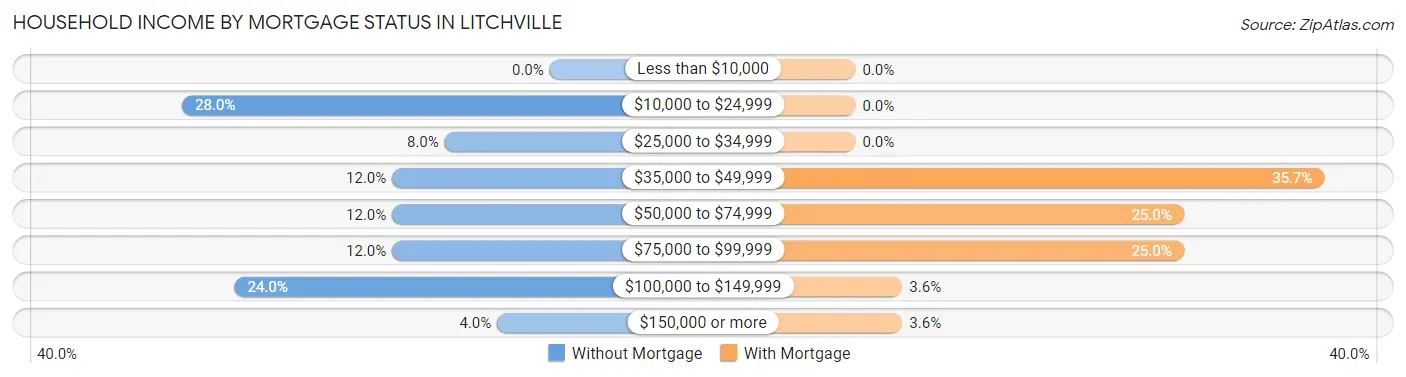
| Household Income | Without Mortgage | With Mortgage |
| Less than $10,000 | 0 (0.0%) | 0 (0.0%) |
| $10,000 to $24,999 | 7 (28.0%) | 0 (0.0%) |
| $25,000 to $34,999 | 2 (8.0%) | 0 (0.0%) |
| $35,000 to $49,999 | 3 (12.0%) | 10 (35.7%) |
| $50,000 to $74,999 | 3 (12.0%) | 7 (25.0%) |
| $75,000 to $99,999 | 3 (12.0%) | 7 (25.0%) |
| $100,000 to $149,999 | 6 (24.0%) | 1 (3.6%) |
| $150,000 or more | 1 (4.0%) | 1 (3.6%) |
| Total | 25 (100.0%) | 28 (100.0%) |
Property Value to Household Income Ratio in Litchville
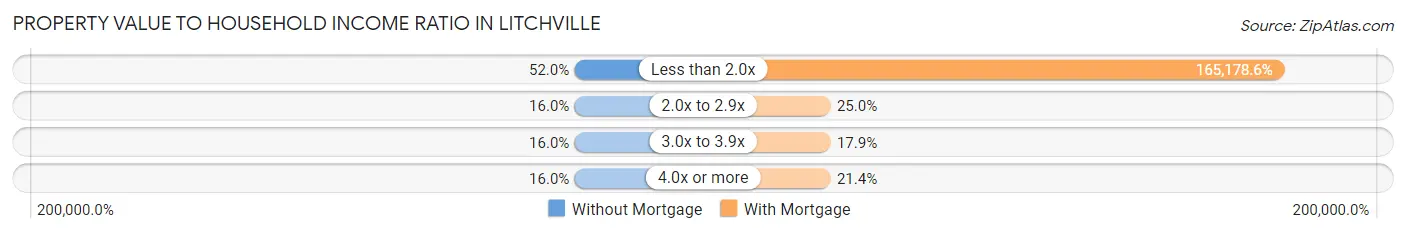
| Value-to-Income Ratio | Without Mortgage | With Mortgage |
| Less than 2.0x | 13 (52.0%) | 46,250 (165,178.6%) |
| 2.0x to 2.9x | 4 (16.0%) | 7 (25.0%) |
| 3.0x to 3.9x | 4 (16.0%) | 5 (17.9%) |
| 4.0x or more | 4 (16.0%) | 6 (21.4%) |
| Total | 25 (100.0%) | 28 (100.0%) |
Real Estate Taxes by Mortgage Status in Litchville
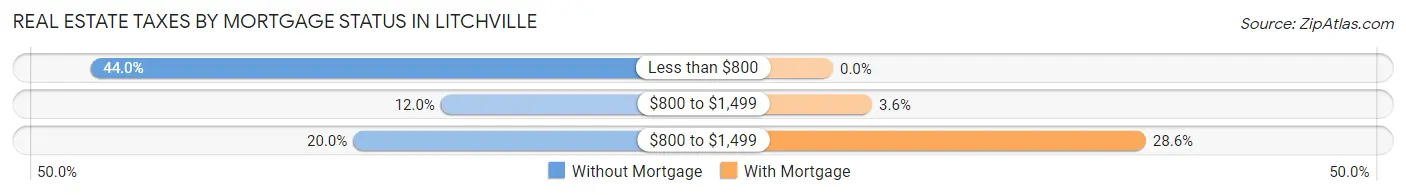
| Property Taxes | Without Mortgage | With Mortgage |
| Less than $800 | 11 (44.0%) | 0 (0.0%) |
| $800 to $1,499 | 3 (12.0%) | 1 (3.6%) |
| $800 to $1,499 | 5 (20.0%) | 8 (28.6%) |
| Total | 25 (100.0%) | 28 (100.0%) |
Health & Disability in Litchville
Health Insurance Coverage by Age in Litchville
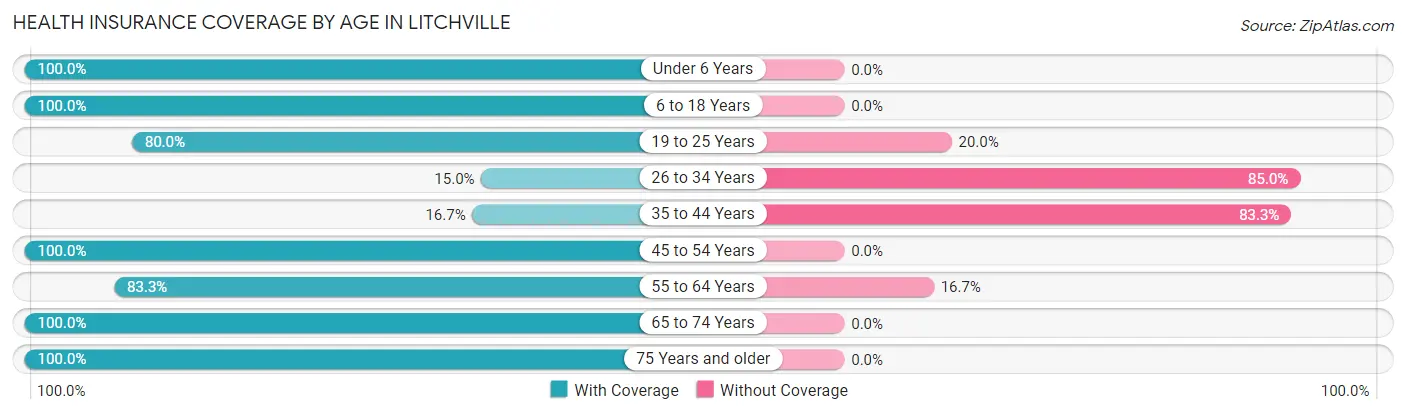
| Age Bracket | With Coverage | Without Coverage |
| Under 6 Years | 5 (100.0%) | 0 (0.0%) |
| 6 to 18 Years | 15 (100.0%) | 0 (0.0%) |
| 19 to 25 Years | 8 (80.0%) | 2 (20.0%) |
| 26 to 34 Years | 6 (15.0%) | 34 (85.0%) |
| 35 to 44 Years | 3 (16.7%) | 15 (83.3%) |
| 45 to 54 Years | 10 (100.0%) | 0 (0.0%) |
| 55 to 64 Years | 25 (83.3%) | 5 (16.7%) |
| 65 to 74 Years | 12 (100.0%) | 0 (0.0%) |
| 75 Years and older | 12 (100.0%) | 0 (0.0%) |
| Total | 96 (63.2%) | 56 (36.8%) |
Health Insurance Coverage by Citizenship Status in Litchville
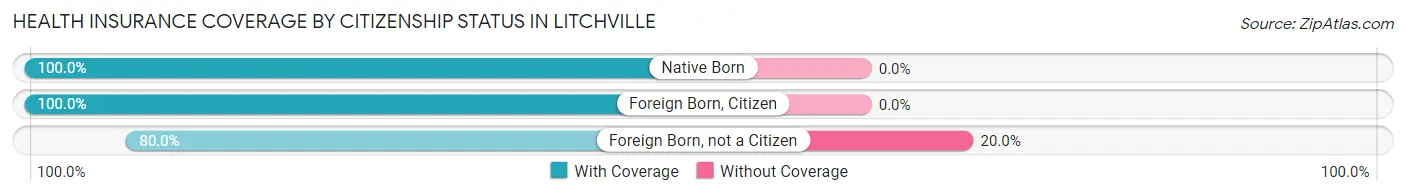
| Citizenship Status | With Coverage | Without Coverage |
| Native Born | 5 (100.0%) | 0 (0.0%) |
| Foreign Born, Citizen | 15 (100.0%) | 0 (0.0%) |
| Foreign Born, not a Citizen | 8 (80.0%) | 2 (20.0%) |
Health Insurance Coverage by Household Income in Litchville
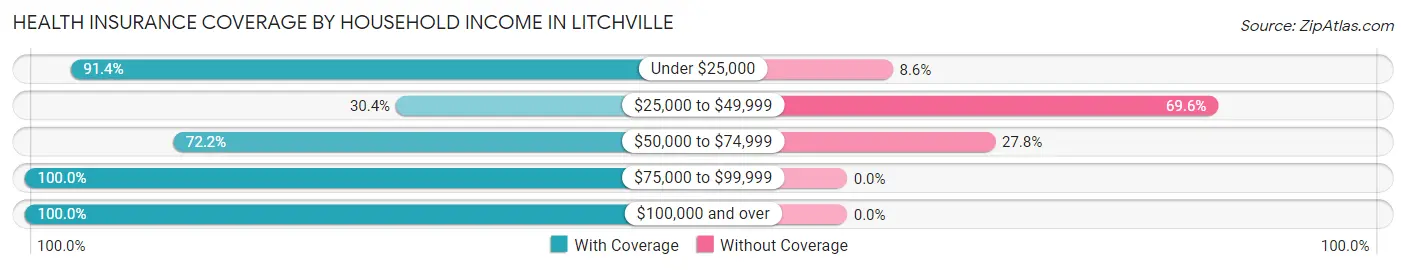
| Household Income | With Coverage | Without Coverage |
| Under $25,000 | 32 (91.4%) | 3 (8.6%) |
| $25,000 to $49,999 | 21 (30.4%) | 48 (69.6%) |
| $50,000 to $74,999 | 13 (72.2%) | 5 (27.8%) |
| $75,000 to $99,999 | 9 (100.0%) | 0 (0.0%) |
| $100,000 and over | 21 (100.0%) | 0 (0.0%) |
Public vs Private Health Insurance Coverage by Age in Litchville
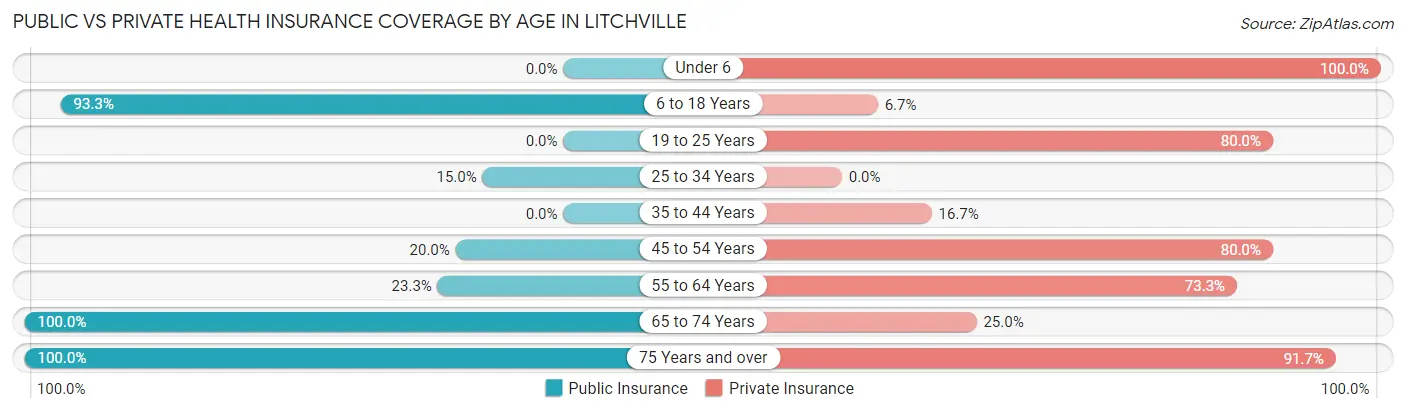
| Age Bracket | Public Insurance | Private Insurance |
| Under 6 | 0 (0.0%) | 5 (100.0%) |
| 6 to 18 Years | 14 (93.3%) | 1 (6.7%) |
| 19 to 25 Years | 0 (0.0%) | 8 (80.0%) |
| 25 to 34 Years | 6 (15.0%) | 0 (0.0%) |
| 35 to 44 Years | 0 (0.0%) | 3 (16.7%) |
| 45 to 54 Years | 2 (20.0%) | 8 (80.0%) |
| 55 to 64 Years | 7 (23.3%) | 22 (73.3%) |
| 65 to 74 Years | 12 (100.0%) | 3 (25.0%) |
| 75 Years and over | 12 (100.0%) | 11 (91.7%) |
| Total | 53 (34.9%) | 61 (40.1%) |
Disability Status by Sex by Age in Litchville
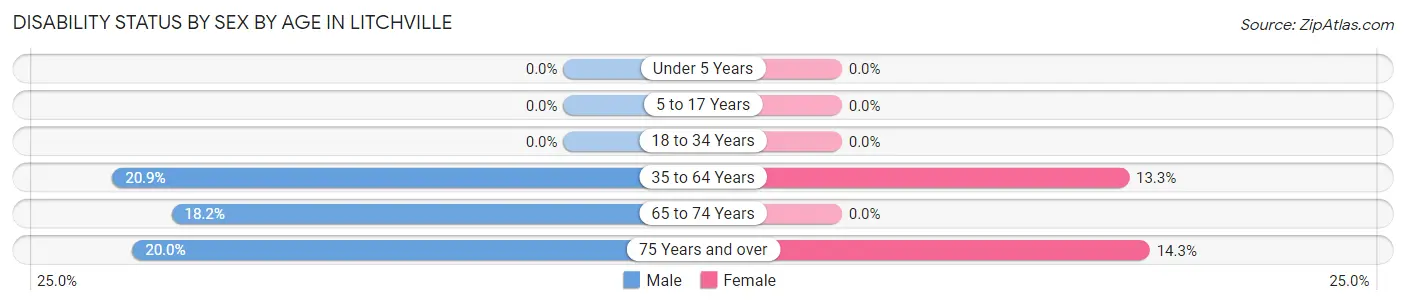
| Age Bracket | Male | Female |
| Under 5 Years | 0 (0.0%) | 0 (0.0%) |
| 5 to 17 Years | 0 (0.0%) | 0 (0.0%) |
| 18 to 34 Years | 0 (0.0%) | 0 (0.0%) |
| 35 to 64 Years | 9 (20.9%) | 2 (13.3%) |
| 65 to 74 Years | 2 (18.2%) | 0 (0.0%) |
| 75 Years and over | 1 (20.0%) | 1 (14.3%) |
Disability Class by Sex by Age in Litchville
Disability Class: Hearing Difficulty
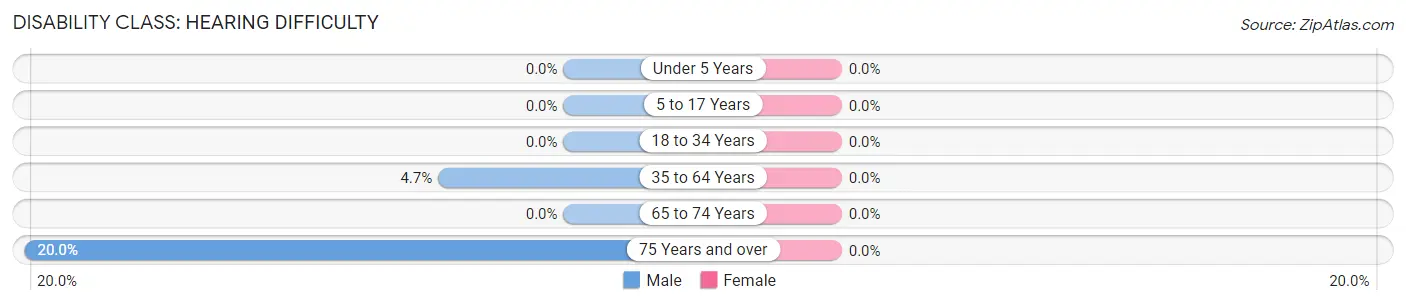
| Age Bracket | Male | Female |
| Under 5 Years | 0 (0.0%) | 0 (0.0%) |
| 5 to 17 Years | 0 (0.0%) | 0 (0.0%) |
| 18 to 34 Years | 0 (0.0%) | 0 (0.0%) |
| 35 to 64 Years | 2 (4.6%) | 0 (0.0%) |
| 65 to 74 Years | 0 (0.0%) | 0 (0.0%) |
| 75 Years and over | 1 (20.0%) | 0 (0.0%) |
Disability Class: Vision Difficulty
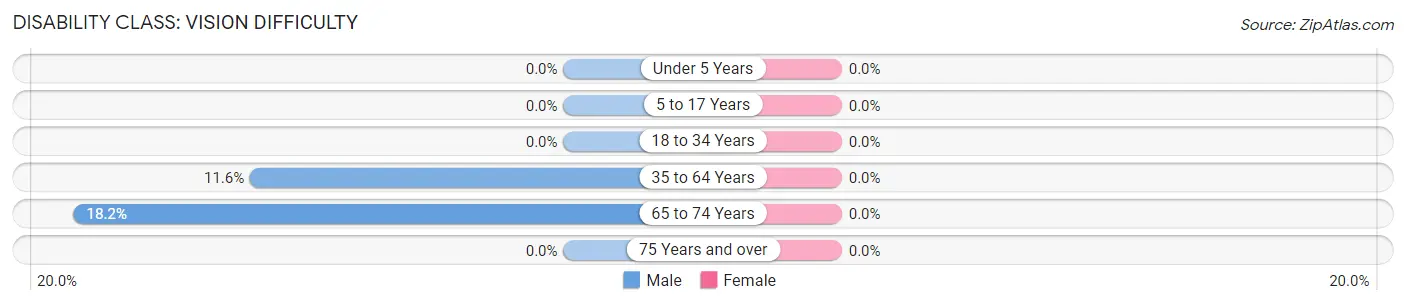
| Age Bracket | Male | Female |
| Under 5 Years | 0 (0.0%) | 0 (0.0%) |
| 5 to 17 Years | 0 (0.0%) | 0 (0.0%) |
| 18 to 34 Years | 0 (0.0%) | 0 (0.0%) |
| 35 to 64 Years | 5 (11.6%) | 0 (0.0%) |
| 65 to 74 Years | 2 (18.2%) | 0 (0.0%) |
| 75 Years and over | 0 (0.0%) | 0 (0.0%) |
Disability Class: Cognitive Difficulty
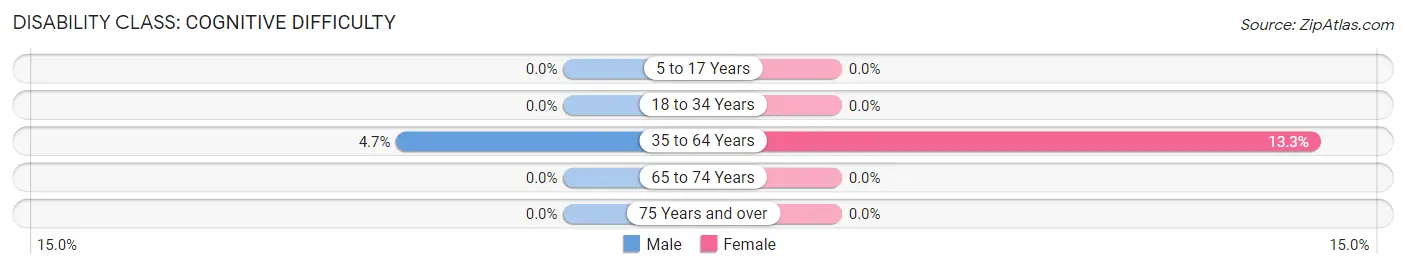
| Age Bracket | Male | Female |
| 5 to 17 Years | 0 (0.0%) | 0 (0.0%) |
| 18 to 34 Years | 0 (0.0%) | 0 (0.0%) |
| 35 to 64 Years | 2 (4.6%) | 2 (13.3%) |
| 65 to 74 Years | 0 (0.0%) | 0 (0.0%) |
| 75 Years and over | 0 (0.0%) | 0 (0.0%) |
Disability Class: Ambulatory Difficulty
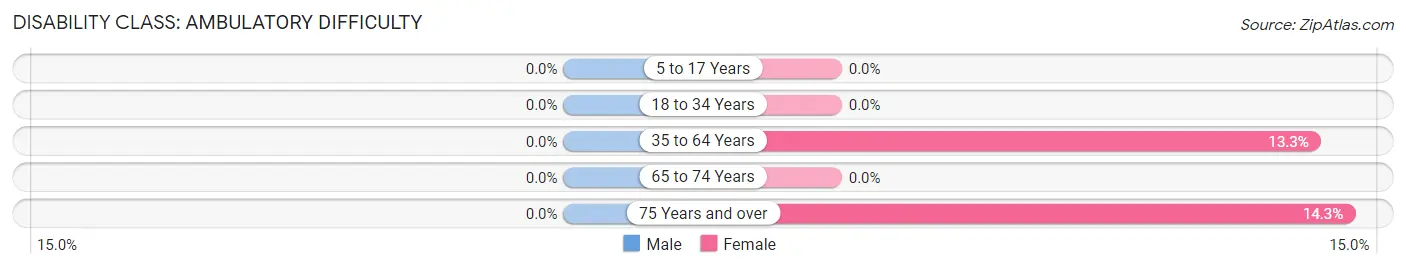
| Age Bracket | Male | Female |
| 5 to 17 Years | 0 (0.0%) | 0 (0.0%) |
| 18 to 34 Years | 0 (0.0%) | 0 (0.0%) |
| 35 to 64 Years | 0 (0.0%) | 2 (13.3%) |
| 65 to 74 Years | 0 (0.0%) | 0 (0.0%) |
| 75 Years and over | 0 (0.0%) | 1 (14.3%) |
Disability Class: Self-Care Difficulty
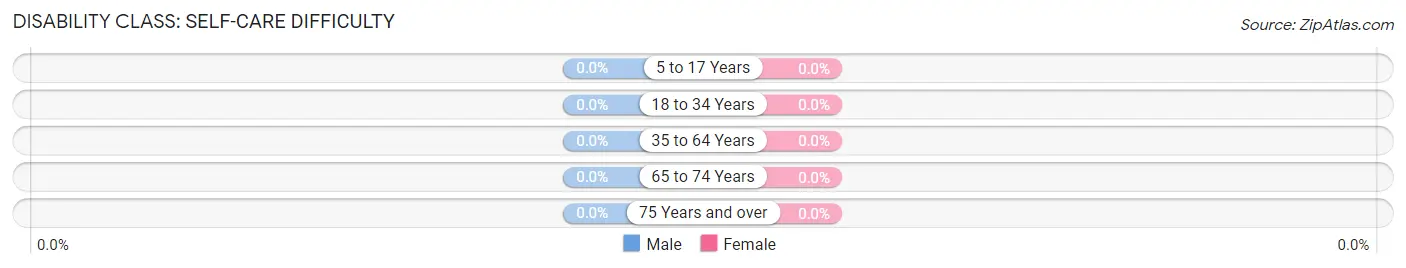
| Age Bracket | Male | Female |
| 5 to 17 Years | 0 (0.0%) | 0 (0.0%) |
| 18 to 34 Years | 0 (0.0%) | 0 (0.0%) |
| 35 to 64 Years | 0 (0.0%) | 0 (0.0%) |
| 65 to 74 Years | 0 (0.0%) | 0 (0.0%) |
| 75 Years and over | 0 (0.0%) | 0 (0.0%) |
Technology Access in Litchville
Computing Device Access in Litchville
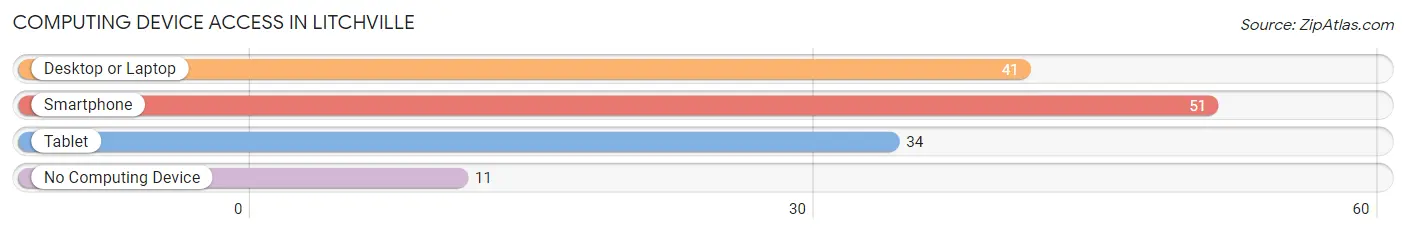
| Device Type | # Households | % Households |
| Desktop or Laptop | 41 | 57.8% |
| Smartphone | 51 | 71.8% |
| Tablet | 34 | 47.9% |
| No Computing Device | 11 | 15.5% |
| Total | 71 | 100.0% |
Internet Access in Litchville
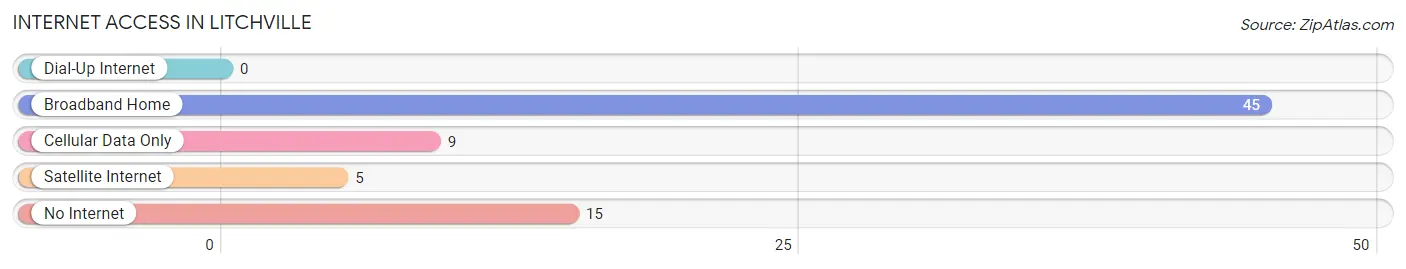
| Internet Type | # Households | % Households |
| Dial-Up Internet | 0 | 0.0% |
| Broadband Home | 45 | 63.4% |
| Cellular Data Only | 9 | 12.7% |
| Satellite Internet | 5 | 7.0% |
| No Internet | 15 | 21.1% |
| Total | 71 | 100.0% |
Litchville Summary
Litchville is a small city located in Barnes County, North Dakota. It is situated on the Sheyenne River, approximately 20 miles west of Valley City. The city has a population of approximately 500 people and is part of the Fargo-Moorhead metropolitan area.
History
Litchville was founded in 1882 by John Litch, a homesteader from Wisconsin. He named the town after himself and it quickly grew into a thriving community. The town was incorporated in 1887 and soon became a hub for the surrounding agricultural area. The town was home to a variety of businesses, including a bank, a hotel, a general store, a blacksmith, and a post office.
In the early 1900s, the town experienced a period of growth and prosperity. The railroad arrived in 1906, bringing with it new opportunities for trade and commerce. The town also became a popular destination for tourists, who came to enjoy the area’s natural beauty.
In the 1950s, the town began to decline as the railroad industry declined and the population began to move away. The town’s population dropped to just over 200 people by the 1970s. In recent years, the town has experienced a resurgence in population and economic activity.
Geography
Litchville is located in the Red River Valley, a flat, fertile region of North Dakota. The Sheyenne River runs through the city, providing a source of water for the area. The city is surrounded by rolling hills and prairies, and is located approximately 20 miles west of Valley City.
The climate in Litchville is typical of the northern Great Plains, with cold winters and hot summers. The average annual temperature is around 45 degrees Fahrenheit, and the average annual precipitation is around 20 inches.
Economy
The economy of Litchville is largely based on agriculture. The area is home to a variety of crops, including wheat, corn, soybeans, and sunflowers. The town is also home to a number of small businesses, including a grocery store, a hardware store, and a restaurant.
The town is also home to a number of manufacturing companies, including a furniture factory and a plastics factory. The town is also home to a number of service-based businesses, including a bank, a post office, and a medical clinic.
Demographics
As of the 2010 census, the population of Litchville was 498 people. The racial makeup of the town was 97.6% White, 0.2% African American, 0.2% Native American, 0.2% Asian, 0.2% from other races, and 1.8% from two or more races. Hispanic or Latino of any race were 0.8% of the population.
The median income for a household in Litchville was $37,500, and the median income for a family was $45,000. The per capita income for the town was $18,000. About 10.2% of families and 12.2% of the population were below the poverty line, including 16.7% of those under age 18 and 8.3% of those age 65 or over.
Litchville is a small town with a rich history and a bright future. The town is home to a variety of businesses and industries, and is a popular destination for tourists. The town’s population is growing, and the economy is thriving. Litchville is a great place to live, work, and play.
Common Questions
What is Per Capita Income in Litchville?
Per Capita income in Litchville is $27,536.
What is the Median Family Income in Litchville?
Median Family Income in Litchville is $68,750.
What is the Median Household income in Litchville?
Median Household Income in Litchville is $41,875.
What is Income or Wage Gap in Litchville?
Income or Wage Gap in Litchville is 22.9%.
Women in Litchville earn 77.1 cents for every dollar earned by a man.
What is Inequality or Gini Index in Litchville?
Inequality or Gini Index in Litchville is 0.42.
What is the Total Population of Litchville?
Total Population of Litchville is 152.
What is the Total Male Population of Litchville?
Total Male Population of Litchville is 74.
What is the Total Female Population of Litchville?
Total Female Population of Litchville is 78.
What is the Ratio of Males per 100 Females in Litchville?
There are 94.87 Males per 100 Females in Litchville.
What is the Ratio of Females per 100 Males in Litchville?
There are 105.41 Females per 100 Males in Litchville.
What is the Median Population Age in Litchville?
Median Population Age in Litchville is 39.3 Years.
What is the Average Family Size in Litchville
Average Family Size in Litchville is 2.7 People.
What is the Average Household Size in Litchville
Average Household Size in Litchville is 2.1 People.
How Large is the Labor Force in Litchville?
There are 53 People in the Labor Forcein in Litchville.
What is the Percentage of People in the Labor Force in Litchville?
39.8% of People are in the Labor Force in Litchville.