Zip Codes with the Highest Percentage of Population Employed in Food Preparation & Serving in Minot, ND
RELATED REPORTS & OPTIONS
Food Preparation & Serving
Minot
Compare Zip Codes
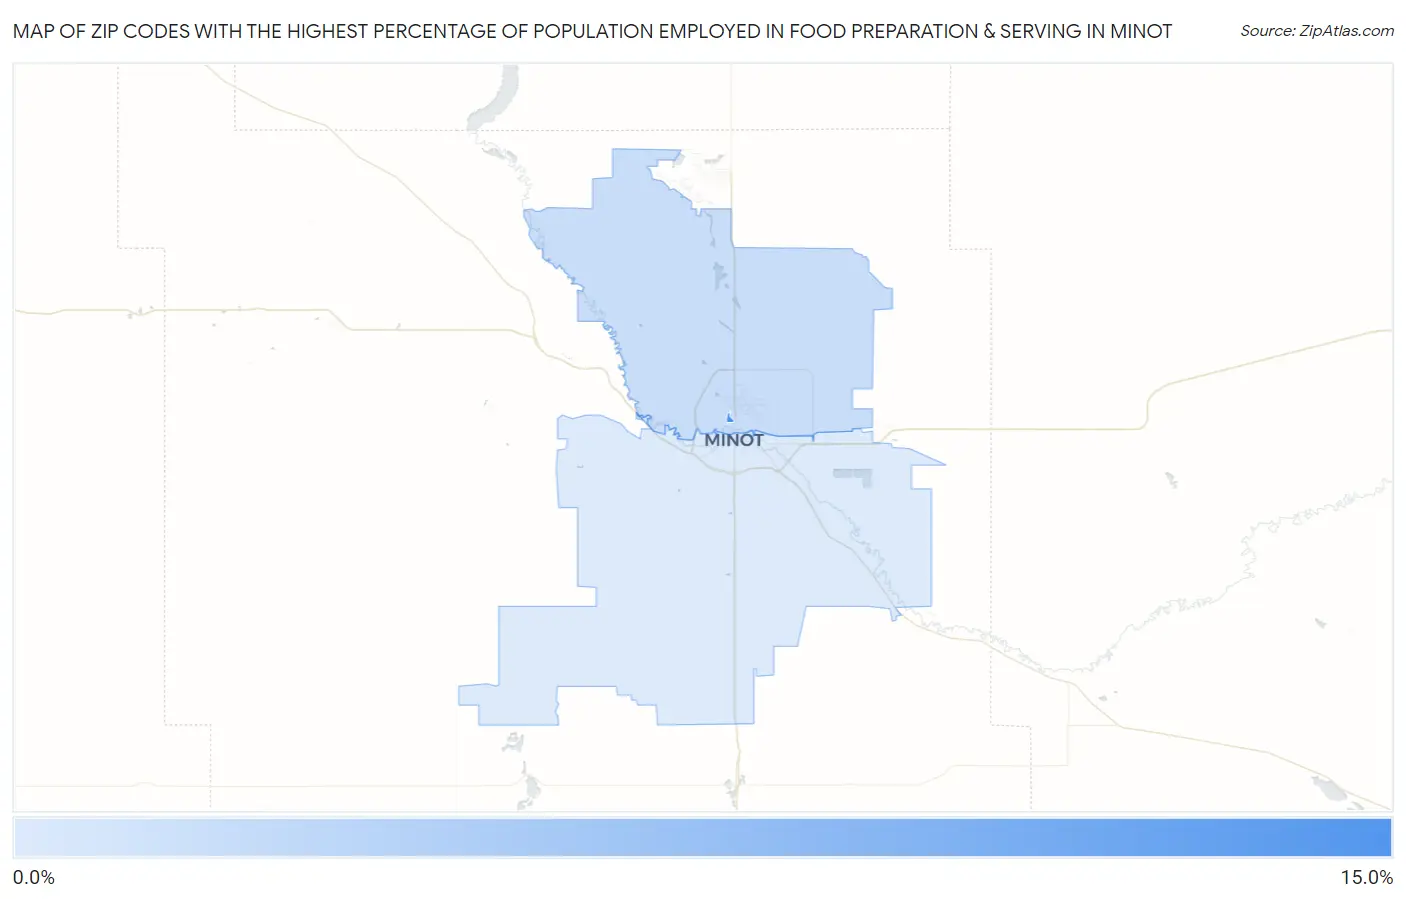
Map of Zip Codes with the Highest Percentage of Population Employed in Food Preparation & Serving in Minot
3.7%
10.4%
Zip Codes with the Highest Percentage of Population Employed in Food Preparation & Serving in Minot, ND
| Zip Code | % Employed | vs State | vs National | |
| 1. | 58707 | 10.4% | 5.2%(+5.18)#30 | 5.3%(+5.12)#2,369 |
| 2. | 58703 | 4.6% | 5.2%(-0.612)#120 | 5.3%(-0.669)#14,510 |
| 3. | 58701 | 3.7% | 5.2%(-1.55)#148 | 5.3%(-1.61)#18,445 |
1
Common Questions
What are the Top Zip Codes with the Highest Percentage of Population Employed in Food Preparation & Serving in Minot, ND?
Top Zip Codes with the Highest Percentage of Population Employed in Food Preparation & Serving in Minot, ND are:
What zip code has the Highest Percentage of Population Employed in Food Preparation & Serving in Minot, ND?
58707 has the Highest Percentage of Population Employed in Food Preparation & Serving in Minot, ND with 10.4%.
What is the Percentage of Population Employed in Food Preparation & Serving in Minot, ND?
Percentage of Population Employed in Food Preparation & Serving in Minot is 4.4%.
What is the Percentage of Population Employed in Food Preparation & Serving in North Dakota?
Percentage of Population Employed in Food Preparation & Serving in North Dakota is 5.2%.
What is the Percentage of Population Employed in Food Preparation & Serving in the United States?
Percentage of Population Employed in Food Preparation & Serving in the United States is 5.3%.