Zip Codes with the Highest Percentage of Population Employed in Food Preparation & Serving in Fargo, ND
RELATED REPORTS & OPTIONS
Food Preparation & Serving
Fargo
Compare Zip Codes
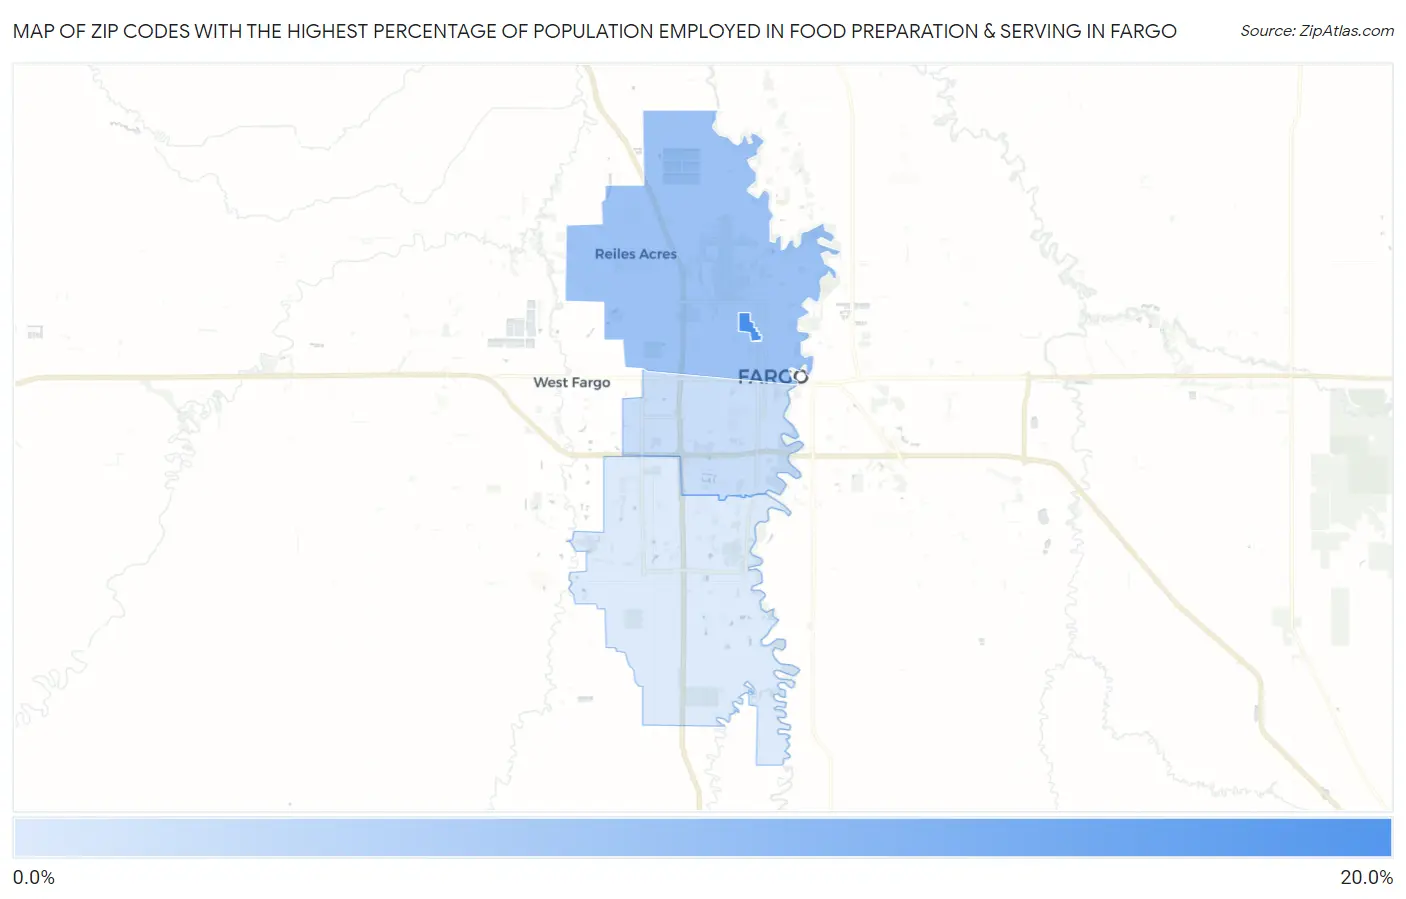
Map of Zip Codes with the Highest Percentage of Population Employed in Food Preparation & Serving in Fargo
4.3%
17.2%
Zip Codes with the Highest Percentage of Population Employed in Food Preparation & Serving in Fargo, ND
| Zip Code | % Employed | vs State | vs National | |
| 1. | 58105 | 17.2% | 5.2%(+11.9)#9 | 5.3%(+11.9)#731 |
| 2. | 58102 | 9.7% | 5.2%(+4.50)#32 | 5.3%(+4.44)#2,859 |
| 3. | 58103 | 6.0% | 5.2%(+0.813)#76 | 5.3%(+0.756)#9,197 |
| 4. | 58104 | 4.3% | 5.2%(-0.944)#128 | 5.3%(-1.00)#15,947 |
1
Common Questions
What are the Top 3 Zip Codes with the Highest Percentage of Population Employed in Food Preparation & Serving in Fargo, ND?
Top 3 Zip Codes with the Highest Percentage of Population Employed in Food Preparation & Serving in Fargo, ND are:
What zip code has the Highest Percentage of Population Employed in Food Preparation & Serving in Fargo, ND?
58105 has the Highest Percentage of Population Employed in Food Preparation & Serving in Fargo, ND with 17.2%.
What is the Percentage of Population Employed in Food Preparation & Serving in Fargo, ND?
Percentage of Population Employed in Food Preparation & Serving in Fargo is 6.6%.
What is the Percentage of Population Employed in Food Preparation & Serving in North Dakota?
Percentage of Population Employed in Food Preparation & Serving in North Dakota is 5.2%.
What is the Percentage of Population Employed in Food Preparation & Serving in the United States?
Percentage of Population Employed in Food Preparation & Serving in the United States is 5.3%.