Kenmare, ND Map & Demographics
Kenmare Map
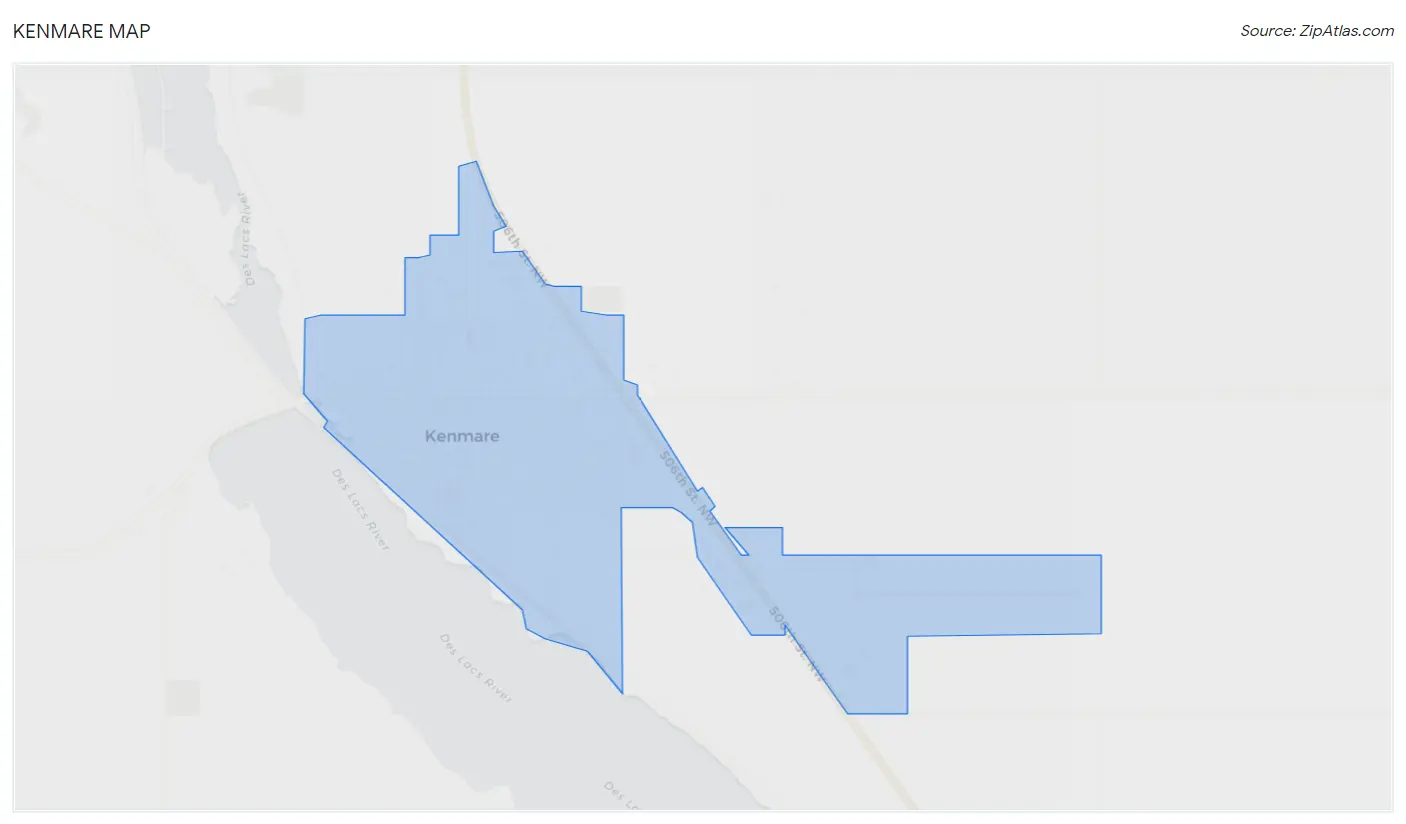
Kenmare Overview
$37,694
PER CAPITA INCOME
$84,417
AVG FAMILY INCOME
$59,063
AVG HOUSEHOLD INCOME
44.6%
WAGE / INCOME GAP [ % ]
55.4¢/ $1
WAGE / INCOME GAP [ $ ]
0.39
INEQUALITY / GINI INDEX
1,016
TOTAL POPULATION
485
MALE POPULATION
531
FEMALE POPULATION
91.34
MALES / 100 FEMALES
109.48
FEMALES / 100 MALES
51.0
MEDIAN AGE
2.6
AVG FAMILY SIZE
1.9
AVG HOUSEHOLD SIZE
540
LABOR FORCE [ PEOPLE ]
62.4%
PERCENT IN LABOR FORCE
2.0%
UNEMPLOYMENT RATE
Kenmare Zip Codes
Kenmare Area Codes
Income in Kenmare
Income Overview in Kenmare
Per Capita Income in Kenmare is $37,694, while median incomes of families and households are $84,417 and $59,063 respectively.
| Characteristic | Number | Measure |
| Per Capita Income | 1,016 | $37,694 |
| Median Family Income | 245 | $84,417 |
| Mean Family Income | 245 | $93,767 |
| Median Household Income | 509 | $59,063 |
| Mean Household Income | 509 | $72,715 |
| Income Deficit | 245 | $0 |
| Wage / Income Gap (%) | 1,016 | 44.63% |
| Wage / Income Gap ($) | 1,016 | 55.37¢ per $1 |
| Gini / Inequality Index | 1,016 | 0.39 |
Earnings by Sex in Kenmare
Average Earnings in Kenmare are $50,489, $56,058 for men and $31,042 for women, a difference of 44.6%.
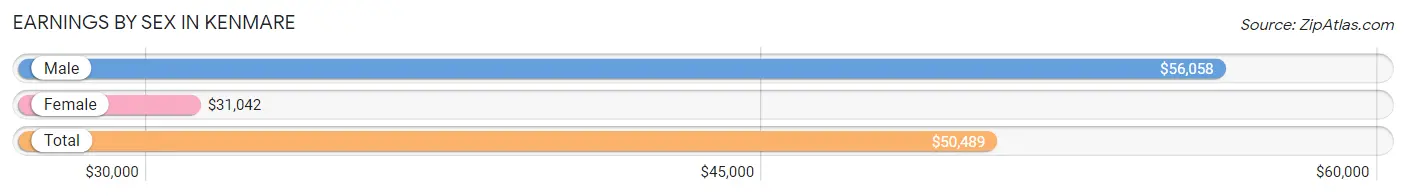
| Sex | Number | Average Earnings |
| Male | 296 (51.5%) | $56,058 |
| Female | 279 (48.5%) | $31,042 |
| Total | 575 (100.0%) | $50,489 |
Earnings by Sex by Income Bracket in Kenmare
The most common earnings brackets in Kenmare are $55,000 to $64,999 for men (58 | 19.6%) and $17,500 to $19,999 for women (40 | 14.3%).
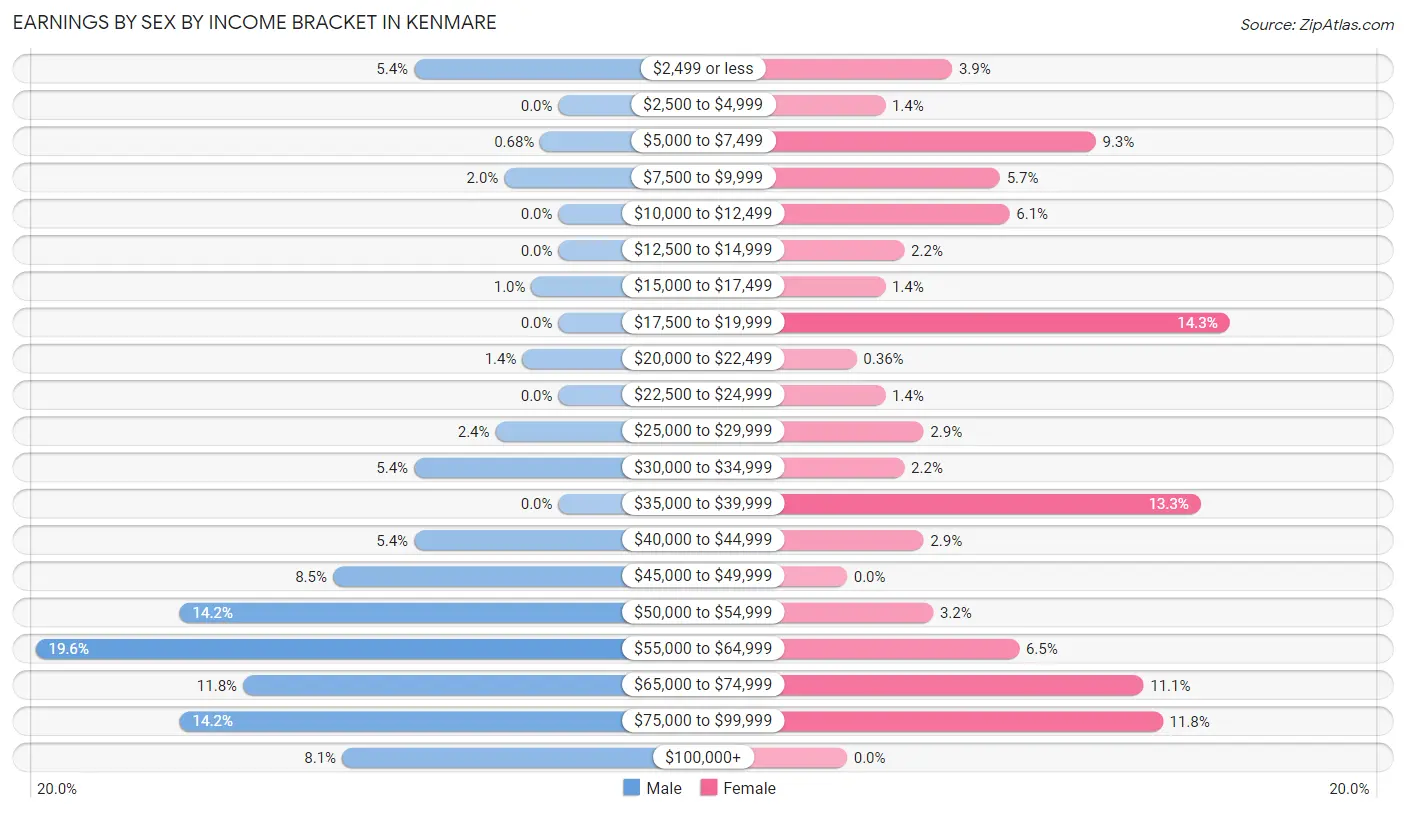
| Income | Male | Female |
| $2,499 or less | 16 (5.4%) | 11 (3.9%) |
| $2,500 to $4,999 | 0 (0.0%) | 4 (1.4%) |
| $5,000 to $7,499 | 2 (0.7%) | 26 (9.3%) |
| $7,500 to $9,999 | 6 (2.0%) | 16 (5.7%) |
| $10,000 to $12,499 | 0 (0.0%) | 17 (6.1%) |
| $12,500 to $14,999 | 0 (0.0%) | 6 (2.1%) |
| $15,000 to $17,499 | 3 (1.0%) | 4 (1.4%) |
| $17,500 to $19,999 | 0 (0.0%) | 40 (14.3%) |
| $20,000 to $22,499 | 4 (1.3%) | 1 (0.4%) |
| $22,500 to $24,999 | 0 (0.0%) | 4 (1.4%) |
| $25,000 to $29,999 | 7 (2.4%) | 8 (2.9%) |
| $30,000 to $34,999 | 16 (5.4%) | 6 (2.1%) |
| $35,000 to $39,999 | 0 (0.0%) | 37 (13.3%) |
| $40,000 to $44,999 | 16 (5.4%) | 8 (2.9%) |
| $45,000 to $49,999 | 25 (8.5%) | 0 (0.0%) |
| $50,000 to $54,999 | 42 (14.2%) | 9 (3.2%) |
| $55,000 to $64,999 | 58 (19.6%) | 18 (6.5%) |
| $65,000 to $74,999 | 35 (11.8%) | 31 (11.1%) |
| $75,000 to $99,999 | 42 (14.2%) | 33 (11.8%) |
| $100,000+ | 24 (8.1%) | 0 (0.0%) |
| Total | 296 (100.0%) | 279 (100.0%) |
Earnings by Sex by Educational Attainment in Kenmare
Average earnings in Kenmare are $56,635 for men and $36,181 for women, a difference of 36.1%. Men with an educational attainment of bachelor's degree enjoy the highest average annual earnings of $69,375, while those with high school diploma education earn the least with $52,829. Women with an educational attainment of bachelor's degree earn the most with the average annual earnings of $66,172, while those with high school diploma education have the smallest earnings of $9,688.
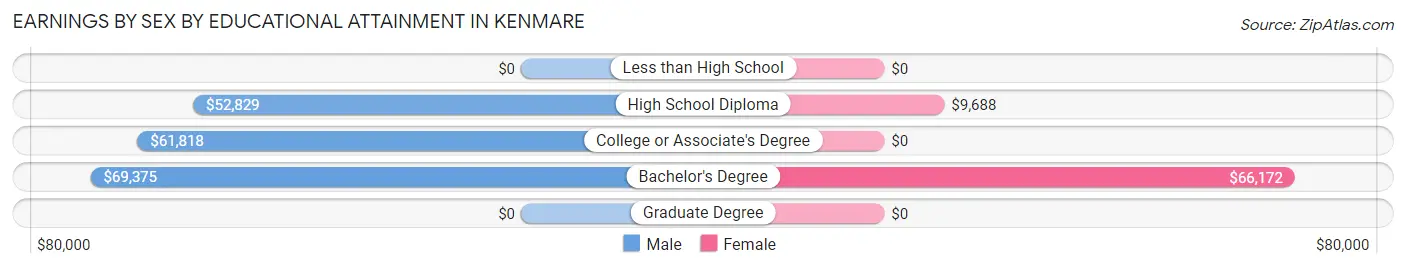
| Educational Attainment | Male Income | Female Income |
| Less than High School | - | - |
| High School Diploma | $52,829 | $9,688 |
| College or Associate's Degree | $61,818 | $0 |
| Bachelor's Degree | $69,375 | $66,172 |
| Graduate Degree | - | - |
| Total | $56,635 | $36,181 |
Family Income in Kenmare
Family Income Brackets in Kenmare
According to the Kenmare family income data, there are 75 families falling into the $100,000 to $149,999 income range, which is the most common income bracket and makes up 30.6% of all families.
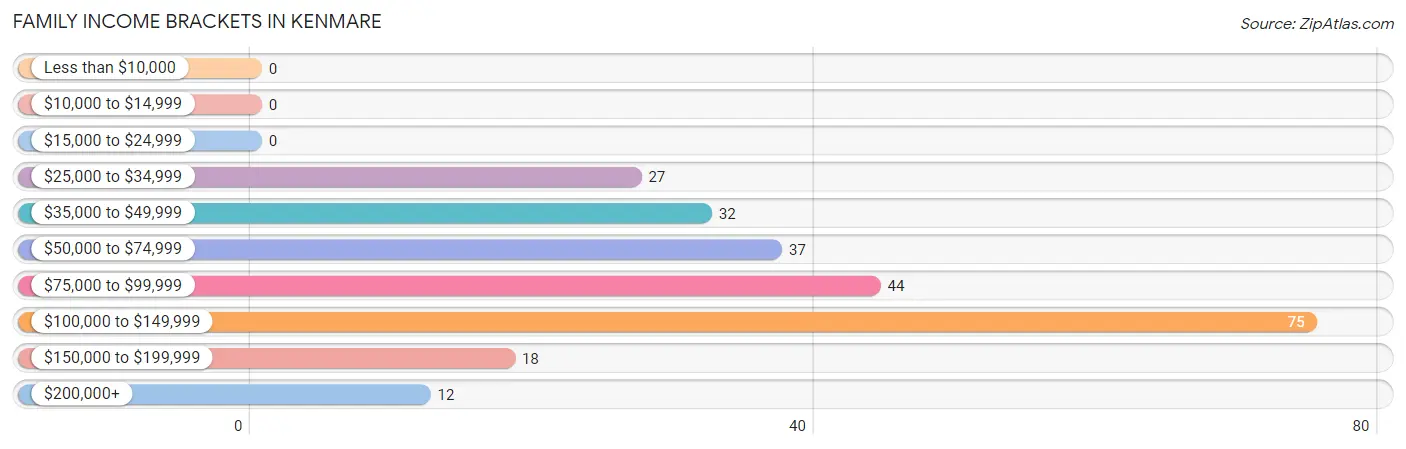
| Income Bracket | # Families | % Families |
| Less than $10,000 | 0 | 0.0% |
| $10,000 to $14,999 | 0 | 0.0% |
| $15,000 to $24,999 | 0 | 0.0% |
| $25,000 to $34,999 | 27 | 11.0% |
| $35,000 to $49,999 | 32 | 13.1% |
| $50,000 to $74,999 | 37 | 15.1% |
| $75,000 to $99,999 | 44 | 18.0% |
| $100,000 to $149,999 | 75 | 30.6% |
| $150,000 to $199,999 | 18 | 7.3% |
| $200,000+ | 12 | 4.9% |
Family Income by Famaliy Size in Kenmare
4-person families (31 | 12.7%) account for the highest median family income in Kenmare with $106,771 per family, while 2-person families (167 | 68.2%) have the highest median income of $41,542 per family member.
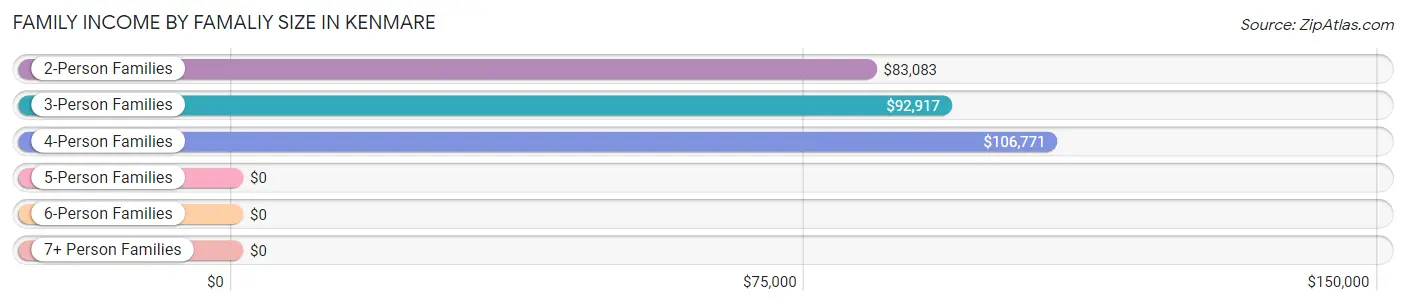
| Income Bracket | # Families | Median Income |
| 2-Person Families | 167 (68.2%) | $83,083 |
| 3-Person Families | 42 (17.1%) | $92,917 |
| 4-Person Families | 31 (12.7%) | $106,771 |
| 5-Person Families | 0 (0.0%) | $0 |
| 6-Person Families | 5 (2.0%) | $0 |
| 7+ Person Families | 0 (0.0%) | $0 |
| Total | 245 (100.0%) | $84,417 |
Family Income by Number of Earners in Kenmare
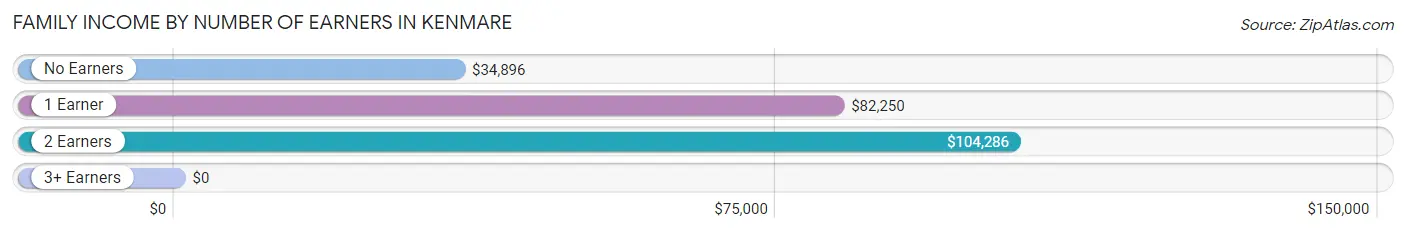
| Number of Earners | # Families | Median Income |
| No Earners | 23 (9.4%) | $34,896 |
| 1 Earner | 94 (38.4%) | $82,250 |
| 2 Earners | 120 (49.0%) | $104,286 |
| 3+ Earners | 8 (3.3%) | $0 |
| Total | 245 (100.0%) | $84,417 |
Household Income in Kenmare
Household Income Brackets in Kenmare
With 160 households falling in the category, the $50,000 to $74,999 income range is the most frequent in Kenmare, accounting for 31.4% of all households. In contrast, only 12 households (2.4%) fall into the $10,000 to $14,999 income bracket, making it the least populous group.
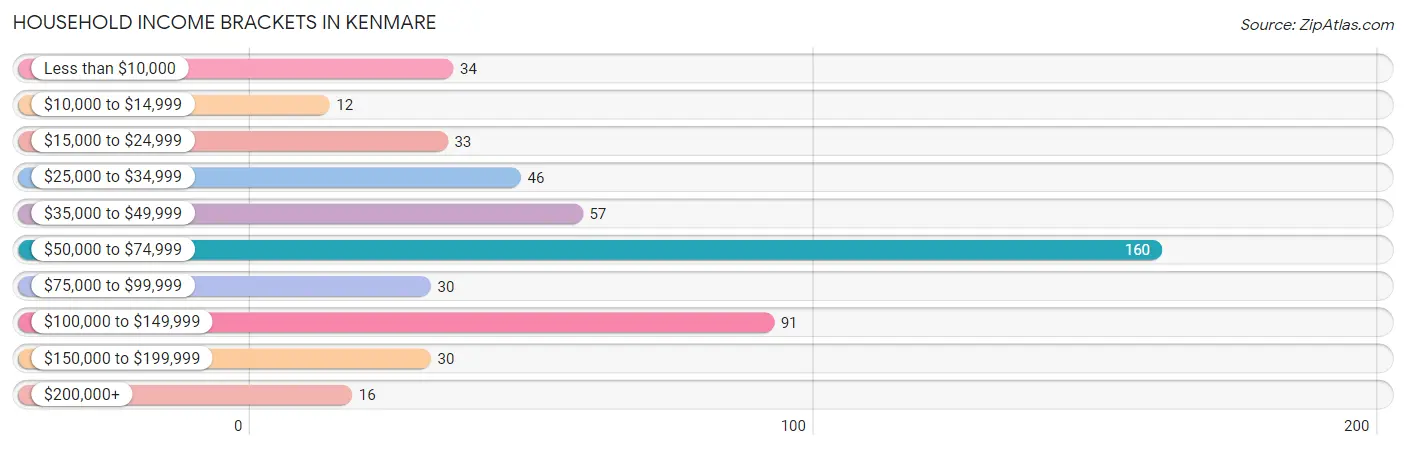
| Income Bracket | # Households | % Households |
| Less than $10,000 | 34 | 6.7% |
| $10,000 to $14,999 | 12 | 2.4% |
| $15,000 to $24,999 | 33 | 6.5% |
| $25,000 to $34,999 | 46 | 9.0% |
| $35,000 to $49,999 | 57 | 11.2% |
| $50,000 to $74,999 | 160 | 31.4% |
| $75,000 to $99,999 | 30 | 5.9% |
| $100,000 to $149,999 | 91 | 17.9% |
| $150,000 to $199,999 | 30 | 5.9% |
| $200,000+ | 16 | 3.1% |
Household Income by Householder Age in Kenmare
The median household income in Kenmare is $59,063, with the highest median household income of $84,500 found in the 45 to 64 years age bracket for the primary householder. A total of 158 households (31.0%) fall into this category. Meanwhile, the 65+ years age bracket for the primary householder has the lowest median household income of $39,000, with 190 households (37.3%) in this group.
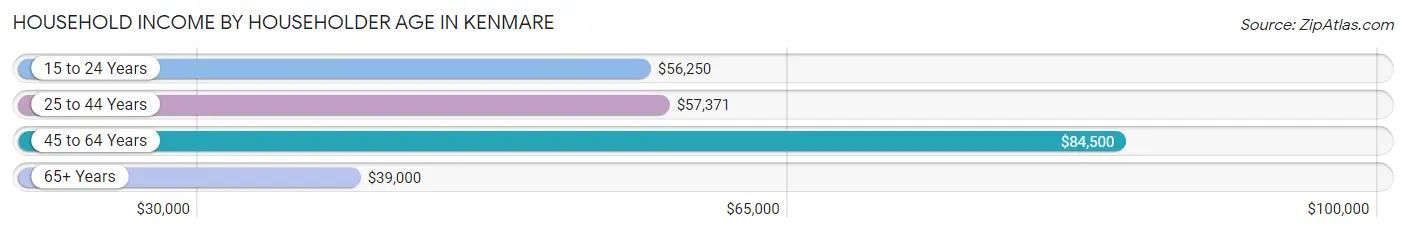
| Income Bracket | # Households | Median Income |
| 15 to 24 Years | 42 (8.3%) | $56,250 |
| 25 to 44 Years | 119 (23.4%) | $57,371 |
| 45 to 64 Years | 158 (31.0%) | $84,500 |
| 65+ Years | 190 (37.3%) | $39,000 |
| Total | 509 (100.0%) | $59,063 |
Poverty in Kenmare
Income Below Poverty by Sex and Age in Kenmare
With 2.8% poverty level for males and 11.9% for females among the residents of Kenmare, 55 to 64 year old males and 75 year old and over females are the most vulnerable to poverty, with 9 males (8.2%) and 36 females (41.4%) in their respective age groups living below the poverty level.
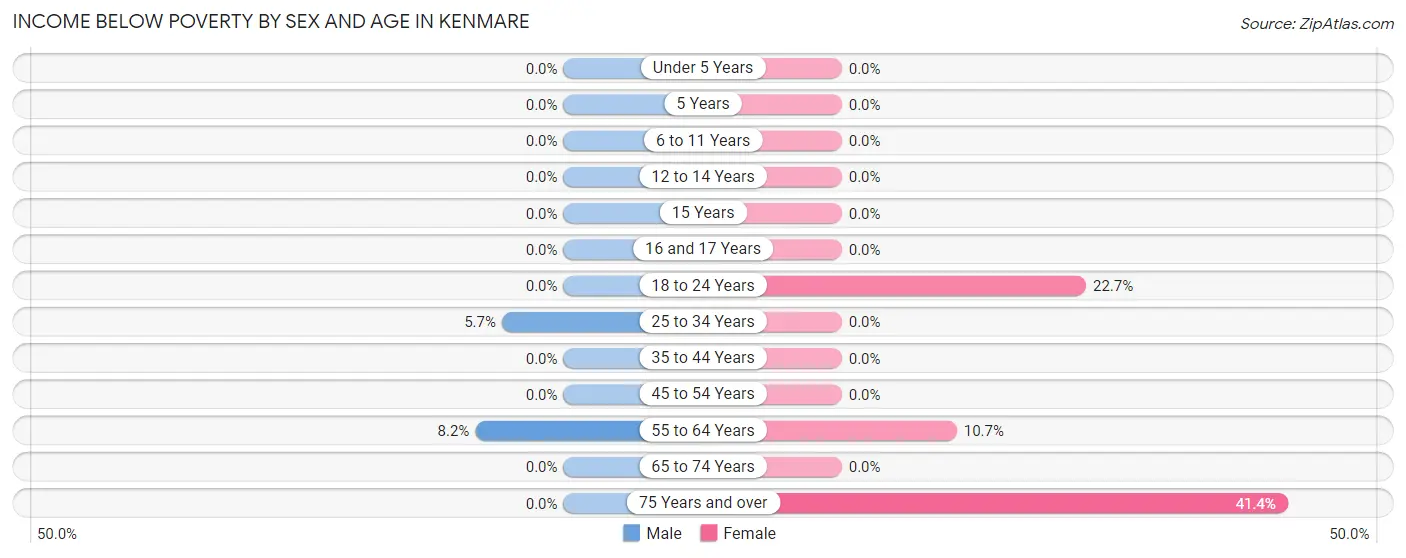
| Age Bracket | Male | Female |
| Under 5 Years | 0 (0.0%) | 0 (0.0%) |
| 5 Years | 0 (0.0%) | 0 (0.0%) |
| 6 to 11 Years | 0 (0.0%) | 0 (0.0%) |
| 12 to 14 Years | 0 (0.0%) | 0 (0.0%) |
| 15 Years | 0 (0.0%) | 0 (0.0%) |
| 16 and 17 Years | 0 (0.0%) | 0 (0.0%) |
| 18 to 24 Years | 0 (0.0%) | 17 (22.7%) |
| 25 to 34 Years | 4 (5.7%) | 0 (0.0%) |
| 35 to 44 Years | 0 (0.0%) | 0 (0.0%) |
| 45 to 54 Years | 0 (0.0%) | 0 (0.0%) |
| 55 to 64 Years | 9 (8.2%) | 8 (10.7%) |
| 65 to 74 Years | 0 (0.0%) | 0 (0.0%) |
| 75 Years and over | 0 (0.0%) | 36 (41.4%) |
| Total | 13 (2.8%) | 61 (11.9%) |
Income Above Poverty by Sex and Age in Kenmare
According to the poverty statistics in Kenmare, males aged under 5 years and females aged under 5 years are the age groups that are most secure financially, with 100.0% of males and 100.0% of females in these age groups living above the poverty line.
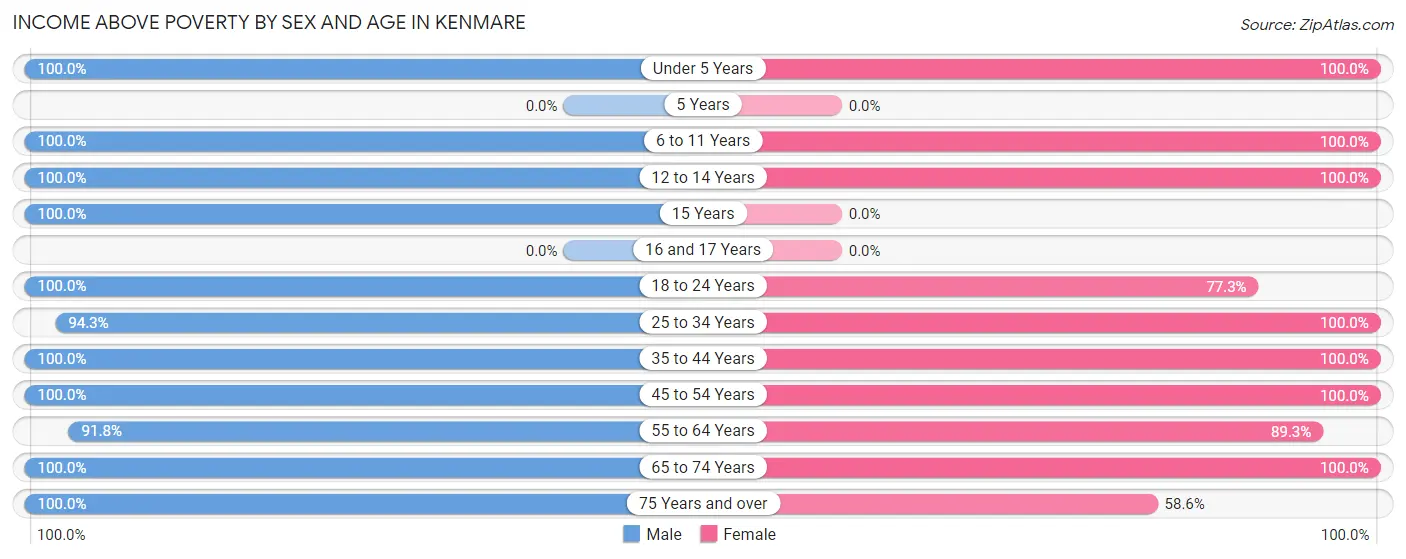
| Age Bracket | Male | Female |
| Under 5 Years | 22 (100.0%) | 24 (100.0%) |
| 5 Years | 0 (0.0%) | 0 (0.0%) |
| 6 to 11 Years | 31 (100.0%) | 17 (100.0%) |
| 12 to 14 Years | 29 (100.0%) | 14 (100.0%) |
| 15 Years | 13 (100.0%) | 0 (0.0%) |
| 16 and 17 Years | 0 (0.0%) | 0 (0.0%) |
| 18 to 24 Years | 28 (100.0%) | 58 (77.3%) |
| 25 to 34 Years | 66 (94.3%) | 27 (100.0%) |
| 35 to 44 Years | 28 (100.0%) | 41 (100.0%) |
| 45 to 54 Years | 56 (100.0%) | 68 (100.0%) |
| 55 to 64 Years | 101 (91.8%) | 67 (89.3%) |
| 65 to 74 Years | 34 (100.0%) | 85 (100.0%) |
| 75 Years and over | 50 (100.0%) | 51 (58.6%) |
| Total | 458 (97.2%) | 452 (88.1%) |
Income Below Poverty Among Married-Couple Families in Kenmare
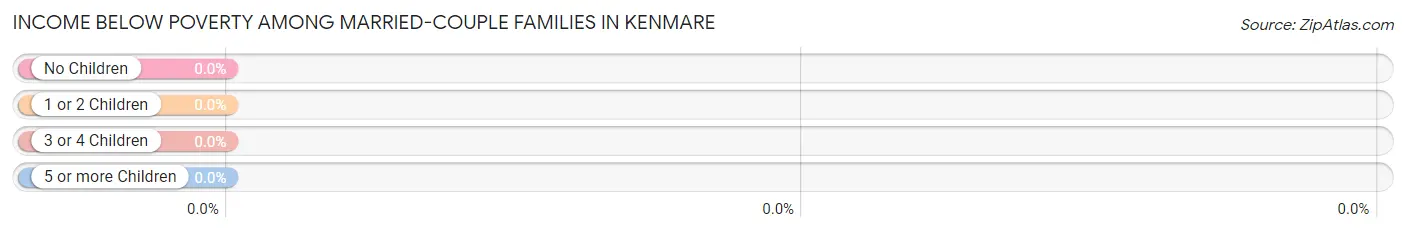
| Children | Above Poverty | Below Poverty |
| No Children | 119 (100.0%) | 0 (0.0%) |
| 1 or 2 Children | 29 (100.0%) | 0 (0.0%) |
| 3 or 4 Children | 5 (100.0%) | 0 (0.0%) |
| 5 or more Children | 0 (0.0%) | 0 (0.0%) |
| Total | 153 (100.0%) | 0 (0.0%) |
Income Below Poverty Among Single-Parent Households in Kenmare
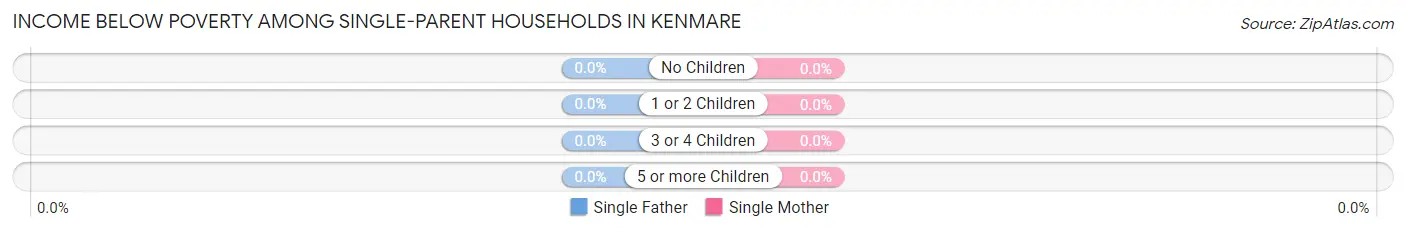
| Children | Single Father | Single Mother |
| No Children | 0 (0.0%) | 0 (0.0%) |
| 1 or 2 Children | 0 (0.0%) | 0 (0.0%) |
| 3 or 4 Children | 0 (0.0%) | 0 (0.0%) |
| 5 or more Children | 0 (0.0%) | 0 (0.0%) |
| Total | 0 (0.0%) | 0 (0.0%) |
Income Below Poverty Among Married-Couple vs Single-Parent Households in Kenmare
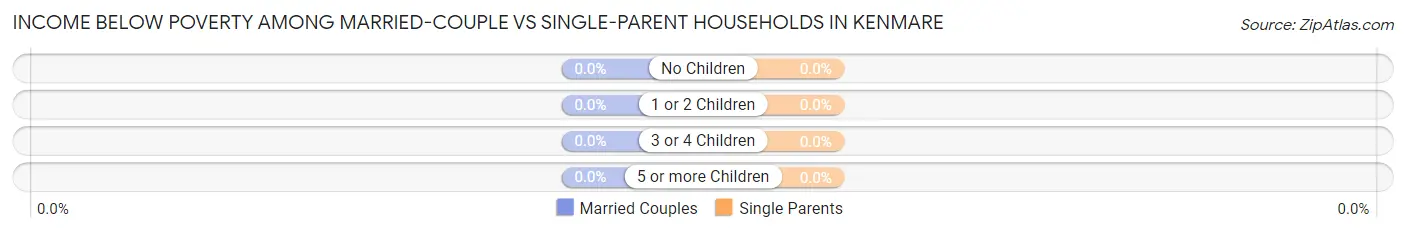
| Children | Married-Couple Families | Single-Parent Households |
| No Children | 0 (0.0%) | 0 (0.0%) |
| 1 or 2 Children | 0 (0.0%) | 0 (0.0%) |
| 3 or 4 Children | 0 (0.0%) | 0 (0.0%) |
| 5 or more Children | 0 (0.0%) | 0 (0.0%) |
| Total | 0 (0.0%) | 0 (0.0%) |
Race in Kenmare
The most populous races in Kenmare are White / Caucasian (973 | 95.8%), Two or more Races (28 | 2.8%), and Hispanic or Latino (25 | 2.5%).
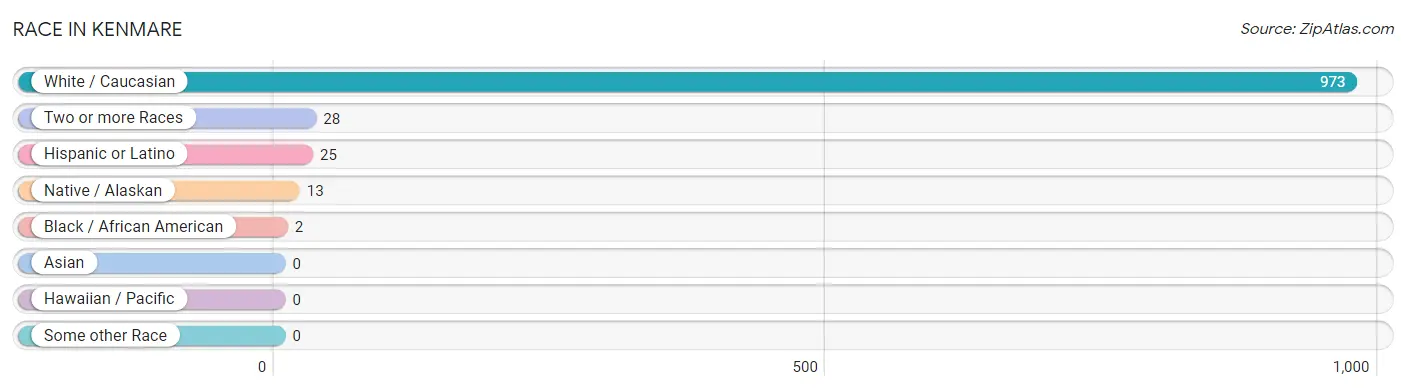
| Race | # Population | % Population |
| Asian | 0 | 0.0% |
| Black / African American | 2 | 0.2% |
| Hawaiian / Pacific | 0 | 0.0% |
| Hispanic or Latino | 25 | 2.5% |
| Native / Alaskan | 13 | 1.3% |
| White / Caucasian | 973 | 95.8% |
| Two or more Races | 28 | 2.8% |
| Some other Race | 0 | 0.0% |
| Total | 1,016 | 100.0% |
Ancestry in Kenmare
The most populous ancestries reported in Kenmare are German (484 | 47.6%), Norwegian (328 | 32.3%), English (109 | 10.7%), Swedish (93 | 9.1%), and Danish (45 | 4.4%), together accounting for 104.2% of all Kenmare residents.
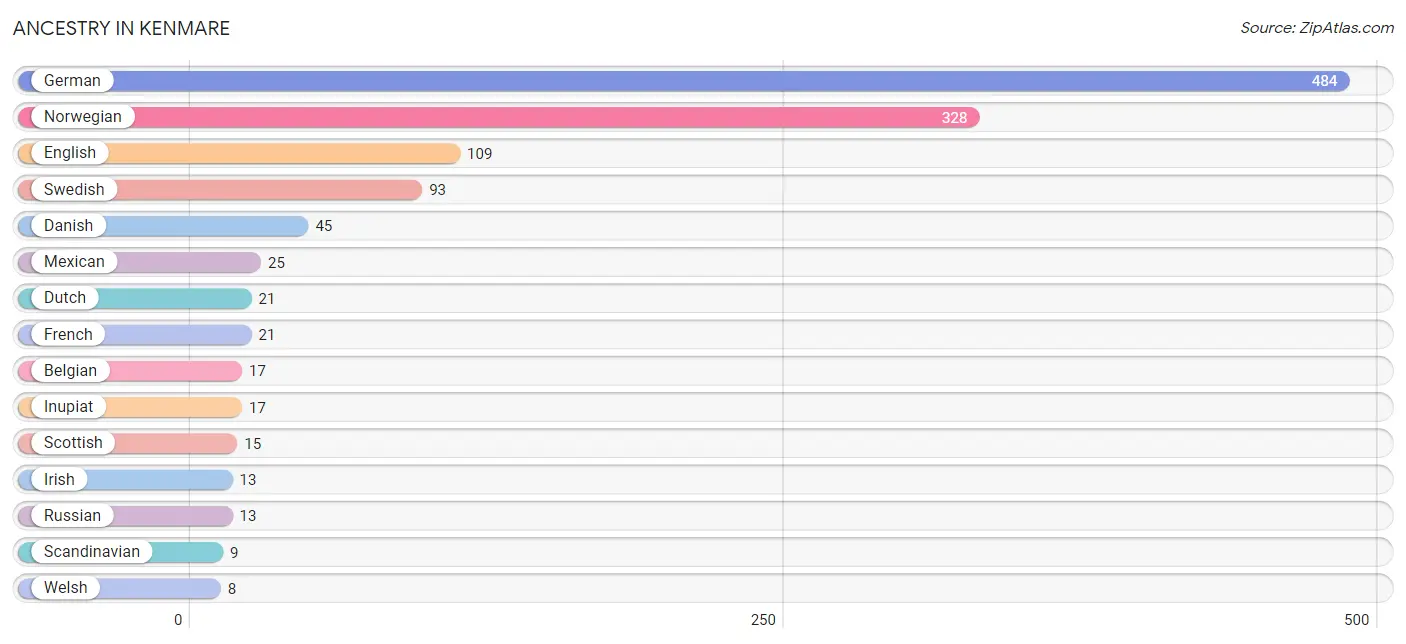
| Ancestry | # Population | % Population |
| American | 4 | 0.4% |
| Belgian | 17 | 1.7% |
| Czech | 2 | 0.2% |
| Danish | 45 | 4.4% |
| Dutch | 21 | 2.1% |
| English | 109 | 10.7% |
| Finnish | 4 | 0.4% |
| French | 21 | 2.1% |
| German | 484 | 47.6% |
| Hungarian | 1 | 0.1% |
| Inupiat | 17 | 1.7% |
| Irish | 13 | 1.3% |
| Liberian | 2 | 0.2% |
| Mexican | 25 | 2.5% |
| Norwegian | 328 | 32.3% |
| Russian | 13 | 1.3% |
| Scandinavian | 9 | 0.9% |
| Scottish | 15 | 1.5% |
| Sioux | 5 | 0.5% |
| Subsaharan African | 2 | 0.2% |
| Swedish | 93 | 9.1% |
| Ukrainian | 4 | 0.4% |
| Welsh | 8 | 0.8% | View All 23 Rows |
Immigrants in Kenmare
The most numerous immigrant groups reported in Kenmare came from Canada (11 | 1.1%), Africa (2 | 0.2%), Liberia (2 | 0.2%), and Western Africa (2 | 0.2%), together accounting for 1.7% of all Kenmare residents.
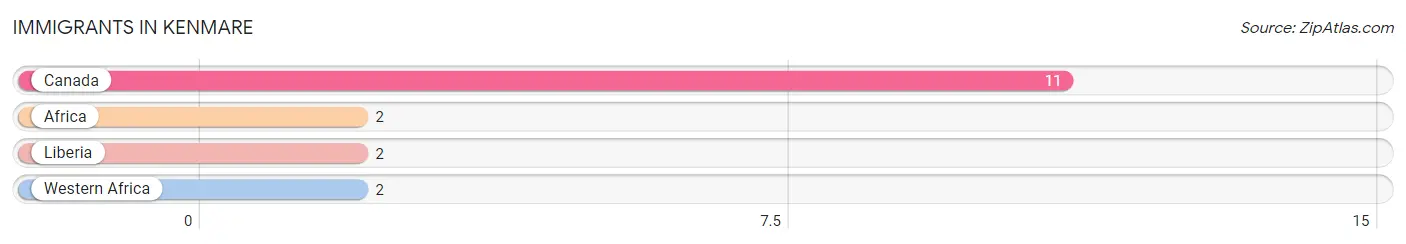
| Immigration Origin | # Population | % Population |
| Africa | 2 | 0.2% |
| Canada | 11 | 1.1% |
| Liberia | 2 | 0.2% |
| Western Africa | 2 | 0.2% | View All 4 Rows |
Sex and Age in Kenmare
Sex and Age in Kenmare
The most populous age groups in Kenmare are 60 to 64 Years (71 | 14.6%) for men and 20 to 24 Years (64 | 12.0%) for women.
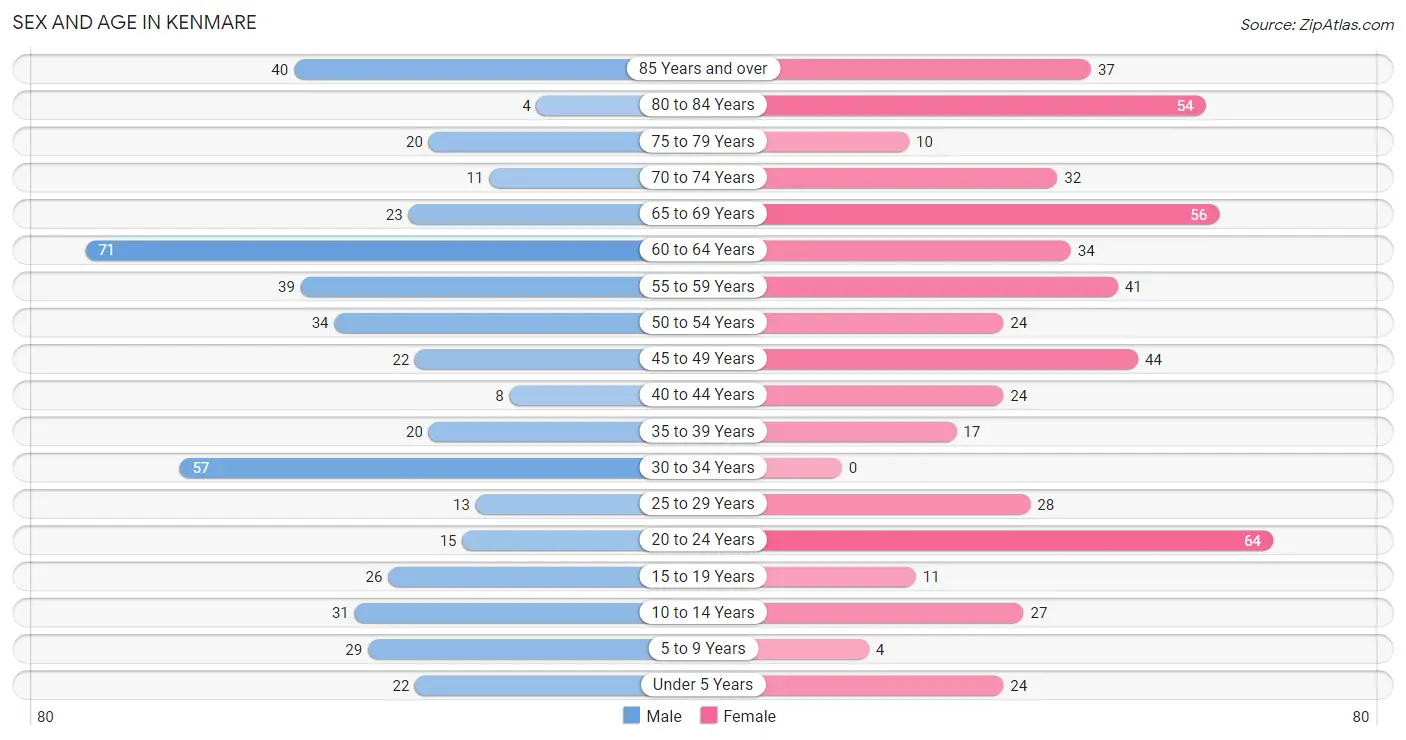
| Age Bracket | Male | Female |
| Under 5 Years | 22 (4.5%) | 24 (4.5%) |
| 5 to 9 Years | 29 (6.0%) | 4 (0.7%) |
| 10 to 14 Years | 31 (6.4%) | 27 (5.1%) |
| 15 to 19 Years | 26 (5.4%) | 11 (2.1%) |
| 20 to 24 Years | 15 (3.1%) | 64 (12.0%) |
| 25 to 29 Years | 13 (2.7%) | 28 (5.3%) |
| 30 to 34 Years | 57 (11.7%) | 0 (0.0%) |
| 35 to 39 Years | 20 (4.1%) | 17 (3.2%) |
| 40 to 44 Years | 8 (1.7%) | 24 (4.5%) |
| 45 to 49 Years | 22 (4.5%) | 44 (8.3%) |
| 50 to 54 Years | 34 (7.0%) | 24 (4.5%) |
| 55 to 59 Years | 39 (8.0%) | 41 (7.7%) |
| 60 to 64 Years | 71 (14.6%) | 34 (6.4%) |
| 65 to 69 Years | 23 (4.7%) | 56 (10.5%) |
| 70 to 74 Years | 11 (2.3%) | 32 (6.0%) |
| 75 to 79 Years | 20 (4.1%) | 10 (1.9%) |
| 80 to 84 Years | 4 (0.8%) | 54 (10.2%) |
| 85 Years and over | 40 (8.3%) | 37 (7.0%) |
| Total | 485 (100.0%) | 531 (100.0%) |
Families and Households in Kenmare
Median Family Size in Kenmare
The median family size in Kenmare is 2.56 persons per family, with single female/mother families (84 | 34.3%) accounting for the largest median family size of 2.61 persons per family. On the other hand, single male/father families (8 | 3.3%) represent the smallest median family size with 2.13 persons per family.
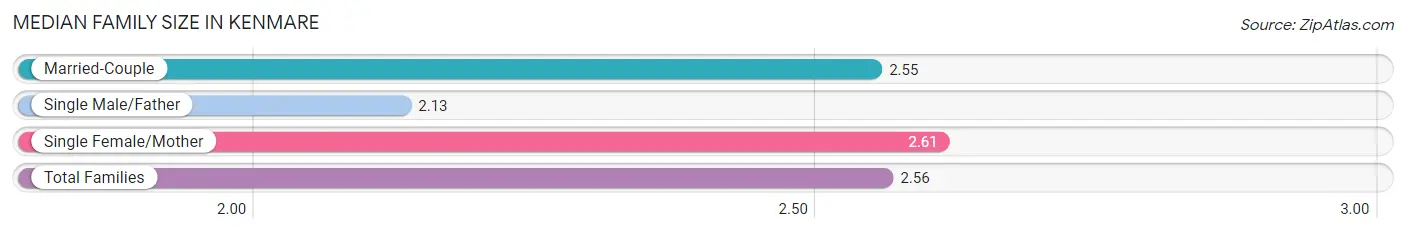
| Family Type | # Families | Family Size |
| Married-Couple | 153 (62.5%) | 2.55 |
| Single Male/Father | 8 (3.3%) | 2.13 |
| Single Female/Mother | 84 (34.3%) | 2.61 |
| Total Families | 245 (100.0%) | 2.56 |
Median Household Size in Kenmare
The median household size in Kenmare is 1.92 persons per household, with single female/mother households (84 | 16.5%) accounting for the largest median household size of 2.89 persons per household. non-family households (264 | 51.9%) represent the smallest median household size with 1.20 persons per household.
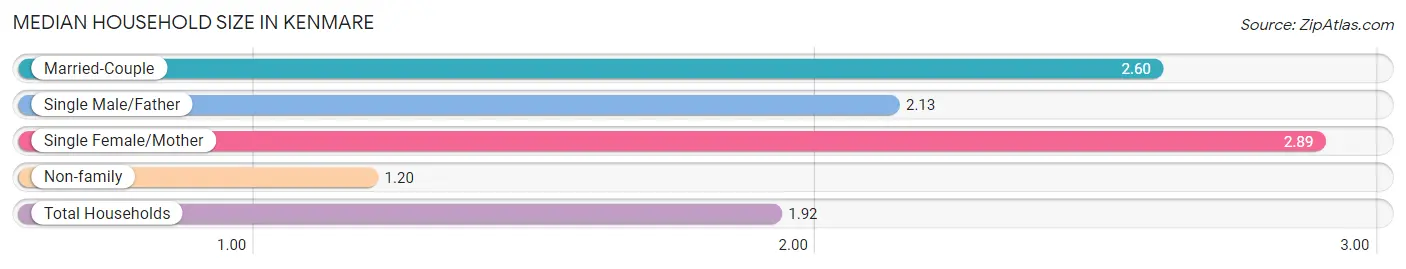
| Household Type | # Households | Household Size |
| Married-Couple | 153 (30.1%) | 2.60 |
| Single Male/Father | 8 (1.6%) | 2.13 |
| Single Female/Mother | 84 (16.5%) | 2.89 |
| Non-family | 264 (51.9%) | 1.20 |
| Total Households | 509 (100.0%) | 1.92 |
Household Size by Marriage Status in Kenmare
Out of a total of 509 households in Kenmare, 245 (48.1%) are family households, while 264 (51.9%) are nonfamily households. The most numerous type of family households are 2-person households, comprising 153, and the most common type of nonfamily households are 1-person households, comprising 211.
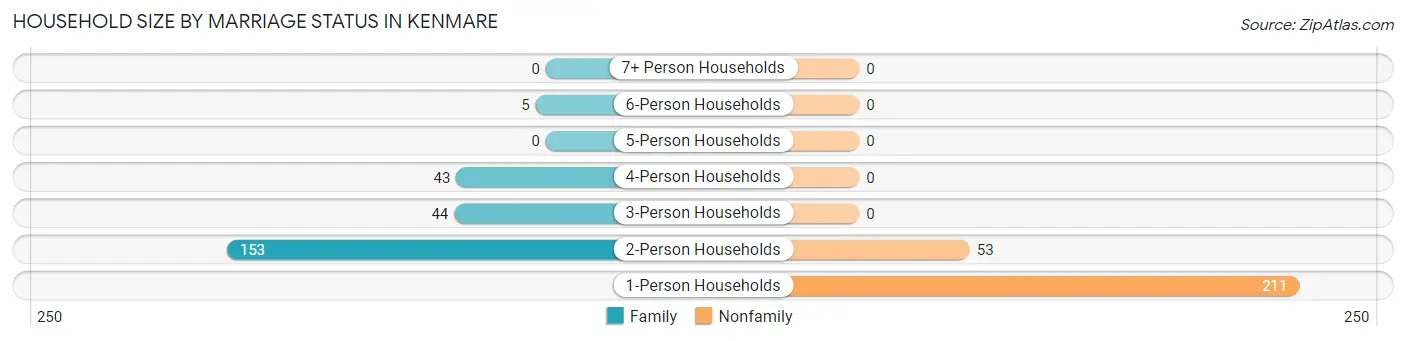
| Household Size | Family Households | Nonfamily Households |
| 1-Person Households | - | 211 (41.4%) |
| 2-Person Households | 153 (30.1%) | 53 (10.4%) |
| 3-Person Households | 44 (8.6%) | 0 (0.0%) |
| 4-Person Households | 43 (8.5%) | 0 (0.0%) |
| 5-Person Households | 0 (0.0%) | 0 (0.0%) |
| 6-Person Households | 5 (1.0%) | 0 (0.0%) |
| 7+ Person Households | 0 (0.0%) | 0 (0.0%) |
| Total | 245 (48.1%) | 264 (51.9%) |
Female Fertility in Kenmare
Fertility by Age in Kenmare
Average fertility rate in Kenmare is 20.0 births per 1,000 women. Women in the age bracket of 20 to 34 years have the highest fertility rate with 22.0 births per 1,000 women. Women in the age bracket of 20 to 34 years acount for 50.0% of all women with births.
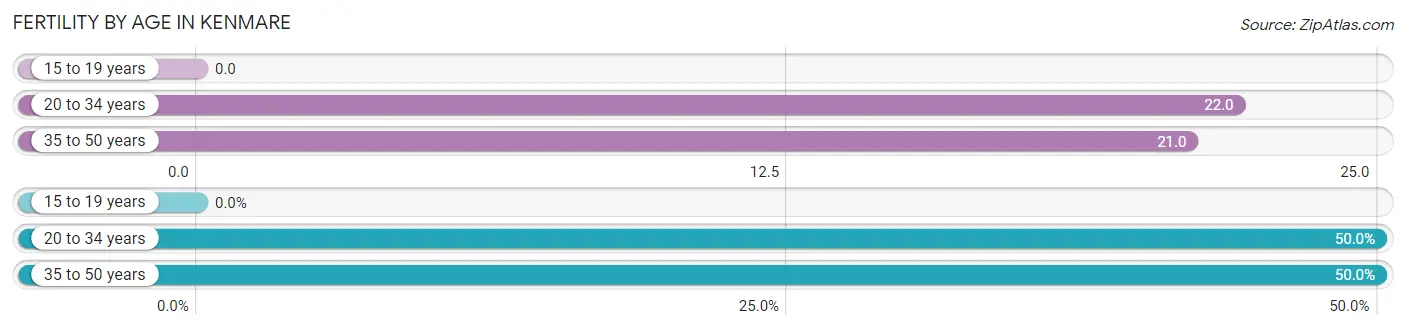
| Age Bracket | Women with Births | Births / 1,000 Women |
| 15 to 19 years | 0 (0.0%) | 0.0 |
| 20 to 34 years | 2 (50.0%) | 22.0 |
| 35 to 50 years | 2 (50.0%) | 21.0 |
| Total | 4 (100.0%) | 20.0 |
Fertility by Age by Marriage Status in Kenmare
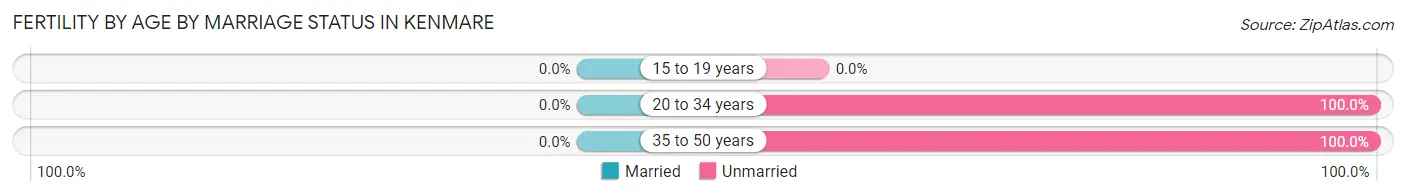
| Age Bracket | Married | Unmarried |
| 15 to 19 years | 0 (0.0%) | 0 (0.0%) |
| 20 to 34 years | 0 (0.0%) | 2 (100.0%) |
| 35 to 50 years | 0 (0.0%) | 2 (100.0%) |
| Total | 0 (0.0%) | 4 (100.0%) |
Fertility by Education in Kenmare
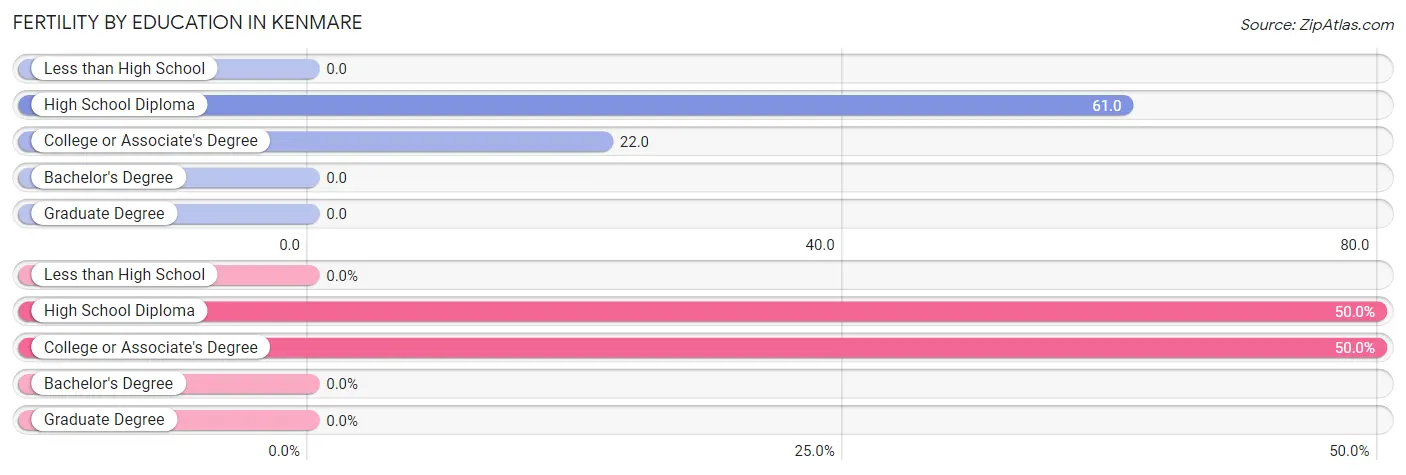
| Educational Attainment | Women with Births | Births / 1,000 Women |
| Less than High School | 0 (0.0%) | 0.0 |
| High School Diploma | 2 (50.0%) | 61.0 |
| College or Associate's Degree | 2 (50.0%) | 22.0 |
| Bachelor's Degree | 0 (0.0%) | 0.0 |
| Graduate Degree | 0 (0.0%) | 0.0 |
| Total | 4 (100.0%) | 20.0 |
Fertility by Education by Marriage Status in Kenmare
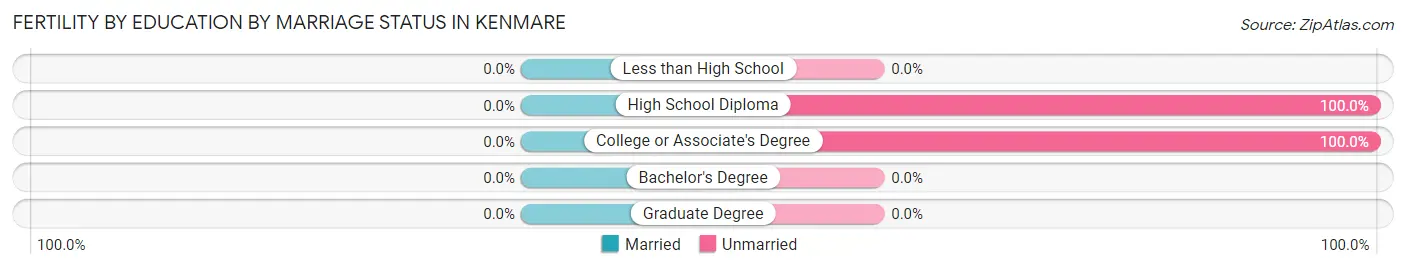
| Educational Attainment | Married | Unmarried |
| Less than High School | 0 (0.0%) | 0 (0.0%) |
| High School Diploma | 0 (0.0%) | 2 (100.0%) |
| College or Associate's Degree | 0 (0.0%) | 2 (100.0%) |
| Bachelor's Degree | 0 (0.0%) | 0 (0.0%) |
| Graduate Degree | 0 (0.0%) | 0 (0.0%) |
| Total | 0 (0.0%) | 4 (100.0%) |
Employment Characteristics in Kenmare
Employment by Class of Employer in Kenmare
Among the 492 employed individuals in Kenmare, private company employees (301 | 61.2%), local government employees (66 | 13.4%), and not-for-profit organizations (47 | 9.6%) make up the most common classes of employment.
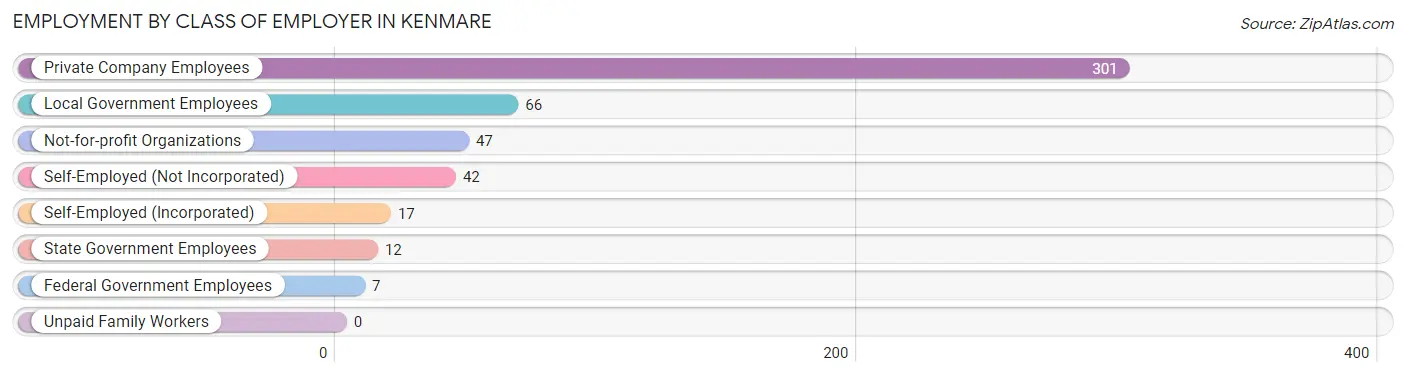
| Employer Class | # Employees | % Employees |
| Private Company Employees | 301 | 61.2% |
| Self-Employed (Incorporated) | 17 | 3.5% |
| Self-Employed (Not Incorporated) | 42 | 8.5% |
| Not-for-profit Organizations | 47 | 9.6% |
| Local Government Employees | 66 | 13.4% |
| State Government Employees | 12 | 2.4% |
| Federal Government Employees | 7 | 1.4% |
| Unpaid Family Workers | 0 | 0.0% |
| Total | 492 | 100.0% |
Employment Status by Age in Kenmare
According to the labor force statistics for Kenmare, out of the total population over 16 years of age (866), 62.4% or 540 individuals are in the labor force, with 2.0% or 11 of them unemployed. The age group with the highest labor force participation rate is 16 to 19 years, with 100.0% or 24 individuals in the labor force. Within the labor force, the 20 to 24 years age range has the highest percentage of unemployed individuals, with 22.0% or 11 of them being unemployed.
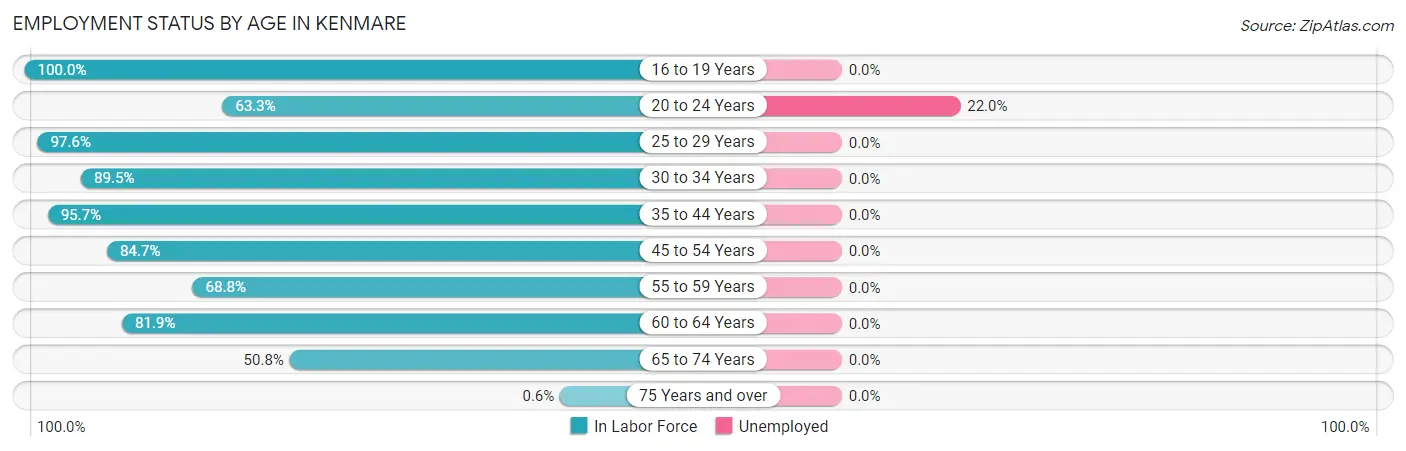
| Age Bracket | In Labor Force | Unemployed |
| 16 to 19 Years | 24 (100.0%) | 0 (0.0%) |
| 20 to 24 Years | 50 (63.3%) | 11 (22.0%) |
| 25 to 29 Years | 40 (97.6%) | 0 (0.0%) |
| 30 to 34 Years | 51 (89.5%) | 0 (0.0%) |
| 35 to 44 Years | 66 (95.7%) | 0 (0.0%) |
| 45 to 54 Years | 105 (84.7%) | 0 (0.0%) |
| 55 to 59 Years | 55 (68.8%) | 0 (0.0%) |
| 60 to 64 Years | 86 (81.9%) | 0 (0.0%) |
| 65 to 74 Years | 62 (50.8%) | 0 (0.0%) |
| 75 Years and over | 1 (0.6%) | 0 (0.0%) |
| Total | 540 (62.4%) | 11 (2.0%) |
Employment Status by Educational Attainment in Kenmare
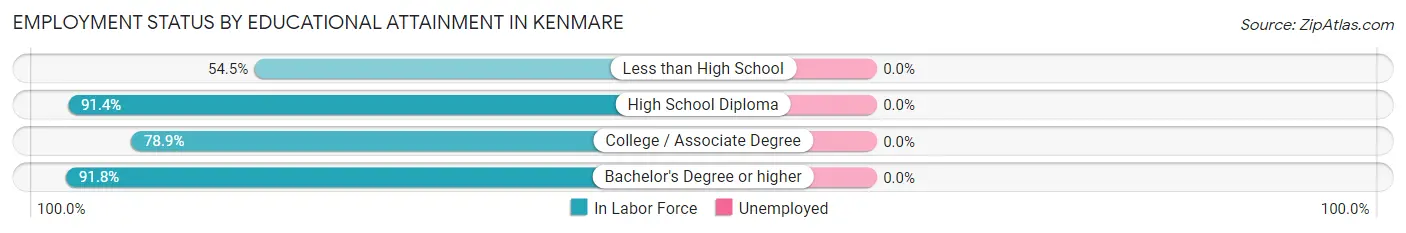
| Educational Attainment | In Labor Force | Unemployed |
| Less than High School | 12 (54.5%) | 0 (0.0%) |
| High School Diploma | 149 (91.4%) | 0 (0.0%) |
| College / Associate Degree | 153 (78.9%) | 0 (0.0%) |
| Bachelor's Degree or higher | 89 (91.8%) | 0 (0.0%) |
| Total | 403 (84.7%) | 0 (0.0%) |
Employment Occupations by Sex in Kenmare
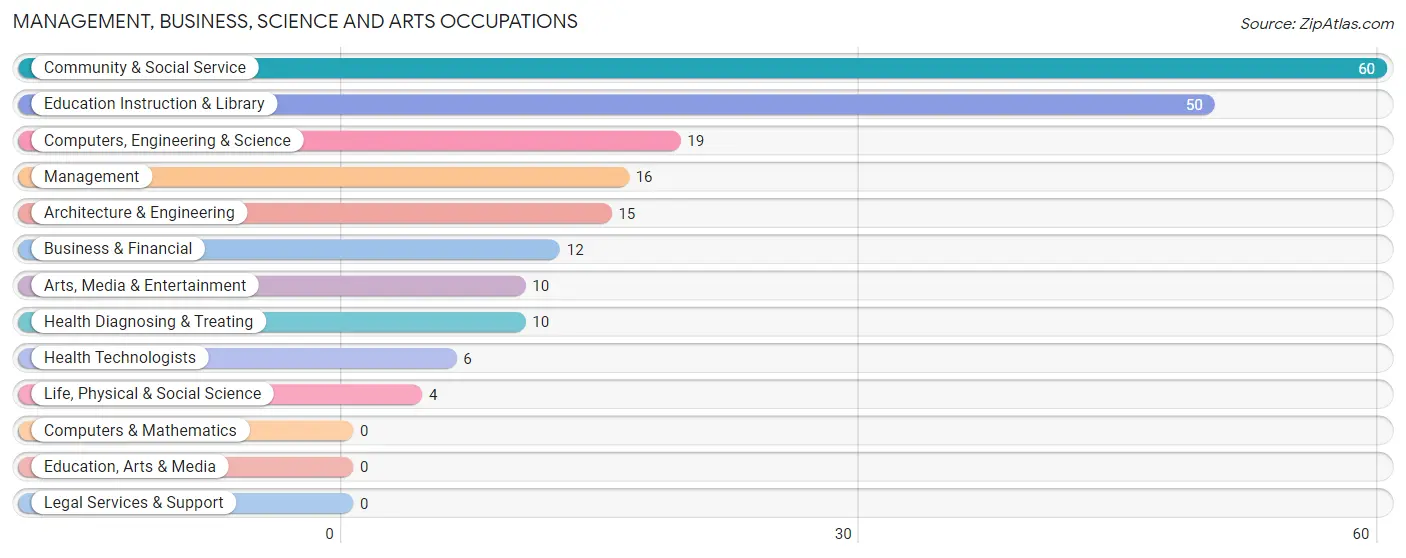
Management, Business, Science and Arts Occupations
The most common Management, Business, Science and Arts occupations in Kenmare are Community & Social Service (60 | 11.3%), Education Instruction & Library (50 | 9.5%), Computers, Engineering & Science (19 | 3.6%), Management (16 | 3.0%), and Architecture & Engineering (15 | 2.8%).
Management, Business, Science and Arts Occupations by Sex
Within the Management, Business, Science and Arts occupations in Kenmare, the most male-oriented occupations are Life, Physical & Social Science (100.0%), Business & Financial (75.0%), and Management (43.8%), while the most female-oriented occupations are Arts, Media & Entertainment (100.0%), Health Diagnosing & Treating (100.0%), and Health Technologists (100.0%).
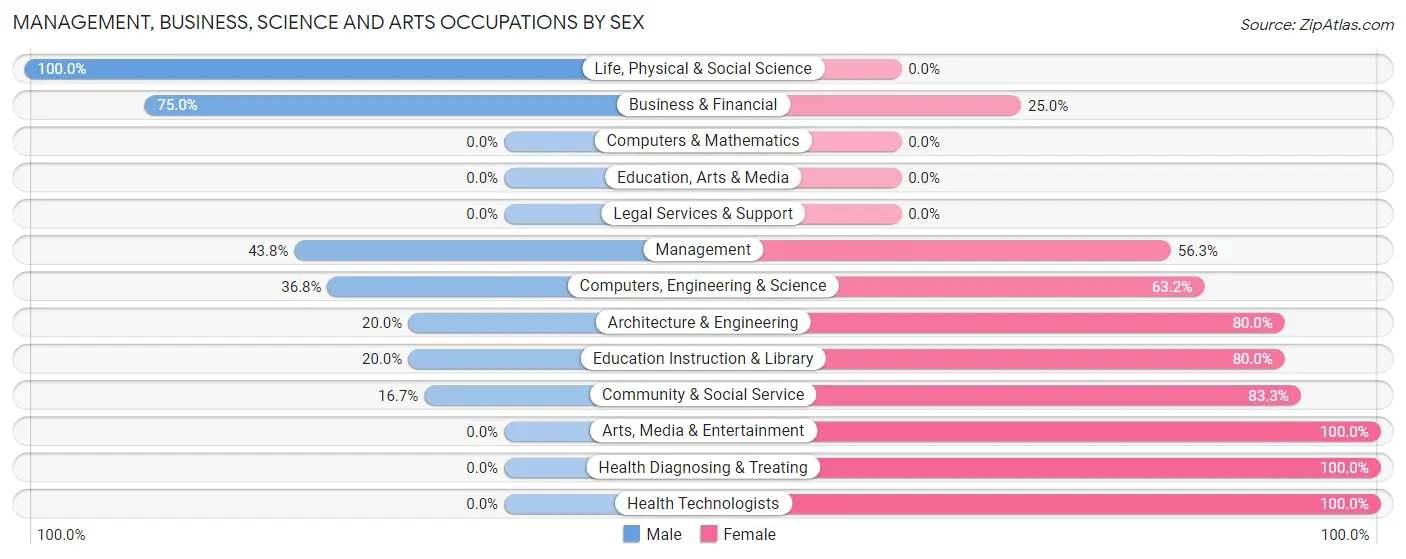
| Occupation | Male | Female |
| Management | 7 (43.8%) | 9 (56.2%) |
| Business & Financial | 9 (75.0%) | 3 (25.0%) |
| Computers, Engineering & Science | 7 (36.8%) | 12 (63.2%) |
| Computers & Mathematics | 0 (0.0%) | 0 (0.0%) |
| Architecture & Engineering | 3 (20.0%) | 12 (80.0%) |
| Life, Physical & Social Science | 4 (100.0%) | 0 (0.0%) |
| Community & Social Service | 10 (16.7%) | 50 (83.3%) |
| Education, Arts & Media | 0 (0.0%) | 0 (0.0%) |
| Legal Services & Support | 0 (0.0%) | 0 (0.0%) |
| Education Instruction & Library | 10 (20.0%) | 40 (80.0%) |
| Arts, Media & Entertainment | 0 (0.0%) | 10 (100.0%) |
| Health Diagnosing & Treating | 0 (0.0%) | 10 (100.0%) |
| Health Technologists | 0 (0.0%) | 6 (100.0%) |
| Total (Category) | 33 (28.2%) | 84 (71.8%) |
| Total (Overall) | 266 (50.3%) | 263 (49.7%) |
Services Occupations
The most common Services occupations in Kenmare are Food Preparation & Serving (55 | 10.4%), Cleaning & Maintenance (39 | 7.4%), Healthcare Support (17 | 3.2%), Personal Care & Service (12 | 2.3%), and Security & Protection (8 | 1.5%).

Services Occupations by Sex
Within the Services occupations in Kenmare, the most male-oriented occupations are Security & Protection (100.0%), Law Enforcement (100.0%), and Cleaning & Maintenance (79.5%), while the most female-oriented occupations are Healthcare Support (100.0%), Food Preparation & Serving (100.0%), and Personal Care & Service (100.0%).
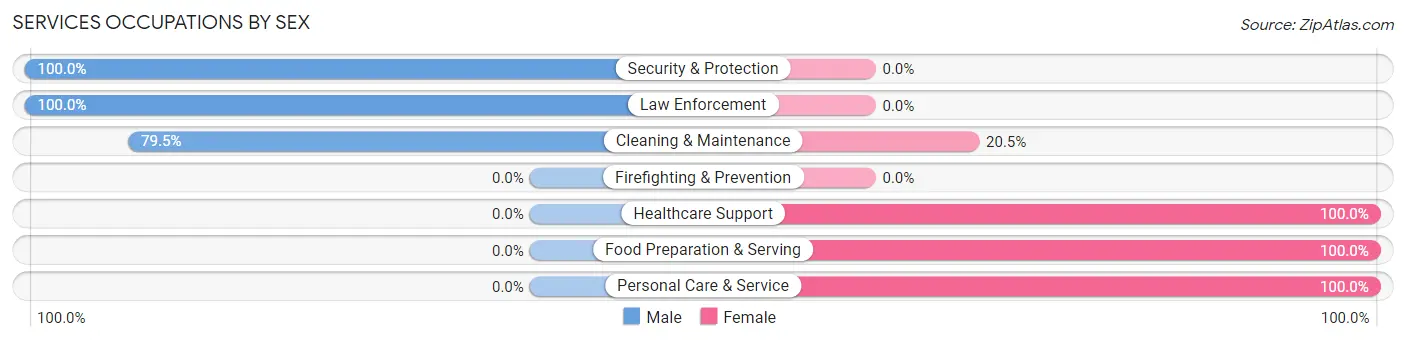
| Occupation | Male | Female |
| Healthcare Support | 0 (0.0%) | 17 (100.0%) |
| Security & Protection | 8 (100.0%) | 0 (0.0%) |
| Firefighting & Prevention | 0 (0.0%) | 0 (0.0%) |
| Law Enforcement | 8 (100.0%) | 0 (0.0%) |
| Food Preparation & Serving | 0 (0.0%) | 55 (100.0%) |
| Cleaning & Maintenance | 31 (79.5%) | 8 (20.5%) |
| Personal Care & Service | 0 (0.0%) | 12 (100.0%) |
| Total (Category) | 39 (29.8%) | 92 (70.2%) |
| Total (Overall) | 266 (50.3%) | 263 (49.7%) |
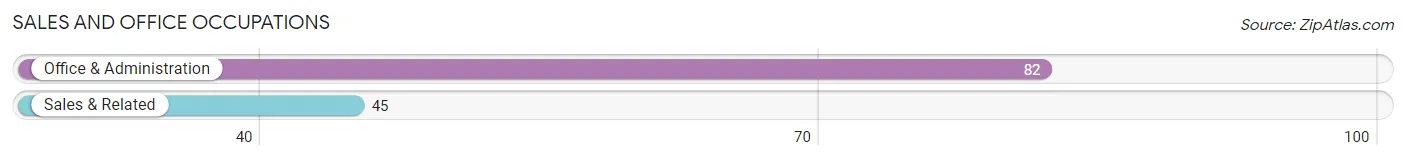
Sales and Office Occupations
The most common Sales and Office occupations in Kenmare are Office & Administration (82 | 15.5%), and Sales & Related (45 | 8.5%).
Sales and Office Occupations by Sex
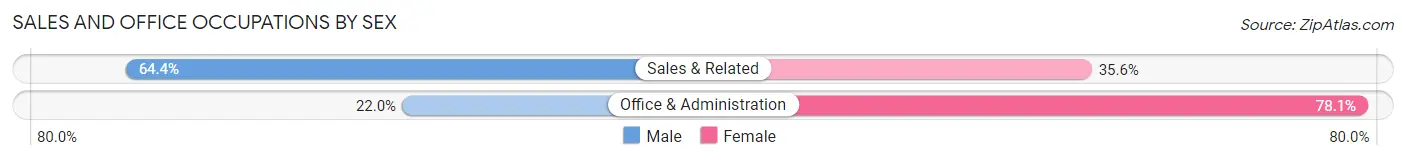
| Occupation | Male | Female |
| Sales & Related | 29 (64.4%) | 16 (35.6%) |
| Office & Administration | 18 (22.0%) | 64 (78.0%) |
| Total (Category) | 47 (37.0%) | 80 (63.0%) |
| Total (Overall) | 266 (50.3%) | 263 (49.7%) |
Natural Resources, Construction and Maintenance Occupations
The most common Natural Resources, Construction and Maintenance occupations in Kenmare are Construction & Extraction (66 | 12.5%), Farming, Fishing & Forestry (29 | 5.5%), and Installation, Maintenance & Repair (26 | 4.9%).
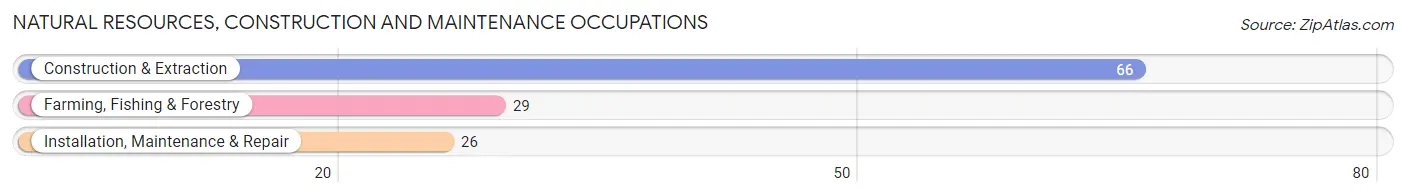
Natural Resources, Construction and Maintenance Occupations by Sex
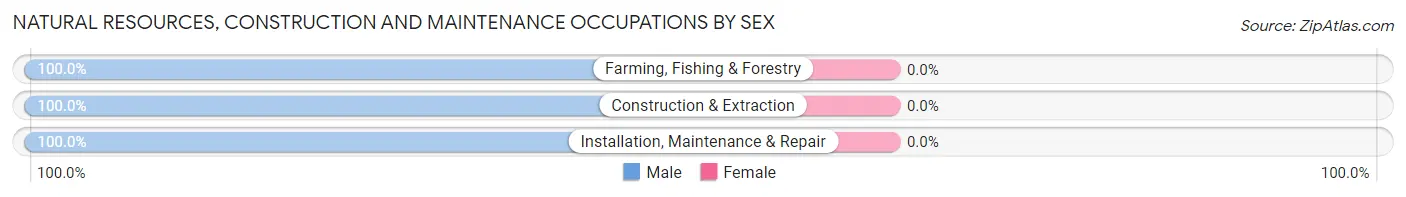
| Occupation | Male | Female |
| Farming, Fishing & Forestry | 29 (100.0%) | 0 (0.0%) |
| Construction & Extraction | 66 (100.0%) | 0 (0.0%) |
| Installation, Maintenance & Repair | 26 (100.0%) | 0 (0.0%) |
| Total (Category) | 121 (100.0%) | 0 (0.0%) |
| Total (Overall) | 266 (50.3%) | 263 (49.7%) |
Production, Transportation and Moving Occupations
The most common Production, Transportation and Moving occupations in Kenmare are Transportation (16 | 3.0%), Production (9 | 1.7%), and Material Moving (8 | 1.5%).
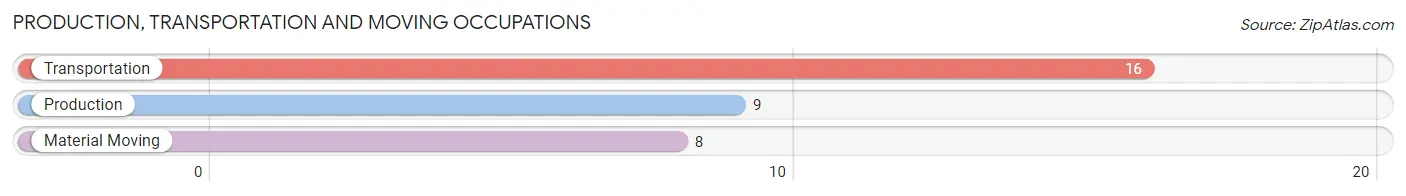
Production, Transportation and Moving Occupations by Sex
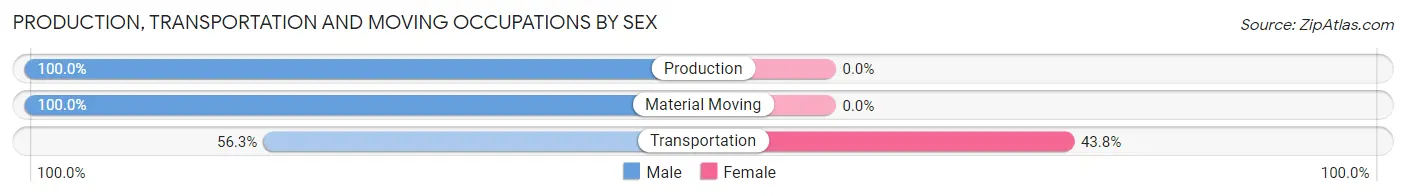
| Occupation | Male | Female |
| Production | 9 (100.0%) | 0 (0.0%) |
| Transportation | 9 (56.2%) | 7 (43.8%) |
| Material Moving | 8 (100.0%) | 0 (0.0%) |
| Total (Category) | 26 (78.8%) | 7 (21.2%) |
| Total (Overall) | 266 (50.3%) | 263 (49.7%) |
Employment Industries by Sex in Kenmare
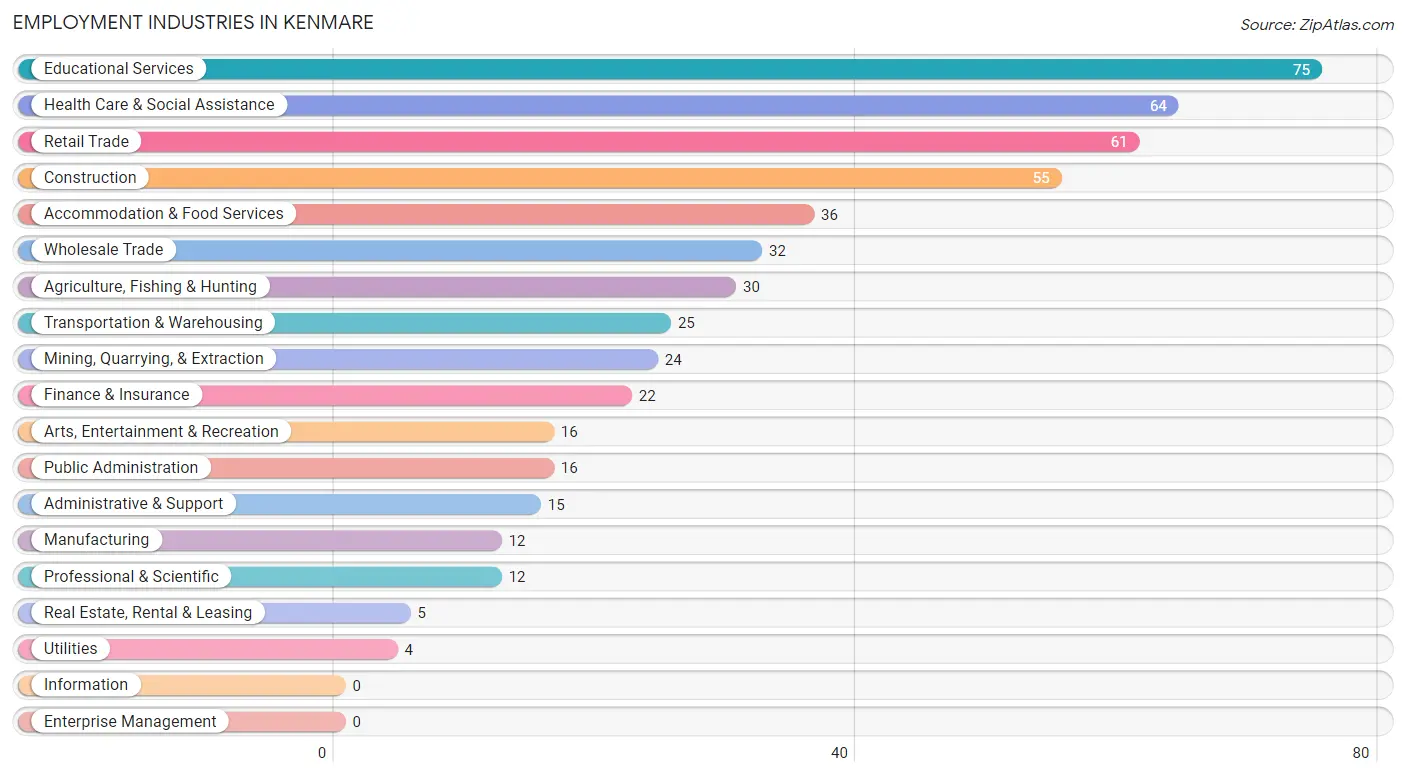
Employment Industries in Kenmare
The major employment industries in Kenmare include Educational Services (75 | 14.2%), Health Care & Social Assistance (64 | 12.1%), Retail Trade (61 | 11.5%), Construction (55 | 10.4%), and Accommodation & Food Services (36 | 6.8%).
Employment Industries by Sex in Kenmare
The Kenmare industries that see more men than women are Agriculture, Fishing & Hunting (100.0%), Mining, Quarrying, & Extraction (100.0%), and Construction (100.0%), whereas the industries that tend to have a higher number of women are Utilities (100.0%), Real Estate, Rental & Leasing (100.0%), and Professional & Scientific (100.0%).
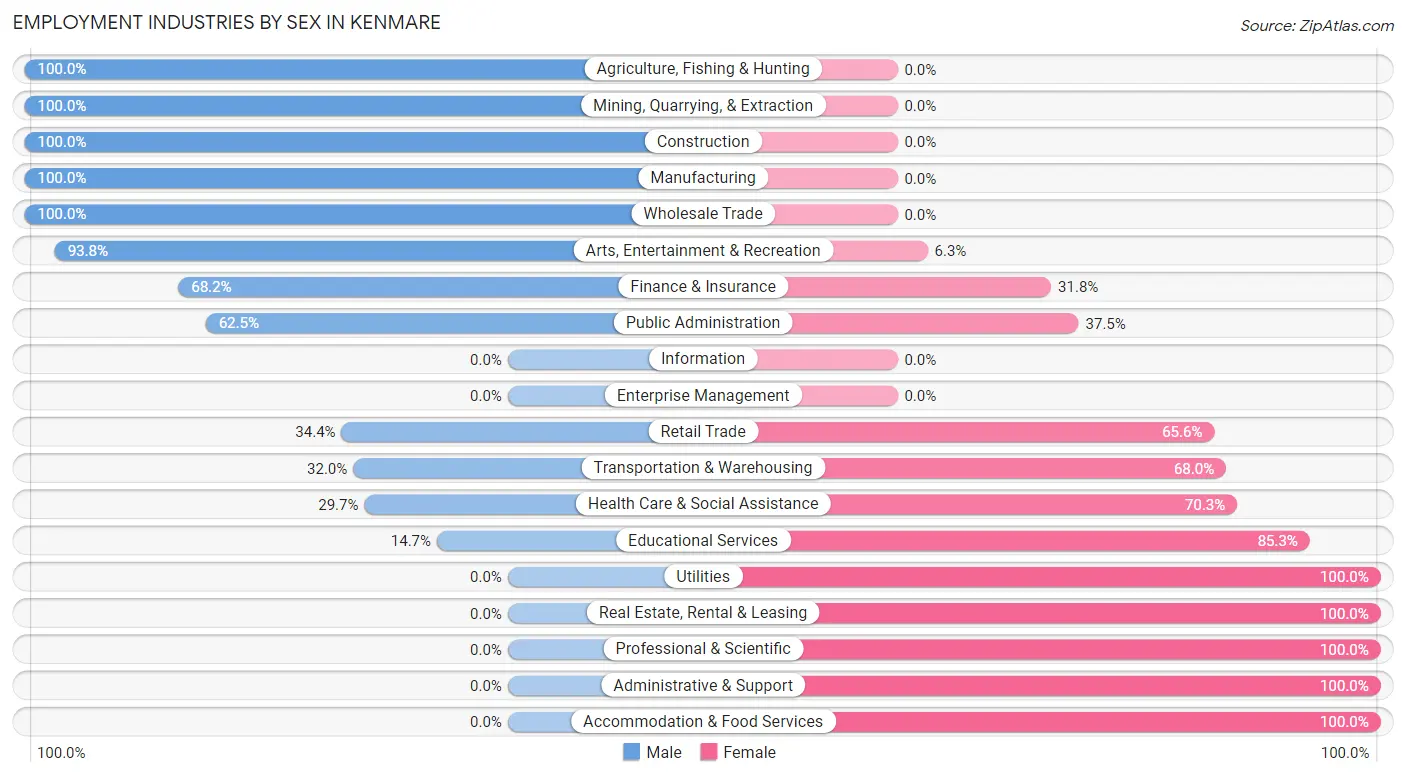
| Industry | Male | Female |
| Agriculture, Fishing & Hunting | 30 (100.0%) | 0 (0.0%) |
| Mining, Quarrying, & Extraction | 24 (100.0%) | 0 (0.0%) |
| Construction | 55 (100.0%) | 0 (0.0%) |
| Manufacturing | 12 (100.0%) | 0 (0.0%) |
| Wholesale Trade | 32 (100.0%) | 0 (0.0%) |
| Retail Trade | 21 (34.4%) | 40 (65.6%) |
| Transportation & Warehousing | 8 (32.0%) | 17 (68.0%) |
| Utilities | 0 (0.0%) | 4 (100.0%) |
| Information | 0 (0.0%) | 0 (0.0%) |
| Finance & Insurance | 15 (68.2%) | 7 (31.8%) |
| Real Estate, Rental & Leasing | 0 (0.0%) | 5 (100.0%) |
| Professional & Scientific | 0 (0.0%) | 12 (100.0%) |
| Enterprise Management | 0 (0.0%) | 0 (0.0%) |
| Administrative & Support | 0 (0.0%) | 15 (100.0%) |
| Educational Services | 11 (14.7%) | 64 (85.3%) |
| Health Care & Social Assistance | 19 (29.7%) | 45 (70.3%) |
| Arts, Entertainment & Recreation | 15 (93.8%) | 1 (6.2%) |
| Accommodation & Food Services | 0 (0.0%) | 36 (100.0%) |
| Public Administration | 10 (62.5%) | 6 (37.5%) |
| Total | 266 (50.3%) | 263 (49.7%) |
Education in Kenmare
School Enrollment in Kenmare
The most common levels of schooling among the 144 students in Kenmare are middle school (47 | 32.6%), elementary school (35 | 24.3%), and graduate / professional (25 | 17.4%).
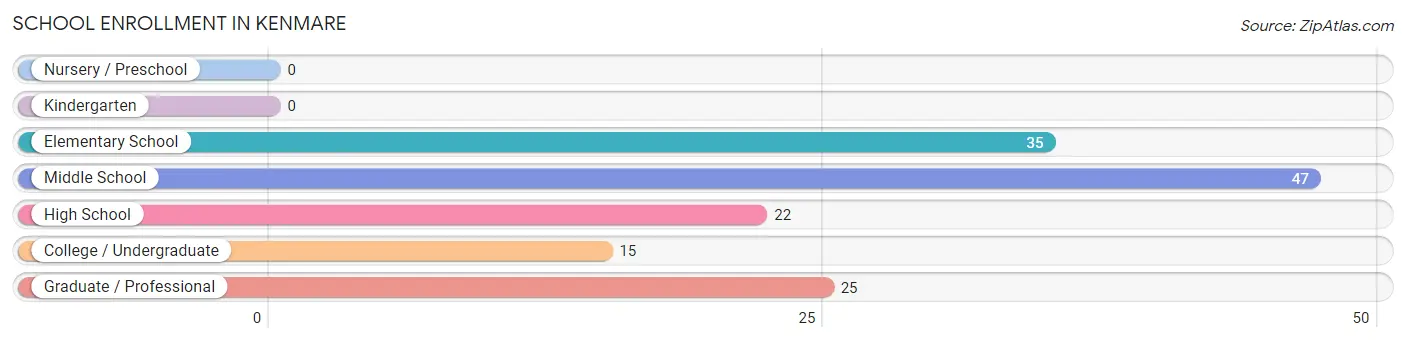
| School Level | # Students | % Students |
| Nursery / Preschool | 0 | 0.0% |
| Kindergarten | 0 | 0.0% |
| Elementary School | 35 | 24.3% |
| Middle School | 47 | 32.6% |
| High School | 22 | 15.3% |
| College / Undergraduate | 15 | 10.4% |
| Graduate / Professional | 25 | 17.4% |
| Total | 144 | 100.0% |
School Enrollment by Age by Funding Source in Kenmare
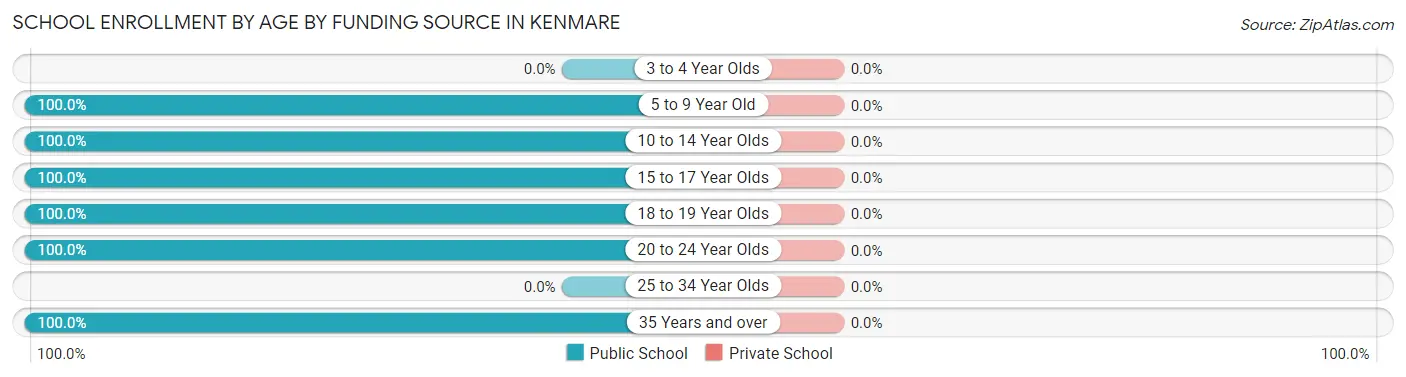
| Age Bracket | Public School | Private School |
| 3 to 4 Year Olds | 0 (0.0%) | 0 (0.0%) |
| 5 to 9 Year Old | 33 (100.0%) | 0 (0.0%) |
| 10 to 14 Year Olds | 58 (100.0%) | 0 (0.0%) |
| 15 to 17 Year Olds | 13 (100.0%) | 0 (0.0%) |
| 18 to 19 Year Olds | 5 (100.0%) | 0 (0.0%) |
| 20 to 24 Year Olds | 15 (100.0%) | 0 (0.0%) |
| 25 to 34 Year Olds | 0 (0.0%) | 0 (0.0%) |
| 35 Years and over | 20 (100.0%) | 0 (0.0%) |
| Total | 144 (100.0%) | 0 (0.0%) |
Educational Attainment by Field of Study in Kenmare
Education (61 | 38.4%), science & technology (34 | 21.4%), business (17 | 10.7%), bio, nature & agricultural (16 | 10.1%), and liberal arts & history (15 | 9.4%) are the most common fields of study among 159 individuals in Kenmare who have obtained a bachelor's degree or higher.
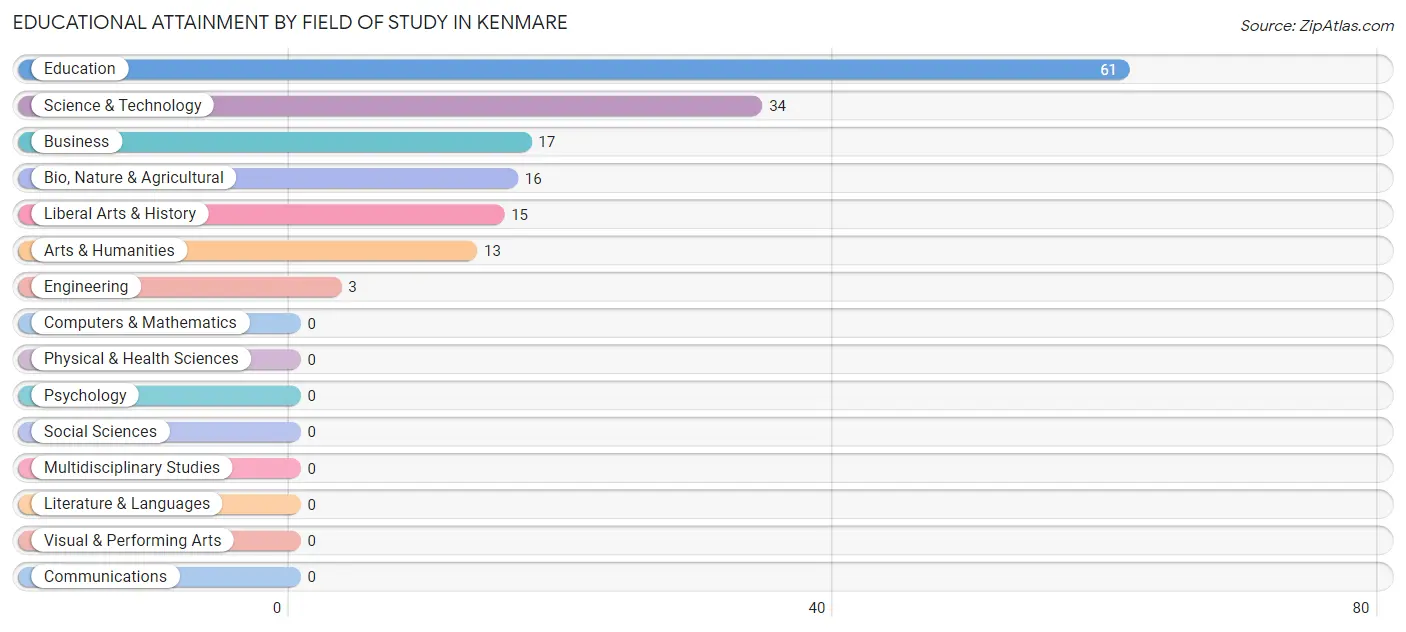
| Field of Study | # Graduates | % Graduates |
| Computers & Mathematics | 0 | 0.0% |
| Bio, Nature & Agricultural | 16 | 10.1% |
| Physical & Health Sciences | 0 | 0.0% |
| Psychology | 0 | 0.0% |
| Social Sciences | 0 | 0.0% |
| Engineering | 3 | 1.9% |
| Multidisciplinary Studies | 0 | 0.0% |
| Science & Technology | 34 | 21.4% |
| Business | 17 | 10.7% |
| Education | 61 | 38.4% |
| Literature & Languages | 0 | 0.0% |
| Liberal Arts & History | 15 | 9.4% |
| Visual & Performing Arts | 0 | 0.0% |
| Communications | 0 | 0.0% |
| Arts & Humanities | 13 | 8.2% |
| Total | 159 | 100.0% |
Transportation & Commute in Kenmare
Vehicle Availability by Sex in Kenmare
The most prevalent vehicle ownership categories in Kenmare are males with 1 vehicle (86, accounting for 34.8%) and females with 1 vehicle (52, making up 35.4%).
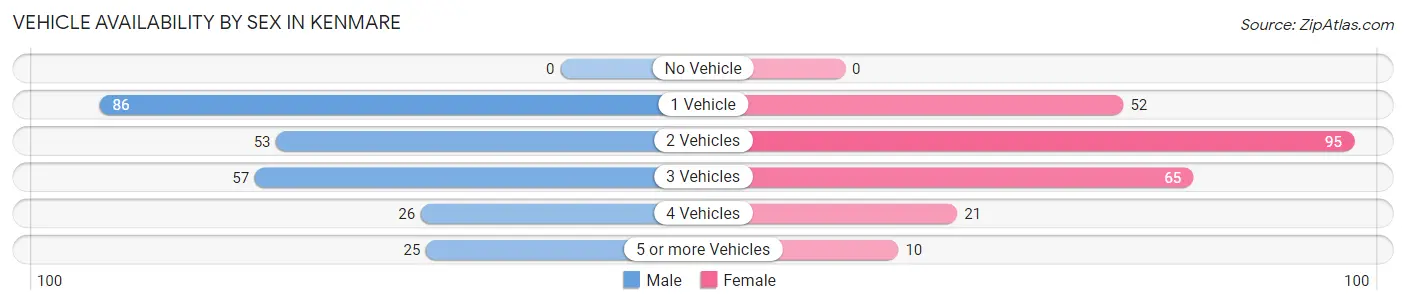
| Vehicles Available | Male | Female |
| No Vehicle | 0 (0.0%) | 0 (0.0%) |
| 1 Vehicle | 86 (34.8%) | 52 (21.4%) |
| 2 Vehicles | 53 (21.5%) | 95 (39.1%) |
| 3 Vehicles | 57 (23.1%) | 65 (26.8%) |
| 4 Vehicles | 26 (10.5%) | 21 (8.6%) |
| 5 or more Vehicles | 25 (10.1%) | 10 (4.1%) |
| Total | 247 (100.0%) | 243 (100.0%) |
Commute Time in Kenmare
The most frequently occuring commute durations in Kenmare are less than 5 minutes (184 commuters, 38.3%), 5 to 9 minutes (125 commuters, 26.0%), and 10 to 14 minutes (43 commuters, 9.0%).
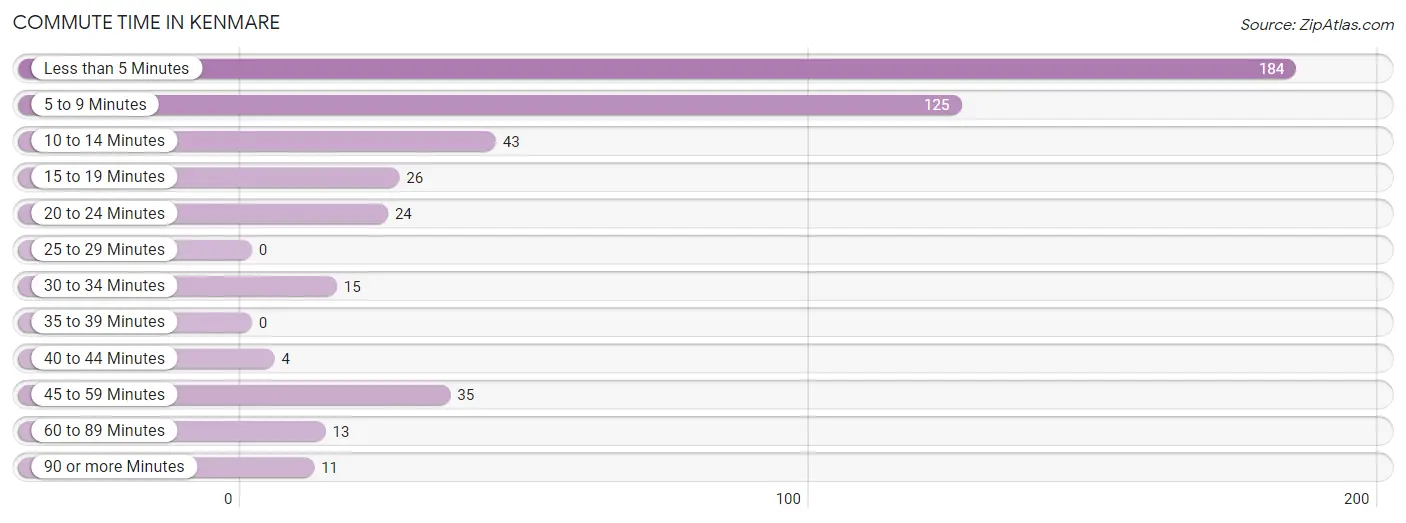
| Commute Time | # Commuters | % Commuters |
| Less than 5 Minutes | 184 | 38.3% |
| 5 to 9 Minutes | 125 | 26.0% |
| 10 to 14 Minutes | 43 | 9.0% |
| 15 to 19 Minutes | 26 | 5.4% |
| 20 to 24 Minutes | 24 | 5.0% |
| 25 to 29 Minutes | 0 | 0.0% |
| 30 to 34 Minutes | 15 | 3.1% |
| 35 to 39 Minutes | 0 | 0.0% |
| 40 to 44 Minutes | 4 | 0.8% |
| 45 to 59 Minutes | 35 | 7.3% |
| 60 to 89 Minutes | 13 | 2.7% |
| 90 or more Minutes | 11 | 2.3% |
Commute Time by Sex in Kenmare
The most common commute times in Kenmare are less than 5 minutes (104 commuters, 41.8%) for males and less than 5 minutes (80 commuters, 34.6%) for females.
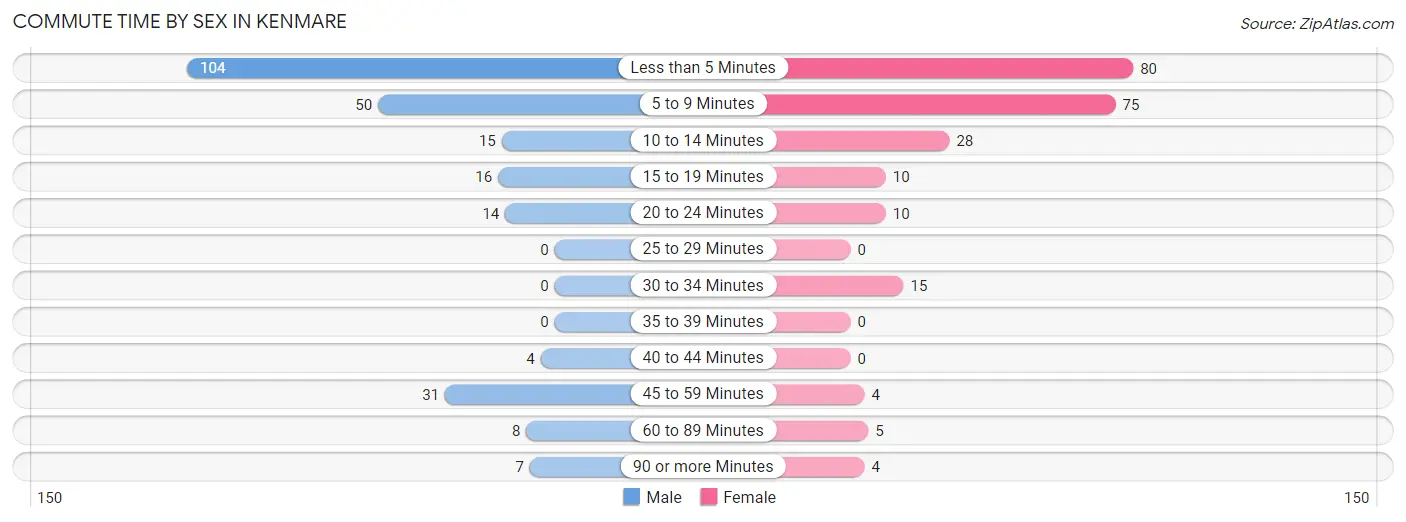
| Commute Time | Male | Female |
| Less than 5 Minutes | 104 (41.8%) | 80 (34.6%) |
| 5 to 9 Minutes | 50 (20.1%) | 75 (32.5%) |
| 10 to 14 Minutes | 15 (6.0%) | 28 (12.1%) |
| 15 to 19 Minutes | 16 (6.4%) | 10 (4.3%) |
| 20 to 24 Minutes | 14 (5.6%) | 10 (4.3%) |
| 25 to 29 Minutes | 0 (0.0%) | 0 (0.0%) |
| 30 to 34 Minutes | 0 (0.0%) | 15 (6.5%) |
| 35 to 39 Minutes | 0 (0.0%) | 0 (0.0%) |
| 40 to 44 Minutes | 4 (1.6%) | 0 (0.0%) |
| 45 to 59 Minutes | 31 (12.4%) | 4 (1.7%) |
| 60 to 89 Minutes | 8 (3.2%) | 5 (2.2%) |
| 90 or more Minutes | 7 (2.8%) | 4 (1.7%) |
Time of Departure to Work by Sex in Kenmare
The most frequent times of departure to work in Kenmare are 7:00 AM to 7:29 AM (58, 23.3%) for males and 8:00 AM to 8:29 AM (96, 41.6%) for females.
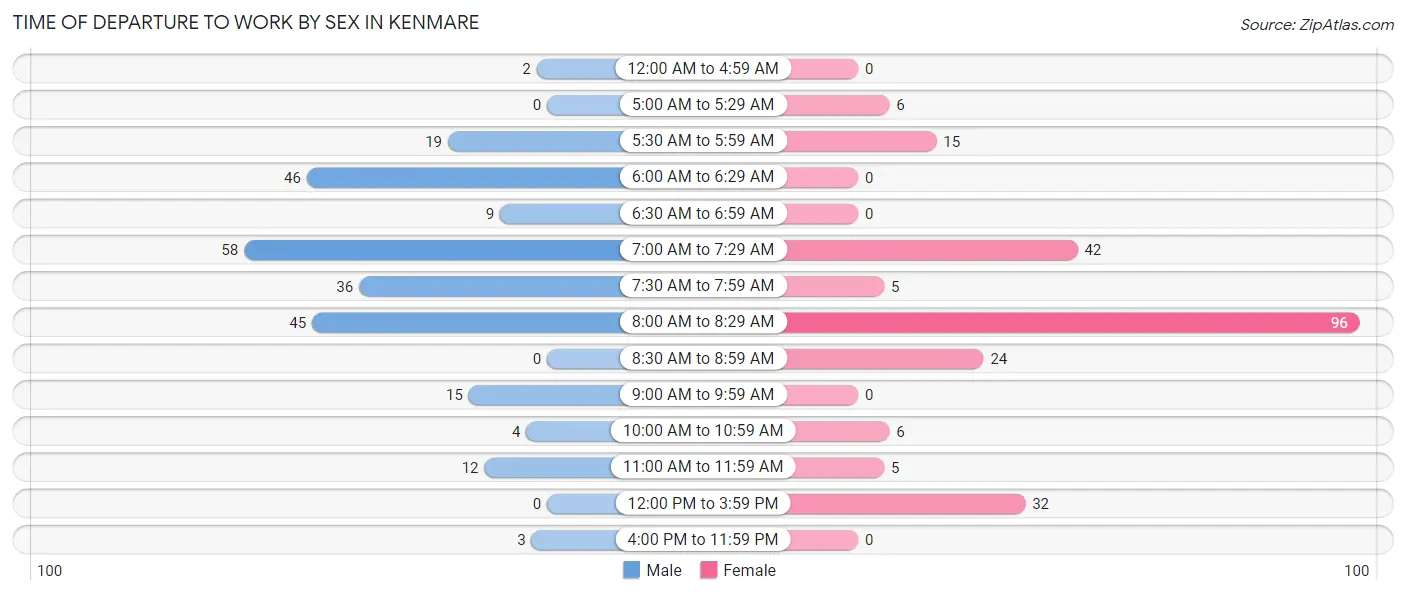
| Time of Departure | Male | Female |
| 12:00 AM to 4:59 AM | 2 (0.8%) | 0 (0.0%) |
| 5:00 AM to 5:29 AM | 0 (0.0%) | 6 (2.6%) |
| 5:30 AM to 5:59 AM | 19 (7.6%) | 15 (6.5%) |
| 6:00 AM to 6:29 AM | 46 (18.5%) | 0 (0.0%) |
| 6:30 AM to 6:59 AM | 9 (3.6%) | 0 (0.0%) |
| 7:00 AM to 7:29 AM | 58 (23.3%) | 42 (18.2%) |
| 7:30 AM to 7:59 AM | 36 (14.5%) | 5 (2.2%) |
| 8:00 AM to 8:29 AM | 45 (18.1%) | 96 (41.6%) |
| 8:30 AM to 8:59 AM | 0 (0.0%) | 24 (10.4%) |
| 9:00 AM to 9:59 AM | 15 (6.0%) | 0 (0.0%) |
| 10:00 AM to 10:59 AM | 4 (1.6%) | 6 (2.6%) |
| 11:00 AM to 11:59 AM | 12 (4.8%) | 5 (2.2%) |
| 12:00 PM to 3:59 PM | 0 (0.0%) | 32 (13.9%) |
| 4:00 PM to 11:59 PM | 3 (1.2%) | 0 (0.0%) |
| Total | 249 (100.0%) | 231 (100.0%) |
Housing Occupancy in Kenmare
Occupancy by Ownership in Kenmare
Of the total 509 dwellings in Kenmare, owner-occupied units account for 339 (66.6%), while renter-occupied units make up 170 (33.4%).
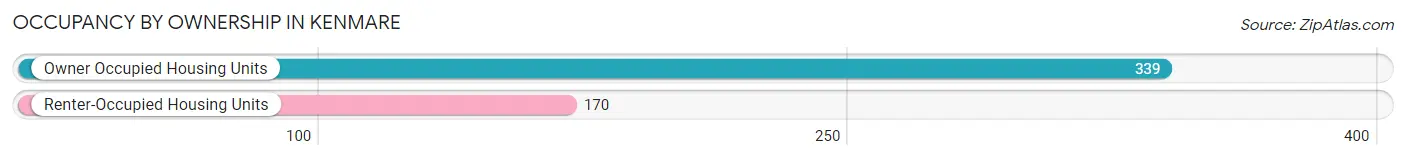
| Occupancy | # Housing Units | % Housing Units |
| Owner Occupied Housing Units | 339 | 66.6% |
| Renter-Occupied Housing Units | 170 | 33.4% |
| Total Occupied Housing Units | 509 | 100.0% |
Occupancy by Household Size in Kenmare
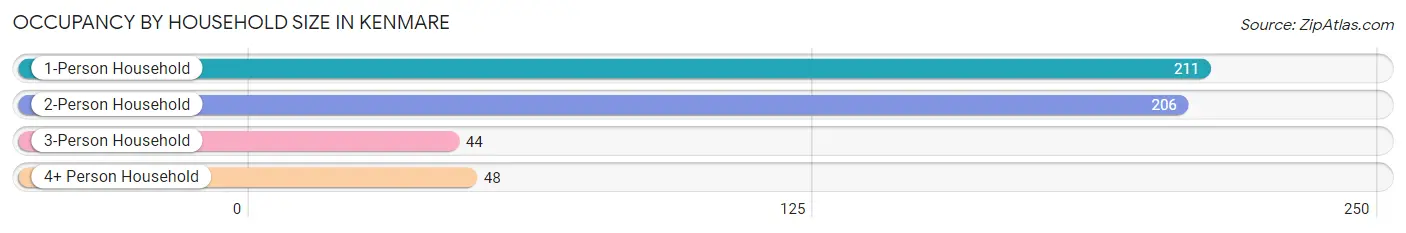
| Household Size | # Housing Units | % Housing Units |
| 1-Person Household | 211 | 41.4% |
| 2-Person Household | 206 | 40.5% |
| 3-Person Household | 44 | 8.6% |
| 4+ Person Household | 48 | 9.4% |
| Total Housing Units | 509 | 100.0% |
Occupancy by Ownership by Household Size in Kenmare
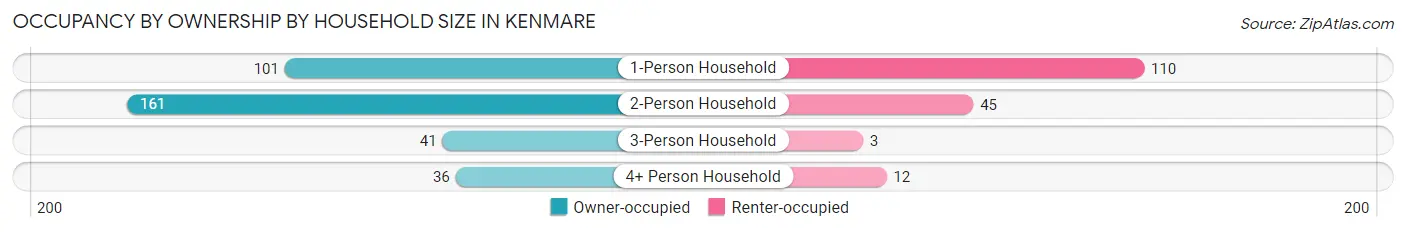
| Household Size | Owner-occupied | Renter-occupied |
| 1-Person Household | 101 (47.9%) | 110 (52.1%) |
| 2-Person Household | 161 (78.2%) | 45 (21.8%) |
| 3-Person Household | 41 (93.2%) | 3 (6.8%) |
| 4+ Person Household | 36 (75.0%) | 12 (25.0%) |
| Total Housing Units | 339 (66.6%) | 170 (33.4%) |
Occupancy by Educational Attainment in Kenmare
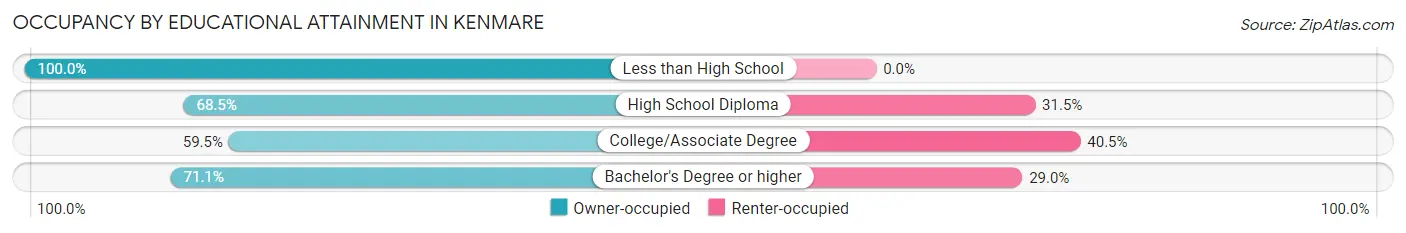
| Household Size | Owner-occupied | Renter-occupied |
| Less than High School | 20 (100.0%) | 0 (0.0%) |
| High School Diploma | 113 (68.5%) | 52 (31.5%) |
| College/Associate Degree | 125 (59.5%) | 85 (40.5%) |
| Bachelor's Degree or higher | 81 (71.1%) | 33 (28.9%) |
Occupancy by Age of Householder in Kenmare
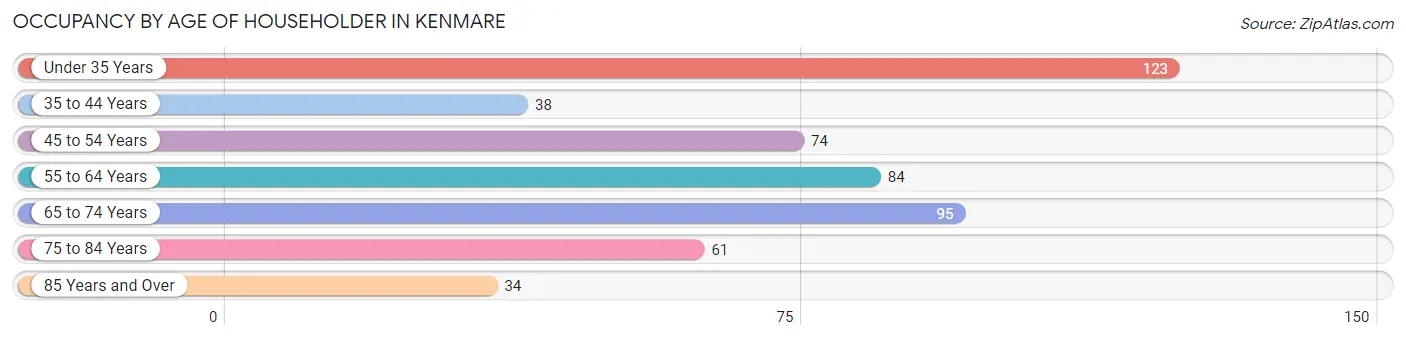
| Age Bracket | # Households | % Households |
| Under 35 Years | 123 | 24.2% |
| 35 to 44 Years | 38 | 7.5% |
| 45 to 54 Years | 74 | 14.5% |
| 55 to 64 Years | 84 | 16.5% |
| 65 to 74 Years | 95 | 18.7% |
| 75 to 84 Years | 61 | 12.0% |
| 85 Years and Over | 34 | 6.7% |
| Total | 509 | 100.0% |
Housing Finances in Kenmare
Median Income by Occupancy in Kenmare
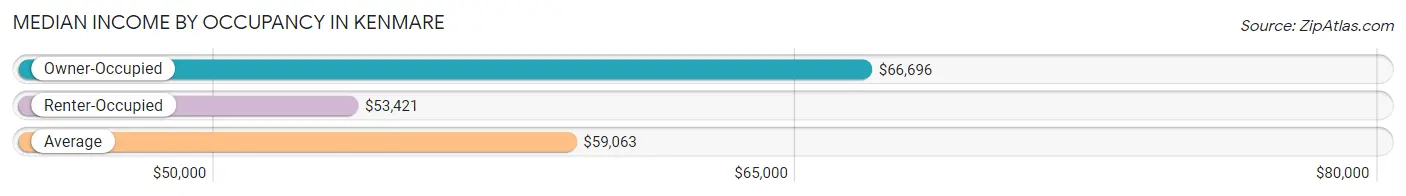
| Occupancy Type | # Households | Median Income |
| Owner-Occupied | 339 (66.6%) | $66,696 |
| Renter-Occupied | 170 (33.4%) | $53,421 |
| Average | 509 (100.0%) | $59,063 |
Occupancy by Householder Income Bracket in Kenmare
| Income Bracket | Owner-occupied | Renter-occupied |
| Less than $5,000 | 9 (2.6%) | 15 (8.8%) |
| $5,000 to $9,999 | 10 (2.9%) | 0 (0.0%) |
| $10,000 to $14,999 | 3 (0.9%) | 9 (5.3%) |
| $15,000 to $19,999 | 0 (0.0%) | 10 (5.9%) |
| $20,000 to $24,999 | 23 (6.8%) | 0 (0.0%) |
| $25,000 to $34,999 | 34 (10.0%) | 12 (7.1%) |
| $35,000 to $49,999 | 25 (7.4%) | 32 (18.8%) |
| $50,000 to $74,999 | 95 (28.0%) | 65 (38.2%) |
| $75,000 to $99,999 | 15 (4.4%) | 15 (8.8%) |
| $100,000 to $149,999 | 91 (26.8%) | 0 (0.0%) |
| $150,000 or more | 34 (10.0%) | 12 (7.1%) |
| Total | 339 (100.0%) | 170 (100.0%) |
Monthly Housing Cost Tiers in Kenmare
| Monthly Cost | Owner-occupied | Renter-occupied |
| Less than $300 | 27 (8.0%) | 14 (8.2%) |
| $300 to $499 | 86 (25.4%) | 7 (4.1%) |
| $500 to $799 | 101 (29.8%) | 54 (31.8%) |
| $800 to $999 | 28 (8.3%) | 23 (13.5%) |
| $1,000 to $1,499 | 72 (21.2%) | 48 (28.2%) |
| $1,500 to $1,999 | 21 (6.2%) | 0 (0.0%) |
| $2,000 to $2,499 | 4 (1.2%) | 0 (0.0%) |
| $2,500 to $2,999 | 0 (0.0%) | 0 (0.0%) |
| $3,000 or more | 0 (0.0%) | 0 (0.0%) |
| Total | 339 (100.0%) | 170 (100.0%) |
Physical Housing Characteristics in Kenmare
Housing Structures in Kenmare
| Structure Type | # Housing Units | % Housing Units |
| Single Unit, Detached | 367 | 72.1% |
| Single Unit, Attached | 6 | 1.2% |
| 2 Unit Apartments | 38 | 7.5% |
| 3 or 4 Unit Apartments | 29 | 5.7% |
| 5 to 9 Unit Apartments | 34 | 6.7% |
| 10 or more Apartments | 27 | 5.3% |
| Mobile Home / Other | 8 | 1.6% |
| Total | 509 | 100.0% |
Housing Structures by Occupancy in Kenmare
| Structure Type | Owner-occupied | Renter-occupied |
| Single Unit, Detached | 301 (82.0%) | 66 (18.0%) |
| Single Unit, Attached | 6 (100.0%) | 0 (0.0%) |
| 2 Unit Apartments | 24 (63.2%) | 14 (36.8%) |
| 3 or 4 Unit Apartments | 0 (0.0%) | 29 (100.0%) |
| 5 to 9 Unit Apartments | 0 (0.0%) | 34 (100.0%) |
| 10 or more Apartments | 0 (0.0%) | 27 (100.0%) |
| Mobile Home / Other | 8 (100.0%) | 0 (0.0%) |
| Total | 339 (66.6%) | 170 (33.4%) |
Housing Structures by Number of Rooms in Kenmare
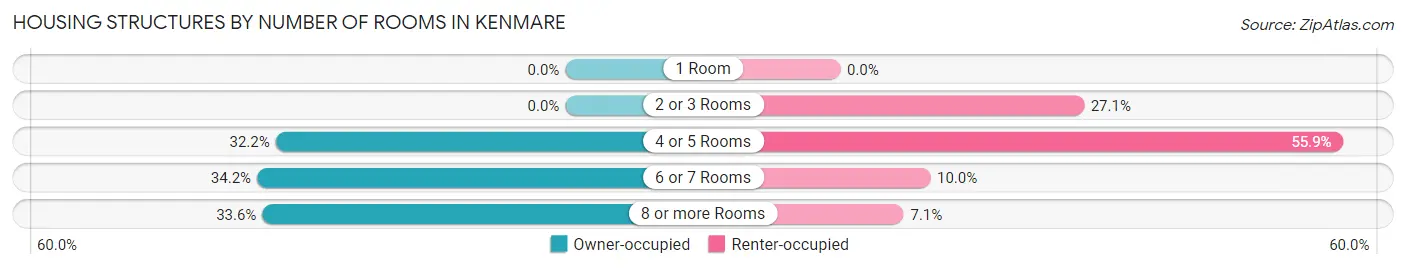
| Number of Rooms | Owner-occupied | Renter-occupied |
| 1 Room | 0 (0.0%) | 0 (0.0%) |
| 2 or 3 Rooms | 0 (0.0%) | 46 (27.1%) |
| 4 or 5 Rooms | 109 (32.2%) | 95 (55.9%) |
| 6 or 7 Rooms | 116 (34.2%) | 17 (10.0%) |
| 8 or more Rooms | 114 (33.6%) | 12 (7.1%) |
| Total | 339 (100.0%) | 170 (100.0%) |
Housing Structure by Heating Type in Kenmare
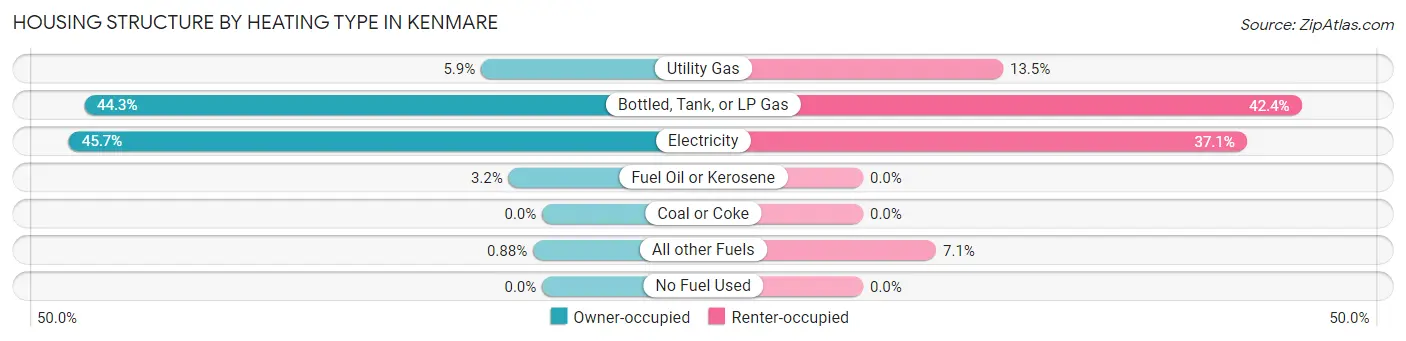
| Heating Type | Owner-occupied | Renter-occupied |
| Utility Gas | 20 (5.9%) | 23 (13.5%) |
| Bottled, Tank, or LP Gas | 150 (44.3%) | 72 (42.3%) |
| Electricity | 155 (45.7%) | 63 (37.1%) |
| Fuel Oil or Kerosene | 11 (3.2%) | 0 (0.0%) |
| Coal or Coke | 0 (0.0%) | 0 (0.0%) |
| All other Fuels | 3 (0.9%) | 12 (7.1%) |
| No Fuel Used | 0 (0.0%) | 0 (0.0%) |
| Total | 339 (100.0%) | 170 (100.0%) |
Household Vehicle Usage in Kenmare
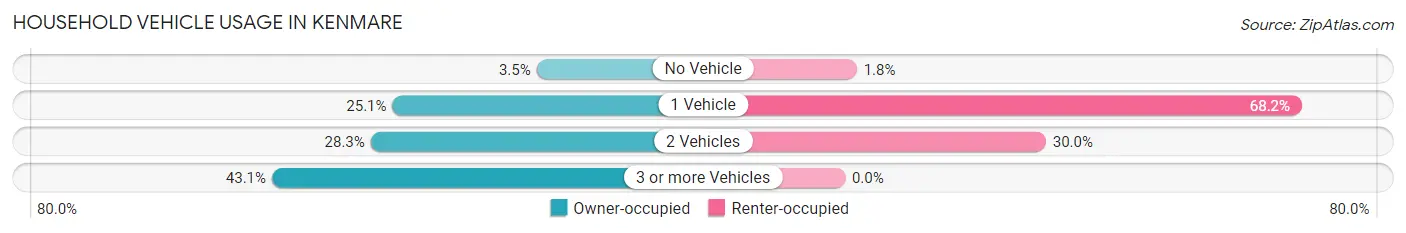
| Vehicles per Household | Owner-occupied | Renter-occupied |
| No Vehicle | 12 (3.5%) | 3 (1.8%) |
| 1 Vehicle | 85 (25.1%) | 116 (68.2%) |
| 2 Vehicles | 96 (28.3%) | 51 (30.0%) |
| 3 or more Vehicles | 146 (43.1%) | 0 (0.0%) |
| Total | 339 (100.0%) | 170 (100.0%) |
Real Estate & Mortgages in Kenmare
Real Estate and Mortgage Overview in Kenmare
| Characteristic | Without Mortgage | With Mortgage |
| Housing Units | 226 | 113 |
| Median Property Value | $107,000 | $148,000 |
| Median Household Income | $61,750 | $8 |
| Monthly Housing Costs | $500 | $0 |
| Real Estate Taxes | $1,250 | $5 |
Property Value by Mortgage Status in Kenmare
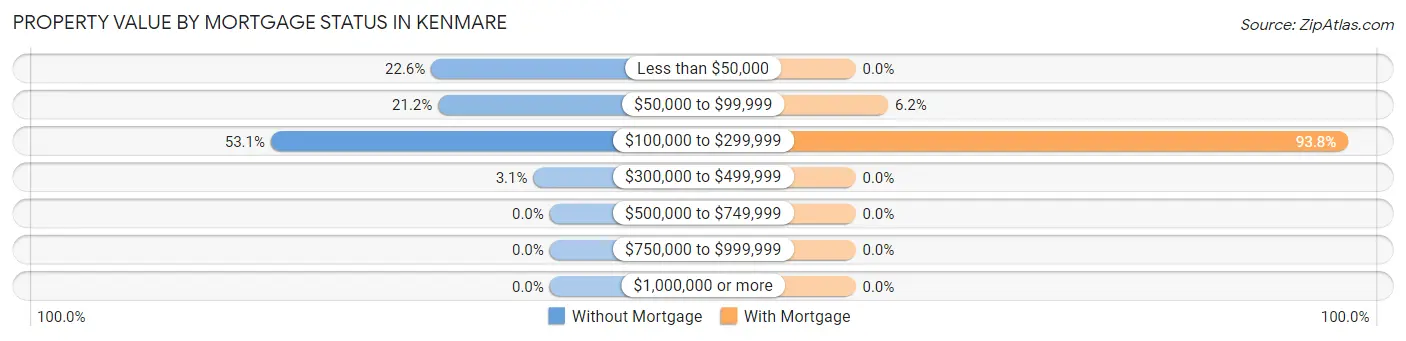
| Property Value | Without Mortgage | With Mortgage |
| Less than $50,000 | 51 (22.6%) | 0 (0.0%) |
| $50,000 to $99,999 | 48 (21.2%) | 7 (6.2%) |
| $100,000 to $299,999 | 120 (53.1%) | 106 (93.8%) |
| $300,000 to $499,999 | 7 (3.1%) | 0 (0.0%) |
| $500,000 to $749,999 | 0 (0.0%) | 0 (0.0%) |
| $750,000 to $999,999 | 0 (0.0%) | 0 (0.0%) |
| $1,000,000 or more | 0 (0.0%) | 0 (0.0%) |
| Total | 226 (100.0%) | 113 (100.0%) |
Household Income by Mortgage Status in Kenmare
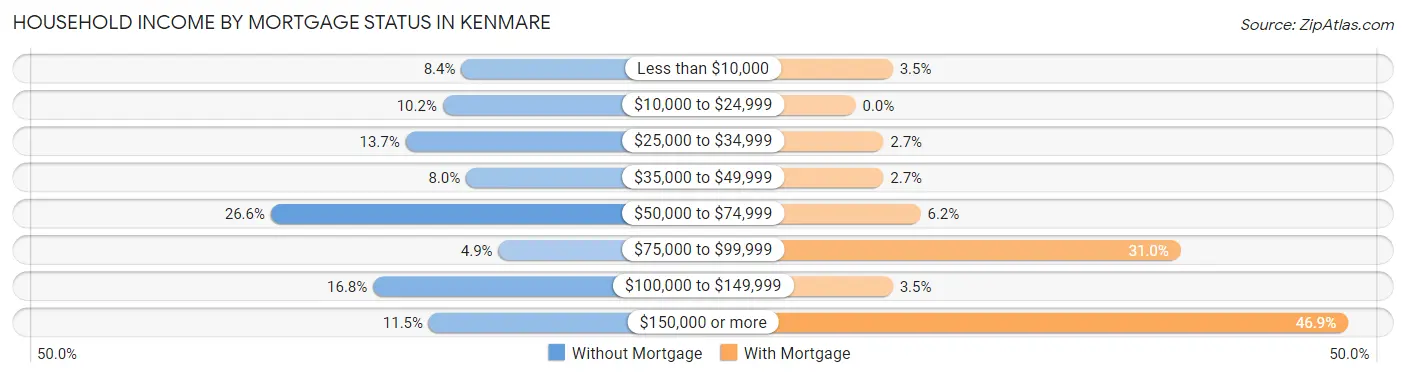
| Household Income | Without Mortgage | With Mortgage |
| Less than $10,000 | 19 (8.4%) | 4 (3.5%) |
| $10,000 to $24,999 | 23 (10.2%) | 0 (0.0%) |
| $25,000 to $34,999 | 31 (13.7%) | 3 (2.6%) |
| $35,000 to $49,999 | 18 (8.0%) | 3 (2.6%) |
| $50,000 to $74,999 | 60 (26.6%) | 7 (6.2%) |
| $75,000 to $99,999 | 11 (4.9%) | 35 (31.0%) |
| $100,000 to $149,999 | 38 (16.8%) | 4 (3.5%) |
| $150,000 or more | 26 (11.5%) | 53 (46.9%) |
| Total | 226 (100.0%) | 113 (100.0%) |
Property Value to Household Income Ratio in Kenmare
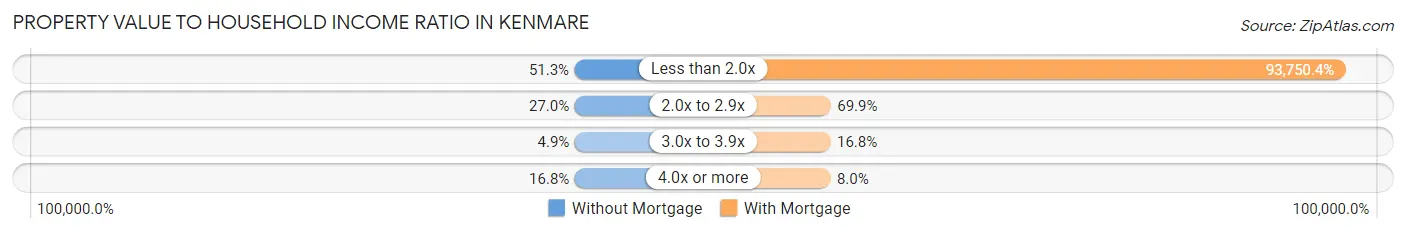
| Value-to-Income Ratio | Without Mortgage | With Mortgage |
| Less than 2.0x | 116 (51.3%) | 105,938 (93,750.4%) |
| 2.0x to 2.9x | 61 (27.0%) | 79 (69.9%) |
| 3.0x to 3.9x | 11 (4.9%) | 19 (16.8%) |
| 4.0x or more | 38 (16.8%) | 9 (8.0%) |
| Total | 226 (100.0%) | 113 (100.0%) |
Real Estate Taxes by Mortgage Status in Kenmare
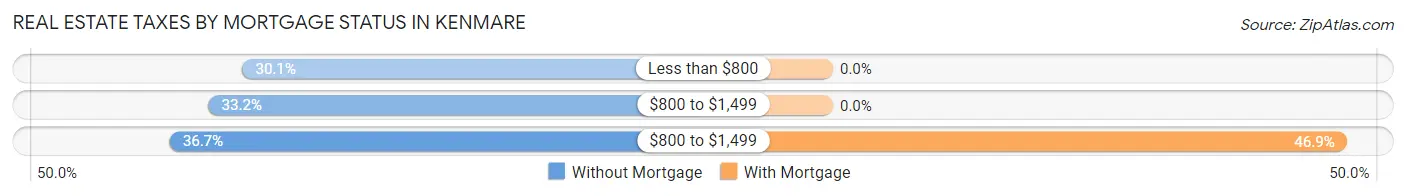
| Property Taxes | Without Mortgage | With Mortgage |
| Less than $800 | 68 (30.1%) | 0 (0.0%) |
| $800 to $1,499 | 75 (33.2%) | 0 (0.0%) |
| $800 to $1,499 | 83 (36.7%) | 53 (46.9%) |
| Total | 226 (100.0%) | 113 (100.0%) |
Health & Disability in Kenmare
Health Insurance Coverage by Age in Kenmare
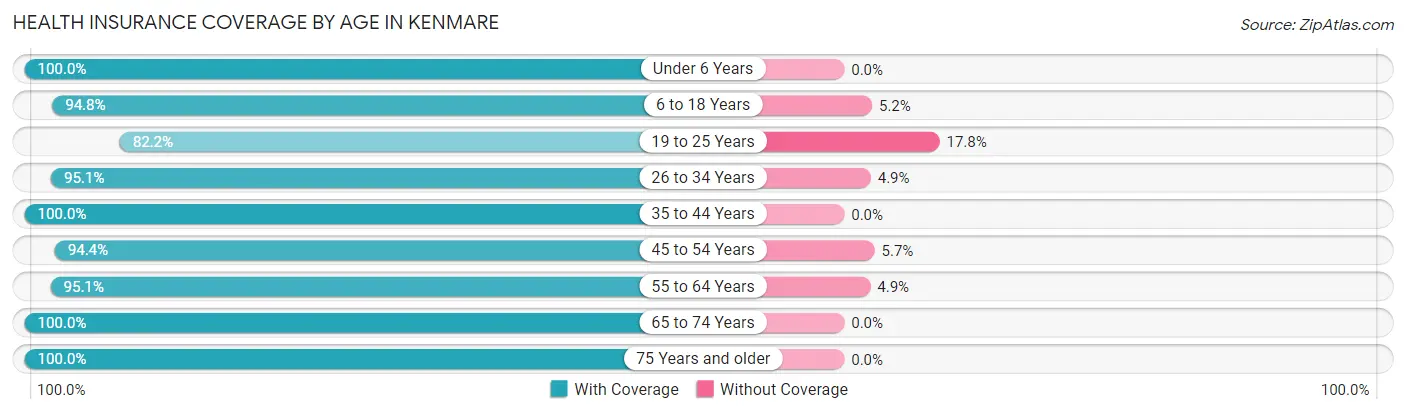
| Age Bracket | With Coverage | Without Coverage |
| Under 6 Years | 46 (100.0%) | 0 (0.0%) |
| 6 to 18 Years | 110 (94.8%) | 6 (5.2%) |
| 19 to 25 Years | 88 (82.2%) | 19 (17.8%) |
| 26 to 34 Years | 77 (95.1%) | 4 (4.9%) |
| 35 to 44 Years | 69 (100.0%) | 0 (0.0%) |
| 45 to 54 Years | 117 (94.4%) | 7 (5.7%) |
| 55 to 64 Years | 176 (95.1%) | 9 (4.9%) |
| 65 to 74 Years | 119 (100.0%) | 0 (0.0%) |
| 75 Years and older | 137 (100.0%) | 0 (0.0%) |
| Total | 939 (95.4%) | 45 (4.6%) |
Health Insurance Coverage by Citizenship Status in Kenmare
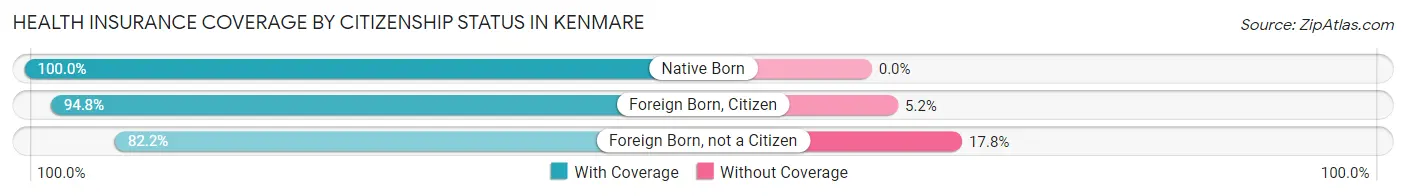
| Citizenship Status | With Coverage | Without Coverage |
| Native Born | 46 (100.0%) | 0 (0.0%) |
| Foreign Born, Citizen | 110 (94.8%) | 6 (5.2%) |
| Foreign Born, not a Citizen | 88 (82.2%) | 19 (17.8%) |
Health Insurance Coverage by Household Income in Kenmare
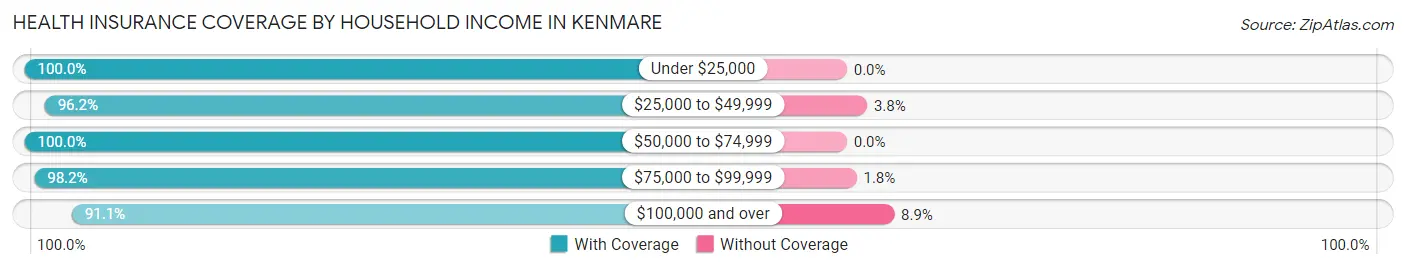
| Household Income | With Coverage | Without Coverage |
| Under $25,000 | 79 (100.0%) | 0 (0.0%) |
| $25,000 to $49,999 | 178 (96.2%) | 7 (3.8%) |
| $50,000 to $74,999 | 285 (100.0%) | 0 (0.0%) |
| $75,000 to $99,999 | 54 (98.2%) | 1 (1.8%) |
| $100,000 and over | 339 (91.1%) | 33 (8.9%) |
Public vs Private Health Insurance Coverage by Age in Kenmare
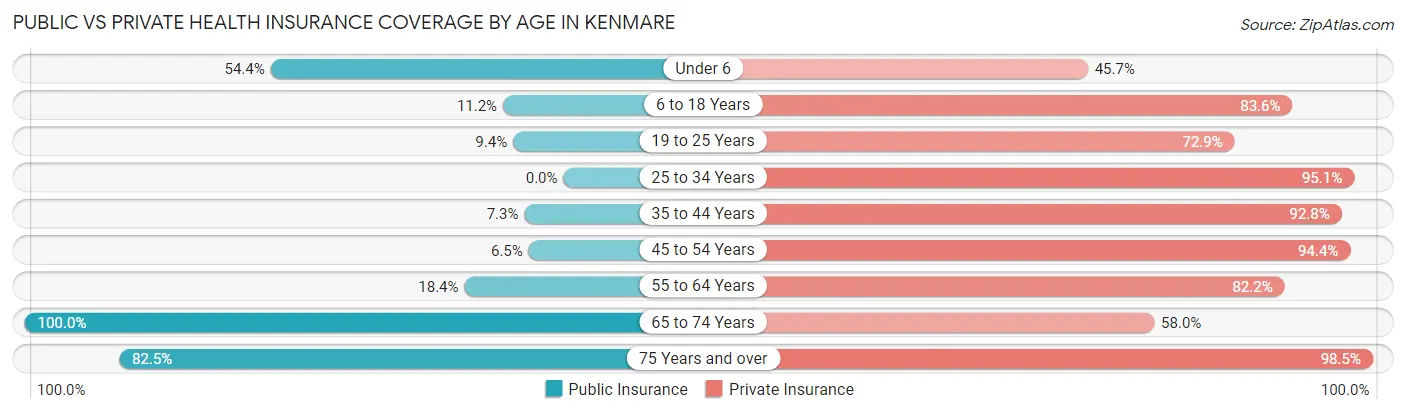
| Age Bracket | Public Insurance | Private Insurance |
| Under 6 | 25 (54.3%) | 21 (45.7%) |
| 6 to 18 Years | 13 (11.2%) | 97 (83.6%) |
| 19 to 25 Years | 10 (9.3%) | 78 (72.9%) |
| 25 to 34 Years | 0 (0.0%) | 77 (95.1%) |
| 35 to 44 Years | 5 (7.2%) | 64 (92.7%) |
| 45 to 54 Years | 8 (6.5%) | 117 (94.4%) |
| 55 to 64 Years | 34 (18.4%) | 152 (82.2%) |
| 65 to 74 Years | 119 (100.0%) | 69 (58.0%) |
| 75 Years and over | 113 (82.5%) | 135 (98.5%) |
| Total | 327 (33.2%) | 810 (82.3%) |
Disability Status by Sex by Age in Kenmare
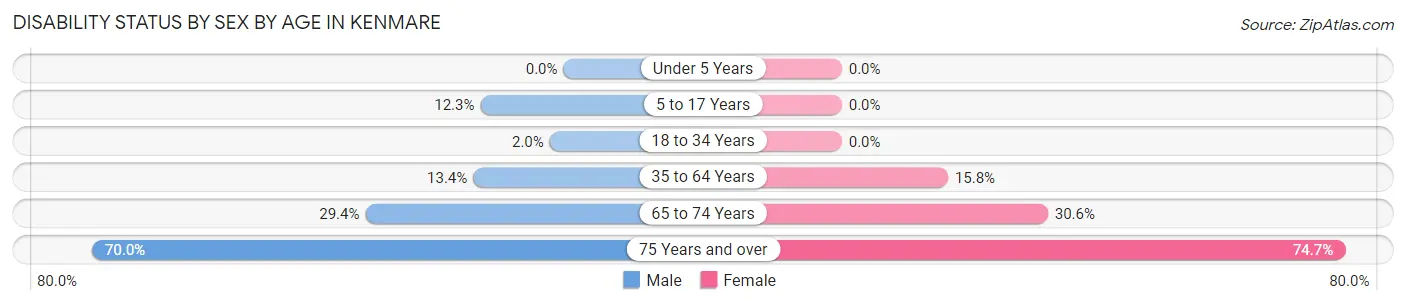
| Age Bracket | Male | Female |
| Under 5 Years | 0 (0.0%) | 0 (0.0%) |
| 5 to 17 Years | 9 (12.3%) | 0 (0.0%) |
| 18 to 34 Years | 2 (2.0%) | 0 (0.0%) |
| 35 to 64 Years | 26 (13.4%) | 29 (15.8%) |
| 65 to 74 Years | 10 (29.4%) | 26 (30.6%) |
| 75 Years and over | 35 (70.0%) | 65 (74.7%) |
Disability Class by Sex by Age in Kenmare
Disability Class: Hearing Difficulty
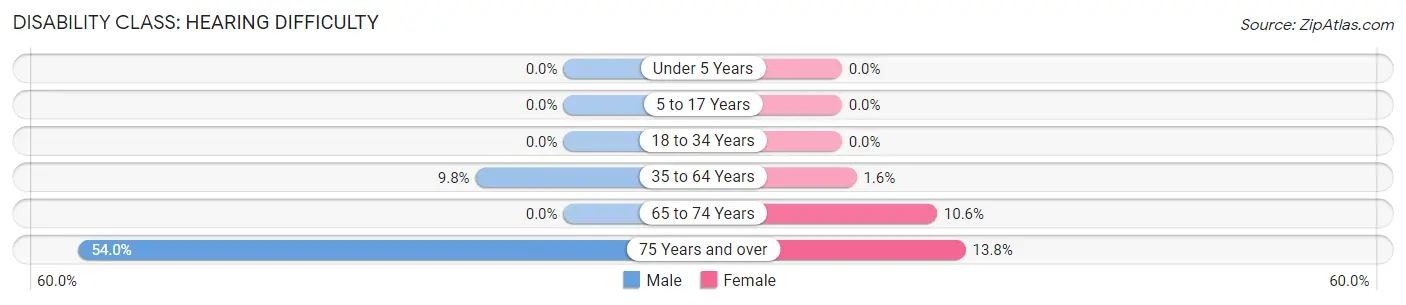
| Age Bracket | Male | Female |
| Under 5 Years | 0 (0.0%) | 0 (0.0%) |
| 5 to 17 Years | 0 (0.0%) | 0 (0.0%) |
| 18 to 34 Years | 0 (0.0%) | 0 (0.0%) |
| 35 to 64 Years | 19 (9.8%) | 3 (1.6%) |
| 65 to 74 Years | 0 (0.0%) | 9 (10.6%) |
| 75 Years and over | 27 (54.0%) | 12 (13.8%) |
Disability Class: Vision Difficulty
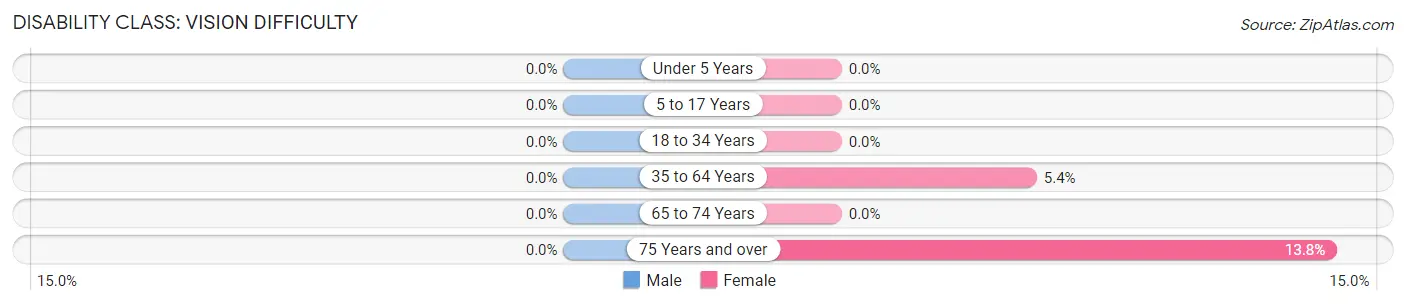
| Age Bracket | Male | Female |
| Under 5 Years | 0 (0.0%) | 0 (0.0%) |
| 5 to 17 Years | 0 (0.0%) | 0 (0.0%) |
| 18 to 34 Years | 0 (0.0%) | 0 (0.0%) |
| 35 to 64 Years | 0 (0.0%) | 10 (5.4%) |
| 65 to 74 Years | 0 (0.0%) | 0 (0.0%) |
| 75 Years and over | 0 (0.0%) | 12 (13.8%) |
Disability Class: Cognitive Difficulty
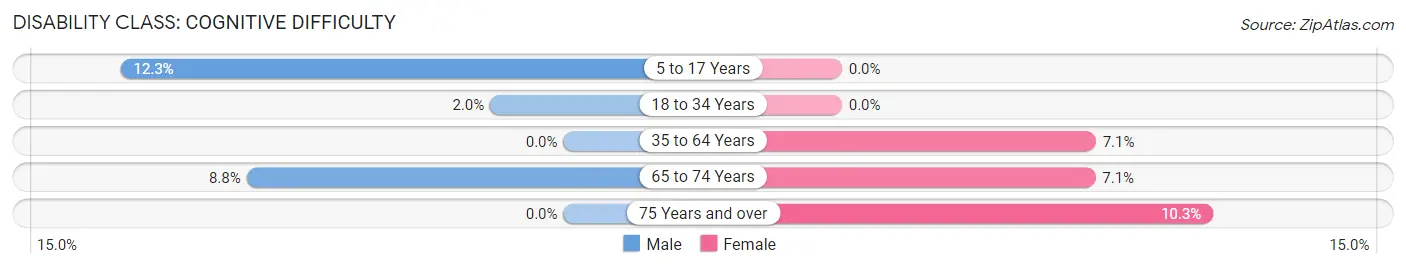
| Age Bracket | Male | Female |
| 5 to 17 Years | 9 (12.3%) | 0 (0.0%) |
| 18 to 34 Years | 2 (2.0%) | 0 (0.0%) |
| 35 to 64 Years | 0 (0.0%) | 13 (7.1%) |
| 65 to 74 Years | 3 (8.8%) | 6 (7.1%) |
| 75 Years and over | 0 (0.0%) | 9 (10.3%) |
Disability Class: Ambulatory Difficulty
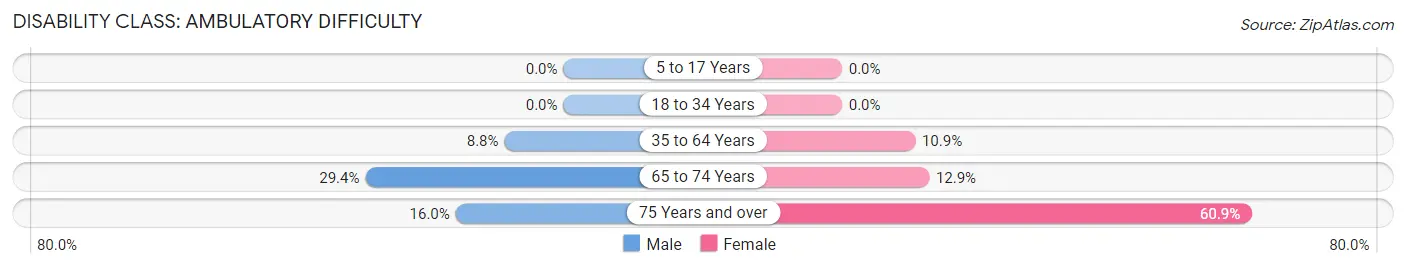
| Age Bracket | Male | Female |
| 5 to 17 Years | 0 (0.0%) | 0 (0.0%) |
| 18 to 34 Years | 0 (0.0%) | 0 (0.0%) |
| 35 to 64 Years | 17 (8.8%) | 20 (10.9%) |
| 65 to 74 Years | 10 (29.4%) | 11 (12.9%) |
| 75 Years and over | 8 (16.0%) | 53 (60.9%) |
Disability Class: Self-Care Difficulty
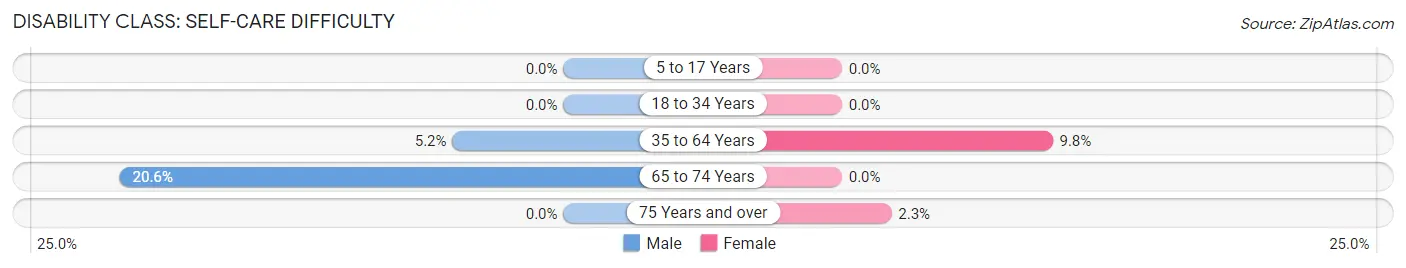
| Age Bracket | Male | Female |
| 5 to 17 Years | 0 (0.0%) | 0 (0.0%) |
| 18 to 34 Years | 0 (0.0%) | 0 (0.0%) |
| 35 to 64 Years | 10 (5.1%) | 18 (9.8%) |
| 65 to 74 Years | 7 (20.6%) | 0 (0.0%) |
| 75 Years and over | 0 (0.0%) | 2 (2.3%) |
Technology Access in Kenmare
Computing Device Access in Kenmare
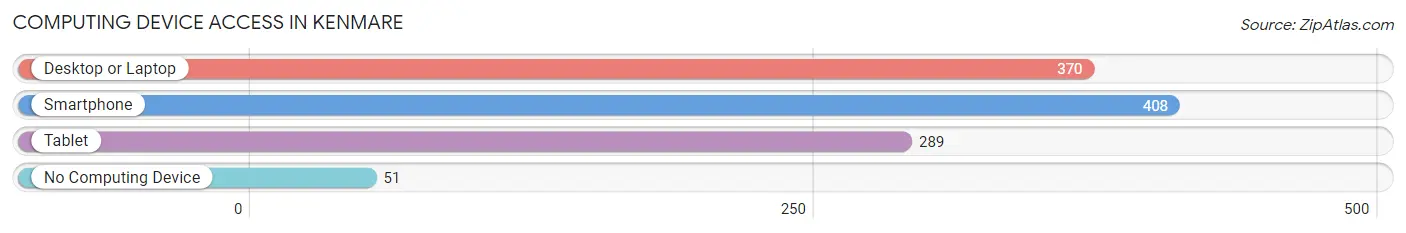
| Device Type | # Households | % Households |
| Desktop or Laptop | 370 | 72.7% |
| Smartphone | 408 | 80.2% |
| Tablet | 289 | 56.8% |
| No Computing Device | 51 | 10.0% |
| Total | 509 | 100.0% |
Internet Access in Kenmare
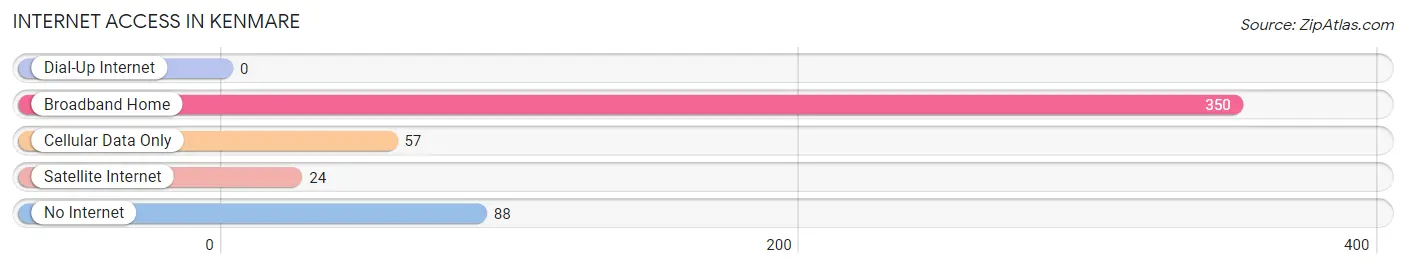
| Internet Type | # Households | % Households |
| Dial-Up Internet | 0 | 0.0% |
| Broadband Home | 350 | 68.8% |
| Cellular Data Only | 57 | 11.2% |
| Satellite Internet | 24 | 4.7% |
| No Internet | 88 | 17.3% |
| Total | 509 | 100.0% |
Kenmare Summary
Kenmare, North Dakota is a small city located in Ward County, in the north-central part of the state. It is situated on the banks of the Souris River, and is the county seat of Ward County. The city has a population of 1,845 people, according to the 2010 census.
Kenmare was founded in 1902, when the Great Northern Railway was built through the area. The city was named after Kenmare, Ireland, and was incorporated in 1906. The city was originally a farming and ranching community, but has since become a center for oil and gas production.
Geography
Kenmare is located in the north-central part of North Dakota, in Ward County. It is situated on the banks of the Souris River, and is the county seat of Ward County. The city is located at the intersection of U.S. Highway 52 and North Dakota Highway 23. The city is located approximately 75 miles northwest of Minot, and about 150 miles northeast of Bismarck.
The city has a total area of 1.2 square miles, all of which is land. The city is located in a flat, open area, with rolling hills to the north and east. The climate is semi-arid, with cold winters and hot summers.
Economy
Kenmare's economy is largely based on oil and gas production. The city is home to several oil and gas companies, including Continental Resources, Hess Corporation, and Marathon Oil. The city is also home to several manufacturing companies, including a plastics plant and a food processing plant.
The city is also home to several retail stores, including a grocery store, a hardware store, and a variety of other shops. The city also has a hospital, a library, and a post office.
Demographics
According to the 2010 census, Kenmare has a population of 1,845 people. The racial makeup of the city is 97.3% White, 0.3% African American, 0.2% Native American, 0.2% Asian, 0.1% Pacific Islander, 0.7% from other races, and 1.2% from two or more races. Hispanic or Latino of any race were 1.7% of the population.
The median income for a household in the city was $37,917, and the median income for a family was $45,000. The per capita income for the city was $18,945. About 11.2% of families and 14.2% of the population were below the poverty line, including 17.2% of those under age 18 and 8.3% of those age 65 or over.
Conclusion
Kenmare, North Dakota is a small city located in Ward County, in the north-central part of the state. It is situated on the banks of the Souris River, and is the county seat of Ward County. The city has a population of 1,845 people, according to the 2010 census. The city's economy is largely based on oil and gas production, and the city is home to several manufacturing companies, retail stores, a hospital, a library, and a post office. The racial makeup of the city is 97.3% White, 0.3% African American, 0.2% Native American, 0.2% Asian, 0.1% Pacific Islander, 0.7% from other races, and 1.2% from two or more races. The median income for a household in the city was $37,917, and the median income for a family was $45,000.
Common Questions
What is Per Capita Income in Kenmare?
Per Capita income in Kenmare is $37,694.
What is the Median Family Income in Kenmare?
Median Family Income in Kenmare is $84,417.
What is the Median Household income in Kenmare?
Median Household Income in Kenmare is $59,063.
What is Income or Wage Gap in Kenmare?
Income or Wage Gap in Kenmare is 44.6%.
Women in Kenmare earn 55.4 cents for every dollar earned by a man.
What is Inequality or Gini Index in Kenmare?
Inequality or Gini Index in Kenmare is 0.39.
What is the Total Population of Kenmare?
Total Population of Kenmare is 1,016.
What is the Total Male Population of Kenmare?
Total Male Population of Kenmare is 485.
What is the Total Female Population of Kenmare?
Total Female Population of Kenmare is 531.
What is the Ratio of Males per 100 Females in Kenmare?
There are 91.34 Males per 100 Females in Kenmare.
What is the Ratio of Females per 100 Males in Kenmare?
There are 109.48 Females per 100 Males in Kenmare.
What is the Median Population Age in Kenmare?
Median Population Age in Kenmare is 51.0 Years.
What is the Average Family Size in Kenmare
Average Family Size in Kenmare is 2.6 People.
What is the Average Household Size in Kenmare
Average Household Size in Kenmare is 1.9 People.
How Large is the Labor Force in Kenmare?
There are 540 People in the Labor Forcein in Kenmare.
What is the Percentage of People in the Labor Force in Kenmare?
62.4% of People are in the Labor Force in Kenmare.
What is the Unemployment Rate in Kenmare?
Unemployment Rate in Kenmare is 2.0%.