Noonan, ND Map & Demographics
Noonan Map
Noonan Overview
$42,927
PER CAPITA INCOME
$61,528
AVG HOUSEHOLD INCOME
0.38
INEQUALITY / GINI INDEX
142
TOTAL POPULATION
70
MALE POPULATION
72
FEMALE POPULATION
97.22
MALES / 100 FEMALES
102.86
FEMALES / 100 MALES
53.3
MEDIAN AGE
2.4
AVG FAMILY SIZE
2.0
AVG HOUSEHOLD SIZE
73
LABOR FORCE [ PEOPLE ]
60.3%
PERCENT IN LABOR FORCE
15.1%
UNEMPLOYMENT RATE
Noonan Zip Codes
Noonan Area Codes
Income in Noonan
Income Overview in Noonan
| Characteristic | Number | Measure |
| Per Capita Income | 142 | $42,927 |
| Median Family Income | 40 | $0 |
| Mean Family Income | 40 | $76,893 |
| Median Household Income | 71 | $61,528 |
| Mean Household Income | 71 | $79,304 |
| Income Deficit | 40 | $0 |
| Wage / Income Gap (%) | 142 | 0.00% |
| Wage / Income Gap ($) | 142 | 100.00¢ per $1 |
| Gini / Inequality Index | 142 | 0.38 |
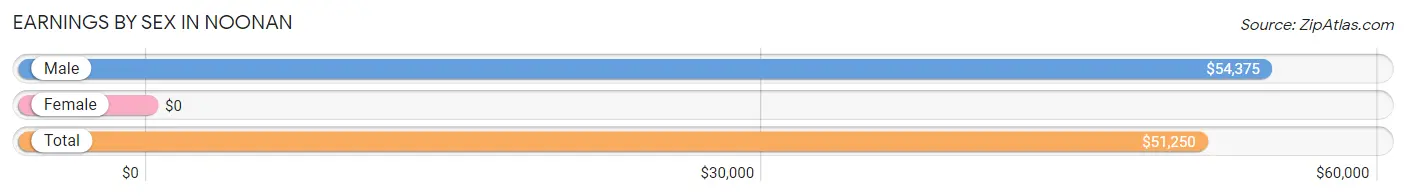
Earnings by Sex in Noonan
| Sex | Number | Average Earnings |
| Male | 49 (57.7%) | $54,375 |
| Female | 36 (42.3%) | $0 |
| Total | 85 (100.0%) | $51,250 |
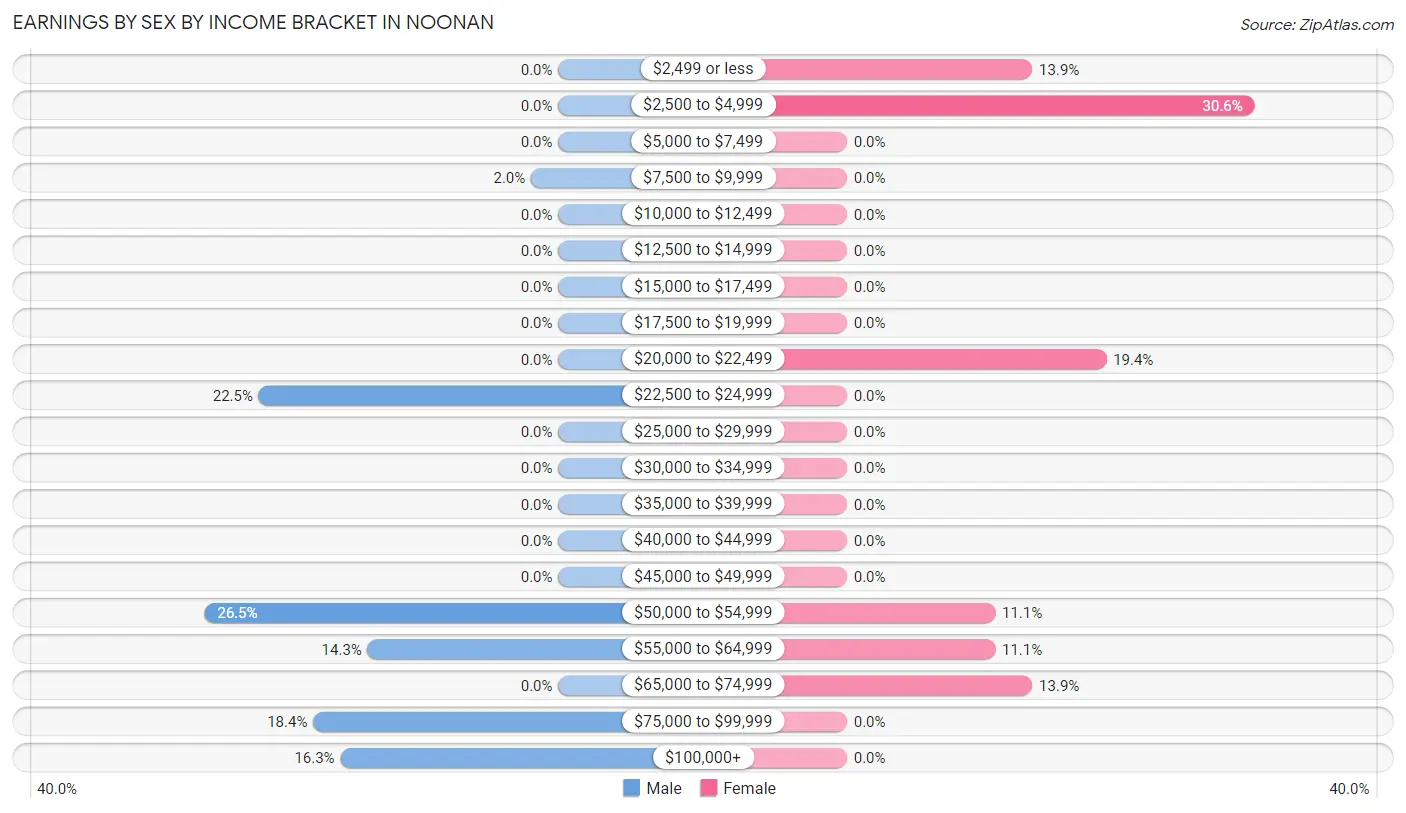
Earnings by Sex by Income Bracket in Noonan
The most common earnings brackets in Noonan are $50,000 to $54,999 for men (13 | 26.5%) and $2,500 to $4,999 for women (11 | 30.6%).
| Income | Male | Female |
| $2,499 or less | 0 (0.0%) | 5 (13.9%) |
| $2,500 to $4,999 | 0 (0.0%) | 11 (30.6%) |
| $5,000 to $7,499 | 0 (0.0%) | 0 (0.0%) |
| $7,500 to $9,999 | 1 (2.0%) | 0 (0.0%) |
| $10,000 to $12,499 | 0 (0.0%) | 0 (0.0%) |
| $12,500 to $14,999 | 0 (0.0%) | 0 (0.0%) |
| $15,000 to $17,499 | 0 (0.0%) | 0 (0.0%) |
| $17,500 to $19,999 | 0 (0.0%) | 0 (0.0%) |
| $20,000 to $22,499 | 0 (0.0%) | 7 (19.4%) |
| $22,500 to $24,999 | 11 (22.5%) | 0 (0.0%) |
| $25,000 to $29,999 | 0 (0.0%) | 0 (0.0%) |
| $30,000 to $34,999 | 0 (0.0%) | 0 (0.0%) |
| $35,000 to $39,999 | 0 (0.0%) | 0 (0.0%) |
| $40,000 to $44,999 | 0 (0.0%) | 0 (0.0%) |
| $45,000 to $49,999 | 0 (0.0%) | 0 (0.0%) |
| $50,000 to $54,999 | 13 (26.5%) | 4 (11.1%) |
| $55,000 to $64,999 | 7 (14.3%) | 4 (11.1%) |
| $65,000 to $74,999 | 0 (0.0%) | 5 (13.9%) |
| $75,000 to $99,999 | 9 (18.4%) | 0 (0.0%) |
| $100,000+ | 8 (16.3%) | 0 (0.0%) |
| Total | 49 (100.0%) | 36 (100.0%) |
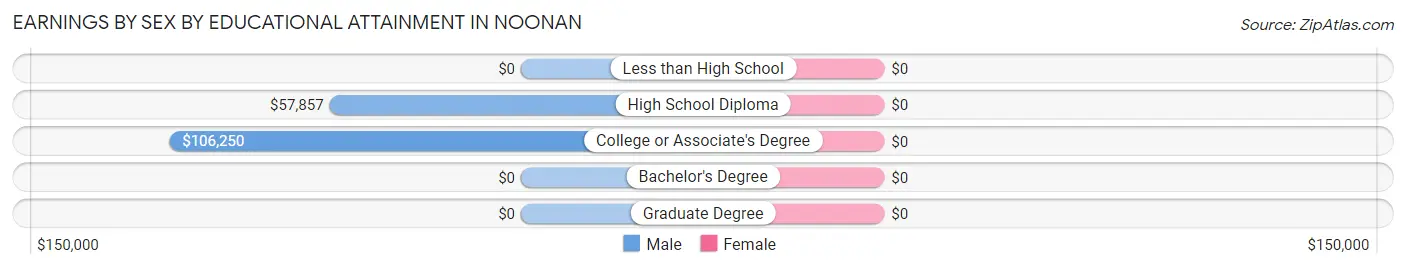
Earnings by Sex by Educational Attainment in Noonan
| Educational Attainment | Male Income | Female Income |
| Less than High School | - | - |
| High School Diploma | $57,857 | $0 |
| College or Associate's Degree | $106,250 | $0 |
| Bachelor's Degree | - | - |
| Graduate Degree | - | - |
| Total | $54,375 | $0 |
Family Income in Noonan
Family Income Brackets in Noonan
According to the Noonan family income data, there are 16 families falling into the less than $10,000 income range, which is the most common income bracket and makes up 40.0% of all families.
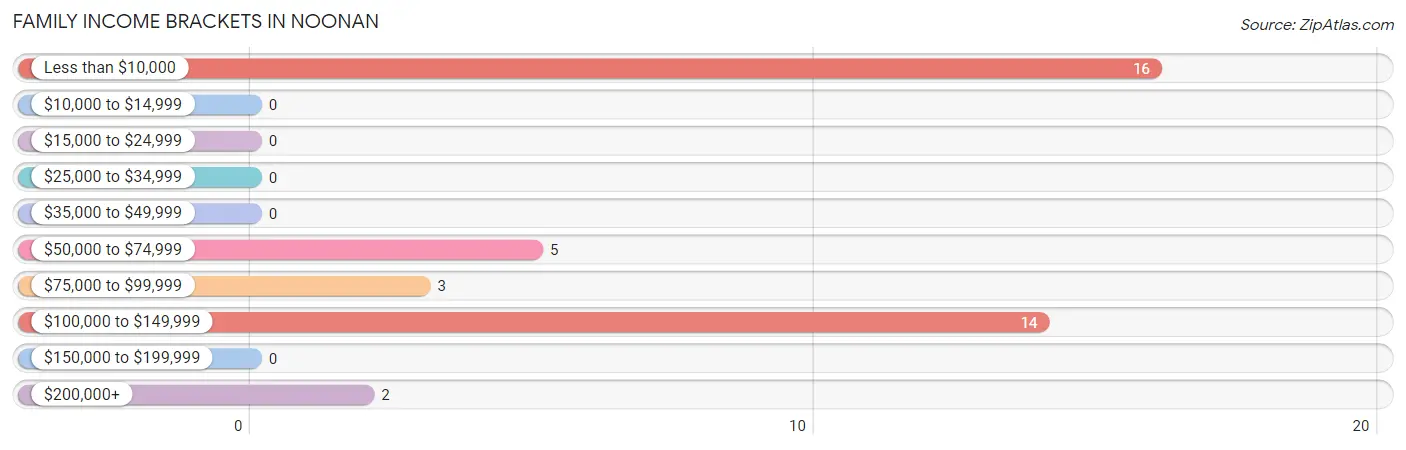
| Income Bracket | # Families | % Families |
| Less than $10,000 | 16 | 40.0% |
| $10,000 to $14,999 | 0 | 0.0% |
| $15,000 to $24,999 | 0 | 0.0% |
| $25,000 to $34,999 | 0 | 0.0% |
| $35,000 to $49,999 | 0 | 0.0% |
| $50,000 to $74,999 | 5 | 12.5% |
| $75,000 to $99,999 | 3 | 7.5% |
| $100,000 to $149,999 | 14 | 35.0% |
| $150,000 to $199,999 | 0 | 0.0% |
| $200,000+ | 2 | 5.0% |
Family Income by Famaliy Size in Noonan
| Income Bracket | # Families | Median Income |
| 2-Person Families | 37 (92.5%) | $0 |
| 3-Person Families | 0 (0.0%) | $0 |
| 4-Person Families | 3 (7.5%) | $0 |
| 5-Person Families | 0 (0.0%) | $0 |
| 6-Person Families | 0 (0.0%) | $0 |
| 7+ Person Families | 0 (0.0%) | $0 |
| Total | 40 (100.0%) | $0 |
Family Income by Number of Earners in Noonan
| Number of Earners | # Families | Median Income |
| No Earners | 7 (17.5%) | $0 |
| 1 Earner | 26 (65.0%) | $0 |
| 2 Earners | 7 (17.5%) | $0 |
| 3+ Earners | 0 (0.0%) | $0 |
| Total | 40 (100.0%) | $0 |
Household Income in Noonan
Household Income Brackets in Noonan
With 20 households falling in the category, the $100,000 to $149,999 income range is the most frequent in Noonan, accounting for 28.2% of all households.
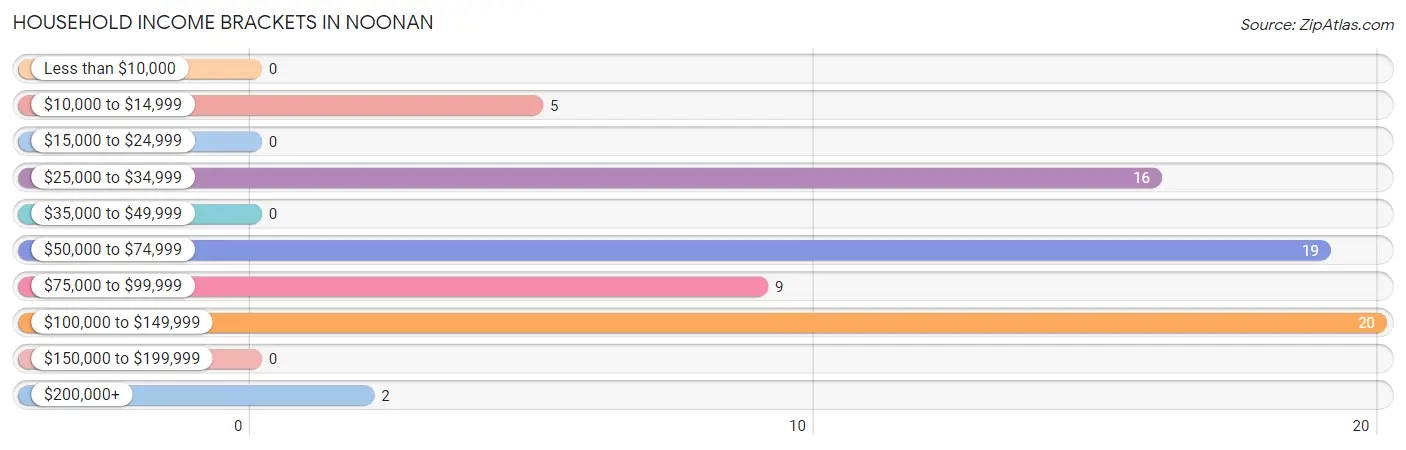
| Income Bracket | # Households | % Households |
| Less than $10,000 | 0 | 0.0% |
| $10,000 to $14,999 | 5 | 7.0% |
| $15,000 to $24,999 | 0 | 0.0% |
| $25,000 to $34,999 | 16 | 22.5% |
| $35,000 to $49,999 | 0 | 0.0% |
| $50,000 to $74,999 | 19 | 26.8% |
| $75,000 to $99,999 | 9 | 12.7% |
| $100,000 to $149,999 | 20 | 28.2% |
| $150,000 to $199,999 | 0 | 0.0% |
| $200,000+ | 2 | 2.8% |
Household Income by Householder Age in Noonan
The median household income in Noonan is $61,528, with the highest median household income of $116,875 found in the 45 to 64 years age bracket for the primary householder. A total of 24 households (33.8%) fall into this category.
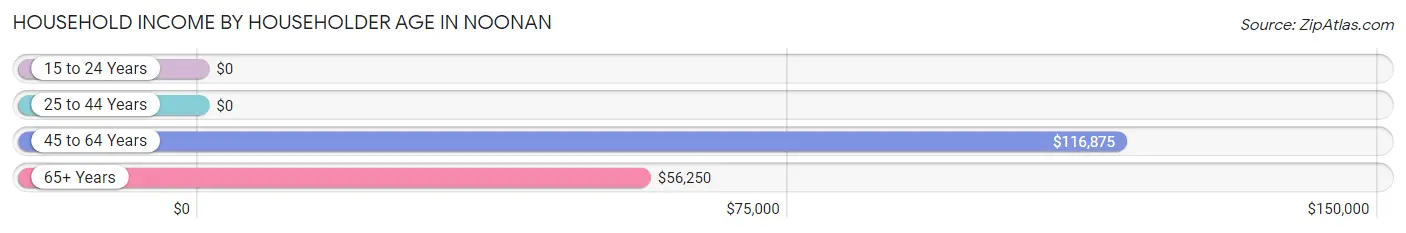
| Income Bracket | # Households | Median Income |
| 15 to 24 Years | 0 (0.0%) | $0 |
| 25 to 44 Years | 20 (28.2%) | $0 |
| 45 to 64 Years | 24 (33.8%) | $116,875 |
| 65+ Years | 27 (38.0%) | $56,250 |
| Total | 71 (100.0%) | $61,528 |
Poverty in Noonan
Income Below Poverty by Sex and Age in Noonan
With 11.4% poverty level for males and 29.2% for females among the residents of Noonan, under 5 year old males and under 5 year old females are the most vulnerable to poverty, with 8 males (100.0%) and 5 females (100.0%) in their respective age groups living below the poverty level.
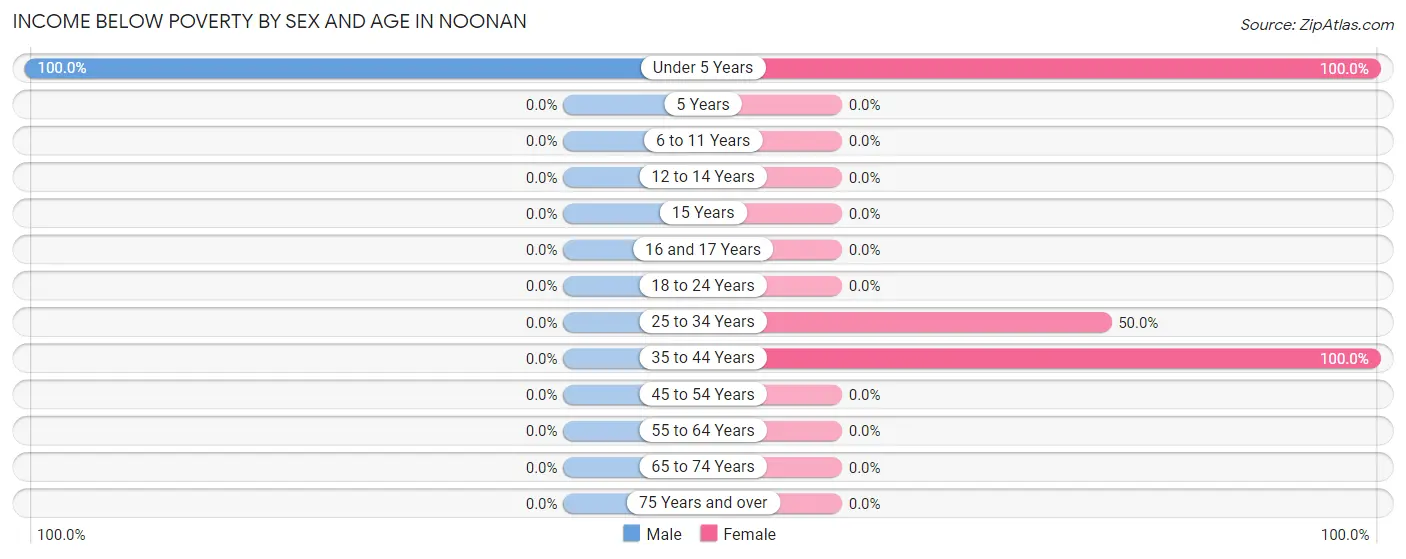
| Age Bracket | Male | Female |
| Under 5 Years | 8 (100.0%) | 5 (100.0%) |
| 5 Years | 0 (0.0%) | 0 (0.0%) |
| 6 to 11 Years | 0 (0.0%) | 0 (0.0%) |
| 12 to 14 Years | 0 (0.0%) | 0 (0.0%) |
| 15 Years | 0 (0.0%) | 0 (0.0%) |
| 16 and 17 Years | 0 (0.0%) | 0 (0.0%) |
| 18 to 24 Years | 0 (0.0%) | 0 (0.0%) |
| 25 to 34 Years | 0 (0.0%) | 5 (50.0%) |
| 35 to 44 Years | 0 (0.0%) | 11 (100.0%) |
| 45 to 54 Years | 0 (0.0%) | 0 (0.0%) |
| 55 to 64 Years | 0 (0.0%) | 0 (0.0%) |
| 65 to 74 Years | 0 (0.0%) | 0 (0.0%) |
| 75 Years and over | 0 (0.0%) | 0 (0.0%) |
| Total | 8 (11.4%) | 21 (29.2%) |
Income Above Poverty by Sex and Age in Noonan
According to the poverty statistics in Noonan, males aged 6 to 11 years and females aged 6 to 11 years are the age groups that are most secure financially, with 100.0% of males and 100.0% of females in these age groups living above the poverty line.
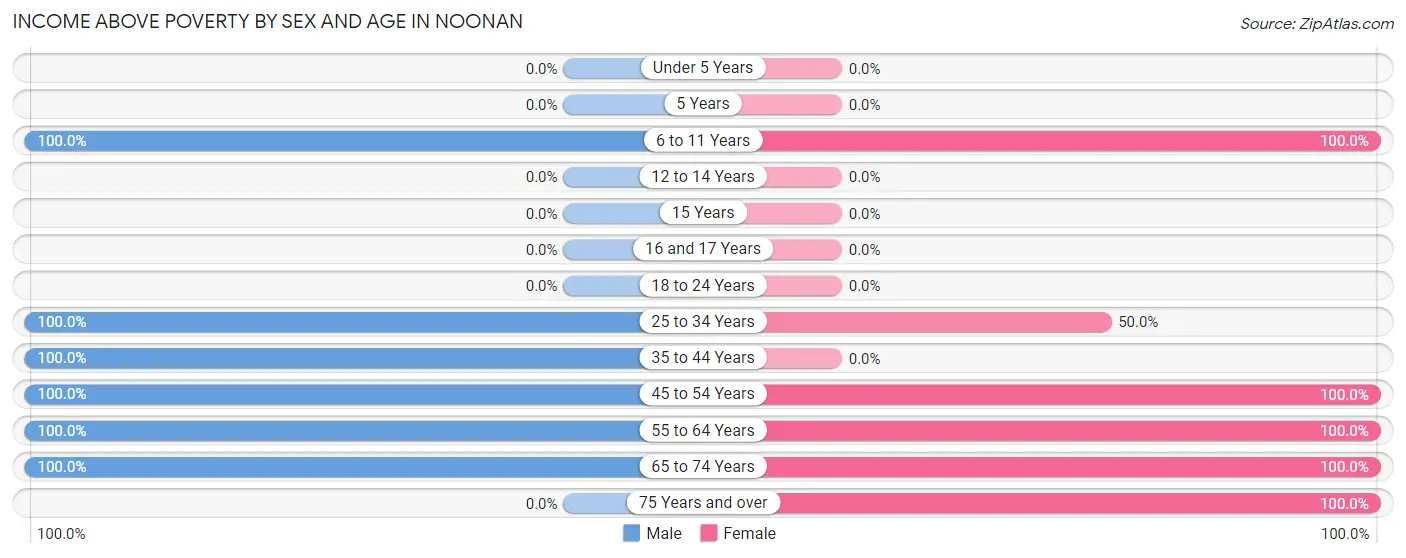
| Age Bracket | Male | Female |
| Under 5 Years | 0 (0.0%) | 0 (0.0%) |
| 5 Years | 0 (0.0%) | 0 (0.0%) |
| 6 to 11 Years | 4 (100.0%) | 4 (100.0%) |
| 12 to 14 Years | 0 (0.0%) | 0 (0.0%) |
| 15 Years | 0 (0.0%) | 0 (0.0%) |
| 16 and 17 Years | 0 (0.0%) | 0 (0.0%) |
| 18 to 24 Years | 0 (0.0%) | 0 (0.0%) |
| 25 to 34 Years | 11 (100.0%) | 5 (50.0%) |
| 35 to 44 Years | 4 (100.0%) | 0 (0.0%) |
| 45 to 54 Years | 13 (100.0%) | 4 (100.0%) |
| 55 to 64 Years | 20 (100.0%) | 13 (100.0%) |
| 65 to 74 Years | 10 (100.0%) | 15 (100.0%) |
| 75 Years and over | 0 (0.0%) | 10 (100.0%) |
| Total | 62 (88.6%) | 51 (70.8%) |
Income Below Poverty Among Married-Couple Families in Noonan
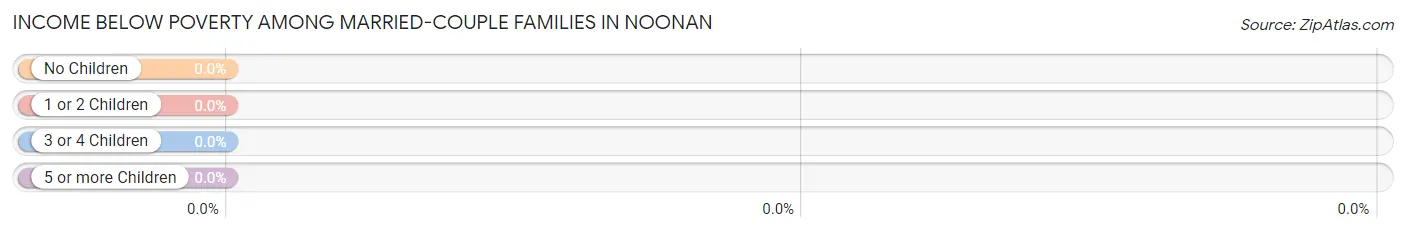
| Children | Above Poverty | Below Poverty |
| No Children | 21 (100.0%) | 0 (0.0%) |
| 1 or 2 Children | 3 (100.0%) | 0 (0.0%) |
| 3 or 4 Children | 0 (0.0%) | 0 (0.0%) |
| 5 or more Children | 0 (0.0%) | 0 (0.0%) |
| Total | 24 (100.0%) | 0 (0.0%) |
Income Below Poverty Among Single-Parent Households in Noonan
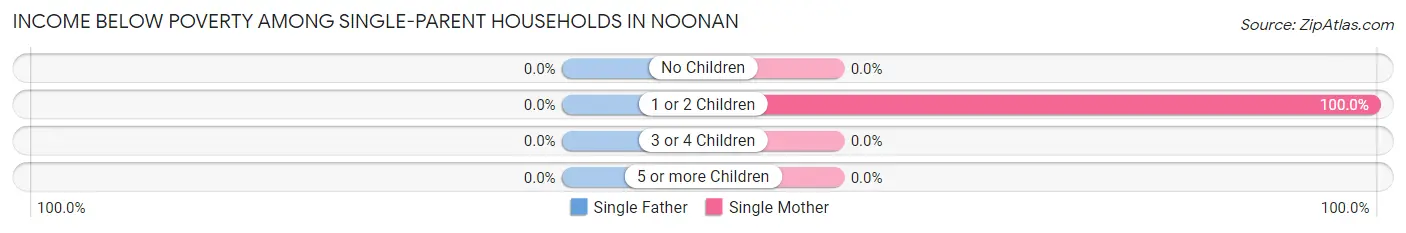
| Children | Single Father | Single Mother |
| No Children | 0 (0.0%) | 0 (0.0%) |
| 1 or 2 Children | 0 (0.0%) | 16 (100.0%) |
| 3 or 4 Children | 0 (0.0%) | 0 (0.0%) |
| 5 or more Children | 0 (0.0%) | 0 (0.0%) |
| Total | 0 (0.0%) | 16 (100.0%) |
Income Below Poverty Among Married-Couple vs Single-Parent Households in Noonan
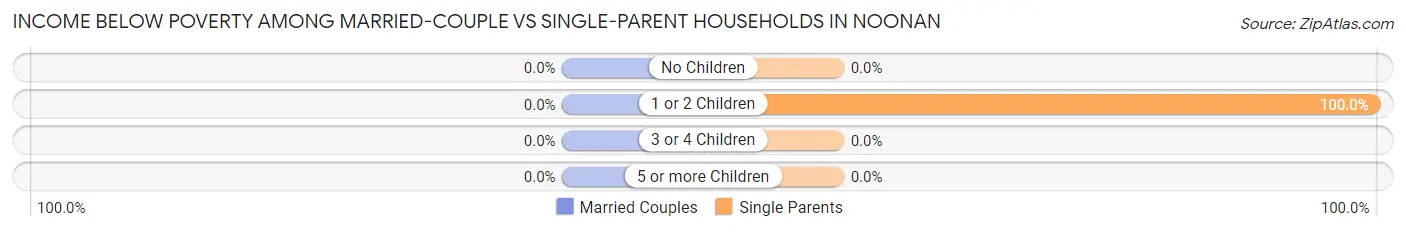
| Children | Married-Couple Families | Single-Parent Households |
| No Children | 0 (0.0%) | 0 (0.0%) |
| 1 or 2 Children | 0 (0.0%) | 16 (100.0%) |
| 3 or 4 Children | 0 (0.0%) | 0 (0.0%) |
| 5 or more Children | 0 (0.0%) | 0 (0.0%) |
| Total | 0 (0.0%) | 16 (100.0%) |
Race in Noonan
The most populous races in Noonan are White / Caucasian (119 | 83.8%), Two or more Races (19 | 13.4%), and Asian (4 | 2.8%).
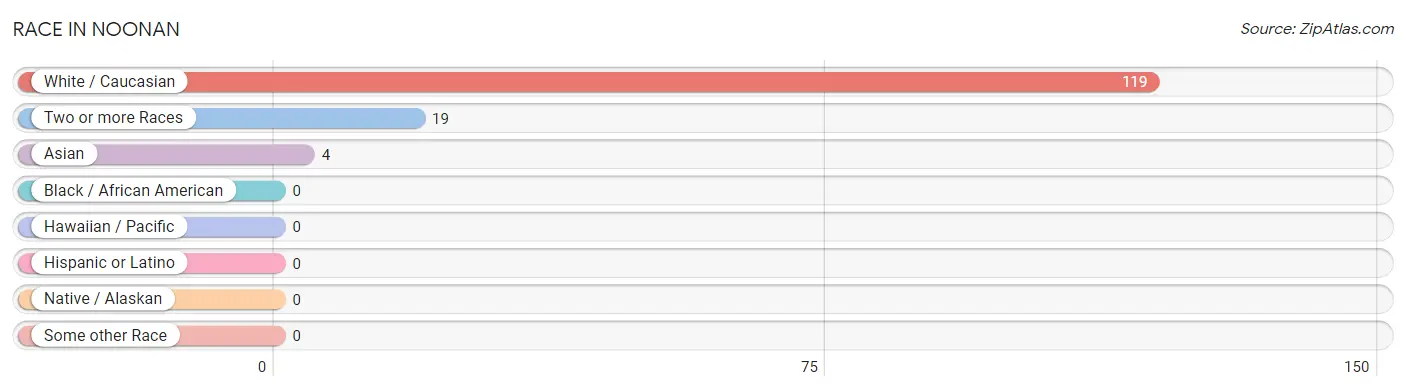
| Race | # Population | % Population |
| Asian | 4 | 2.8% |
| Black / African American | 0 | 0.0% |
| Hawaiian / Pacific | 0 | 0.0% |
| Hispanic or Latino | 0 | 0.0% |
| Native / Alaskan | 0 | 0.0% |
| White / Caucasian | 119 | 83.8% |
| Two or more Races | 19 | 13.4% |
| Some other Race | 0 | 0.0% |
| Total | 142 | 100.0% |
Ancestry in Noonan
The most populous ancestries reported in Noonan are German (50 | 35.2%), Norwegian (50 | 35.2%), Irish (27 | 19.0%), Chippewa (13 | 9.1%), and Belgian (9 | 6.3%), together accounting for 104.9% of all Noonan residents.
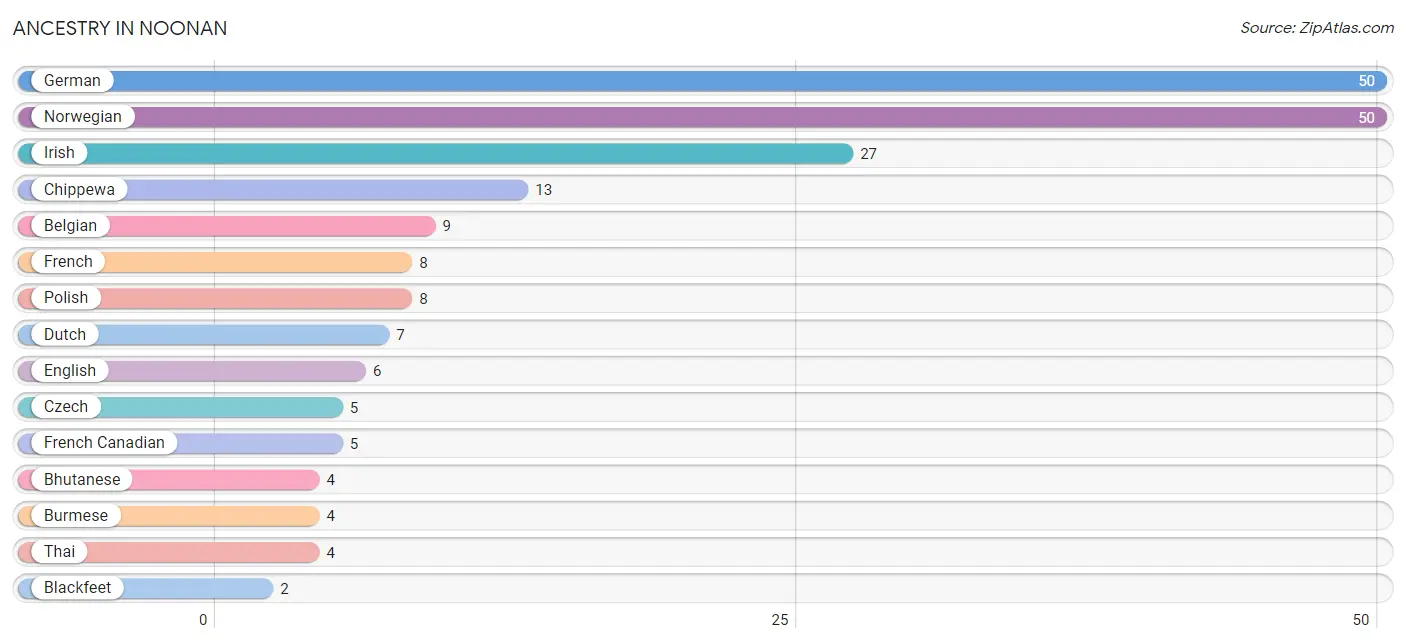
| Ancestry | # Population | % Population |
| Belgian | 9 | 6.3% |
| Bhutanese | 4 | 2.8% |
| Blackfeet | 2 | 1.4% |
| Burmese | 4 | 2.8% |
| Chippewa | 13 | 9.1% |
| Czech | 5 | 3.5% |
| Dutch | 7 | 4.9% |
| English | 6 | 4.2% |
| European | 2 | 1.4% |
| French | 8 | 5.6% |
| French Canadian | 5 | 3.5% |
| German | 50 | 35.2% |
| Irish | 27 | 19.0% |
| Norwegian | 50 | 35.2% |
| Polish | 8 | 5.6% |
| Thai | 4 | 2.8% | View All 16 Rows |
Immigrants in Noonan
The most numerous immigrant groups reported in Noonan came from , and Canada (5 | 3.5%), together accounting for 3.5% of all Noonan residents.

| Immigration Origin | # Population | % Population |
| Canada | 5 | 3.5% | View All 1 Rows |
Sex and Age in Noonan
Sex and Age in Noonan
The most populous age groups in Noonan are 60 to 64 Years (18 | 25.7%) for men and 60 to 64 Years (12 | 16.7%) for women.
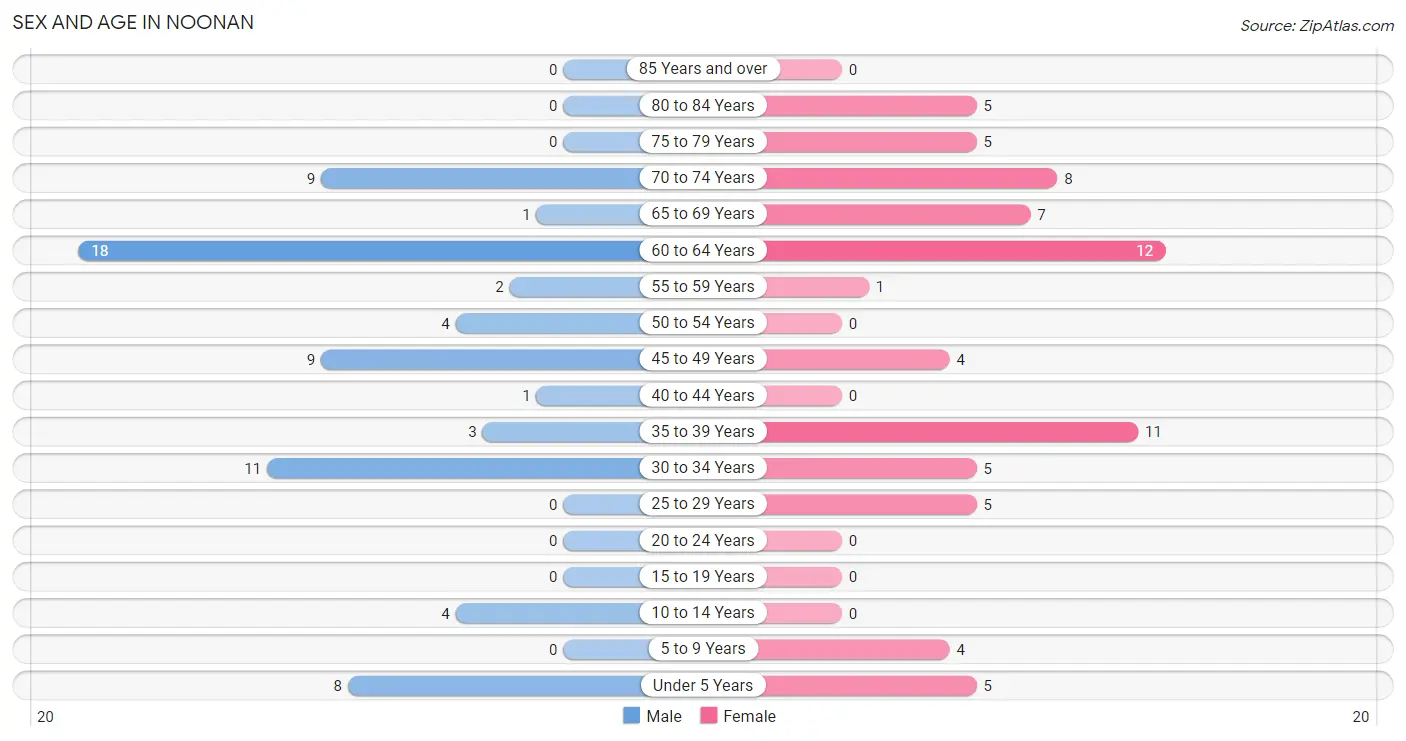
| Age Bracket | Male | Female |
| Under 5 Years | 8 (11.4%) | 5 (6.9%) |
| 5 to 9 Years | 0 (0.0%) | 4 (5.6%) |
| 10 to 14 Years | 4 (5.7%) | 0 (0.0%) |
| 15 to 19 Years | 0 (0.0%) | 0 (0.0%) |
| 20 to 24 Years | 0 (0.0%) | 0 (0.0%) |
| 25 to 29 Years | 0 (0.0%) | 5 (6.9%) |
| 30 to 34 Years | 11 (15.7%) | 5 (6.9%) |
| 35 to 39 Years | 3 (4.3%) | 11 (15.3%) |
| 40 to 44 Years | 1 (1.4%) | 0 (0.0%) |
| 45 to 49 Years | 9 (12.9%) | 4 (5.6%) |
| 50 to 54 Years | 4 (5.7%) | 0 (0.0%) |
| 55 to 59 Years | 2 (2.9%) | 1 (1.4%) |
| 60 to 64 Years | 18 (25.7%) | 12 (16.7%) |
| 65 to 69 Years | 1 (1.4%) | 7 (9.7%) |
| 70 to 74 Years | 9 (12.9%) | 8 (11.1%) |
| 75 to 79 Years | 0 (0.0%) | 5 (6.9%) |
| 80 to 84 Years | 0 (0.0%) | 5 (6.9%) |
| 85 Years and over | 0 (0.0%) | 0 (0.0%) |
| Total | 70 (100.0%) | 72 (100.0%) |
Families and Households in Noonan
Median Family Size in Noonan
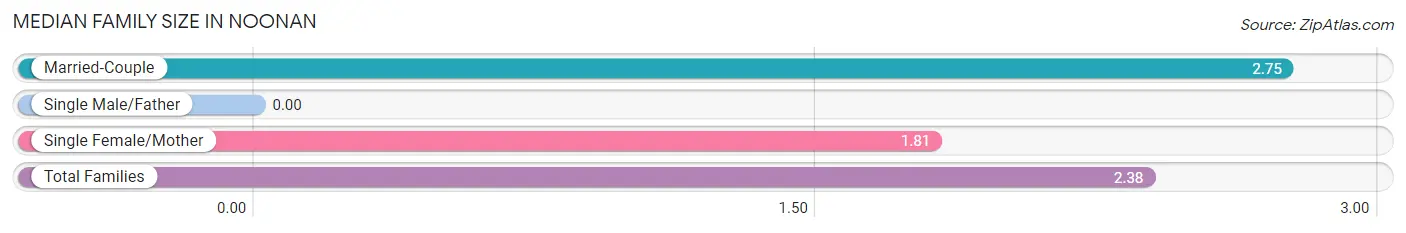
| Family Type | # Families | Family Size |
| Married-Couple | 24 (60.0%) | 2.75 |
| Single Male/Father | 0 (0.0%) | - |
| Single Female/Mother | 16 (40.0%) | 1.81 |
| Total Families | 40 (100.0%) | 2.38 |
Median Household Size in Noonan
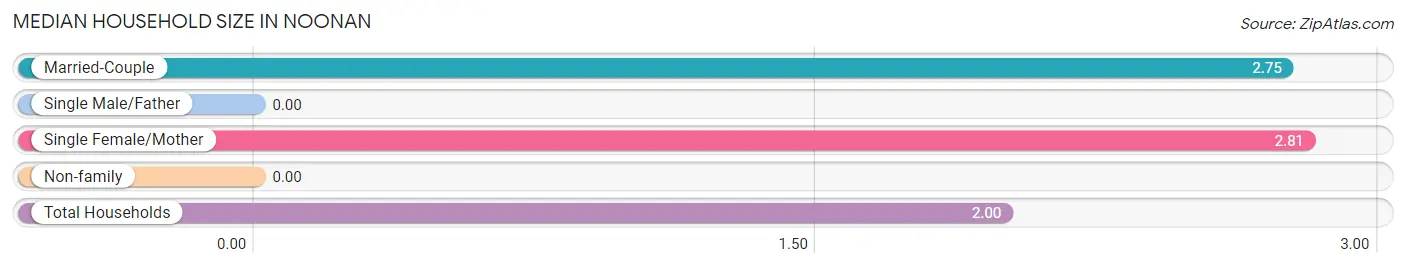
| Household Type | # Households | Household Size |
| Married-Couple | 24 (33.8%) | 2.75 |
| Single Male/Father | 0 (0.0%) | - |
| Single Female/Mother | 16 (22.5%) | 2.81 |
| Non-family | 31 (43.7%) | - |
| Total Households | 71 (100.0%) | 2.00 |
Household Size by Marriage Status in Noonan
Out of a total of 71 households in Noonan, 40 (56.3%) are family households, while 31 (43.7%) are nonfamily households. The most numerous type of family households are 2-person households, comprising 21, and the most common type of nonfamily households are 1-person households, comprising 31.
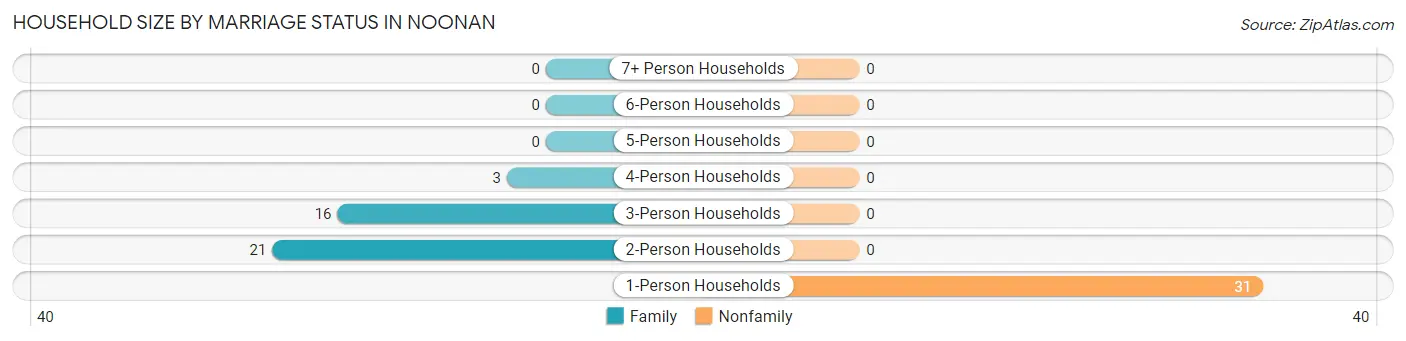
| Household Size | Family Households | Nonfamily Households |
| 1-Person Households | - | 31 (43.7%) |
| 2-Person Households | 21 (29.6%) | 0 (0.0%) |
| 3-Person Households | 16 (22.5%) | 0 (0.0%) |
| 4-Person Households | 3 (4.2%) | 0 (0.0%) |
| 5-Person Households | 0 (0.0%) | 0 (0.0%) |
| 6-Person Households | 0 (0.0%) | 0 (0.0%) |
| 7+ Person Households | 0 (0.0%) | 0 (0.0%) |
| Total | 40 (56.3%) | 31 (43.7%) |
Female Fertility in Noonan
Fertility by Age in Noonan
| Age Bracket | Women with Births | Births / 1,000 Women |
| 15 to 19 years | 0 (0.0%) | 0.0 |
| 20 to 34 years | 0 (0.0%) | 0.0 |
| 35 to 50 years | 0 (0.0%) | 0.0 |
| Total | 0 (0.0%) | 0.0 |
Fertility by Age by Marriage Status in Noonan
| Age Bracket | Married | Unmarried |
| 15 to 19 years | 0 (0.0%) | 0 (0.0%) |
| 20 to 34 years | 0 (0.0%) | 0 (0.0%) |
| 35 to 50 years | 0 (0.0%) | 0 (0.0%) |
| Total | 0 (0.0%) | 0 (0.0%) |
Fertility by Education in Noonan
| Educational Attainment | Women with Births | Births / 1,000 Women |
| Less than High School | 0 (0.0%) | 0.0 |
| High School Diploma | 0 (0.0%) | 0.0 |
| College or Associate's Degree | 0 (0.0%) | 0.0 |
| Bachelor's Degree | 0 (0.0%) | 0.0 |
| Graduate Degree | 0 (0.0%) | 0.0 |
| Total | 0 (0.0%) | 0.0 |
Fertility by Education by Marriage Status in Noonan
| Educational Attainment | Married | Unmarried |
| Less than High School | 0 (0.0%) | 0 (0.0%) |
| High School Diploma | 0 (0.0%) | 0 (0.0%) |
| College or Associate's Degree | 0 (0.0%) | 0 (0.0%) |
| Bachelor's Degree | 0 (0.0%) | 0 (0.0%) |
| Graduate Degree | 0 (0.0%) | 0 (0.0%) |
| Total | 0 (0.0%) | 0 (0.0%) |
Employment Characteristics in Noonan
Employment by Class of Employer in Noonan
Among the 57 employed individuals in Noonan, private company employees (30 | 52.6%), self-employed (not incorporated) (9 | 15.8%), and not-for-profit organizations (8 | 14.0%) make up the most common classes of employment.
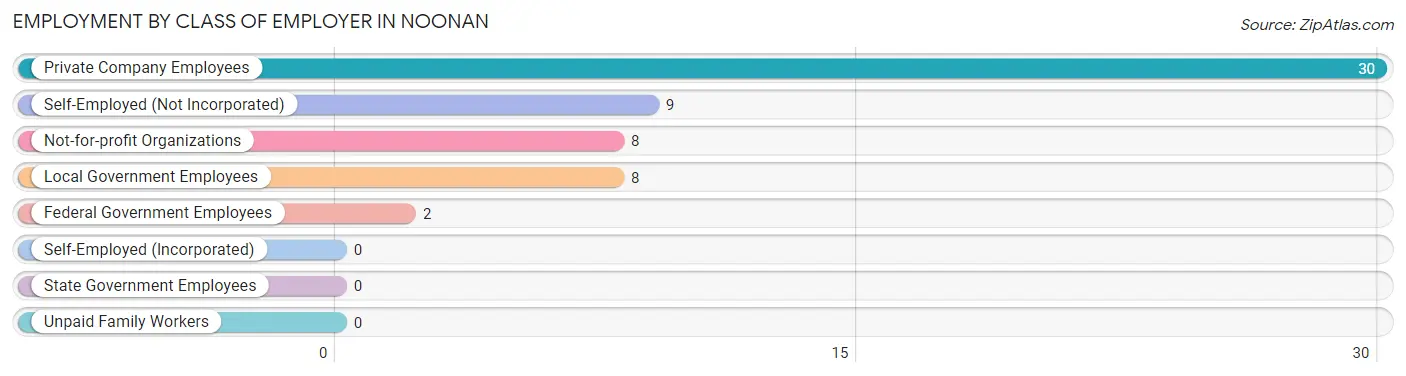
| Employer Class | # Employees | % Employees |
| Private Company Employees | 30 | 52.6% |
| Self-Employed (Incorporated) | 0 | 0.0% |
| Self-Employed (Not Incorporated) | 9 | 15.8% |
| Not-for-profit Organizations | 8 | 14.0% |
| Local Government Employees | 8 | 14.0% |
| State Government Employees | 0 | 0.0% |
| Federal Government Employees | 2 | 3.5% |
| Unpaid Family Workers | 0 | 0.0% |
| Total | 57 | 100.0% |
Employment Status by Age in Noonan
According to the labor force statistics for Noonan, out of the total population over 16 years of age (121), 60.3% or 73 individuals are in the labor force, with 15.1% or 11 of them unemployed. The age group with the highest labor force participation rate is 25 to 29 years, with 100.0% or 5 individuals in the labor force. Within the labor force, the 30 to 34 years age range has the highest percentage of unemployed individuals, with 100.0% or 11 of them being unemployed.
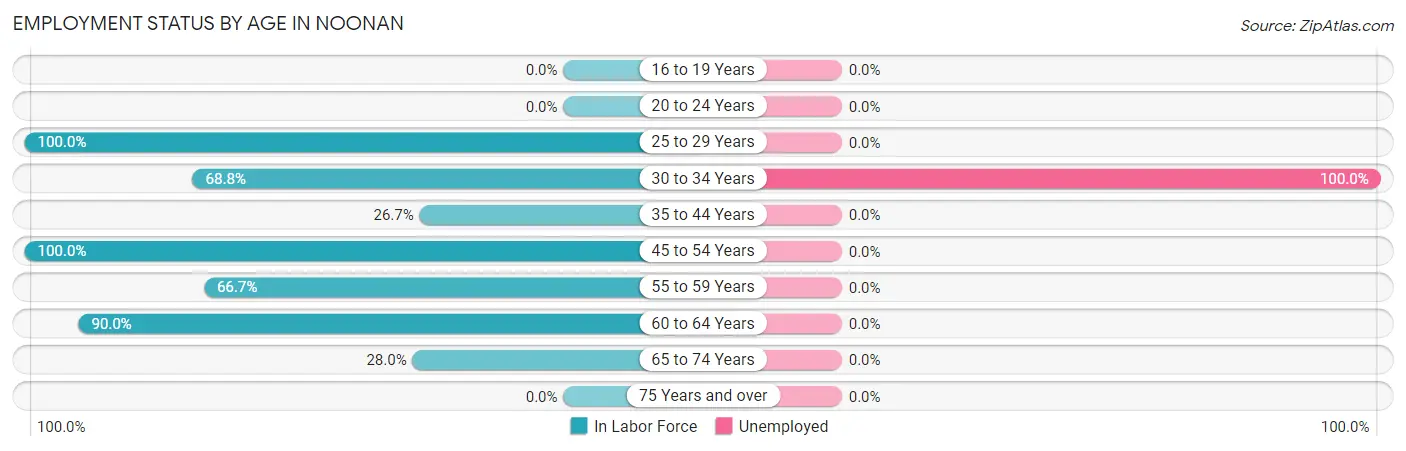
| Age Bracket | In Labor Force | Unemployed |
| 16 to 19 Years | 0 (0.0%) | 0 (0.0%) |
| 20 to 24 Years | 0 (0.0%) | 0 (0.0%) |
| 25 to 29 Years | 5 (100.0%) | 0 (0.0%) |
| 30 to 34 Years | 11 (68.8%) | 11 (100.0%) |
| 35 to 44 Years | 4 (26.7%) | 0 (0.0%) |
| 45 to 54 Years | 17 (100.0%) | 0 (0.0%) |
| 55 to 59 Years | 2 (66.7%) | 0 (0.0%) |
| 60 to 64 Years | 27 (90.0%) | 0 (0.0%) |
| 65 to 74 Years | 7 (28.0%) | 0 (0.0%) |
| 75 Years and over | 0 (0.0%) | 0 (0.0%) |
| Total | 73 (60.3%) | 11 (15.1%) |
Employment Status by Educational Attainment in Noonan
According to labor force statistics for Noonan, 76.7% of individuals (66) out of the total population between 25 and 64 years of age (86) are in the labor force, with 16.7% or 11 of them being unemployed. The group with the highest labor force participation rate are those with the educational attainment of college / associate degree, with 100.0% or 12 individuals in the labor force. Within the labor force, individuals with bachelor's degree or higher education have the highest percentage of unemployment, with 52.4% or 11 of them being unemployed.
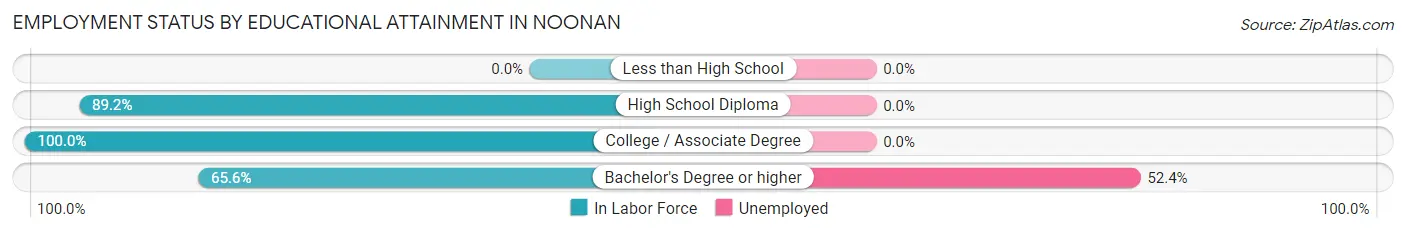
| Educational Attainment | In Labor Force | Unemployed |
| Less than High School | 0 (0.0%) | 0 (0.0%) |
| High School Diploma | 33 (89.2%) | 0 (0.0%) |
| College / Associate Degree | 12 (100.0%) | 0 (0.0%) |
| Bachelor's Degree or higher | 21 (65.6%) | 17 (52.4%) |
| Total | 66 (76.7%) | 14 (16.7%) |
Employment Occupations by Sex in Noonan
Management, Business, Science and Arts Occupations
The most common Management, Business, Science and Arts occupations in Noonan are Management (12 | 19.4%), Business & Financial (11 | 17.7%), Computers, Engineering & Science (2 | 3.2%), and Architecture & Engineering (2 | 3.2%).
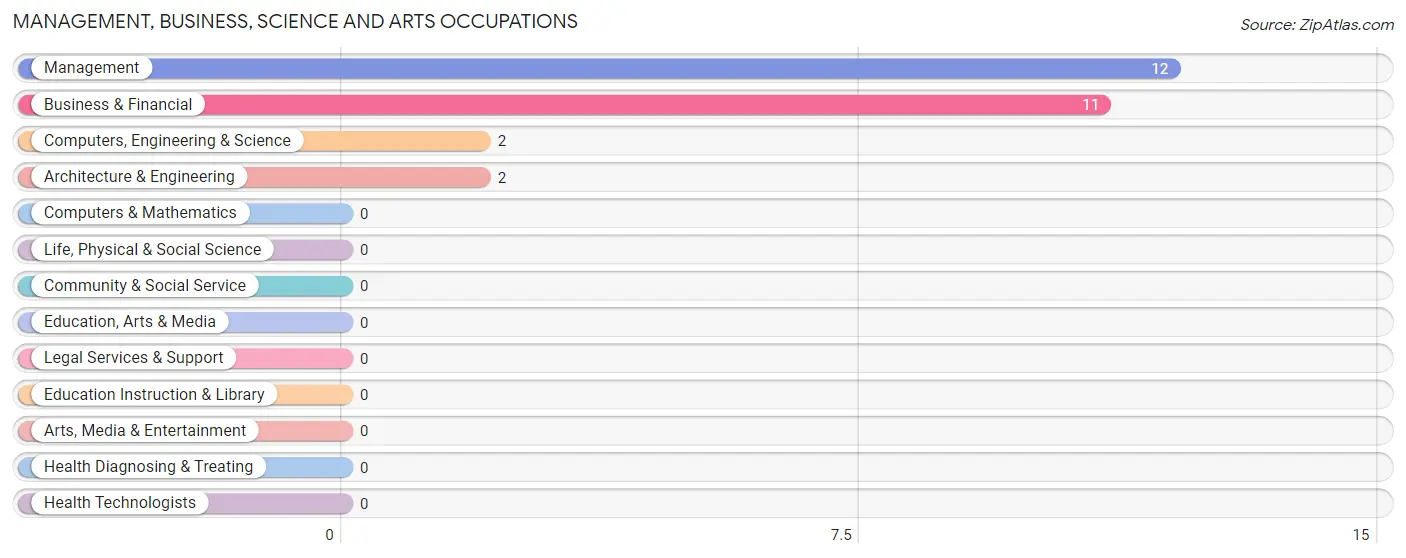
Management, Business, Science and Arts Occupations by Sex
Within the Management, Business, Science and Arts occupations in Noonan, the most male-oriented occupations are Computers, Engineering & Science (100.0%), Architecture & Engineering (100.0%), and Management (58.3%), while the most female-oriented occupations are Business & Financial (100.0%), and Management (41.7%).
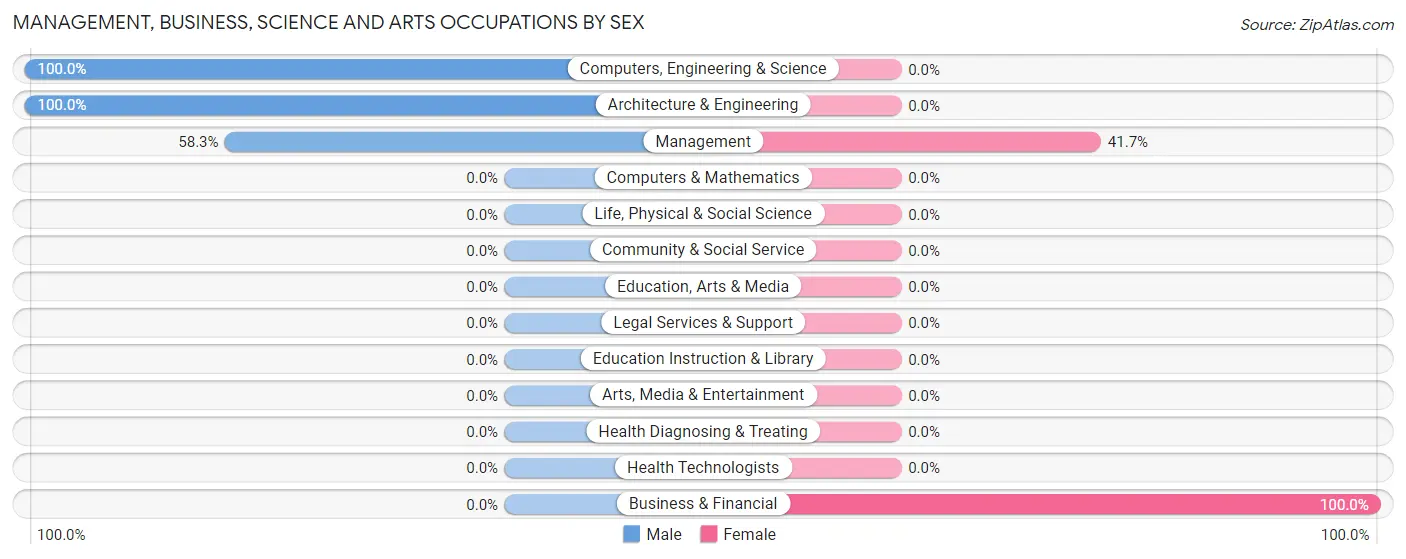
| Occupation | Male | Female |
| Management | 7 (58.3%) | 5 (41.7%) |
| Business & Financial | 0 (0.0%) | 11 (100.0%) |
| Computers, Engineering & Science | 2 (100.0%) | 0 (0.0%) |
| Computers & Mathematics | 0 (0.0%) | 0 (0.0%) |
| Architecture & Engineering | 2 (100.0%) | 0 (0.0%) |
| Life, Physical & Social Science | 0 (0.0%) | 0 (0.0%) |
| Community & Social Service | 0 (0.0%) | 0 (0.0%) |
| Education, Arts & Media | 0 (0.0%) | 0 (0.0%) |
| Legal Services & Support | 0 (0.0%) | 0 (0.0%) |
| Education Instruction & Library | 0 (0.0%) | 0 (0.0%) |
| Arts, Media & Entertainment | 0 (0.0%) | 0 (0.0%) |
| Health Diagnosing & Treating | 0 (0.0%) | 0 (0.0%) |
| Health Technologists | 0 (0.0%) | 0 (0.0%) |
| Total (Category) | 9 (36.0%) | 16 (64.0%) |
| Total (Overall) | 37 (59.7%) | 25 (40.3%) |
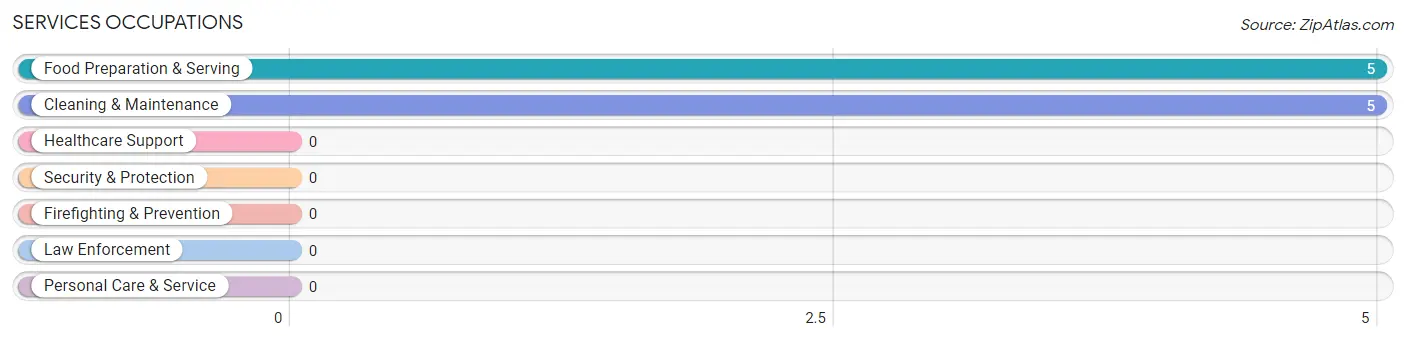
Services Occupations
The most common Services occupations in Noonan are Food Preparation & Serving (5 | 8.1%), and Cleaning & Maintenance (5 | 8.1%).
Services Occupations by Sex
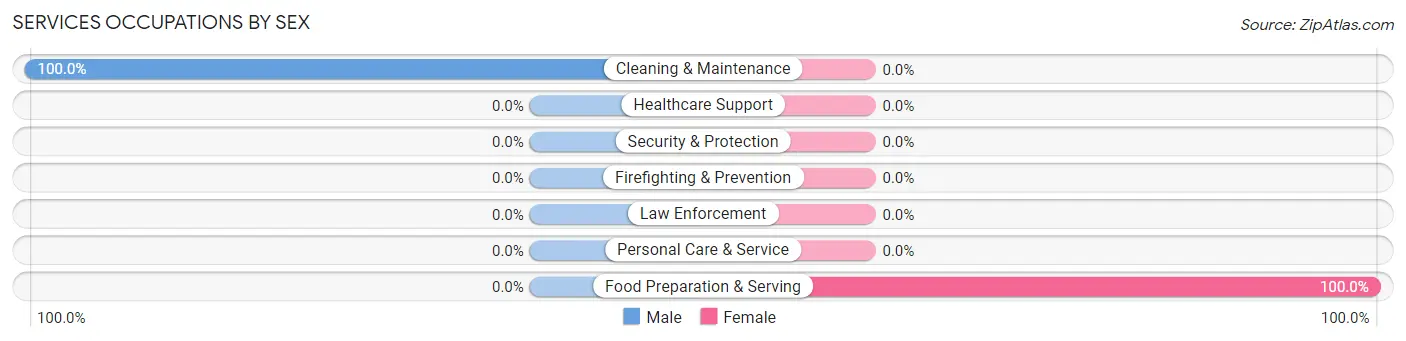
| Occupation | Male | Female |
| Healthcare Support | 0 (0.0%) | 0 (0.0%) |
| Security & Protection | 0 (0.0%) | 0 (0.0%) |
| Firefighting & Prevention | 0 (0.0%) | 0 (0.0%) |
| Law Enforcement | 0 (0.0%) | 0 (0.0%) |
| Food Preparation & Serving | 0 (0.0%) | 5 (100.0%) |
| Cleaning & Maintenance | 5 (100.0%) | 0 (0.0%) |
| Personal Care & Service | 0 (0.0%) | 0 (0.0%) |
| Total (Category) | 5 (50.0%) | 5 (50.0%) |
| Total (Overall) | 37 (59.7%) | 25 (40.3%) |
Sales and Office Occupations
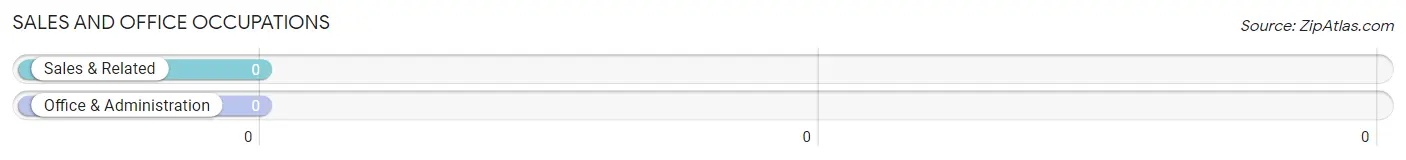
Sales and Office Occupations by Sex
| Occupation | Male | Female |
| Sales & Related | 0 (0.0%) | 0 (0.0%) |
| Office & Administration | 0 (0.0%) | 0 (0.0%) |
| Total (Category) | 0 (0.0%) | 0 (0.0%) |
| Total (Overall) | 37 (59.7%) | 25 (40.3%) |
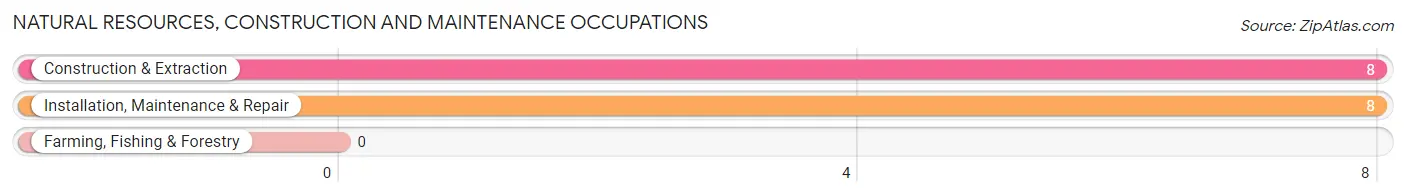
Natural Resources, Construction and Maintenance Occupations
The most common Natural Resources, Construction and Maintenance occupations in Noonan are Construction & Extraction (8 | 12.9%), and Installation, Maintenance & Repair (8 | 12.9%).
Natural Resources, Construction and Maintenance Occupations by Sex
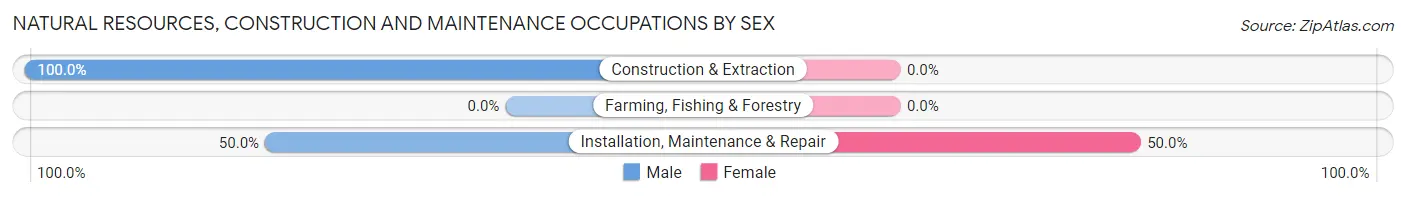
| Occupation | Male | Female |
| Farming, Fishing & Forestry | 0 (0.0%) | 0 (0.0%) |
| Construction & Extraction | 8 (100.0%) | 0 (0.0%) |
| Installation, Maintenance & Repair | 4 (50.0%) | 4 (50.0%) |
| Total (Category) | 12 (75.0%) | 4 (25.0%) |
| Total (Overall) | 37 (59.7%) | 25 (40.3%) |
Production, Transportation and Moving Occupations
The most common Production, Transportation and Moving occupations in Noonan are Material Moving (7 | 11.3%), Production (3 | 4.8%), and Transportation (1 | 1.6%).
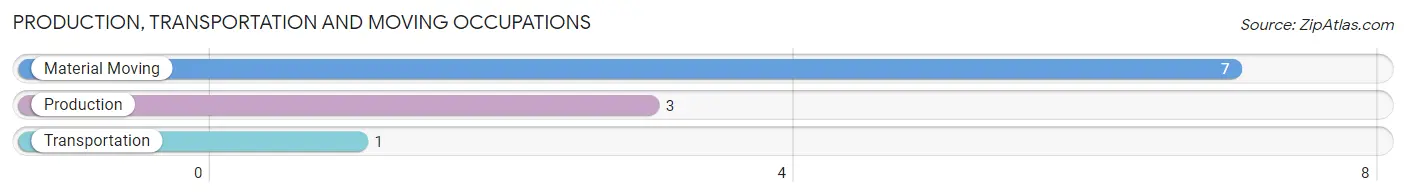
Production, Transportation and Moving Occupations by Sex
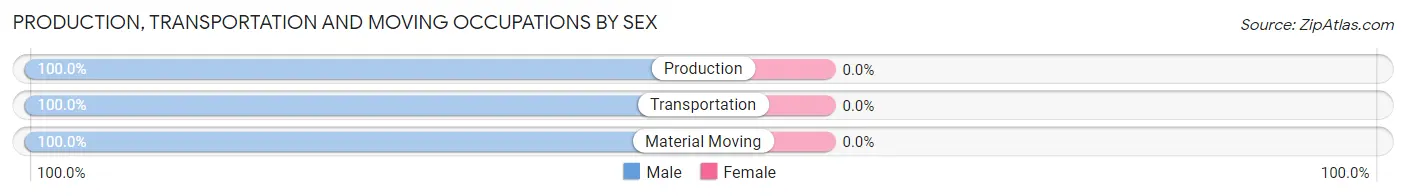
| Occupation | Male | Female |
| Production | 3 (100.0%) | 0 (0.0%) |
| Transportation | 1 (100.0%) | 0 (0.0%) |
| Material Moving | 7 (100.0%) | 0 (0.0%) |
| Total (Category) | 11 (100.0%) | 0 (0.0%) |
| Total (Overall) | 37 (59.7%) | 25 (40.3%) |
Employment Industries by Sex in Noonan
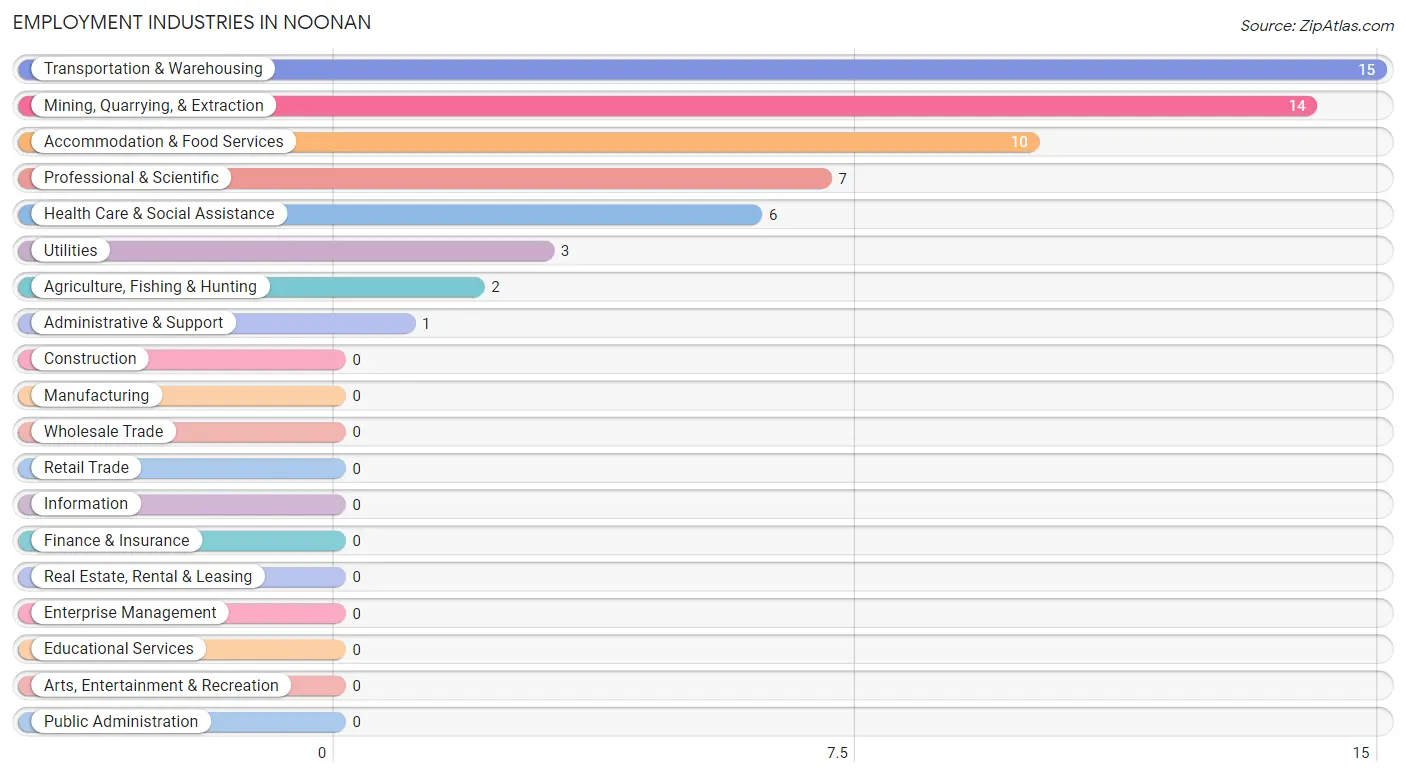
Employment Industries in Noonan
The major employment industries in Noonan include Transportation & Warehousing (15 | 24.2%), Mining, Quarrying, & Extraction (14 | 22.6%), Accommodation & Food Services (10 | 16.1%), Professional & Scientific (7 | 11.3%), and Health Care & Social Assistance (6 | 9.7%).
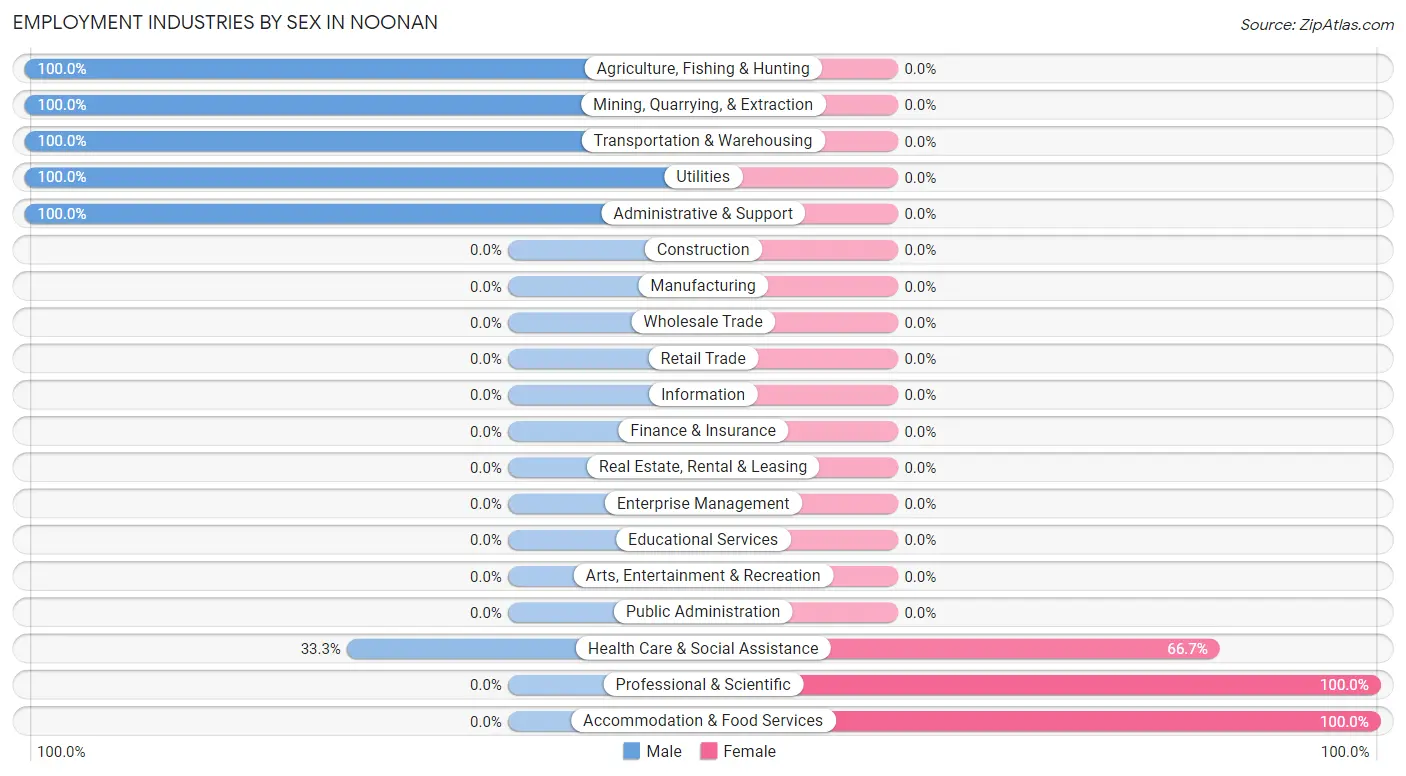
Employment Industries by Sex in Noonan
The Noonan industries that see more men than women are Agriculture, Fishing & Hunting (100.0%), Mining, Quarrying, & Extraction (100.0%), and Transportation & Warehousing (100.0%), whereas the industries that tend to have a higher number of women are Professional & Scientific (100.0%), Accommodation & Food Services (100.0%), and Health Care & Social Assistance (66.7%).
| Industry | Male | Female |
| Agriculture, Fishing & Hunting | 2 (100.0%) | 0 (0.0%) |
| Mining, Quarrying, & Extraction | 14 (100.0%) | 0 (0.0%) |
| Construction | 0 (0.0%) | 0 (0.0%) |
| Manufacturing | 0 (0.0%) | 0 (0.0%) |
| Wholesale Trade | 0 (0.0%) | 0 (0.0%) |
| Retail Trade | 0 (0.0%) | 0 (0.0%) |
| Transportation & Warehousing | 15 (100.0%) | 0 (0.0%) |
| Utilities | 3 (100.0%) | 0 (0.0%) |
| Information | 0 (0.0%) | 0 (0.0%) |
| Finance & Insurance | 0 (0.0%) | 0 (0.0%) |
| Real Estate, Rental & Leasing | 0 (0.0%) | 0 (0.0%) |
| Professional & Scientific | 0 (0.0%) | 7 (100.0%) |
| Enterprise Management | 0 (0.0%) | 0 (0.0%) |
| Administrative & Support | 1 (100.0%) | 0 (0.0%) |
| Educational Services | 0 (0.0%) | 0 (0.0%) |
| Health Care & Social Assistance | 2 (33.3%) | 4 (66.7%) |
| Arts, Entertainment & Recreation | 0 (0.0%) | 0 (0.0%) |
| Accommodation & Food Services | 0 (0.0%) | 10 (100.0%) |
| Public Administration | 0 (0.0%) | 0 (0.0%) |
| Total | 37 (59.7%) | 25 (40.3%) |
Education in Noonan
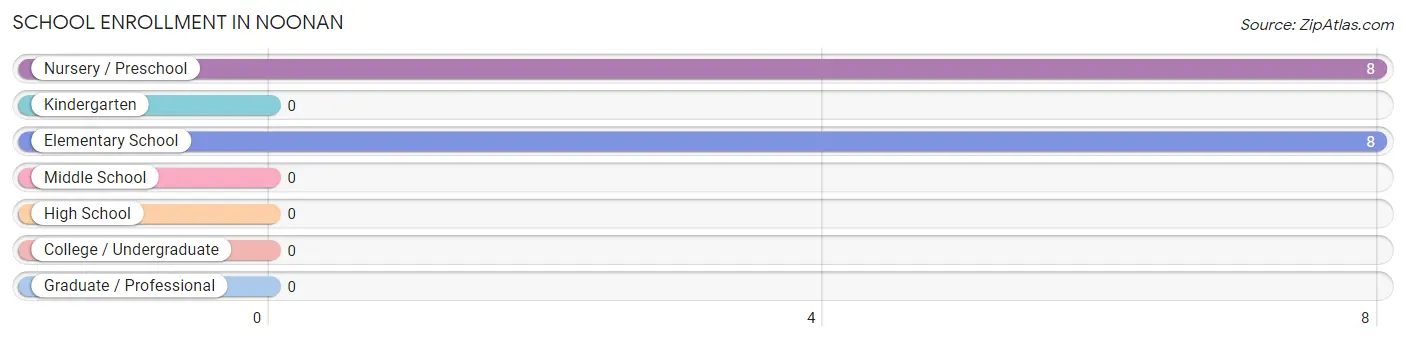
School Enrollment in Noonan
The most common levels of schooling among the 16 students in Noonan are nursery / preschool (8 | 50.0%), and elementary school (8 | 50.0%).
| School Level | # Students | % Students |
| Nursery / Preschool | 8 | 50.0% |
| Kindergarten | 0 | 0.0% |
| Elementary School | 8 | 50.0% |
| Middle School | 0 | 0.0% |
| High School | 0 | 0.0% |
| College / Undergraduate | 0 | 0.0% |
| Graduate / Professional | 0 | 0.0% |
| Total | 16 | 100.0% |
School Enrollment by Age by Funding Source in Noonan
Out of a total of 16 students who are enrolled in schools in Noonan, 8 (50.0%) attend a private institution, while the remaining 8 (50.0%) are enrolled in public schools. The age group of 3 to 4 year olds has the highest likelihood of being enrolled in private schools, with 8 (100.0% in the age bracket) enrolled. Conversely, the age group of 5 to 9 year old has the lowest likelihood of being enrolled in a private school, with 4 (100.0% in the age bracket) attending a public institution.
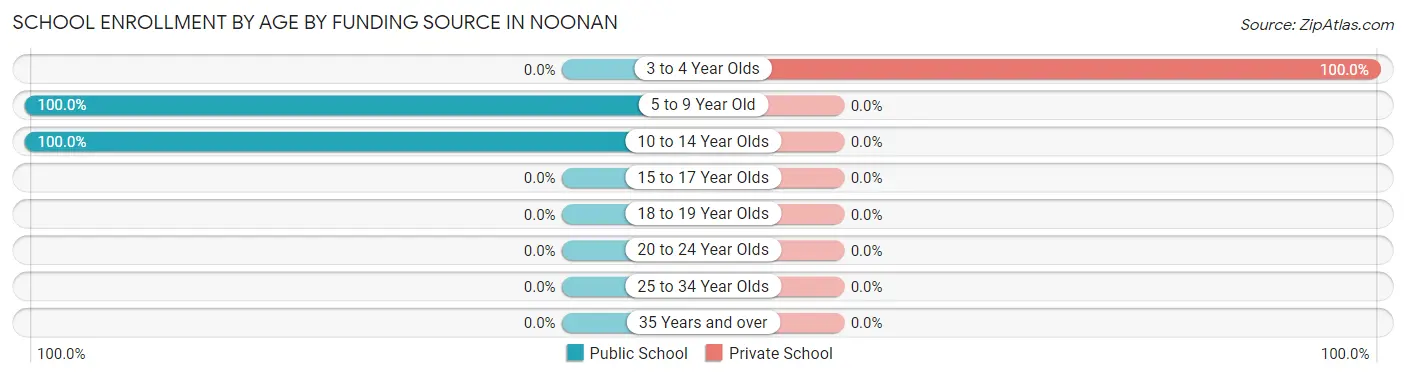
| Age Bracket | Public School | Private School |
| 3 to 4 Year Olds | 0 (0.0%) | 8 (100.0%) |
| 5 to 9 Year Old | 4 (100.0%) | 0 (0.0%) |
| 10 to 14 Year Olds | 4 (100.0%) | 0 (0.0%) |
| 15 to 17 Year Olds | 0 (0.0%) | 0 (0.0%) |
| 18 to 19 Year Olds | 0 (0.0%) | 0 (0.0%) |
| 20 to 24 Year Olds | 0 (0.0%) | 0 (0.0%) |
| 25 to 34 Year Olds | 0 (0.0%) | 0 (0.0%) |
| 35 Years and over | 0 (0.0%) | 0 (0.0%) |
| Total | 8 (50.0%) | 8 (50.0%) |
Educational Attainment by Field of Study in Noonan
Business (18 | 46.2%), psychology (11 | 28.2%), computers & mathematics (4 | 10.3%), education (4 | 10.3%), and bio, nature & agricultural (2 | 5.1%) are the most common fields of study among 39 individuals in Noonan who have obtained a bachelor's degree or higher.
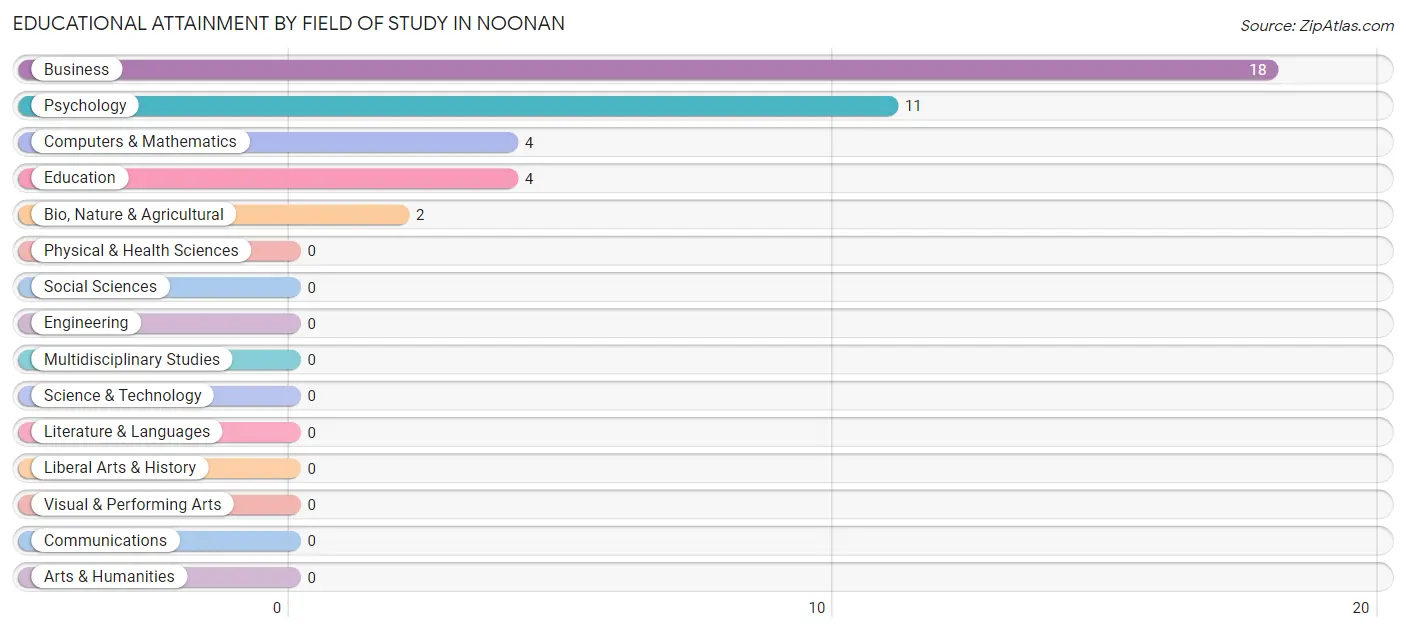
| Field of Study | # Graduates | % Graduates |
| Computers & Mathematics | 4 | 10.3% |
| Bio, Nature & Agricultural | 2 | 5.1% |
| Physical & Health Sciences | 0 | 0.0% |
| Psychology | 11 | 28.2% |
| Social Sciences | 0 | 0.0% |
| Engineering | 0 | 0.0% |
| Multidisciplinary Studies | 0 | 0.0% |
| Science & Technology | 0 | 0.0% |
| Business | 18 | 46.2% |
| Education | 4 | 10.3% |
| Literature & Languages | 0 | 0.0% |
| Liberal Arts & History | 0 | 0.0% |
| Visual & Performing Arts | 0 | 0.0% |
| Communications | 0 | 0.0% |
| Arts & Humanities | 0 | 0.0% |
| Total | 39 | 100.0% |
Transportation & Commute in Noonan
Vehicle Availability by Sex in Noonan
The most prevalent vehicle ownership categories in Noonan are males with 2 vehicles (17, accounting for 46.0%) and females with 2 vehicles (11, making up 85.0%).
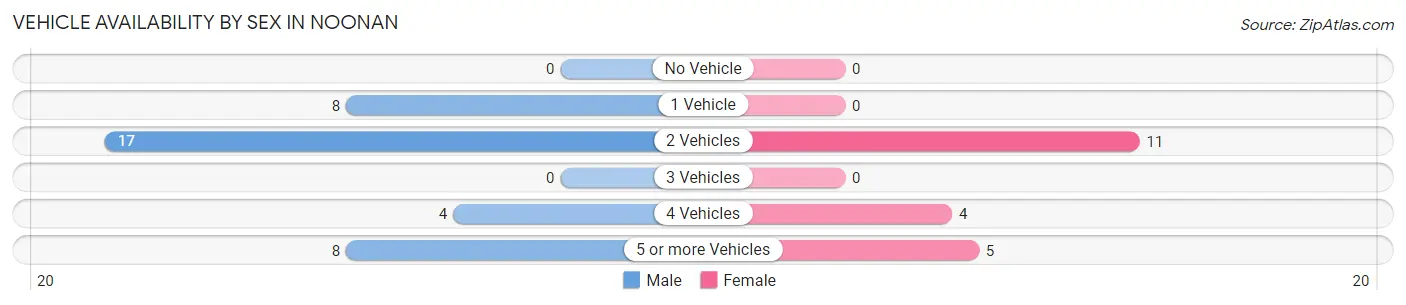
| Vehicles Available | Male | Female |
| No Vehicle | 0 (0.0%) | 0 (0.0%) |
| 1 Vehicle | 8 (21.6%) | 0 (0.0%) |
| 2 Vehicles | 17 (46.0%) | 11 (55.0%) |
| 3 Vehicles | 0 (0.0%) | 0 (0.0%) |
| 4 Vehicles | 4 (10.8%) | 4 (20.0%) |
| 5 or more Vehicles | 8 (21.6%) | 5 (25.0%) |
| Total | 37 (100.0%) | 20 (100.0%) |
Commute Time in Noonan
The most frequently occuring commute durations in Noonan are 60 to 89 minutes (17 commuters, 34.7%), 35 to 39 minutes (13 commuters, 26.5%), and 5 to 9 minutes (11 commuters, 22.5%).
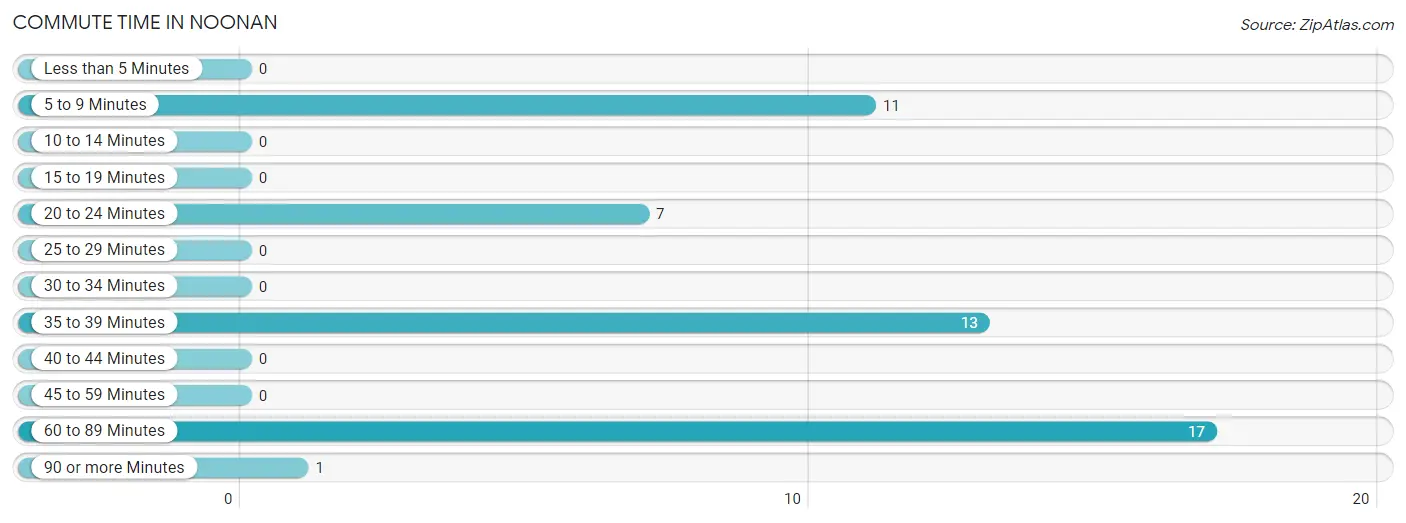
| Commute Time | # Commuters | % Commuters |
| Less than 5 Minutes | 0 | 0.0% |
| 5 to 9 Minutes | 11 | 22.5% |
| 10 to 14 Minutes | 0 | 0.0% |
| 15 to 19 Minutes | 0 | 0.0% |
| 20 to 24 Minutes | 7 | 14.3% |
| 25 to 29 Minutes | 0 | 0.0% |
| 30 to 34 Minutes | 0 | 0.0% |
| 35 to 39 Minutes | 13 | 26.5% |
| 40 to 44 Minutes | 0 | 0.0% |
| 45 to 59 Minutes | 0 | 0.0% |
| 60 to 89 Minutes | 17 | 34.7% |
| 90 or more Minutes | 1 | 2.0% |
Commute Time by Sex in Noonan
The most common commute times in Noonan are 60 to 89 minutes (17 commuters, 51.5%) for males and 5 to 9 minutes (9 commuters, 56.2%) for females.
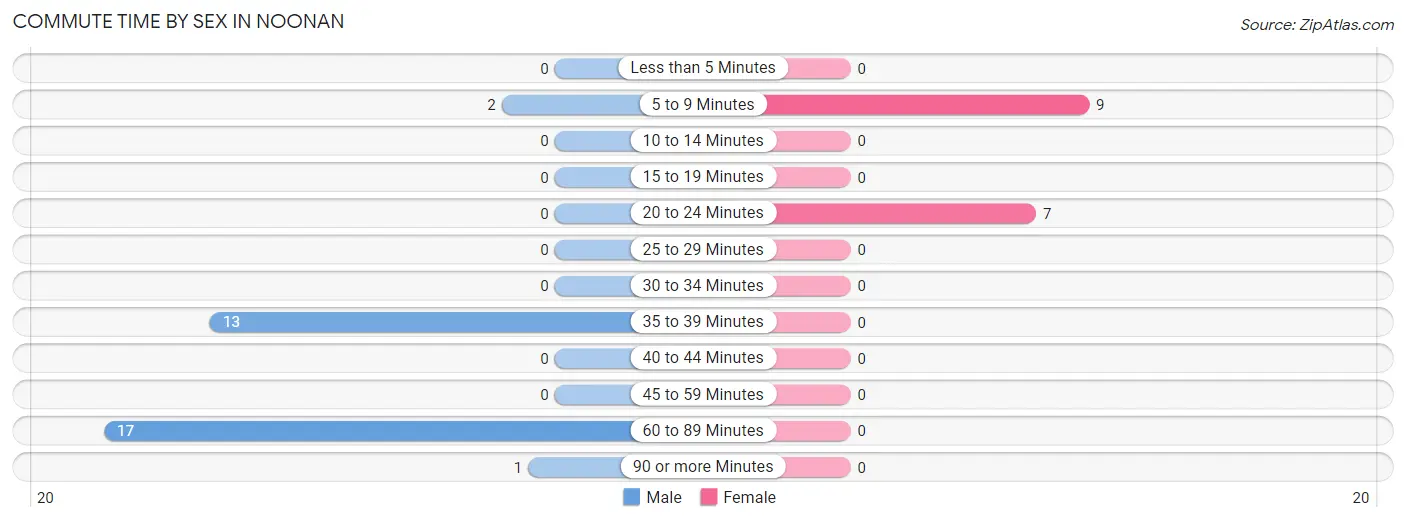
| Commute Time | Male | Female |
| Less than 5 Minutes | 0 (0.0%) | 0 (0.0%) |
| 5 to 9 Minutes | 2 (6.1%) | 9 (56.2%) |
| 10 to 14 Minutes | 0 (0.0%) | 0 (0.0%) |
| 15 to 19 Minutes | 0 (0.0%) | 0 (0.0%) |
| 20 to 24 Minutes | 0 (0.0%) | 7 (43.8%) |
| 25 to 29 Minutes | 0 (0.0%) | 0 (0.0%) |
| 30 to 34 Minutes | 0 (0.0%) | 0 (0.0%) |
| 35 to 39 Minutes | 13 (39.4%) | 0 (0.0%) |
| 40 to 44 Minutes | 0 (0.0%) | 0 (0.0%) |
| 45 to 59 Minutes | 0 (0.0%) | 0 (0.0%) |
| 60 to 89 Minutes | 17 (51.5%) | 0 (0.0%) |
| 90 or more Minutes | 1 (3.0%) | 0 (0.0%) |
Time of Departure to Work by Sex in Noonan
The most frequent times of departure to work in Noonan are 5:30 AM to 5:59 AM (12, 36.4%) for males and 8:00 AM to 8:29 AM (11, 68.8%) for females.
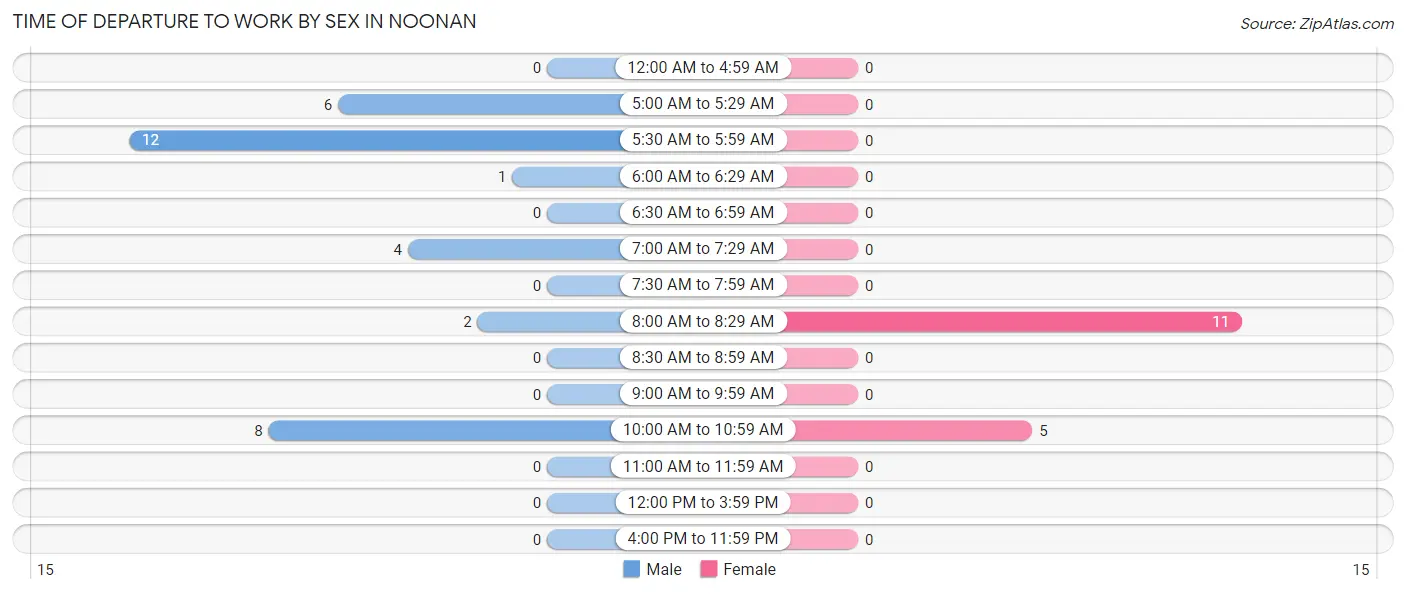
| Time of Departure | Male | Female |
| 12:00 AM to 4:59 AM | 0 (0.0%) | 0 (0.0%) |
| 5:00 AM to 5:29 AM | 6 (18.2%) | 0 (0.0%) |
| 5:30 AM to 5:59 AM | 12 (36.4%) | 0 (0.0%) |
| 6:00 AM to 6:29 AM | 1 (3.0%) | 0 (0.0%) |
| 6:30 AM to 6:59 AM | 0 (0.0%) | 0 (0.0%) |
| 7:00 AM to 7:29 AM | 4 (12.1%) | 0 (0.0%) |
| 7:30 AM to 7:59 AM | 0 (0.0%) | 0 (0.0%) |
| 8:00 AM to 8:29 AM | 2 (6.1%) | 11 (68.8%) |
| 8:30 AM to 8:59 AM | 0 (0.0%) | 0 (0.0%) |
| 9:00 AM to 9:59 AM | 0 (0.0%) | 0 (0.0%) |
| 10:00 AM to 10:59 AM | 8 (24.2%) | 5 (31.2%) |
| 11:00 AM to 11:59 AM | 0 (0.0%) | 0 (0.0%) |
| 12:00 PM to 3:59 PM | 0 (0.0%) | 0 (0.0%) |
| 4:00 PM to 11:59 PM | 0 (0.0%) | 0 (0.0%) |
| Total | 33 (100.0%) | 16 (100.0%) |
Housing Occupancy in Noonan
Occupancy by Ownership in Noonan
Of the total 71 dwellings in Noonan, owner-occupied units account for 64 (90.1%), while renter-occupied units make up 7 (9.9%).
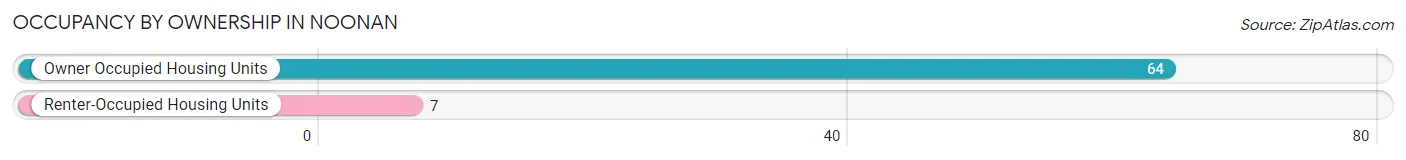
| Occupancy | # Housing Units | % Housing Units |
| Owner Occupied Housing Units | 64 | 90.1% |
| Renter-Occupied Housing Units | 7 | 9.9% |
| Total Occupied Housing Units | 71 | 100.0% |
Occupancy by Household Size in Noonan
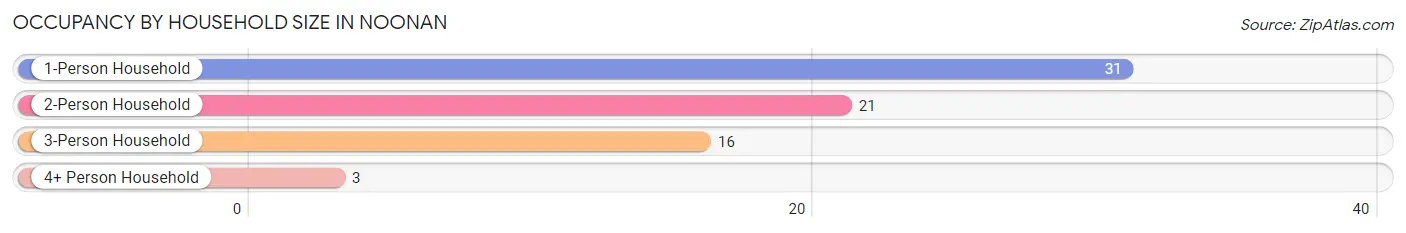
| Household Size | # Housing Units | % Housing Units |
| 1-Person Household | 31 | 43.7% |
| 2-Person Household | 21 | 29.6% |
| 3-Person Household | 16 | 22.5% |
| 4+ Person Household | 3 | 4.2% |
| Total Housing Units | 71 | 100.0% |
Occupancy by Ownership by Household Size in Noonan
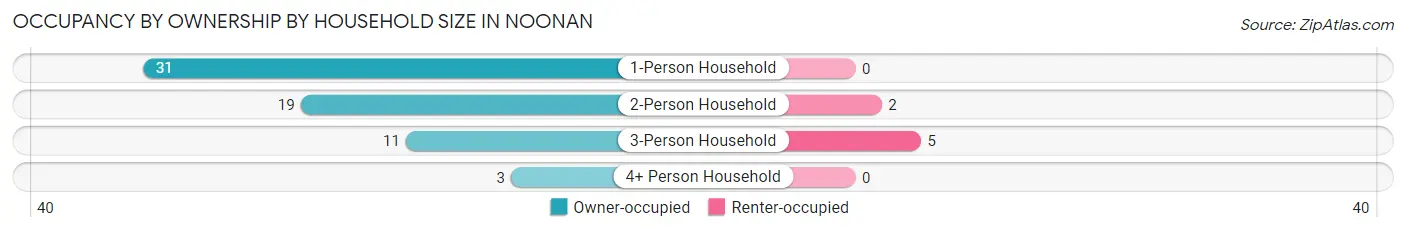
| Household Size | Owner-occupied | Renter-occupied |
| 1-Person Household | 31 (100.0%) | 0 (0.0%) |
| 2-Person Household | 19 (90.5%) | 2 (9.5%) |
| 3-Person Household | 11 (68.8%) | 5 (31.2%) |
| 4+ Person Household | 3 (100.0%) | 0 (0.0%) |
| Total Housing Units | 64 (90.1%) | 7 (9.9%) |
Occupancy by Educational Attainment in Noonan
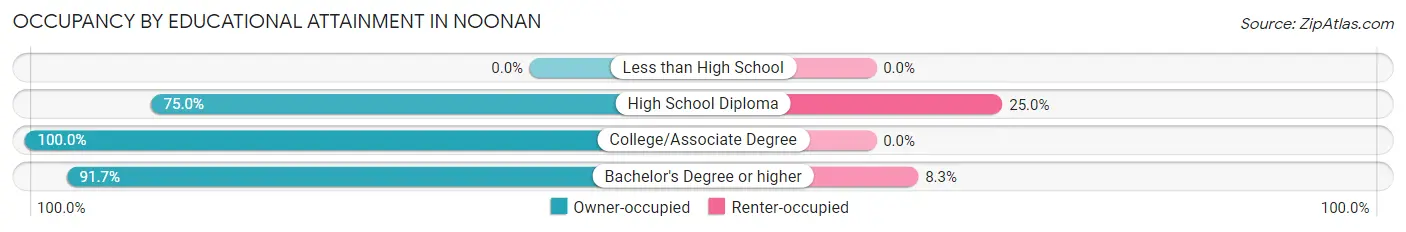
| Household Size | Owner-occupied | Renter-occupied |
| Less than High School | 0 (0.0%) | 0 (0.0%) |
| High School Diploma | 15 (75.0%) | 5 (25.0%) |
| College/Associate Degree | 27 (100.0%) | 0 (0.0%) |
| Bachelor's Degree or higher | 22 (91.7%) | 2 (8.3%) |
Occupancy by Age of Householder in Noonan
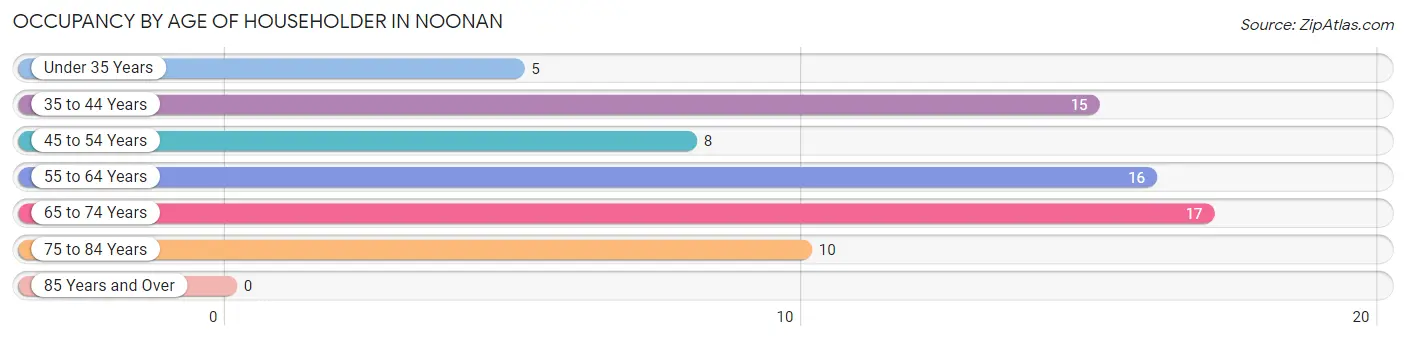
| Age Bracket | # Households | % Households |
| Under 35 Years | 5 | 7.0% |
| 35 to 44 Years | 15 | 21.1% |
| 45 to 54 Years | 8 | 11.3% |
| 55 to 64 Years | 16 | 22.5% |
| 65 to 74 Years | 17 | 23.9% |
| 75 to 84 Years | 10 | 14.1% |
| 85 Years and Over | 0 | 0.0% |
| Total | 71 | 100.0% |
Housing Finances in Noonan
Median Income by Occupancy in Noonan
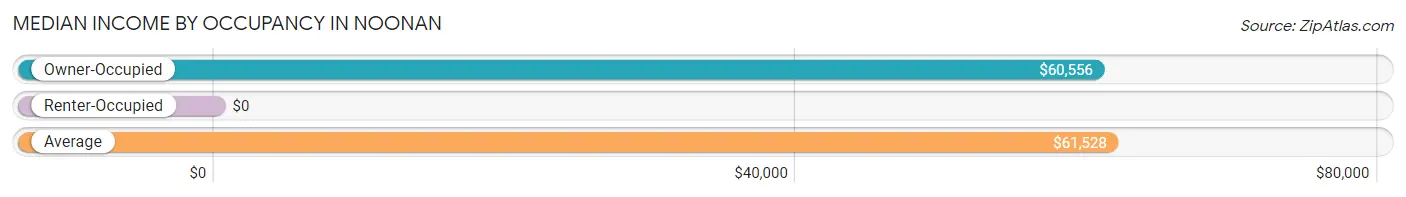
| Occupancy Type | # Households | Median Income |
| Owner-Occupied | 64 (90.1%) | $60,556 |
| Renter-Occupied | 7 (9.9%) | $0 |
| Average | 71 (100.0%) | $61,528 |
Occupancy by Householder Income Bracket in Noonan
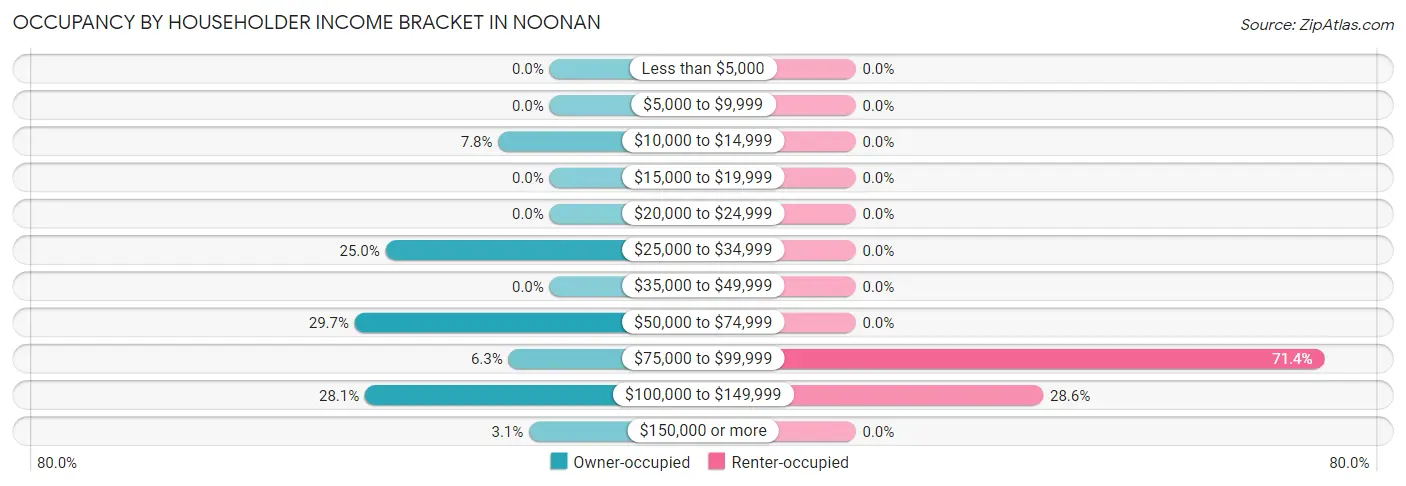
| Income Bracket | Owner-occupied | Renter-occupied |
| Less than $5,000 | 0 (0.0%) | 0 (0.0%) |
| $5,000 to $9,999 | 0 (0.0%) | 0 (0.0%) |
| $10,000 to $14,999 | 5 (7.8%) | 0 (0.0%) |
| $15,000 to $19,999 | 0 (0.0%) | 0 (0.0%) |
| $20,000 to $24,999 | 0 (0.0%) | 0 (0.0%) |
| $25,000 to $34,999 | 16 (25.0%) | 0 (0.0%) |
| $35,000 to $49,999 | 0 (0.0%) | 0 (0.0%) |
| $50,000 to $74,999 | 19 (29.7%) | 0 (0.0%) |
| $75,000 to $99,999 | 4 (6.2%) | 5 (71.4%) |
| $100,000 to $149,999 | 18 (28.1%) | 2 (28.6%) |
| $150,000 or more | 2 (3.1%) | 0 (0.0%) |
| Total | 64 (100.0%) | 7 (100.0%) |
Monthly Housing Cost Tiers in Noonan
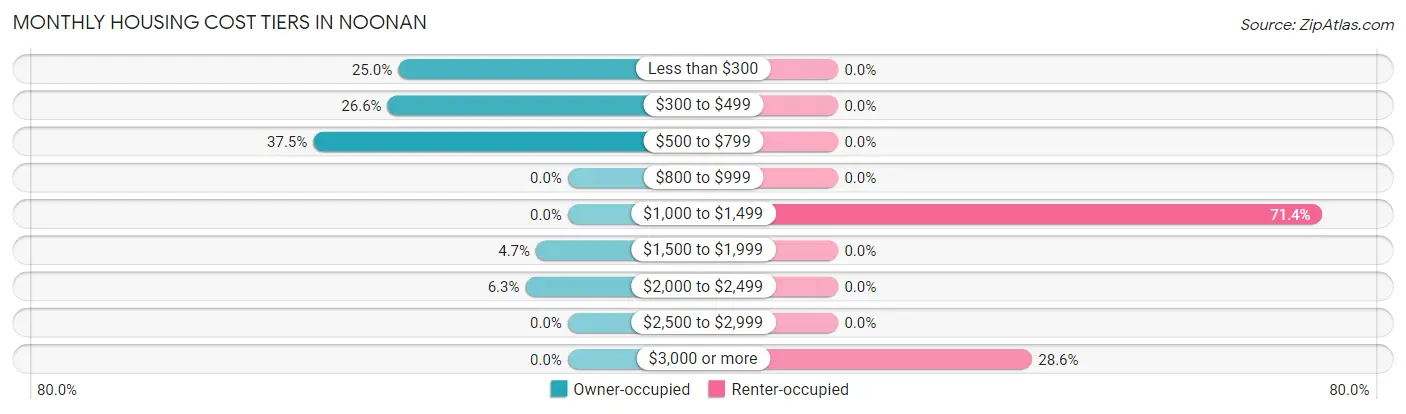
| Monthly Cost | Owner-occupied | Renter-occupied |
| Less than $300 | 16 (25.0%) | 0 (0.0%) |
| $300 to $499 | 17 (26.6%) | 0 (0.0%) |
| $500 to $799 | 24 (37.5%) | 0 (0.0%) |
| $800 to $999 | 0 (0.0%) | 0 (0.0%) |
| $1,000 to $1,499 | 0 (0.0%) | 5 (71.4%) |
| $1,500 to $1,999 | 3 (4.7%) | 0 (0.0%) |
| $2,000 to $2,499 | 4 (6.2%) | 0 (0.0%) |
| $2,500 to $2,999 | 0 (0.0%) | 0 (0.0%) |
| $3,000 or more | 0 (0.0%) | 2 (28.6%) |
| Total | 64 (100.0%) | 7 (100.0%) |
Physical Housing Characteristics in Noonan
Housing Structures in Noonan
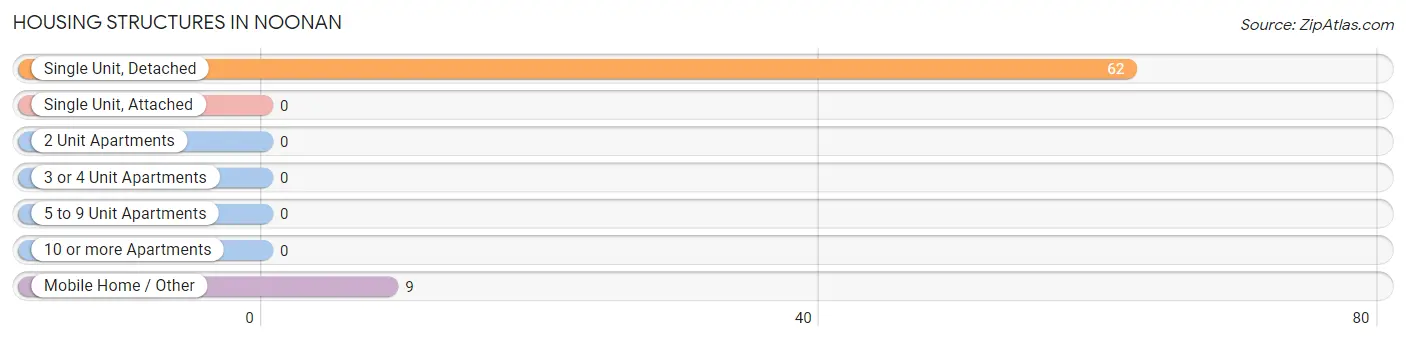
| Structure Type | # Housing Units | % Housing Units |
| Single Unit, Detached | 62 | 87.3% |
| Single Unit, Attached | 0 | 0.0% |
| 2 Unit Apartments | 0 | 0.0% |
| 3 or 4 Unit Apartments | 0 | 0.0% |
| 5 to 9 Unit Apartments | 0 | 0.0% |
| 10 or more Apartments | 0 | 0.0% |
| Mobile Home / Other | 9 | 12.7% |
| Total | 71 | 100.0% |
Housing Structures by Occupancy in Noonan
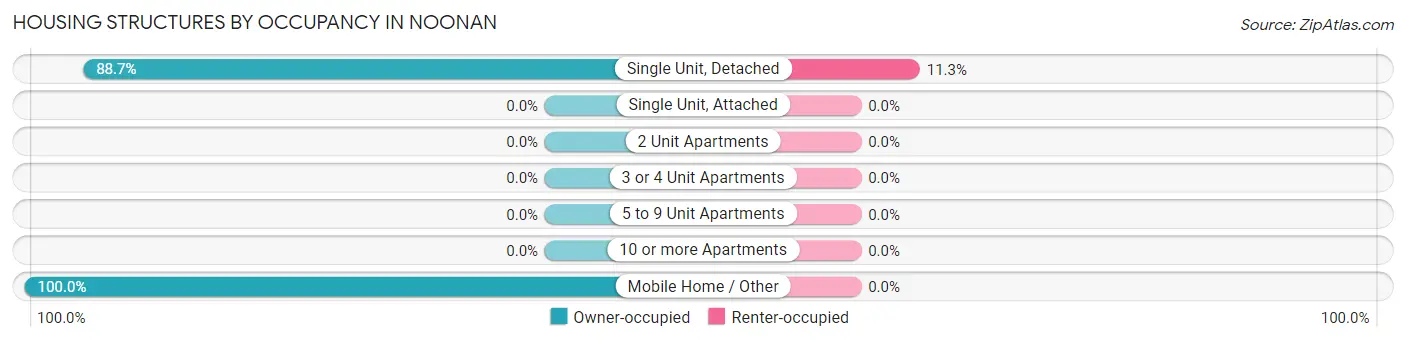
| Structure Type | Owner-occupied | Renter-occupied |
| Single Unit, Detached | 55 (88.7%) | 7 (11.3%) |
| Single Unit, Attached | 0 (0.0%) | 0 (0.0%) |
| 2 Unit Apartments | 0 (0.0%) | 0 (0.0%) |
| 3 or 4 Unit Apartments | 0 (0.0%) | 0 (0.0%) |
| 5 to 9 Unit Apartments | 0 (0.0%) | 0 (0.0%) |
| 10 or more Apartments | 0 (0.0%) | 0 (0.0%) |
| Mobile Home / Other | 9 (100.0%) | 0 (0.0%) |
| Total | 64 (90.1%) | 7 (9.9%) |
Housing Structures by Number of Rooms in Noonan
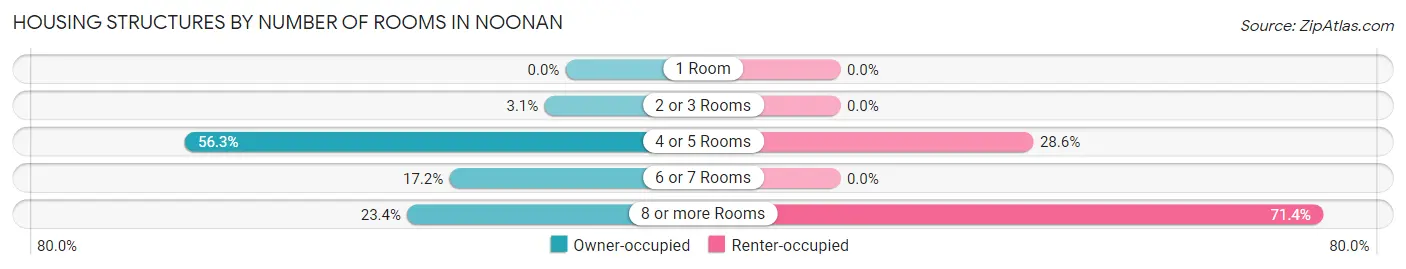
| Number of Rooms | Owner-occupied | Renter-occupied |
| 1 Room | 0 (0.0%) | 0 (0.0%) |
| 2 or 3 Rooms | 2 (3.1%) | 0 (0.0%) |
| 4 or 5 Rooms | 36 (56.2%) | 2 (28.6%) |
| 6 or 7 Rooms | 11 (17.2%) | 0 (0.0%) |
| 8 or more Rooms | 15 (23.4%) | 5 (71.4%) |
| Total | 64 (100.0%) | 7 (100.0%) |
Housing Structure by Heating Type in Noonan
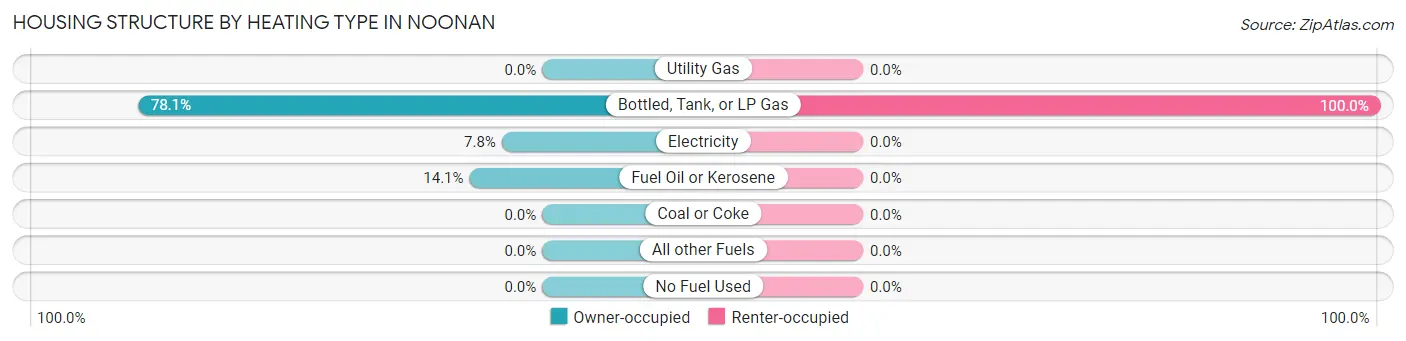
| Heating Type | Owner-occupied | Renter-occupied |
| Utility Gas | 0 (0.0%) | 0 (0.0%) |
| Bottled, Tank, or LP Gas | 50 (78.1%) | 7 (100.0%) |
| Electricity | 5 (7.8%) | 0 (0.0%) |
| Fuel Oil or Kerosene | 9 (14.1%) | 0 (0.0%) |
| Coal or Coke | 0 (0.0%) | 0 (0.0%) |
| All other Fuels | 0 (0.0%) | 0 (0.0%) |
| No Fuel Used | 0 (0.0%) | 0 (0.0%) |
| Total | 64 (100.0%) | 7 (100.0%) |
Household Vehicle Usage in Noonan
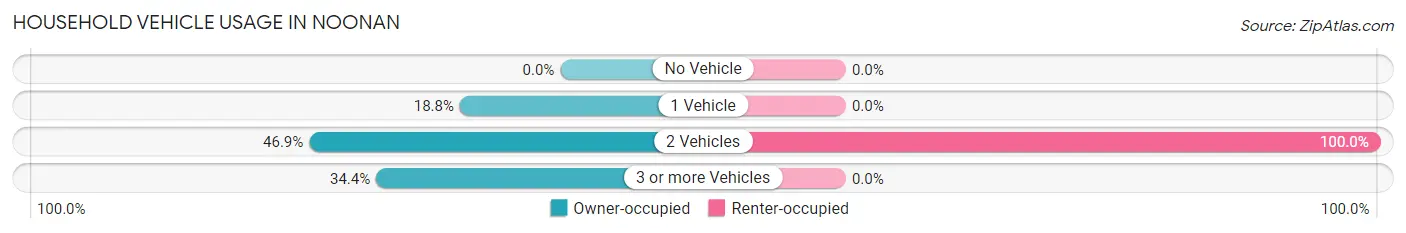
| Vehicles per Household | Owner-occupied | Renter-occupied |
| No Vehicle | 0 (0.0%) | 0 (0.0%) |
| 1 Vehicle | 12 (18.8%) | 0 (0.0%) |
| 2 Vehicles | 30 (46.9%) | 7 (100.0%) |
| 3 or more Vehicles | 22 (34.4%) | 0 (0.0%) |
| Total | 64 (100.0%) | 7 (100.0%) |
Real Estate & Mortgages in Noonan
Real Estate and Mortgage Overview in Noonan
| Characteristic | Without Mortgage | With Mortgage |
| Housing Units | 59 | 5 |
| Median Property Value | $87,900 | $0 |
| Median Household Income | $57,321 | $0 |
| Monthly Housing Costs | $479 | $0 |
| Real Estate Taxes | $518 | $0 |
Property Value by Mortgage Status in Noonan
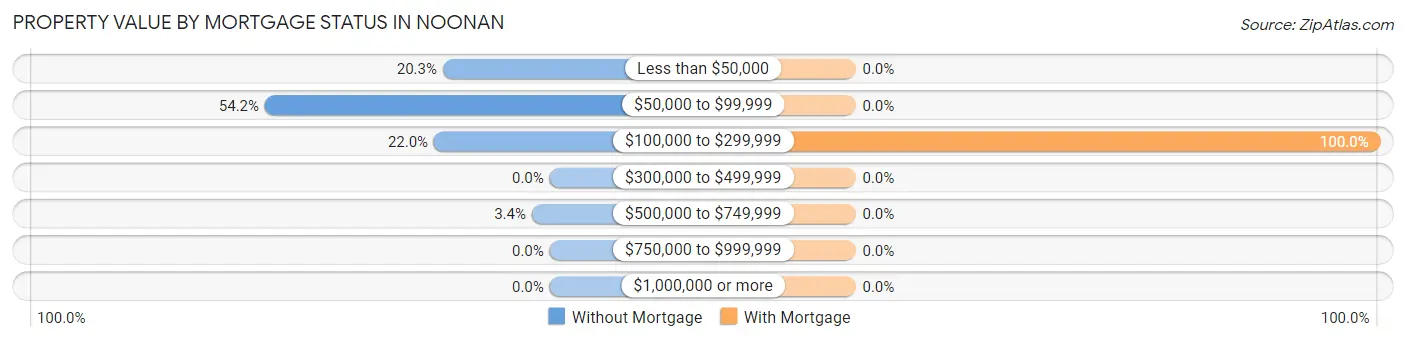
| Property Value | Without Mortgage | With Mortgage |
| Less than $50,000 | 12 (20.3%) | 0 (0.0%) |
| $50,000 to $99,999 | 32 (54.2%) | 0 (0.0%) |
| $100,000 to $299,999 | 13 (22.0%) | 5 (100.0%) |
| $300,000 to $499,999 | 0 (0.0%) | 0 (0.0%) |
| $500,000 to $749,999 | 2 (3.4%) | 0 (0.0%) |
| $750,000 to $999,999 | 0 (0.0%) | 0 (0.0%) |
| $1,000,000 or more | 0 (0.0%) | 0 (0.0%) |
| Total | 59 (100.0%) | 5 (100.0%) |
Household Income by Mortgage Status in Noonan
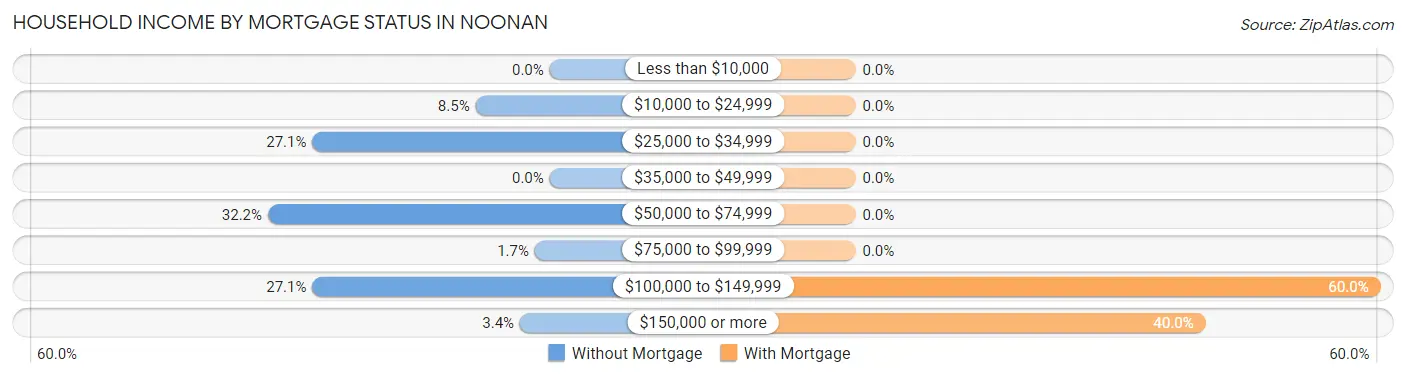
| Household Income | Without Mortgage | With Mortgage |
| Less than $10,000 | 0 (0.0%) | 0 (0.0%) |
| $10,000 to $24,999 | 5 (8.5%) | 0 (0.0%) |
| $25,000 to $34,999 | 16 (27.1%) | 0 (0.0%) |
| $35,000 to $49,999 | 0 (0.0%) | 0 (0.0%) |
| $50,000 to $74,999 | 19 (32.2%) | 0 (0.0%) |
| $75,000 to $99,999 | 1 (1.7%) | 0 (0.0%) |
| $100,000 to $149,999 | 16 (27.1%) | 3 (60.0%) |
| $150,000 or more | 2 (3.4%) | 2 (40.0%) |
| Total | 59 (100.0%) | 5 (100.0%) |
Property Value to Household Income Ratio in Noonan
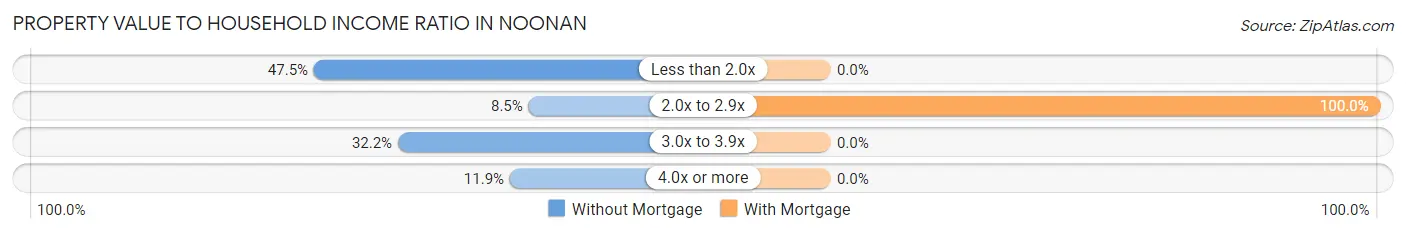
| Value-to-Income Ratio | Without Mortgage | With Mortgage |
| Less than 2.0x | 28 (47.5%) | 0 (0.0%) |
| 2.0x to 2.9x | 5 (8.5%) | 5 (100.0%) |
| 3.0x to 3.9x | 19 (32.2%) | 0 (0.0%) |
| 4.0x or more | 7 (11.9%) | 0 (0.0%) |
| Total | 59 (100.0%) | 5 (100.0%) |
Real Estate Taxes by Mortgage Status in Noonan
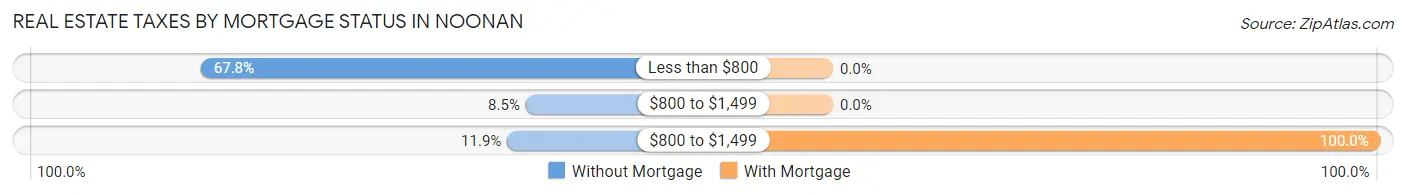
| Property Taxes | Without Mortgage | With Mortgage |
| Less than $800 | 40 (67.8%) | 0 (0.0%) |
| $800 to $1,499 | 5 (8.5%) | 0 (0.0%) |
| $800 to $1,499 | 7 (11.9%) | 5 (100.0%) |
| Total | 59 (100.0%) | 5 (100.0%) |
Health & Disability in Noonan
Health Insurance Coverage by Age in Noonan
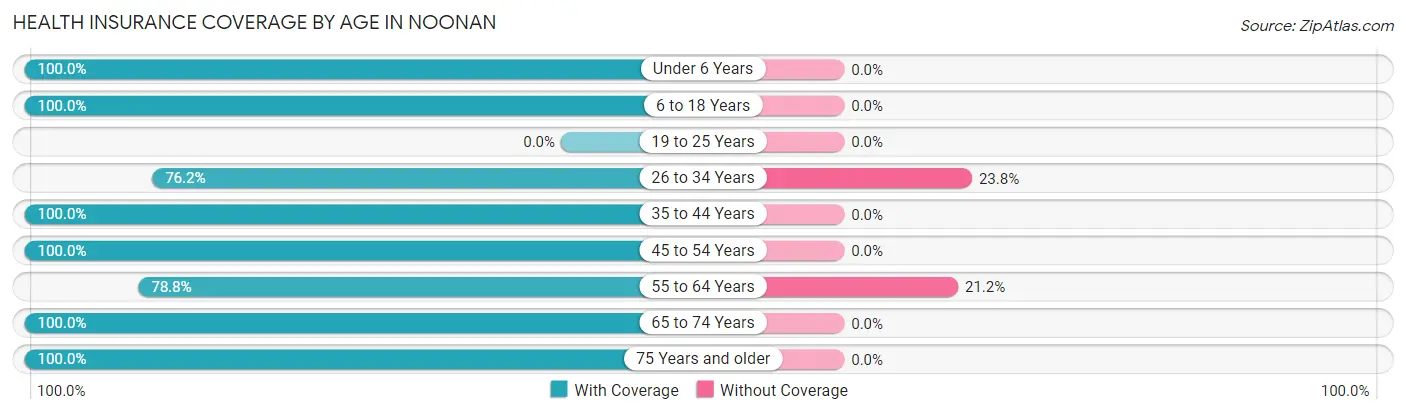
| Age Bracket | With Coverage | Without Coverage |
| Under 6 Years | 13 (100.0%) | 0 (0.0%) |
| 6 to 18 Years | 8 (100.0%) | 0 (0.0%) |
| 19 to 25 Years | 0 (0.0%) | 0 (0.0%) |
| 26 to 34 Years | 16 (76.2%) | 5 (23.8%) |
| 35 to 44 Years | 15 (100.0%) | 0 (0.0%) |
| 45 to 54 Years | 17 (100.0%) | 0 (0.0%) |
| 55 to 64 Years | 26 (78.8%) | 7 (21.2%) |
| 65 to 74 Years | 25 (100.0%) | 0 (0.0%) |
| 75 Years and older | 10 (100.0%) | 0 (0.0%) |
| Total | 130 (91.5%) | 12 (8.5%) |
Health Insurance Coverage by Citizenship Status in Noonan
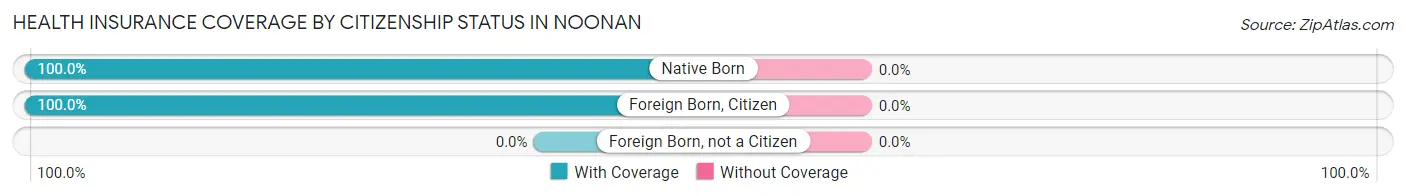
| Citizenship Status | With Coverage | Without Coverage |
| Native Born | 13 (100.0%) | 0 (0.0%) |
| Foreign Born, Citizen | 8 (100.0%) | 0 (0.0%) |
| Foreign Born, not a Citizen | 0 (0.0%) | 0 (0.0%) |
Health Insurance Coverage by Household Income in Noonan
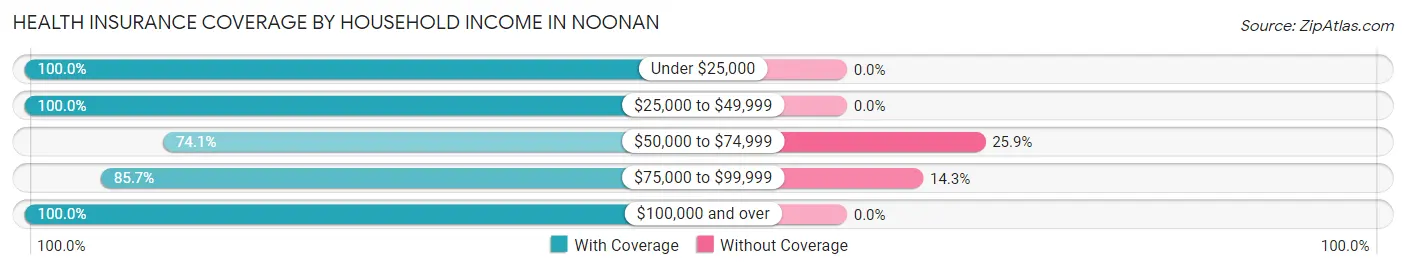
| Household Income | With Coverage | Without Coverage |
| Under $25,000 | 5 (100.0%) | 0 (0.0%) |
| $25,000 to $49,999 | 32 (100.0%) | 0 (0.0%) |
| $50,000 to $74,999 | 20 (74.1%) | 7 (25.9%) |
| $75,000 to $99,999 | 30 (85.7%) | 5 (14.3%) |
| $100,000 and over | 43 (100.0%) | 0 (0.0%) |
Public vs Private Health Insurance Coverage by Age in Noonan
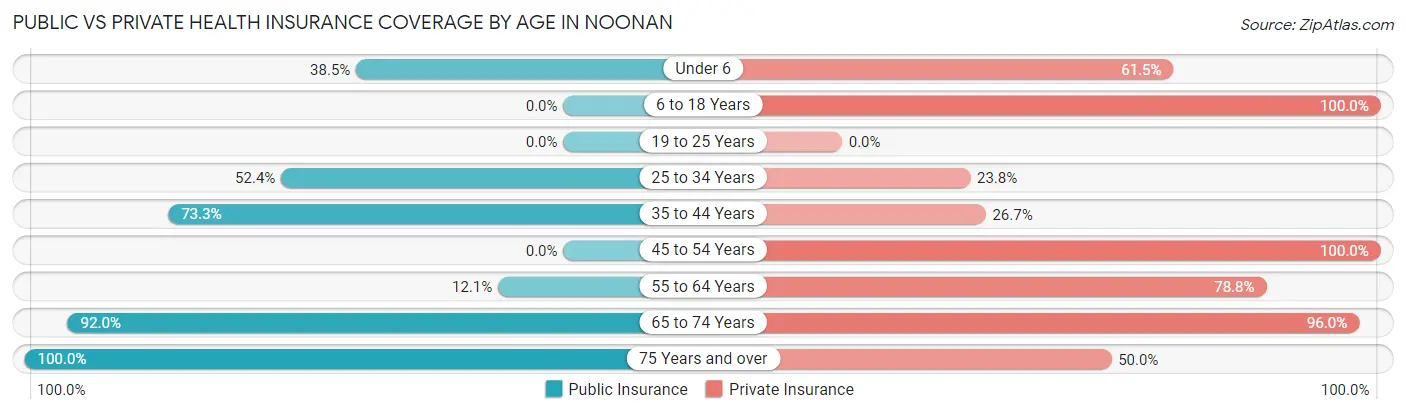
| Age Bracket | Public Insurance | Private Insurance |
| Under 6 | 5 (38.5%) | 8 (61.5%) |
| 6 to 18 Years | 0 (0.0%) | 8 (100.0%) |
| 19 to 25 Years | 0 (0.0%) | 0 (0.0%) |
| 25 to 34 Years | 11 (52.4%) | 5 (23.8%) |
| 35 to 44 Years | 11 (73.3%) | 4 (26.7%) |
| 45 to 54 Years | 0 (0.0%) | 17 (100.0%) |
| 55 to 64 Years | 4 (12.1%) | 26 (78.8%) |
| 65 to 74 Years | 23 (92.0%) | 24 (96.0%) |
| 75 Years and over | 10 (100.0%) | 5 (50.0%) |
| Total | 64 (45.1%) | 97 (68.3%) |
Disability Status by Sex by Age in Noonan
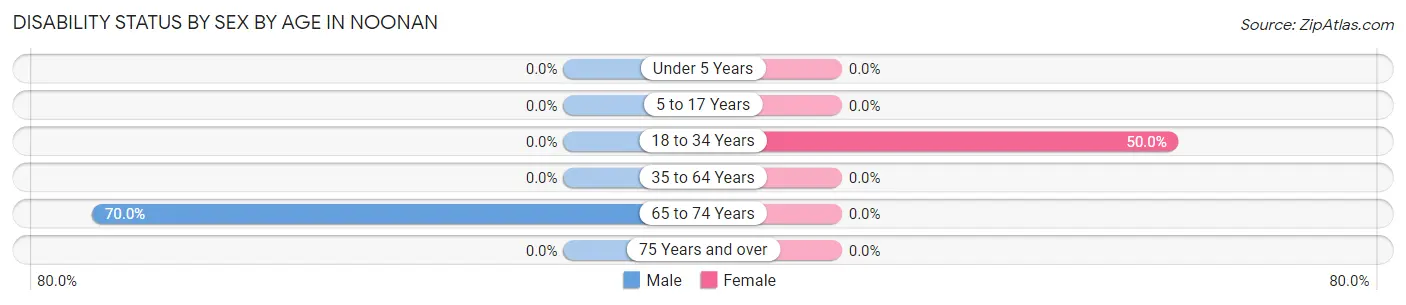
| Age Bracket | Male | Female |
| Under 5 Years | 0 (0.0%) | 0 (0.0%) |
| 5 to 17 Years | 0 (0.0%) | 0 (0.0%) |
| 18 to 34 Years | 0 (0.0%) | 5 (50.0%) |
| 35 to 64 Years | 0 (0.0%) | 0 (0.0%) |
| 65 to 74 Years | 7 (70.0%) | 0 (0.0%) |
| 75 Years and over | 0 (0.0%) | 0 (0.0%) |
Disability Class by Sex by Age in Noonan
Disability Class: Hearing Difficulty
| Age Bracket | Male | Female |
| Under 5 Years | 0 (0.0%) | 0 (0.0%) |
| 5 to 17 Years | 0 (0.0%) | 0 (0.0%) |
| 18 to 34 Years | 0 (0.0%) | 0 (0.0%) |
| 35 to 64 Years | 0 (0.0%) | 0 (0.0%) |
| 65 to 74 Years | 0 (0.0%) | 0 (0.0%) |
| 75 Years and over | 0 (0.0%) | 0 (0.0%) |
Disability Class: Vision Difficulty
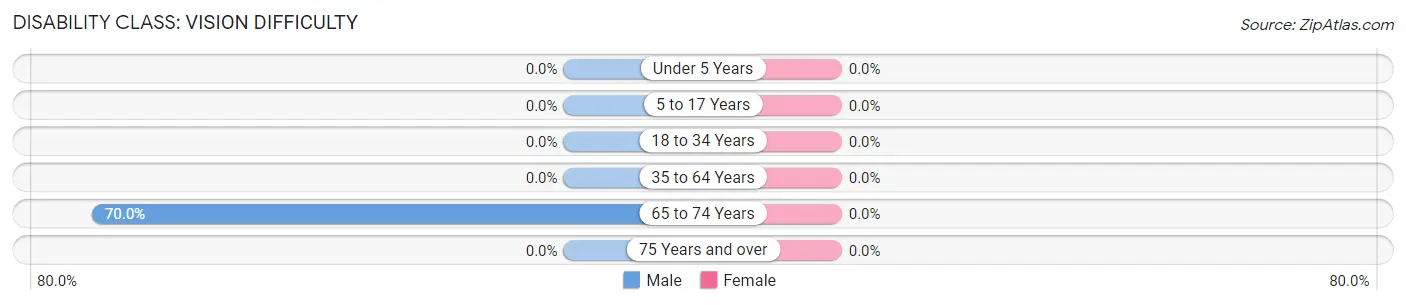
| Age Bracket | Male | Female |
| Under 5 Years | 0 (0.0%) | 0 (0.0%) |
| 5 to 17 Years | 0 (0.0%) | 0 (0.0%) |
| 18 to 34 Years | 0 (0.0%) | 0 (0.0%) |
| 35 to 64 Years | 0 (0.0%) | 0 (0.0%) |
| 65 to 74 Years | 7 (70.0%) | 0 (0.0%) |
| 75 Years and over | 0 (0.0%) | 0 (0.0%) |
Disability Class: Cognitive Difficulty
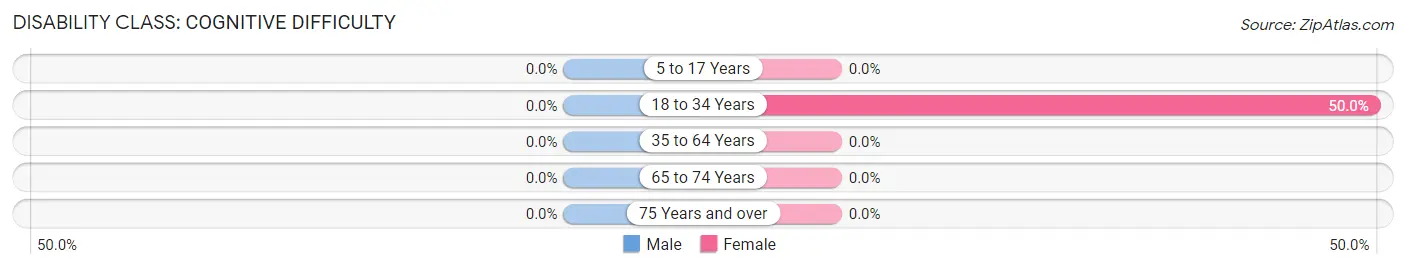
| Age Bracket | Male | Female |
| 5 to 17 Years | 0 (0.0%) | 0 (0.0%) |
| 18 to 34 Years | 0 (0.0%) | 5 (50.0%) |
| 35 to 64 Years | 0 (0.0%) | 0 (0.0%) |
| 65 to 74 Years | 0 (0.0%) | 0 (0.0%) |
| 75 Years and over | 0 (0.0%) | 0 (0.0%) |
Disability Class: Ambulatory Difficulty
| Age Bracket | Male | Female |
| 5 to 17 Years | 0 (0.0%) | 0 (0.0%) |
| 18 to 34 Years | 0 (0.0%) | 0 (0.0%) |
| 35 to 64 Years | 0 (0.0%) | 0 (0.0%) |
| 65 to 74 Years | 0 (0.0%) | 0 (0.0%) |
| 75 Years and over | 0 (0.0%) | 0 (0.0%) |
Disability Class: Self-Care Difficulty
| Age Bracket | Male | Female |
| 5 to 17 Years | 0 (0.0%) | 0 (0.0%) |
| 18 to 34 Years | 0 (0.0%) | 0 (0.0%) |
| 35 to 64 Years | 0 (0.0%) | 0 (0.0%) |
| 65 to 74 Years | 0 (0.0%) | 0 (0.0%) |
| 75 Years and over | 0 (0.0%) | 0 (0.0%) |
Technology Access in Noonan
Computing Device Access in Noonan
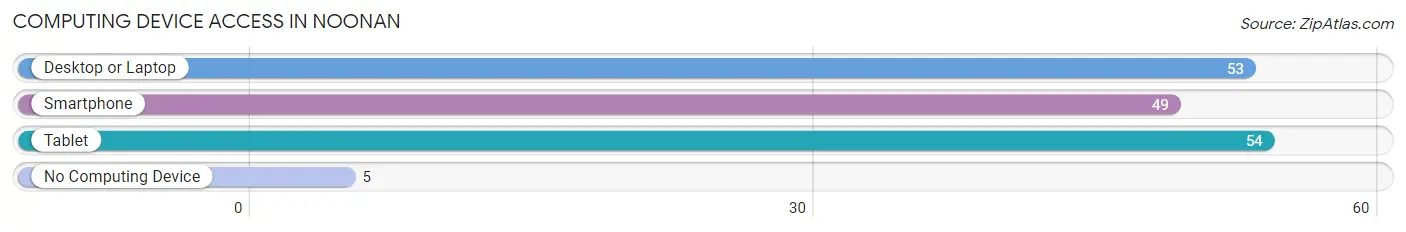
| Device Type | # Households | % Households |
| Desktop or Laptop | 53 | 74.7% |
| Smartphone | 49 | 69.0% |
| Tablet | 54 | 76.1% |
| No Computing Device | 5 | 7.0% |
| Total | 71 | 100.0% |
Internet Access in Noonan
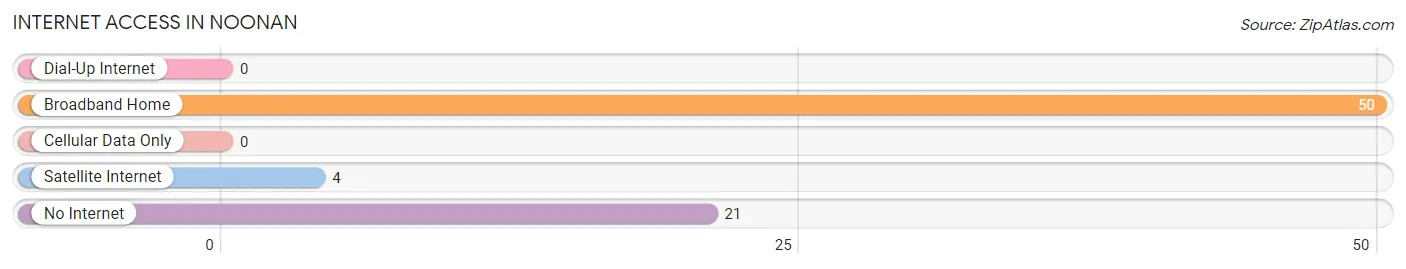
| Internet Type | # Households | % Households |
| Dial-Up Internet | 0 | 0.0% |
| Broadband Home | 50 | 70.4% |
| Cellular Data Only | 0 | 0.0% |
| Satellite Internet | 4 | 5.6% |
| No Internet | 21 | 29.6% |
| Total | 71 | 100.0% |
Noonan Summary
Noonan is a small city located in the northwestern corner of North Dakota. It is situated in the heart of the Red River Valley, a region known for its rich agricultural heritage. The city is home to a population of approximately 1,000 people, and is the county seat of Walsh County.
Geographically, Noonan is located in the Red River Valley, which is a flat, fertile plain that stretches from the Canadian border to the Minnesota border. The valley is bordered by the Red River of the North to the east, and the Souris River to the west. The valley is known for its rich soil, which is ideal for growing crops such as wheat, corn, and soybeans. The area is also known for its rolling hills and prairies, which are home to a variety of wildlife.
Economically, Noonan is a small, rural community that relies heavily on agriculture. The city is home to several large farms, as well as a number of smaller family-owned farms. The city is also home to a number of businesses, including a grocery store, a hardware store, a bank, and a few restaurants. The city is also home to a number of small manufacturing businesses, such as a furniture factory and a printing company.
Demographically, Noonan is a predominantly white city, with a population that is approximately 95% white. The city is also home to a small Hispanic population, as well as a small Native American population. The median household income in Noonan is approximately $45,000, and the median home value is approximately $90,000.
Noonan is a small, rural city that is known for its agricultural heritage and its friendly, welcoming atmosphere. The city is home to a diverse population, and is a great place to live and work. With its rich soil and its proximity to the Red River Valley, Noonan is an ideal place for those looking to start a business or to raise a family.
Common Questions
What is Per Capita Income in Noonan?
Per Capita income in Noonan is $42,927.
What is the Median Household income in Noonan?
Median Household Income in Noonan is $61,528.
What is Inequality or Gini Index in Noonan?
Inequality or Gini Index in Noonan is 0.38.
What is the Total Population of Noonan?
Total Population of Noonan is 142.
What is the Total Male Population of Noonan?
Total Male Population of Noonan is 70.
What is the Total Female Population of Noonan?
Total Female Population of Noonan is 72.
What is the Ratio of Males per 100 Females in Noonan?
There are 97.22 Males per 100 Females in Noonan.
What is the Ratio of Females per 100 Males in Noonan?
There are 102.86 Females per 100 Males in Noonan.
What is the Median Population Age in Noonan?
Median Population Age in Noonan is 53.3 Years.
What is the Average Family Size in Noonan
Average Family Size in Noonan is 2.4 People.
What is the Average Household Size in Noonan
Average Household Size in Noonan is 2.0 People.
How Large is the Labor Force in Noonan?
There are 73 People in the Labor Forcein in Noonan.
What is the Percentage of People in the Labor Force in Noonan?
60.3% of People are in the Labor Force in Noonan.
What is the Unemployment Rate in Noonan?
Unemployment Rate in Noonan is 15.1%.