Portland, ND Map & Demographics
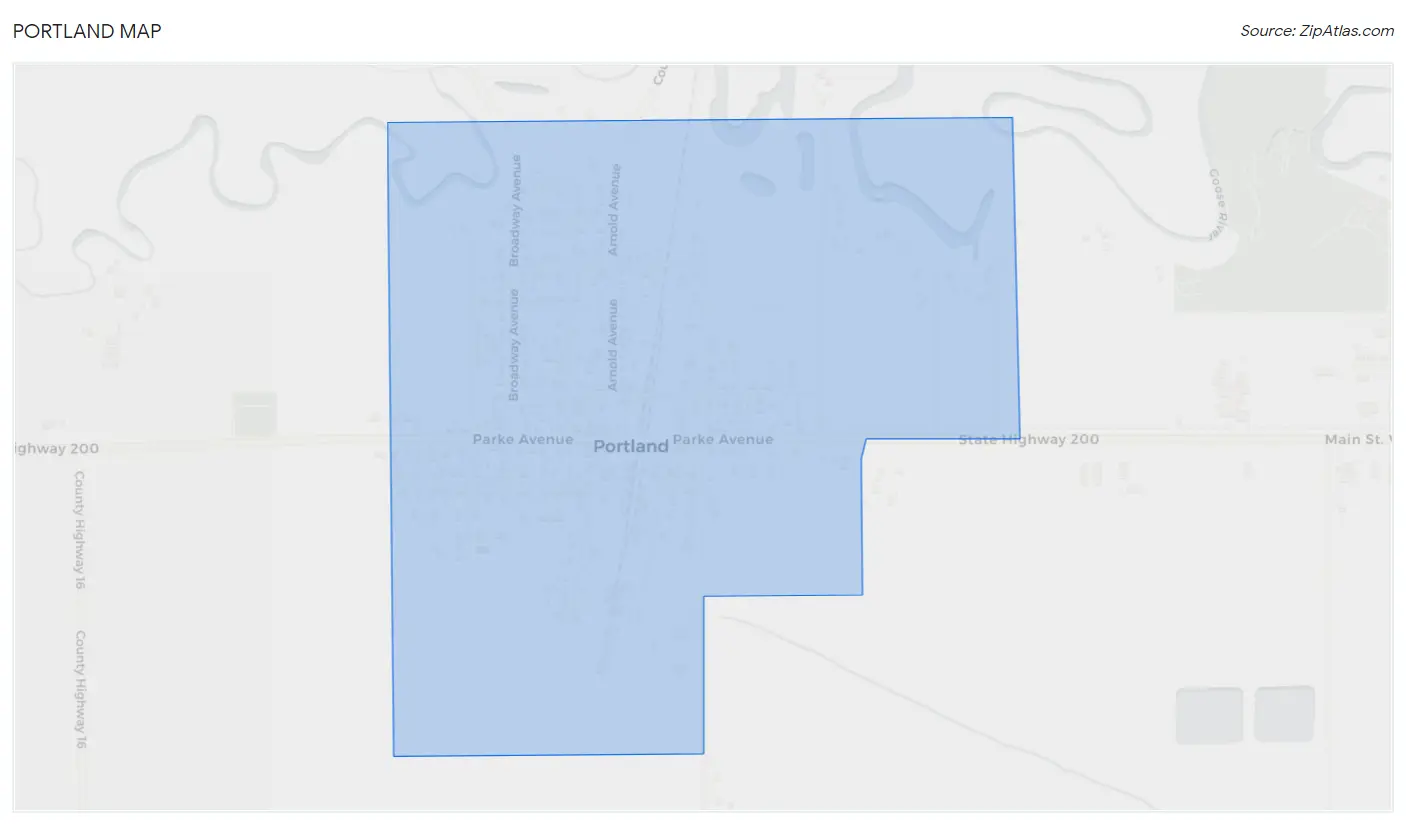
Portland Map
Portland Overview
$38,623
PER CAPITA INCOME
$99,500
AVG FAMILY INCOME
$77,250
AVG HOUSEHOLD INCOME
24.8%
WAGE / INCOME GAP [ % ]
75.2¢/ $1
WAGE / INCOME GAP [ $ ]
0.39
INEQUALITY / GINI INDEX
562
TOTAL POPULATION
292
MALE POPULATION
270
FEMALE POPULATION
108.15
MALES / 100 FEMALES
92.47
FEMALES / 100 MALES
46.4
MEDIAN AGE
2.7
AVG FAMILY SIZE
2.3
AVG HOUSEHOLD SIZE
279
LABOR FORCE [ PEOPLE ]
67.6%
PERCENT IN LABOR FORCE
1.4%
UNEMPLOYMENT RATE
Portland Zip Codes
Portland Area Codes
Income in Portland
Income Overview in Portland
Per Capita Income in Portland is $38,623, while median incomes of families and households are $99,500 and $77,250 respectively.
| Characteristic | Number | Measure |
| Per Capita Income | 562 | $38,623 |
| Median Family Income | 176 | $99,500 |
| Mean Family Income | 176 | $107,665 |
| Median Household Income | 249 | $77,250 |
| Mean Household Income | 249 | $88,482 |
| Income Deficit | 176 | $0 |
| Wage / Income Gap (%) | 562 | 24.77% |
| Wage / Income Gap ($) | 562 | 75.23¢ per $1 |
| Gini / Inequality Index | 562 | 0.39 |
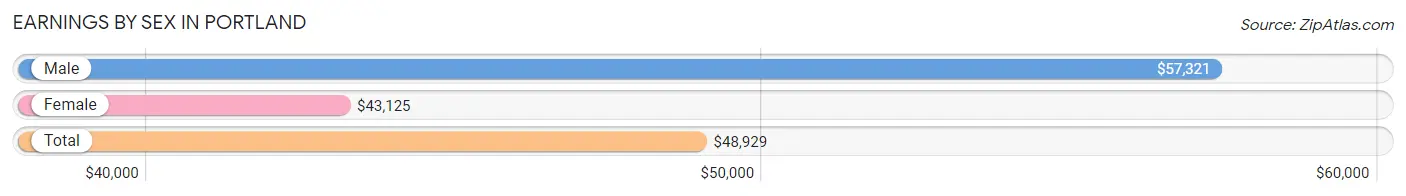
Earnings by Sex in Portland
Average Earnings in Portland are $48,929, $57,321 for men and $43,125 for women, a difference of 24.8%.
| Sex | Number | Average Earnings |
| Male | 161 (54.8%) | $57,321 |
| Female | 133 (45.2%) | $43,125 |
| Total | 294 (100.0%) | $48,929 |
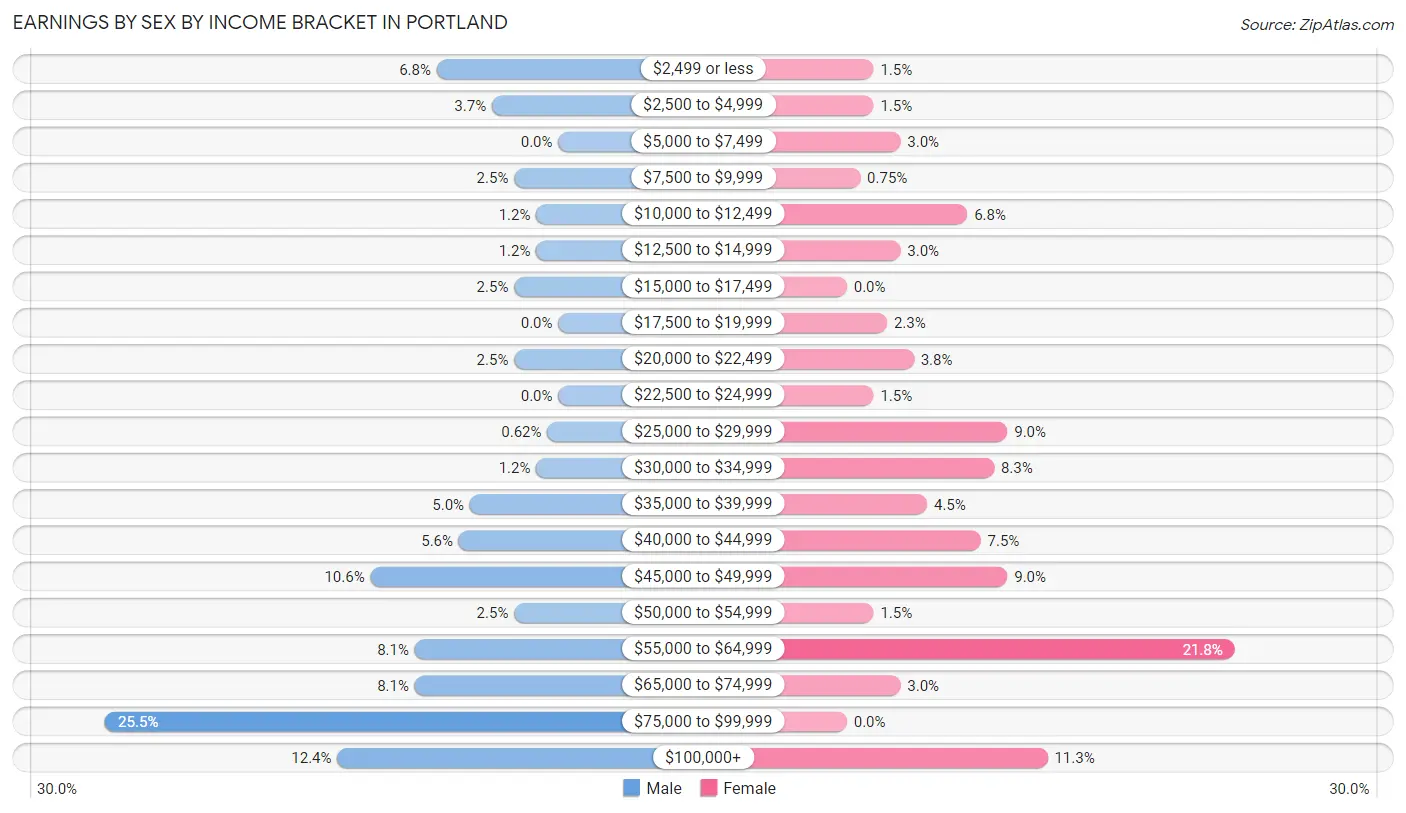
Earnings by Sex by Income Bracket in Portland
The most common earnings brackets in Portland are $75,000 to $99,999 for men (41 | 25.5%) and $55,000 to $64,999 for women (29 | 21.8%).
| Income | Male | Female |
| $2,499 or less | 11 (6.8%) | 2 (1.5%) |
| $2,500 to $4,999 | 6 (3.7%) | 2 (1.5%) |
| $5,000 to $7,499 | 0 (0.0%) | 4 (3.0%) |
| $7,500 to $9,999 | 4 (2.5%) | 1 (0.7%) |
| $10,000 to $12,499 | 2 (1.2%) | 9 (6.8%) |
| $12,500 to $14,999 | 2 (1.2%) | 4 (3.0%) |
| $15,000 to $17,499 | 4 (2.5%) | 0 (0.0%) |
| $17,500 to $19,999 | 0 (0.0%) | 3 (2.3%) |
| $20,000 to $22,499 | 4 (2.5%) | 5 (3.8%) |
| $22,500 to $24,999 | 0 (0.0%) | 2 (1.5%) |
| $25,000 to $29,999 | 1 (0.6%) | 12 (9.0%) |
| $30,000 to $34,999 | 2 (1.2%) | 11 (8.3%) |
| $35,000 to $39,999 | 8 (5.0%) | 6 (4.5%) |
| $40,000 to $44,999 | 9 (5.6%) | 10 (7.5%) |
| $45,000 to $49,999 | 17 (10.6%) | 12 (9.0%) |
| $50,000 to $54,999 | 4 (2.5%) | 2 (1.5%) |
| $55,000 to $64,999 | 13 (8.1%) | 29 (21.8%) |
| $65,000 to $74,999 | 13 (8.1%) | 4 (3.0%) |
| $75,000 to $99,999 | 41 (25.5%) | 0 (0.0%) |
| $100,000+ | 20 (12.4%) | 15 (11.3%) |
| Total | 161 (100.0%) | 133 (100.0%) |
Earnings by Sex by Educational Attainment in Portland
Average earnings in Portland are $60,000 for men and $48,000 for women, a difference of 20.0%. Men with an educational attainment of graduate degree enjoy the highest average annual earnings of $120,625, while those with high school diploma education earn the least with $35,833. Women with an educational attainment of bachelor's degree earn the most with the average annual earnings of $58,125, while those with college or associate's degree education have the smallest earnings of $43,750.
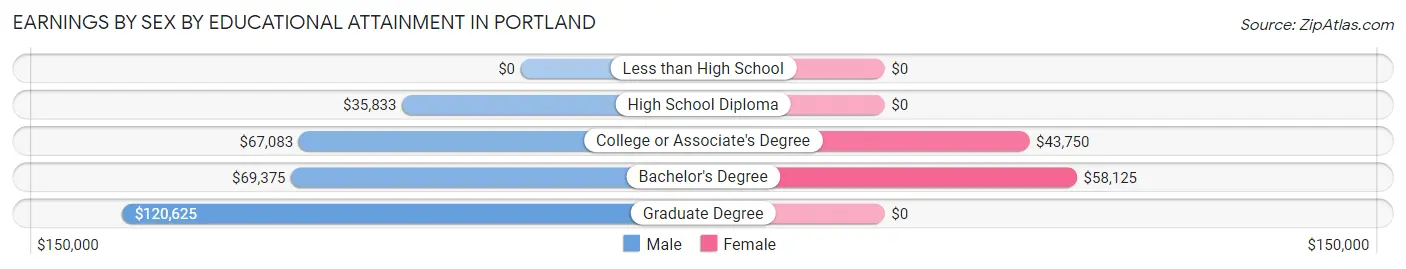
| Educational Attainment | Male Income | Female Income |
| Less than High School | - | - |
| High School Diploma | $35,833 | $0 |
| College or Associate's Degree | $67,083 | $43,750 |
| Bachelor's Degree | $69,375 | $58,125 |
| Graduate Degree | $120,625 | $0 |
| Total | $60,000 | $48,000 |
Family Income in Portland
Family Income Brackets in Portland
According to the Portland family income data, there are 57 families falling into the $100,000 to $149,999 income range, which is the most common income bracket and makes up 32.4% of all families.
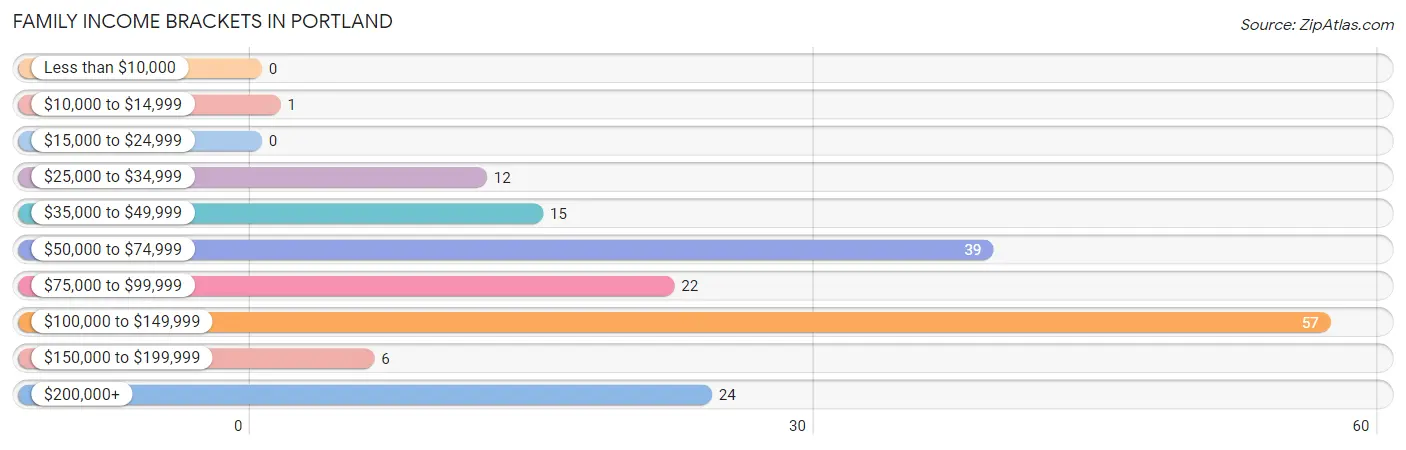
| Income Bracket | # Families | % Families |
| Less than $10,000 | 0 | 0.0% |
| $10,000 to $14,999 | 1 | 0.6% |
| $15,000 to $24,999 | 0 | 0.0% |
| $25,000 to $34,999 | 12 | 6.8% |
| $35,000 to $49,999 | 15 | 8.5% |
| $50,000 to $74,999 | 39 | 22.2% |
| $75,000 to $99,999 | 22 | 12.5% |
| $100,000 to $149,999 | 57 | 32.4% |
| $150,000 to $199,999 | 6 | 3.4% |
| $200,000+ | 24 | 13.6% |
Family Income by Famaliy Size in Portland
4-person families (19 | 10.8%) account for the highest median family income in Portland with $118,036 per family, while 2-person families (113 | 64.2%) have the highest median income of $51,042 per family member.
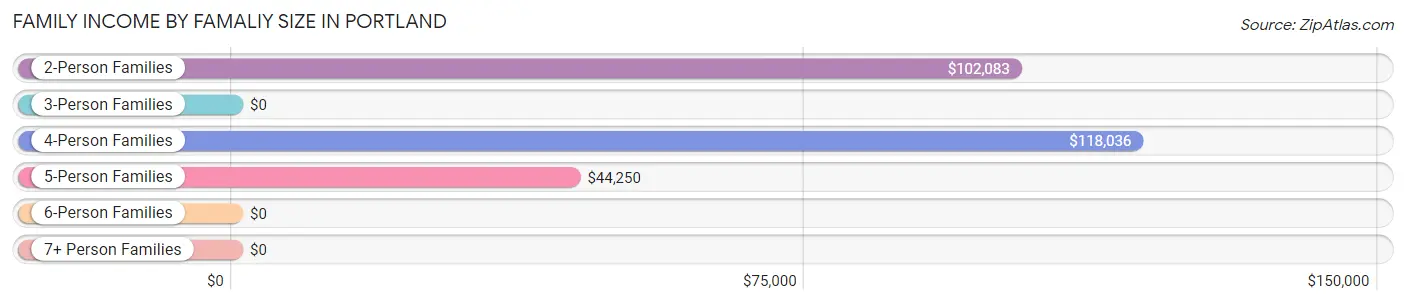
| Income Bracket | # Families | Median Income |
| 2-Person Families | 113 (64.2%) | $102,083 |
| 3-Person Families | 19 (10.8%) | $0 |
| 4-Person Families | 19 (10.8%) | $118,036 |
| 5-Person Families | 14 (8.0%) | $44,250 |
| 6-Person Families | 11 (6.2%) | $0 |
| 7+ Person Families | 0 (0.0%) | $0 |
| Total | 176 (100.0%) | $99,500 |
Family Income by Number of Earners in Portland
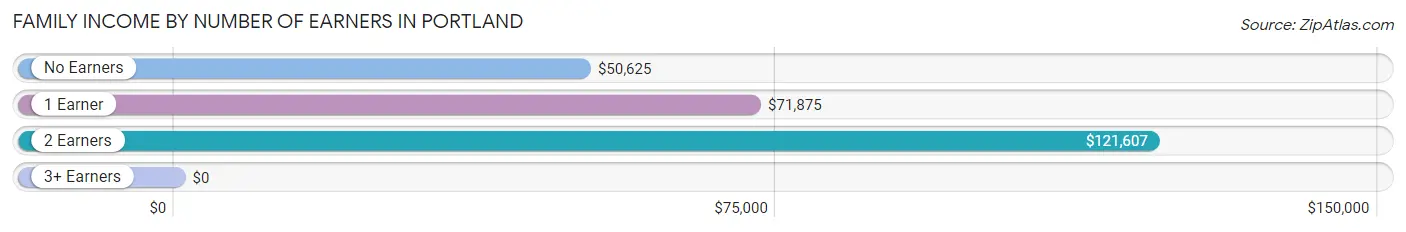
| Number of Earners | # Families | Median Income |
| No Earners | 32 (18.2%) | $50,625 |
| 1 Earner | 43 (24.4%) | $71,875 |
| 2 Earners | 97 (55.1%) | $121,607 |
| 3+ Earners | 4 (2.3%) | $0 |
| Total | 176 (100.0%) | $99,500 |
Household Income in Portland
Household Income Brackets in Portland
With 57 households falling in the category, the $100,000 to $149,999 income range is the most frequent in Portland, accounting for 22.9% of all households. In contrast, only 6 households (2.4%) fall into the $150,000 to $199,999 income bracket, making it the least populous group.
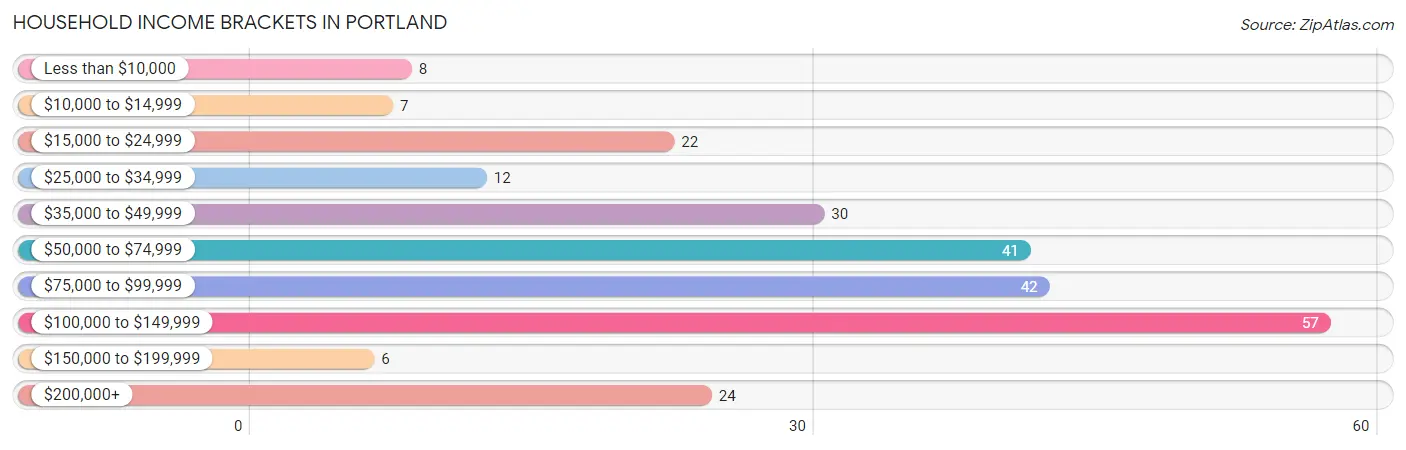
| Income Bracket | # Households | % Households |
| Less than $10,000 | 8 | 3.2% |
| $10,000 to $14,999 | 7 | 2.8% |
| $15,000 to $24,999 | 22 | 8.8% |
| $25,000 to $34,999 | 12 | 4.8% |
| $35,000 to $49,999 | 30 | 12.0% |
| $50,000 to $74,999 | 41 | 16.5% |
| $75,000 to $99,999 | 42 | 16.9% |
| $100,000 to $149,999 | 57 | 22.9% |
| $150,000 to $199,999 | 6 | 2.4% |
| $200,000+ | 24 | 9.6% |
Household Income by Householder Age in Portland
The median household income in Portland is $77,250, with the highest median household income of $103,125 found in the 25 to 44 years age bracket for the primary householder. A total of 53 households (21.3%) fall into this category. Meanwhile, the 15 to 24 years age bracket for the primary householder has the lowest median household income of $0, with 9 households (3.6%) in this group.
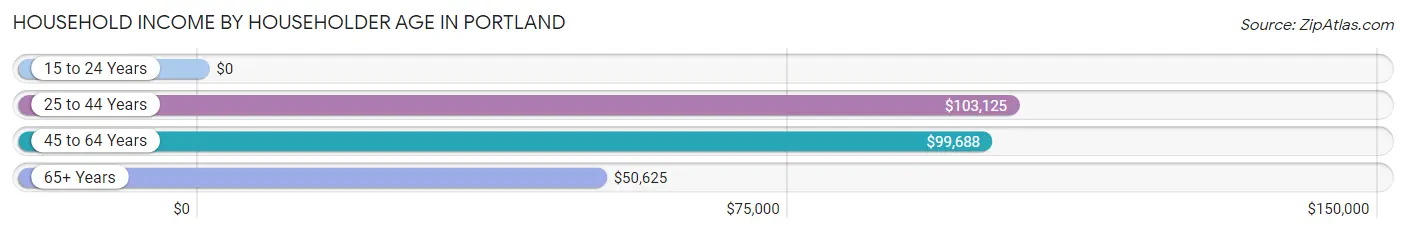
| Income Bracket | # Households | Median Income |
| 15 to 24 Years | 9 (3.6%) | $0 |
| 25 to 44 Years | 53 (21.3%) | $103,125 |
| 45 to 64 Years | 111 (44.6%) | $99,688 |
| 65+ Years | 76 (30.5%) | $50,625 |
| Total | 249 (100.0%) | $77,250 |
Poverty in Portland
Income Below Poverty by Sex and Age in Portland
With 4.8% poverty level for males and 4.1% for females among the residents of Portland, 18 to 24 year old males and 15 year old females are the most vulnerable to poverty, with 5 males (100.0%) and 2 females (50.0%) in their respective age groups living below the poverty level.
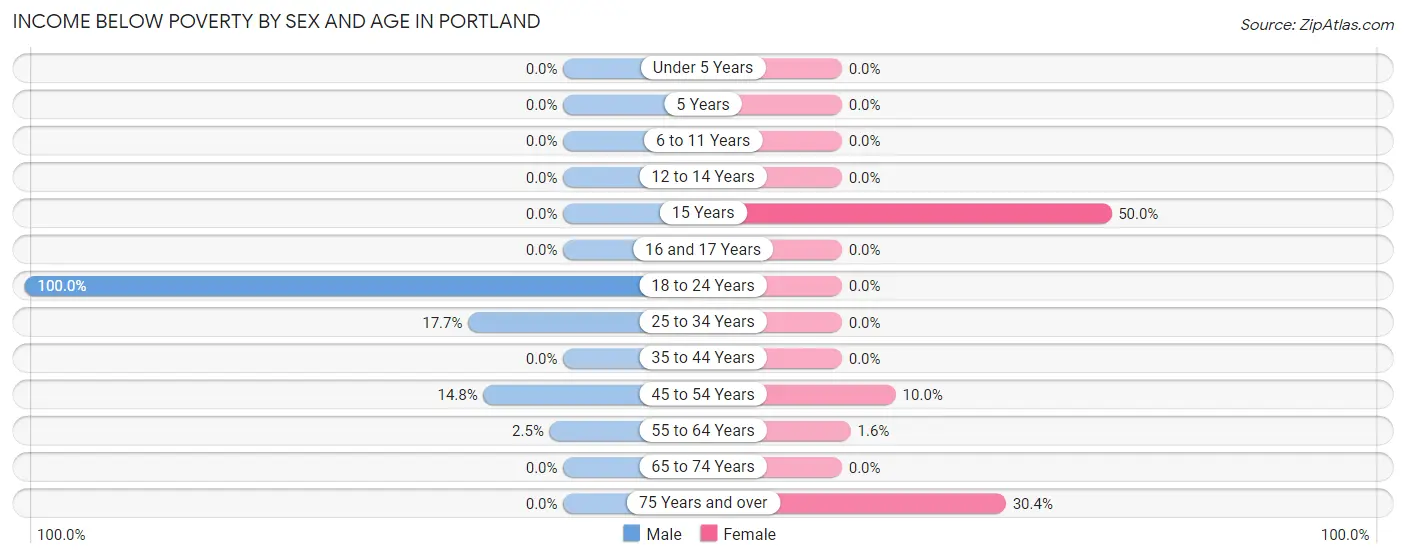
| Age Bracket | Male | Female |
| Under 5 Years | 0 (0.0%) | 0 (0.0%) |
| 5 Years | 0 (0.0%) | 0 (0.0%) |
| 6 to 11 Years | 0 (0.0%) | 0 (0.0%) |
| 12 to 14 Years | 0 (0.0%) | 0 (0.0%) |
| 15 Years | 0 (0.0%) | 2 (50.0%) |
| 16 and 17 Years | 0 (0.0%) | 0 (0.0%) |
| 18 to 24 Years | 5 (100.0%) | 0 (0.0%) |
| 25 to 34 Years | 3 (17.6%) | 0 (0.0%) |
| 35 to 44 Years | 0 (0.0%) | 0 (0.0%) |
| 45 to 54 Years | 4 (14.8%) | 1 (10.0%) |
| 55 to 64 Years | 2 (2.5%) | 1 (1.6%) |
| 65 to 74 Years | 0 (0.0%) | 0 (0.0%) |
| 75 Years and over | 0 (0.0%) | 7 (30.4%) |
| Total | 14 (4.8%) | 11 (4.1%) |
Income Above Poverty by Sex and Age in Portland
According to the poverty statistics in Portland, males aged under 5 years and females aged under 5 years are the age groups that are most secure financially, with 100.0% of males and 100.0% of females in these age groups living above the poverty line.
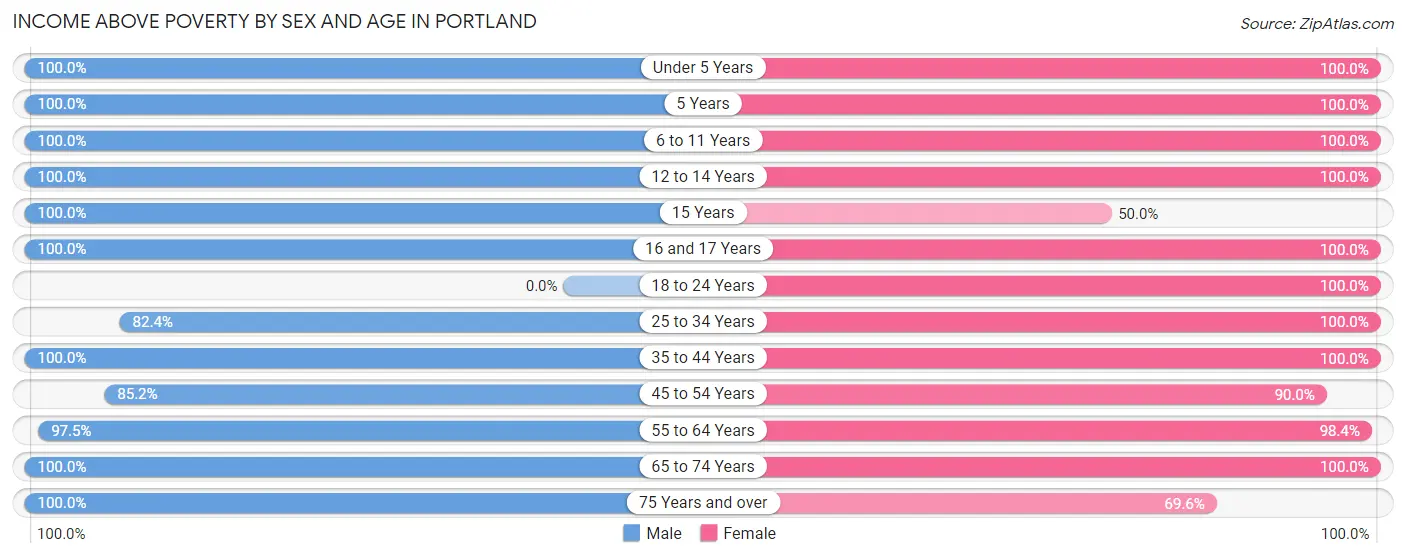
| Age Bracket | Male | Female |
| Under 5 Years | 23 (100.0%) | 32 (100.0%) |
| 5 Years | 8 (100.0%) | 14 (100.0%) |
| 6 to 11 Years | 42 (100.0%) | 2 (100.0%) |
| 12 to 14 Years | 3 (100.0%) | 16 (100.0%) |
| 15 Years | 5 (100.0%) | 2 (50.0%) |
| 16 and 17 Years | 3 (100.0%) | 3 (100.0%) |
| 18 to 24 Years | 0 (0.0%) | 14 (100.0%) |
| 25 to 34 Years | 14 (82.4%) | 35 (100.0%) |
| 35 to 44 Years | 29 (100.0%) | 20 (100.0%) |
| 45 to 54 Years | 23 (85.2%) | 9 (90.0%) |
| 55 to 64 Years | 77 (97.5%) | 60 (98.4%) |
| 65 to 74 Years | 30 (100.0%) | 36 (100.0%) |
| 75 Years and over | 21 (100.0%) | 16 (69.6%) |
| Total | 278 (95.2%) | 259 (95.9%) |
Income Below Poverty Among Married-Couple Families in Portland
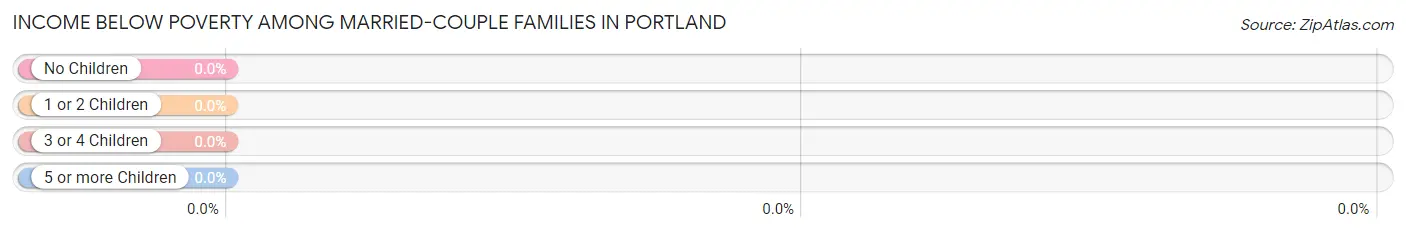
| Children | Above Poverty | Below Poverty |
| No Children | 106 (100.0%) | 0 (0.0%) |
| 1 or 2 Children | 25 (100.0%) | 0 (0.0%) |
| 3 or 4 Children | 15 (100.0%) | 0 (0.0%) |
| 5 or more Children | 0 (0.0%) | 0 (0.0%) |
| Total | 146 (100.0%) | 0 (0.0%) |
Income Below Poverty Among Single-Parent Households in Portland
| Children | Single Father | Single Mother |
| No Children | 0 (0.0%) | 1 (16.7%) |
| 1 or 2 Children | 0 (0.0%) | 0 (0.0%) |
| 3 or 4 Children | 0 (0.0%) | 0 (0.0%) |
| 5 or more Children | 0 (0.0%) | 0 (0.0%) |
| Total | 0 (0.0%) | 1 (3.6%) |
Income Below Poverty Among Married-Couple vs Single-Parent Households in Portland
| Children | Married-Couple Families | Single-Parent Households |
| No Children | 0 (0.0%) | 1 (16.7%) |
| 1 or 2 Children | 0 (0.0%) | 0 (0.0%) |
| 3 or 4 Children | 0 (0.0%) | 0 (0.0%) |
| 5 or more Children | 0 (0.0%) | 0 (0.0%) |
| Total | 0 (0.0%) | 1 (3.3%) |
Race in Portland
The most populous races in Portland are White / Caucasian (502 | 89.3%), Native / Alaskan (53 | 9.4%), and Black / African American (7 | 1.3%).
| Race | # Population | % Population |
| Asian | 0 | 0.0% |
| Black / African American | 7 | 1.3% |
| Hawaiian / Pacific | 0 | 0.0% |
| Hispanic or Latino | 0 | 0.0% |
| Native / Alaskan | 53 | 9.4% |
| White / Caucasian | 502 | 89.3% |
| Two or more Races | 0 | 0.0% |
| Some other Race | 0 | 0.0% |
| Total | 562 | 100.0% |
Ancestry in Portland
The most populous ancestries reported in Portland are Norwegian (300 | 53.4%), German (86 | 15.3%), English (29 | 5.2%), Scandinavian (25 | 4.4%), and Swedish (21 | 3.7%), together accounting for 82.0% of all Portland residents.
| Ancestry | # Population | % Population |
| American | 11 | 2.0% |
| Chippewa | 17 | 3.0% |
| Czech | 13 | 2.3% |
| Danish | 2 | 0.4% |
| Eastern European | 2 | 0.4% |
| English | 29 | 5.2% |
| French Canadian | 14 | 2.5% |
| German | 86 | 15.3% |
| Icelander | 4 | 0.7% |
| Irish | 19 | 3.4% |
| Italian | 5 | 0.9% |
| Norwegian | 300 | 53.4% |
| Polish | 2 | 0.4% |
| Scandinavian | 25 | 4.4% |
| Sioux | 17 | 3.0% |
| Swedish | 21 | 3.7% | View All 16 Rows |
Immigrants in Portland

| Immigration Origin | # Population | % Population | View All 0 Rows |
Sex and Age in Portland
Sex and Age in Portland
The most populous age groups in Portland are 55 to 59 Years (43 | 14.7%) for men and 55 to 59 Years (34 | 12.6%) for women.
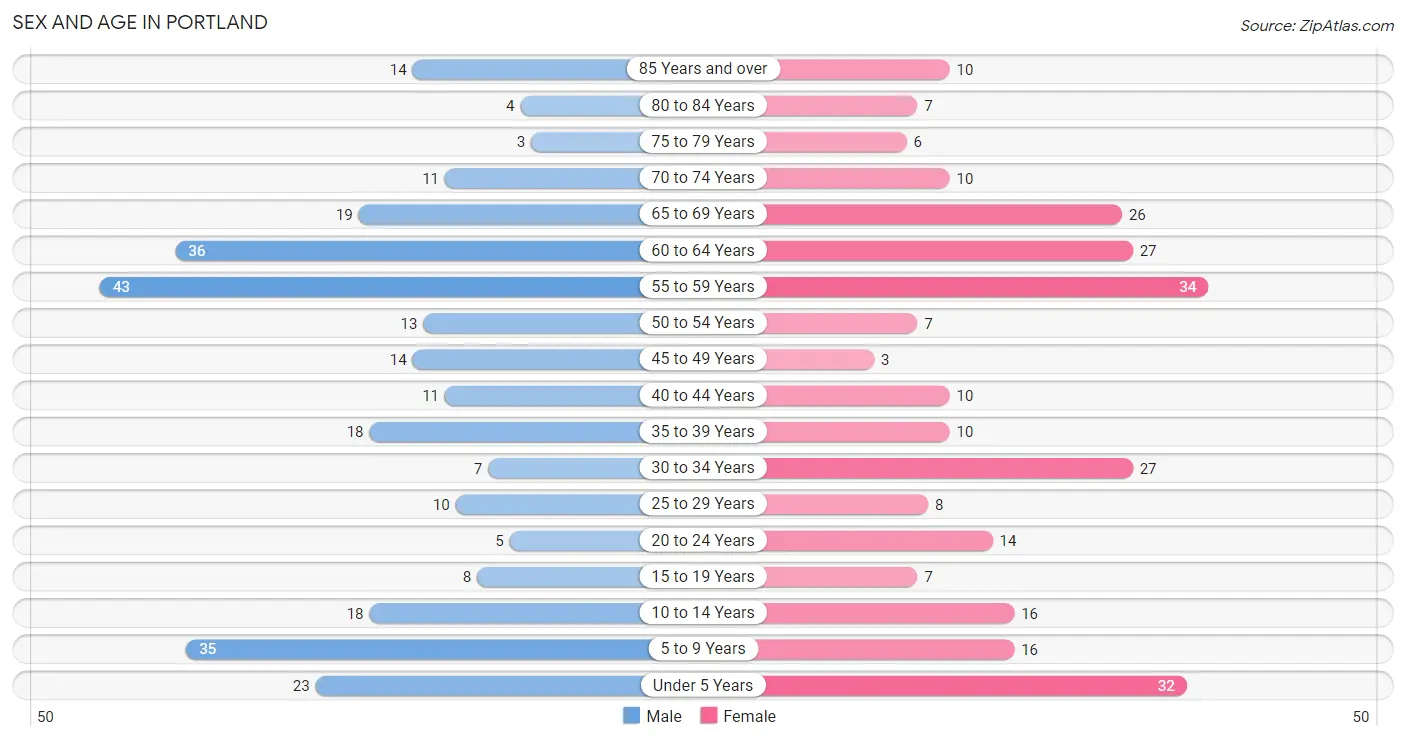
| Age Bracket | Male | Female |
| Under 5 Years | 23 (7.9%) | 32 (11.8%) |
| 5 to 9 Years | 35 (12.0%) | 16 (5.9%) |
| 10 to 14 Years | 18 (6.2%) | 16 (5.9%) |
| 15 to 19 Years | 8 (2.7%) | 7 (2.6%) |
| 20 to 24 Years | 5 (1.7%) | 14 (5.2%) |
| 25 to 29 Years | 10 (3.4%) | 8 (3.0%) |
| 30 to 34 Years | 7 (2.4%) | 27 (10.0%) |
| 35 to 39 Years | 18 (6.2%) | 10 (3.7%) |
| 40 to 44 Years | 11 (3.8%) | 10 (3.7%) |
| 45 to 49 Years | 14 (4.8%) | 3 (1.1%) |
| 50 to 54 Years | 13 (4.4%) | 7 (2.6%) |
| 55 to 59 Years | 43 (14.7%) | 34 (12.6%) |
| 60 to 64 Years | 36 (12.3%) | 27 (10.0%) |
| 65 to 69 Years | 19 (6.5%) | 26 (9.6%) |
| 70 to 74 Years | 11 (3.8%) | 10 (3.7%) |
| 75 to 79 Years | 3 (1.0%) | 6 (2.2%) |
| 80 to 84 Years | 4 (1.4%) | 7 (2.6%) |
| 85 Years and over | 14 (4.8%) | 10 (3.7%) |
| Total | 292 (100.0%) | 270 (100.0%) |
Families and Households in Portland
Median Family Size in Portland
The median family size in Portland is 2.74 persons per family, with single female/mother families (28 | 15.9%) accounting for the largest median family size of 2.82 persons per family. On the other hand, single male/father families (2 | 1.1%) represent the smallest median family size with 2.50 persons per family.
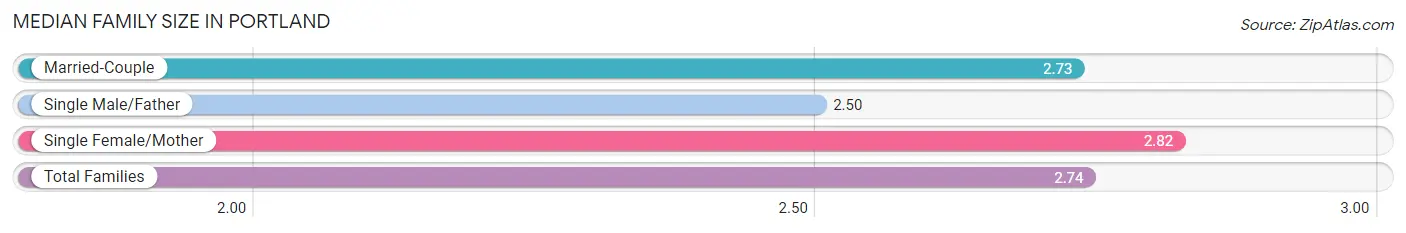
| Family Type | # Families | Family Size |
| Married-Couple | 146 (83.0%) | 2.73 |
| Single Male/Father | 2 (1.1%) | 2.50 |
| Single Female/Mother | 28 (15.9%) | 2.82 |
| Total Families | 176 (100.0%) | 2.74 |
Median Household Size in Portland
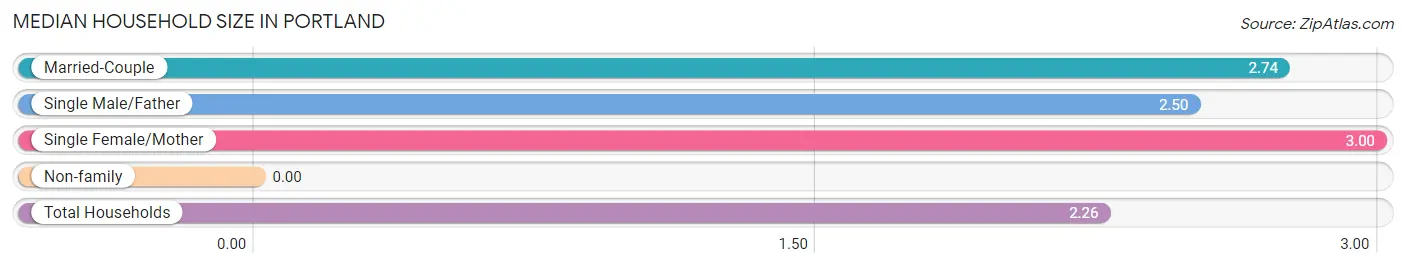
| Household Type | # Households | Household Size |
| Married-Couple | 146 (58.6%) | 2.74 |
| Single Male/Father | 2 (0.8%) | 2.50 |
| Single Female/Mother | 28 (11.2%) | 3.00 |
| Non-family | 73 (29.3%) | - |
| Total Households | 249 (100.0%) | 2.26 |
Household Size by Marriage Status in Portland
Out of a total of 249 households in Portland, 176 (70.7%) are family households, while 73 (29.3%) are nonfamily households. The most numerous type of family households are 2-person households, comprising 111, and the most common type of nonfamily households are 1-person households, comprising 73.
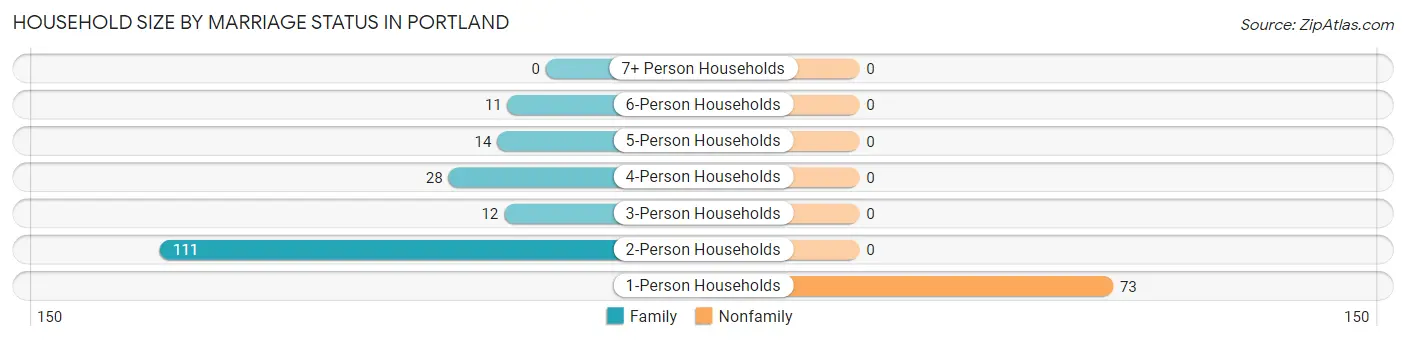
| Household Size | Family Households | Nonfamily Households |
| 1-Person Households | - | 73 (29.3%) |
| 2-Person Households | 111 (44.6%) | 0 (0.0%) |
| 3-Person Households | 12 (4.8%) | 0 (0.0%) |
| 4-Person Households | 28 (11.2%) | 0 (0.0%) |
| 5-Person Households | 14 (5.6%) | 0 (0.0%) |
| 6-Person Households | 11 (4.4%) | 0 (0.0%) |
| 7+ Person Households | 0 (0.0%) | 0 (0.0%) |
| Total | 176 (70.7%) | 73 (29.3%) |
Female Fertility in Portland
Fertility by Age in Portland
Average fertility rate in Portland is 169.0 births per 1,000 women. Women in the age bracket of 20 to 34 years have the highest fertility rate with 286.0 births per 1,000 women. Women in the age bracket of 20 to 34 years acount for 100.0% of all women with births.
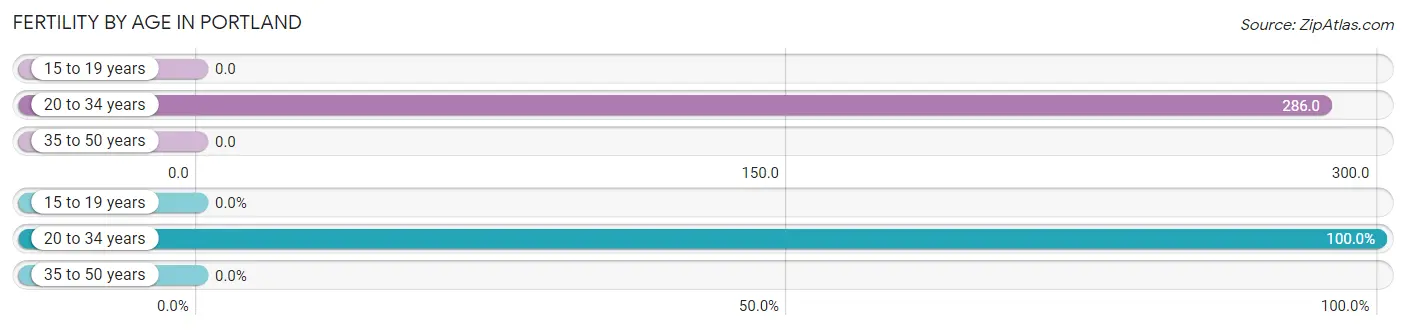
| Age Bracket | Women with Births | Births / 1,000 Women |
| 15 to 19 years | 0 (0.0%) | 0.0 |
| 20 to 34 years | 14 (100.0%) | 286.0 |
| 35 to 50 years | 0 (0.0%) | 0.0 |
| Total | 14 (100.0%) | 169.0 |
Fertility by Age by Marriage Status in Portland
35.7% of women with births (14) in Portland are married. The highest percentage of unmarried women with births falls into 20 to 34 years age bracket with 64.3% of them unmarried at the time of birth, while the lowest percentage of unmarried women with births belong to 20 to 34 years age bracket with 64.3% of them unmarried.
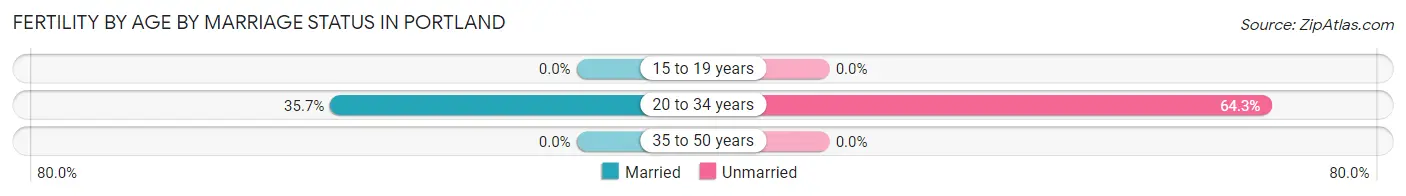
| Age Bracket | Married | Unmarried |
| 15 to 19 years | 0 (0.0%) | 0 (0.0%) |
| 20 to 34 years | 5 (35.7%) | 9 (64.3%) |
| 35 to 50 years | 0 (0.0%) | 0 (0.0%) |
| Total | 5 (35.7%) | 9 (64.3%) |
Fertility by Education in Portland
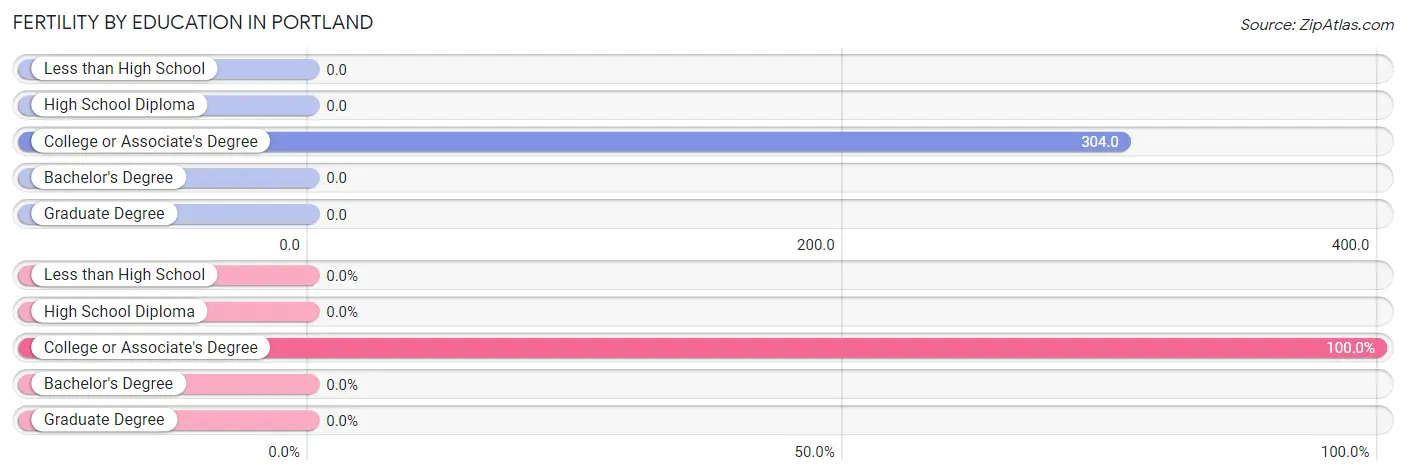
| Educational Attainment | Women with Births | Births / 1,000 Women |
| Less than High School | 0 (0.0%) | 0.0 |
| High School Diploma | 0 (0.0%) | 0.0 |
| College or Associate's Degree | 14 (100.0%) | 304.0 |
| Bachelor's Degree | 0 (0.0%) | 0.0 |
| Graduate Degree | 0 (0.0%) | 0.0 |
| Total | 14 (100.0%) | 169.0 |
Fertility by Education by Marriage Status in Portland
64.3% of women with births in Portland are unmarried. Women with the educational attainment of college or associate's degree are most likely to be married with 35.7% of them married at childbirth, while women with the educational attainment of college or associate's degree are least likely to be married with 64.3% of them unmarried at childbirth.
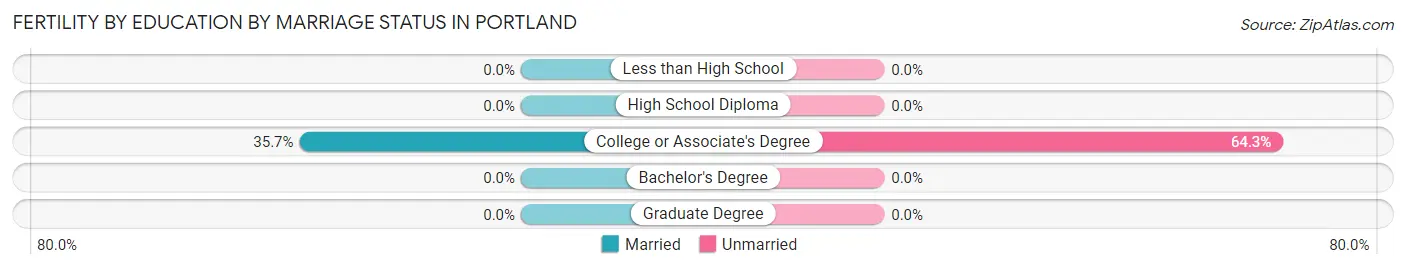
| Educational Attainment | Married | Unmarried |
| Less than High School | 0 (0.0%) | 0 (0.0%) |
| High School Diploma | 0 (0.0%) | 0 (0.0%) |
| College or Associate's Degree | 5 (35.7%) | 9 (64.3%) |
| Bachelor's Degree | 0 (0.0%) | 0 (0.0%) |
| Graduate Degree | 0 (0.0%) | 0 (0.0%) |
| Total | 5 (35.7%) | 9 (64.3%) |
Employment Characteristics in Portland
Employment by Class of Employer in Portland
Among the 272 employed individuals in Portland, private company employees (155 | 57.0%), self-employed (not incorporated) (37 | 13.6%), and not-for-profit organizations (25 | 9.2%) make up the most common classes of employment.
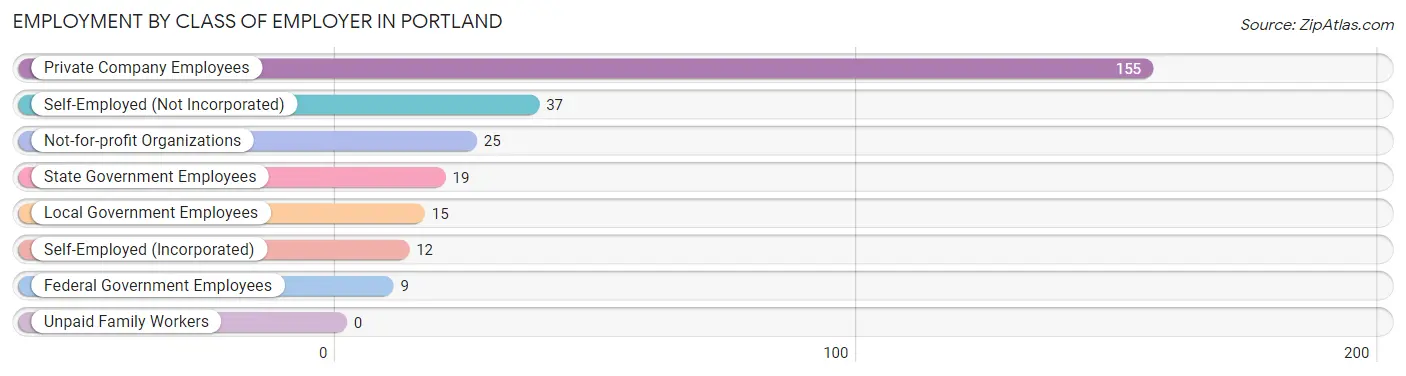
| Employer Class | # Employees | % Employees |
| Private Company Employees | 155 | 57.0% |
| Self-Employed (Incorporated) | 12 | 4.4% |
| Self-Employed (Not Incorporated) | 37 | 13.6% |
| Not-for-profit Organizations | 25 | 9.2% |
| Local Government Employees | 15 | 5.5% |
| State Government Employees | 19 | 7.0% |
| Federal Government Employees | 9 | 3.3% |
| Unpaid Family Workers | 0 | 0.0% |
| Total | 272 | 100.0% |
Employment Status by Age in Portland
According to the labor force statistics for Portland, out of the total population over 16 years of age (413), 67.6% or 279 individuals are in the labor force, with 1.4% or 4 of them unemployed. The age group with the highest labor force participation rate is 35 to 44 years, with 100.0% or 49 individuals in the labor force. Within the labor force, the 45 to 54 years age range has the highest percentage of unemployed individuals, with 11.1% or 4 of them being unemployed.
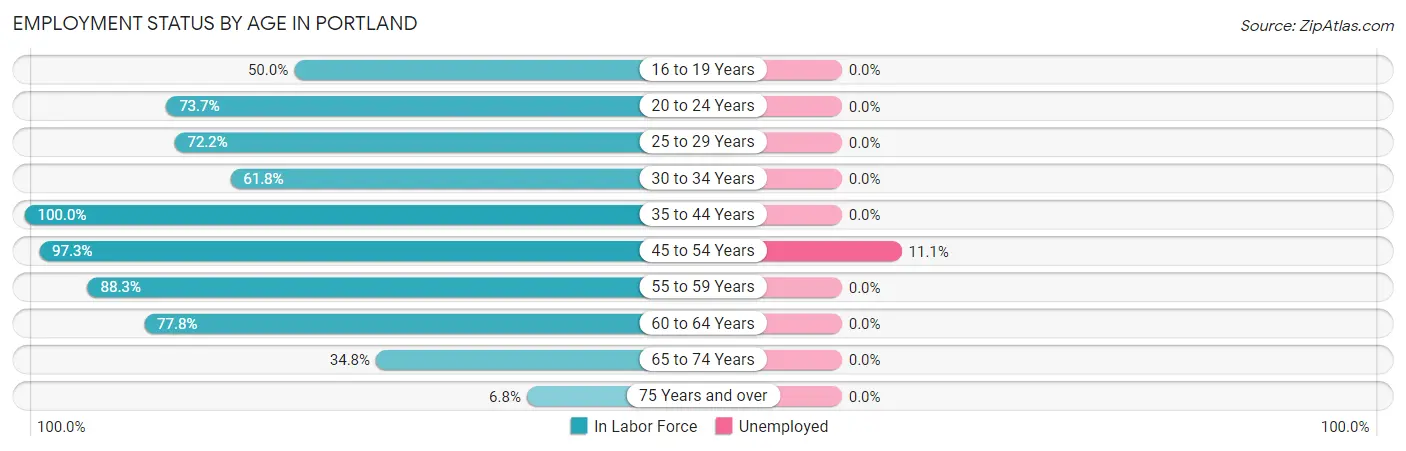
| Age Bracket | In Labor Force | Unemployed |
| 16 to 19 Years | 3 (50.0%) | 0 (0.0%) |
| 20 to 24 Years | 14 (73.7%) | 0 (0.0%) |
| 25 to 29 Years | 13 (72.2%) | 0 (0.0%) |
| 30 to 34 Years | 21 (61.8%) | 0 (0.0%) |
| 35 to 44 Years | 49 (100.0%) | 0 (0.0%) |
| 45 to 54 Years | 36 (97.3%) | 4 (11.1%) |
| 55 to 59 Years | 68 (88.3%) | 0 (0.0%) |
| 60 to 64 Years | 49 (77.8%) | 0 (0.0%) |
| 65 to 74 Years | 23 (34.8%) | 0 (0.0%) |
| 75 Years and over | 3 (6.8%) | 0 (0.0%) |
| Total | 279 (67.6%) | 4 (1.4%) |
Employment Status by Educational Attainment in Portland
According to labor force statistics for Portland, 84.9% of individuals (236) out of the total population between 25 and 64 years of age (278) are in the labor force, with 1.7% or 4 of them being unemployed. The group with the highest labor force participation rate are those with the educational attainment of college / associate degree, with 90.5% or 105 individuals in the labor force. Within the labor force, individuals with high school diploma education have the highest percentage of unemployment, with 8.5% or 4 of them being unemployed.
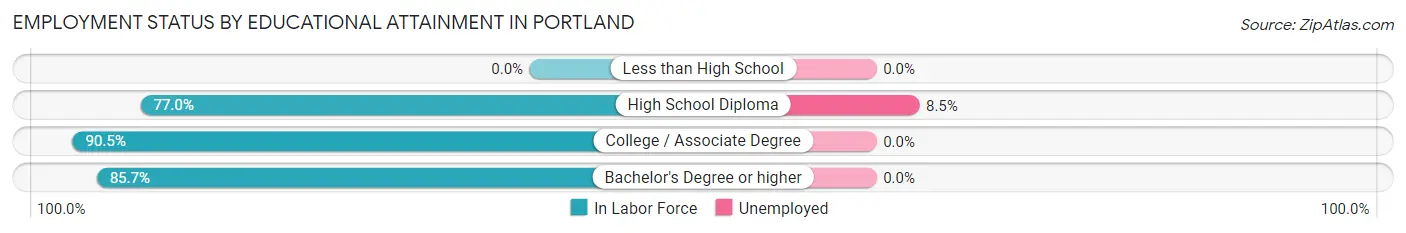
| Educational Attainment | In Labor Force | Unemployed |
| Less than High School | 0 (0.0%) | 0 (0.0%) |
| High School Diploma | 47 (77.0%) | 5 (8.5%) |
| College / Associate Degree | 105 (90.5%) | 0 (0.0%) |
| Bachelor's Degree or higher | 84 (85.7%) | 0 (0.0%) |
| Total | 236 (84.9%) | 5 (1.7%) |
Employment Occupations by Sex in Portland
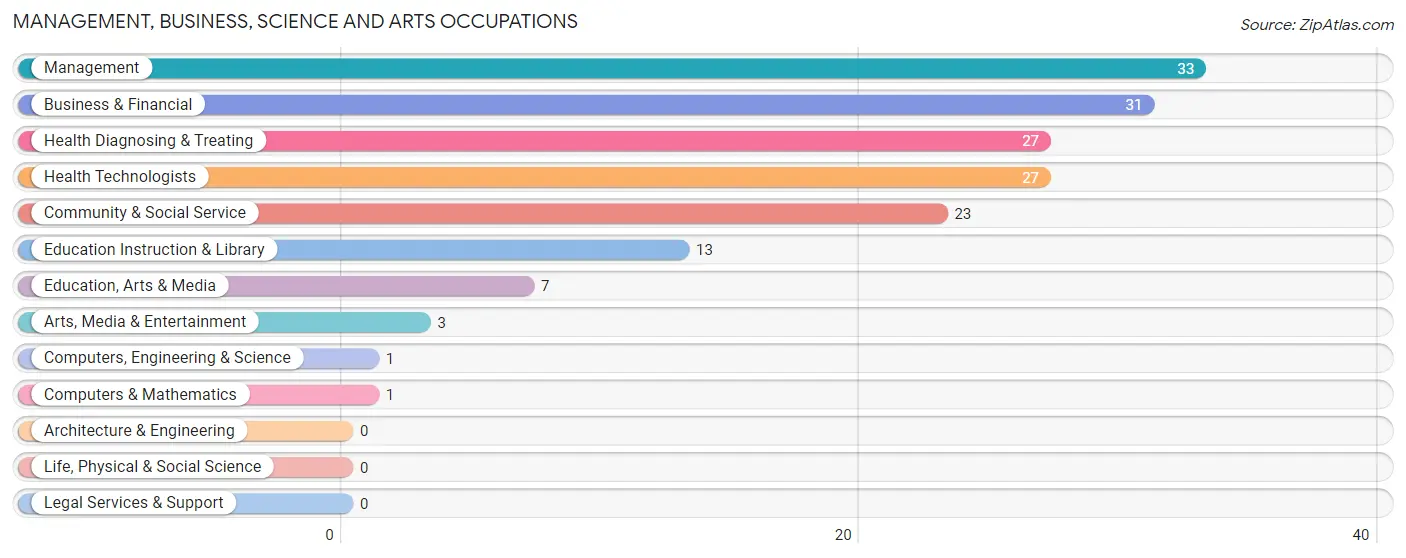
Management, Business, Science and Arts Occupations
The most common Management, Business, Science and Arts occupations in Portland are Management (33 | 12.0%), Business & Financial (31 | 11.3%), Health Diagnosing & Treating (27 | 9.8%), Health Technologists (27 | 9.8%), and Community & Social Service (23 | 8.4%).
Management, Business, Science and Arts Occupations by Sex
Within the Management, Business, Science and Arts occupations in Portland, the most male-oriented occupations are Computers, Engineering & Science (100.0%), Computers & Mathematics (100.0%), and Management (66.7%), while the most female-oriented occupations are Education, Arts & Media (100.0%), Arts, Media & Entertainment (100.0%), and Community & Social Service (82.6%).
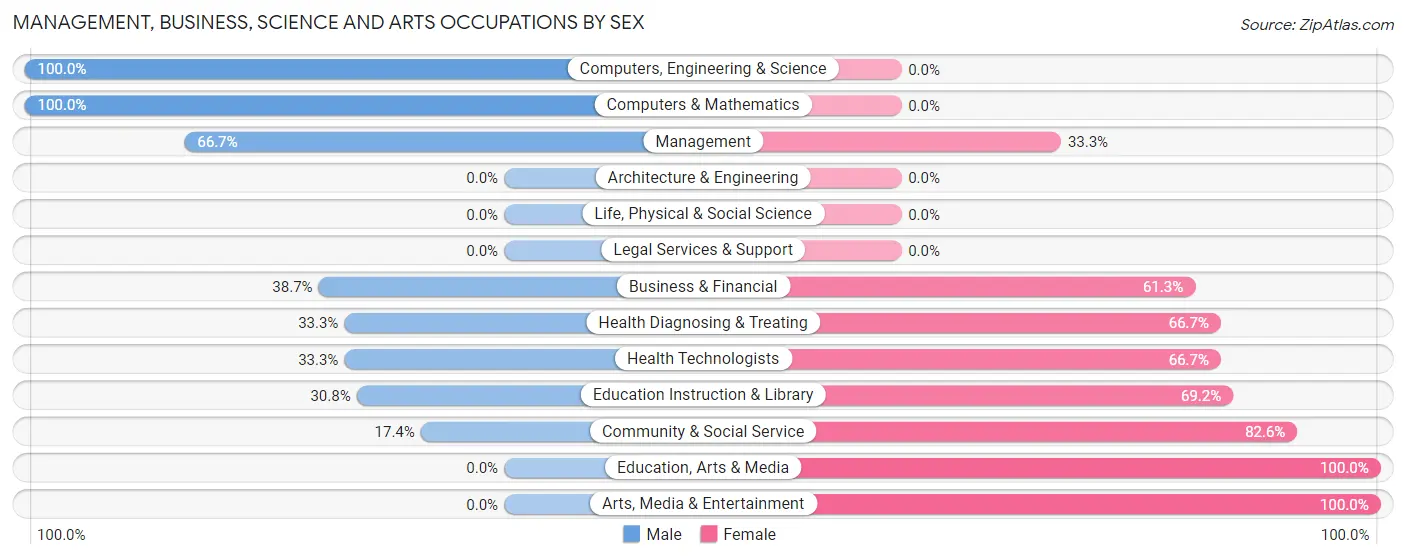
| Occupation | Male | Female |
| Management | 22 (66.7%) | 11 (33.3%) |
| Business & Financial | 12 (38.7%) | 19 (61.3%) |
| Computers, Engineering & Science | 1 (100.0%) | 0 (0.0%) |
| Computers & Mathematics | 1 (100.0%) | 0 (0.0%) |
| Architecture & Engineering | 0 (0.0%) | 0 (0.0%) |
| Life, Physical & Social Science | 0 (0.0%) | 0 (0.0%) |
| Community & Social Service | 4 (17.4%) | 19 (82.6%) |
| Education, Arts & Media | 0 (0.0%) | 7 (100.0%) |
| Legal Services & Support | 0 (0.0%) | 0 (0.0%) |
| Education Instruction & Library | 4 (30.8%) | 9 (69.2%) |
| Arts, Media & Entertainment | 0 (0.0%) | 3 (100.0%) |
| Health Diagnosing & Treating | 9 (33.3%) | 18 (66.7%) |
| Health Technologists | 9 (33.3%) | 18 (66.7%) |
| Total (Category) | 48 (41.7%) | 67 (58.3%) |
| Total (Overall) | 144 (52.4%) | 131 (47.6%) |
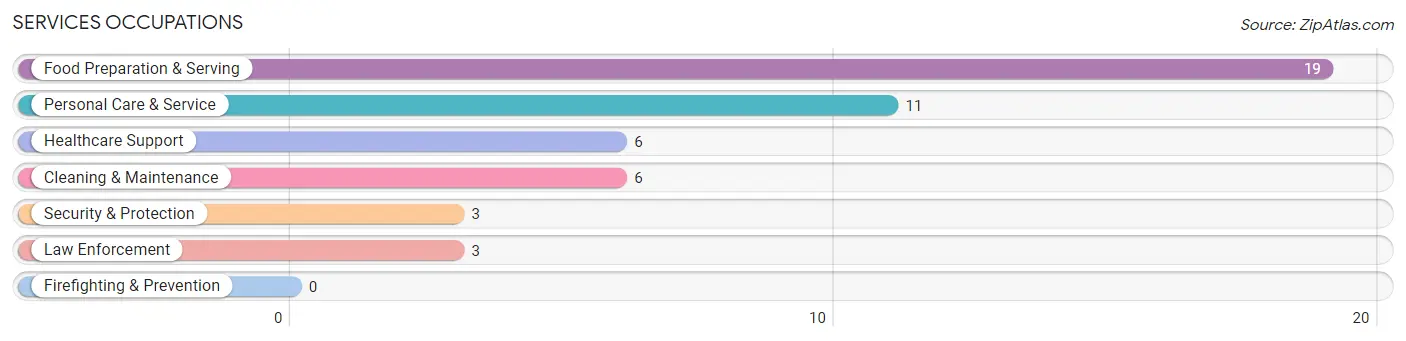
Services Occupations
The most common Services occupations in Portland are Food Preparation & Serving (19 | 6.9%), Personal Care & Service (11 | 4.0%), Healthcare Support (6 | 2.2%), Cleaning & Maintenance (6 | 2.2%), and Security & Protection (3 | 1.1%).
Services Occupations by Sex
Within the Services occupations in Portland, the most male-oriented occupations are Security & Protection (100.0%), Law Enforcement (100.0%), and Cleaning & Maintenance (33.3%), while the most female-oriented occupations are Healthcare Support (100.0%), Personal Care & Service (100.0%), and Food Preparation & Serving (68.4%).
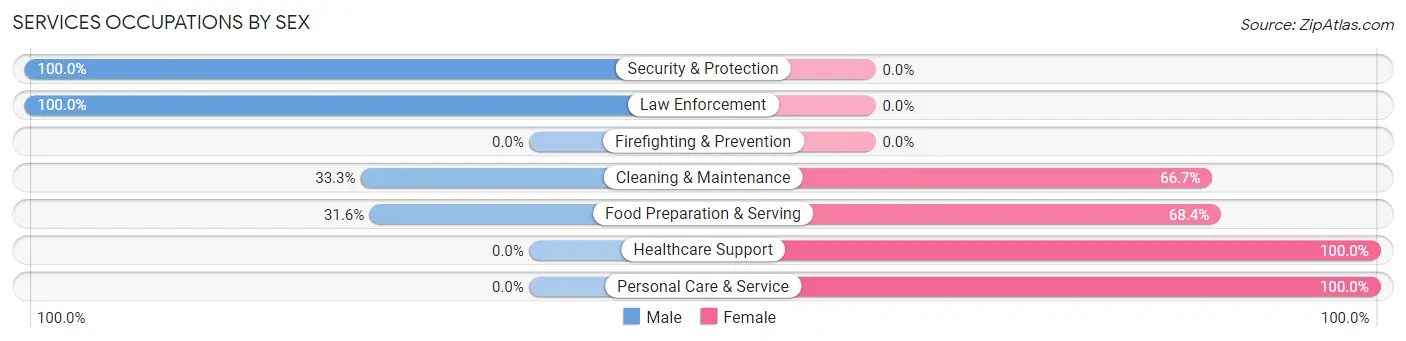
| Occupation | Male | Female |
| Healthcare Support | 0 (0.0%) | 6 (100.0%) |
| Security & Protection | 3 (100.0%) | 0 (0.0%) |
| Firefighting & Prevention | 0 (0.0%) | 0 (0.0%) |
| Law Enforcement | 3 (100.0%) | 0 (0.0%) |
| Food Preparation & Serving | 6 (31.6%) | 13 (68.4%) |
| Cleaning & Maintenance | 2 (33.3%) | 4 (66.7%) |
| Personal Care & Service | 0 (0.0%) | 11 (100.0%) |
| Total (Category) | 11 (24.4%) | 34 (75.6%) |
| Total (Overall) | 144 (52.4%) | 131 (47.6%) |
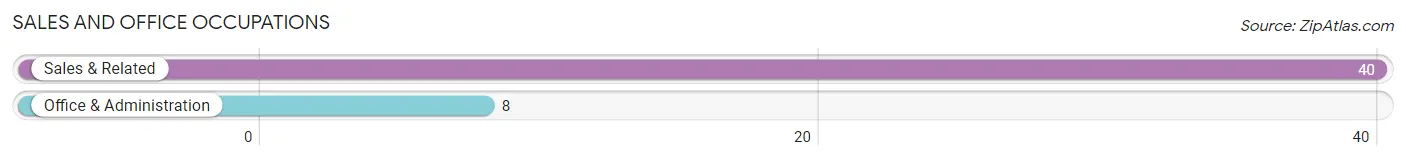
Sales and Office Occupations
The most common Sales and Office occupations in Portland are Sales & Related (40 | 14.5%), and Office & Administration (8 | 2.9%).
Sales and Office Occupations by Sex
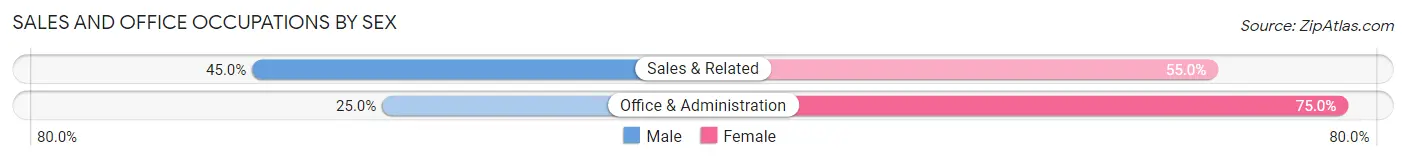
| Occupation | Male | Female |
| Sales & Related | 18 (45.0%) | 22 (55.0%) |
| Office & Administration | 2 (25.0%) | 6 (75.0%) |
| Total (Category) | 20 (41.7%) | 28 (58.3%) |
| Total (Overall) | 144 (52.4%) | 131 (47.6%) |
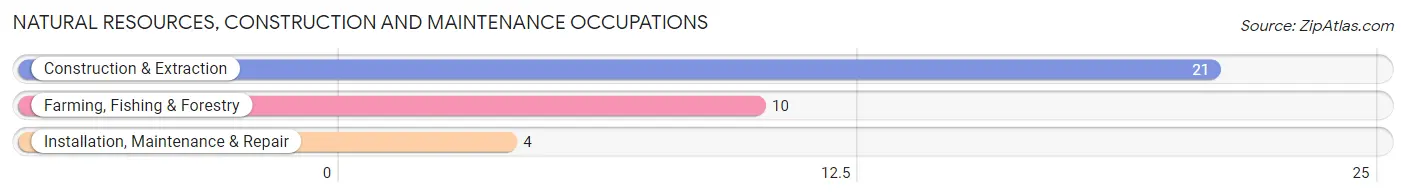
Natural Resources, Construction and Maintenance Occupations
The most common Natural Resources, Construction and Maintenance occupations in Portland are Construction & Extraction (21 | 7.6%), Farming, Fishing & Forestry (10 | 3.6%), and Installation, Maintenance & Repair (4 | 1.5%).
Natural Resources, Construction and Maintenance Occupations by Sex
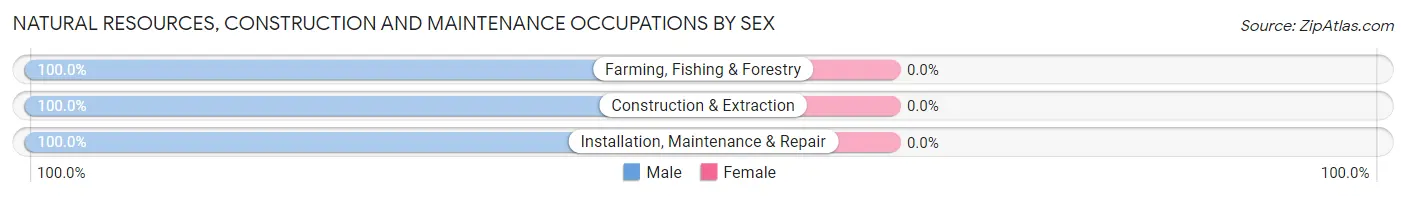
| Occupation | Male | Female |
| Farming, Fishing & Forestry | 10 (100.0%) | 0 (0.0%) |
| Construction & Extraction | 21 (100.0%) | 0 (0.0%) |
| Installation, Maintenance & Repair | 4 (100.0%) | 0 (0.0%) |
| Total (Category) | 35 (100.0%) | 0 (0.0%) |
| Total (Overall) | 144 (52.4%) | 131 (47.6%) |
Production, Transportation and Moving Occupations
The most common Production, Transportation and Moving occupations in Portland are Production (13 | 4.7%), Transportation (13 | 4.7%), and Material Moving (6 | 2.2%).
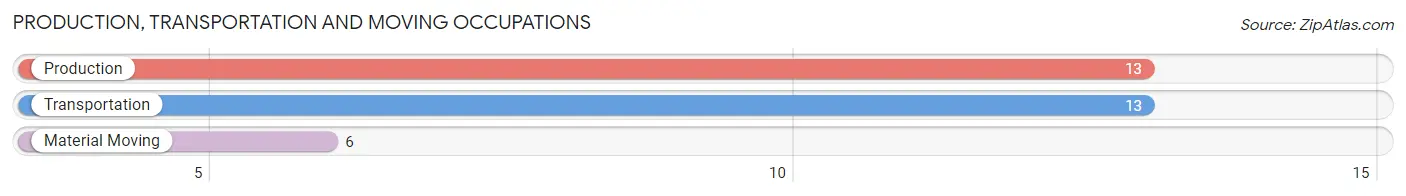
Production, Transportation and Moving Occupations by Sex
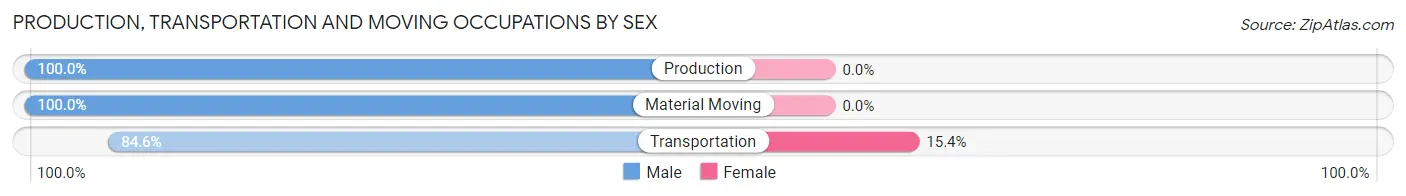
| Occupation | Male | Female |
| Production | 13 (100.0%) | 0 (0.0%) |
| Transportation | 11 (84.6%) | 2 (15.4%) |
| Material Moving | 6 (100.0%) | 0 (0.0%) |
| Total (Category) | 30 (93.8%) | 2 (6.2%) |
| Total (Overall) | 144 (52.4%) | 131 (47.6%) |
Employment Industries by Sex in Portland
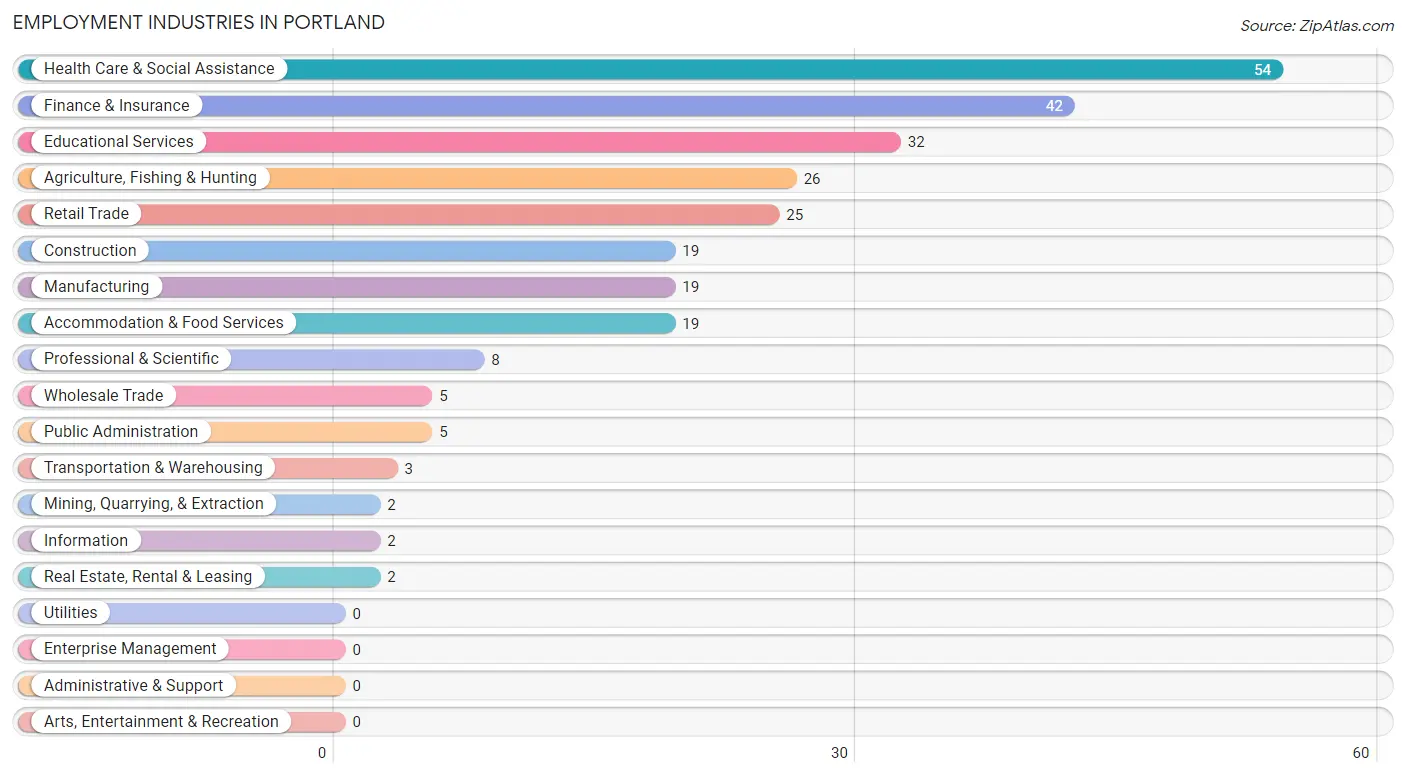
Employment Industries in Portland
The major employment industries in Portland include Health Care & Social Assistance (54 | 19.6%), Finance & Insurance (42 | 15.3%), Educational Services (32 | 11.6%), Agriculture, Fishing & Hunting (26 | 9.5%), and Retail Trade (25 | 9.1%).
Employment Industries by Sex in Portland
The Portland industries that see more men than women are Mining, Quarrying, & Extraction (100.0%), Construction (100.0%), and Manufacturing (100.0%), whereas the industries that tend to have a higher number of women are Information (100.0%), Professional & Scientific (87.5%), and Finance & Insurance (85.7%).
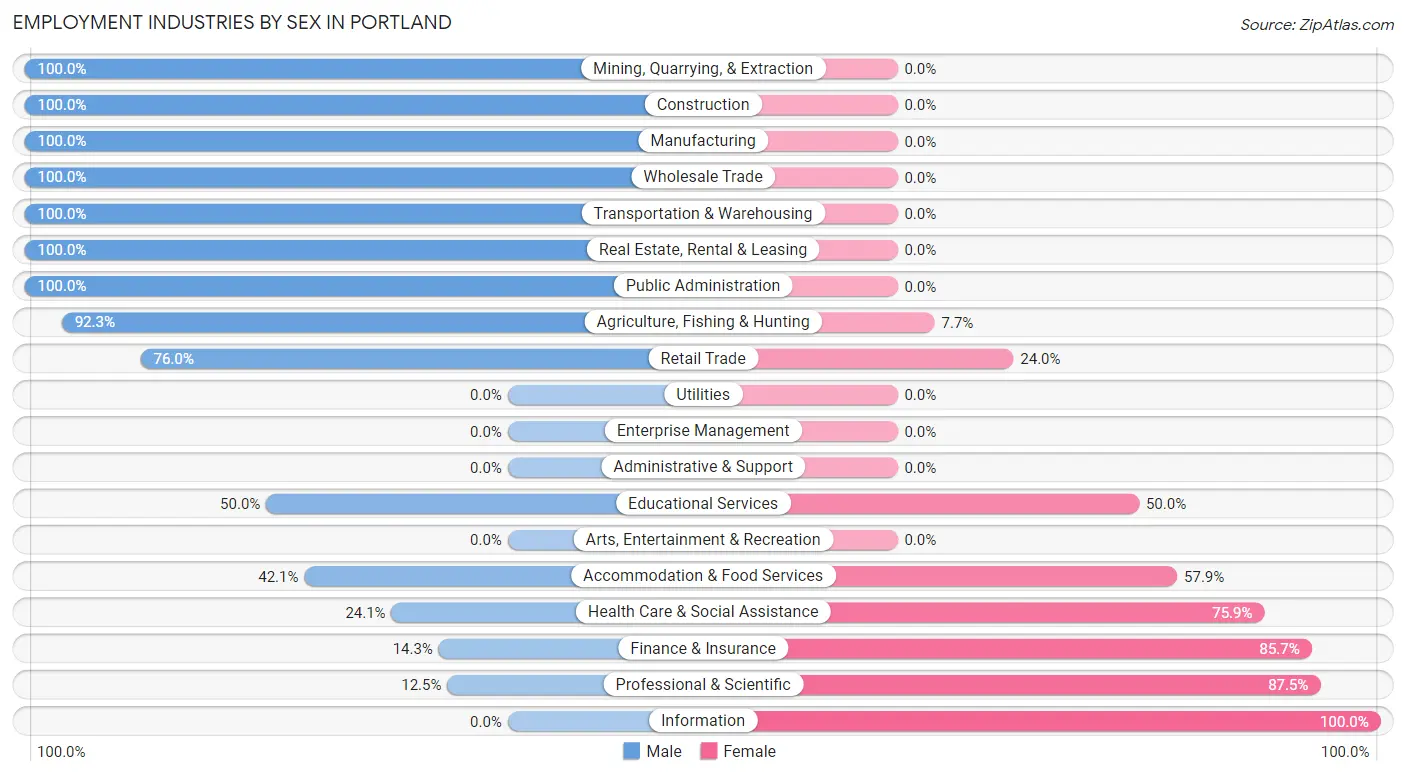
| Industry | Male | Female |
| Agriculture, Fishing & Hunting | 24 (92.3%) | 2 (7.7%) |
| Mining, Quarrying, & Extraction | 2 (100.0%) | 0 (0.0%) |
| Construction | 19 (100.0%) | 0 (0.0%) |
| Manufacturing | 19 (100.0%) | 0 (0.0%) |
| Wholesale Trade | 5 (100.0%) | 0 (0.0%) |
| Retail Trade | 19 (76.0%) | 6 (24.0%) |
| Transportation & Warehousing | 3 (100.0%) | 0 (0.0%) |
| Utilities | 0 (0.0%) | 0 (0.0%) |
| Information | 0 (0.0%) | 2 (100.0%) |
| Finance & Insurance | 6 (14.3%) | 36 (85.7%) |
| Real Estate, Rental & Leasing | 2 (100.0%) | 0 (0.0%) |
| Professional & Scientific | 1 (12.5%) | 7 (87.5%) |
| Enterprise Management | 0 (0.0%) | 0 (0.0%) |
| Administrative & Support | 0 (0.0%) | 0 (0.0%) |
| Educational Services | 16 (50.0%) | 16 (50.0%) |
| Health Care & Social Assistance | 13 (24.1%) | 41 (75.9%) |
| Arts, Entertainment & Recreation | 0 (0.0%) | 0 (0.0%) |
| Accommodation & Food Services | 8 (42.1%) | 11 (57.9%) |
| Public Administration | 5 (100.0%) | 0 (0.0%) |
| Total | 144 (52.4%) | 131 (47.6%) |
Education in Portland
School Enrollment in Portland
The most common levels of schooling among the 120 students in Portland are middle school (32 | 26.7%), elementary school (29 | 24.2%), and kindergarten (24 | 20.0%).
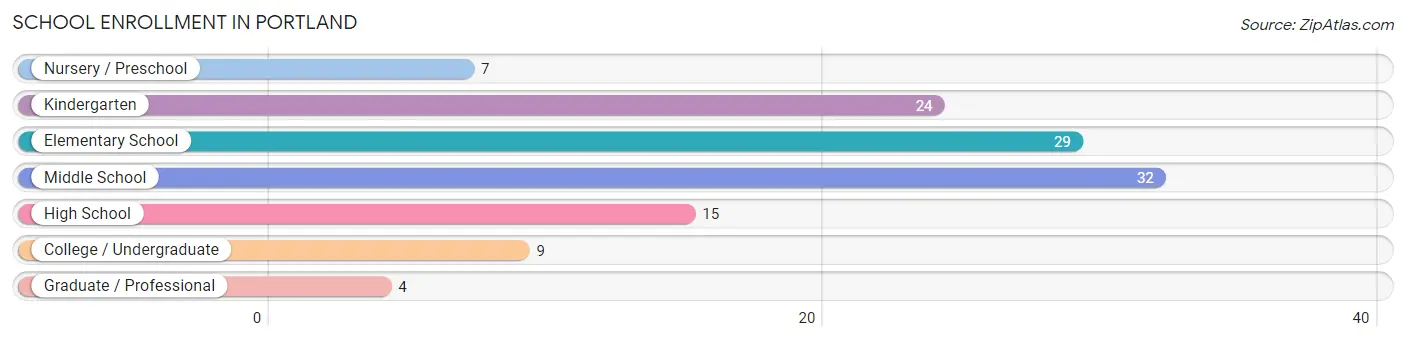
| School Level | # Students | % Students |
| Nursery / Preschool | 7 | 5.8% |
| Kindergarten | 24 | 20.0% |
| Elementary School | 29 | 24.2% |
| Middle School | 32 | 26.7% |
| High School | 15 | 12.5% |
| College / Undergraduate | 9 | 7.5% |
| Graduate / Professional | 4 | 3.3% |
| Total | 120 | 100.0% |
School Enrollment by Age by Funding Source in Portland
Out of a total of 120 students who are enrolled in schools in Portland, 16 (13.3%) attend a private institution, while the remaining 104 (86.7%) are enrolled in public schools. The age group of 3 to 4 year olds has the highest likelihood of being enrolled in private schools, with 7 (100.0% in the age bracket) enrolled. Conversely, the age group of 5 to 9 year old has the lowest likelihood of being enrolled in a private school, with 51 (100.0% in the age bracket) attending a public institution.
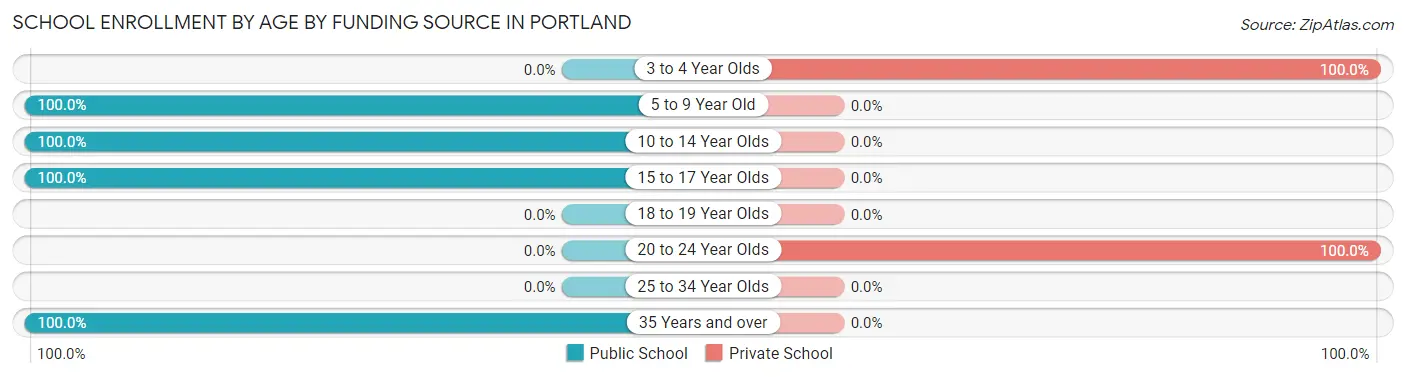
| Age Bracket | Public School | Private School |
| 3 to 4 Year Olds | 0 (0.0%) | 7 (100.0%) |
| 5 to 9 Year Old | 51 (100.0%) | 0 (0.0%) |
| 10 to 14 Year Olds | 34 (100.0%) | 0 (0.0%) |
| 15 to 17 Year Olds | 15 (100.0%) | 0 (0.0%) |
| 18 to 19 Year Olds | 0 (0.0%) | 0 (0.0%) |
| 20 to 24 Year Olds | 0 (0.0%) | 9 (100.0%) |
| 25 to 34 Year Olds | 0 (0.0%) | 0 (0.0%) |
| 35 Years and over | 4 (100.0%) | 0 (0.0%) |
| Total | 104 (86.7%) | 16 (13.3%) |
Educational Attainment by Field of Study in Portland
Education (42 | 30.4%), business (39 | 28.3%), bio, nature & agricultural (19 | 13.8%), arts & humanities (9 | 6.5%), and science & technology (8 | 5.8%) are the most common fields of study among 138 individuals in Portland who have obtained a bachelor's degree or higher.
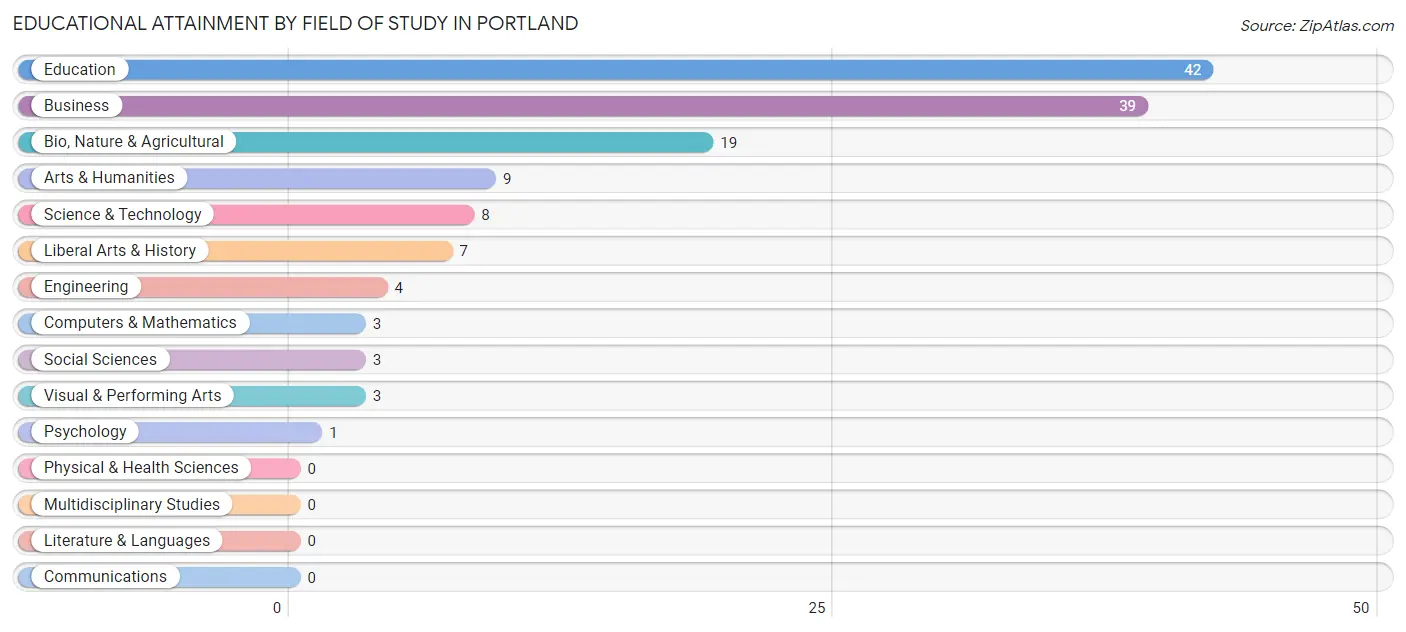
| Field of Study | # Graduates | % Graduates |
| Computers & Mathematics | 3 | 2.2% |
| Bio, Nature & Agricultural | 19 | 13.8% |
| Physical & Health Sciences | 0 | 0.0% |
| Psychology | 1 | 0.7% |
| Social Sciences | 3 | 2.2% |
| Engineering | 4 | 2.9% |
| Multidisciplinary Studies | 0 | 0.0% |
| Science & Technology | 8 | 5.8% |
| Business | 39 | 28.3% |
| Education | 42 | 30.4% |
| Literature & Languages | 0 | 0.0% |
| Liberal Arts & History | 7 | 5.1% |
| Visual & Performing Arts | 3 | 2.2% |
| Communications | 0 | 0.0% |
| Arts & Humanities | 9 | 6.5% |
| Total | 138 | 100.0% |
Transportation & Commute in Portland
Vehicle Availability by Sex in Portland
The most prevalent vehicle ownership categories in Portland are males with 2 vehicles (68, accounting for 48.2%) and females with 2 vehicles (63, making up 51.9%).
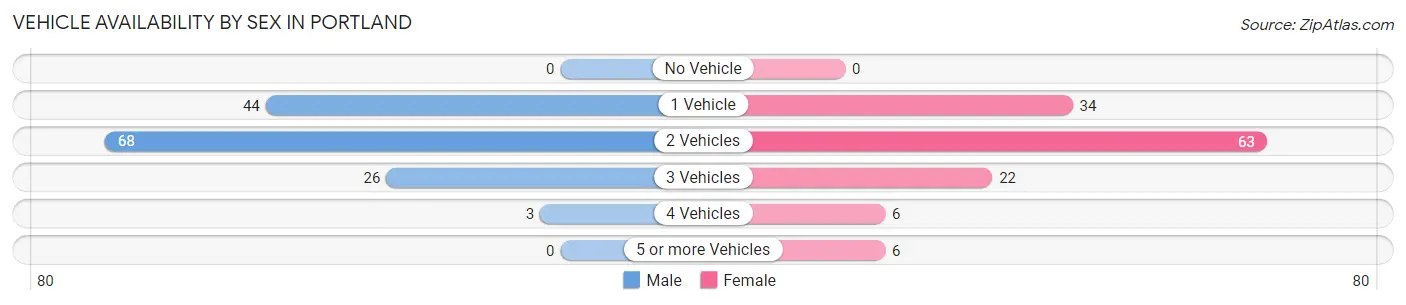
| Vehicles Available | Male | Female |
| No Vehicle | 0 (0.0%) | 0 (0.0%) |
| 1 Vehicle | 44 (31.2%) | 34 (26.0%) |
| 2 Vehicles | 68 (48.2%) | 63 (48.1%) |
| 3 Vehicles | 26 (18.4%) | 22 (16.8%) |
| 4 Vehicles | 3 (2.1%) | 6 (4.6%) |
| 5 or more Vehicles | 0 (0.0%) | 6 (4.6%) |
| Total | 141 (100.0%) | 131 (100.0%) |
Commute Time in Portland
The most frequently occuring commute durations in Portland are 5 to 9 minutes (85 commuters, 33.7%), less than 5 minutes (52 commuters, 20.6%), and 10 to 14 minutes (40 commuters, 15.9%).
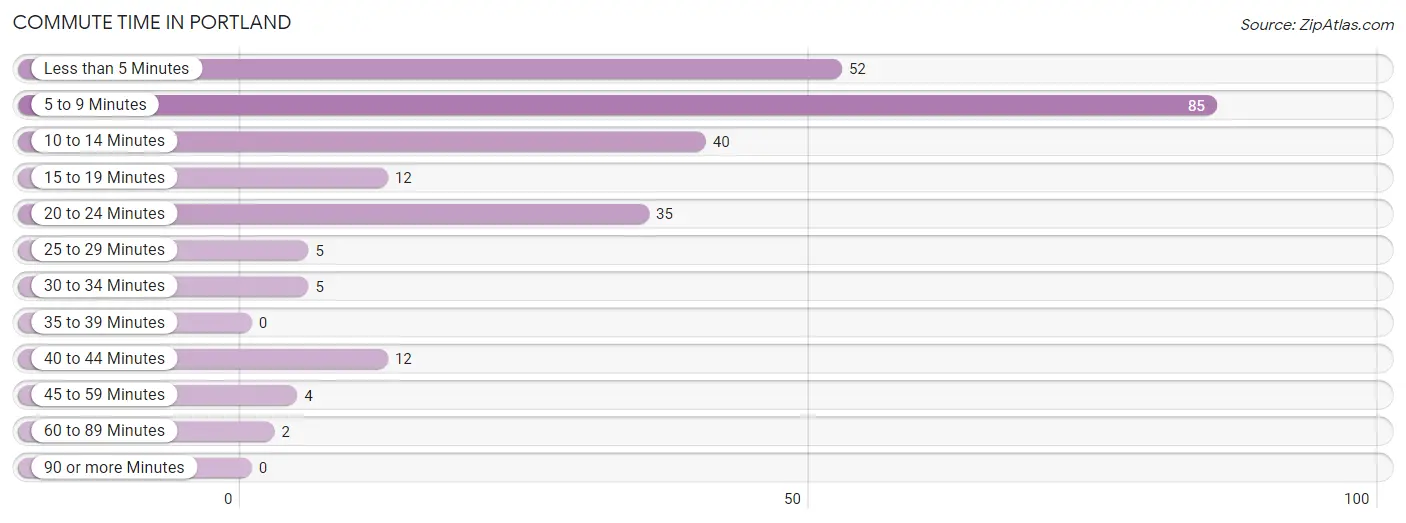
| Commute Time | # Commuters | % Commuters |
| Less than 5 Minutes | 52 | 20.6% |
| 5 to 9 Minutes | 85 | 33.7% |
| 10 to 14 Minutes | 40 | 15.9% |
| 15 to 19 Minutes | 12 | 4.8% |
| 20 to 24 Minutes | 35 | 13.9% |
| 25 to 29 Minutes | 5 | 2.0% |
| 30 to 34 Minutes | 5 | 2.0% |
| 35 to 39 Minutes | 0 | 0.0% |
| 40 to 44 Minutes | 12 | 4.8% |
| 45 to 59 Minutes | 4 | 1.6% |
| 60 to 89 Minutes | 2 | 0.8% |
| 90 or more Minutes | 0 | 0.0% |
Commute Time by Sex in Portland
The most common commute times in Portland are 5 to 9 minutes (34 commuters, 26.0%) for males and 5 to 9 minutes (51 commuters, 42.1%) for females.
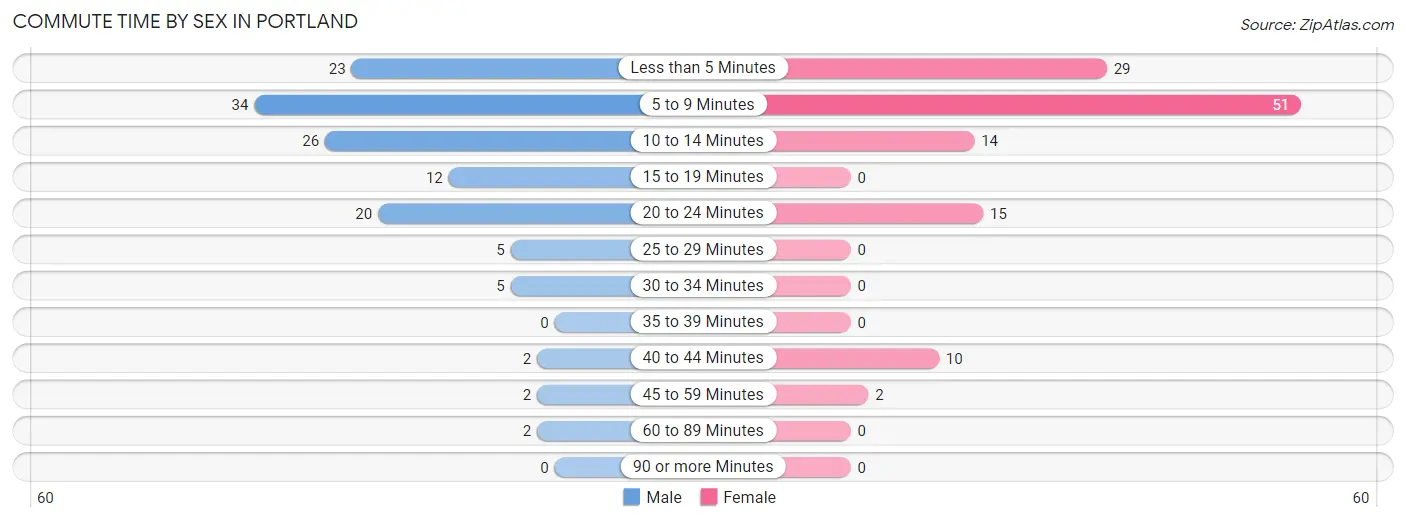
| Commute Time | Male | Female |
| Less than 5 Minutes | 23 (17.6%) | 29 (24.0%) |
| 5 to 9 Minutes | 34 (26.0%) | 51 (42.1%) |
| 10 to 14 Minutes | 26 (19.9%) | 14 (11.6%) |
| 15 to 19 Minutes | 12 (9.2%) | 0 (0.0%) |
| 20 to 24 Minutes | 20 (15.3%) | 15 (12.4%) |
| 25 to 29 Minutes | 5 (3.8%) | 0 (0.0%) |
| 30 to 34 Minutes | 5 (3.8%) | 0 (0.0%) |
| 35 to 39 Minutes | 0 (0.0%) | 0 (0.0%) |
| 40 to 44 Minutes | 2 (1.5%) | 10 (8.3%) |
| 45 to 59 Minutes | 2 (1.5%) | 2 (1.7%) |
| 60 to 89 Minutes | 2 (1.5%) | 0 (0.0%) |
| 90 or more Minutes | 0 (0.0%) | 0 (0.0%) |
Time of Departure to Work by Sex in Portland
The most frequent times of departure to work in Portland are 7:00 AM to 7:29 AM (36, 27.5%) for males and 7:30 AM to 7:59 AM (41, 33.9%) for females.
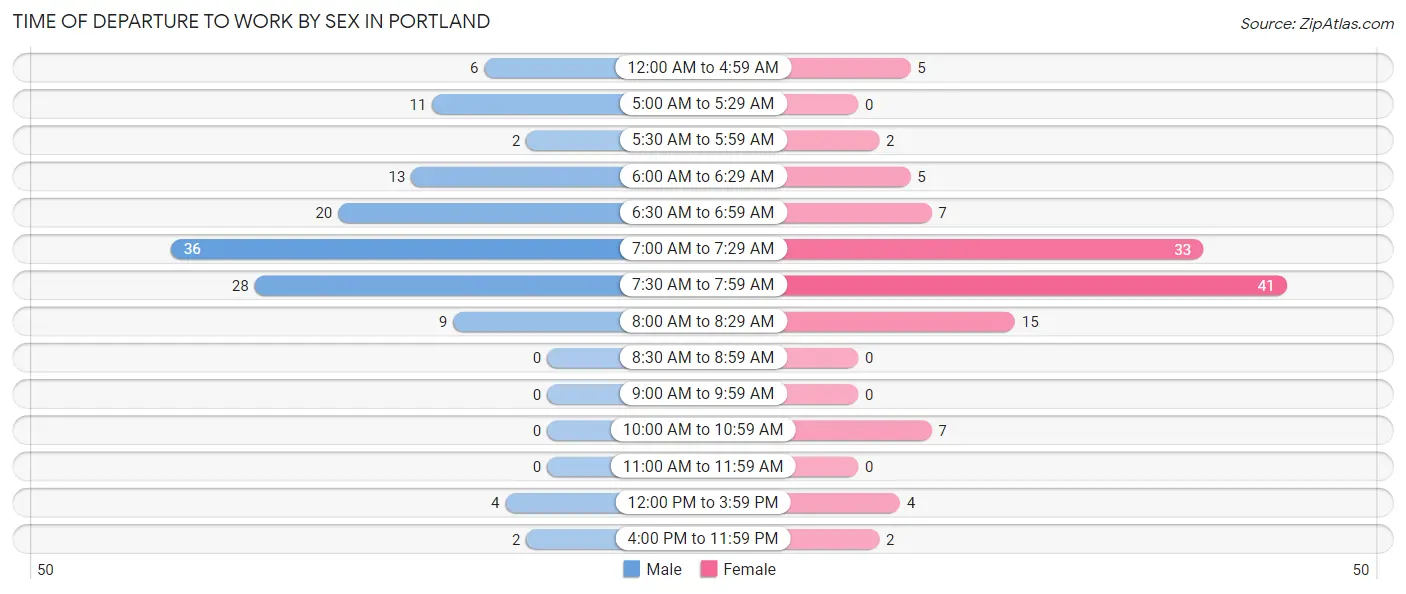
| Time of Departure | Male | Female |
| 12:00 AM to 4:59 AM | 6 (4.6%) | 5 (4.1%) |
| 5:00 AM to 5:29 AM | 11 (8.4%) | 0 (0.0%) |
| 5:30 AM to 5:59 AM | 2 (1.5%) | 2 (1.7%) |
| 6:00 AM to 6:29 AM | 13 (9.9%) | 5 (4.1%) |
| 6:30 AM to 6:59 AM | 20 (15.3%) | 7 (5.8%) |
| 7:00 AM to 7:29 AM | 36 (27.5%) | 33 (27.3%) |
| 7:30 AM to 7:59 AM | 28 (21.4%) | 41 (33.9%) |
| 8:00 AM to 8:29 AM | 9 (6.9%) | 15 (12.4%) |
| 8:30 AM to 8:59 AM | 0 (0.0%) | 0 (0.0%) |
| 9:00 AM to 9:59 AM | 0 (0.0%) | 0 (0.0%) |
| 10:00 AM to 10:59 AM | 0 (0.0%) | 7 (5.8%) |
| 11:00 AM to 11:59 AM | 0 (0.0%) | 0 (0.0%) |
| 12:00 PM to 3:59 PM | 4 (3.0%) | 4 (3.3%) |
| 4:00 PM to 11:59 PM | 2 (1.5%) | 2 (1.7%) |
| Total | 131 (100.0%) | 121 (100.0%) |
Housing Occupancy in Portland
Occupancy by Ownership in Portland
Of the total 249 dwellings in Portland, owner-occupied units account for 183 (73.5%), while renter-occupied units make up 66 (26.5%).
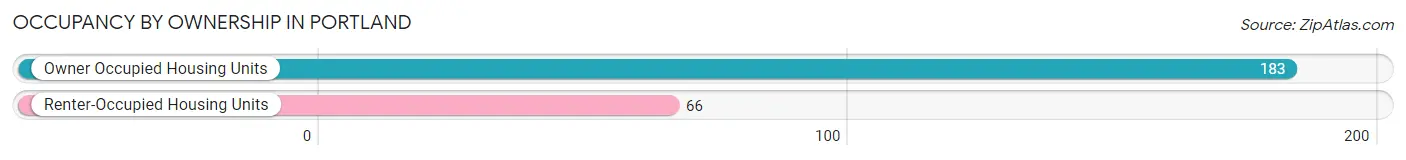
| Occupancy | # Housing Units | % Housing Units |
| Owner Occupied Housing Units | 183 | 73.5% |
| Renter-Occupied Housing Units | 66 | 26.5% |
| Total Occupied Housing Units | 249 | 100.0% |
Occupancy by Household Size in Portland
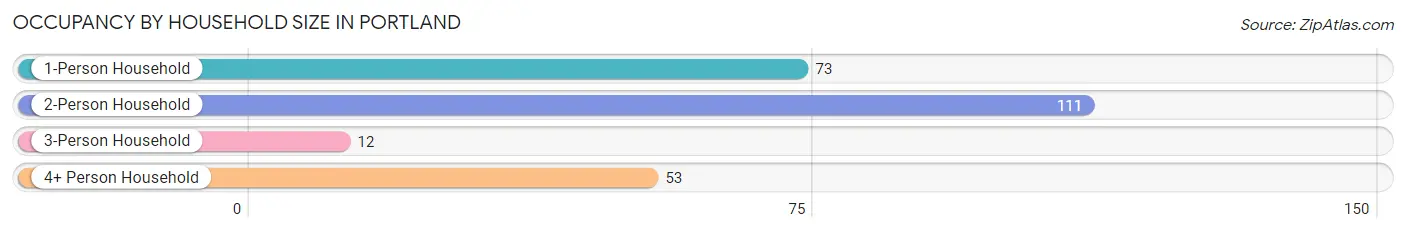
| Household Size | # Housing Units | % Housing Units |
| 1-Person Household | 73 | 29.3% |
| 2-Person Household | 111 | 44.6% |
| 3-Person Household | 12 | 4.8% |
| 4+ Person Household | 53 | 21.3% |
| Total Housing Units | 249 | 100.0% |
Occupancy by Ownership by Household Size in Portland
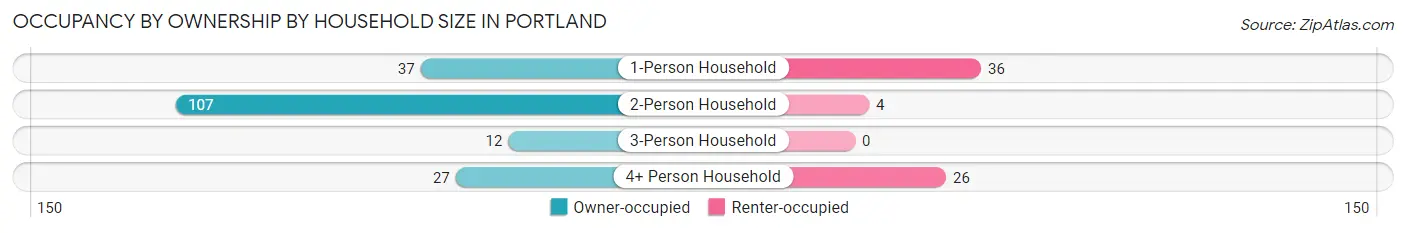
| Household Size | Owner-occupied | Renter-occupied |
| 1-Person Household | 37 (50.7%) | 36 (49.3%) |
| 2-Person Household | 107 (96.4%) | 4 (3.6%) |
| 3-Person Household | 12 (100.0%) | 0 (0.0%) |
| 4+ Person Household | 27 (50.9%) | 26 (49.1%) |
| Total Housing Units | 183 (73.5%) | 66 (26.5%) |
Occupancy by Educational Attainment in Portland
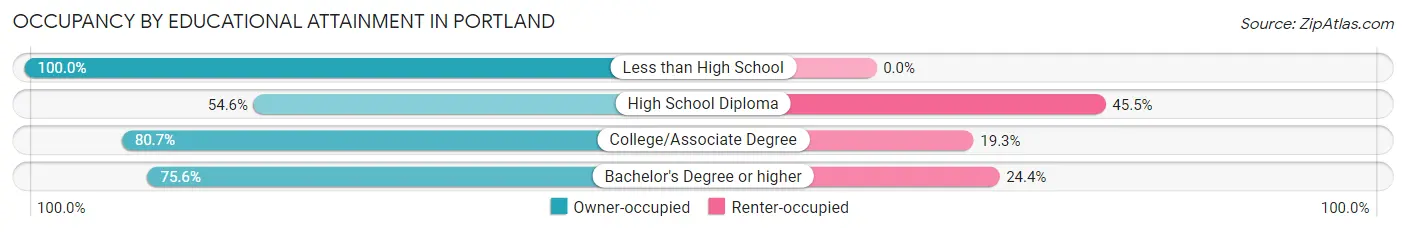
| Household Size | Owner-occupied | Renter-occupied |
| Less than High School | 3 (100.0%) | 0 (0.0%) |
| High School Diploma | 30 (54.5%) | 25 (45.5%) |
| College/Associate Degree | 88 (80.7%) | 21 (19.3%) |
| Bachelor's Degree or higher | 62 (75.6%) | 20 (24.4%) |
Occupancy by Age of Householder in Portland
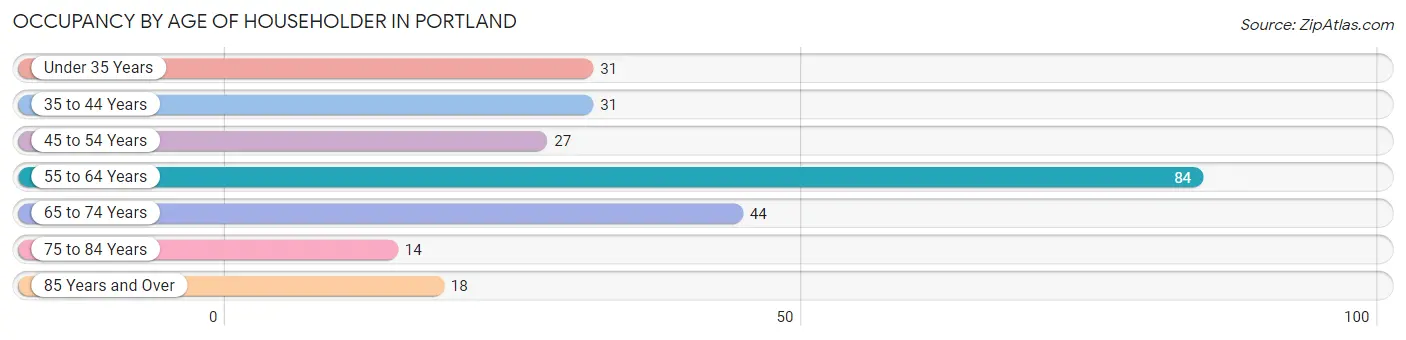
| Age Bracket | # Households | % Households |
| Under 35 Years | 31 | 12.4% |
| 35 to 44 Years | 31 | 12.4% |
| 45 to 54 Years | 27 | 10.8% |
| 55 to 64 Years | 84 | 33.7% |
| 65 to 74 Years | 44 | 17.7% |
| 75 to 84 Years | 14 | 5.6% |
| 85 Years and Over | 18 | 7.2% |
| Total | 249 | 100.0% |
Housing Finances in Portland
Median Income by Occupancy in Portland
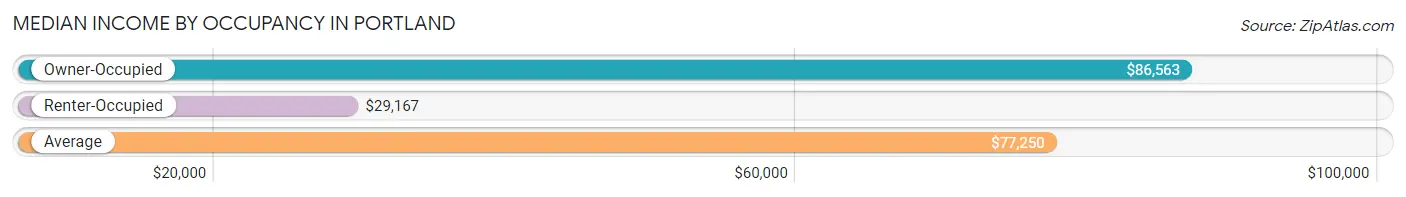
| Occupancy Type | # Households | Median Income |
| Owner-Occupied | 183 (73.5%) | $86,563 |
| Renter-Occupied | 66 (26.5%) | $29,167 |
| Average | 249 (100.0%) | $77,250 |
Occupancy by Householder Income Bracket in Portland
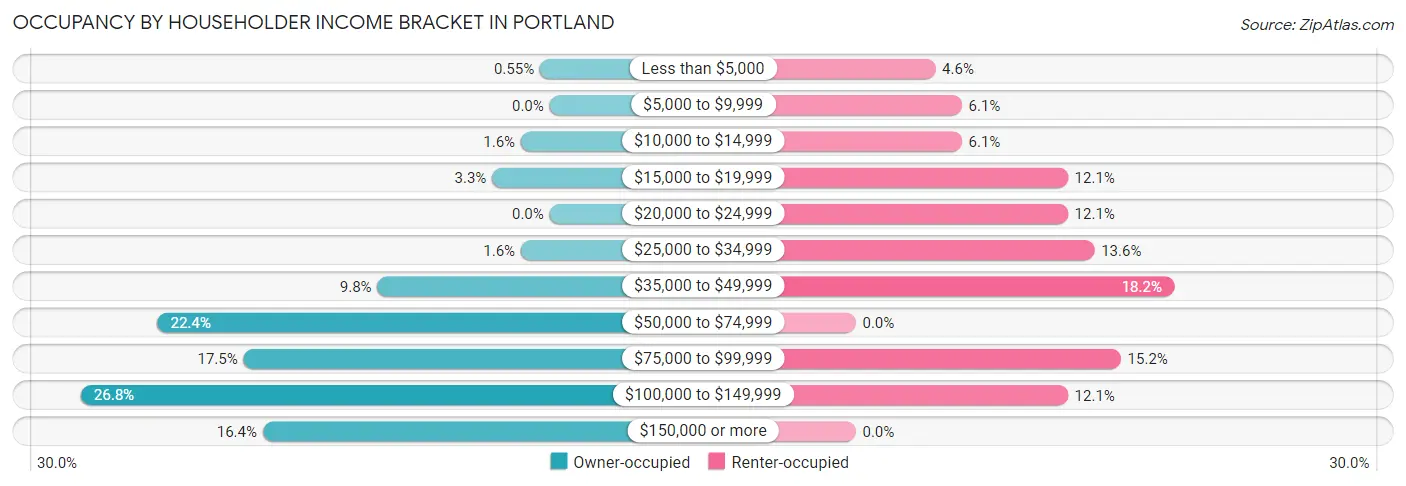
| Income Bracket | Owner-occupied | Renter-occupied |
| Less than $5,000 | 1 (0.5%) | 3 (4.5%) |
| $5,000 to $9,999 | 0 (0.0%) | 4 (6.1%) |
| $10,000 to $14,999 | 3 (1.6%) | 4 (6.1%) |
| $15,000 to $19,999 | 6 (3.3%) | 8 (12.1%) |
| $20,000 to $24,999 | 0 (0.0%) | 8 (12.1%) |
| $25,000 to $34,999 | 3 (1.6%) | 9 (13.6%) |
| $35,000 to $49,999 | 18 (9.8%) | 12 (18.2%) |
| $50,000 to $74,999 | 41 (22.4%) | 0 (0.0%) |
| $75,000 to $99,999 | 32 (17.5%) | 10 (15.1%) |
| $100,000 to $149,999 | 49 (26.8%) | 8 (12.1%) |
| $150,000 or more | 30 (16.4%) | 0 (0.0%) |
| Total | 183 (100.0%) | 66 (100.0%) |
Monthly Housing Cost Tiers in Portland
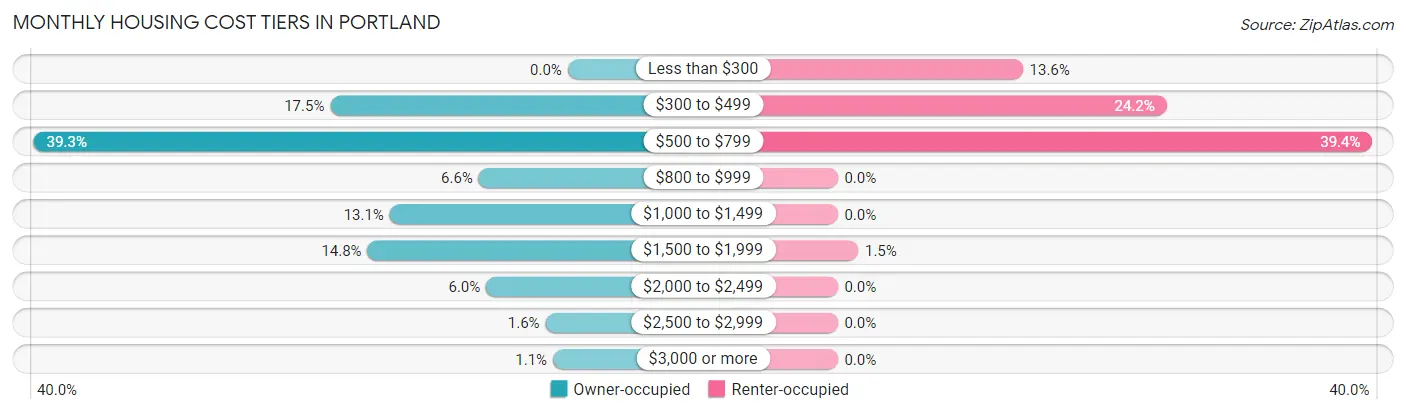
| Monthly Cost | Owner-occupied | Renter-occupied |
| Less than $300 | 0 (0.0%) | 9 (13.6%) |
| $300 to $499 | 32 (17.5%) | 16 (24.2%) |
| $500 to $799 | 72 (39.3%) | 26 (39.4%) |
| $800 to $999 | 12 (6.6%) | 0 (0.0%) |
| $1,000 to $1,499 | 24 (13.1%) | 0 (0.0%) |
| $1,500 to $1,999 | 27 (14.7%) | 1 (1.5%) |
| $2,000 to $2,499 | 11 (6.0%) | 0 (0.0%) |
| $2,500 to $2,999 | 3 (1.6%) | 0 (0.0%) |
| $3,000 or more | 2 (1.1%) | 0 (0.0%) |
| Total | 183 (100.0%) | 66 (100.0%) |
Physical Housing Characteristics in Portland
Housing Structures in Portland
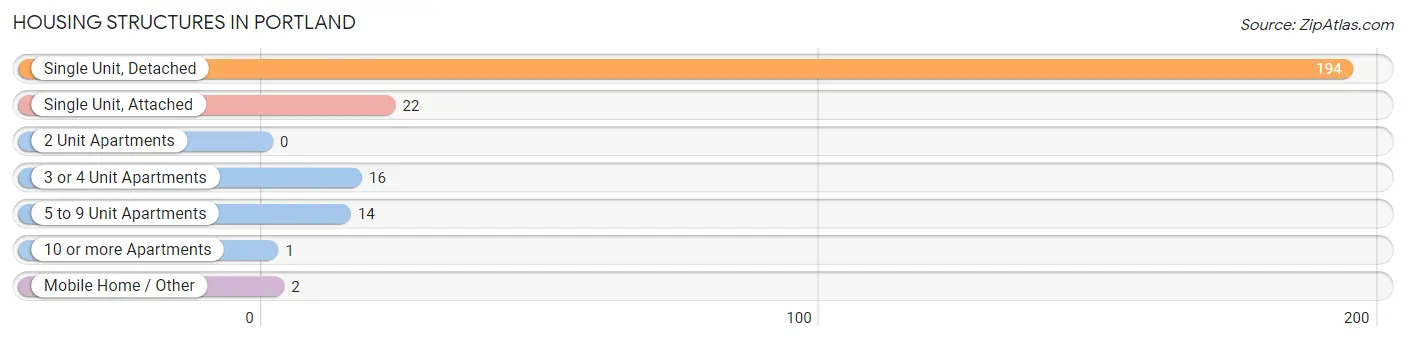
| Structure Type | # Housing Units | % Housing Units |
| Single Unit, Detached | 194 | 77.9% |
| Single Unit, Attached | 22 | 8.8% |
| 2 Unit Apartments | 0 | 0.0% |
| 3 or 4 Unit Apartments | 16 | 6.4% |
| 5 to 9 Unit Apartments | 14 | 5.6% |
| 10 or more Apartments | 1 | 0.4% |
| Mobile Home / Other | 2 | 0.8% |
| Total | 249 | 100.0% |
Housing Structures by Occupancy in Portland
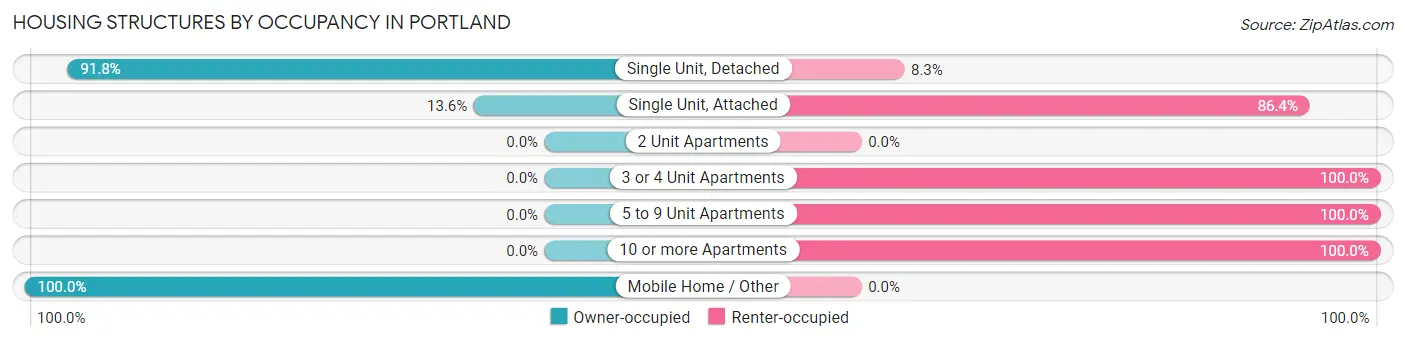
| Structure Type | Owner-occupied | Renter-occupied |
| Single Unit, Detached | 178 (91.7%) | 16 (8.3%) |
| Single Unit, Attached | 3 (13.6%) | 19 (86.4%) |
| 2 Unit Apartments | 0 (0.0%) | 0 (0.0%) |
| 3 or 4 Unit Apartments | 0 (0.0%) | 16 (100.0%) |
| 5 to 9 Unit Apartments | 0 (0.0%) | 14 (100.0%) |
| 10 or more Apartments | 0 (0.0%) | 1 (100.0%) |
| Mobile Home / Other | 2 (100.0%) | 0 (0.0%) |
| Total | 183 (73.5%) | 66 (26.5%) |
Housing Structures by Number of Rooms in Portland
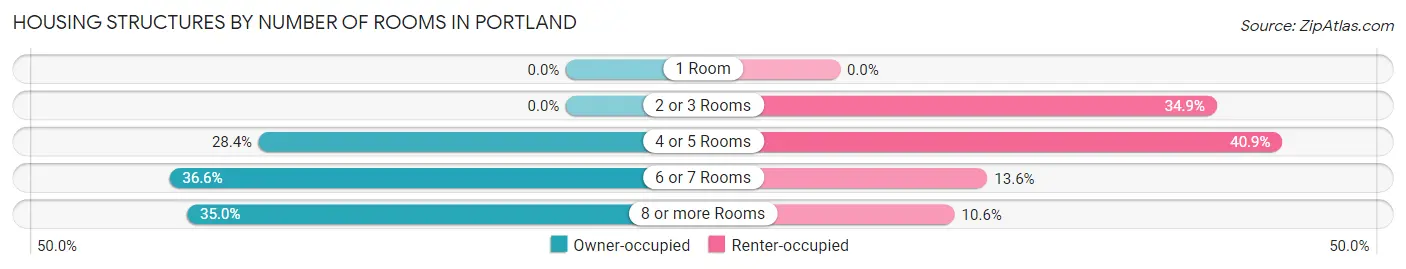
| Number of Rooms | Owner-occupied | Renter-occupied |
| 1 Room | 0 (0.0%) | 0 (0.0%) |
| 2 or 3 Rooms | 0 (0.0%) | 23 (34.8%) |
| 4 or 5 Rooms | 52 (28.4%) | 27 (40.9%) |
| 6 or 7 Rooms | 67 (36.6%) | 9 (13.6%) |
| 8 or more Rooms | 64 (35.0%) | 7 (10.6%) |
| Total | 183 (100.0%) | 66 (100.0%) |
Housing Structure by Heating Type in Portland
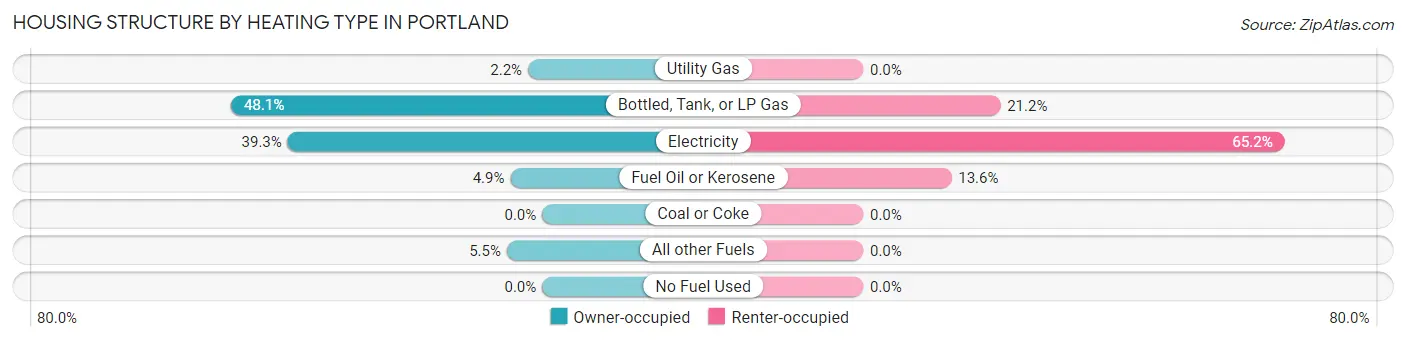
| Heating Type | Owner-occupied | Renter-occupied |
| Utility Gas | 4 (2.2%) | 0 (0.0%) |
| Bottled, Tank, or LP Gas | 88 (48.1%) | 14 (21.2%) |
| Electricity | 72 (39.3%) | 43 (65.1%) |
| Fuel Oil or Kerosene | 9 (4.9%) | 9 (13.6%) |
| Coal or Coke | 0 (0.0%) | 0 (0.0%) |
| All other Fuels | 10 (5.5%) | 0 (0.0%) |
| No Fuel Used | 0 (0.0%) | 0 (0.0%) |
| Total | 183 (100.0%) | 66 (100.0%) |
Household Vehicle Usage in Portland
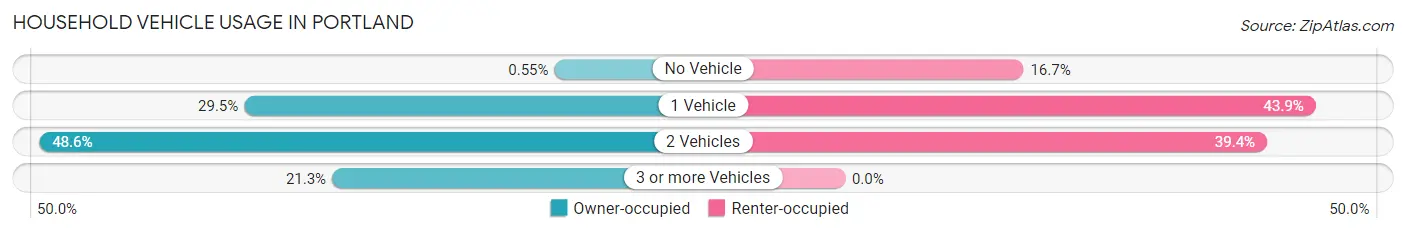
| Vehicles per Household | Owner-occupied | Renter-occupied |
| No Vehicle | 1 (0.5%) | 11 (16.7%) |
| 1 Vehicle | 54 (29.5%) | 29 (43.9%) |
| 2 Vehicles | 89 (48.6%) | 26 (39.4%) |
| 3 or more Vehicles | 39 (21.3%) | 0 (0.0%) |
| Total | 183 (100.0%) | 66 (100.0%) |
Real Estate & Mortgages in Portland
Real Estate and Mortgage Overview in Portland
| Characteristic | Without Mortgage | With Mortgage |
| Housing Units | 107 | 76 |
| Median Property Value | $182,800 | $191,700 |
| Median Household Income | $71,458 | $23 |
| Monthly Housing Costs | $580 | $2 |
| Real Estate Taxes | $2,451 | $0 |
Property Value by Mortgage Status in Portland
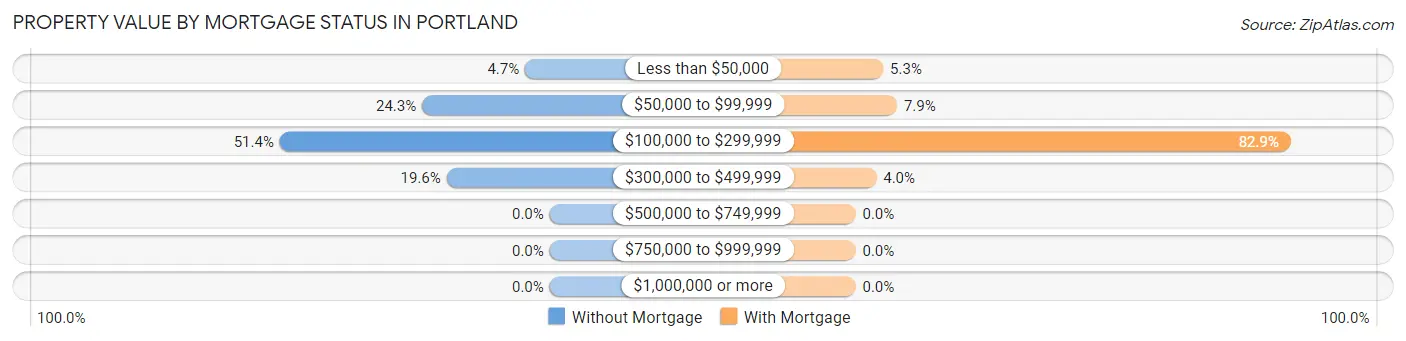
| Property Value | Without Mortgage | With Mortgage |
| Less than $50,000 | 5 (4.7%) | 4 (5.3%) |
| $50,000 to $99,999 | 26 (24.3%) | 6 (7.9%) |
| $100,000 to $299,999 | 55 (51.4%) | 63 (82.9%) |
| $300,000 to $499,999 | 21 (19.6%) | 3 (4.0%) |
| $500,000 to $749,999 | 0 (0.0%) | 0 (0.0%) |
| $750,000 to $999,999 | 0 (0.0%) | 0 (0.0%) |
| $1,000,000 or more | 0 (0.0%) | 0 (0.0%) |
| Total | 107 (100.0%) | 76 (100.0%) |
Household Income by Mortgage Status in Portland
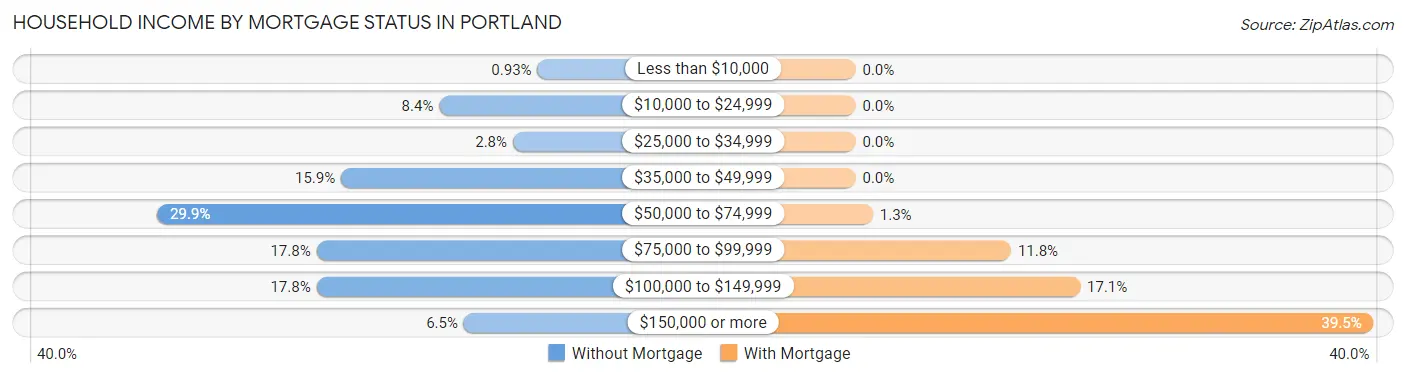
| Household Income | Without Mortgage | With Mortgage |
| Less than $10,000 | 1 (0.9%) | 0 (0.0%) |
| $10,000 to $24,999 | 9 (8.4%) | 0 (0.0%) |
| $25,000 to $34,999 | 3 (2.8%) | 0 (0.0%) |
| $35,000 to $49,999 | 17 (15.9%) | 0 (0.0%) |
| $50,000 to $74,999 | 32 (29.9%) | 1 (1.3%) |
| $75,000 to $99,999 | 19 (17.8%) | 9 (11.8%) |
| $100,000 to $149,999 | 19 (17.8%) | 13 (17.1%) |
| $150,000 or more | 7 (6.5%) | 30 (39.5%) |
| Total | 107 (100.0%) | 76 (100.0%) |
Property Value to Household Income Ratio in Portland
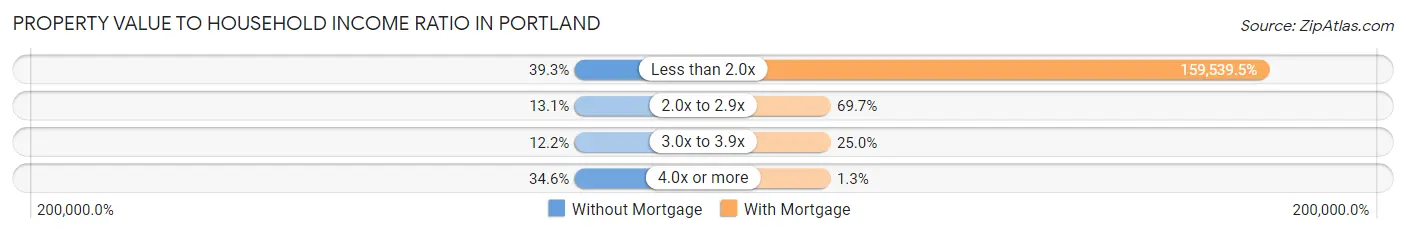
| Value-to-Income Ratio | Without Mortgage | With Mortgage |
| Less than 2.0x | 42 (39.3%) | 121,250 (159,539.5%) |
| 2.0x to 2.9x | 14 (13.1%) | 53 (69.7%) |
| 3.0x to 3.9x | 13 (12.1%) | 19 (25.0%) |
| 4.0x or more | 37 (34.6%) | 1 (1.3%) |
| Total | 107 (100.0%) | 76 (100.0%) |
Real Estate Taxes by Mortgage Status in Portland
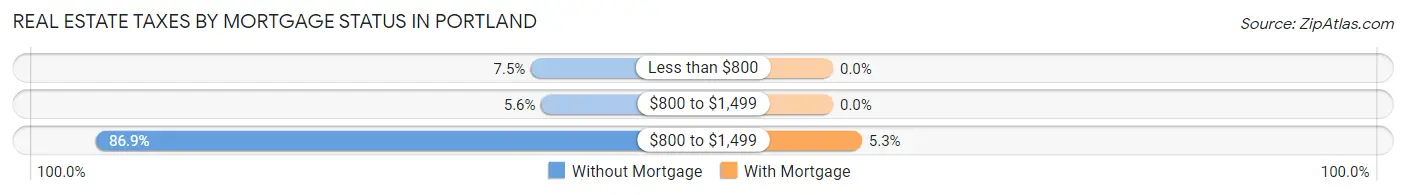
| Property Taxes | Without Mortgage | With Mortgage |
| Less than $800 | 8 (7.5%) | 0 (0.0%) |
| $800 to $1,499 | 6 (5.6%) | 0 (0.0%) |
| $800 to $1,499 | 93 (86.9%) | 4 (5.3%) |
| Total | 107 (100.0%) | 76 (100.0%) |
Health & Disability in Portland
Health Insurance Coverage by Age in Portland
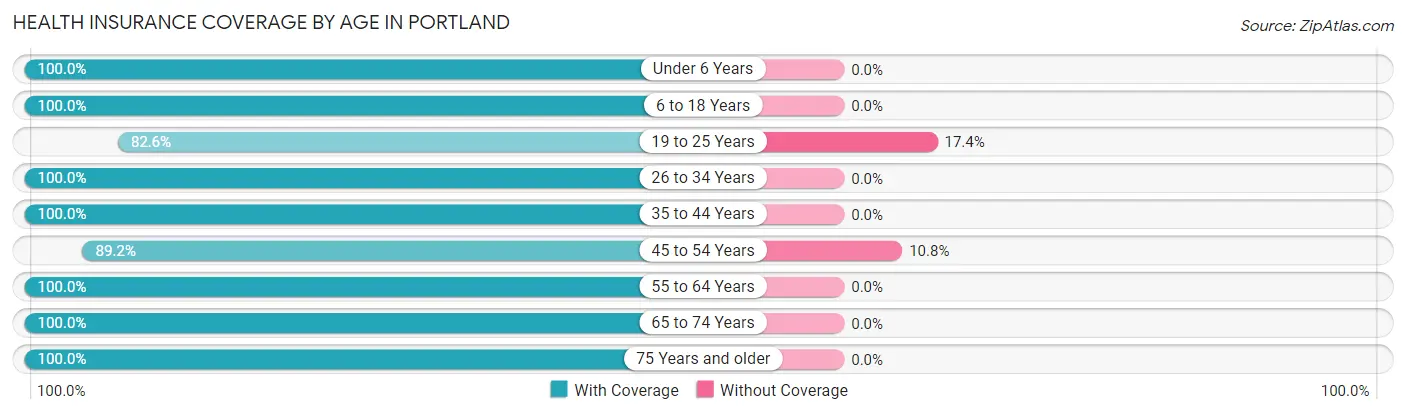
| Age Bracket | With Coverage | Without Coverage |
| Under 6 Years | 77 (100.0%) | 0 (0.0%) |
| 6 to 18 Years | 78 (100.0%) | 0 (0.0%) |
| 19 to 25 Years | 19 (82.6%) | 4 (17.4%) |
| 26 to 34 Years | 48 (100.0%) | 0 (0.0%) |
| 35 to 44 Years | 49 (100.0%) | 0 (0.0%) |
| 45 to 54 Years | 33 (89.2%) | 4 (10.8%) |
| 55 to 64 Years | 140 (100.0%) | 0 (0.0%) |
| 65 to 74 Years | 66 (100.0%) | 0 (0.0%) |
| 75 Years and older | 44 (100.0%) | 0 (0.0%) |
| Total | 554 (98.6%) | 8 (1.4%) |
Health Insurance Coverage by Citizenship Status in Portland
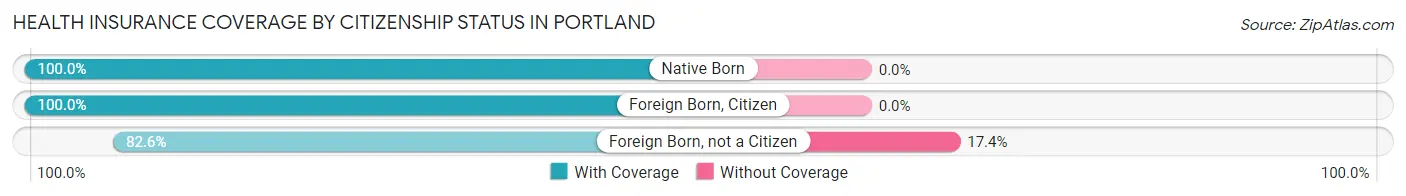
| Citizenship Status | With Coverage | Without Coverage |
| Native Born | 77 (100.0%) | 0 (0.0%) |
| Foreign Born, Citizen | 78 (100.0%) | 0 (0.0%) |
| Foreign Born, not a Citizen | 19 (82.6%) | 4 (17.4%) |
Health Insurance Coverage by Household Income in Portland
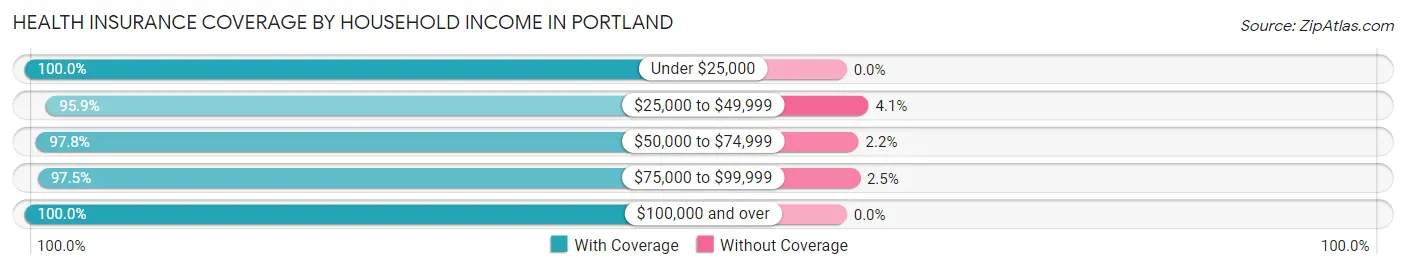
| Household Income | With Coverage | Without Coverage |
| Under $25,000 | 40 (100.0%) | 0 (0.0%) |
| $25,000 to $49,999 | 94 (95.9%) | 4 (4.1%) |
| $50,000 to $74,999 | 88 (97.8%) | 2 (2.2%) |
| $75,000 to $99,999 | 79 (97.5%) | 2 (2.5%) |
| $100,000 and over | 253 (100.0%) | 0 (0.0%) |
Public vs Private Health Insurance Coverage by Age in Portland
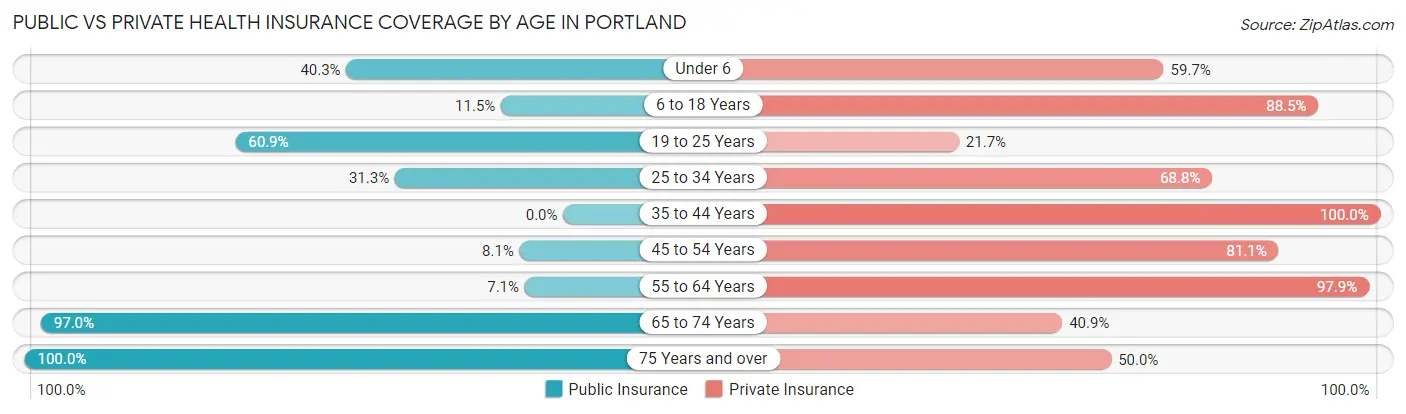
| Age Bracket | Public Insurance | Private Insurance |
| Under 6 | 31 (40.3%) | 46 (59.7%) |
| 6 to 18 Years | 9 (11.5%) | 69 (88.5%) |
| 19 to 25 Years | 14 (60.9%) | 5 (21.7%) |
| 25 to 34 Years | 15 (31.2%) | 33 (68.8%) |
| 35 to 44 Years | 0 (0.0%) | 49 (100.0%) |
| 45 to 54 Years | 3 (8.1%) | 30 (81.1%) |
| 55 to 64 Years | 10 (7.1%) | 137 (97.9%) |
| 65 to 74 Years | 64 (97.0%) | 27 (40.9%) |
| 75 Years and over | 44 (100.0%) | 22 (50.0%) |
| Total | 190 (33.8%) | 418 (74.4%) |
Disability Status by Sex by Age in Portland
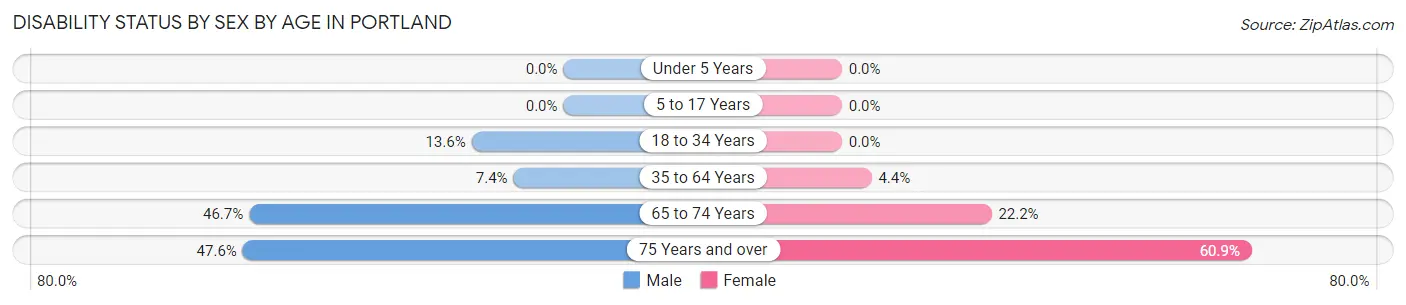
| Age Bracket | Male | Female |
| Under 5 Years | 0 (0.0%) | 0 (0.0%) |
| 5 to 17 Years | 0 (0.0%) | 0 (0.0%) |
| 18 to 34 Years | 3 (13.6%) | 0 (0.0%) |
| 35 to 64 Years | 10 (7.4%) | 4 (4.4%) |
| 65 to 74 Years | 14 (46.7%) | 8 (22.2%) |
| 75 Years and over | 10 (47.6%) | 14 (60.9%) |
Disability Class by Sex by Age in Portland
Disability Class: Hearing Difficulty
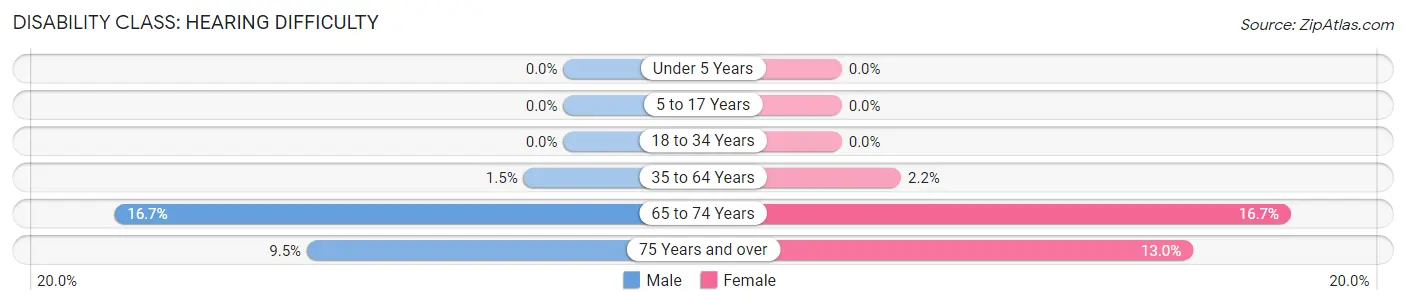
| Age Bracket | Male | Female |
| Under 5 Years | 0 (0.0%) | 0 (0.0%) |
| 5 to 17 Years | 0 (0.0%) | 0 (0.0%) |
| 18 to 34 Years | 0 (0.0%) | 0 (0.0%) |
| 35 to 64 Years | 2 (1.5%) | 2 (2.2%) |
| 65 to 74 Years | 5 (16.7%) | 6 (16.7%) |
| 75 Years and over | 2 (9.5%) | 3 (13.0%) |
Disability Class: Vision Difficulty
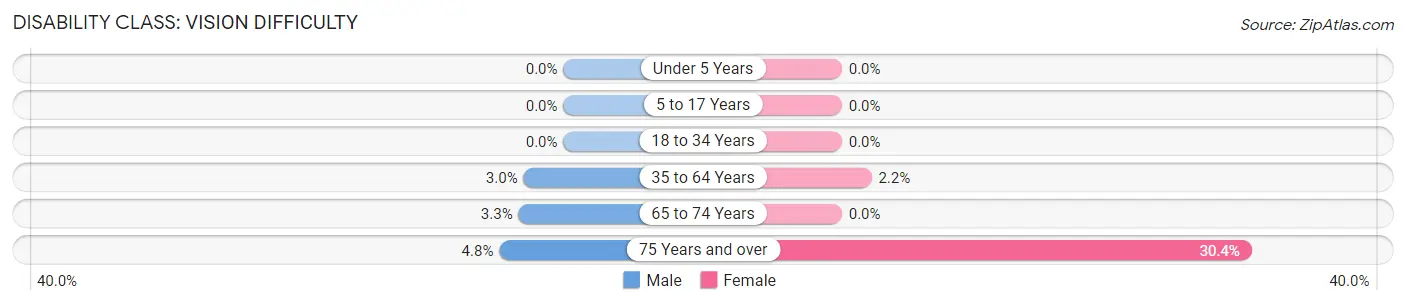
| Age Bracket | Male | Female |
| Under 5 Years | 0 (0.0%) | 0 (0.0%) |
| 5 to 17 Years | 0 (0.0%) | 0 (0.0%) |
| 18 to 34 Years | 0 (0.0%) | 0 (0.0%) |
| 35 to 64 Years | 4 (3.0%) | 2 (2.2%) |
| 65 to 74 Years | 1 (3.3%) | 0 (0.0%) |
| 75 Years and over | 1 (4.8%) | 7 (30.4%) |
Disability Class: Cognitive Difficulty
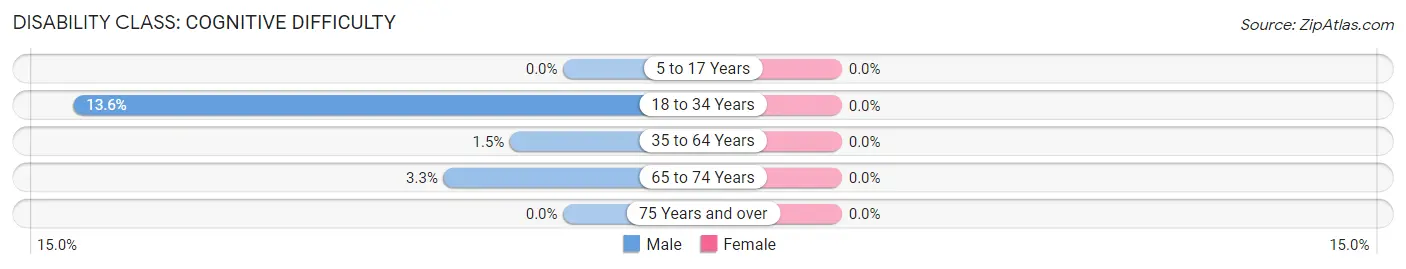
| Age Bracket | Male | Female |
| 5 to 17 Years | 0 (0.0%) | 0 (0.0%) |
| 18 to 34 Years | 3 (13.6%) | 0 (0.0%) |
| 35 to 64 Years | 2 (1.5%) | 0 (0.0%) |
| 65 to 74 Years | 1 (3.3%) | 0 (0.0%) |
| 75 Years and over | 0 (0.0%) | 0 (0.0%) |
Disability Class: Ambulatory Difficulty
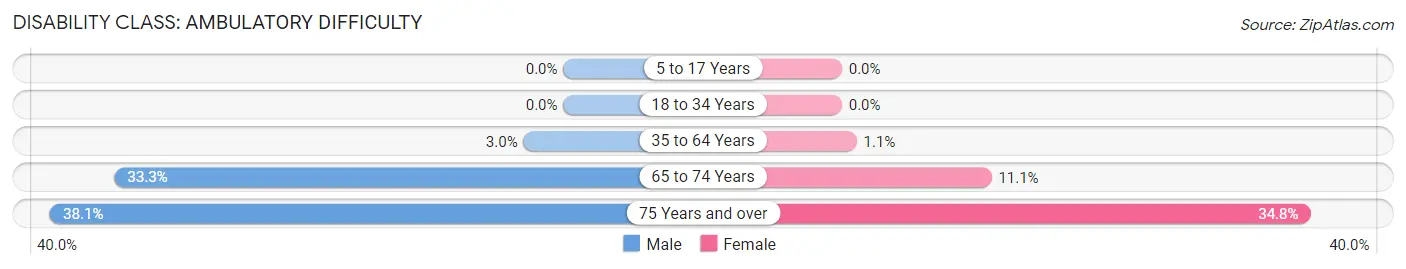
| Age Bracket | Male | Female |
| 5 to 17 Years | 0 (0.0%) | 0 (0.0%) |
| 18 to 34 Years | 0 (0.0%) | 0 (0.0%) |
| 35 to 64 Years | 4 (3.0%) | 1 (1.1%) |
| 65 to 74 Years | 10 (33.3%) | 4 (11.1%) |
| 75 Years and over | 8 (38.1%) | 8 (34.8%) |
Disability Class: Self-Care Difficulty
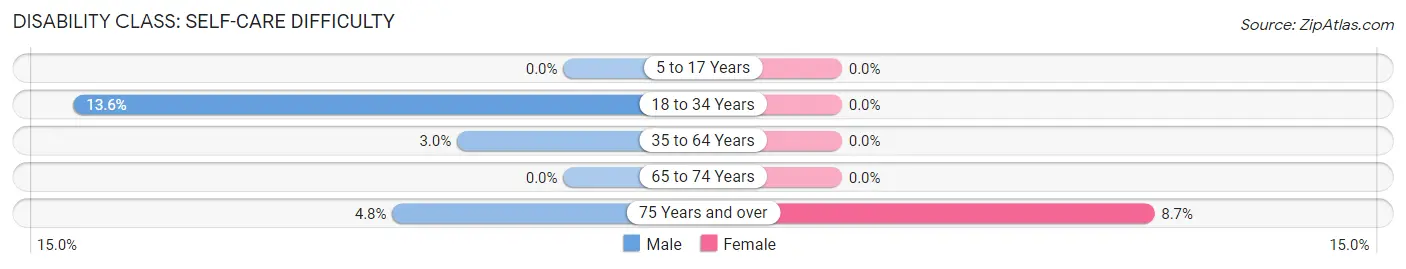
| Age Bracket | Male | Female |
| 5 to 17 Years | 0 (0.0%) | 0 (0.0%) |
| 18 to 34 Years | 3 (13.6%) | 0 (0.0%) |
| 35 to 64 Years | 4 (3.0%) | 0 (0.0%) |
| 65 to 74 Years | 0 (0.0%) | 0 (0.0%) |
| 75 Years and over | 1 (4.8%) | 2 (8.7%) |
Technology Access in Portland
Computing Device Access in Portland
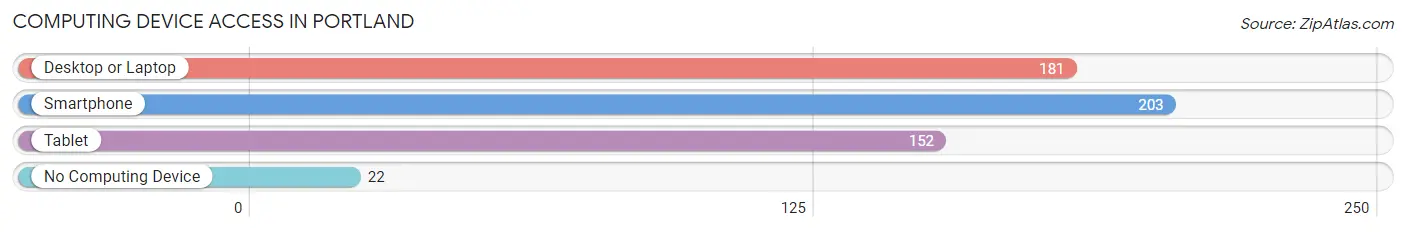
| Device Type | # Households | % Households |
| Desktop or Laptop | 181 | 72.7% |
| Smartphone | 203 | 81.5% |
| Tablet | 152 | 61.0% |
| No Computing Device | 22 | 8.8% |
| Total | 249 | 100.0% |
Internet Access in Portland
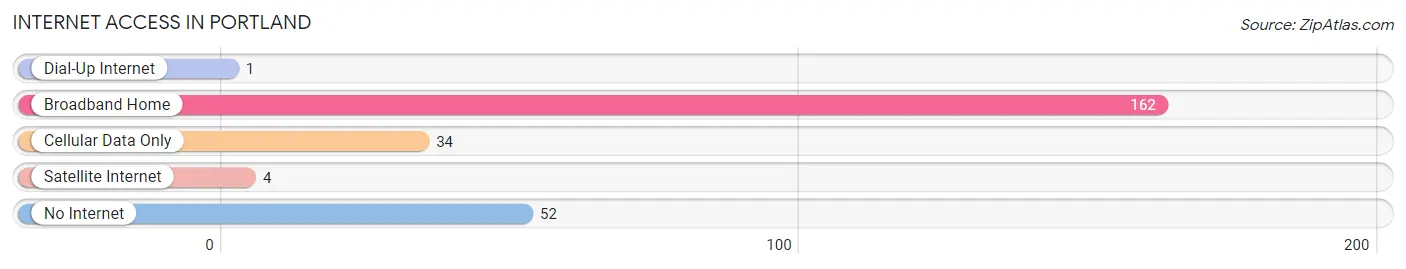
| Internet Type | # Households | % Households |
| Dial-Up Internet | 1 | 0.4% |
| Broadband Home | 162 | 65.1% |
| Cellular Data Only | 34 | 13.7% |
| Satellite Internet | 4 | 1.6% |
| No Internet | 52 | 20.9% |
| Total | 249 | 100.0% |
Portland Summary
Portland is a city located in the state of North Dakota. It is the county seat of Walsh County and is located in the northeastern part of the state. The city is situated on the Red River of the North, which forms the border between North Dakota and Minnesota. The population of Portland was 1,845 at the 2010 census.
Geography
Portland is located at the intersection of U.S. Route 81 and North Dakota Highway 17. It is situated on the Red River of the North, which forms the border between North Dakota and Minnesota. The city is located in the Red River Valley, which is a flat, fertile region of the Great Plains. The city is surrounded by agricultural land, with the nearest major city being Grand Forks, which is located about 40 miles to the north.
Climate
Portland has a humid continental climate, with cold winters and hot summers. The average annual temperature is 45°F, with an average high of 57°F in July and an average low of 33°F in January. The average annual precipitation is 22 inches, with the wettest month being June, when an average of 4.5 inches of rain falls.
Demographics
As of the 2010 census, there were 1,845 people, 745 households, and 463 families residing in the city. The population density was 1,092.3 people per square mile (422.2/km2). There were 817 housing units at an average density of 482.3 per square mile (186.2/km2). The racial makeup of the city was 97.2% White, 0.2% African American, 0.7% Native American, 0.2% Asian, 0.2% from other races, and 1.7% from two or more races. Hispanic or Latino of any race were 1.2% of the population.
Economy
Portland’s economy is largely based on agriculture, with the city being located in the heart of the Red River Valley. The city is home to several grain elevators, as well as a number of other businesses related to agriculture. The city is also home to a number of manufacturing companies, including a plastics manufacturer and a metal fabrication company. The city is also home to a number of retail stores, restaurants, and other businesses.
History
Portland was founded in 1881 by a group of settlers from Wisconsin. The city was named after Portland, Maine, and was incorporated in 1883. The city grew rapidly in the late 19th and early 20th centuries, and by 1910, the population had reached 1,845. The city was a major shipping point for grain and other agricultural products, and the city’s economy was largely based on agriculture.
In the mid-20th century, the city’s economy began to diversify, with the addition of manufacturing and other businesses. The city’s population has remained relatively stable since the 1950s, and the city continues to be a major shipping point for grain and other agricultural products.
Conclusion
Portland is a city located in the northeastern part of North Dakota. It is situated on the Red River of the North, which forms the border between North Dakota and Minnesota. The city has a population of 1,845, and its economy is largely based on agriculture, with the city being located in the heart of the Red River Valley. The city is also home to a number of manufacturing and retail businesses, as well as a number of restaurants and other businesses. Portland has a long history, having been founded in 1881, and it continues to be an important shipping point for grain and other agricultural products.
Common Questions
What is Per Capita Income in Portland?
Per Capita income in Portland is $38,623.
What is the Median Family Income in Portland?
Median Family Income in Portland is $99,500.
What is the Median Household income in Portland?
Median Household Income in Portland is $77,250.
What is Income or Wage Gap in Portland?
Income or Wage Gap in Portland is 24.8%.
Women in Portland earn 75.2 cents for every dollar earned by a man.
What is Inequality or Gini Index in Portland?
Inequality or Gini Index in Portland is 0.39.
What is the Total Population of Portland?
Total Population of Portland is 562.
What is the Total Male Population of Portland?
Total Male Population of Portland is 292.
What is the Total Female Population of Portland?
Total Female Population of Portland is 270.
What is the Ratio of Males per 100 Females in Portland?
There are 108.15 Males per 100 Females in Portland.
What is the Ratio of Females per 100 Males in Portland?
There are 92.47 Females per 100 Males in Portland.
What is the Median Population Age in Portland?
Median Population Age in Portland is 46.4 Years.
What is the Average Family Size in Portland
Average Family Size in Portland is 2.7 People.
What is the Average Household Size in Portland
Average Household Size in Portland is 2.3 People.
How Large is the Labor Force in Portland?
There are 279 People in the Labor Forcein in Portland.
What is the Percentage of People in the Labor Force in Portland?
67.6% of People are in the Labor Force in Portland.
What is the Unemployment Rate in Portland?
Unemployment Rate in Portland is 1.4%.