Halliday, ND Map & Demographics
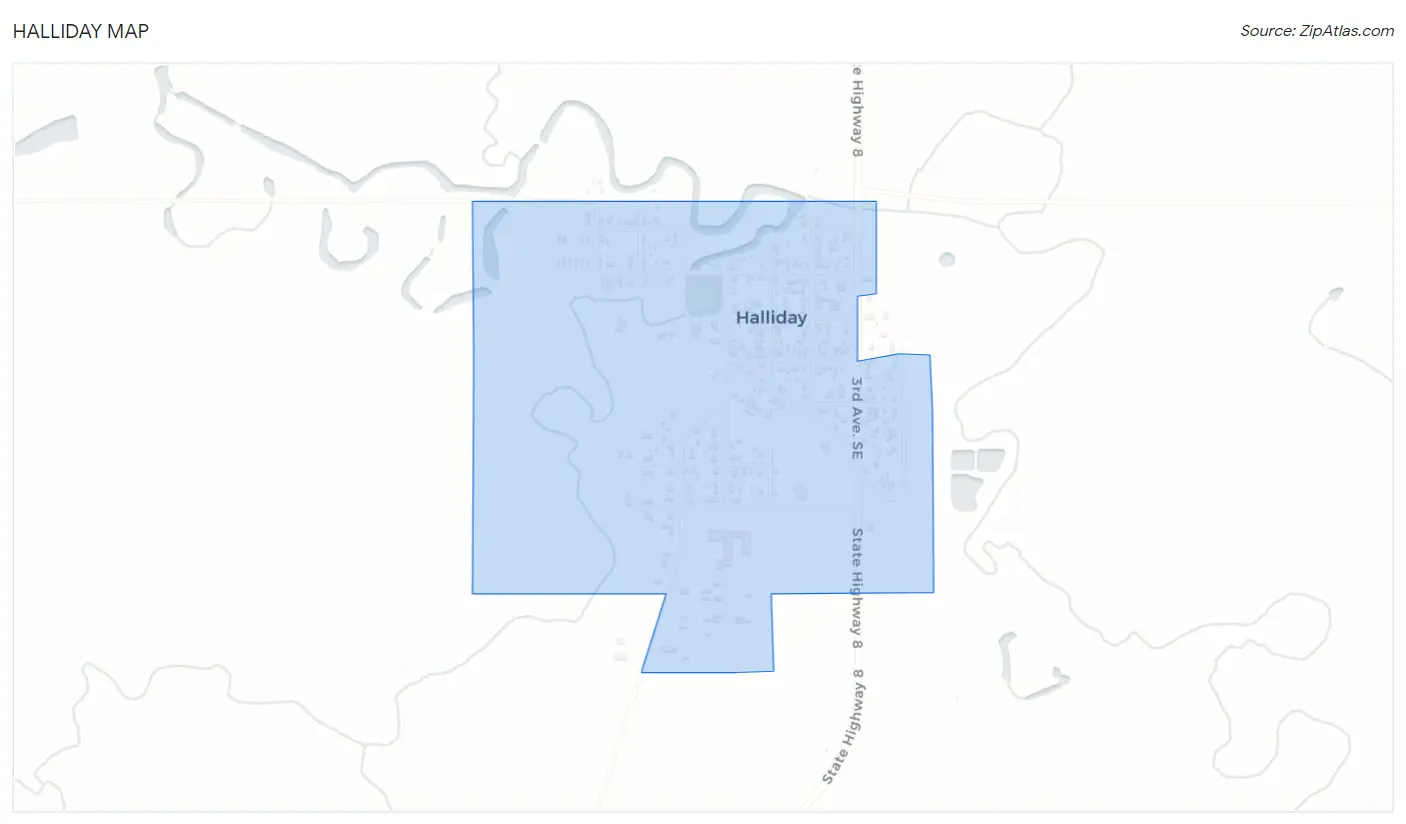
Halliday Map
Halliday Overview
$40,568
PER CAPITA INCOME
$55,000
AVG FAMILY INCOME
$60,833
AVG HOUSEHOLD INCOME
72.6%
WAGE / INCOME GAP [ % ]
27.4¢/ $1
WAGE / INCOME GAP [ $ ]
0.44
INEQUALITY / GINI INDEX
316
TOTAL POPULATION
155
MALE POPULATION
161
FEMALE POPULATION
96.27
MALES / 100 FEMALES
103.87
FEMALES / 100 MALES
29.9
MEDIAN AGE
5.0
AVG FAMILY SIZE
2.5
AVG HOUSEHOLD SIZE
178
LABOR FORCE [ PEOPLE ]
81.3%
PERCENT IN LABOR FORCE
Halliday Zip Codes
Halliday Area Codes
Income in Halliday
Income Overview in Halliday
Per Capita Income in Halliday is $40,568, while median incomes of families and households are $55,000 and $60,833 respectively.
| Characteristic | Number | Measure |
| Per Capita Income | 316 | $40,568 |
| Median Family Income | 38 | $55,000 |
| Mean Family Income | 38 | $75,921 |
| Median Household Income | 128 | $60,833 |
| Mean Household Income | 128 | $93,105 |
| Income Deficit | 38 | $0 |
| Wage / Income Gap (%) | 316 | 72.65% |
| Wage / Income Gap ($) | 316 | 27.35¢ per $1 |
| Gini / Inequality Index | 316 | 0.44 |
Earnings by Sex in Halliday
Average Earnings in Halliday are $47,250, $83,167 for men and $22,750 for women, a difference of 72.7%.
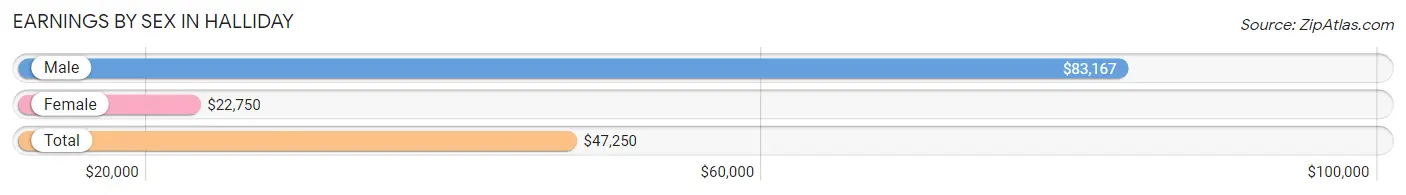
| Sex | Number | Average Earnings |
| Male | 118 (65.2%) | $83,167 |
| Female | 63 (34.8%) | $22,750 |
| Total | 181 (100.0%) | $47,250 |
Earnings by Sex by Income Bracket in Halliday
The most common earnings brackets in Halliday are $100,000+ for men (46 | 39.0%) and $35,000 to $39,999 for women (18 | 28.6%).
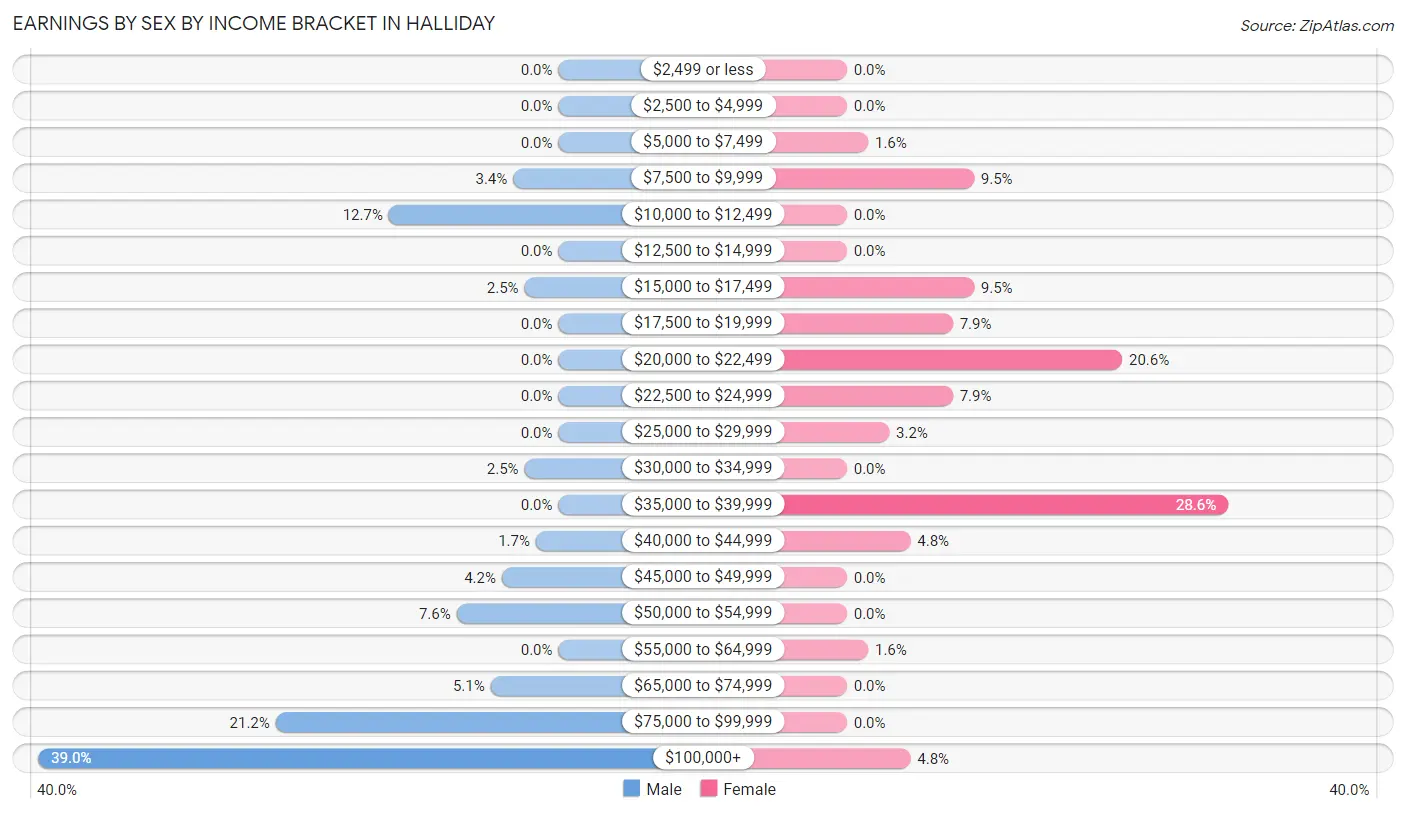
| Income | Male | Female |
| $2,499 or less | 0 (0.0%) | 0 (0.0%) |
| $2,500 to $4,999 | 0 (0.0%) | 0 (0.0%) |
| $5,000 to $7,499 | 0 (0.0%) | 1 (1.6%) |
| $7,500 to $9,999 | 4 (3.4%) | 6 (9.5%) |
| $10,000 to $12,499 | 15 (12.7%) | 0 (0.0%) |
| $12,500 to $14,999 | 0 (0.0%) | 0 (0.0%) |
| $15,000 to $17,499 | 3 (2.5%) | 6 (9.5%) |
| $17,500 to $19,999 | 0 (0.0%) | 5 (7.9%) |
| $20,000 to $22,499 | 0 (0.0%) | 13 (20.6%) |
| $22,500 to $24,999 | 0 (0.0%) | 5 (7.9%) |
| $25,000 to $29,999 | 0 (0.0%) | 2 (3.2%) |
| $30,000 to $34,999 | 3 (2.5%) | 0 (0.0%) |
| $35,000 to $39,999 | 0 (0.0%) | 18 (28.6%) |
| $40,000 to $44,999 | 2 (1.7%) | 3 (4.8%) |
| $45,000 to $49,999 | 5 (4.2%) | 0 (0.0%) |
| $50,000 to $54,999 | 9 (7.6%) | 0 (0.0%) |
| $55,000 to $64,999 | 0 (0.0%) | 1 (1.6%) |
| $65,000 to $74,999 | 6 (5.1%) | 0 (0.0%) |
| $75,000 to $99,999 | 25 (21.2%) | 0 (0.0%) |
| $100,000+ | 46 (39.0%) | 3 (4.8%) |
| Total | 118 (100.0%) | 63 (100.0%) |
Earnings by Sex by Educational Attainment in Halliday
Average earnings in Halliday are $84,667 for men and $28,750 for women, a difference of 66.0%. Men with an educational attainment of college or associate's degree enjoy the highest average annual earnings of $118,125, while those with high school diploma education earn the least with $69,375. Women with an educational attainment of bachelor's degree earn the most with the average annual earnings of $52,500, while those with high school diploma education have the smallest earnings of $23,750.
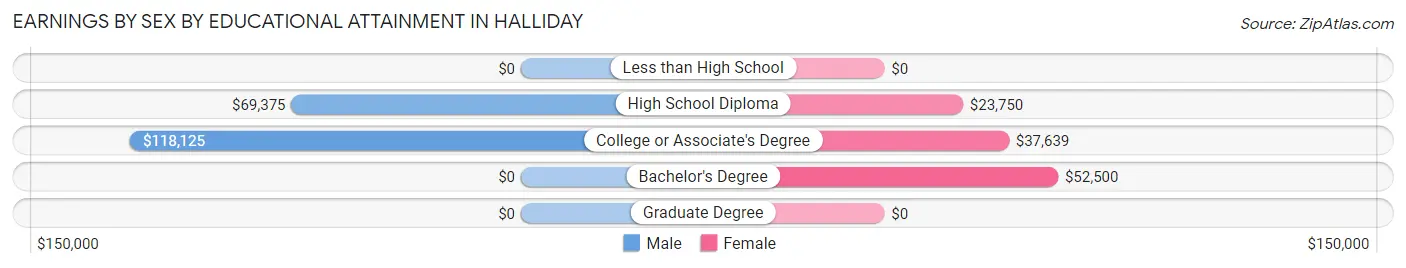
| Educational Attainment | Male Income | Female Income |
| Less than High School | - | - |
| High School Diploma | $69,375 | $23,750 |
| College or Associate's Degree | $118,125 | $37,639 |
| Bachelor's Degree | - | - |
| Graduate Degree | - | - |
| Total | $84,667 | $28,750 |
Family Income in Halliday
Family Income Brackets in Halliday
According to the Halliday family income data, there are 12 families falling into the $50,000 to $74,999 income range, which is the most common income bracket and makes up 31.6% of all families.
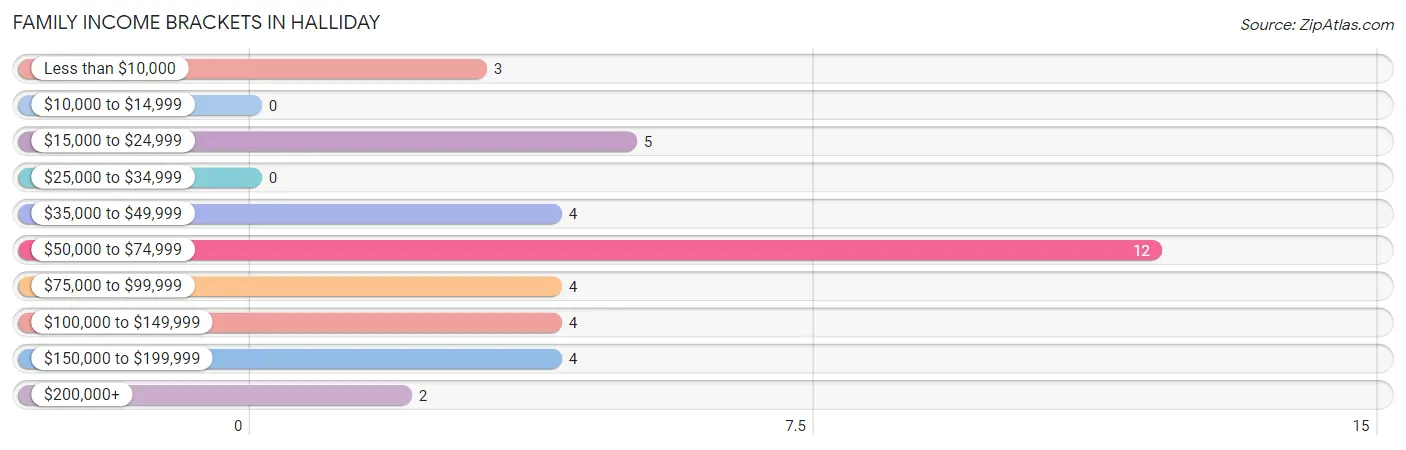
| Income Bracket | # Families | % Families |
| Less than $10,000 | 3 | 7.9% |
| $10,000 to $14,999 | 0 | 0.0% |
| $15,000 to $24,999 | 5 | 13.2% |
| $25,000 to $34,999 | 0 | 0.0% |
| $35,000 to $49,999 | 4 | 10.5% |
| $50,000 to $74,999 | 12 | 31.6% |
| $75,000 to $99,999 | 4 | 10.5% |
| $100,000 to $149,999 | 4 | 10.5% |
| $150,000 to $199,999 | 4 | 10.5% |
| $200,000+ | 2 | 5.3% |
Family Income by Famaliy Size in Halliday
2-person families (12 | 31.6%) account for the highest median family income in Halliday with $57,000 per family, while 2-person families (12 | 31.6%) have the highest median income of $28,500 per family member.
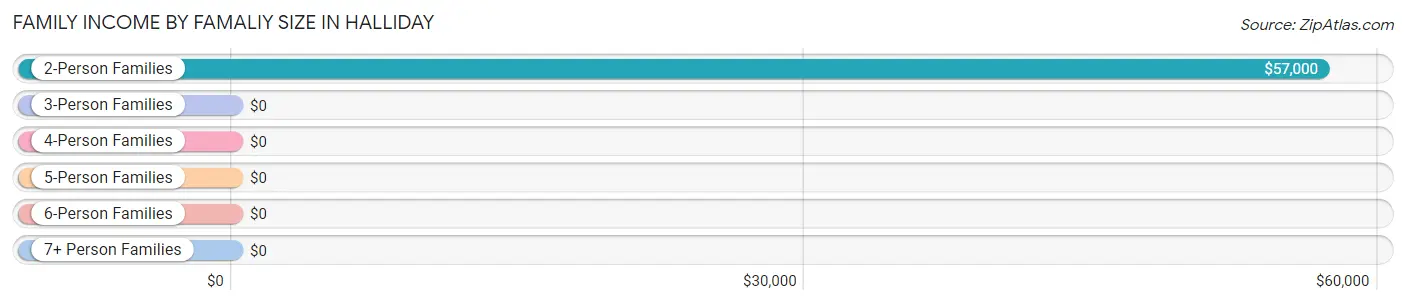
| Income Bracket | # Families | Median Income |
| 2-Person Families | 12 (31.6%) | $57,000 |
| 3-Person Families | 5 (13.2%) | $0 |
| 4-Person Families | 12 (31.6%) | $0 |
| 5-Person Families | 6 (15.8%) | $0 |
| 6-Person Families | 1 (2.6%) | $0 |
| 7+ Person Families | 2 (5.3%) | $0 |
| Total | 38 (100.0%) | $55,000 |
Family Income by Number of Earners in Halliday
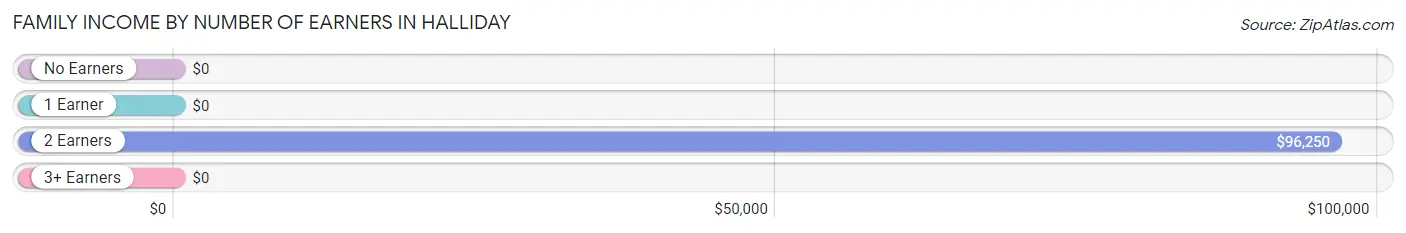
| Number of Earners | # Families | Median Income |
| No Earners | 1 (2.6%) | $0 |
| 1 Earner | 18 (47.4%) | $0 |
| 2 Earners | 18 (47.4%) | $96,250 |
| 3+ Earners | 1 (2.6%) | $0 |
| Total | 38 (100.0%) | $55,000 |
Household Income in Halliday
Household Income Brackets in Halliday
With 30 households falling in the category, the $35,000 to $49,999 income range is the most frequent in Halliday, accounting for 23.4% of all households. In contrast, only 3 households (2.3%) fall into the $10,000 to $14,999 income bracket, making it the least populous group.
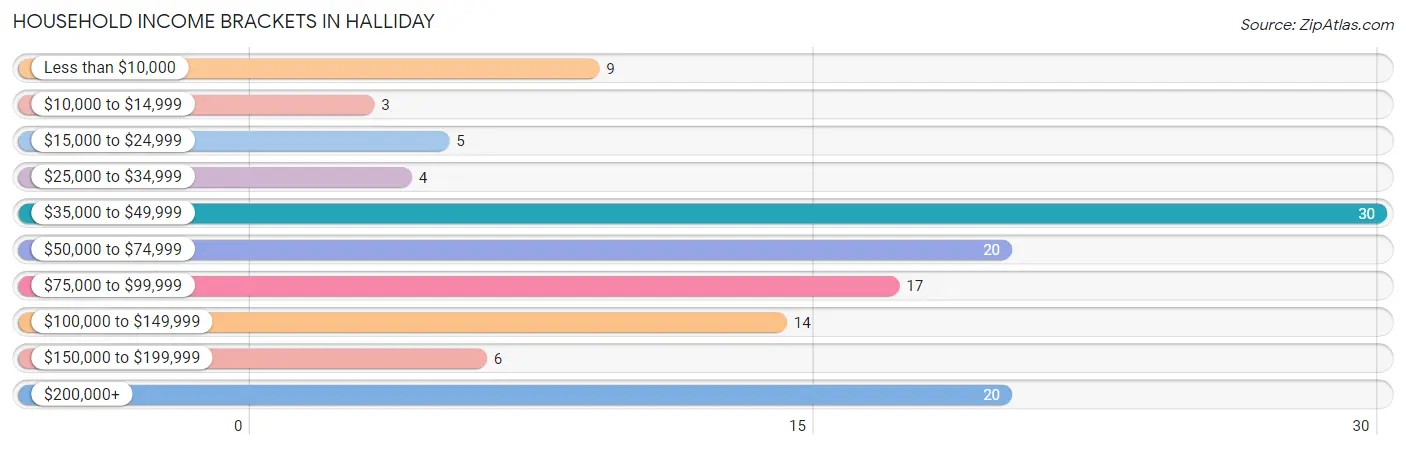
| Income Bracket | # Households | % Households |
| Less than $10,000 | 9 | 7.0% |
| $10,000 to $14,999 | 3 | 2.3% |
| $15,000 to $24,999 | 5 | 3.9% |
| $25,000 to $34,999 | 4 | 3.1% |
| $35,000 to $49,999 | 30 | 23.4% |
| $50,000 to $74,999 | 20 | 15.6% |
| $75,000 to $99,999 | 17 | 13.3% |
| $100,000 to $149,999 | 14 | 10.9% |
| $150,000 to $199,999 | 6 | 4.7% |
| $200,000+ | 20 | 15.6% |
Household Income by Householder Age in Halliday
The median household income in Halliday is $60,833, with the highest median household income of $62,750 found in the 65+ years age bracket for the primary householder. A total of 39 households (30.5%) fall into this category. Meanwhile, the 45 to 64 years age bracket for the primary householder has the lowest median household income of $0, with 37 households (28.9%) in this group.
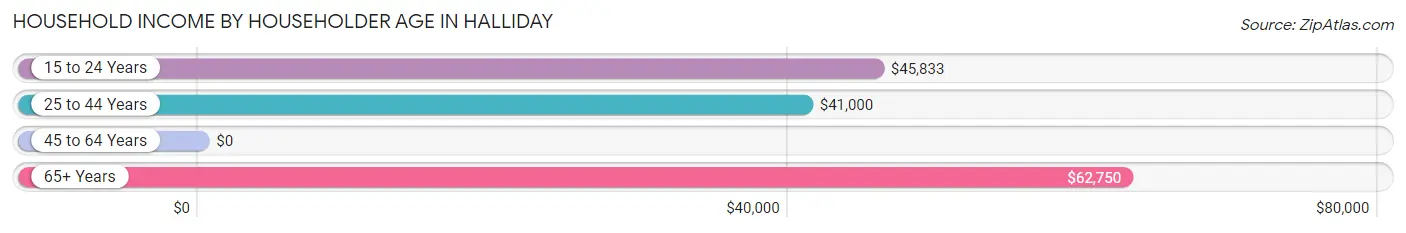
| Income Bracket | # Households | Median Income |
| 15 to 24 Years | 6 (4.7%) | $45,833 |
| 25 to 44 Years | 46 (35.9%) | $41,000 |
| 45 to 64 Years | 37 (28.9%) | $0 |
| 65+ Years | 39 (30.5%) | $62,750 |
| Total | 128 (100.0%) | $60,833 |
Poverty in Halliday
Income Below Poverty by Sex and Age in Halliday
With 12.3% poverty level for males and 26.7% for females among the residents of Halliday, 75 year old and over males and 15 year old females are the most vulnerable to poverty, with 10 males (83.3%) and 8 females (100.0%) in their respective age groups living below the poverty level.
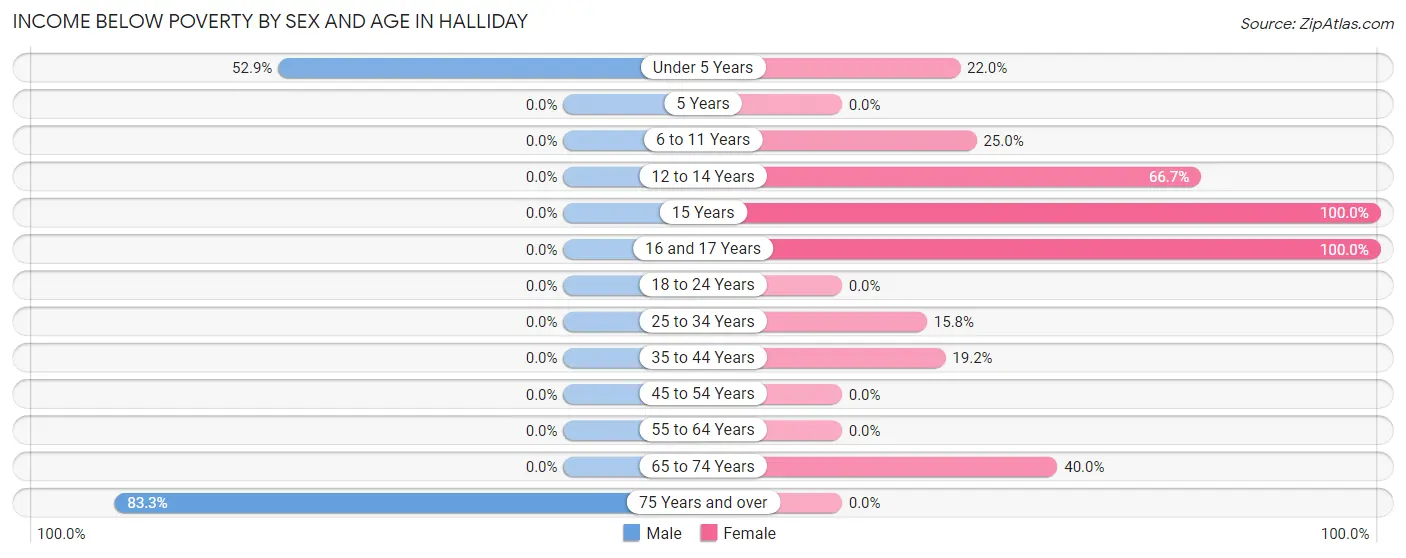
| Age Bracket | Male | Female |
| Under 5 Years | 9 (52.9%) | 9 (22.0%) |
| 5 Years | 0 (0.0%) | 0 (0.0%) |
| 6 to 11 Years | 0 (0.0%) | 4 (25.0%) |
| 12 to 14 Years | 0 (0.0%) | 4 (66.7%) |
| 15 Years | 0 (0.0%) | 8 (100.0%) |
| 16 and 17 Years | 0 (0.0%) | 8 (100.0%) |
| 18 to 24 Years | 0 (0.0%) | 0 (0.0%) |
| 25 to 34 Years | 0 (0.0%) | 3 (15.8%) |
| 35 to 44 Years | 0 (0.0%) | 5 (19.2%) |
| 45 to 54 Years | 0 (0.0%) | 0 (0.0%) |
| 55 to 64 Years | 0 (0.0%) | 0 (0.0%) |
| 65 to 74 Years | 0 (0.0%) | 2 (40.0%) |
| 75 Years and over | 10 (83.3%) | 0 (0.0%) |
| Total | 19 (12.3%) | 43 (26.7%) |
Income Above Poverty by Sex and Age in Halliday
According to the poverty statistics in Halliday, males aged 6 to 11 years and females aged 5 years are the age groups that are most secure financially, with 100.0% of males and 100.0% of females in these age groups living above the poverty line.
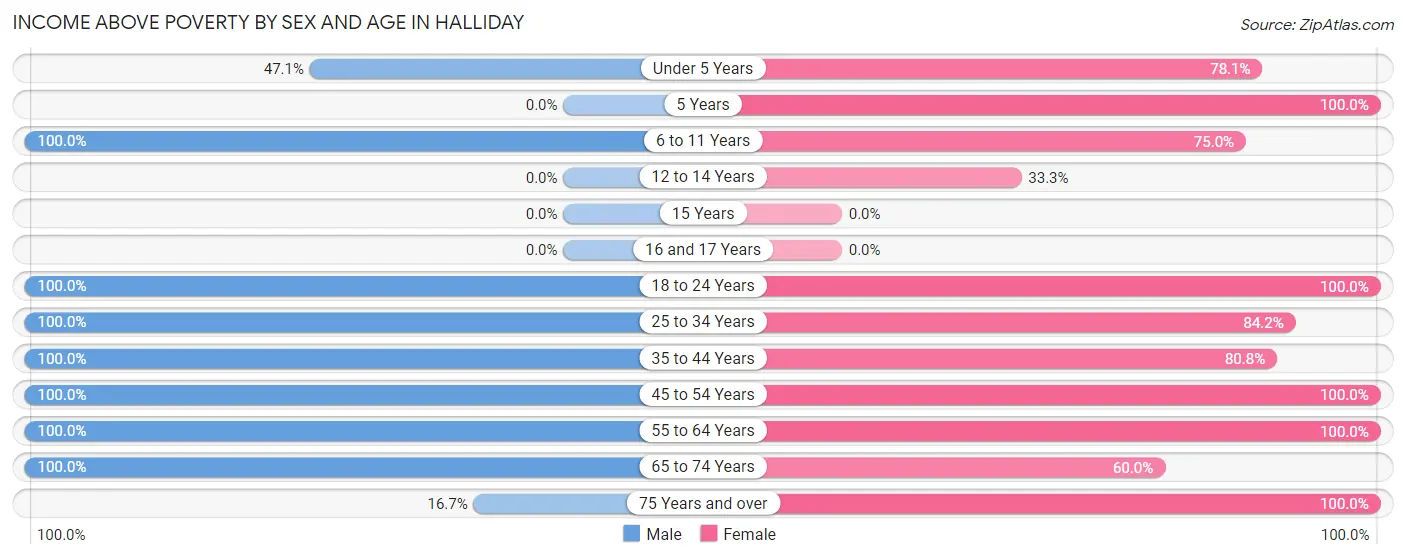
| Age Bracket | Male | Female |
| Under 5 Years | 8 (47.1%) | 32 (78.0%) |
| 5 Years | 0 (0.0%) | 2 (100.0%) |
| 6 to 11 Years | 7 (100.0%) | 12 (75.0%) |
| 12 to 14 Years | 0 (0.0%) | 2 (33.3%) |
| 15 Years | 0 (0.0%) | 0 (0.0%) |
| 16 and 17 Years | 0 (0.0%) | 0 (0.0%) |
| 18 to 24 Years | 18 (100.0%) | 14 (100.0%) |
| 25 to 34 Years | 17 (100.0%) | 16 (84.2%) |
| 35 to 44 Years | 23 (100.0%) | 21 (80.8%) |
| 45 to 54 Years | 29 (100.0%) | 7 (100.0%) |
| 55 to 64 Years | 9 (100.0%) | 6 (100.0%) |
| 65 to 74 Years | 23 (100.0%) | 3 (60.0%) |
| 75 Years and over | 2 (16.7%) | 3 (100.0%) |
| Total | 136 (87.7%) | 118 (73.3%) |
Income Below Poverty Among Married-Couple Families in Halliday
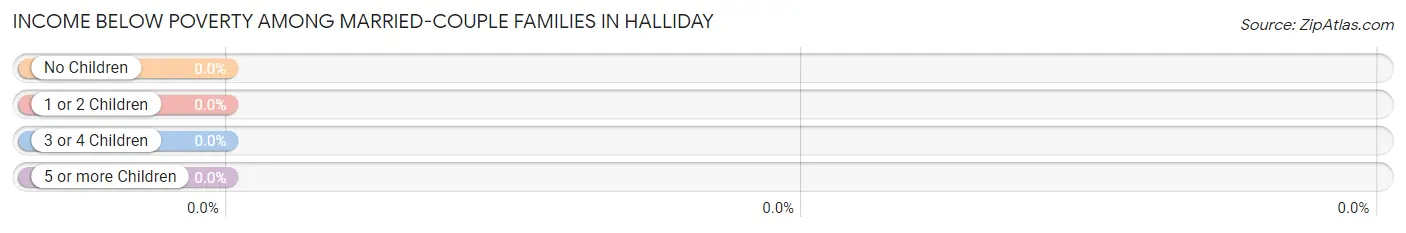
| Children | Above Poverty | Below Poverty |
| No Children | 12 (100.0%) | 0 (0.0%) |
| 1 or 2 Children | 13 (100.0%) | 0 (0.0%) |
| 3 or 4 Children | 2 (100.0%) | 0 (0.0%) |
| 5 or more Children | 2 (100.0%) | 0 (0.0%) |
| Total | 29 (100.0%) | 0 (0.0%) |
Income Below Poverty Among Single-Parent Households in Halliday
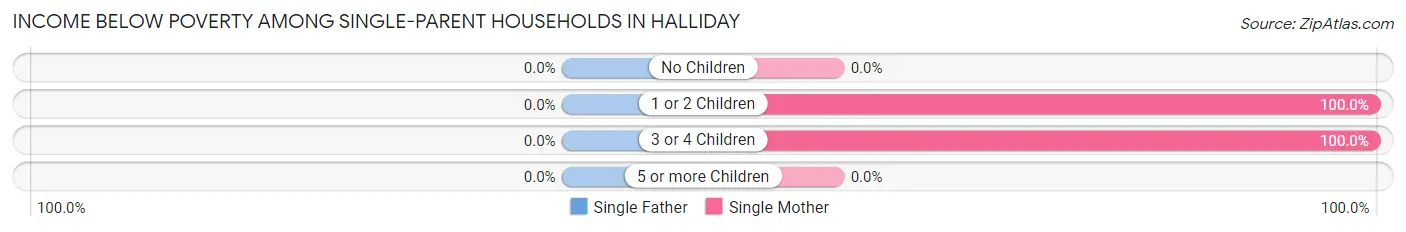
| Children | Single Father | Single Mother |
| No Children | 0 (0.0%) | 0 (0.0%) |
| 1 or 2 Children | 0 (0.0%) | 3 (100.0%) |
| 3 or 4 Children | 0 (0.0%) | 5 (100.0%) |
| 5 or more Children | 0 (0.0%) | 0 (0.0%) |
| Total | 0 (0.0%) | 8 (88.9%) |
Income Below Poverty Among Married-Couple vs Single-Parent Households in Halliday
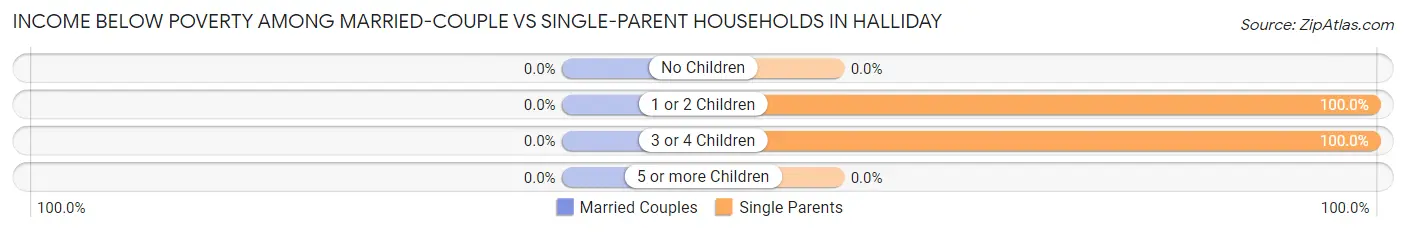
| Children | Married-Couple Families | Single-Parent Households |
| No Children | 0 (0.0%) | 0 (0.0%) |
| 1 or 2 Children | 0 (0.0%) | 3 (100.0%) |
| 3 or 4 Children | 0 (0.0%) | 5 (100.0%) |
| 5 or more Children | 0 (0.0%) | 0 (0.0%) |
| Total | 0 (0.0%) | 8 (88.9%) |
Race in Halliday
The most populous races in Halliday are White / Caucasian (256 | 81.0%), Two or more Races (44 | 13.9%), and Hispanic or Latino (34 | 10.8%).
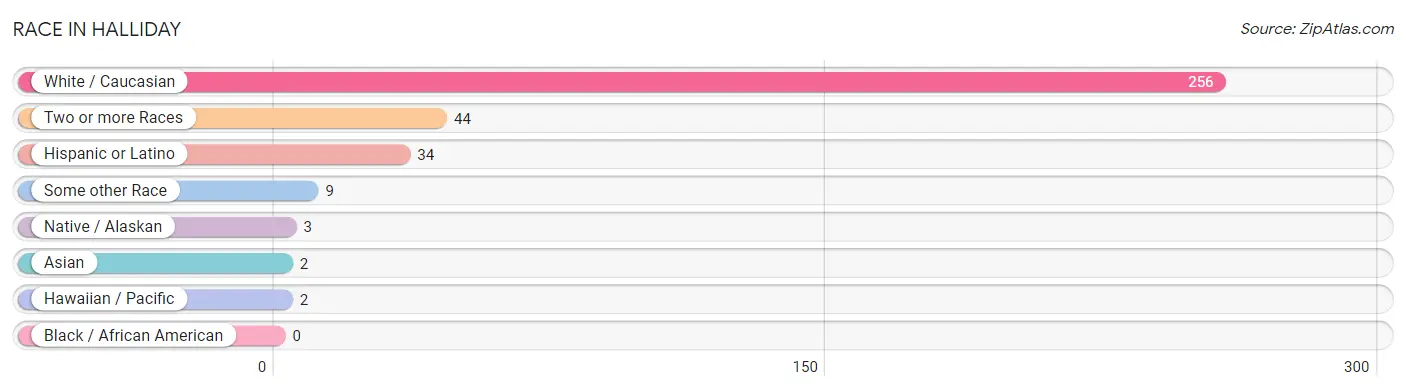
| Race | # Population | % Population |
| Asian | 2 | 0.6% |
| Black / African American | 0 | 0.0% |
| Hawaiian / Pacific | 2 | 0.6% |
| Hispanic or Latino | 34 | 10.8% |
| Native / Alaskan | 3 | 0.9% |
| White / Caucasian | 256 | 81.0% |
| Two or more Races | 44 | 13.9% |
| Some other Race | 9 | 2.9% |
| Total | 316 | 100.0% |
Ancestry in Halliday
The most populous ancestries reported in Halliday are German (148 | 46.8%), Norwegian (35 | 11.1%), Mexican (34 | 10.8%), Irish (31 | 9.8%), and Mexican American Indian (25 | 7.9%), together accounting for 86.4% of all Halliday residents.
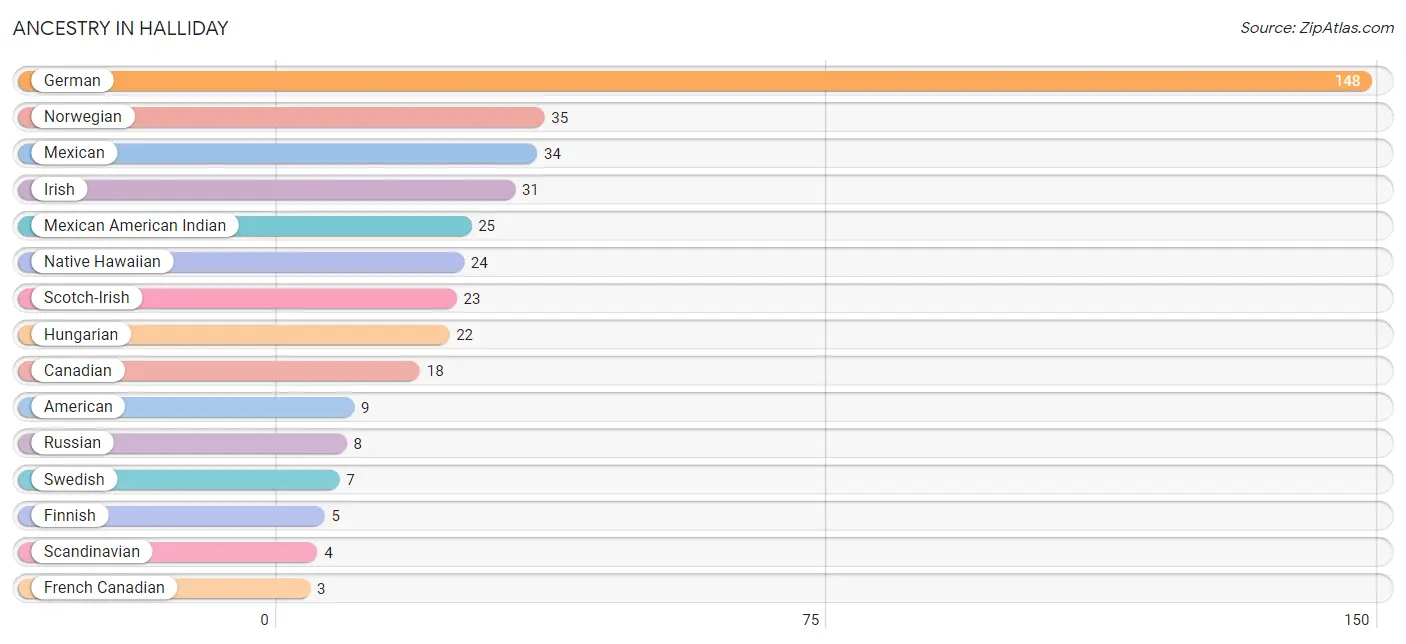
| Ancestry | # Population | % Population |
| American | 9 | 2.9% |
| Canadian | 18 | 5.7% |
| English | 2 | 0.6% |
| Finnish | 5 | 1.6% |
| French | 1 | 0.3% |
| French Canadian | 3 | 0.9% |
| German | 148 | 46.8% |
| Hungarian | 22 | 7.0% |
| Irish | 31 | 9.8% |
| Mexican | 34 | 10.8% |
| Mexican American Indian | 25 | 7.9% |
| Native Hawaiian | 24 | 7.6% |
| Norwegian | 35 | 11.1% |
| Polish | 3 | 0.9% |
| Russian | 8 | 2.5% |
| Scandinavian | 4 | 1.3% |
| Scotch-Irish | 23 | 7.3% |
| Sri Lankan | 2 | 0.6% |
| Swedish | 7 | 2.2% | View All 19 Rows |
Immigrants in Halliday
The most numerous immigrant groups reported in Halliday came from Asia (2 | 0.6%), South Eastern Asia (2 | 0.6%), and Vietnam (2 | 0.6%), together accounting for 1.9% of all Halliday residents.
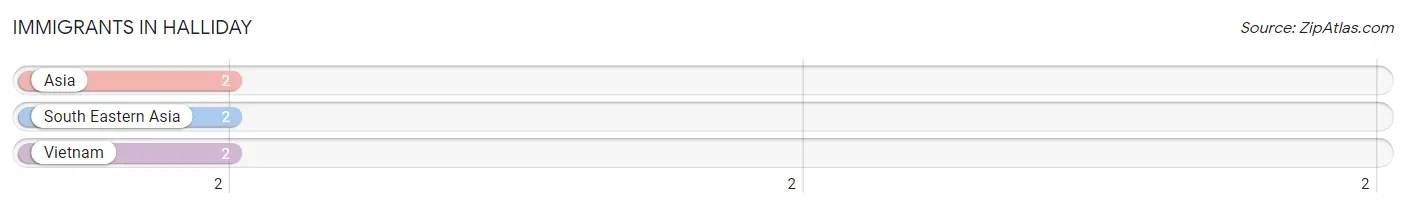
| Immigration Origin | # Population | % Population |
| Asia | 2 | 0.6% |
| South Eastern Asia | 2 | 0.6% |
| Vietnam | 2 | 0.6% | View All 3 Rows |
Sex and Age in Halliday
Sex and Age in Halliday
The most populous age groups in Halliday are 45 to 49 Years (28 | 18.1%) for men and Under 5 Years (41 | 25.5%) for women.
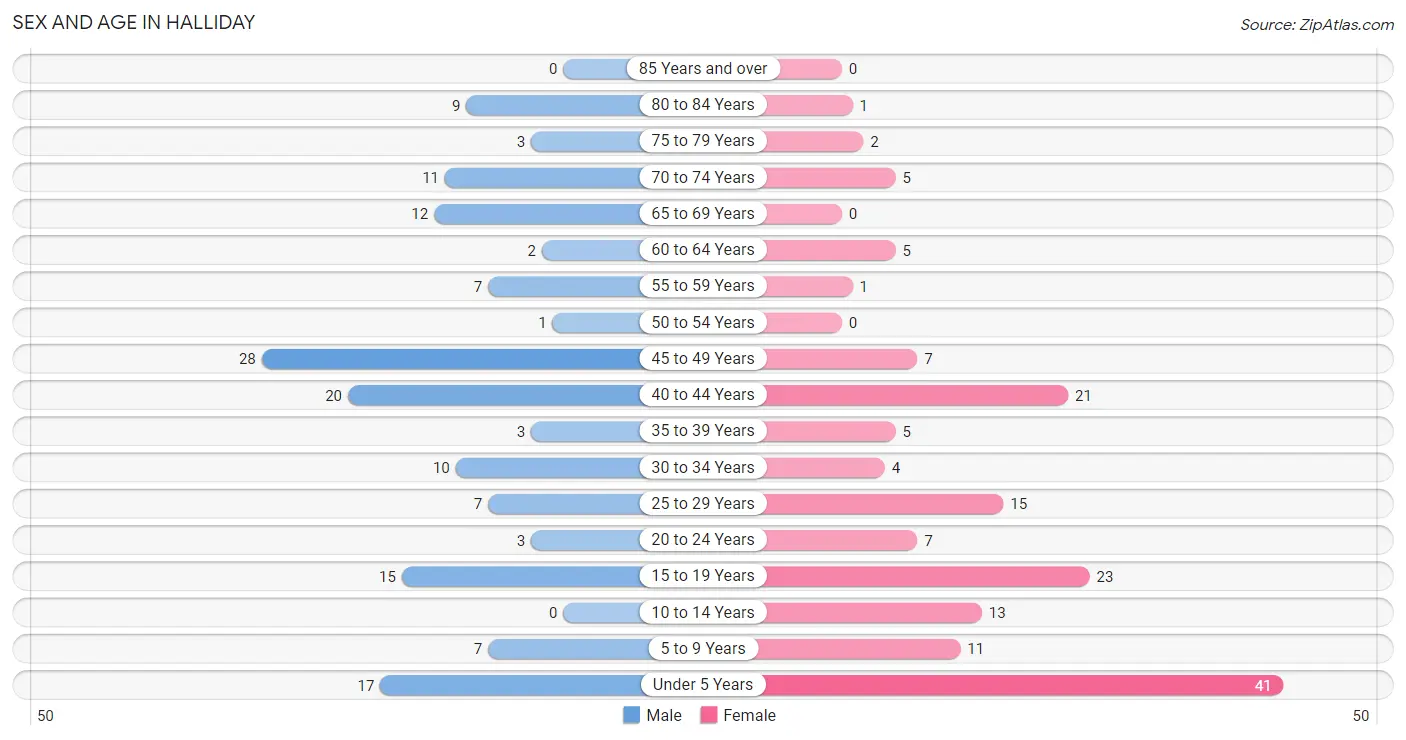
| Age Bracket | Male | Female |
| Under 5 Years | 17 (11.0%) | 41 (25.5%) |
| 5 to 9 Years | 7 (4.5%) | 11 (6.8%) |
| 10 to 14 Years | 0 (0.0%) | 13 (8.1%) |
| 15 to 19 Years | 15 (9.7%) | 23 (14.3%) |
| 20 to 24 Years | 3 (1.9%) | 7 (4.3%) |
| 25 to 29 Years | 7 (4.5%) | 15 (9.3%) |
| 30 to 34 Years | 10 (6.5%) | 4 (2.5%) |
| 35 to 39 Years | 3 (1.9%) | 5 (3.1%) |
| 40 to 44 Years | 20 (12.9%) | 21 (13.0%) |
| 45 to 49 Years | 28 (18.1%) | 7 (4.3%) |
| 50 to 54 Years | 1 (0.6%) | 0 (0.0%) |
| 55 to 59 Years | 7 (4.5%) | 1 (0.6%) |
| 60 to 64 Years | 2 (1.3%) | 5 (3.1%) |
| 65 to 69 Years | 12 (7.7%) | 0 (0.0%) |
| 70 to 74 Years | 11 (7.1%) | 5 (3.1%) |
| 75 to 79 Years | 3 (1.9%) | 2 (1.2%) |
| 80 to 84 Years | 9 (5.8%) | 1 (0.6%) |
| 85 Years and over | 0 (0.0%) | 0 (0.0%) |
| Total | 155 (100.0%) | 161 (100.0%) |
Families and Households in Halliday
Median Family Size in Halliday
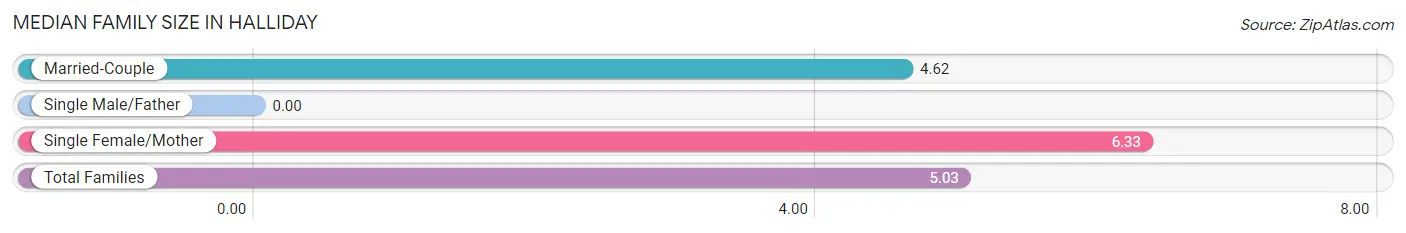
| Family Type | # Families | Family Size |
| Married-Couple | 29 (76.3%) | 4.62 |
| Single Male/Father | 0 (0.0%) | - |
| Single Female/Mother | 9 (23.7%) | 6.33 |
| Total Families | 38 (100.0%) | 5.03 |
Median Household Size in Halliday
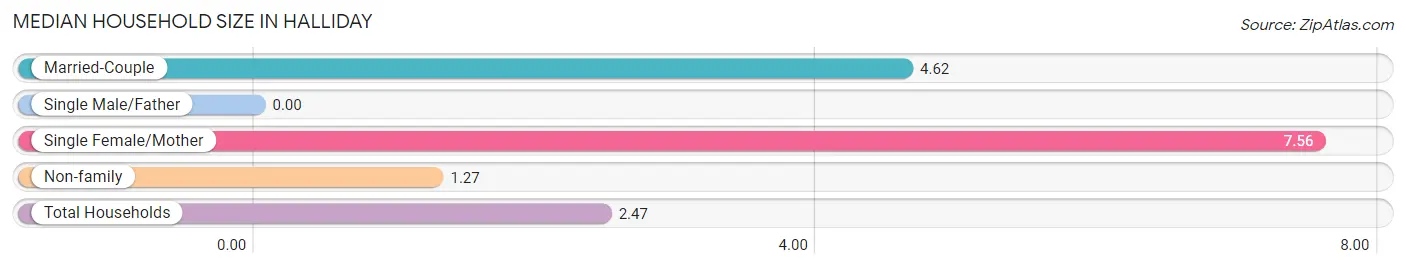
| Household Type | # Households | Household Size |
| Married-Couple | 29 (22.7%) | 4.62 |
| Single Male/Father | 0 (0.0%) | - |
| Single Female/Mother | 9 (7.0%) | 7.56 |
| Non-family | 90 (70.3%) | 1.27 |
| Total Households | 128 (100.0%) | 2.47 |
Household Size by Marriage Status in Halliday
Out of a total of 128 households in Halliday, 38 (29.7%) are family households, while 90 (70.3%) are nonfamily households. The most numerous type of family households are 4-person households, comprising 15, and the most common type of nonfamily households are 1-person households, comprising 70.
| Household Size | Family Households | Nonfamily Households |
| 1-Person Households | - | 70 (54.7%) |
| 2-Person Households | 12 (9.4%) | 20 (15.6%) |
| 3-Person Households | 2 (1.6%) | 0 (0.0%) |
| 4-Person Households | 15 (11.7%) | 0 (0.0%) |
| 5-Person Households | 1 (0.8%) | 0 (0.0%) |
| 6-Person Households | 6 (4.7%) | 0 (0.0%) |
| 7+ Person Households | 2 (1.6%) | 0 (0.0%) |
| Total | 38 (29.7%) | 90 (70.3%) |
Female Fertility in Halliday
Fertility by Age in Halliday
Average fertility rate in Halliday is 37.0 births per 1,000 women. Women in the age bracket of 20 to 34 years have the highest fertility rate with 115.0 births per 1,000 women. Women in the age bracket of 20 to 34 years acount for 100.0% of all women with births.
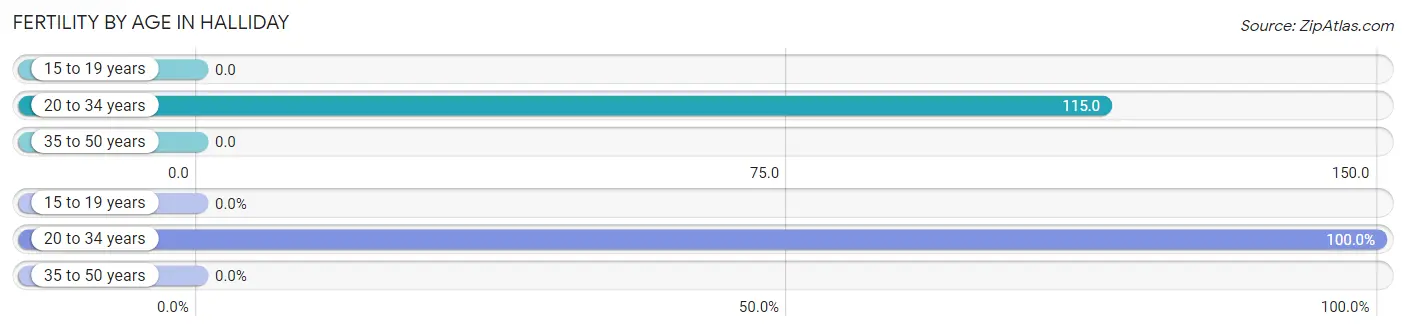
| Age Bracket | Women with Births | Births / 1,000 Women |
| 15 to 19 years | 0 (0.0%) | 0.0 |
| 20 to 34 years | 3 (100.0%) | 115.0 |
| 35 to 50 years | 0 (0.0%) | 0.0 |
| Total | 3 (100.0%) | 37.0 |
Fertility by Age by Marriage Status in Halliday
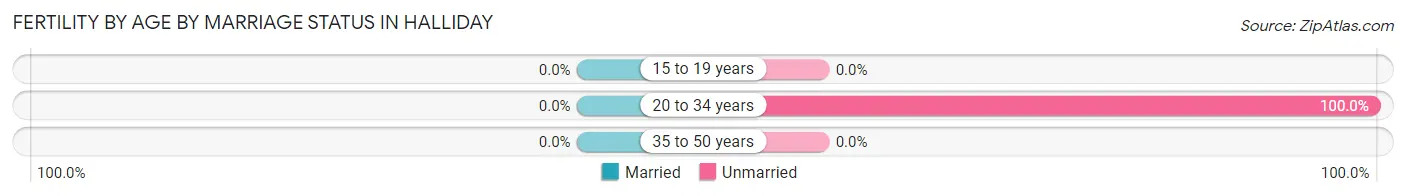
| Age Bracket | Married | Unmarried |
| 15 to 19 years | 0 (0.0%) | 0 (0.0%) |
| 20 to 34 years | 0 (0.0%) | 3 (100.0%) |
| 35 to 50 years | 0 (0.0%) | 0 (0.0%) |
| Total | 0 (0.0%) | 3 (100.0%) |
Fertility by Education in Halliday
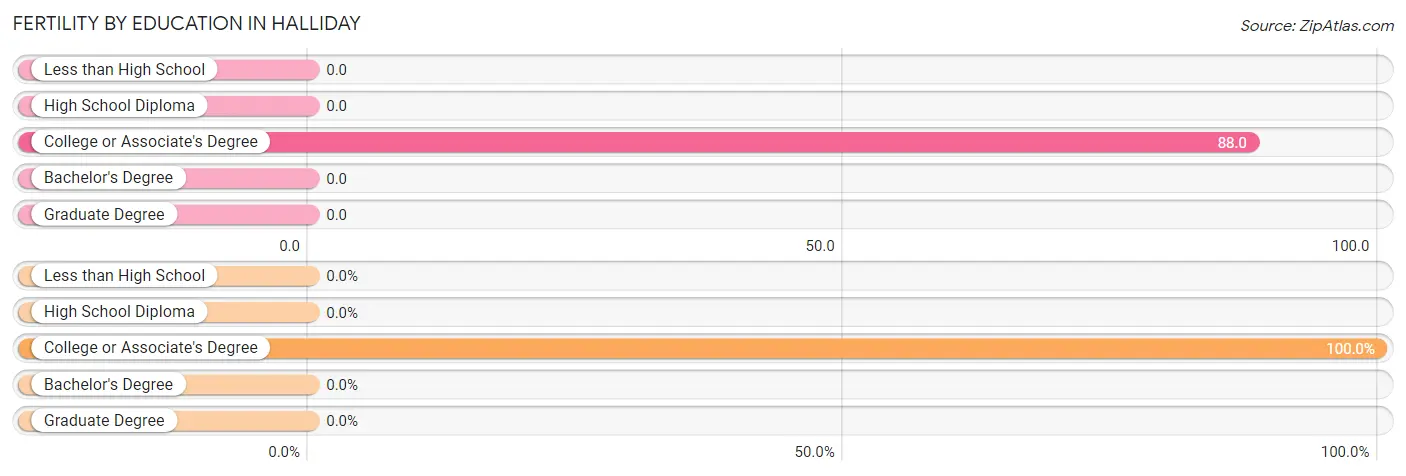
| Educational Attainment | Women with Births | Births / 1,000 Women |
| Less than High School | 0 (0.0%) | 0.0 |
| High School Diploma | 0 (0.0%) | 0.0 |
| College or Associate's Degree | 3 (100.0%) | 88.0 |
| Bachelor's Degree | 0 (0.0%) | 0.0 |
| Graduate Degree | 0 (0.0%) | 0.0 |
| Total | 3 (100.0%) | 37.0 |
Fertility by Education by Marriage Status in Halliday
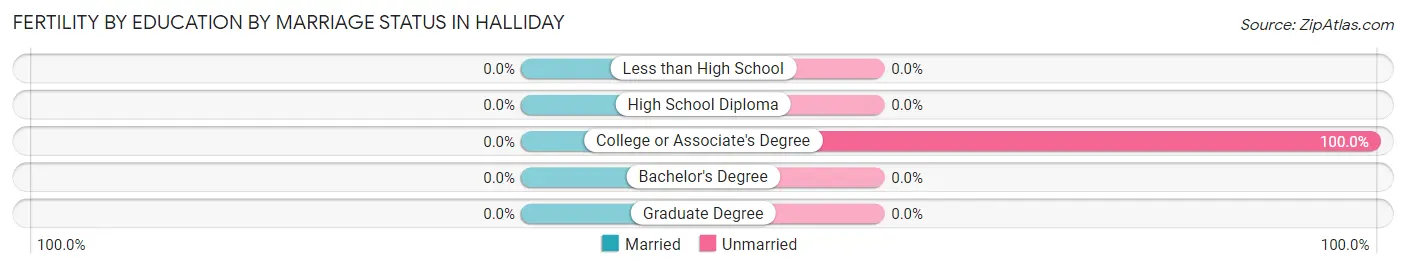
| Educational Attainment | Married | Unmarried |
| Less than High School | 0 (0.0%) | 0 (0.0%) |
| High School Diploma | 0 (0.0%) | 0 (0.0%) |
| College or Associate's Degree | 0 (0.0%) | 3 (100.0%) |
| Bachelor's Degree | 0 (0.0%) | 0 (0.0%) |
| Graduate Degree | 0 (0.0%) | 0 (0.0%) |
| Total | 0 (0.0%) | 3 (100.0%) |
Employment Characteristics in Halliday
Employment by Class of Employer in Halliday
Among the 178 employed individuals in Halliday, private company employees (147 | 82.6%), self-employed (not incorporated) (7 | 3.9%), and self-employed (incorporated) (6 | 3.4%) make up the most common classes of employment.
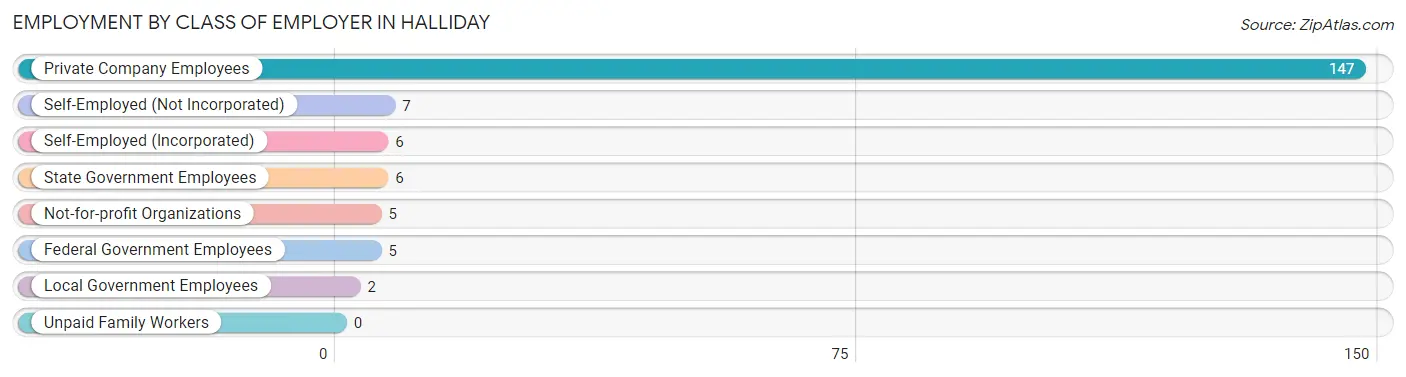
| Employer Class | # Employees | % Employees |
| Private Company Employees | 147 | 82.6% |
| Self-Employed (Incorporated) | 6 | 3.4% |
| Self-Employed (Not Incorporated) | 7 | 3.9% |
| Not-for-profit Organizations | 5 | 2.8% |
| Local Government Employees | 2 | 1.1% |
| State Government Employees | 6 | 3.4% |
| Federal Government Employees | 5 | 2.8% |
| Unpaid Family Workers | 0 | 0.0% |
| Total | 178 | 100.0% |
Employment Status by Age in Halliday
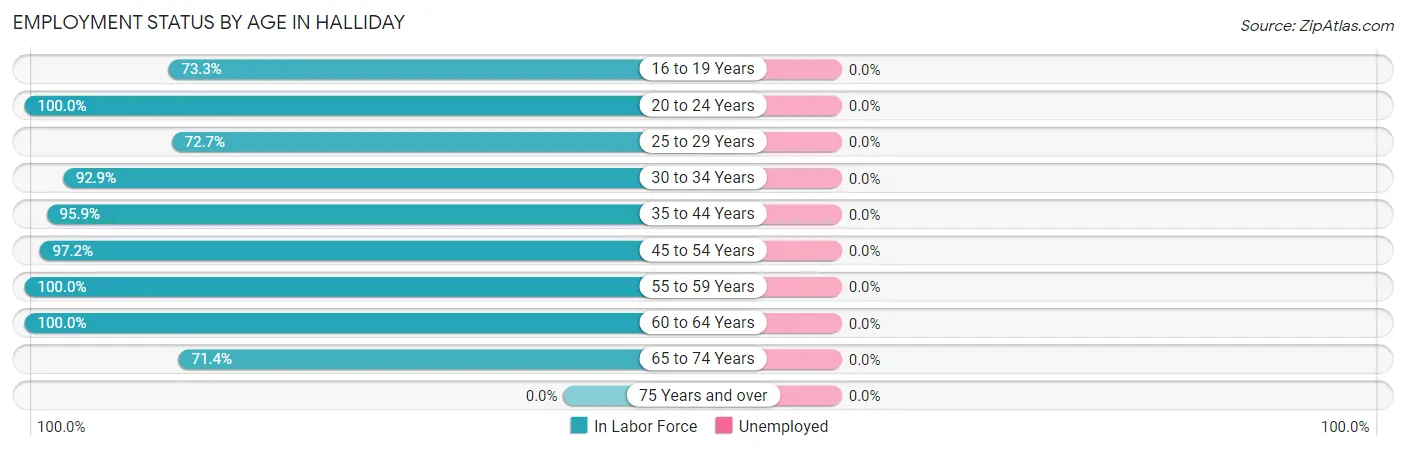
| Age Bracket | In Labor Force | Unemployed |
| 16 to 19 Years | 22 (73.3%) | 0 (0.0%) |
| 20 to 24 Years | 10 (100.0%) | 0 (0.0%) |
| 25 to 29 Years | 16 (72.7%) | 0 (0.0%) |
| 30 to 34 Years | 13 (92.9%) | 0 (0.0%) |
| 35 to 44 Years | 47 (95.9%) | 0 (0.0%) |
| 45 to 54 Years | 35 (97.2%) | 0 (0.0%) |
| 55 to 59 Years | 8 (100.0%) | 0 (0.0%) |
| 60 to 64 Years | 7 (100.0%) | 0 (0.0%) |
| 65 to 74 Years | 20 (71.4%) | 0 (0.0%) |
| 75 Years and over | 0 (0.0%) | 0 (0.0%) |
| Total | 178 (81.3%) | 0 (0.0%) |
Employment Status by Educational Attainment in Halliday
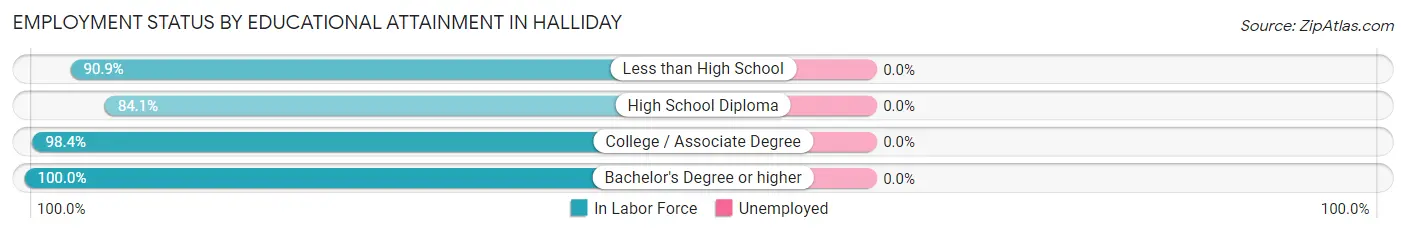
| Educational Attainment | In Labor Force | Unemployed |
| Less than High School | 20 (90.9%) | 0 (0.0%) |
| High School Diploma | 37 (84.1%) | 0 (0.0%) |
| College / Associate Degree | 61 (98.4%) | 0 (0.0%) |
| Bachelor's Degree or higher | 8 (100.0%) | 0 (0.0%) |
| Total | 126 (92.6%) | 0 (0.0%) |
Employment Occupations by Sex in Halliday
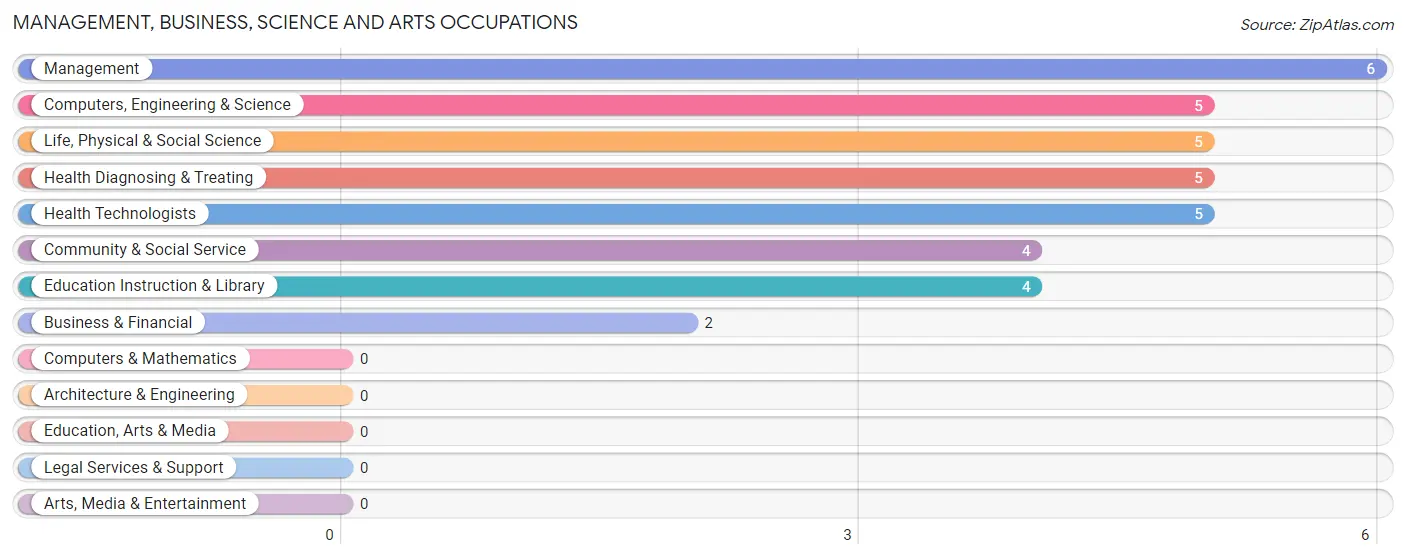
Management, Business, Science and Arts Occupations
The most common Management, Business, Science and Arts occupations in Halliday are Management (6 | 3.4%), Computers, Engineering & Science (5 | 2.8%), Life, Physical & Social Science (5 | 2.8%), Health Diagnosing & Treating (5 | 2.8%), and Health Technologists (5 | 2.8%).
Management, Business, Science and Arts Occupations by Sex
Within the Management, Business, Science and Arts occupations in Halliday, the most male-oriented occupations are Management (66.7%), Computers, Engineering & Science (60.0%), and Life, Physical & Social Science (60.0%), while the most female-oriented occupations are Business & Financial (100.0%), Health Diagnosing & Treating (100.0%), and Health Technologists (100.0%).
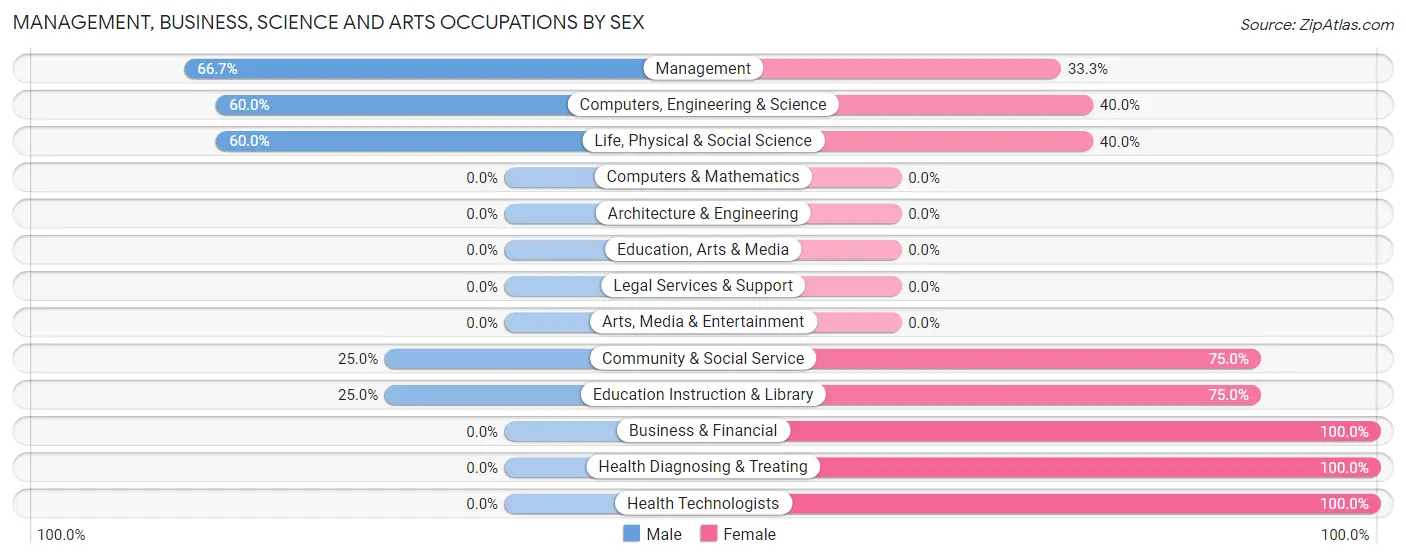
| Occupation | Male | Female |
| Management | 4 (66.7%) | 2 (33.3%) |
| Business & Financial | 0 (0.0%) | 2 (100.0%) |
| Computers, Engineering & Science | 3 (60.0%) | 2 (40.0%) |
| Computers & Mathematics | 0 (0.0%) | 0 (0.0%) |
| Architecture & Engineering | 0 (0.0%) | 0 (0.0%) |
| Life, Physical & Social Science | 3 (60.0%) | 2 (40.0%) |
| Community & Social Service | 1 (25.0%) | 3 (75.0%) |
| Education, Arts & Media | 0 (0.0%) | 0 (0.0%) |
| Legal Services & Support | 0 (0.0%) | 0 (0.0%) |
| Education Instruction & Library | 1 (25.0%) | 3 (75.0%) |
| Arts, Media & Entertainment | 0 (0.0%) | 0 (0.0%) |
| Health Diagnosing & Treating | 0 (0.0%) | 5 (100.0%) |
| Health Technologists | 0 (0.0%) | 5 (100.0%) |
| Total (Category) | 8 (36.4%) | 14 (63.6%) |
| Total (Overall) | 116 (65.2%) | 62 (34.8%) |
Services Occupations
The most common Services occupations in Halliday are Food Preparation & Serving (16 | 9.0%), Cleaning & Maintenance (9 | 5.1%), Personal Care & Service (5 | 2.8%), and Healthcare Support (1 | 0.6%).
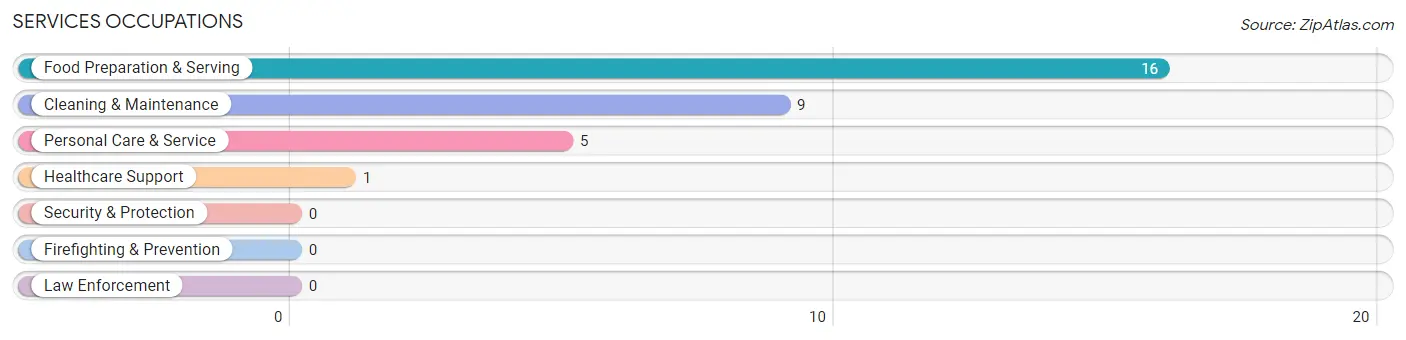
Services Occupations by Sex
Within the Services occupations in Halliday, the most male-oriented occupations are Cleaning & Maintenance (100.0%), Personal Care & Service (40.0%), and Food Preparation & Serving (25.0%), while the most female-oriented occupations are Healthcare Support (100.0%), Food Preparation & Serving (75.0%), and Personal Care & Service (60.0%).
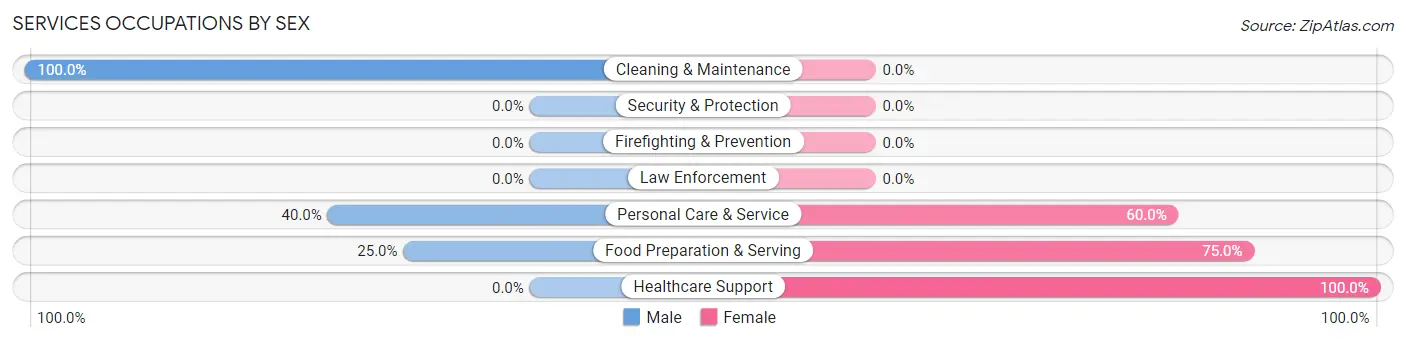
| Occupation | Male | Female |
| Healthcare Support | 0 (0.0%) | 1 (100.0%) |
| Security & Protection | 0 (0.0%) | 0 (0.0%) |
| Firefighting & Prevention | 0 (0.0%) | 0 (0.0%) |
| Law Enforcement | 0 (0.0%) | 0 (0.0%) |
| Food Preparation & Serving | 4 (25.0%) | 12 (75.0%) |
| Cleaning & Maintenance | 9 (100.0%) | 0 (0.0%) |
| Personal Care & Service | 2 (40.0%) | 3 (60.0%) |
| Total (Category) | 15 (48.4%) | 16 (51.6%) |
| Total (Overall) | 116 (65.2%) | 62 (34.8%) |
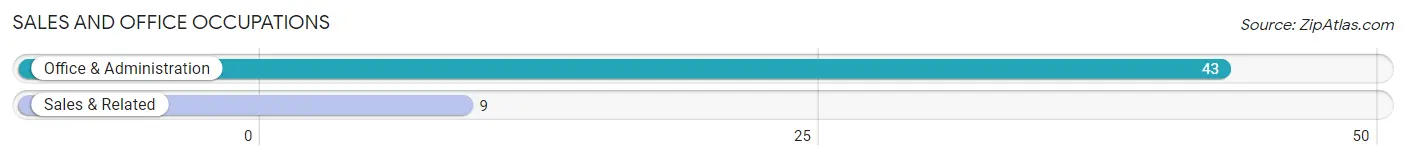
Sales and Office Occupations
The most common Sales and Office occupations in Halliday are Office & Administration (43 | 24.2%), and Sales & Related (9 | 5.1%).
Sales and Office Occupations by Sex
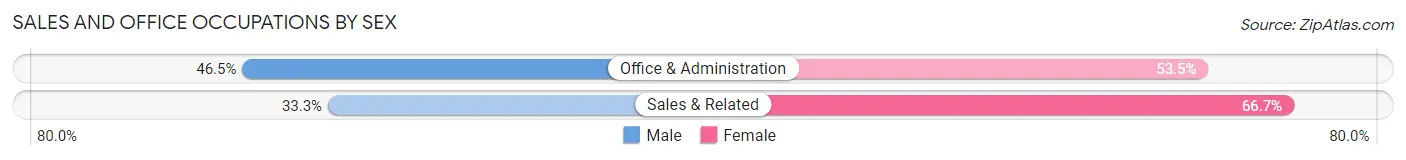
| Occupation | Male | Female |
| Sales & Related | 3 (33.3%) | 6 (66.7%) |
| Office & Administration | 20 (46.5%) | 23 (53.5%) |
| Total (Category) | 23 (44.2%) | 29 (55.8%) |
| Total (Overall) | 116 (65.2%) | 62 (34.8%) |
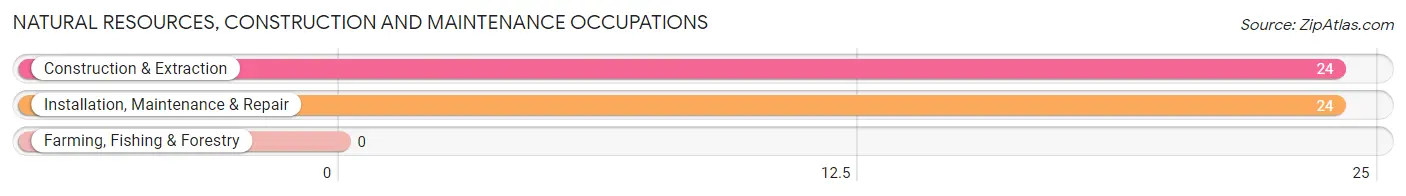
Natural Resources, Construction and Maintenance Occupations
The most common Natural Resources, Construction and Maintenance occupations in Halliday are Construction & Extraction (24 | 13.5%), and Installation, Maintenance & Repair (24 | 13.5%).
Natural Resources, Construction and Maintenance Occupations by Sex
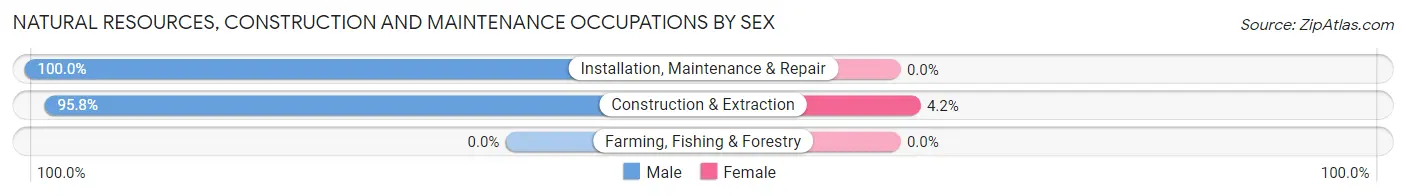
| Occupation | Male | Female |
| Farming, Fishing & Forestry | 0 (0.0%) | 0 (0.0%) |
| Construction & Extraction | 23 (95.8%) | 1 (4.2%) |
| Installation, Maintenance & Repair | 24 (100.0%) | 0 (0.0%) |
| Total (Category) | 47 (97.9%) | 1 (2.1%) |
| Total (Overall) | 116 (65.2%) | 62 (34.8%) |
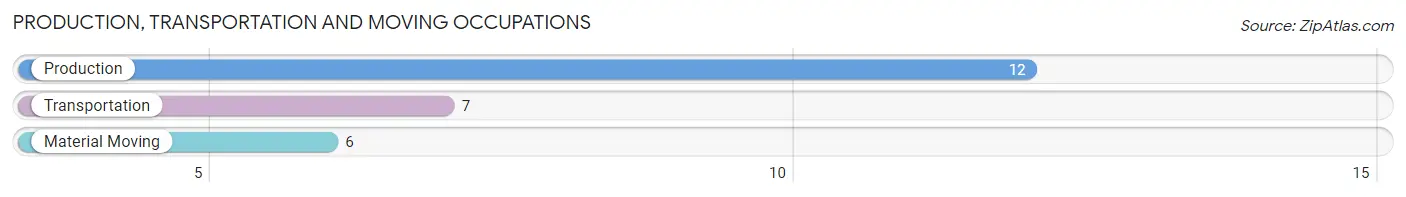
Production, Transportation and Moving Occupations
The most common Production, Transportation and Moving occupations in Halliday are Production (12 | 6.7%), Transportation (7 | 3.9%), and Material Moving (6 | 3.4%).
Production, Transportation and Moving Occupations by Sex
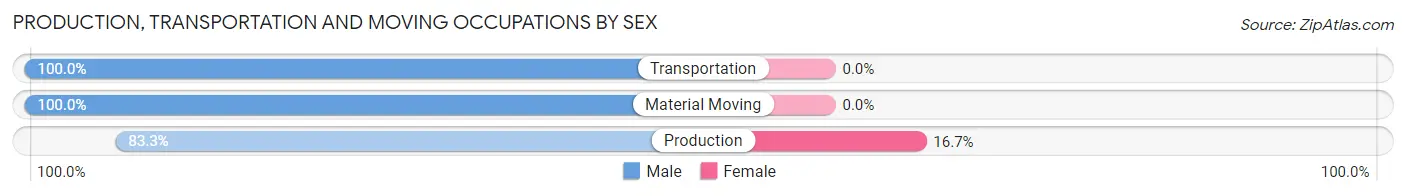
| Occupation | Male | Female |
| Production | 10 (83.3%) | 2 (16.7%) |
| Transportation | 7 (100.0%) | 0 (0.0%) |
| Material Moving | 6 (100.0%) | 0 (0.0%) |
| Total (Category) | 23 (92.0%) | 2 (8.0%) |
| Total (Overall) | 116 (65.2%) | 62 (34.8%) |
Employment Industries by Sex in Halliday
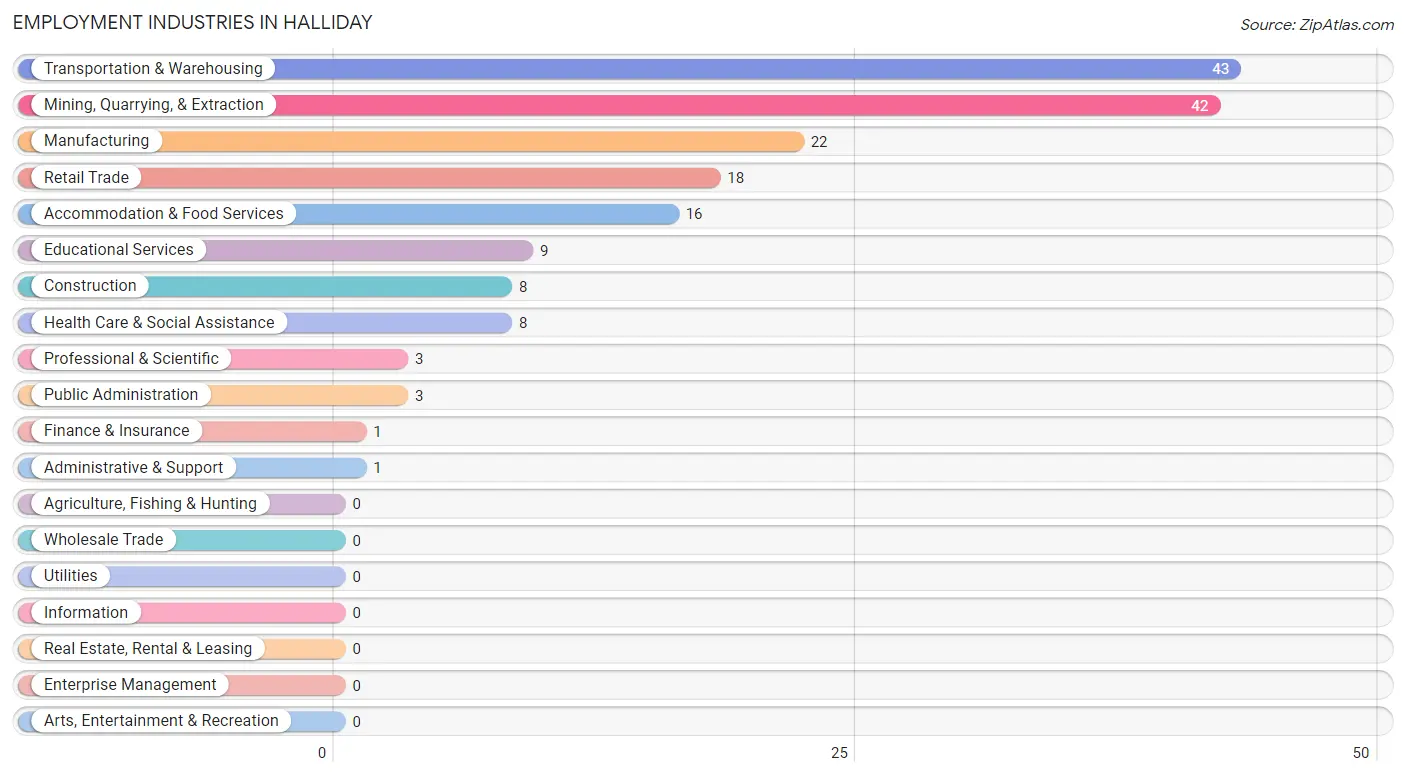
Employment Industries in Halliday
The major employment industries in Halliday include Transportation & Warehousing (43 | 24.2%), Mining, Quarrying, & Extraction (42 | 23.6%), Manufacturing (22 | 12.4%), Retail Trade (18 | 10.1%), and Accommodation & Food Services (16 | 9.0%).
Employment Industries by Sex in Halliday
The Halliday industries that see more men than women are Transportation & Warehousing (100.0%), Mining, Quarrying, & Extraction (97.6%), and Construction (75.0%), whereas the industries that tend to have a higher number of women are Manufacturing (100.0%), Finance & Insurance (100.0%), and Professional & Scientific (100.0%).
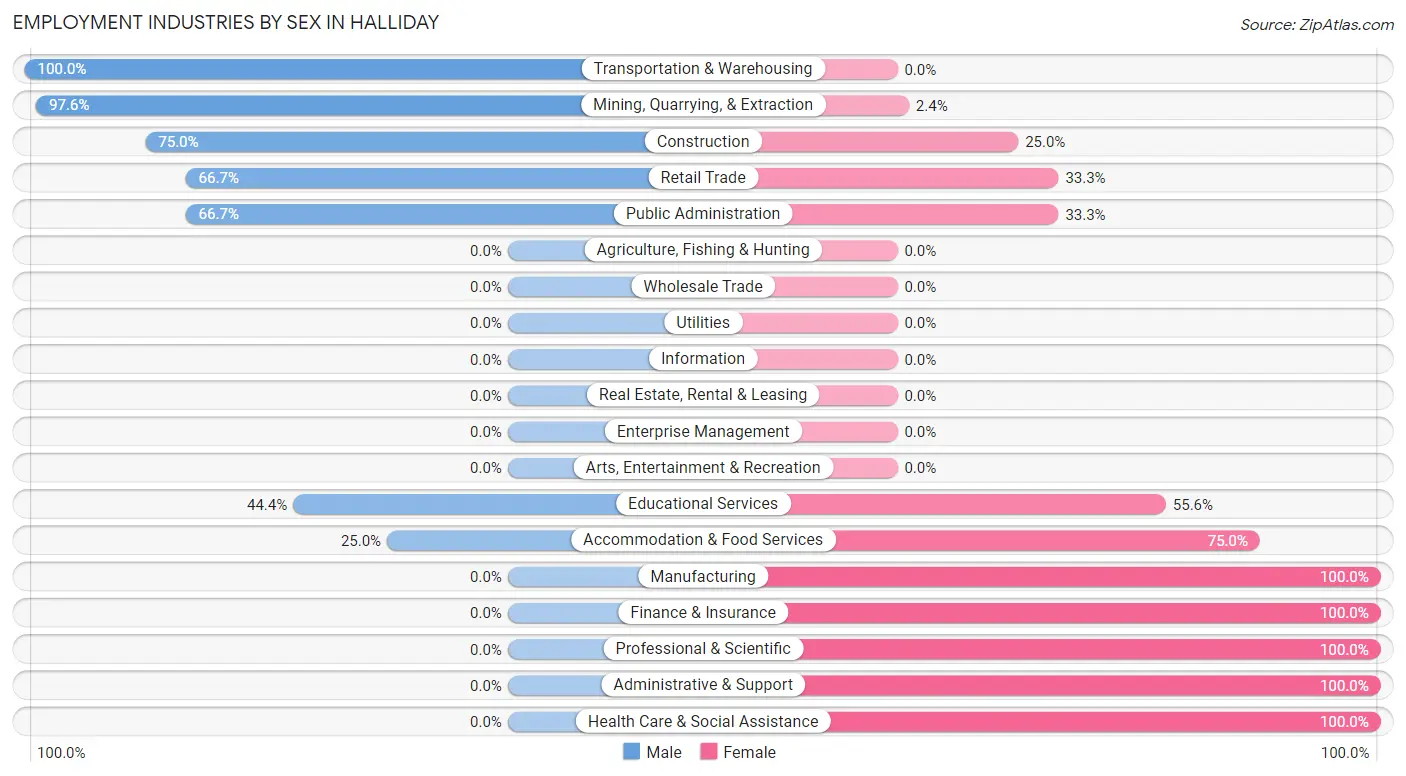
| Industry | Male | Female |
| Agriculture, Fishing & Hunting | 0 (0.0%) | 0 (0.0%) |
| Mining, Quarrying, & Extraction | 41 (97.6%) | 1 (2.4%) |
| Construction | 6 (75.0%) | 2 (25.0%) |
| Manufacturing | 0 (0.0%) | 22 (100.0%) |
| Wholesale Trade | 0 (0.0%) | 0 (0.0%) |
| Retail Trade | 12 (66.7%) | 6 (33.3%) |
| Transportation & Warehousing | 43 (100.0%) | 0 (0.0%) |
| Utilities | 0 (0.0%) | 0 (0.0%) |
| Information | 0 (0.0%) | 0 (0.0%) |
| Finance & Insurance | 0 (0.0%) | 1 (100.0%) |
| Real Estate, Rental & Leasing | 0 (0.0%) | 0 (0.0%) |
| Professional & Scientific | 0 (0.0%) | 3 (100.0%) |
| Enterprise Management | 0 (0.0%) | 0 (0.0%) |
| Administrative & Support | 0 (0.0%) | 1 (100.0%) |
| Educational Services | 4 (44.4%) | 5 (55.6%) |
| Health Care & Social Assistance | 0 (0.0%) | 8 (100.0%) |
| Arts, Entertainment & Recreation | 0 (0.0%) | 0 (0.0%) |
| Accommodation & Food Services | 4 (25.0%) | 12 (75.0%) |
| Public Administration | 2 (66.7%) | 1 (33.3%) |
| Total | 116 (65.2%) | 62 (34.8%) |
Education in Halliday
School Enrollment in Halliday
The most common levels of schooling among the 55 students in Halliday are elementary school (16 | 29.1%), high school (16 | 29.1%), and middle school (13 | 23.6%).
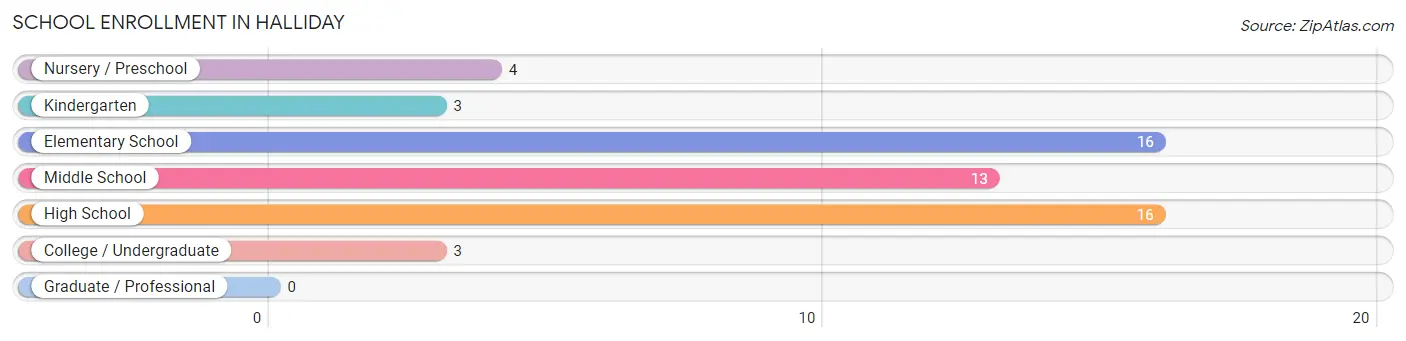
| School Level | # Students | % Students |
| Nursery / Preschool | 4 | 7.3% |
| Kindergarten | 3 | 5.4% |
| Elementary School | 16 | 29.1% |
| Middle School | 13 | 23.6% |
| High School | 16 | 29.1% |
| College / Undergraduate | 3 | 5.4% |
| Graduate / Professional | 0 | 0.0% |
| Total | 55 | 100.0% |
School Enrollment by Age by Funding Source in Halliday
Out of a total of 55 students who are enrolled in schools in Halliday, 4 (7.3%) attend a private institution, while the remaining 51 (92.7%) are enrolled in public schools. The age group of 3 to 4 year olds has the highest likelihood of being enrolled in private schools, with 2 (40.0% in the age bracket) enrolled. Conversely, the age group of 10 to 14 year olds has the lowest likelihood of being enrolled in a private school, with 13 (100.0% in the age bracket) attending a public institution.
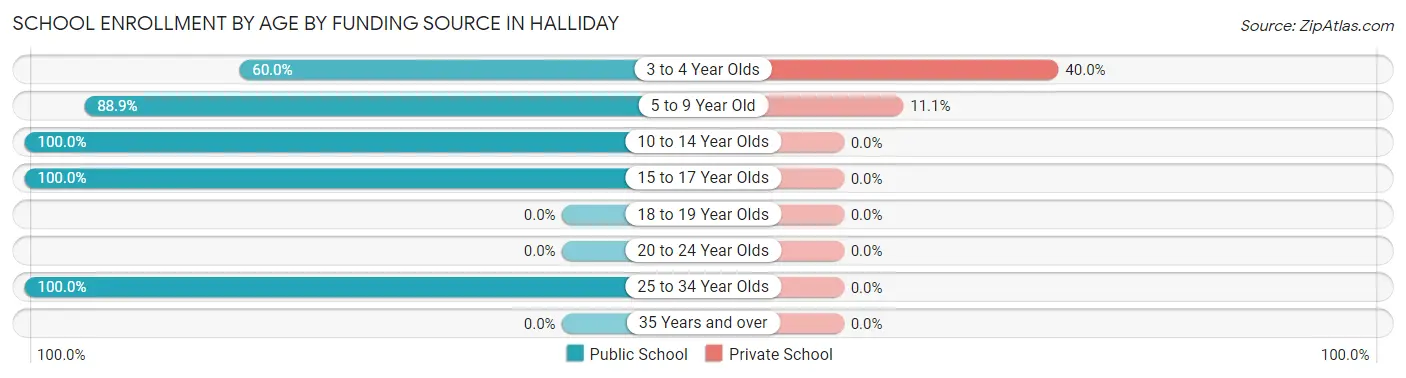
| Age Bracket | Public School | Private School |
| 3 to 4 Year Olds | 3 (60.0%) | 2 (40.0%) |
| 5 to 9 Year Old | 16 (88.9%) | 2 (11.1%) |
| 10 to 14 Year Olds | 13 (100.0%) | 0 (0.0%) |
| 15 to 17 Year Olds | 16 (100.0%) | 0 (0.0%) |
| 18 to 19 Year Olds | 0 (0.0%) | 0 (0.0%) |
| 20 to 24 Year Olds | 0 (0.0%) | 0 (0.0%) |
| 25 to 34 Year Olds | 3 (100.0%) | 0 (0.0%) |
| 35 Years and over | 0 (0.0%) | 0 (0.0%) |
| Total | 51 (92.7%) | 4 (7.3%) |
Educational Attainment by Field of Study in Halliday
Science & technology (4 | 33.3%), social sciences (3 | 25.0%), business (2 | 16.7%), literature & languages (2 | 16.7%), and bio, nature & agricultural (1 | 8.3%) are the most common fields of study among 12 individuals in Halliday who have obtained a bachelor's degree or higher.
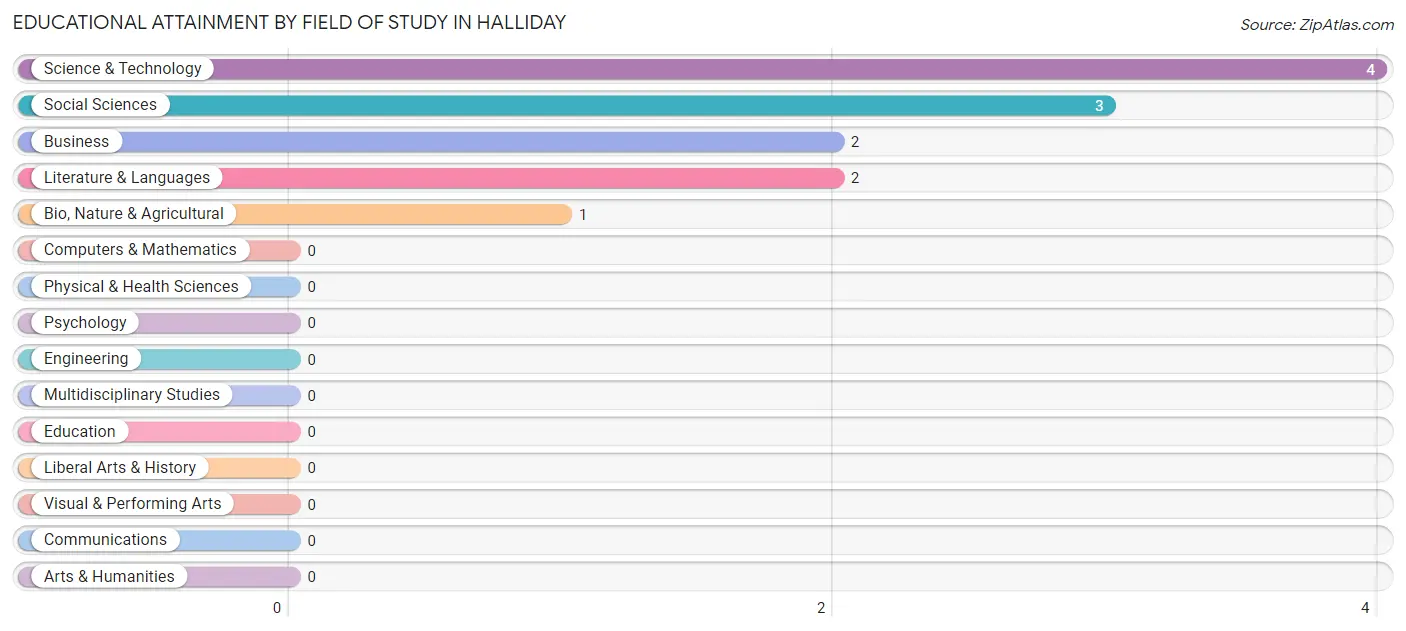
| Field of Study | # Graduates | % Graduates |
| Computers & Mathematics | 0 | 0.0% |
| Bio, Nature & Agricultural | 1 | 8.3% |
| Physical & Health Sciences | 0 | 0.0% |
| Psychology | 0 | 0.0% |
| Social Sciences | 3 | 25.0% |
| Engineering | 0 | 0.0% |
| Multidisciplinary Studies | 0 | 0.0% |
| Science & Technology | 4 | 33.3% |
| Business | 2 | 16.7% |
| Education | 0 | 0.0% |
| Literature & Languages | 2 | 16.7% |
| Liberal Arts & History | 0 | 0.0% |
| Visual & Performing Arts | 0 | 0.0% |
| Communications | 0 | 0.0% |
| Arts & Humanities | 0 | 0.0% |
| Total | 12 | 100.0% |
Transportation & Commute in Halliday
Vehicle Availability by Sex in Halliday
The most prevalent vehicle ownership categories in Halliday are males with 3 vehicles (47, accounting for 40.5%) and females with 3 vehicles (22, making up 75.8%).
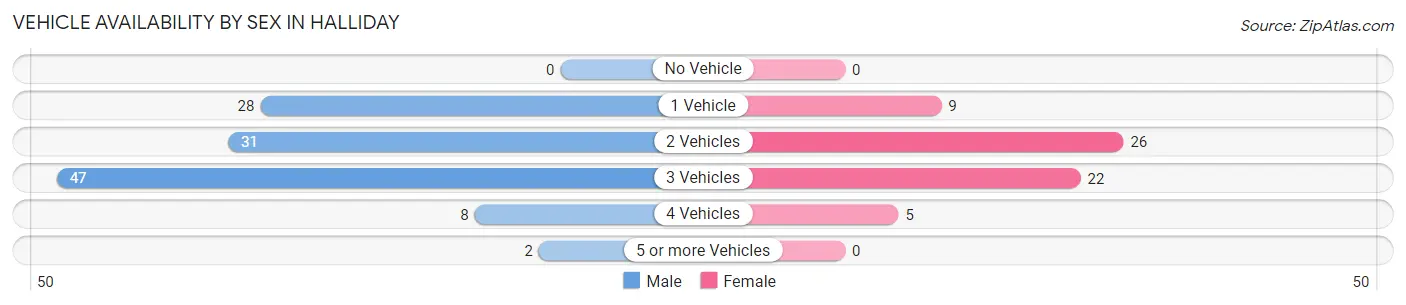
| Vehicles Available | Male | Female |
| No Vehicle | 0 (0.0%) | 0 (0.0%) |
| 1 Vehicle | 28 (24.1%) | 9 (14.5%) |
| 2 Vehicles | 31 (26.7%) | 26 (41.9%) |
| 3 Vehicles | 47 (40.5%) | 22 (35.5%) |
| 4 Vehicles | 8 (6.9%) | 5 (8.1%) |
| 5 or more Vehicles | 2 (1.7%) | 0 (0.0%) |
| Total | 116 (100.0%) | 62 (100.0%) |
Commute Time in Halliday
The most frequently occuring commute durations in Halliday are 25 to 29 minutes (47 commuters, 27.0%), 20 to 24 minutes (40 commuters, 23.0%), and 60 to 89 minutes (29 commuters, 16.7%).
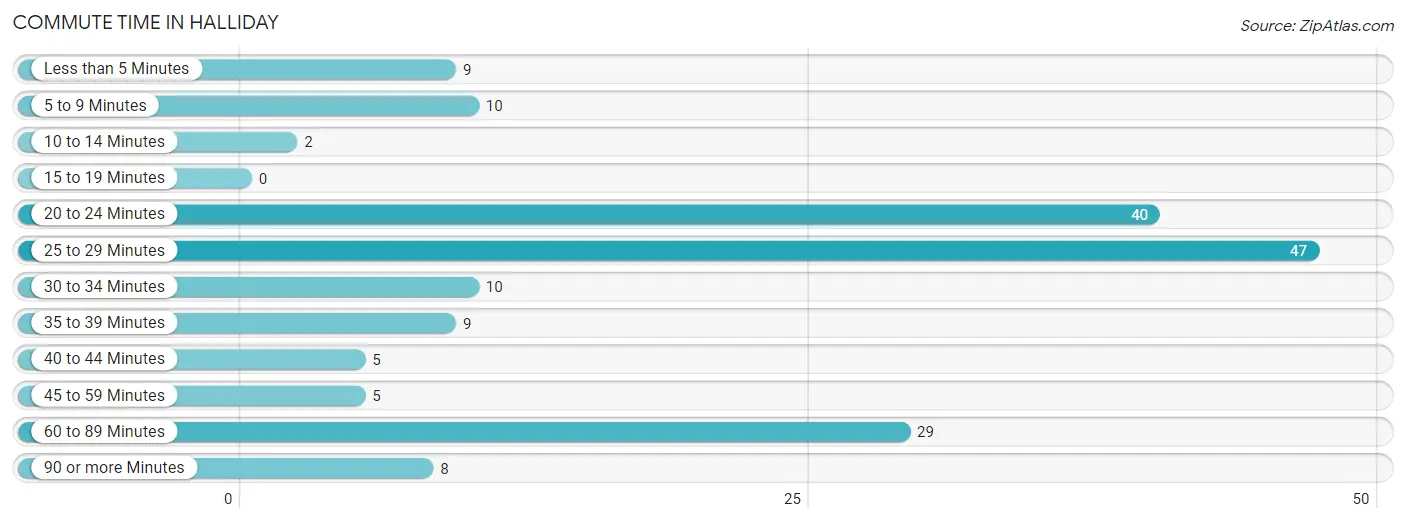
| Commute Time | # Commuters | % Commuters |
| Less than 5 Minutes | 9 | 5.2% |
| 5 to 9 Minutes | 10 | 5.8% |
| 10 to 14 Minutes | 2 | 1.1% |
| 15 to 19 Minutes | 0 | 0.0% |
| 20 to 24 Minutes | 40 | 23.0% |
| 25 to 29 Minutes | 47 | 27.0% |
| 30 to 34 Minutes | 10 | 5.8% |
| 35 to 39 Minutes | 9 | 5.2% |
| 40 to 44 Minutes | 5 | 2.9% |
| 45 to 59 Minutes | 5 | 2.9% |
| 60 to 89 Minutes | 29 | 16.7% |
| 90 or more Minutes | 8 | 4.6% |
Commute Time by Sex in Halliday
The most common commute times in Halliday are 20 to 24 minutes (39 commuters, 34.2%) for males and 25 to 29 minutes (25 commuters, 41.7%) for females.
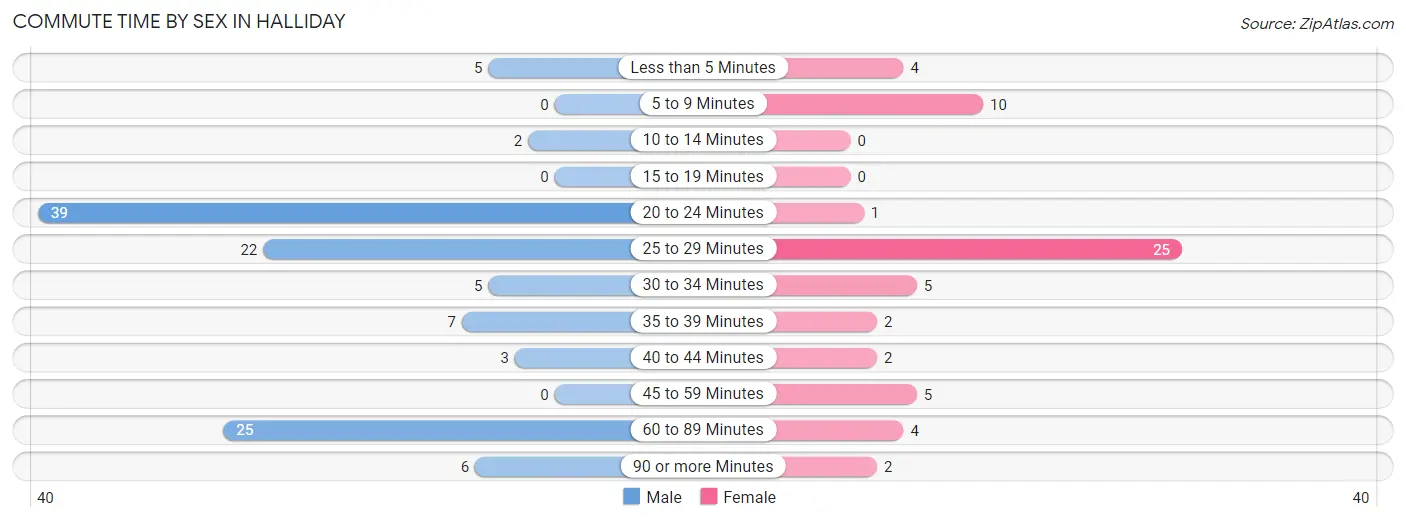
| Commute Time | Male | Female |
| Less than 5 Minutes | 5 (4.4%) | 4 (6.7%) |
| 5 to 9 Minutes | 0 (0.0%) | 10 (16.7%) |
| 10 to 14 Minutes | 2 (1.8%) | 0 (0.0%) |
| 15 to 19 Minutes | 0 (0.0%) | 0 (0.0%) |
| 20 to 24 Minutes | 39 (34.2%) | 1 (1.7%) |
| 25 to 29 Minutes | 22 (19.3%) | 25 (41.7%) |
| 30 to 34 Minutes | 5 (4.4%) | 5 (8.3%) |
| 35 to 39 Minutes | 7 (6.1%) | 2 (3.3%) |
| 40 to 44 Minutes | 3 (2.6%) | 2 (3.3%) |
| 45 to 59 Minutes | 0 (0.0%) | 5 (8.3%) |
| 60 to 89 Minutes | 25 (21.9%) | 4 (6.7%) |
| 90 or more Minutes | 6 (5.3%) | 2 (3.3%) |
Time of Departure to Work by Sex in Halliday
The most frequent times of departure to work in Halliday are 5:30 AM to 5:59 AM (33, 28.9%) for males and 7:30 AM to 7:59 AM (23, 38.3%) for females.
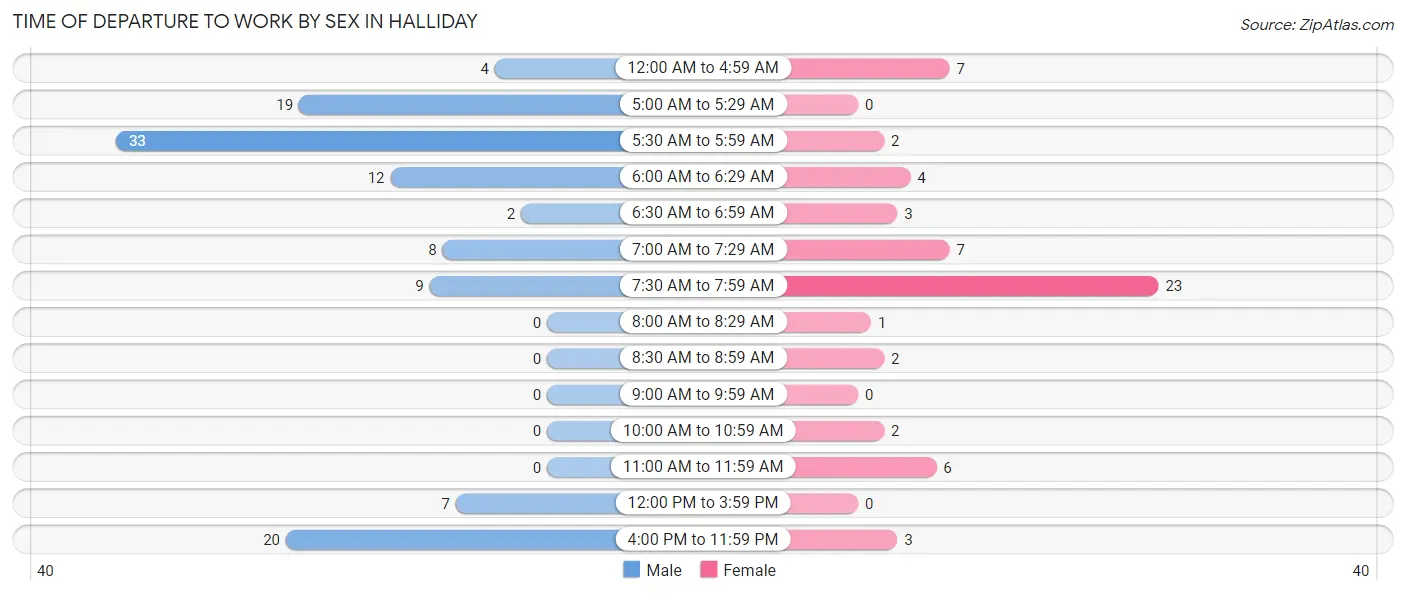
| Time of Departure | Male | Female |
| 12:00 AM to 4:59 AM | 4 (3.5%) | 7 (11.7%) |
| 5:00 AM to 5:29 AM | 19 (16.7%) | 0 (0.0%) |
| 5:30 AM to 5:59 AM | 33 (28.9%) | 2 (3.3%) |
| 6:00 AM to 6:29 AM | 12 (10.5%) | 4 (6.7%) |
| 6:30 AM to 6:59 AM | 2 (1.8%) | 3 (5.0%) |
| 7:00 AM to 7:29 AM | 8 (7.0%) | 7 (11.7%) |
| 7:30 AM to 7:59 AM | 9 (7.9%) | 23 (38.3%) |
| 8:00 AM to 8:29 AM | 0 (0.0%) | 1 (1.7%) |
| 8:30 AM to 8:59 AM | 0 (0.0%) | 2 (3.3%) |
| 9:00 AM to 9:59 AM | 0 (0.0%) | 0 (0.0%) |
| 10:00 AM to 10:59 AM | 0 (0.0%) | 2 (3.3%) |
| 11:00 AM to 11:59 AM | 0 (0.0%) | 6 (10.0%) |
| 12:00 PM to 3:59 PM | 7 (6.1%) | 0 (0.0%) |
| 4:00 PM to 11:59 PM | 20 (17.5%) | 3 (5.0%) |
| Total | 114 (100.0%) | 60 (100.0%) |
Housing Occupancy in Halliday
Occupancy by Ownership in Halliday
Of the total 128 dwellings in Halliday, owner-occupied units account for 97 (75.8%), while renter-occupied units make up 31 (24.2%).
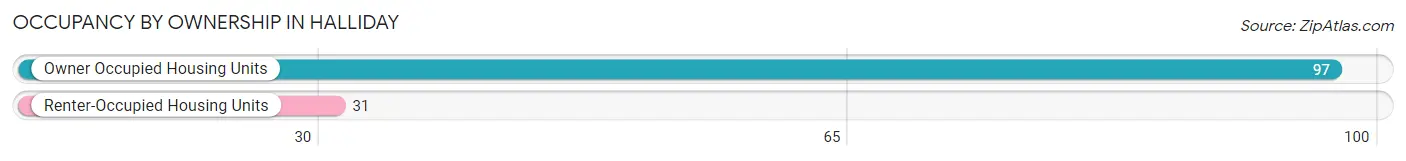
| Occupancy | # Housing Units | % Housing Units |
| Owner Occupied Housing Units | 97 | 75.8% |
| Renter-Occupied Housing Units | 31 | 24.2% |
| Total Occupied Housing Units | 128 | 100.0% |
Occupancy by Household Size in Halliday
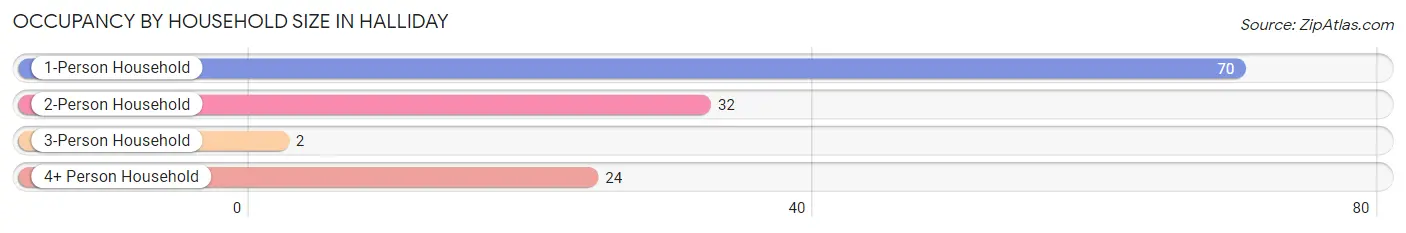
| Household Size | # Housing Units | % Housing Units |
| 1-Person Household | 70 | 54.7% |
| 2-Person Household | 32 | 25.0% |
| 3-Person Household | 2 | 1.6% |
| 4+ Person Household | 24 | 18.8% |
| Total Housing Units | 128 | 100.0% |
Occupancy by Ownership by Household Size in Halliday
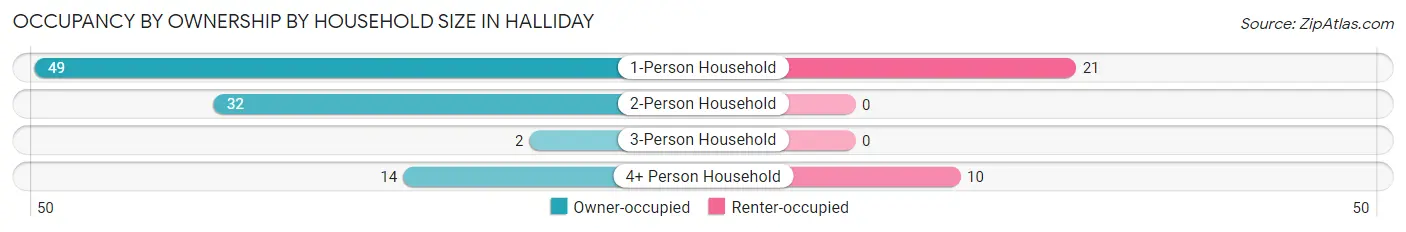
| Household Size | Owner-occupied | Renter-occupied |
| 1-Person Household | 49 (70.0%) | 21 (30.0%) |
| 2-Person Household | 32 (100.0%) | 0 (0.0%) |
| 3-Person Household | 2 (100.0%) | 0 (0.0%) |
| 4+ Person Household | 14 (58.3%) | 10 (41.7%) |
| Total Housing Units | 97 (75.8%) | 31 (24.2%) |
Occupancy by Educational Attainment in Halliday
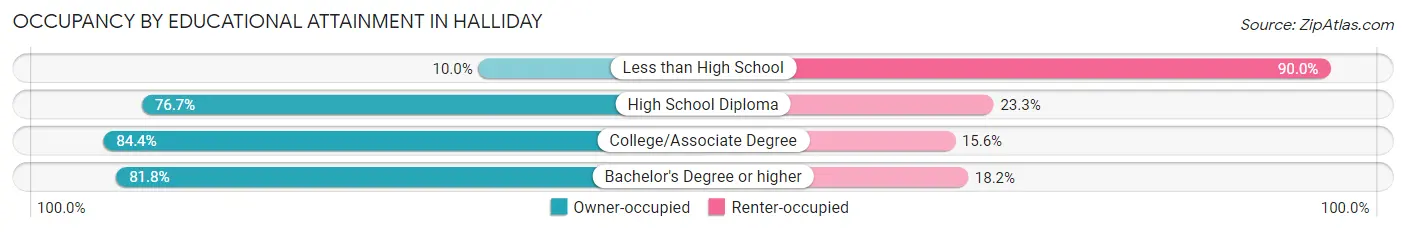
| Household Size | Owner-occupied | Renter-occupied |
| Less than High School | 1 (10.0%) | 9 (90.0%) |
| High School Diploma | 33 (76.7%) | 10 (23.3%) |
| College/Associate Degree | 54 (84.4%) | 10 (15.6%) |
| Bachelor's Degree or higher | 9 (81.8%) | 2 (18.2%) |
Occupancy by Age of Householder in Halliday
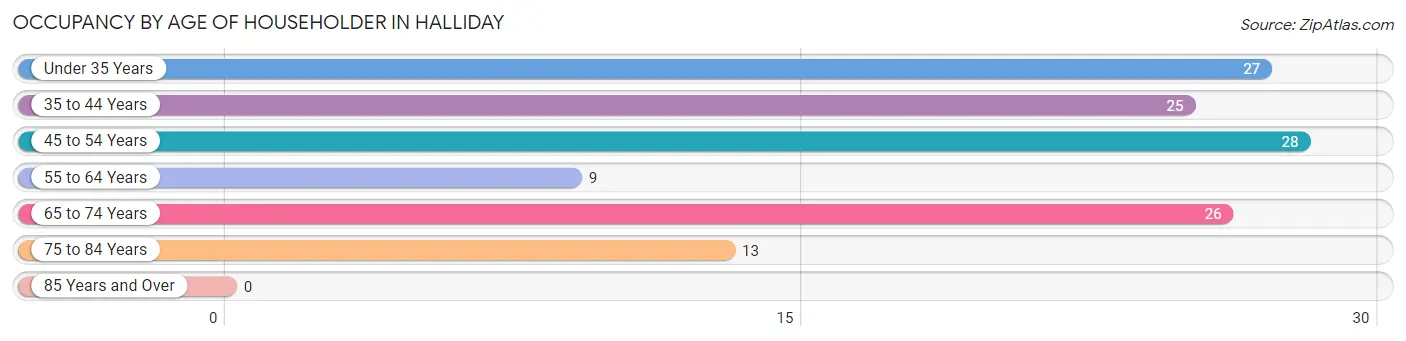
| Age Bracket | # Households | % Households |
| Under 35 Years | 27 | 21.1% |
| 35 to 44 Years | 25 | 19.5% |
| 45 to 54 Years | 28 | 21.9% |
| 55 to 64 Years | 9 | 7.0% |
| 65 to 74 Years | 26 | 20.3% |
| 75 to 84 Years | 13 | 10.2% |
| 85 Years and Over | 0 | 0.0% |
| Total | 128 | 100.0% |
Housing Finances in Halliday
Median Income by Occupancy in Halliday
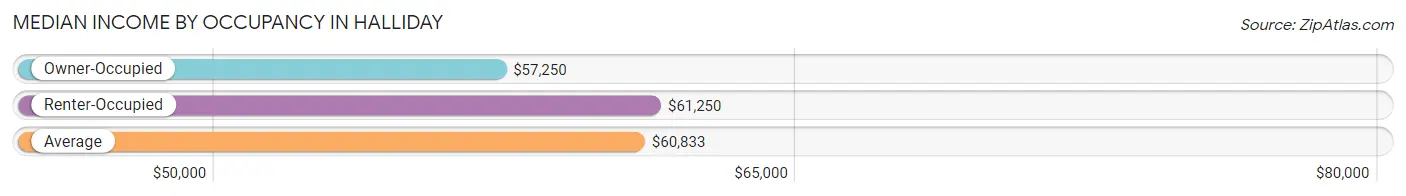
| Occupancy Type | # Households | Median Income |
| Owner-Occupied | 97 (75.8%) | $57,250 |
| Renter-Occupied | 31 (24.2%) | $61,250 |
| Average | 128 (100.0%) | $60,833 |
Occupancy by Householder Income Bracket in Halliday
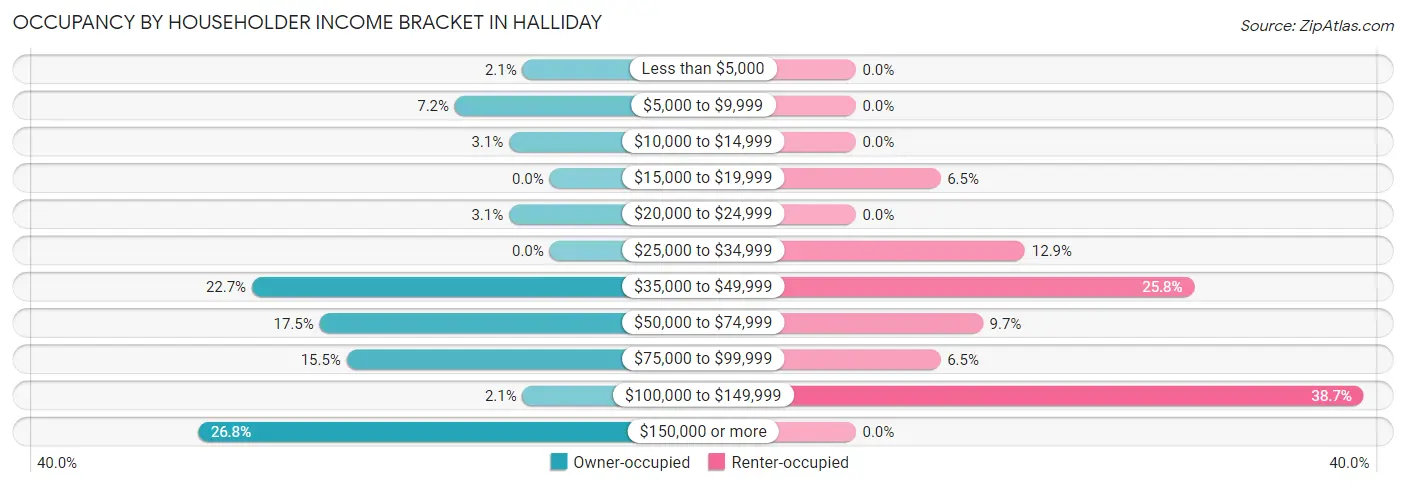
| Income Bracket | Owner-occupied | Renter-occupied |
| Less than $5,000 | 2 (2.1%) | 0 (0.0%) |
| $5,000 to $9,999 | 7 (7.2%) | 0 (0.0%) |
| $10,000 to $14,999 | 3 (3.1%) | 0 (0.0%) |
| $15,000 to $19,999 | 0 (0.0%) | 2 (6.5%) |
| $20,000 to $24,999 | 3 (3.1%) | 0 (0.0%) |
| $25,000 to $34,999 | 0 (0.0%) | 4 (12.9%) |
| $35,000 to $49,999 | 22 (22.7%) | 8 (25.8%) |
| $50,000 to $74,999 | 17 (17.5%) | 3 (9.7%) |
| $75,000 to $99,999 | 15 (15.5%) | 2 (6.5%) |
| $100,000 to $149,999 | 2 (2.1%) | 12 (38.7%) |
| $150,000 or more | 26 (26.8%) | 0 (0.0%) |
| Total | 97 (100.0%) | 31 (100.0%) |
Monthly Housing Cost Tiers in Halliday
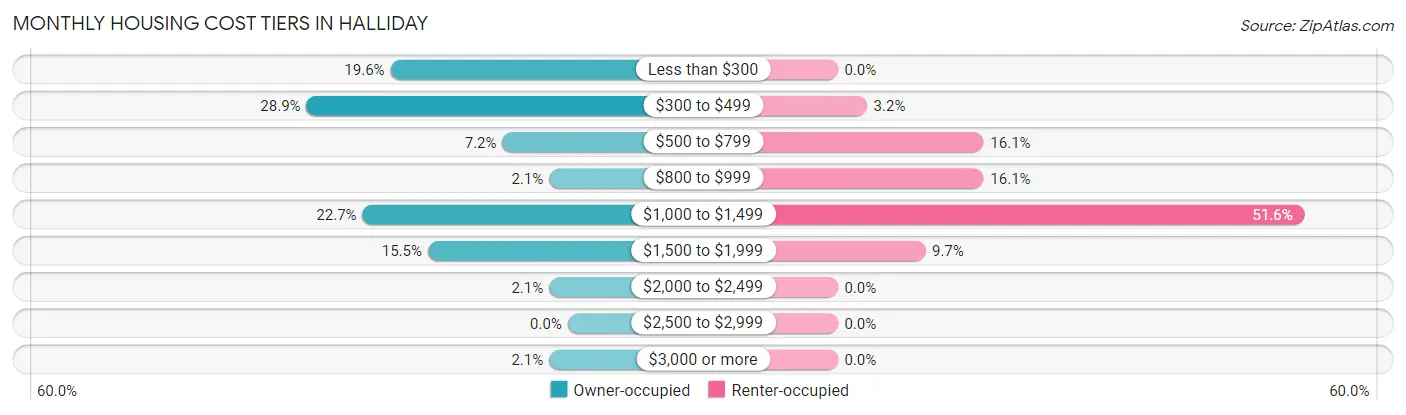
| Monthly Cost | Owner-occupied | Renter-occupied |
| Less than $300 | 19 (19.6%) | 0 (0.0%) |
| $300 to $499 | 28 (28.9%) | 1 (3.2%) |
| $500 to $799 | 7 (7.2%) | 5 (16.1%) |
| $800 to $999 | 2 (2.1%) | 5 (16.1%) |
| $1,000 to $1,499 | 22 (22.7%) | 16 (51.6%) |
| $1,500 to $1,999 | 15 (15.5%) | 3 (9.7%) |
| $2,000 to $2,499 | 2 (2.1%) | 0 (0.0%) |
| $2,500 to $2,999 | 0 (0.0%) | 0 (0.0%) |
| $3,000 or more | 2 (2.1%) | 0 (0.0%) |
| Total | 97 (100.0%) | 31 (100.0%) |
Physical Housing Characteristics in Halliday
Housing Structures in Halliday
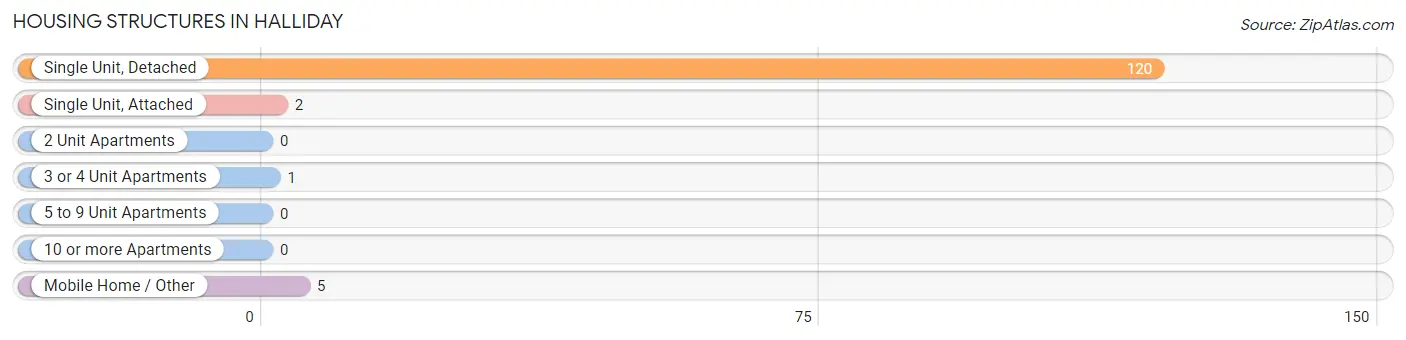
| Structure Type | # Housing Units | % Housing Units |
| Single Unit, Detached | 120 | 93.8% |
| Single Unit, Attached | 2 | 1.6% |
| 2 Unit Apartments | 0 | 0.0% |
| 3 or 4 Unit Apartments | 1 | 0.8% |
| 5 to 9 Unit Apartments | 0 | 0.0% |
| 10 or more Apartments | 0 | 0.0% |
| Mobile Home / Other | 5 | 3.9% |
| Total | 128 | 100.0% |
Housing Structures by Occupancy in Halliday

| Structure Type | Owner-occupied | Renter-occupied |
| Single Unit, Detached | 93 (77.5%) | 27 (22.5%) |
| Single Unit, Attached | 2 (100.0%) | 0 (0.0%) |
| 2 Unit Apartments | 0 (0.0%) | 0 (0.0%) |
| 3 or 4 Unit Apartments | 0 (0.0%) | 1 (100.0%) |
| 5 to 9 Unit Apartments | 0 (0.0%) | 0 (0.0%) |
| 10 or more Apartments | 0 (0.0%) | 0 (0.0%) |
| Mobile Home / Other | 2 (40.0%) | 3 (60.0%) |
| Total | 97 (75.8%) | 31 (24.2%) |
Housing Structures by Number of Rooms in Halliday
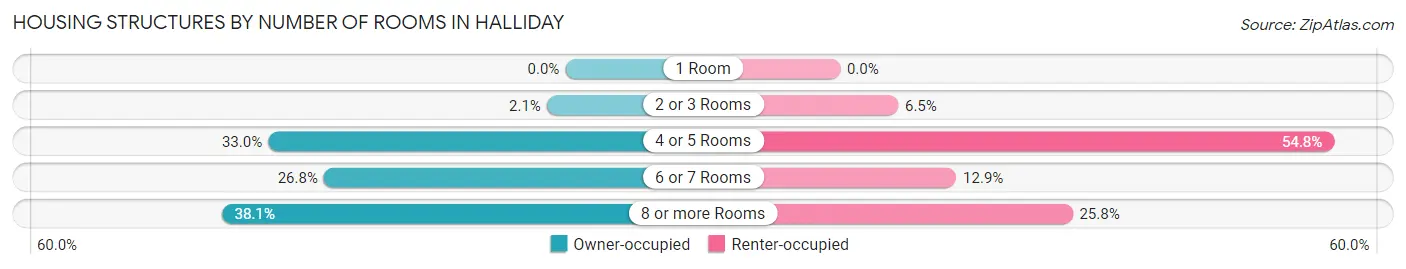
| Number of Rooms | Owner-occupied | Renter-occupied |
| 1 Room | 0 (0.0%) | 0 (0.0%) |
| 2 or 3 Rooms | 2 (2.1%) | 2 (6.5%) |
| 4 or 5 Rooms | 32 (33.0%) | 17 (54.8%) |
| 6 or 7 Rooms | 26 (26.8%) | 4 (12.9%) |
| 8 or more Rooms | 37 (38.1%) | 8 (25.8%) |
| Total | 97 (100.0%) | 31 (100.0%) |
Housing Structure by Heating Type in Halliday
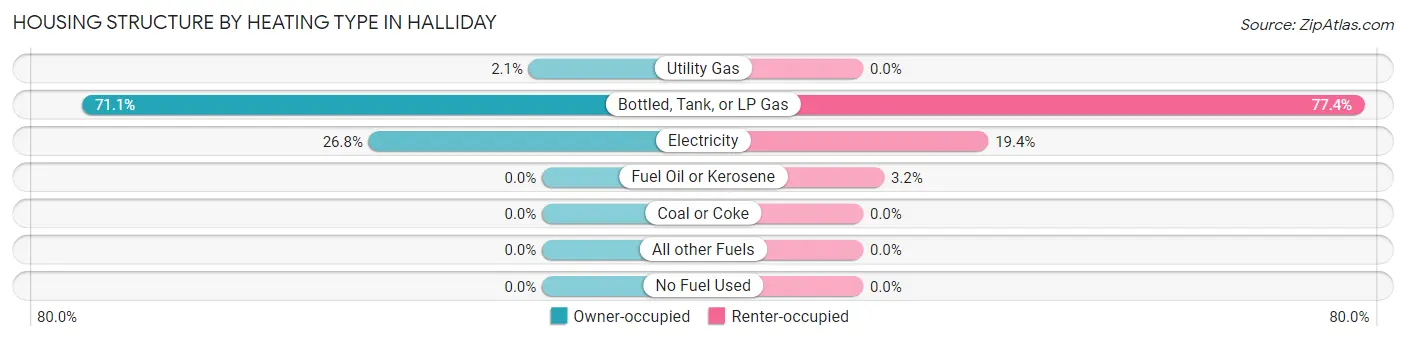
| Heating Type | Owner-occupied | Renter-occupied |
| Utility Gas | 2 (2.1%) | 0 (0.0%) |
| Bottled, Tank, or LP Gas | 69 (71.1%) | 24 (77.4%) |
| Electricity | 26 (26.8%) | 6 (19.4%) |
| Fuel Oil or Kerosene | 0 (0.0%) | 1 (3.2%) |
| Coal or Coke | 0 (0.0%) | 0 (0.0%) |
| All other Fuels | 0 (0.0%) | 0 (0.0%) |
| No Fuel Used | 0 (0.0%) | 0 (0.0%) |
| Total | 97 (100.0%) | 31 (100.0%) |
Household Vehicle Usage in Halliday
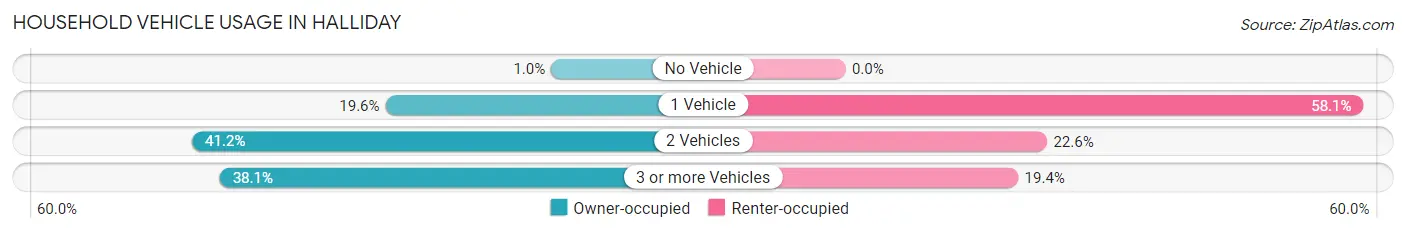
| Vehicles per Household | Owner-occupied | Renter-occupied |
| No Vehicle | 1 (1.0%) | 0 (0.0%) |
| 1 Vehicle | 19 (19.6%) | 18 (58.1%) |
| 2 Vehicles | 40 (41.2%) | 7 (22.6%) |
| 3 or more Vehicles | 37 (38.1%) | 6 (19.4%) |
| Total | 97 (100.0%) | 31 (100.0%) |
Real Estate & Mortgages in Halliday
Real Estate and Mortgage Overview in Halliday
| Characteristic | Without Mortgage | With Mortgage |
| Housing Units | 56 | 41 |
| Median Property Value | - | - |
| Median Household Income | $39,306 | $23 |
| Monthly Housing Costs | $388 | $0 |
| Real Estate Taxes | $389 | $0 |
Property Value by Mortgage Status in Halliday
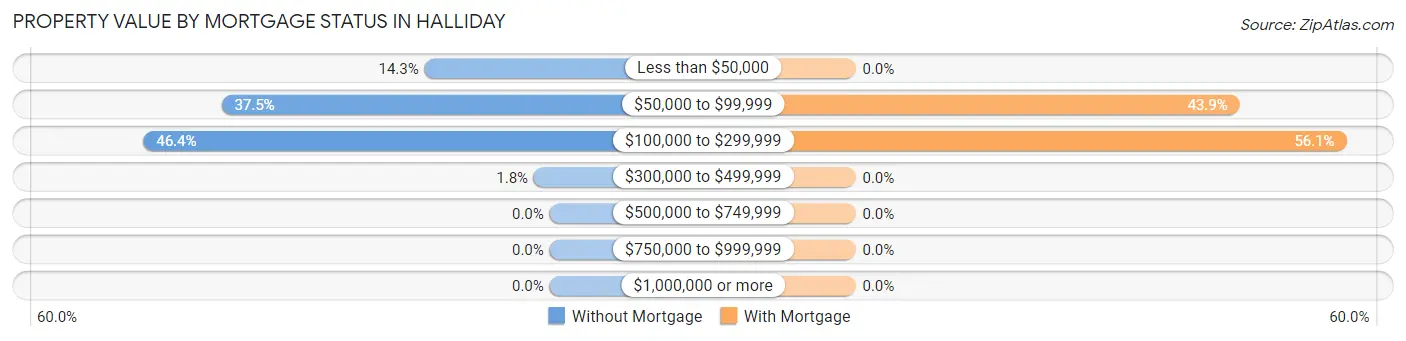
| Property Value | Without Mortgage | With Mortgage |
| Less than $50,000 | 8 (14.3%) | 0 (0.0%) |
| $50,000 to $99,999 | 21 (37.5%) | 18 (43.9%) |
| $100,000 to $299,999 | 26 (46.4%) | 23 (56.1%) |
| $300,000 to $499,999 | 1 (1.8%) | 0 (0.0%) |
| $500,000 to $749,999 | 0 (0.0%) | 0 (0.0%) |
| $750,000 to $999,999 | 0 (0.0%) | 0 (0.0%) |
| $1,000,000 or more | 0 (0.0%) | 0 (0.0%) |
| Total | 56 (100.0%) | 41 (100.0%) |
Household Income by Mortgage Status in Halliday
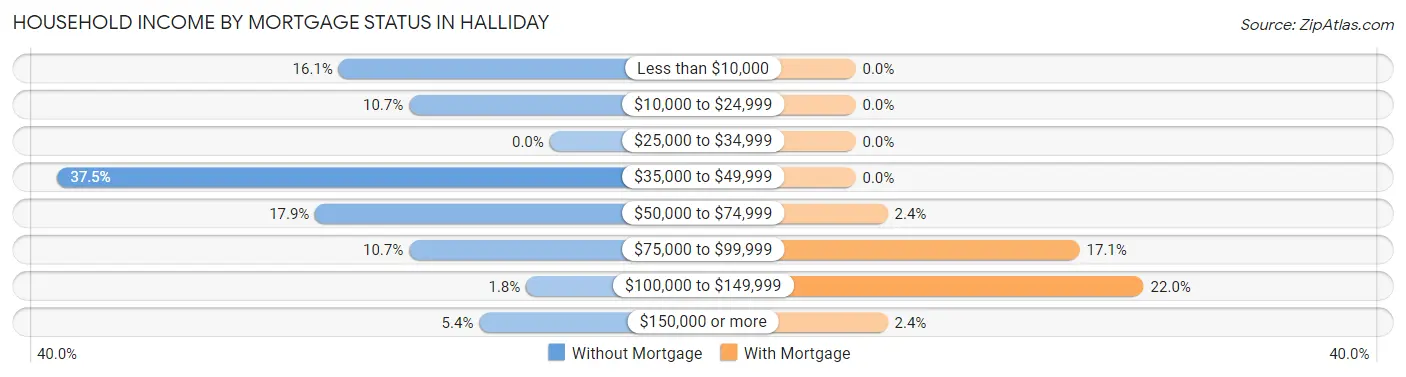
| Household Income | Without Mortgage | With Mortgage |
| Less than $10,000 | 9 (16.1%) | 0 (0.0%) |
| $10,000 to $24,999 | 6 (10.7%) | 0 (0.0%) |
| $25,000 to $34,999 | 0 (0.0%) | 0 (0.0%) |
| $35,000 to $49,999 | 21 (37.5%) | 0 (0.0%) |
| $50,000 to $74,999 | 10 (17.9%) | 1 (2.4%) |
| $75,000 to $99,999 | 6 (10.7%) | 7 (17.1%) |
| $100,000 to $149,999 | 1 (1.8%) | 9 (22.0%) |
| $150,000 or more | 3 (5.4%) | 1 (2.4%) |
| Total | 56 (100.0%) | 41 (100.0%) |
Property Value to Household Income Ratio in Halliday
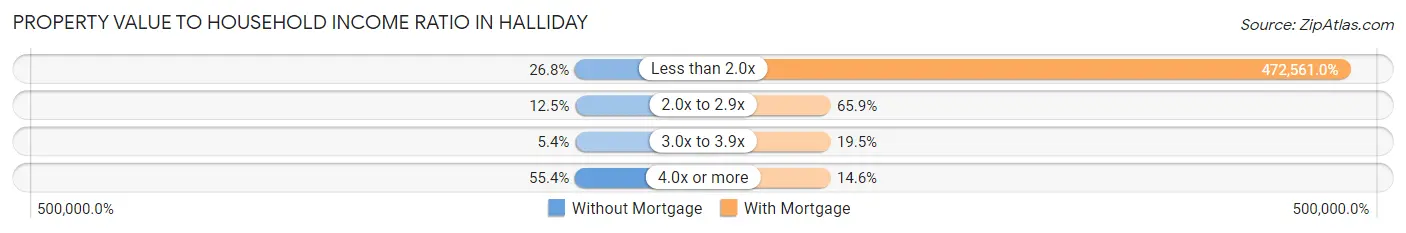
| Value-to-Income Ratio | Without Mortgage | With Mortgage |
| Less than 2.0x | 15 (26.8%) | 193,750 (472,561.0%) |
| 2.0x to 2.9x | 7 (12.5%) | 27 (65.8%) |
| 3.0x to 3.9x | 3 (5.4%) | 8 (19.5%) |
| 4.0x or more | 31 (55.4%) | 6 (14.6%) |
| Total | 56 (100.0%) | 41 (100.0%) |
Real Estate Taxes by Mortgage Status in Halliday
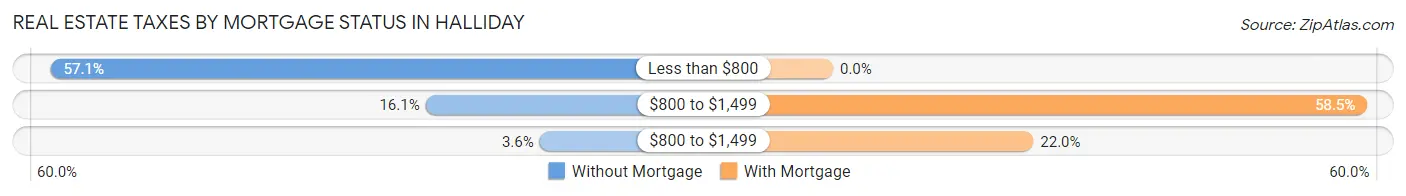
| Property Taxes | Without Mortgage | With Mortgage |
| Less than $800 | 32 (57.1%) | 0 (0.0%) |
| $800 to $1,499 | 9 (16.1%) | 24 (58.5%) |
| $800 to $1,499 | 2 (3.6%) | 9 (22.0%) |
| Total | 56 (100.0%) | 41 (100.0%) |
Health & Disability in Halliday
Health Insurance Coverage by Age in Halliday
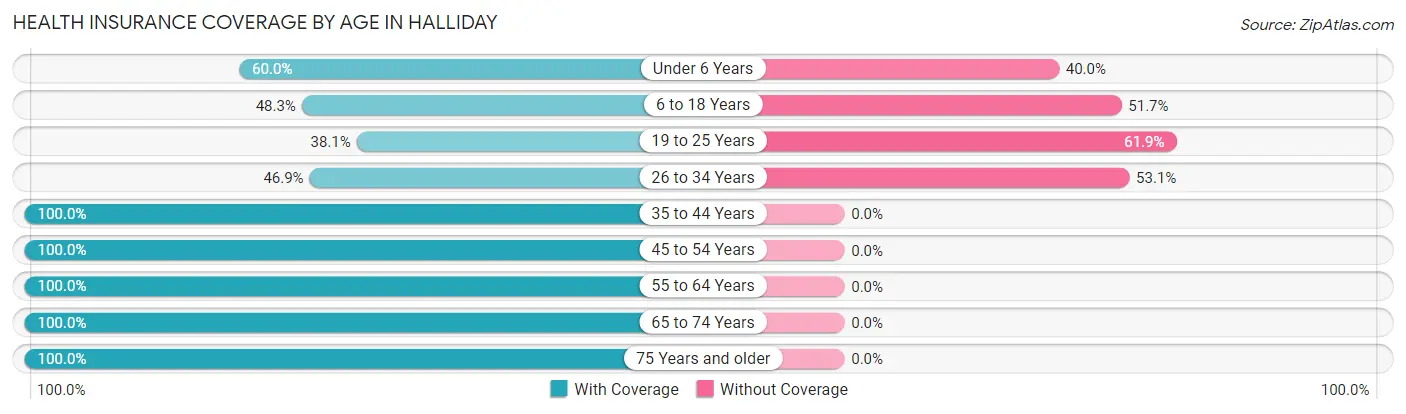
| Age Bracket | With Coverage | Without Coverage |
| Under 6 Years | 36 (60.0%) | 24 (40.0%) |
| 6 to 18 Years | 29 (48.3%) | 31 (51.7%) |
| 19 to 25 Years | 8 (38.1%) | 13 (61.9%) |
| 26 to 34 Years | 15 (46.9%) | 17 (53.1%) |
| 35 to 44 Years | 49 (100.0%) | 0 (0.0%) |
| 45 to 54 Years | 36 (100.0%) | 0 (0.0%) |
| 55 to 64 Years | 15 (100.0%) | 0 (0.0%) |
| 65 to 74 Years | 28 (100.0%) | 0 (0.0%) |
| 75 Years and older | 15 (100.0%) | 0 (0.0%) |
| Total | 231 (73.1%) | 85 (26.9%) |
Health Insurance Coverage by Citizenship Status in Halliday
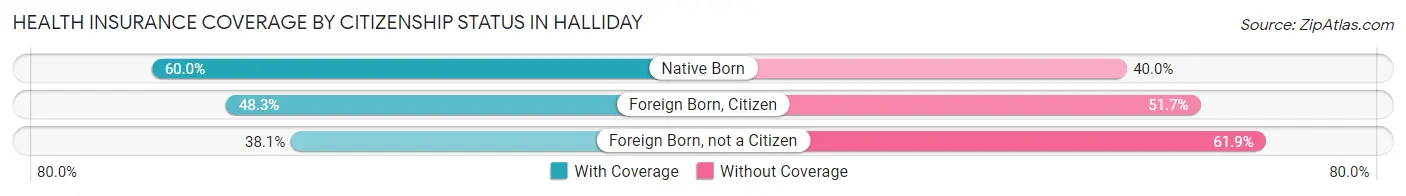
| Citizenship Status | With Coverage | Without Coverage |
| Native Born | 36 (60.0%) | 24 (40.0%) |
| Foreign Born, Citizen | 29 (48.3%) | 31 (51.7%) |
| Foreign Born, not a Citizen | 8 (38.1%) | 13 (61.9%) |
Health Insurance Coverage by Household Income in Halliday
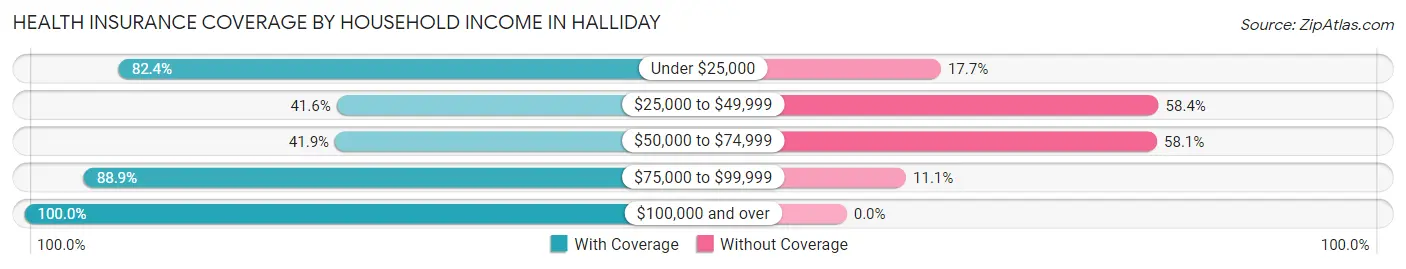
| Household Income | With Coverage | Without Coverage |
| Under $25,000 | 14 (82.4%) | 3 (17.6%) |
| $25,000 to $49,999 | 37 (41.6%) | 52 (58.4%) |
| $50,000 to $74,999 | 18 (41.9%) | 25 (58.1%) |
| $75,000 to $99,999 | 40 (88.9%) | 5 (11.1%) |
| $100,000 and over | 122 (100.0%) | 0 (0.0%) |
Public vs Private Health Insurance Coverage by Age in Halliday
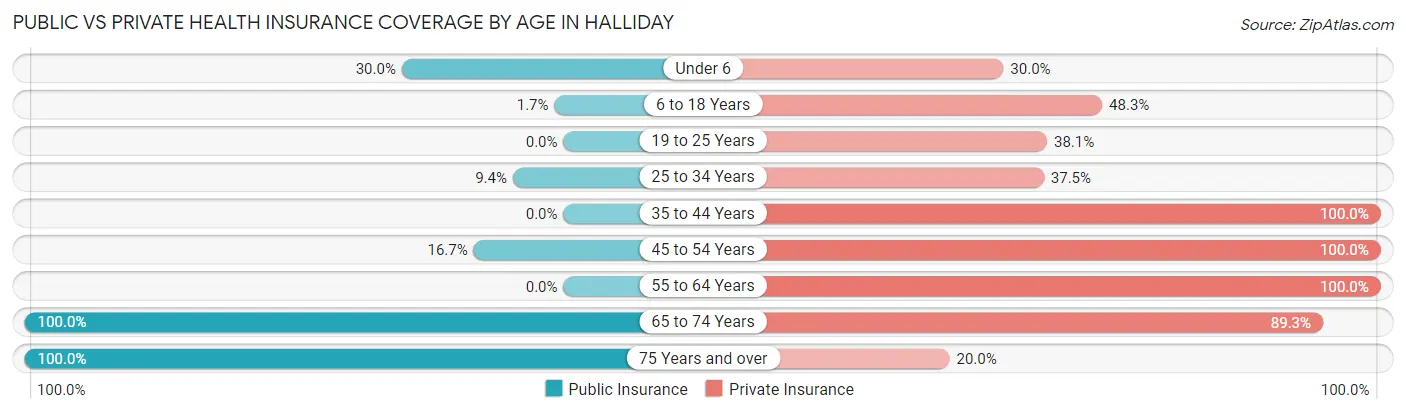
| Age Bracket | Public Insurance | Private Insurance |
| Under 6 | 18 (30.0%) | 18 (30.0%) |
| 6 to 18 Years | 1 (1.7%) | 29 (48.3%) |
| 19 to 25 Years | 0 (0.0%) | 8 (38.1%) |
| 25 to 34 Years | 3 (9.4%) | 12 (37.5%) |
| 35 to 44 Years | 0 (0.0%) | 49 (100.0%) |
| 45 to 54 Years | 6 (16.7%) | 36 (100.0%) |
| 55 to 64 Years | 0 (0.0%) | 15 (100.0%) |
| 65 to 74 Years | 28 (100.0%) | 25 (89.3%) |
| 75 Years and over | 15 (100.0%) | 3 (20.0%) |
| Total | 71 (22.5%) | 195 (61.7%) |
Disability Status by Sex by Age in Halliday
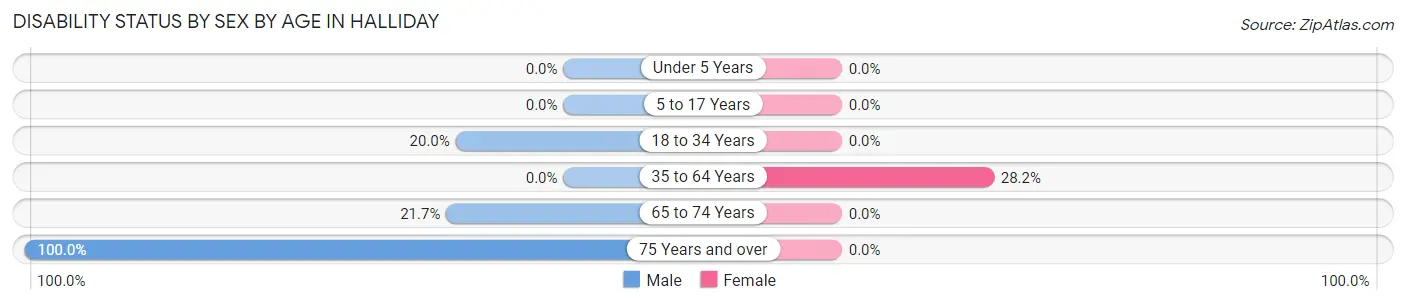
| Age Bracket | Male | Female |
| Under 5 Years | 0 (0.0%) | 0 (0.0%) |
| 5 to 17 Years | 0 (0.0%) | 0 (0.0%) |
| 18 to 34 Years | 7 (20.0%) | 0 (0.0%) |
| 35 to 64 Years | 0 (0.0%) | 11 (28.2%) |
| 65 to 74 Years | 5 (21.7%) | 0 (0.0%) |
| 75 Years and over | 12 (100.0%) | 0 (0.0%) |
Disability Class by Sex by Age in Halliday
Disability Class: Hearing Difficulty
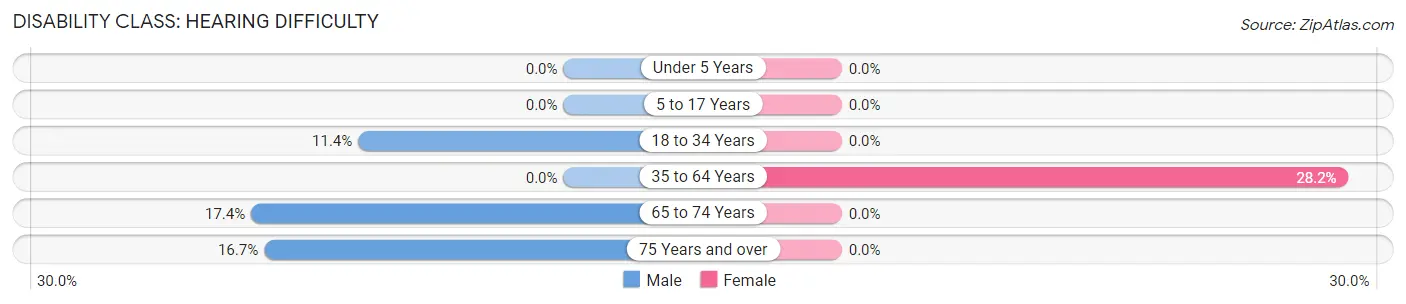
| Age Bracket | Male | Female |
| Under 5 Years | 0 (0.0%) | 0 (0.0%) |
| 5 to 17 Years | 0 (0.0%) | 0 (0.0%) |
| 18 to 34 Years | 4 (11.4%) | 0 (0.0%) |
| 35 to 64 Years | 0 (0.0%) | 11 (28.2%) |
| 65 to 74 Years | 4 (17.4%) | 0 (0.0%) |
| 75 Years and over | 2 (16.7%) | 0 (0.0%) |
Disability Class: Vision Difficulty
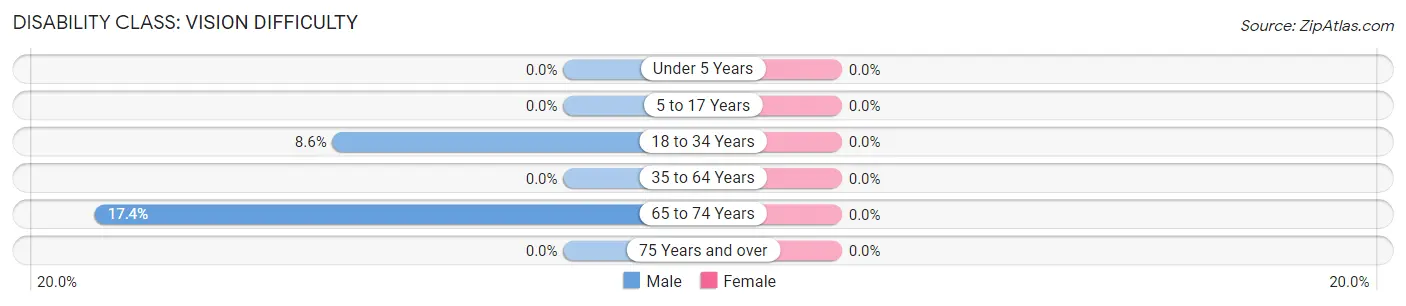
| Age Bracket | Male | Female |
| Under 5 Years | 0 (0.0%) | 0 (0.0%) |
| 5 to 17 Years | 0 (0.0%) | 0 (0.0%) |
| 18 to 34 Years | 3 (8.6%) | 0 (0.0%) |
| 35 to 64 Years | 0 (0.0%) | 0 (0.0%) |
| 65 to 74 Years | 4 (17.4%) | 0 (0.0%) |
| 75 Years and over | 0 (0.0%) | 0 (0.0%) |
Disability Class: Cognitive Difficulty
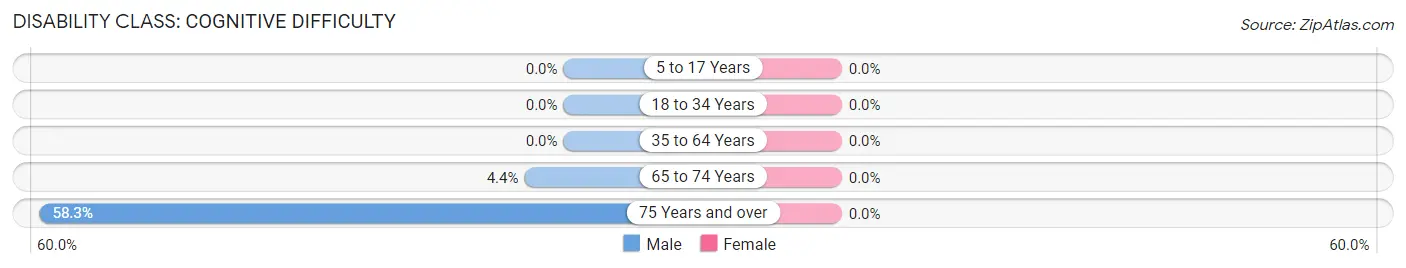
| Age Bracket | Male | Female |
| 5 to 17 Years | 0 (0.0%) | 0 (0.0%) |
| 18 to 34 Years | 0 (0.0%) | 0 (0.0%) |
| 35 to 64 Years | 0 (0.0%) | 0 (0.0%) |
| 65 to 74 Years | 1 (4.3%) | 0 (0.0%) |
| 75 Years and over | 7 (58.3%) | 0 (0.0%) |
Disability Class: Ambulatory Difficulty
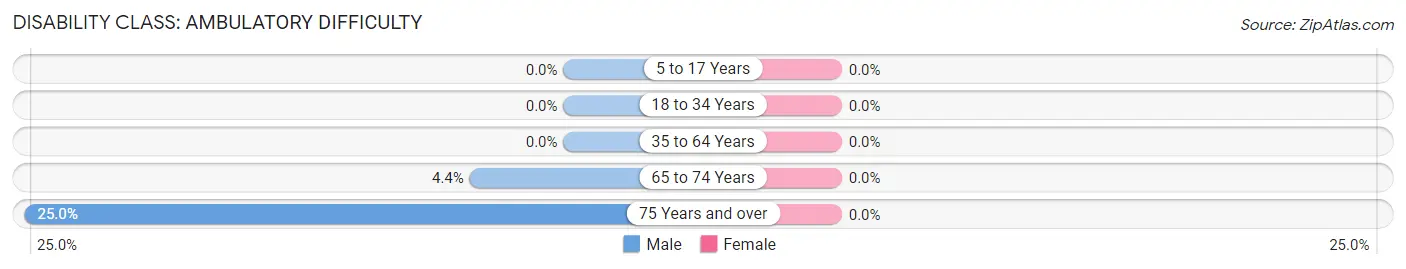
| Age Bracket | Male | Female |
| 5 to 17 Years | 0 (0.0%) | 0 (0.0%) |
| 18 to 34 Years | 0 (0.0%) | 0 (0.0%) |
| 35 to 64 Years | 0 (0.0%) | 0 (0.0%) |
| 65 to 74 Years | 1 (4.3%) | 0 (0.0%) |
| 75 Years and over | 3 (25.0%) | 0 (0.0%) |
Disability Class: Self-Care Difficulty
| Age Bracket | Male | Female |
| 5 to 17 Years | 0 (0.0%) | 0 (0.0%) |
| 18 to 34 Years | 0 (0.0%) | 0 (0.0%) |
| 35 to 64 Years | 0 (0.0%) | 0 (0.0%) |
| 65 to 74 Years | 0 (0.0%) | 0 (0.0%) |
| 75 Years and over | 0 (0.0%) | 0 (0.0%) |
Technology Access in Halliday
Computing Device Access in Halliday
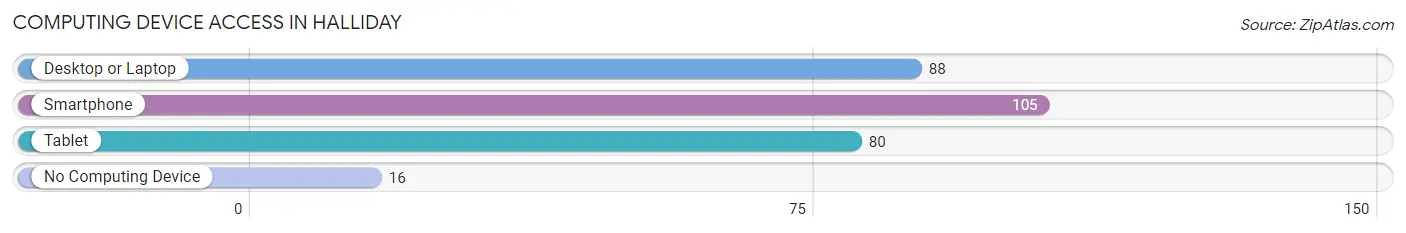
| Device Type | # Households | % Households |
| Desktop or Laptop | 88 | 68.8% |
| Smartphone | 105 | 82.0% |
| Tablet | 80 | 62.5% |
| No Computing Device | 16 | 12.5% |
| Total | 128 | 100.0% |
Internet Access in Halliday
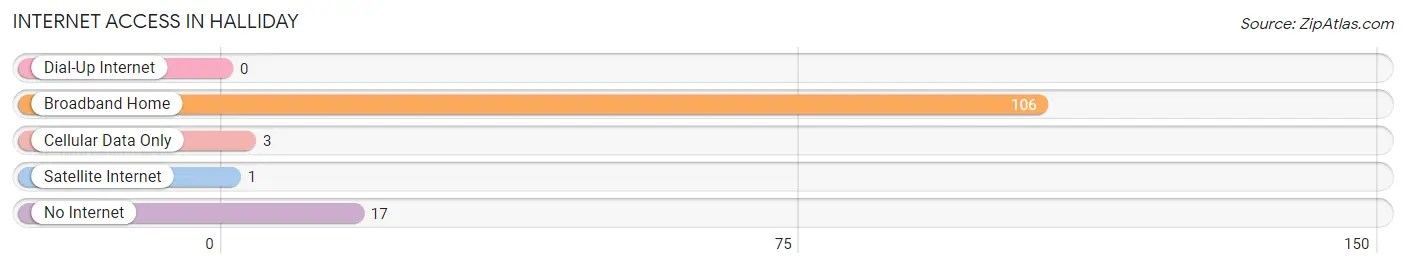
| Internet Type | # Households | % Households |
| Dial-Up Internet | 0 | 0.0% |
| Broadband Home | 106 | 82.8% |
| Cellular Data Only | 3 | 2.3% |
| Satellite Internet | 1 | 0.8% |
| No Internet | 17 | 13.3% |
| Total | 128 | 100.0% |
Halliday Summary
The state of North Dakota is located in the Midwestern and Northern regions of the United States. It is bordered by the Canadian provinces of Saskatchewan and Manitoba to the north, Minnesota to the east, South Dakota to the south, and Montana to the west. North Dakota is the 19th largest state in the United States, with an area of 70,700 square miles. It is the fourth least populous state in the country, with a population of 762,062 as of the 2020 census.
History
The area that is now North Dakota has been inhabited by various Native American tribes for thousands of years. The first Europeans to explore the area were French fur traders in the late 17th century. The area was part of the Louisiana Purchase in 1803, and was part of the Dakota Territory from 1861 to 1889. North Dakota became the 39th state in the Union on November 2, 1889.
The early history of North Dakota was dominated by the fur trade, with the Hudson's Bay Company and the American Fur Company both operating in the area. The first permanent settlement in the state was established in 1812 at Pembina. The Red River Valley was opened to settlement in 1812, and the first homesteaders began to arrive in the 1870s.
The economy of North Dakota was largely based on agriculture until the discovery of oil in the 1950s. The state has since become one of the leading producers of oil in the United States.
Geography
North Dakota is located in the Great Plains region of the United States. The state is divided into two distinct geographic regions: the eastern Great Plains and the western Great Plains. The eastern region is characterized by rolling hills and prairies, while the western region is characterized by rugged badlands and rolling hills.
The Missouri River forms the eastern border of the state, and the Red River forms the western border. The state is home to numerous lakes, including Lake Sakakawea, Lake Oahe, and Lake Audubon. The highest point in the state is White Butte, which has an elevation of 3,506 feet.
Economy
North Dakota has a diversified economy, with agriculture, energy, and tourism being the main industries. Agriculture is the largest sector of the state’s economy, accounting for about one-third of the state’s total economic output. The state is a major producer of wheat, barley, oats, corn, and soybeans.
The energy sector is the second-largest sector of the state’s economy, accounting for about one-fifth of the state’s total economic output. The state is a major producer of oil and natural gas, and is the second-largest producer of oil in the United States.
Tourism is also an important part of the state’s economy, with the state’s many national parks and monuments attracting millions of visitors each year.
Demographics
As of the 2020 census, North Dakota had a population of 762,062. The state has a population density of 10.8 people per square mile, making it the fourth least populous state in the country.
The largest racial group in the state is white, accounting for 87.3% of the population. The second-largest racial group is Native American, accounting for 5.3% of the population. Other racial groups include Asian (2.2%), African American (2.1%), and Hispanic or Latino (2.1%).
The median household income in North Dakota is $60,845, and the median home value is $179,400. The state has a poverty rate of 11.2%, which is slightly lower than the national average.
Common Questions
What is Per Capita Income in Halliday?
Per Capita income in Halliday is $40,568.
What is the Median Family Income in Halliday?
Median Family Income in Halliday is $55,000.
What is the Median Household income in Halliday?
Median Household Income in Halliday is $60,833.
What is Income or Wage Gap in Halliday?
Income or Wage Gap in Halliday is 72.6%.
Women in Halliday earn 27.4 cents for every dollar earned by a man.
What is Inequality or Gini Index in Halliday?
Inequality or Gini Index in Halliday is 0.44.
What is the Total Population of Halliday?
Total Population of Halliday is 316.
What is the Total Male Population of Halliday?
Total Male Population of Halliday is 155.
What is the Total Female Population of Halliday?
Total Female Population of Halliday is 161.
What is the Ratio of Males per 100 Females in Halliday?
There are 96.27 Males per 100 Females in Halliday.
What is the Ratio of Females per 100 Males in Halliday?
There are 103.87 Females per 100 Males in Halliday.
What is the Median Population Age in Halliday?
Median Population Age in Halliday is 29.9 Years.
What is the Average Family Size in Halliday
Average Family Size in Halliday is 5.0 People.
What is the Average Household Size in Halliday
Average Household Size in Halliday is 2.5 People.
How Large is the Labor Force in Halliday?
There are 178 People in the Labor Forcein in Halliday.
What is the Percentage of People in the Labor Force in Halliday?
81.3% of People are in the Labor Force in Halliday.