Zip Codes with the Lowest Poverty Level Among Children Under the Age of 5 in Mississippi
RELATED REPORTS & OPTIONS
Lowest Poverty | Child 0-5
Mississippi
Compare Zip Codes
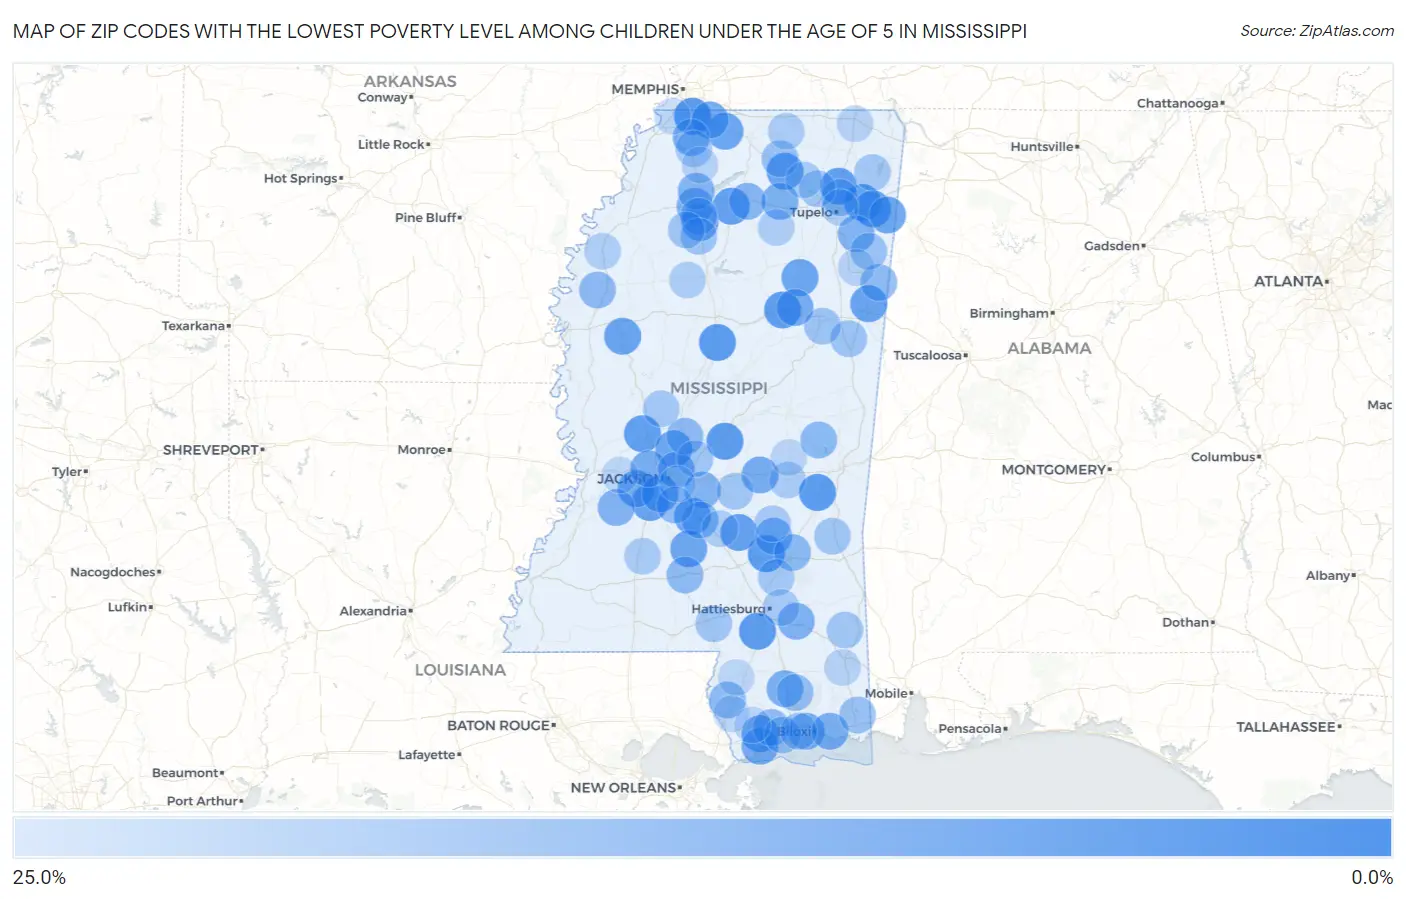
Map of Zip Codes with the Lowest Poverty Level Among Children Under the Age of 5 in Mississippi
25.0%
0.0%
Zip Codes with the Lowest Poverty Level Among Children Under the Age of 5 in Mississippi
| Zip Code | Child Poverty | vs State | vs National | |
| 1. | 38672 | 0.87% | 29.3%(-28.4)#1 | 18.1%(-17.2)#217 |
| 2. | 39480 | 1.8% | 29.3%(-27.5)#2 | 18.1%(-16.3)#701 |
| 3. | 39330 | 1.9% | 29.3%(-27.4)#3 | 18.1%(-16.2)#739 |
| 4. | 39176 | 1.9% | 29.3%(-27.4)#4 | 18.1%(-16.2)#740 |
| 5. | 39475 | 2.1% | 29.3%(-27.2)#5 | 18.1%(-16.0)#882 |
| 6. | 39094 | 2.2% | 29.3%(-27.1)#6 | 18.1%(-15.9)#949 |
| 7. | 39752 | 2.6% | 29.3%(-26.7)#7 | 18.1%(-15.5)#1,207 |
| 8. | 39040 | 3.1% | 29.3%(-26.2)#8 | 18.1%(-14.9)#1,586 |
| 9. | 38855 | 3.2% | 29.3%(-26.1)#9 | 18.1%(-14.9)#1,615 |
| 10. | 38849 | 3.2% | 29.3%(-26.1)#10 | 18.1%(-14.9)#1,616 |
| 11. | 38673 | 3.2% | 29.3%(-26.1)#11 | 18.1%(-14.8)#1,658 |
| 12. | 39116 | 4.0% | 29.3%(-25.2)#12 | 18.1%(-14.0)#2,198 |
| 13. | 39170 | 4.2% | 29.3%(-25.1)#13 | 18.1%(-13.8)#2,354 |
| 14. | 38650 | 4.2% | 29.3%(-25.1)#14 | 18.1%(-13.8)#2,364 |
| 15. | 38843 | 4.4% | 29.3%(-24.9)#15 | 18.1%(-13.6)#2,497 |
| 16. | 38753 | 4.7% | 29.3%(-24.6)#16 | 18.1%(-13.4)#2,668 |
| 17. | 39705 | 4.7% | 29.3%(-24.6)#17 | 18.1%(-13.4)#2,682 |
| 18. | 39776 | 5.0% | 29.3%(-24.3)#18 | 18.1%(-13.1)#2,909 |
| 19. | 38611 | 5.0% | 29.3%(-24.2)#19 | 18.1%(-13.0)#2,937 |
| 20. | 38876 | 5.3% | 29.3%(-24.0)#20 | 18.1%(-12.7)#3,116 |
| 21. | 39044 | 5.3% | 29.3%(-23.9)#21 | 18.1%(-12.7)#3,121 |
| 22. | 39154 | 5.4% | 29.3%(-23.9)#22 | 18.1%(-12.7)#3,150 |
| 23. | 39110 | 5.5% | 29.3%(-23.7)#23 | 18.1%(-12.5)#3,270 |
| 24. | 39525 | 5.6% | 29.3%(-23.7)#24 | 18.1%(-12.5)#3,309 |
| 25. | 39140 | 5.7% | 29.3%(-23.6)#25 | 18.1%(-12.4)#3,379 |
| 26. | 39272 | 6.4% | 29.3%(-22.9)#26 | 18.1%(-11.7)#3,860 |
| 27. | 38654 | 6.7% | 29.3%(-22.6)#27 | 18.1%(-11.4)#4,079 |
| 28. | 39092 | 7.1% | 29.3%(-22.1)#28 | 18.1%(-10.9)#4,363 |
| 29. | 39576 | 7.3% | 29.3%(-22.0)#29 | 18.1%(-10.8)#4,461 |
| 30. | 39750 | 7.5% | 29.3%(-21.8)#30 | 18.1%(-10.6)#4,580 |
| 31. | 39056 | 7.7% | 29.3%(-21.6)#31 | 18.1%(-10.3)#4,755 |
| 32. | 38658 | 7.9% | 29.3%(-21.4)#32 | 18.1%(-10.2)#4,844 |
| 33. | 39531 | 8.0% | 29.3%(-21.3)#33 | 18.1%(-10.1)#4,895 |
| 34. | 39564 | 8.0% | 29.3%(-21.2)#34 | 18.1%(-10.0)#4,944 |
| 35. | 39481 | 8.5% | 29.3%(-20.8)#35 | 18.1%(-9.55)#5,265 |
| 36. | 39211 | 8.5% | 29.3%(-20.8)#36 | 18.1%(-9.53)#5,278 |
| 37. | 38871 | 8.6% | 29.3%(-20.7)#37 | 18.1%(-9.49)#5,302 |
| 38. | 38632 | 8.6% | 29.3%(-20.7)#38 | 18.1%(-9.43)#5,357 |
| 39. | 39561 | 8.7% | 29.3%(-20.6)#39 | 18.1%(-9.37)#5,398 |
| 40. | 39462 | 9.1% | 29.3%(-20.1)#40 | 18.1%(-8.92)#5,716 |
| 41. | 39175 | 9.5% | 29.3%(-19.8)#41 | 18.1%(-8.56)#5,943 |
| 42. | 38606 | 9.5% | 29.3%(-19.7)#42 | 18.1%(-8.52)#5,996 |
| 43. | 39042 | 9.7% | 29.3%(-19.6)#43 | 18.1%(-8.34)#6,094 |
| 44. | 38858 | 9.9% | 29.3%(-19.4)#44 | 18.1%(-8.16)#6,186 |
| 45. | 38666 | 10.2% | 29.3%(-19.1)#45 | 18.1%(-7.89)#6,357 |
| 46. | 38655 | 10.9% | 29.3%(-18.4)#46 | 18.1%(-7.19)#6,762 |
| 47. | 39443 | 11.7% | 29.3%(-17.6)#47 | 18.1%(-6.38)#7,253 |
| 48. | 39325 | 11.7% | 29.3%(-17.6)#48 | 18.1%(-6.35)#7,281 |
| 49. | 39062 | 11.8% | 29.3%(-17.5)#49 | 18.1%(-6.30)#7,319 |
| 50. | 38730 | 11.9% | 29.3%(-17.4)#50 | 18.1%(-6.20)#7,380 |
| 51. | 39046 | 12.1% | 29.3%(-17.2)#51 | 18.1%(-6.00)#7,504 |
| 52. | 39740 | 12.2% | 29.3%(-17.1)#52 | 18.1%(-5.88)#7,559 |
| 53. | 39426 | 12.3% | 29.3%(-17.0)#53 | 18.1%(-5.79)#7,617 |
| 54. | 39663 | 12.3% | 29.3%(-17.0)#54 | 18.1%(-5.78)#7,623 |
| 55. | 38620 | 12.3% | 29.3%(-17.0)#55 | 18.1%(-5.73)#7,650 |
| 56. | 39571 | 12.4% | 29.3%(-16.9)#56 | 18.1%(-5.65)#7,712 |
| 57. | 39073 | 13.4% | 29.3%(-15.9)#57 | 18.1%(-4.71)#8,263 |
| 58. | 39573 | 13.7% | 29.3%(-15.5)#58 | 18.1%(-4.32)#8,482 |
| 59. | 38633 | 14.1% | 29.3%(-15.2)#59 | 18.1%(-3.96)#8,691 |
| 60. | 39560 | 14.4% | 29.3%(-14.9)#60 | 18.1%(-3.63)#8,907 |
| 61. | 39562 | 14.5% | 29.3%(-14.8)#61 | 18.1%(-3.61)#8,919 |
| 62. | 38821 | 14.5% | 29.3%(-14.8)#62 | 18.1%(-3.54)#8,953 |
| 63. | 38866 | 14.8% | 29.3%(-14.5)#63 | 18.1%(-3.30)#9,074 |
| 64. | 38948 | 14.8% | 29.3%(-14.5)#64 | 18.1%(-3.25)#9,097 |
| 65. | 39743 | 15.1% | 29.3%(-14.2)#65 | 18.1%(-3.00)#9,244 |
| 66. | 39759 | 15.2% | 29.3%(-14.1)#66 | 18.1%(-2.90)#9,303 |
| 67. | 39429 | 15.9% | 29.3%(-13.4)#67 | 18.1%(-2.20)#9,683 |
| 68. | 39047 | 15.9% | 29.3%(-13.4)#68 | 18.1%(-2.13)#9,725 |
| 69. | 39152 | 16.2% | 29.3%(-13.0)#69 | 18.1%(-1.82)#9,877 |
| 70. | 39360 | 16.3% | 29.3%(-13.0)#70 | 18.1%(-1.78)#9,895 |
| 71. | 39451 | 16.3% | 29.3%(-13.0)#71 | 18.1%(-1.78)#9,909 |
| 72. | 38927 | 16.3% | 29.3%(-13.0)#72 | 18.1%(-1.74)#9,928 |
| 73. | 39507 | 16.4% | 29.3%(-12.9)#73 | 18.1%(-1.67)#9,976 |
| 74. | 38828 | 16.5% | 29.3%(-12.8)#74 | 18.1%(-1.59)#10,014 |
| 75. | 39039 | 16.6% | 29.3%(-12.7)#75 | 18.1%(-1.47)#10,075 |
| 76. | 39437 | 16.6% | 29.3%(-12.6)#76 | 18.1%(-1.42)#10,089 |
| 77. | 38859 | 16.7% | 29.3%(-12.6)#77 | 18.1%(-1.40)#10,123 |
| 78. | 38618 | 17.5% | 29.3%(-11.8)#78 | 18.1%(-0.567)#10,472 |
| 79. | 39465 | 17.6% | 29.3%(-11.6)#79 | 18.1%(-0.424)#10,527 |
| 80. | 39422 | 17.7% | 29.3%(-11.6)#80 | 18.1%(-0.402)#10,551 |
| 81. | 38652 | 17.9% | 29.3%(-11.4)#81 | 18.1%(-0.159)#10,671 |
| 82. | 39345 | 17.9% | 29.3%(-11.4)#82 | 18.1%(-0.155)#10,673 |
| 83. | 38603 | 18.0% | 29.3%(-11.3)#83 | 18.1%(-0.099)#10,702 |
| 84. | 39191 | 18.0% | 29.3%(-11.3)#84 | 18.1%(-0.042)#10,721 |
| 85. | 38864 | 18.4% | 29.3%(-10.9)#85 | 18.1%(+0.316)#10,896 |
| 86. | 39111 | 18.4% | 29.3%(-10.9)#86 | 18.1%(+0.333)#10,903 |
| 87. | 38940 | 18.6% | 29.3%(-10.7)#87 | 18.1%(+0.542)#10,991 |
| 88. | 38774 | 18.7% | 29.3%(-10.6)#88 | 18.1%(+0.619)#11,024 |
| 89. | 38804 | 18.9% | 29.3%(-10.4)#89 | 18.1%(+0.859)#11,145 |
| 90. | 39730 | 20.1% | 29.3%(-9.21)#90 | 18.1%(+2.01)#11,684 |
| 91. | 38834 | 20.1% | 29.3%(-9.16)#91 | 18.1%(+2.06)#11,707 |
| 92. | 39452 | 20.2% | 29.3%(-9.12)#92 | 18.1%(+2.10)#11,716 |
| 93. | 38668 | 20.5% | 29.3%(-8.83)#93 | 18.1%(+2.39)#11,849 |
| 94. | 39327 | 21.1% | 29.3%(-8.14)#94 | 18.1%(+3.08)#12,131 |
| 95. | 39066 | 21.3% | 29.3%(-8.01)#95 | 18.1%(+3.21)#12,171 |
| 96. | 39470 | 21.4% | 29.3%(-7.87)#96 | 18.1%(+3.36)#12,239 |
| 97. | 38680 | 21.6% | 29.3%(-7.71)#97 | 18.1%(+3.51)#12,318 |
| 98. | 39466 | 21.8% | 29.3%(-7.49)#98 | 18.1%(+3.74)#12,407 |
| 99. | 39556 | 21.9% | 29.3%(-7.36)#99 | 18.1%(+3.86)#12,452 |
| 100. | 39208 | 22.3% | 29.3%(-7.03)#100 | 18.1%(+4.20)#12,607 |
Common Questions
What are the Top 10 Zip Codes with the Lowest Poverty Level Among Children Under the Age of 5 in Mississippi?
Top 10 Zip Codes with the Lowest Poverty Level Among Children Under the Age of 5 in Mississippi are:
What zip code has the Lowest Poverty Level Among Children Under the Age of 5 in Mississippi?
38672 has the Lowest Poverty Level Among Children Under the Age of 5 in Mississippi with 0.87%.
What is the Poverty Level Among Children Under the Age of 5 in the State of Mississippi?
Poverty Level Among Children Under the Age of 5 in Mississippi is 29.3%.
What is the Poverty Level Among Children Under the Age of 5 in the United States?
Poverty Level Among Children Under the Age of 5 in the United States is 18.1%.