Brownington, MO Map & Demographics
Brownington Map
Brownington Overview
$19,698
PER CAPITA INCOME
$63,250
AVG FAMILY INCOME
$35,357
AVG HOUSEHOLD INCOME
28.3%
WAGE / INCOME GAP [ % ]
71.7¢/ $1
WAGE / INCOME GAP [ $ ]
0.38
INEQUALITY / GINI INDEX
86
TOTAL POPULATION
49
MALE POPULATION
37
FEMALE POPULATION
132.43
MALES / 100 FEMALES
75.51
FEMALES / 100 MALES
50.6
MEDIAN AGE
3.0
AVG FAMILY SIZE
2.3
AVG HOUSEHOLD SIZE
38
LABOR FORCE [ PEOPLE ]
51.4%
PERCENT IN LABOR FORCE
10.5%
UNEMPLOYMENT RATE
Income in Brownington
Income Overview in Brownington
Per Capita Income in Brownington is $19,698, while median incomes of families and households are $63,250 and $35,357 respectively.
| Characteristic | Number | Measure |
| Per Capita Income | 86 | $19,698 |
| Median Family Income | 21 | $63,250 |
| Mean Family Income | 21 | $49,924 |
| Median Household Income | 38 | $35,357 |
| Mean Household Income | 38 | $38,582 |
| Income Deficit | 21 | $0 |
| Wage / Income Gap (%) | 86 | 28.26% |
| Wage / Income Gap ($) | 86 | 71.74¢ per $1 |
| Gini / Inequality Index | 86 | 0.38 |
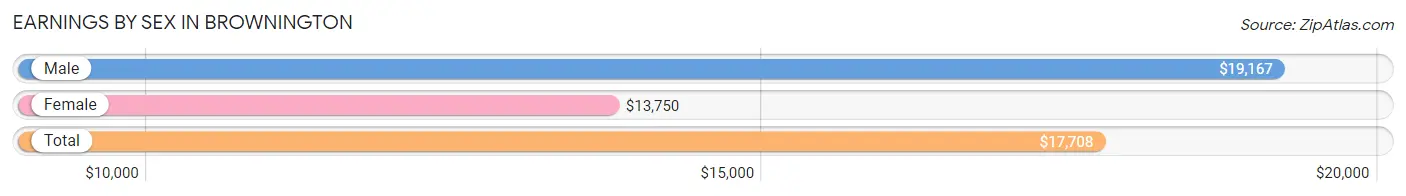
Earnings by Sex in Brownington
Average Earnings in Brownington are $17,708, $19,167 for men and $13,750 for women, a difference of 28.3%.
| Sex | Number | Average Earnings |
| Male | 30 (63.8%) | $19,167 |
| Female | 17 (36.2%) | $13,750 |
| Total | 47 (100.0%) | $17,708 |
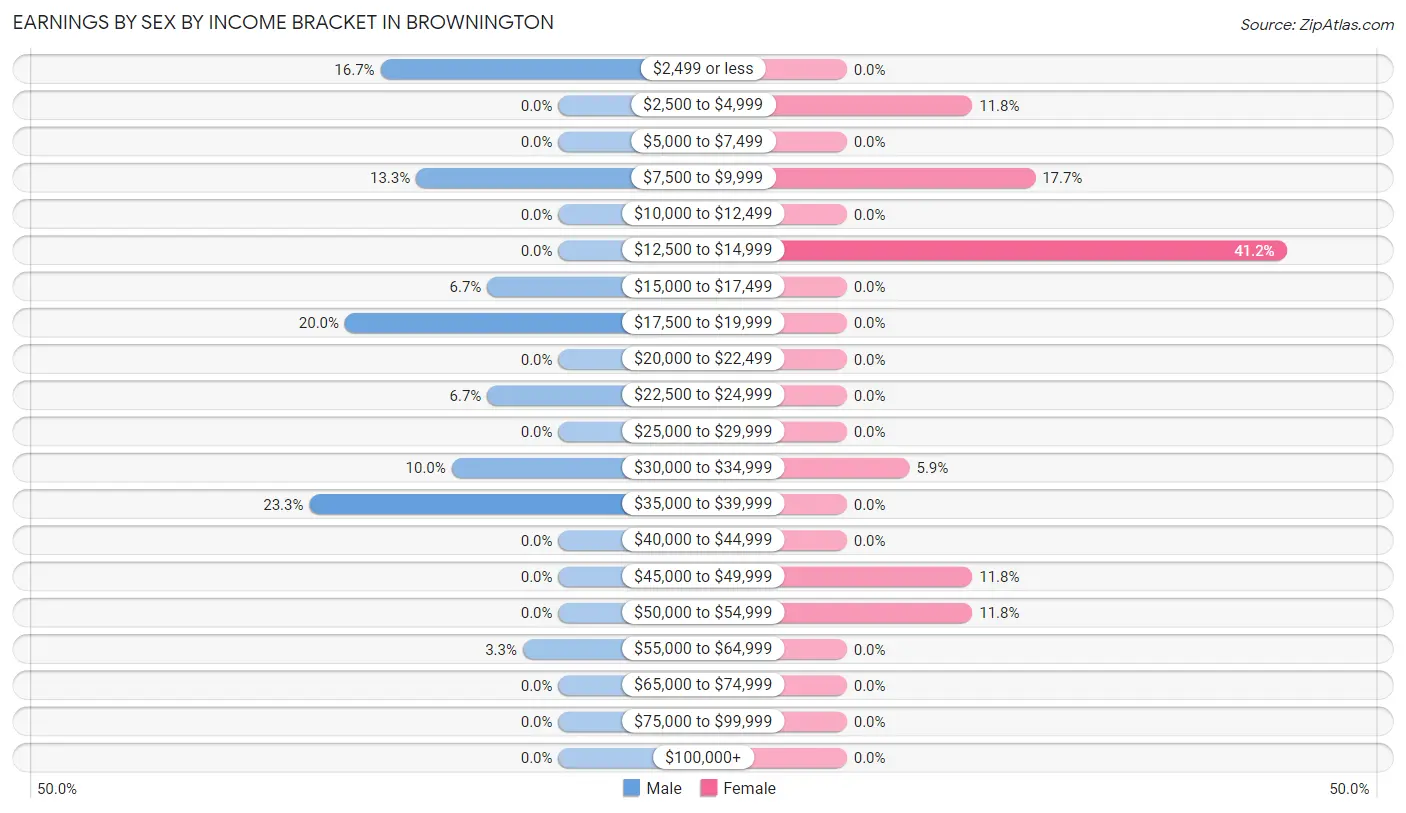
Earnings by Sex by Income Bracket in Brownington
The most common earnings brackets in Brownington are $35,000 to $39,999 for men (7 | 23.3%) and $12,500 to $14,999 for women (7 | 41.2%).
| Income | Male | Female |
| $2,499 or less | 5 (16.7%) | 0 (0.0%) |
| $2,500 to $4,999 | 0 (0.0%) | 2 (11.8%) |
| $5,000 to $7,499 | 0 (0.0%) | 0 (0.0%) |
| $7,500 to $9,999 | 4 (13.3%) | 3 (17.6%) |
| $10,000 to $12,499 | 0 (0.0%) | 0 (0.0%) |
| $12,500 to $14,999 | 0 (0.0%) | 7 (41.2%) |
| $15,000 to $17,499 | 2 (6.7%) | 0 (0.0%) |
| $17,500 to $19,999 | 6 (20.0%) | 0 (0.0%) |
| $20,000 to $22,499 | 0 (0.0%) | 0 (0.0%) |
| $22,500 to $24,999 | 2 (6.7%) | 0 (0.0%) |
| $25,000 to $29,999 | 0 (0.0%) | 0 (0.0%) |
| $30,000 to $34,999 | 3 (10.0%) | 1 (5.9%) |
| $35,000 to $39,999 | 7 (23.3%) | 0 (0.0%) |
| $40,000 to $44,999 | 0 (0.0%) | 0 (0.0%) |
| $45,000 to $49,999 | 0 (0.0%) | 2 (11.8%) |
| $50,000 to $54,999 | 0 (0.0%) | 2 (11.8%) |
| $55,000 to $64,999 | 1 (3.3%) | 0 (0.0%) |
| $65,000 to $74,999 | 0 (0.0%) | 0 (0.0%) |
| $75,000 to $99,999 | 0 (0.0%) | 0 (0.0%) |
| $100,000+ | 0 (0.0%) | 0 (0.0%) |
| Total | 30 (100.0%) | 17 (100.0%) |
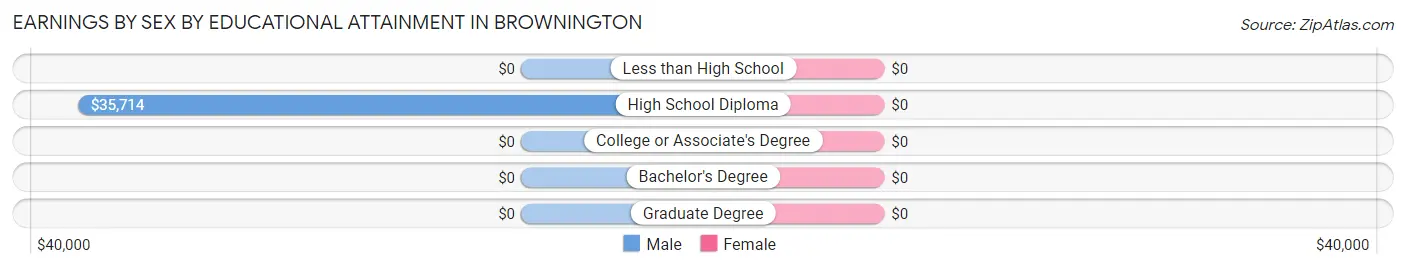
Earnings by Sex by Educational Attainment in Brownington
| Educational Attainment | Male Income | Female Income |
| Less than High School | - | - |
| High School Diploma | $35,714 | $0 |
| College or Associate's Degree | - | - |
| Bachelor's Degree | - | - |
| Graduate Degree | - | - |
| Total | $18,438 | $13,750 |
Family Income in Brownington
Family Income Brackets in Brownington
According to the Brownington family income data, there are 10 families falling into the $50,000 to $74,999 income range, which is the most common income bracket and makes up 47.6% of all families.
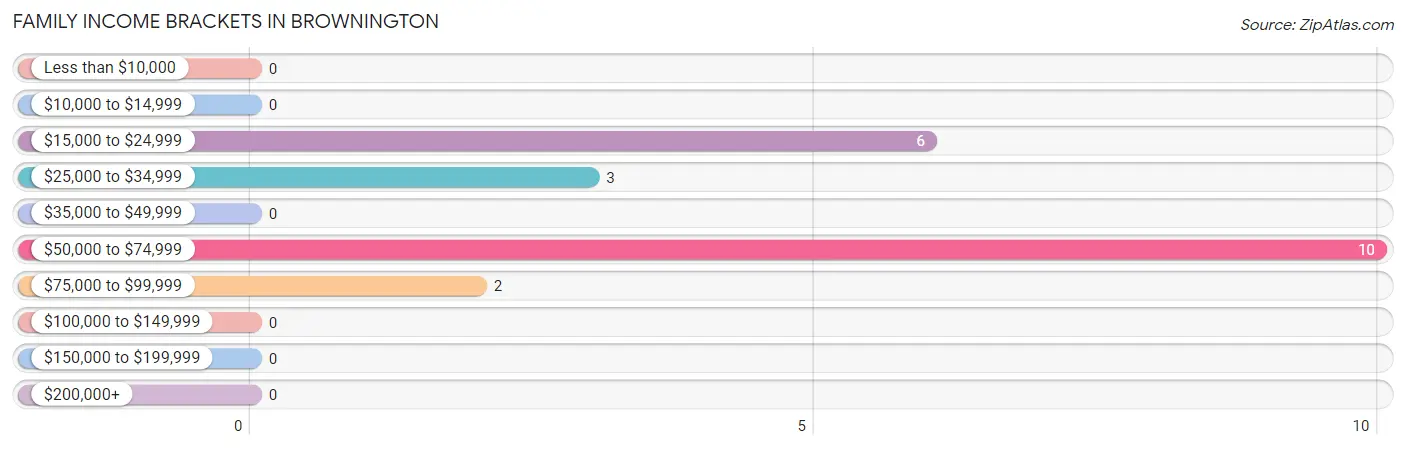
| Income Bracket | # Families | % Families |
| Less than $10,000 | 0 | 0.0% |
| $10,000 to $14,999 | 0 | 0.0% |
| $15,000 to $24,999 | 6 | 28.6% |
| $25,000 to $34,999 | 3 | 14.3% |
| $35,000 to $49,999 | 0 | 0.0% |
| $50,000 to $74,999 | 10 | 47.6% |
| $75,000 to $99,999 | 2 | 9.5% |
| $100,000 to $149,999 | 0 | 0.0% |
| $150,000 to $199,999 | 0 | 0.0% |
| $200,000+ | 0 | 0.0% |
Family Income by Famaliy Size in Brownington
2-person families (15 | 71.4%) account for the highest median family income in Brownington with $63,250 per family, while 2-person families (15 | 71.4%) have the highest median income of $31,625 per family member.
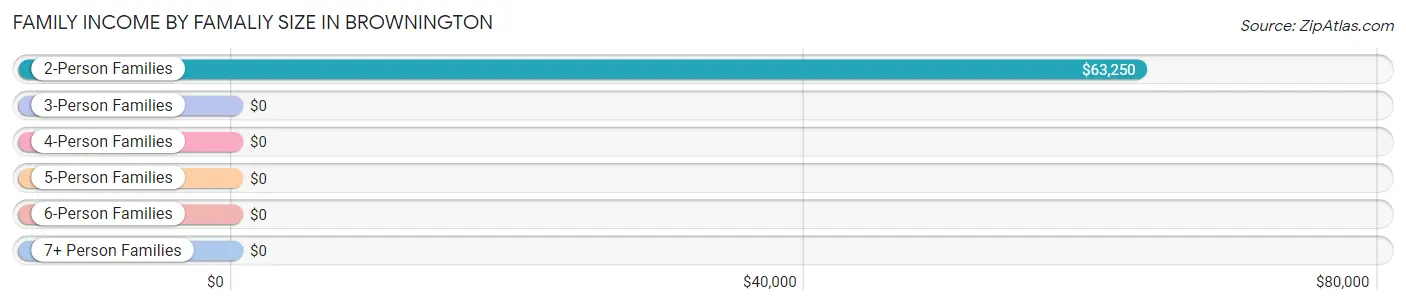
| Income Bracket | # Families | Median Income |
| 2-Person Families | 15 (71.4%) | $63,250 |
| 3-Person Families | 2 (9.5%) | $0 |
| 4-Person Families | 2 (9.5%) | $0 |
| 5-Person Families | 2 (9.5%) | $0 |
| 6-Person Families | 0 (0.0%) | $0 |
| 7+ Person Families | 0 (0.0%) | $0 |
| Total | 21 (100.0%) | $63,250 |
Family Income by Number of Earners in Brownington
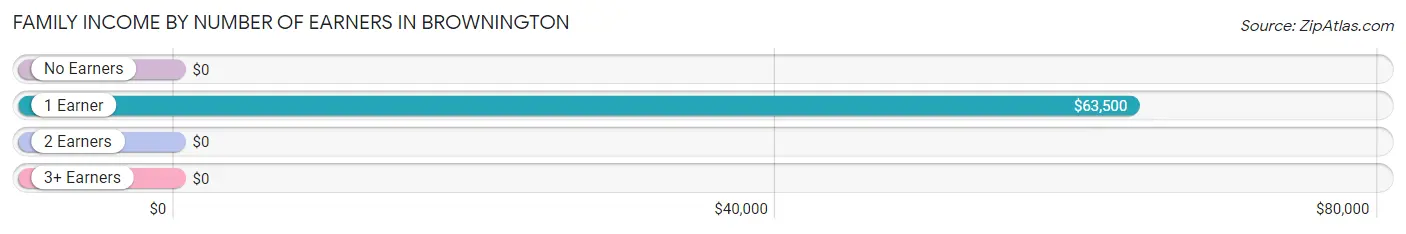
| Number of Earners | # Families | Median Income |
| No Earners | 4 (19.1%) | $0 |
| 1 Earner | 10 (47.6%) | $63,500 |
| 2 Earners | 5 (23.8%) | $0 |
| 3+ Earners | 2 (9.5%) | $0 |
| Total | 21 (100.0%) | $63,250 |
Household Income in Brownington
Household Income Brackets in Brownington
With 10 households falling in the category, the $50,000 to $74,999 income range is the most frequent in Brownington, accounting for 26.3% of all households.
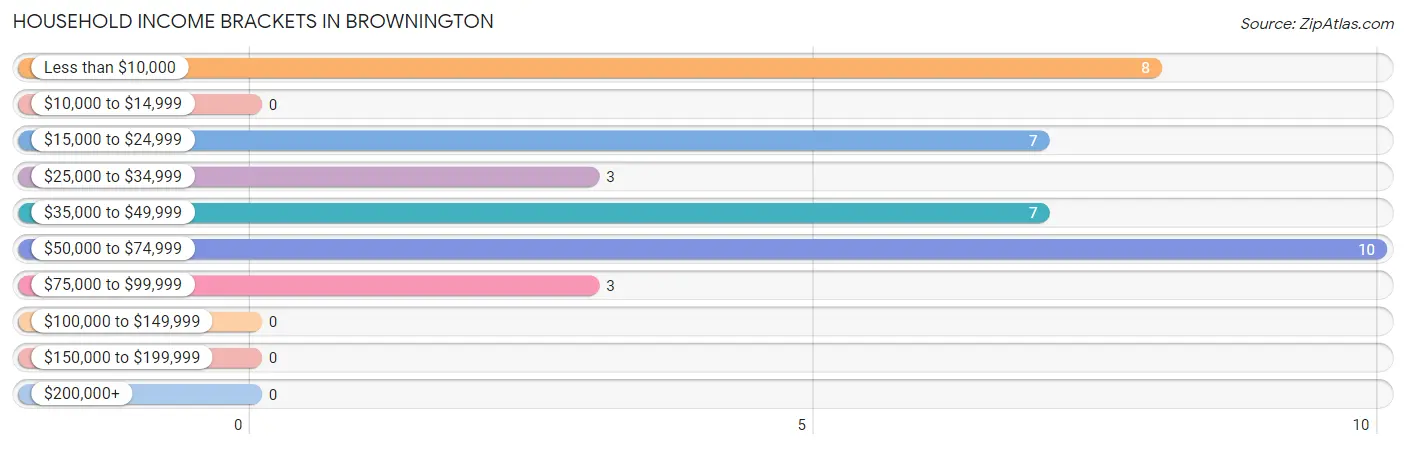
| Income Bracket | # Households | % Households |
| Less than $10,000 | 8 | 21.1% |
| $10,000 to $14,999 | 0 | 0.0% |
| $15,000 to $24,999 | 7 | 18.4% |
| $25,000 to $34,999 | 3 | 7.9% |
| $35,000 to $49,999 | 7 | 18.4% |
| $50,000 to $74,999 | 10 | 26.3% |
| $75,000 to $99,999 | 3 | 7.9% |
| $100,000 to $149,999 | 0 | 0.0% |
| $150,000 to $199,999 | 0 | 0.0% |
| $200,000+ | 0 | 0.0% |
Household Income by Householder Age in Brownington
The median household income in Brownington is $35,357, with the highest median household income of $35,714 found in the 45 to 64 years age bracket for the primary householder. A total of 22 households (57.9%) fall into this category.
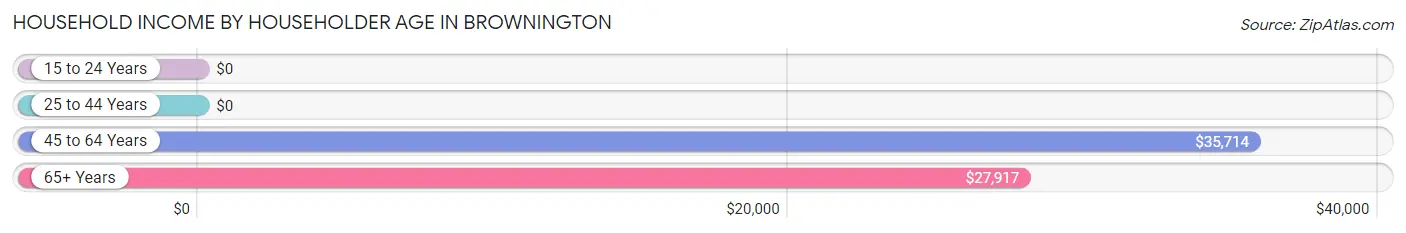
| Income Bracket | # Households | Median Income |
| 15 to 24 Years | 0 (0.0%) | $0 |
| 25 to 44 Years | 7 (18.4%) | $0 |
| 45 to 64 Years | 22 (57.9%) | $35,714 |
| 65+ Years | 9 (23.7%) | $27,917 |
| Total | 38 (100.0%) | $35,357 |
Poverty in Brownington
Income Below Poverty by Sex and Age in Brownington
With 36.7% poverty level for males and 35.1% for females among the residents of Brownington, 5 year old males and under 5 year old females are the most vulnerable to poverty, with 3 males (100.0%) and 2 females (100.0%) in their respective age groups living below the poverty level.
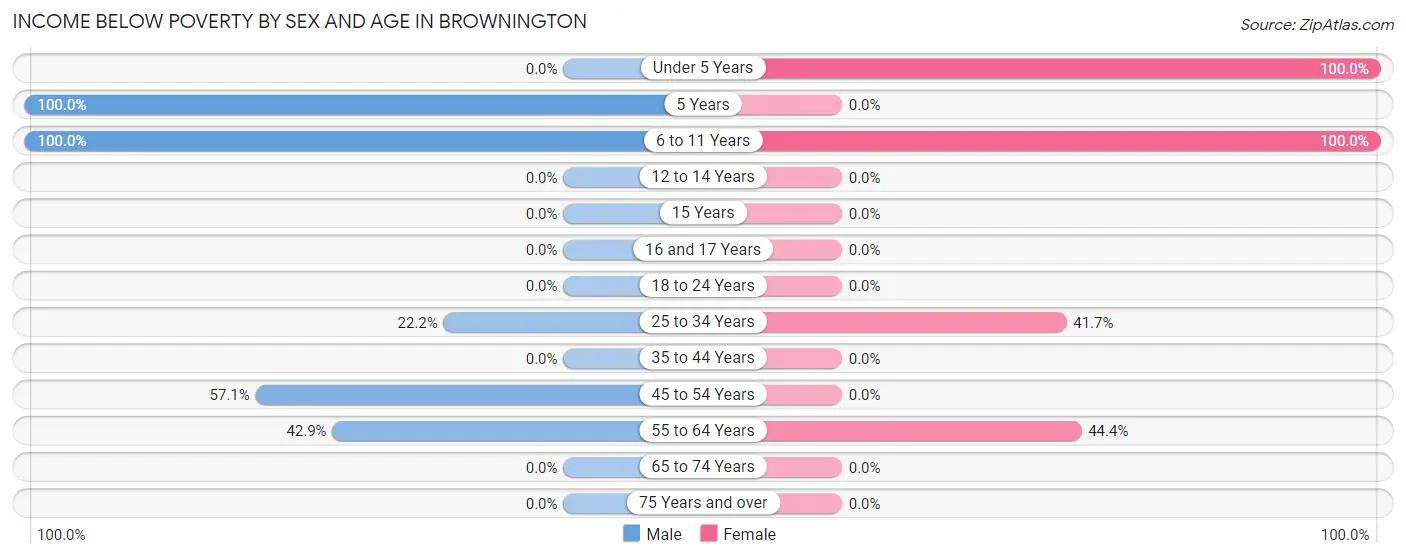
| Age Bracket | Male | Female |
| Under 5 Years | 0 (0.0%) | 2 (100.0%) |
| 5 Years | 3 (100.0%) | 0 (0.0%) |
| 6 to 11 Years | 3 (100.0%) | 2 (100.0%) |
| 12 to 14 Years | 0 (0.0%) | 0 (0.0%) |
| 15 Years | 0 (0.0%) | 0 (0.0%) |
| 16 and 17 Years | 0 (0.0%) | 0 (0.0%) |
| 18 to 24 Years | 0 (0.0%) | 0 (0.0%) |
| 25 to 34 Years | 2 (22.2%) | 5 (41.7%) |
| 35 to 44 Years | 0 (0.0%) | 0 (0.0%) |
| 45 to 54 Years | 4 (57.1%) | 0 (0.0%) |
| 55 to 64 Years | 6 (42.9%) | 4 (44.4%) |
| 65 to 74 Years | 0 (0.0%) | 0 (0.0%) |
| 75 Years and over | 0 (0.0%) | 0 (0.0%) |
| Total | 18 (36.7%) | 13 (35.1%) |
Income Above Poverty by Sex and Age in Brownington
According to the poverty statistics in Brownington, males aged 18 to 24 years and females aged 15 years are the age groups that are most secure financially, with 100.0% of males and 100.0% of females in these age groups living above the poverty line.
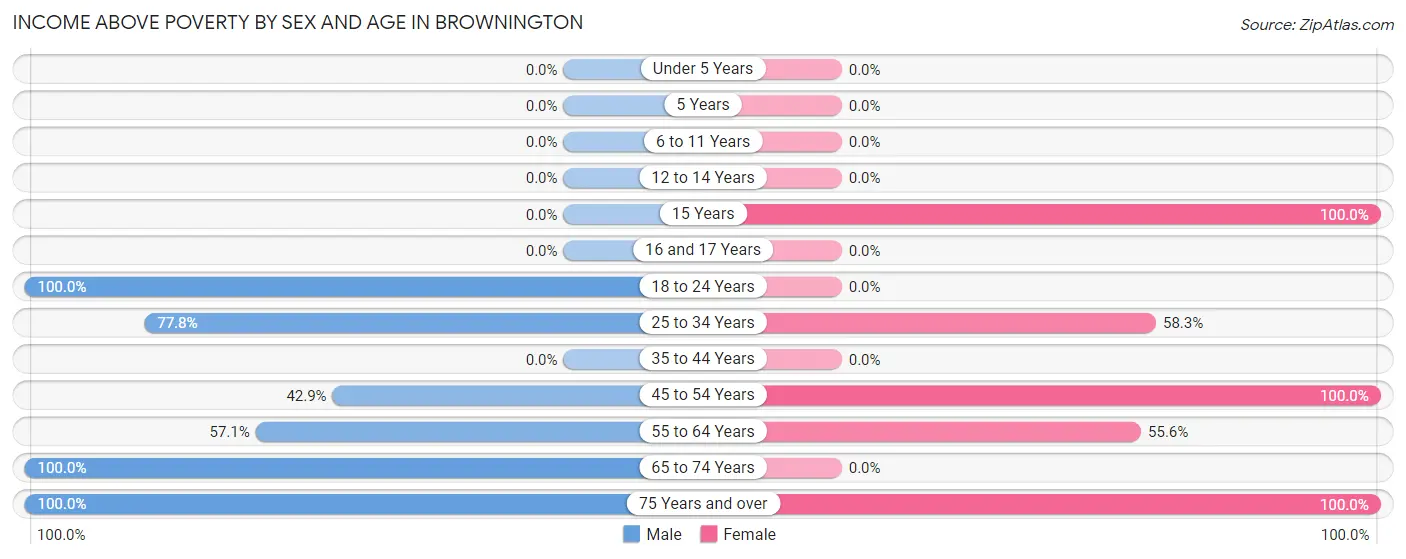
| Age Bracket | Male | Female |
| Under 5 Years | 0 (0.0%) | 0 (0.0%) |
| 5 Years | 0 (0.0%) | 0 (0.0%) |
| 6 to 11 Years | 0 (0.0%) | 0 (0.0%) |
| 12 to 14 Years | 0 (0.0%) | 0 (0.0%) |
| 15 Years | 0 (0.0%) | 2 (100.0%) |
| 16 and 17 Years | 0 (0.0%) | 0 (0.0%) |
| 18 to 24 Years | 5 (100.0%) | 0 (0.0%) |
| 25 to 34 Years | 7 (77.8%) | 7 (58.3%) |
| 35 to 44 Years | 0 (0.0%) | 0 (0.0%) |
| 45 to 54 Years | 3 (42.9%) | 4 (100.0%) |
| 55 to 64 Years | 8 (57.1%) | 5 (55.6%) |
| 65 to 74 Years | 5 (100.0%) | 0 (0.0%) |
| 75 Years and over | 3 (100.0%) | 6 (100.0%) |
| Total | 31 (63.3%) | 24 (64.9%) |
Income Below Poverty Among Married-Couple Families in Brownington
The poverty statistics for married-couple families in Brownington show that 12.5% or 2 of the total 16 families live below the poverty line. Families with 3 or 4 children have the highest poverty rate of 100.0%, comprising of 2 families. On the other hand, families with no children have the lowest poverty rate of 0.0%, which includes 0 families.
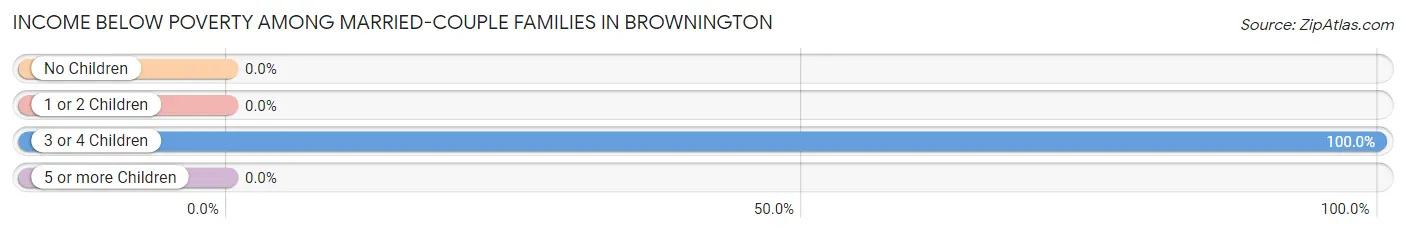
| Children | Above Poverty | Below Poverty |
| No Children | 12 (100.0%) | 0 (0.0%) |
| 1 or 2 Children | 2 (100.0%) | 0 (0.0%) |
| 3 or 4 Children | 0 (0.0%) | 2 (100.0%) |
| 5 or more Children | 0 (0.0%) | 0 (0.0%) |
| Total | 14 (87.5%) | 2 (12.5%) |
Income Below Poverty Among Single-Parent Households in Brownington
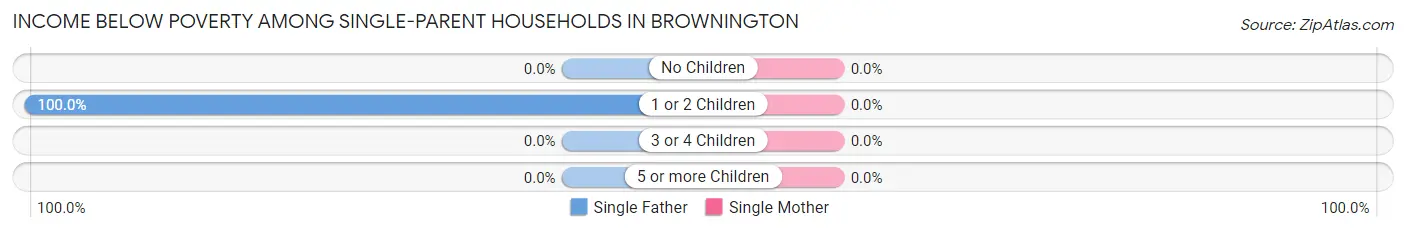
| Children | Single Father | Single Mother |
| No Children | 0 (0.0%) | 0 (0.0%) |
| 1 or 2 Children | 1 (100.0%) | 0 (0.0%) |
| 3 or 4 Children | 0 (0.0%) | 0 (0.0%) |
| 5 or more Children | 0 (0.0%) | 0 (0.0%) |
| Total | 1 (50.0%) | 0 (0.0%) |
Income Below Poverty Among Married-Couple vs Single-Parent Households in Brownington
The poverty data for Brownington shows that 2 of the married-couple family households (12.5%) and 1 of the single-parent households (20.0%) are living below the poverty level. Within the married-couple family households, those with 3 or 4 children have the highest poverty rate, with 2 households (100.0%) falling below the poverty line. Among the single-parent households, those with 1 or 2 children have the highest poverty rate, with 1 household (100.0%) living below poverty.
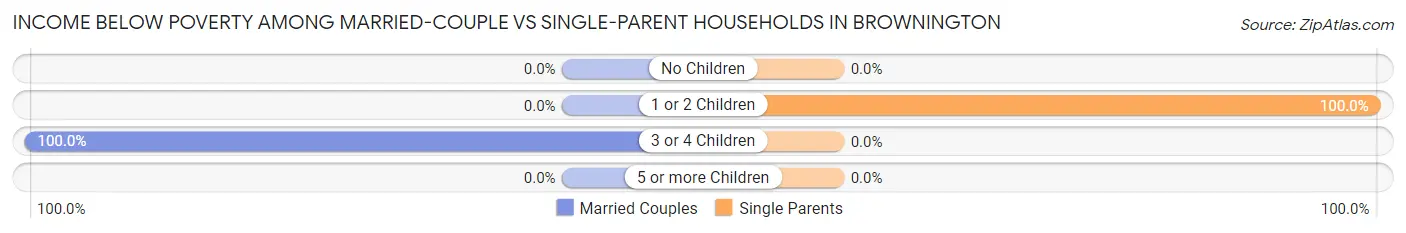
| Children | Married-Couple Families | Single-Parent Households |
| No Children | 0 (0.0%) | 0 (0.0%) |
| 1 or 2 Children | 0 (0.0%) | 1 (100.0%) |
| 3 or 4 Children | 2 (100.0%) | 0 (0.0%) |
| 5 or more Children | 0 (0.0%) | 0 (0.0%) |
| Total | 2 (12.5%) | 1 (20.0%) |
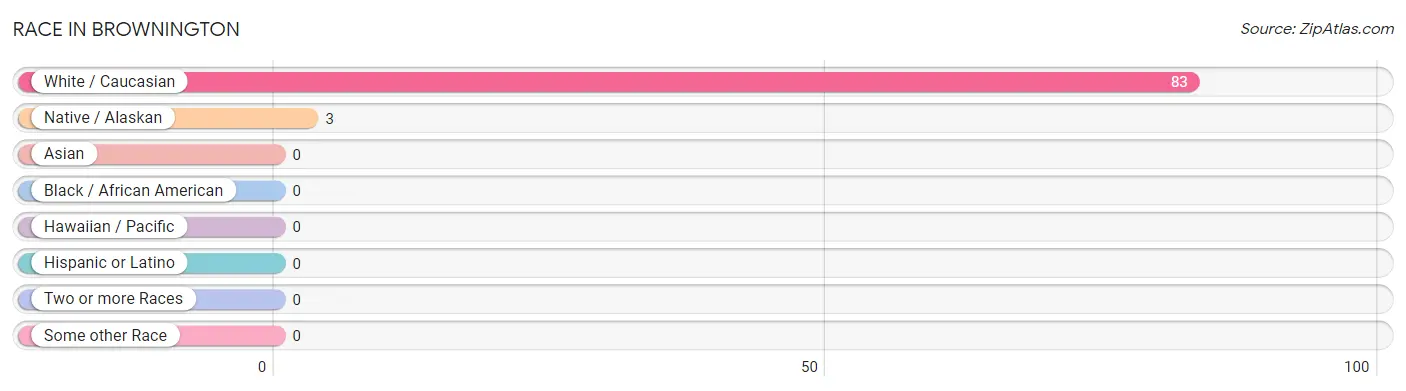
Race in Brownington
The most populous races in Brownington are White / Caucasian (83 | 96.5%), and Native / Alaskan (3 | 3.5%).
| Race | # Population | % Population |
| Asian | 0 | 0.0% |
| Black / African American | 0 | 0.0% |
| Hawaiian / Pacific | 0 | 0.0% |
| Hispanic or Latino | 0 | 0.0% |
| Native / Alaskan | 3 | 3.5% |
| White / Caucasian | 83 | 96.5% |
| Two or more Races | 0 | 0.0% |
| Some other Race | 0 | 0.0% |
| Total | 86 | 100.0% |
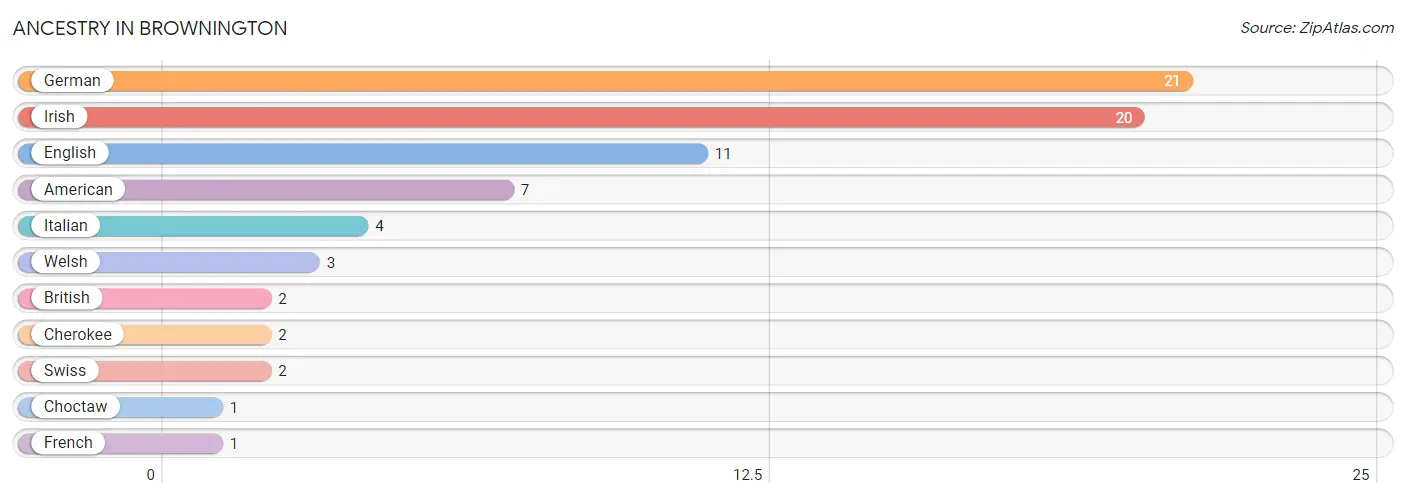
Ancestry in Brownington
The most populous ancestries reported in Brownington are German (21 | 24.4%), Irish (20 | 23.3%), English (11 | 12.8%), American (7 | 8.1%), and Italian (4 | 4.6%), together accounting for 73.3% of all Brownington residents.
| Ancestry | # Population | % Population |
| American | 7 | 8.1% |
| British | 2 | 2.3% |
| Cherokee | 2 | 2.3% |
| Choctaw | 1 | 1.2% |
| English | 11 | 12.8% |
| French | 1 | 1.2% |
| German | 21 | 24.4% |
| Irish | 20 | 23.3% |
| Italian | 4 | 4.6% |
| Swiss | 2 | 2.3% |
| Welsh | 3 | 3.5% | View All 11 Rows |
Immigrants in Brownington

| Immigration Origin | # Population | % Population | View All 0 Rows |
Sex and Age in Brownington
Sex and Age in Brownington
The most populous age groups in Brownington are 30 to 34 Years (9 | 18.4%) for men and 55 to 59 Years (8 | 21.6%) for women.
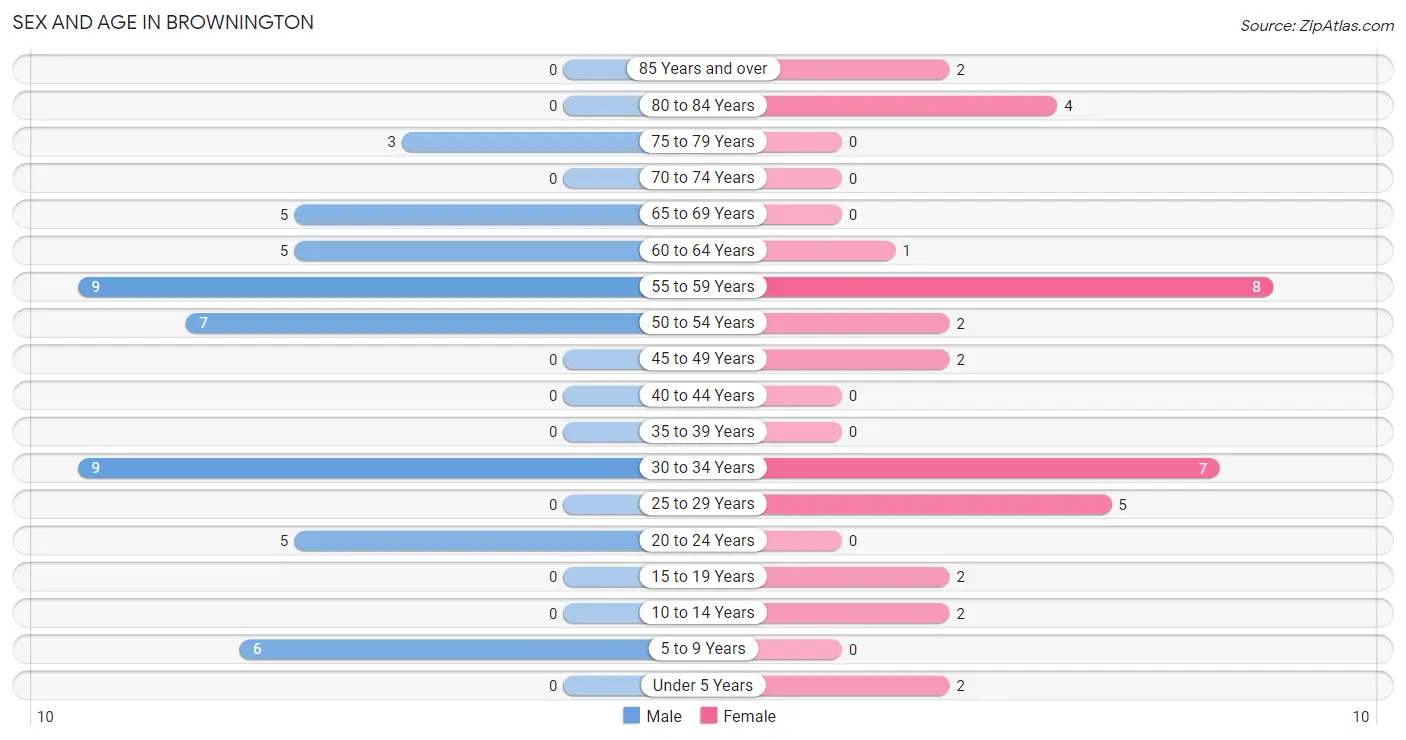
| Age Bracket | Male | Female |
| Under 5 Years | 0 (0.0%) | 2 (5.4%) |
| 5 to 9 Years | 6 (12.2%) | 0 (0.0%) |
| 10 to 14 Years | 0 (0.0%) | 2 (5.4%) |
| 15 to 19 Years | 0 (0.0%) | 2 (5.4%) |
| 20 to 24 Years | 5 (10.2%) | 0 (0.0%) |
| 25 to 29 Years | 0 (0.0%) | 5 (13.5%) |
| 30 to 34 Years | 9 (18.4%) | 7 (18.9%) |
| 35 to 39 Years | 0 (0.0%) | 0 (0.0%) |
| 40 to 44 Years | 0 (0.0%) | 0 (0.0%) |
| 45 to 49 Years | 0 (0.0%) | 2 (5.4%) |
| 50 to 54 Years | 7 (14.3%) | 2 (5.4%) |
| 55 to 59 Years | 9 (18.4%) | 8 (21.6%) |
| 60 to 64 Years | 5 (10.2%) | 1 (2.7%) |
| 65 to 69 Years | 5 (10.2%) | 0 (0.0%) |
| 70 to 74 Years | 0 (0.0%) | 0 (0.0%) |
| 75 to 79 Years | 3 (6.1%) | 0 (0.0%) |
| 80 to 84 Years | 0 (0.0%) | 4 (10.8%) |
| 85 Years and over | 0 (0.0%) | 2 (5.4%) |
| Total | 49 (100.0%) | 37 (100.0%) |
Families and Households in Brownington
Median Family Size in Brownington
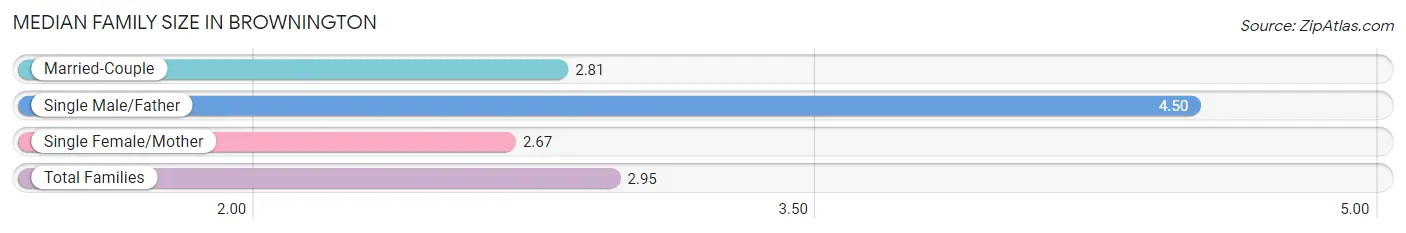
The median family size in Brownington is 2.95 persons per family, with single male/father families (2 | 9.5%) accounting for the largest median family size of 4.5 persons per family. On the other hand, single female/mother families (3 | 14.3%) represent the smallest median family size with 2.67 persons per family.
| Family Type | # Families | Family Size |
| Married-Couple | 16 (76.2%) | 2.81 |
| Single Male/Father | 2 (9.5%) | 4.50 |
| Single Female/Mother | 3 (14.3%) | 2.67 |
| Total Families | 21 (100.0%) | 2.95 |
Median Household Size in Brownington
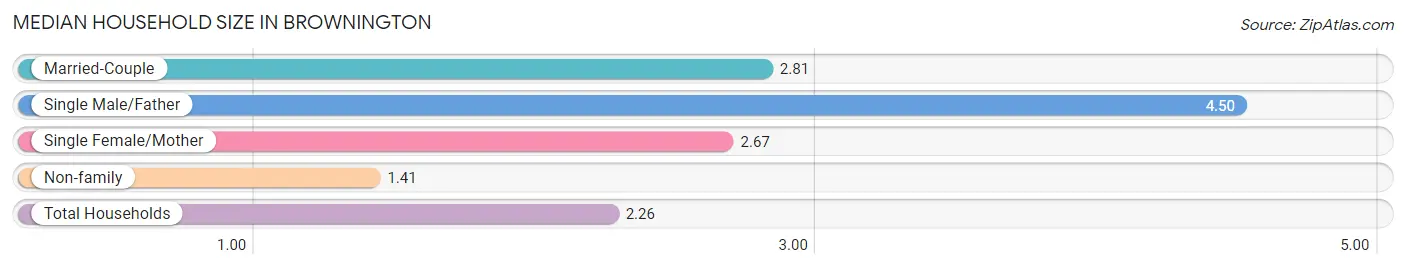
The median household size in Brownington is 2.26 persons per household, with single male/father households (2 | 5.3%) accounting for the largest median household size of 4.5 persons per household. non-family households (17 | 44.7%) represent the smallest median household size with 1.41 persons per household.
| Household Type | # Households | Household Size |
| Married-Couple | 16 (42.1%) | 2.81 |
| Single Male/Father | 2 (5.3%) | 4.50 |
| Single Female/Mother | 3 (7.9%) | 2.67 |
| Non-family | 17 (44.7%) | 1.41 |
| Total Households | 38 (100.0%) | 2.26 |
Household Size by Marriage Status in Brownington
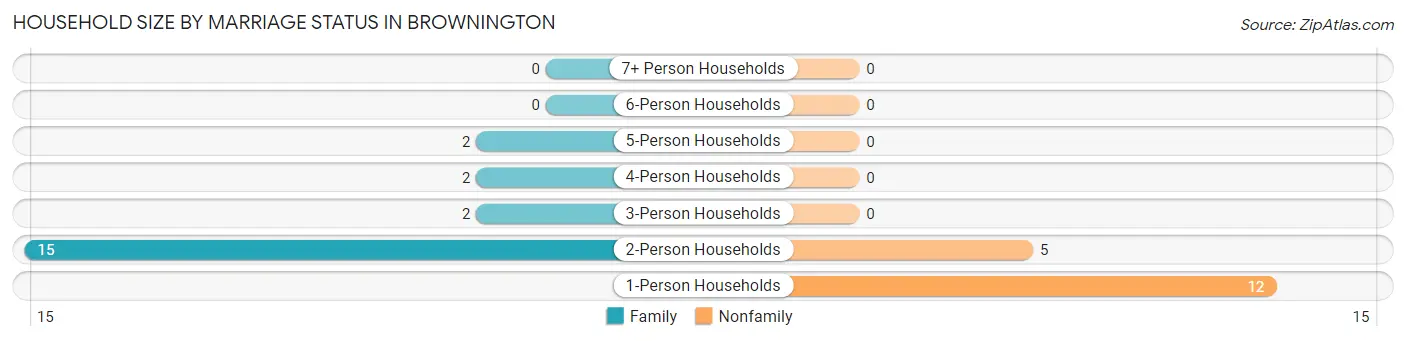
Out of a total of 38 households in Brownington, 21 (55.3%) are family households, while 17 (44.7%) are nonfamily households. The most numerous type of family households are 2-person households, comprising 15, and the most common type of nonfamily households are 1-person households, comprising 12.
| Household Size | Family Households | Nonfamily Households |
| 1-Person Households | - | 12 (31.6%) |
| 2-Person Households | 15 (39.5%) | 5 (13.2%) |
| 3-Person Households | 2 (5.3%) | 0 (0.0%) |
| 4-Person Households | 2 (5.3%) | 0 (0.0%) |
| 5-Person Households | 2 (5.3%) | 0 (0.0%) |
| 6-Person Households | 0 (0.0%) | 0 (0.0%) |
| 7+ Person Households | 0 (0.0%) | 0 (0.0%) |
| Total | 21 (55.3%) | 17 (44.7%) |
Female Fertility in Brownington
Fertility by Age in Brownington
| Age Bracket | Women with Births | Births / 1,000 Women |
| 15 to 19 years | 0 (0.0%) | 0.0 |
| 20 to 34 years | 0 (0.0%) | 0.0 |
| 35 to 50 years | 0 (0.0%) | 0.0 |
| Total | 0 (0.0%) | 0.0 |
Fertility by Age by Marriage Status in Brownington
| Age Bracket | Married | Unmarried |
| 15 to 19 years | 0 (0.0%) | 0 (0.0%) |
| 20 to 34 years | 0 (0.0%) | 0 (0.0%) |
| 35 to 50 years | 0 (0.0%) | 0 (0.0%) |
| Total | 0 (0.0%) | 0 (0.0%) |
Fertility by Education in Brownington
| Educational Attainment | Women with Births | Births / 1,000 Women |
| Less than High School | 0 (0.0%) | 0.0 |
| High School Diploma | 0 (0.0%) | 0.0 |
| College or Associate's Degree | 0 (0.0%) | 0.0 |
| Bachelor's Degree | 0 (0.0%) | 0.0 |
| Graduate Degree | 0 (0.0%) | 0.0 |
| Total | 0 (0.0%) | 0.0 |
Fertility by Education by Marriage Status in Brownington
| Educational Attainment | Married | Unmarried |
| Less than High School | 0 (0.0%) | 0 (0.0%) |
| High School Diploma | 0 (0.0%) | 0 (0.0%) |
| College or Associate's Degree | 0 (0.0%) | 0 (0.0%) |
| Bachelor's Degree | 0 (0.0%) | 0 (0.0%) |
| Graduate Degree | 0 (0.0%) | 0 (0.0%) |
| Total | 0 (0.0%) | 0 (0.0%) |
Employment Characteristics in Brownington
Employment by Class of Employer in Brownington
Among the 34 employed individuals in Brownington, private company employees (26 | 76.5%), self-employed (not incorporated) (4 | 11.8%), and not-for-profit organizations (4 | 11.8%) make up the most common classes of employment.
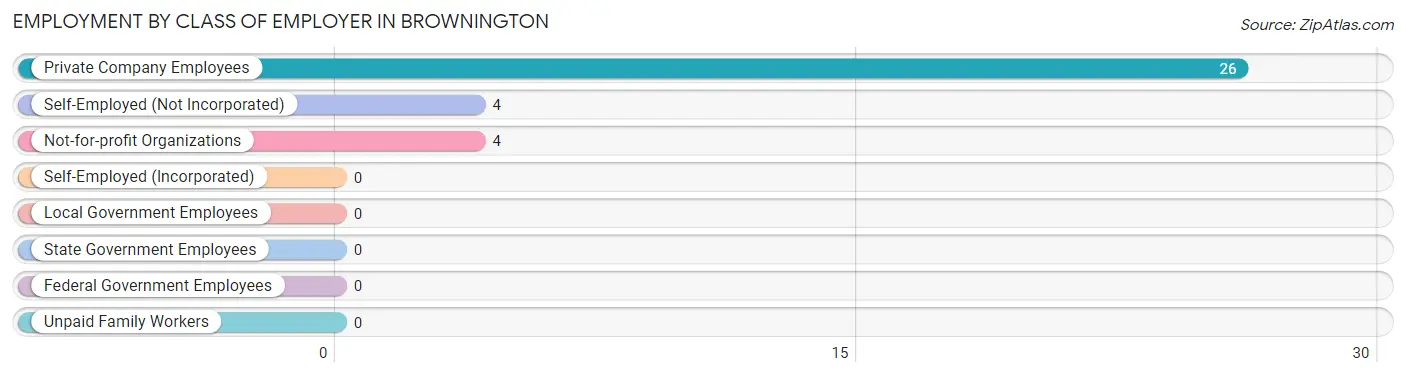
| Employer Class | # Employees | % Employees |
| Private Company Employees | 26 | 76.5% |
| Self-Employed (Incorporated) | 0 | 0.0% |
| Self-Employed (Not Incorporated) | 4 | 11.8% |
| Not-for-profit Organizations | 4 | 11.8% |
| Local Government Employees | 0 | 0.0% |
| State Government Employees | 0 | 0.0% |
| Federal Government Employees | 0 | 0.0% |
| Unpaid Family Workers | 0 | 0.0% |
| Total | 34 | 100.0% |
Employment Status by Age in Brownington
According to the labor force statistics for Brownington, out of the total population over 16 years of age (74), 51.4% or 38 individuals are in the labor force, with 10.5% or 4 of them unemployed. The age group with the highest labor force participation rate is 25 to 29 years, with 100.0% or 5 individuals in the labor force. Within the labor force, the 30 to 34 years age range has the highest percentage of unemployed individuals, with 22.2% or 2 of them being unemployed.
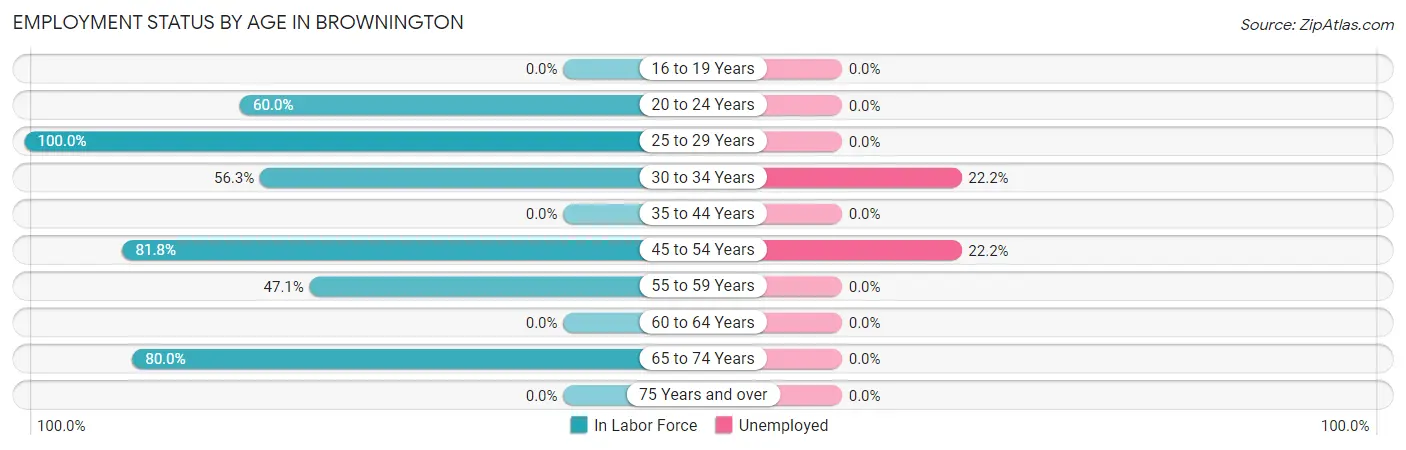
| Age Bracket | In Labor Force | Unemployed |
| 16 to 19 Years | 0 (0.0%) | 0 (0.0%) |
| 20 to 24 Years | 3 (60.0%) | 0 (0.0%) |
| 25 to 29 Years | 5 (100.0%) | 0 (0.0%) |
| 30 to 34 Years | 9 (56.3%) | 2 (22.2%) |
| 35 to 44 Years | 0 (0.0%) | 0 (0.0%) |
| 45 to 54 Years | 9 (81.8%) | 2 (22.2%) |
| 55 to 59 Years | 8 (47.1%) | 0 (0.0%) |
| 60 to 64 Years | 0 (0.0%) | 0 (0.0%) |
| 65 to 74 Years | 4 (80.0%) | 0 (0.0%) |
| 75 Years and over | 0 (0.0%) | 0 (0.0%) |
| Total | 38 (51.4%) | 4 (10.5%) |
Employment Status by Educational Attainment in Brownington
According to labor force statistics for Brownington, 56.4% of individuals (31) out of the total population between 25 and 64 years of age (55) are in the labor force, with 12.9% or 4 of them being unemployed. The group with the highest labor force participation rate are those with the educational attainment of bachelor's degree or higher, with 80.0% or 4 individuals in the labor force. Within the labor force, individuals with high school diploma education have the highest percentage of unemployment, with 21.1% or 4 of them being unemployed.
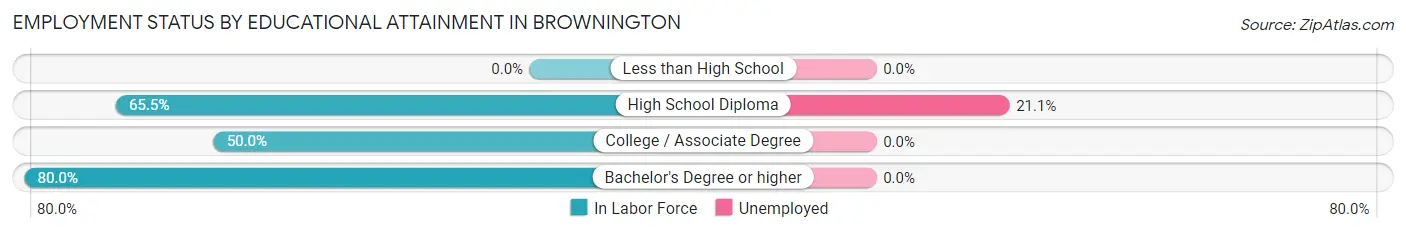
| Educational Attainment | In Labor Force | Unemployed |
| Less than High School | 0 (0.0%) | 0 (0.0%) |
| High School Diploma | 19 (65.5%) | 6 (21.1%) |
| College / Associate Degree | 8 (50.0%) | 0 (0.0%) |
| Bachelor's Degree or higher | 4 (80.0%) | 0 (0.0%) |
| Total | 31 (56.4%) | 7 (12.9%) |
Employment Occupations by Sex in Brownington
Management, Business, Science and Arts Occupations
The most common Management, Business, Science and Arts occupations in Brownington are Community & Social Service (4 | 11.8%), Education, Arts & Media (4 | 11.8%), and Business & Financial (2 | 5.9%).
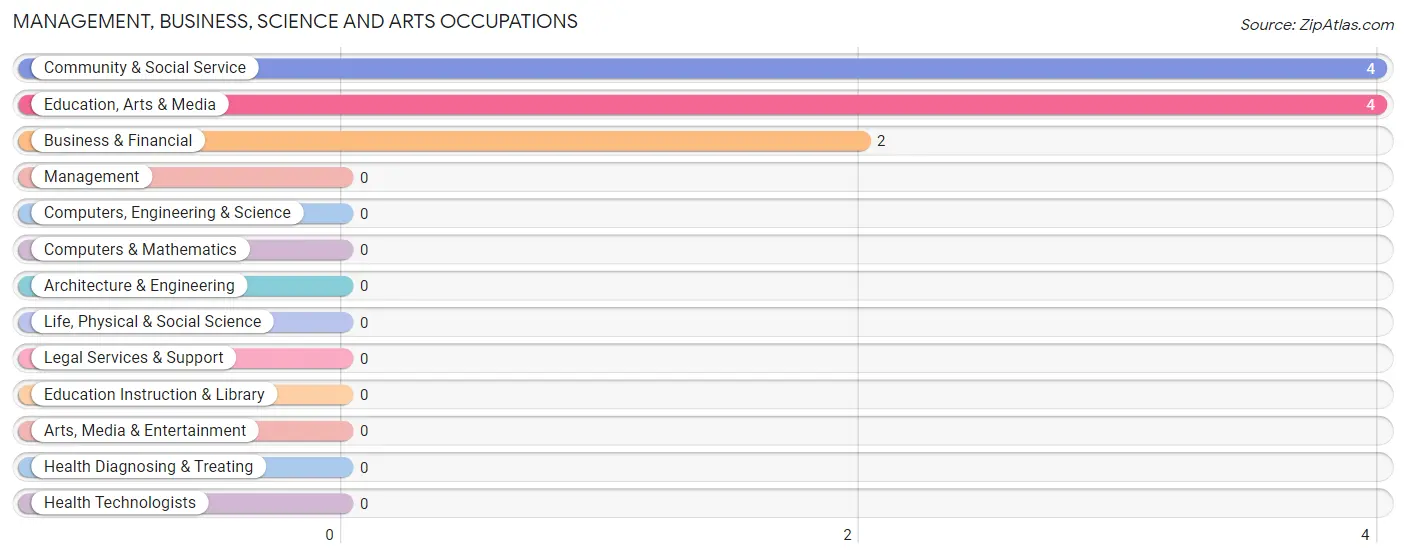
Management, Business, Science and Arts Occupations by Sex
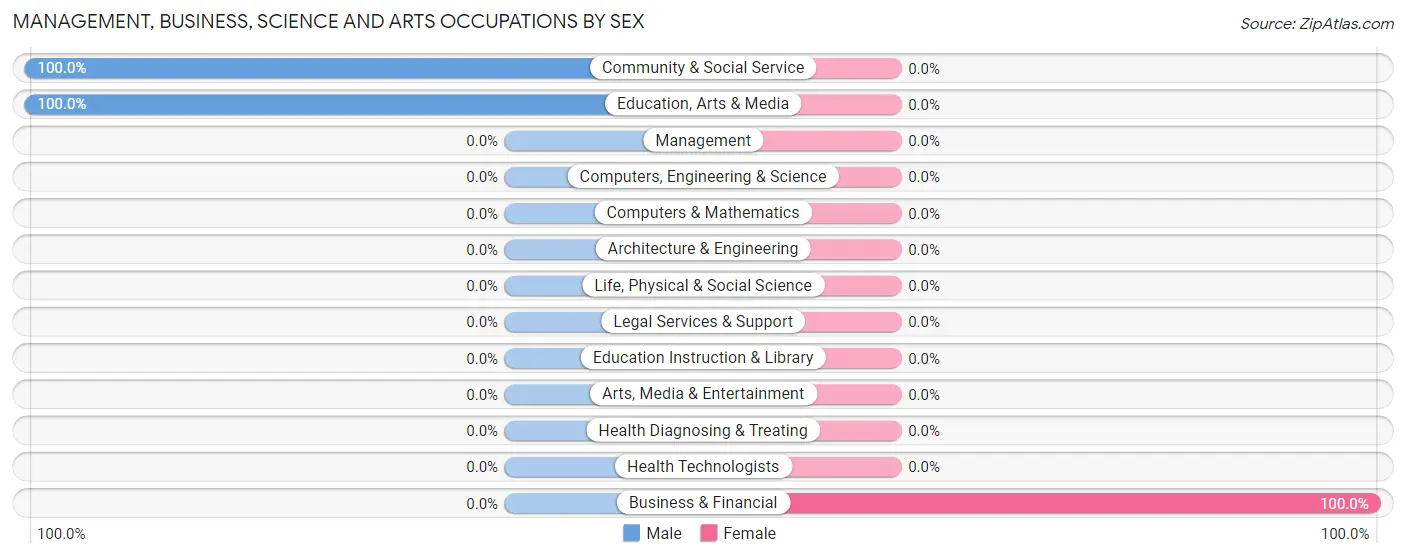
| Occupation | Male | Female |
| Management | 0 (0.0%) | 0 (0.0%) |
| Business & Financial | 0 (0.0%) | 2 (100.0%) |
| Computers, Engineering & Science | 0 (0.0%) | 0 (0.0%) |
| Computers & Mathematics | 0 (0.0%) | 0 (0.0%) |
| Architecture & Engineering | 0 (0.0%) | 0 (0.0%) |
| Life, Physical & Social Science | 0 (0.0%) | 0 (0.0%) |
| Community & Social Service | 4 (100.0%) | 0 (0.0%) |
| Education, Arts & Media | 4 (100.0%) | 0 (0.0%) |
| Legal Services & Support | 0 (0.0%) | 0 (0.0%) |
| Education Instruction & Library | 0 (0.0%) | 0 (0.0%) |
| Arts, Media & Entertainment | 0 (0.0%) | 0 (0.0%) |
| Health Diagnosing & Treating | 0 (0.0%) | 0 (0.0%) |
| Health Technologists | 0 (0.0%) | 0 (0.0%) |
| Total (Category) | 4 (66.7%) | 2 (33.3%) |
| Total (Overall) | 21 (61.8%) | 13 (38.2%) |
Services Occupations
The most common Services occupations in Brownington are , and Cleaning & Maintenance (7 | 20.6%).
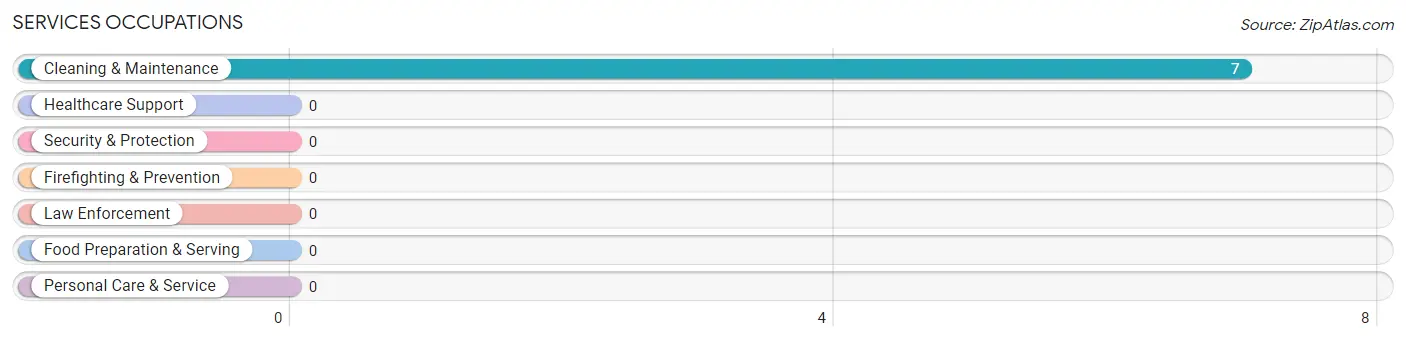
Services Occupations by Sex
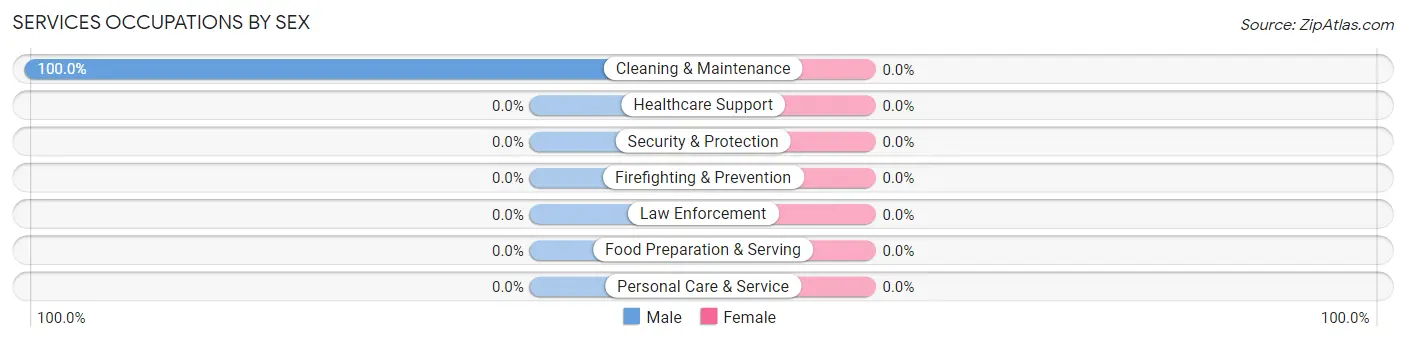
| Occupation | Male | Female |
| Healthcare Support | 0 (0.0%) | 0 (0.0%) |
| Security & Protection | 0 (0.0%) | 0 (0.0%) |
| Firefighting & Prevention | 0 (0.0%) | 0 (0.0%) |
| Law Enforcement | 0 (0.0%) | 0 (0.0%) |
| Food Preparation & Serving | 0 (0.0%) | 0 (0.0%) |
| Cleaning & Maintenance | 7 (100.0%) | 0 (0.0%) |
| Personal Care & Service | 0 (0.0%) | 0 (0.0%) |
| Total (Category) | 7 (100.0%) | 0 (0.0%) |
| Total (Overall) | 21 (61.8%) | 13 (38.2%) |
Sales and Office Occupations
The most common Sales and Office occupations in Brownington are Sales & Related (7 | 20.6%), and Office & Administration (1 | 2.9%).
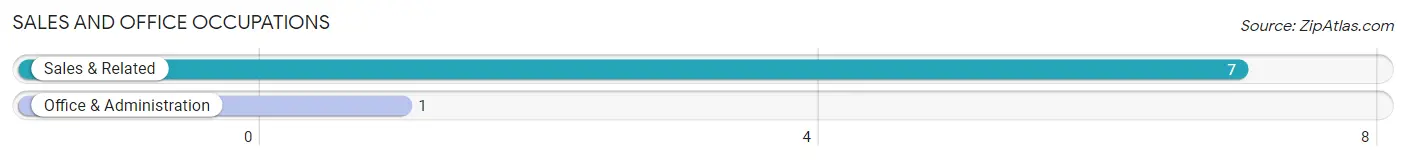
Sales and Office Occupations by Sex
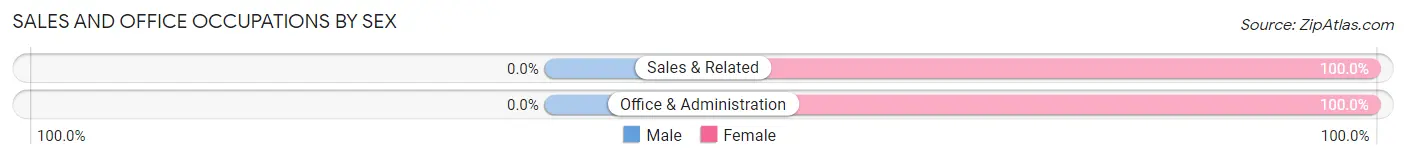
| Occupation | Male | Female |
| Sales & Related | 0 (0.0%) | 7 (100.0%) |
| Office & Administration | 0 (0.0%) | 1 (100.0%) |
| Total (Category) | 0 (0.0%) | 8 (100.0%) |
| Total (Overall) | 21 (61.8%) | 13 (38.2%) |
Natural Resources, Construction and Maintenance Occupations
The most common Natural Resources, Construction and Maintenance occupations in Brownington are Construction & Extraction (4 | 11.8%), and Installation, Maintenance & Repair (3 | 8.8%).
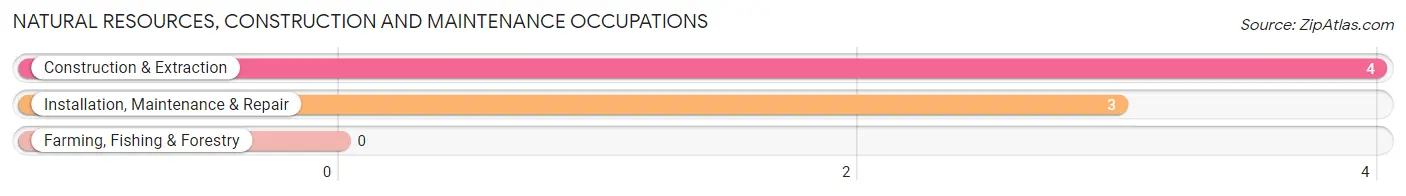
Natural Resources, Construction and Maintenance Occupations by Sex
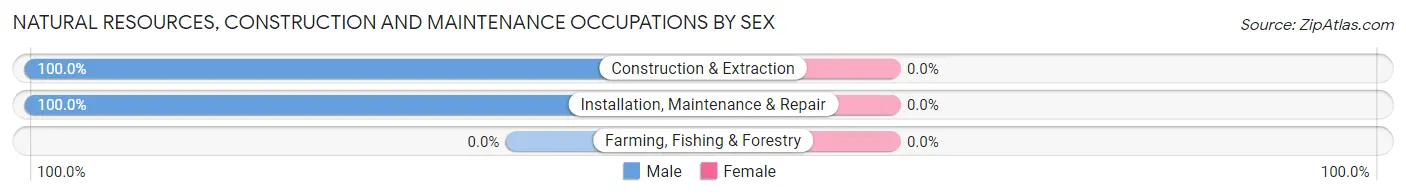
| Occupation | Male | Female |
| Farming, Fishing & Forestry | 0 (0.0%) | 0 (0.0%) |
| Construction & Extraction | 4 (100.0%) | 0 (0.0%) |
| Installation, Maintenance & Repair | 3 (100.0%) | 0 (0.0%) |
| Total (Category) | 7 (100.0%) | 0 (0.0%) |
| Total (Overall) | 21 (61.8%) | 13 (38.2%) |
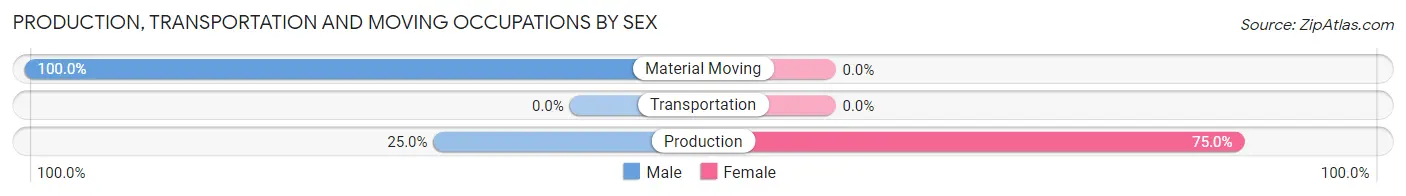
Production, Transportation and Moving Occupations
The most common Production, Transportation and Moving occupations in Brownington are Production (4 | 11.8%), and Material Moving (2 | 5.9%).
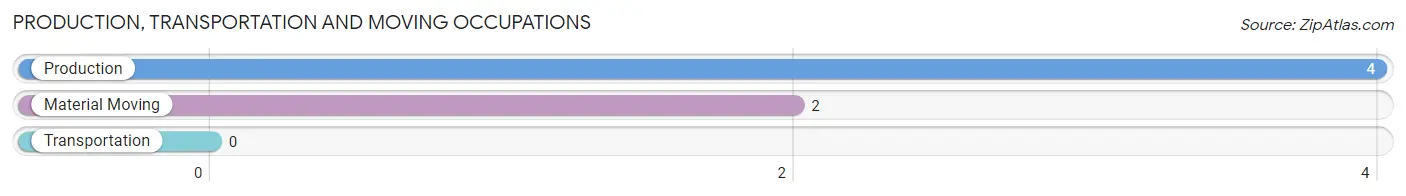
Production, Transportation and Moving Occupations by Sex
| Occupation | Male | Female |
| Production | 1 (25.0%) | 3 (75.0%) |
| Transportation | 0 (0.0%) | 0 (0.0%) |
| Material Moving | 2 (100.0%) | 0 (0.0%) |
| Total (Category) | 3 (50.0%) | 3 (50.0%) |
| Total (Overall) | 21 (61.8%) | 13 (38.2%) |
Employment Industries by Sex in Brownington
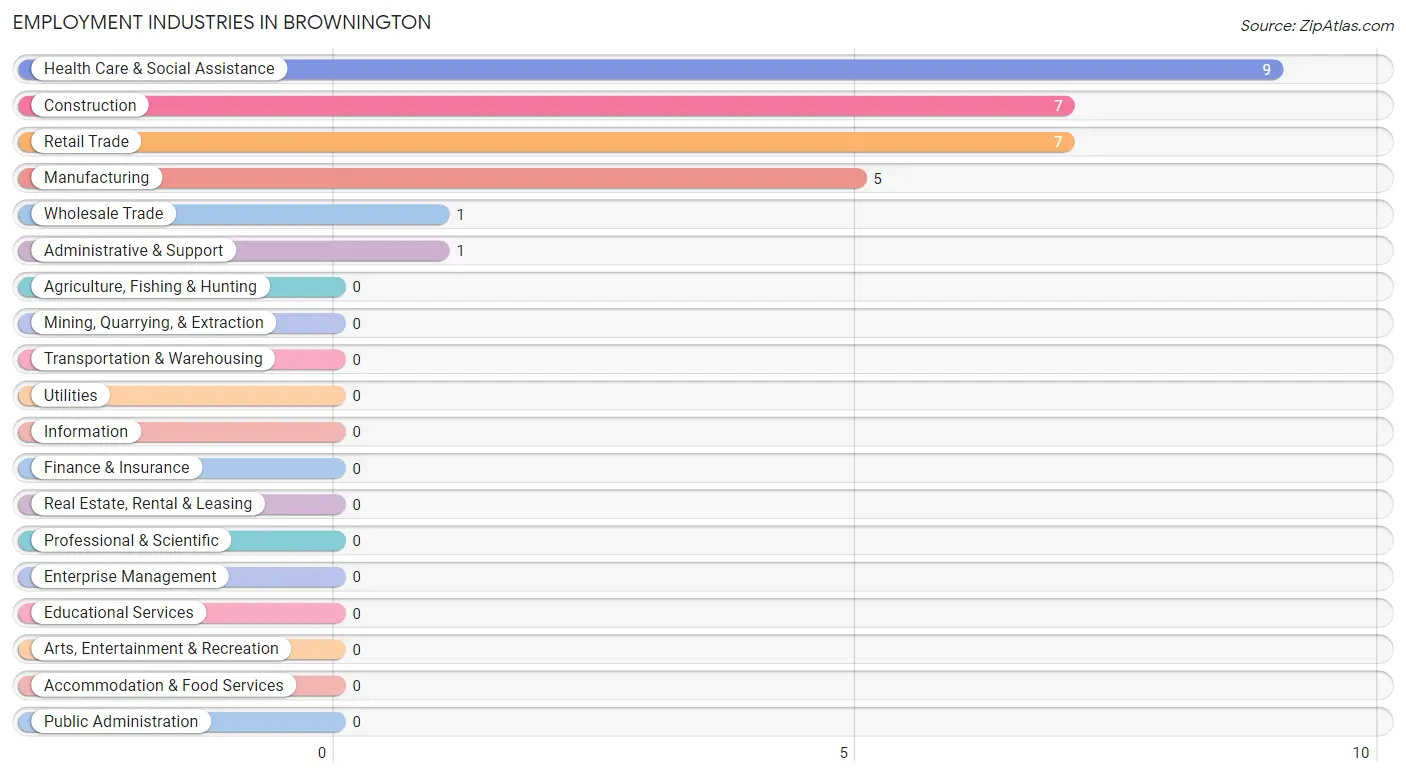
Employment Industries in Brownington
The major employment industries in Brownington include Health Care & Social Assistance (9 | 26.5%), Construction (7 | 20.6%), Retail Trade (7 | 20.6%), Manufacturing (5 | 14.7%), and Wholesale Trade (1 | 2.9%).
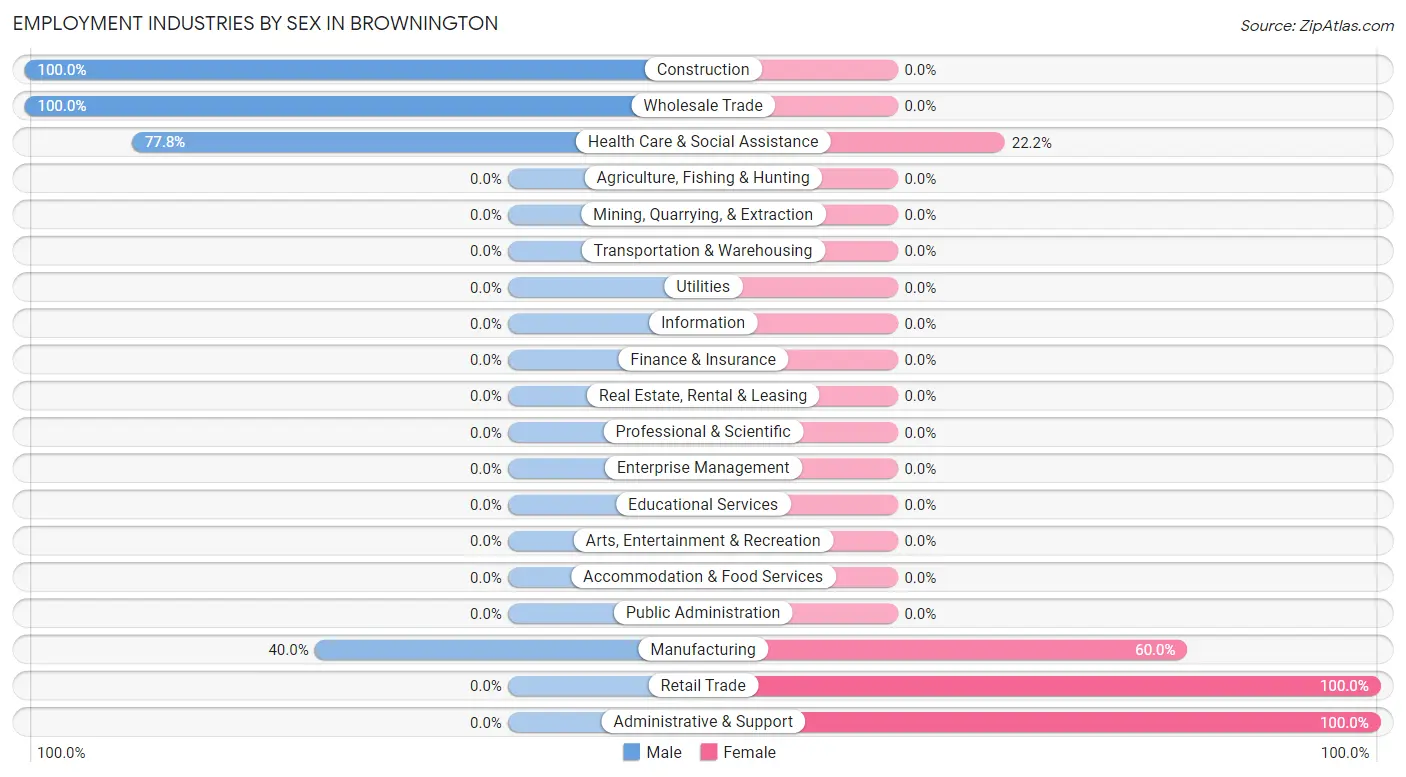
Employment Industries by Sex in Brownington
The Brownington industries that see more men than women are Construction (100.0%), Wholesale Trade (100.0%), and Health Care & Social Assistance (77.8%), whereas the industries that tend to have a higher number of women are Retail Trade (100.0%), Administrative & Support (100.0%), and Manufacturing (60.0%).
| Industry | Male | Female |
| Agriculture, Fishing & Hunting | 0 (0.0%) | 0 (0.0%) |
| Mining, Quarrying, & Extraction | 0 (0.0%) | 0 (0.0%) |
| Construction | 7 (100.0%) | 0 (0.0%) |
| Manufacturing | 2 (40.0%) | 3 (60.0%) |
| Wholesale Trade | 1 (100.0%) | 0 (0.0%) |
| Retail Trade | 0 (0.0%) | 7 (100.0%) |
| Transportation & Warehousing | 0 (0.0%) | 0 (0.0%) |
| Utilities | 0 (0.0%) | 0 (0.0%) |
| Information | 0 (0.0%) | 0 (0.0%) |
| Finance & Insurance | 0 (0.0%) | 0 (0.0%) |
| Real Estate, Rental & Leasing | 0 (0.0%) | 0 (0.0%) |
| Professional & Scientific | 0 (0.0%) | 0 (0.0%) |
| Enterprise Management | 0 (0.0%) | 0 (0.0%) |
| Administrative & Support | 0 (0.0%) | 1 (100.0%) |
| Educational Services | 0 (0.0%) | 0 (0.0%) |
| Health Care & Social Assistance | 7 (77.8%) | 2 (22.2%) |
| Arts, Entertainment & Recreation | 0 (0.0%) | 0 (0.0%) |
| Accommodation & Food Services | 0 (0.0%) | 0 (0.0%) |
| Public Administration | 0 (0.0%) | 0 (0.0%) |
| Total | 21 (61.8%) | 13 (38.2%) |
Education in Brownington
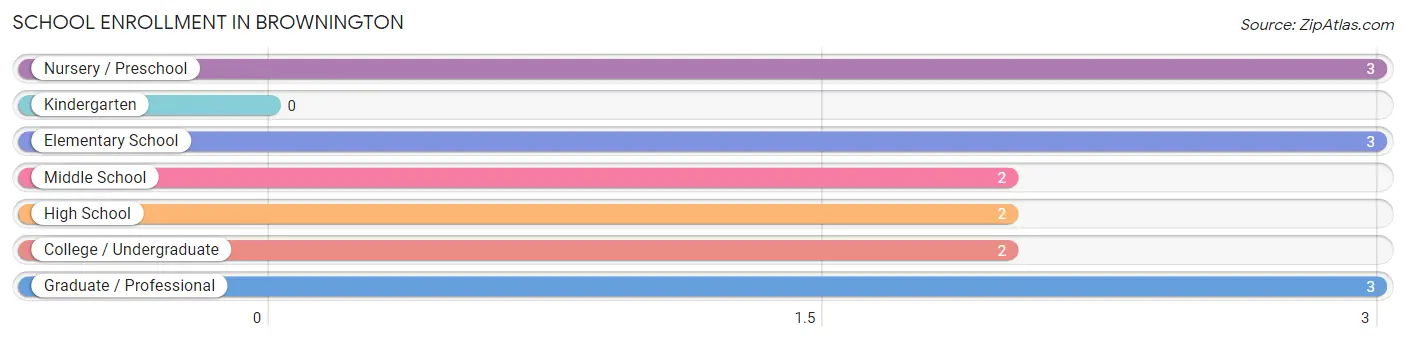
School Enrollment in Brownington
The most common levels of schooling among the 15 students in Brownington are nursery / preschool (3 | 20.0%), elementary school (3 | 20.0%), and graduate / professional (3 | 20.0%).
| School Level | # Students | % Students |
| Nursery / Preschool | 3 | 20.0% |
| Kindergarten | 0 | 0.0% |
| Elementary School | 3 | 20.0% |
| Middle School | 2 | 13.3% |
| High School | 2 | 13.3% |
| College / Undergraduate | 2 | 13.3% |
| Graduate / Professional | 3 | 20.0% |
| Total | 15 | 100.0% |
School Enrollment by Age by Funding Source in Brownington
Out of a total of 15 students who are enrolled in schools in Brownington, 3 (20.0%) attend a private institution, while the remaining 12 (80.0%) are enrolled in public schools. The age group of 20 to 24 year olds has the highest likelihood of being enrolled in private schools, with 3 (60.0% in the age bracket) enrolled. Conversely, the age group of 5 to 9 year old has the lowest likelihood of being enrolled in a private school, with 6 (100.0% in the age bracket) attending a public institution.
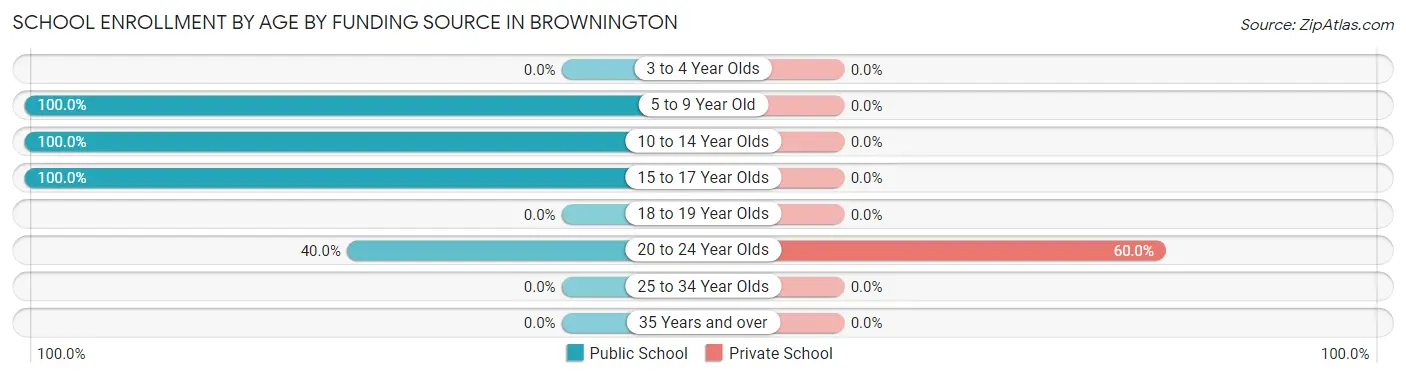
| Age Bracket | Public School | Private School |
| 3 to 4 Year Olds | 0 (0.0%) | 0 (0.0%) |
| 5 to 9 Year Old | 6 (100.0%) | 0 (0.0%) |
| 10 to 14 Year Olds | 2 (100.0%) | 0 (0.0%) |
| 15 to 17 Year Olds | 2 (100.0%) | 0 (0.0%) |
| 18 to 19 Year Olds | 0 (0.0%) | 0 (0.0%) |
| 20 to 24 Year Olds | 2 (40.0%) | 3 (60.0%) |
| 25 to 34 Year Olds | 0 (0.0%) | 0 (0.0%) |
| 35 Years and over | 0 (0.0%) | 0 (0.0%) |
| Total | 12 (80.0%) | 3 (20.0%) |
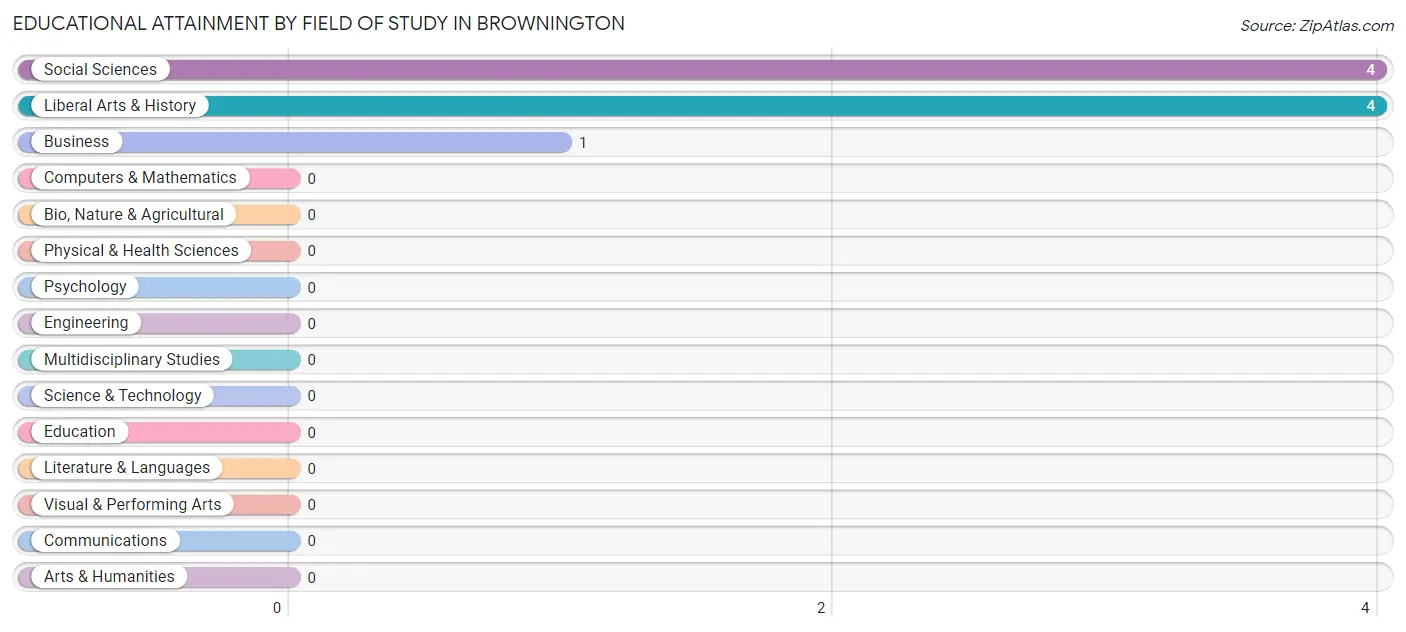
Educational Attainment by Field of Study in Brownington
Social sciences (4 | 44.4%), liberal arts & history (4 | 44.4%), and business (1 | 11.1%) are the most common fields of study among 9 individuals in Brownington who have obtained a bachelor's degree or higher.
| Field of Study | # Graduates | % Graduates |
| Computers & Mathematics | 0 | 0.0% |
| Bio, Nature & Agricultural | 0 | 0.0% |
| Physical & Health Sciences | 0 | 0.0% |
| Psychology | 0 | 0.0% |
| Social Sciences | 4 | 44.4% |
| Engineering | 0 | 0.0% |
| Multidisciplinary Studies | 0 | 0.0% |
| Science & Technology | 0 | 0.0% |
| Business | 1 | 11.1% |
| Education | 0 | 0.0% |
| Literature & Languages | 0 | 0.0% |
| Liberal Arts & History | 4 | 44.4% |
| Visual & Performing Arts | 0 | 0.0% |
| Communications | 0 | 0.0% |
| Arts & Humanities | 0 | 0.0% |
| Total | 9 | 100.0% |
Transportation & Commute in Brownington
Vehicle Availability by Sex in Brownington
The most prevalent vehicle ownership categories in Brownington are males with 2 vehicles (11, accounting for 52.4%) and females with 2 vehicles (7, making up 84.6%).
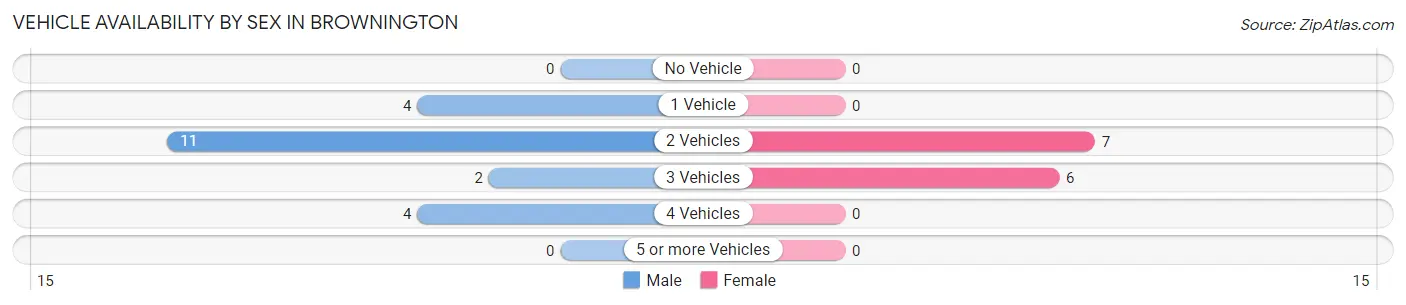
| Vehicles Available | Male | Female |
| No Vehicle | 0 (0.0%) | 0 (0.0%) |
| 1 Vehicle | 4 (19.1%) | 0 (0.0%) |
| 2 Vehicles | 11 (52.4%) | 7 (53.8%) |
| 3 Vehicles | 2 (9.5%) | 6 (46.2%) |
| 4 Vehicles | 4 (19.1%) | 0 (0.0%) |
| 5 or more Vehicles | 0 (0.0%) | 0 (0.0%) |
| Total | 21 (100.0%) | 13 (100.0%) |
Commute Time in Brownington
The most frequently occuring commute durations in Brownington are 15 to 19 minutes (12 commuters, 42.9%), 45 to 59 minutes (5 commuters, 17.9%), and 30 to 34 minutes (3 commuters, 10.7%).
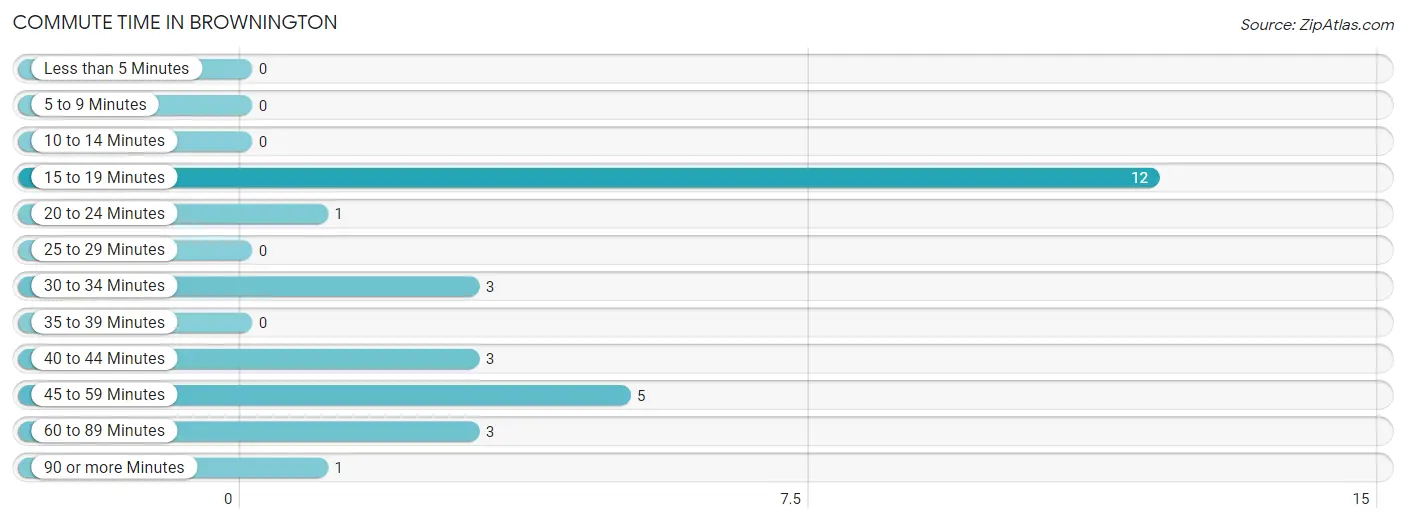
| Commute Time | # Commuters | % Commuters |
| Less than 5 Minutes | 0 | 0.0% |
| 5 to 9 Minutes | 0 | 0.0% |
| 10 to 14 Minutes | 0 | 0.0% |
| 15 to 19 Minutes | 12 | 42.9% |
| 20 to 24 Minutes | 1 | 3.6% |
| 25 to 29 Minutes | 0 | 0.0% |
| 30 to 34 Minutes | 3 | 10.7% |
| 35 to 39 Minutes | 0 | 0.0% |
| 40 to 44 Minutes | 3 | 10.7% |
| 45 to 59 Minutes | 5 | 17.9% |
| 60 to 89 Minutes | 3 | 10.7% |
| 90 or more Minutes | 1 | 3.6% |
Commute Time by Sex in Brownington
The most common commute times in Brownington are 15 to 19 minutes (7 commuters, 41.2%) for males and 15 to 19 minutes (5 commuters, 45.5%) for females.
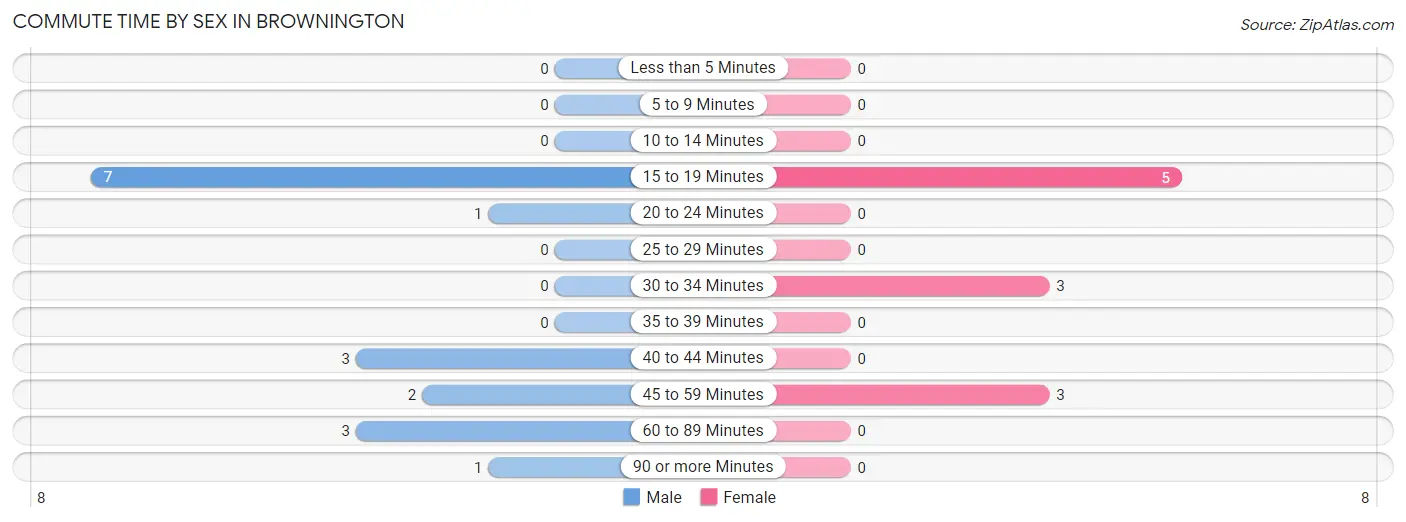
| Commute Time | Male | Female |
| Less than 5 Minutes | 0 (0.0%) | 0 (0.0%) |
| 5 to 9 Minutes | 0 (0.0%) | 0 (0.0%) |
| 10 to 14 Minutes | 0 (0.0%) | 0 (0.0%) |
| 15 to 19 Minutes | 7 (41.2%) | 5 (45.5%) |
| 20 to 24 Minutes | 1 (5.9%) | 0 (0.0%) |
| 25 to 29 Minutes | 0 (0.0%) | 0 (0.0%) |
| 30 to 34 Minutes | 0 (0.0%) | 3 (27.3%) |
| 35 to 39 Minutes | 0 (0.0%) | 0 (0.0%) |
| 40 to 44 Minutes | 3 (17.6%) | 0 (0.0%) |
| 45 to 59 Minutes | 2 (11.8%) | 3 (27.3%) |
| 60 to 89 Minutes | 3 (17.6%) | 0 (0.0%) |
| 90 or more Minutes | 1 (5.9%) | 0 (0.0%) |
Time of Departure to Work by Sex in Brownington
The most frequent times of departure to work in Brownington are 7:30 AM to 7:59 AM (7, 41.2%) for males and 6:30 AM to 6:59 AM (5, 45.5%) for females.
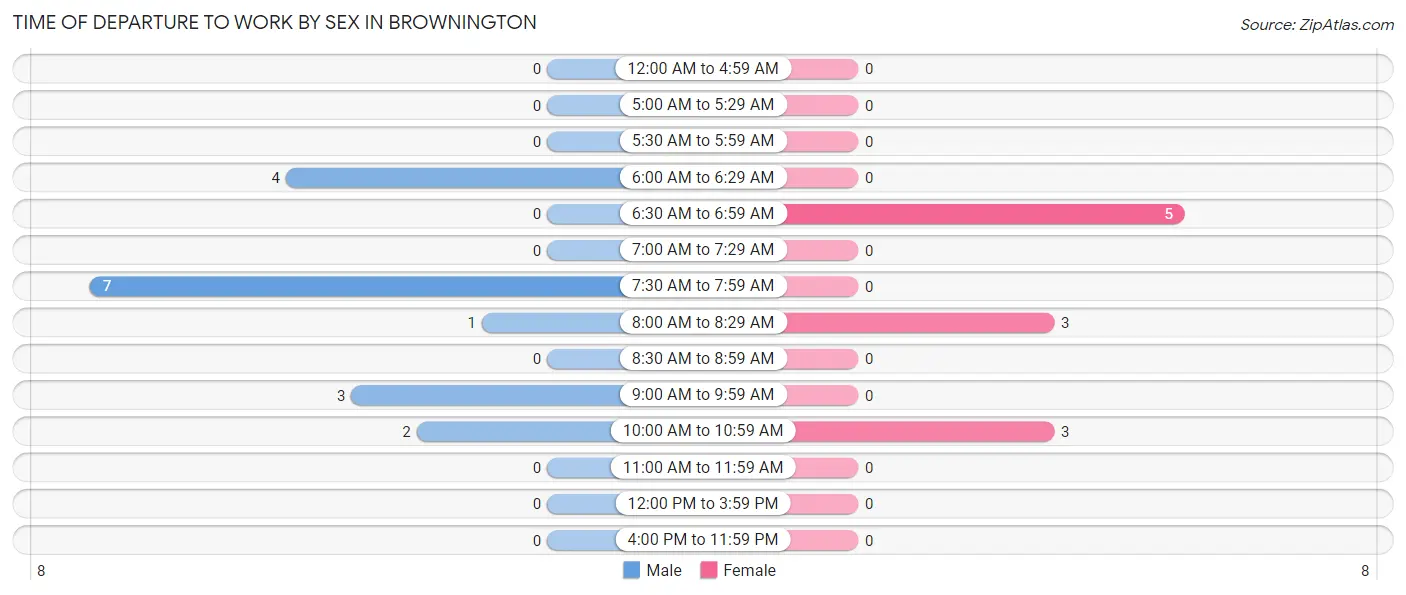
| Time of Departure | Male | Female |
| 12:00 AM to 4:59 AM | 0 (0.0%) | 0 (0.0%) |
| 5:00 AM to 5:29 AM | 0 (0.0%) | 0 (0.0%) |
| 5:30 AM to 5:59 AM | 0 (0.0%) | 0 (0.0%) |
| 6:00 AM to 6:29 AM | 4 (23.5%) | 0 (0.0%) |
| 6:30 AM to 6:59 AM | 0 (0.0%) | 5 (45.5%) |
| 7:00 AM to 7:29 AM | 0 (0.0%) | 0 (0.0%) |
| 7:30 AM to 7:59 AM | 7 (41.2%) | 0 (0.0%) |
| 8:00 AM to 8:29 AM | 1 (5.9%) | 3 (27.3%) |
| 8:30 AM to 8:59 AM | 0 (0.0%) | 0 (0.0%) |
| 9:00 AM to 9:59 AM | 3 (17.6%) | 0 (0.0%) |
| 10:00 AM to 10:59 AM | 2 (11.8%) | 3 (27.3%) |
| 11:00 AM to 11:59 AM | 0 (0.0%) | 0 (0.0%) |
| 12:00 PM to 3:59 PM | 0 (0.0%) | 0 (0.0%) |
| 4:00 PM to 11:59 PM | 0 (0.0%) | 0 (0.0%) |
| Total | 17 (100.0%) | 11 (100.0%) |
Housing Occupancy in Brownington
Occupancy by Ownership in Brownington
Of the total 38 dwellings in Brownington, owner-occupied units account for 27 (71.1%), while renter-occupied units make up 11 (28.9%).
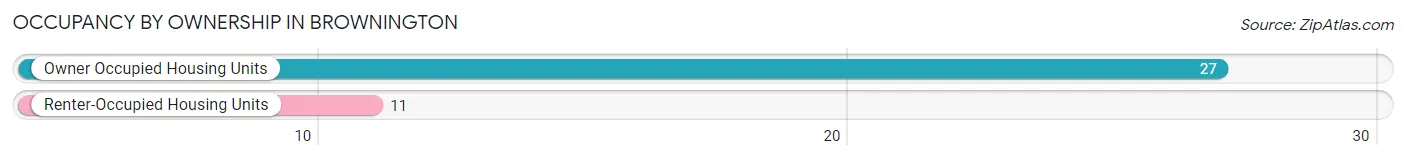
| Occupancy | # Housing Units | % Housing Units |
| Owner Occupied Housing Units | 27 | 71.1% |
| Renter-Occupied Housing Units | 11 | 28.9% |
| Total Occupied Housing Units | 38 | 100.0% |
Occupancy by Household Size in Brownington
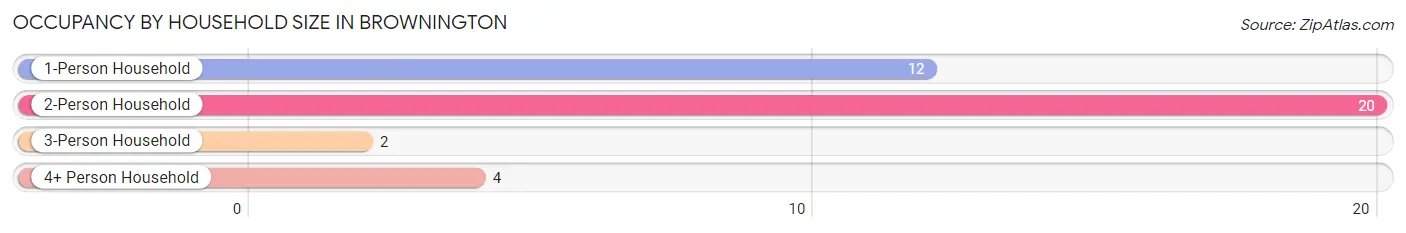
| Household Size | # Housing Units | % Housing Units |
| 1-Person Household | 12 | 31.6% |
| 2-Person Household | 20 | 52.6% |
| 3-Person Household | 2 | 5.3% |
| 4+ Person Household | 4 | 10.5% |
| Total Housing Units | 38 | 100.0% |
Occupancy by Ownership by Household Size in Brownington
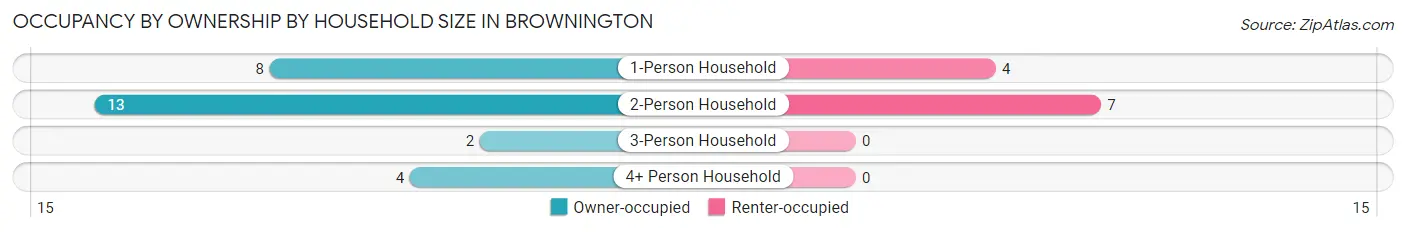
| Household Size | Owner-occupied | Renter-occupied |
| 1-Person Household | 8 (66.7%) | 4 (33.3%) |
| 2-Person Household | 13 (65.0%) | 7 (35.0%) |
| 3-Person Household | 2 (100.0%) | 0 (0.0%) |
| 4+ Person Household | 4 (100.0%) | 0 (0.0%) |
| Total Housing Units | 27 (71.1%) | 11 (28.9%) |
Occupancy by Educational Attainment in Brownington
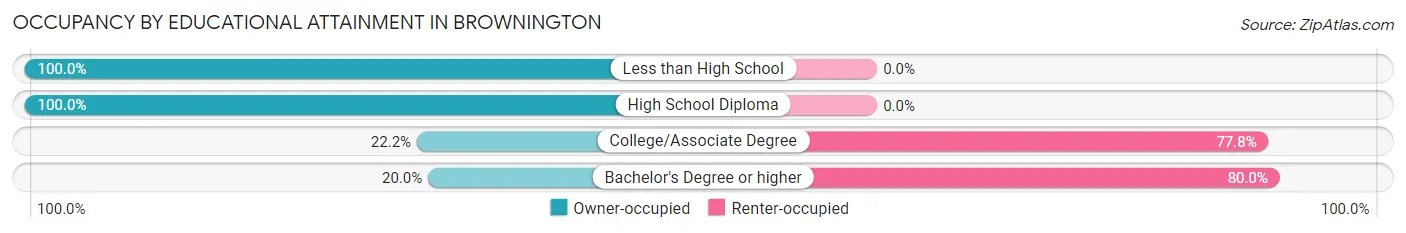
| Household Size | Owner-occupied | Renter-occupied |
| Less than High School | 8 (100.0%) | 0 (0.0%) |
| High School Diploma | 16 (100.0%) | 0 (0.0%) |
| College/Associate Degree | 2 (22.2%) | 7 (77.8%) |
| Bachelor's Degree or higher | 1 (20.0%) | 4 (80.0%) |
Occupancy by Age of Householder in Brownington
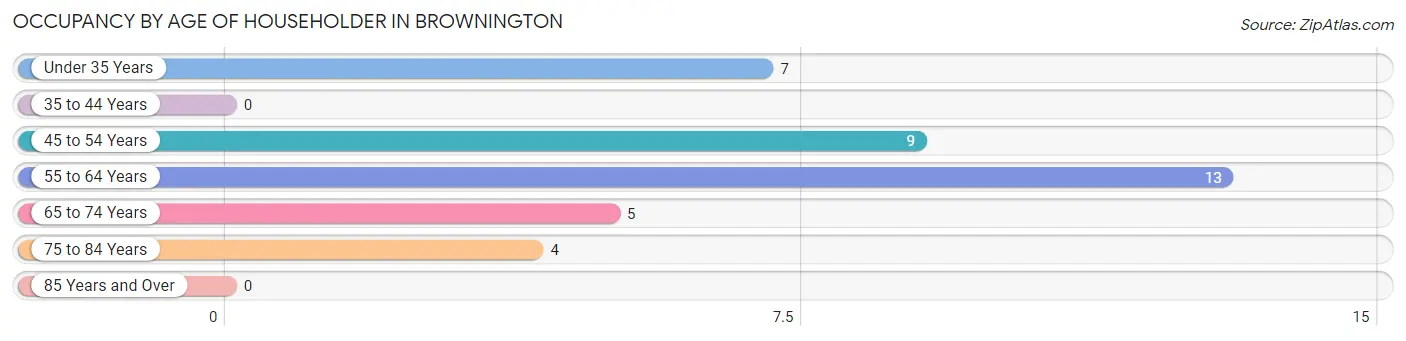
| Age Bracket | # Households | % Households |
| Under 35 Years | 7 | 18.4% |
| 35 to 44 Years | 0 | 0.0% |
| 45 to 54 Years | 9 | 23.7% |
| 55 to 64 Years | 13 | 34.2% |
| 65 to 74 Years | 5 | 13.2% |
| 75 to 84 Years | 4 | 10.5% |
| 85 Years and Over | 0 | 0.0% |
| Total | 38 | 100.0% |
Housing Finances in Brownington
Median Income by Occupancy in Brownington
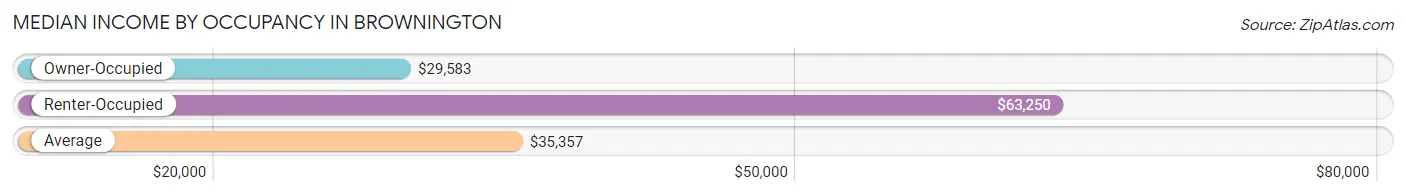
| Occupancy Type | # Households | Median Income |
| Owner-Occupied | 27 (71.1%) | $29,583 |
| Renter-Occupied | 11 (28.9%) | $63,250 |
| Average | 38 (100.0%) | $35,357 |
Occupancy by Householder Income Bracket in Brownington
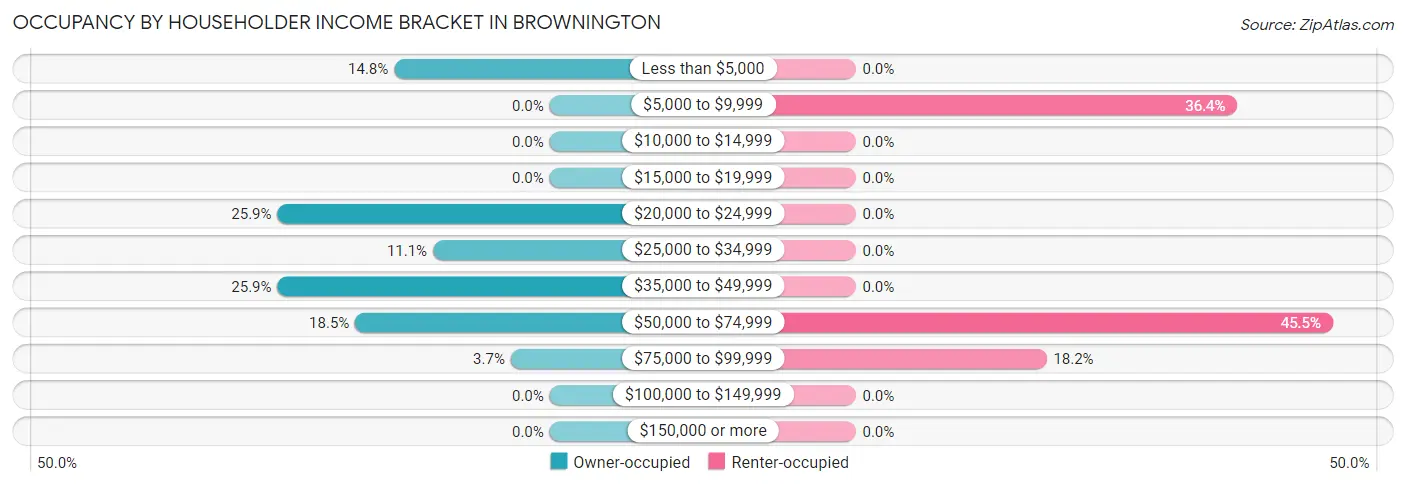
| Income Bracket | Owner-occupied | Renter-occupied |
| Less than $5,000 | 4 (14.8%) | 0 (0.0%) |
| $5,000 to $9,999 | 0 (0.0%) | 4 (36.4%) |
| $10,000 to $14,999 | 0 (0.0%) | 0 (0.0%) |
| $15,000 to $19,999 | 0 (0.0%) | 0 (0.0%) |
| $20,000 to $24,999 | 7 (25.9%) | 0 (0.0%) |
| $25,000 to $34,999 | 3 (11.1%) | 0 (0.0%) |
| $35,000 to $49,999 | 7 (25.9%) | 0 (0.0%) |
| $50,000 to $74,999 | 5 (18.5%) | 5 (45.5%) |
| $75,000 to $99,999 | 1 (3.7%) | 2 (18.2%) |
| $100,000 to $149,999 | 0 (0.0%) | 0 (0.0%) |
| $150,000 or more | 0 (0.0%) | 0 (0.0%) |
| Total | 27 (100.0%) | 11 (100.0%) |
Monthly Housing Cost Tiers in Brownington
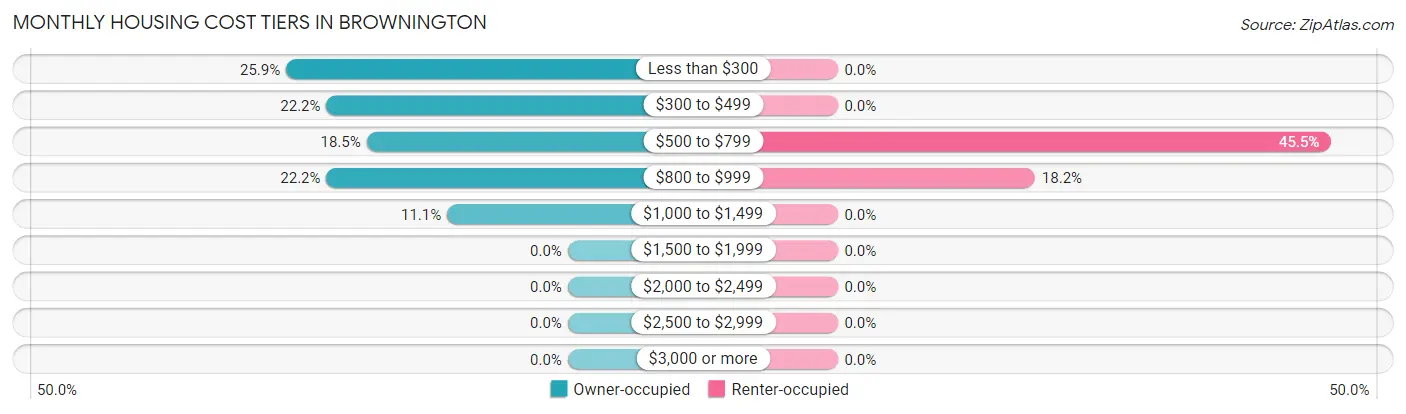
| Monthly Cost | Owner-occupied | Renter-occupied |
| Less than $300 | 7 (25.9%) | 0 (0.0%) |
| $300 to $499 | 6 (22.2%) | 0 (0.0%) |
| $500 to $799 | 5 (18.5%) | 5 (45.5%) |
| $800 to $999 | 6 (22.2%) | 2 (18.2%) |
| $1,000 to $1,499 | 3 (11.1%) | 0 (0.0%) |
| $1,500 to $1,999 | 0 (0.0%) | 0 (0.0%) |
| $2,000 to $2,499 | 0 (0.0%) | 0 (0.0%) |
| $2,500 to $2,999 | 0 (0.0%) | 0 (0.0%) |
| $3,000 or more | 0 (0.0%) | 0 (0.0%) |
| Total | 27 (100.0%) | 11 (100.0%) |
Physical Housing Characteristics in Brownington
Housing Structures in Brownington
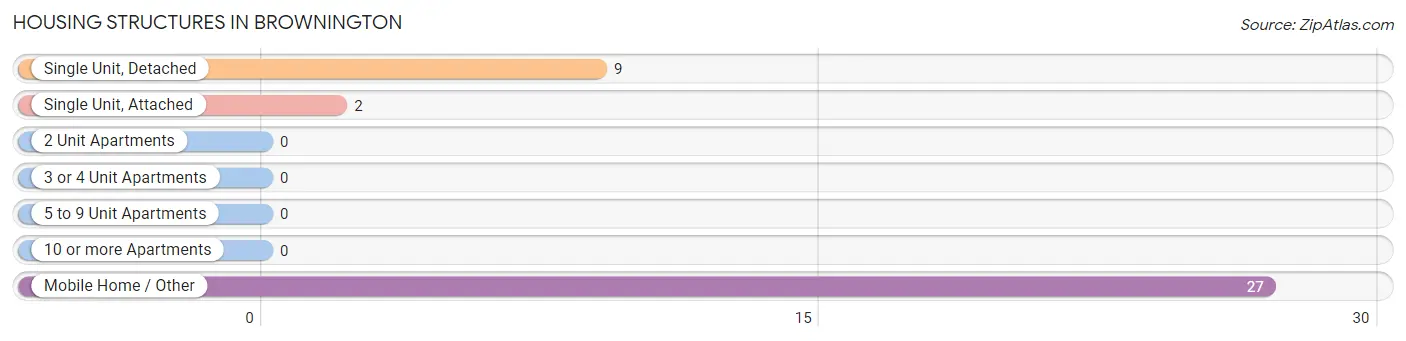
| Structure Type | # Housing Units | % Housing Units |
| Single Unit, Detached | 9 | 23.7% |
| Single Unit, Attached | 2 | 5.3% |
| 2 Unit Apartments | 0 | 0.0% |
| 3 or 4 Unit Apartments | 0 | 0.0% |
| 5 to 9 Unit Apartments | 0 | 0.0% |
| 10 or more Apartments | 0 | 0.0% |
| Mobile Home / Other | 27 | 71.1% |
| Total | 38 | 100.0% |
Housing Structures by Occupancy in Brownington
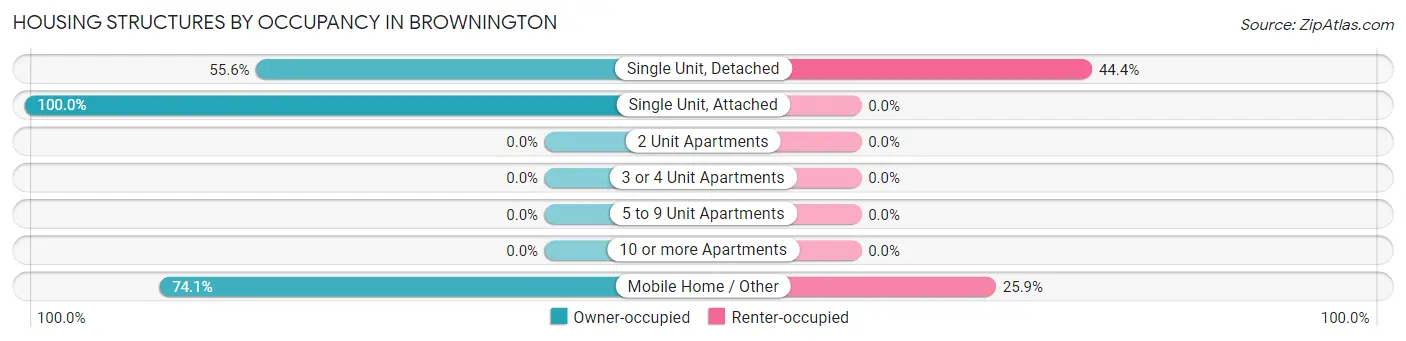
| Structure Type | Owner-occupied | Renter-occupied |
| Single Unit, Detached | 5 (55.6%) | 4 (44.4%) |
| Single Unit, Attached | 2 (100.0%) | 0 (0.0%) |
| 2 Unit Apartments | 0 (0.0%) | 0 (0.0%) |
| 3 or 4 Unit Apartments | 0 (0.0%) | 0 (0.0%) |
| 5 to 9 Unit Apartments | 0 (0.0%) | 0 (0.0%) |
| 10 or more Apartments | 0 (0.0%) | 0 (0.0%) |
| Mobile Home / Other | 20 (74.1%) | 7 (25.9%) |
| Total | 27 (71.1%) | 11 (28.9%) |
Housing Structures by Number of Rooms in Brownington
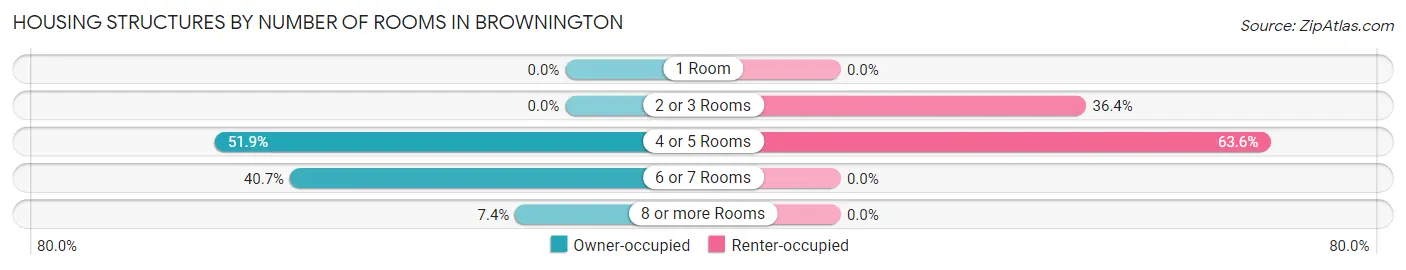
| Number of Rooms | Owner-occupied | Renter-occupied |
| 1 Room | 0 (0.0%) | 0 (0.0%) |
| 2 or 3 Rooms | 0 (0.0%) | 4 (36.4%) |
| 4 or 5 Rooms | 14 (51.8%) | 7 (63.6%) |
| 6 or 7 Rooms | 11 (40.7%) | 0 (0.0%) |
| 8 or more Rooms | 2 (7.4%) | 0 (0.0%) |
| Total | 27 (100.0%) | 11 (100.0%) |
Housing Structure by Heating Type in Brownington
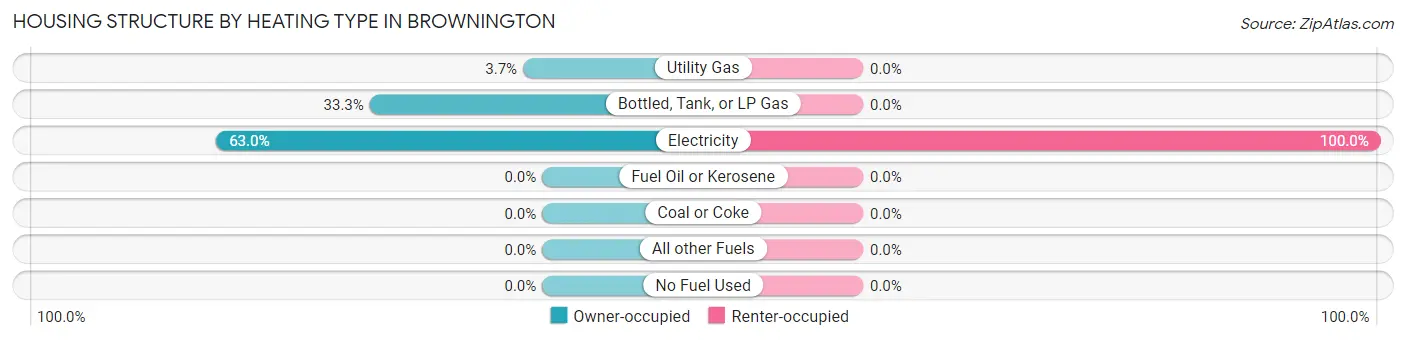
| Heating Type | Owner-occupied | Renter-occupied |
| Utility Gas | 1 (3.7%) | 0 (0.0%) |
| Bottled, Tank, or LP Gas | 9 (33.3%) | 0 (0.0%) |
| Electricity | 17 (63.0%) | 11 (100.0%) |
| Fuel Oil or Kerosene | 0 (0.0%) | 0 (0.0%) |
| Coal or Coke | 0 (0.0%) | 0 (0.0%) |
| All other Fuels | 0 (0.0%) | 0 (0.0%) |
| No Fuel Used | 0 (0.0%) | 0 (0.0%) |
| Total | 27 (100.0%) | 11 (100.0%) |
Household Vehicle Usage in Brownington
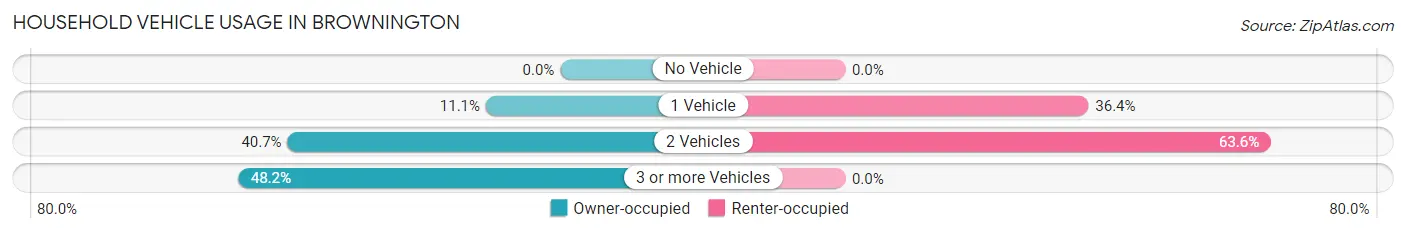
| Vehicles per Household | Owner-occupied | Renter-occupied |
| No Vehicle | 0 (0.0%) | 0 (0.0%) |
| 1 Vehicle | 3 (11.1%) | 4 (36.4%) |
| 2 Vehicles | 11 (40.7%) | 7 (63.6%) |
| 3 or more Vehicles | 13 (48.1%) | 0 (0.0%) |
| Total | 27 (100.0%) | 11 (100.0%) |
Real Estate & Mortgages in Brownington
Real Estate and Mortgage Overview in Brownington
| Characteristic | Without Mortgage | With Mortgage |
| Housing Units | 21 | 6 |
| Median Property Value | $65,800 | $0 |
| Median Household Income | $29,583 | $0 |
| Monthly Housing Costs | $450 | $0 |
| Real Estate Taxes | $1,000 | $0 |
Property Value by Mortgage Status in Brownington
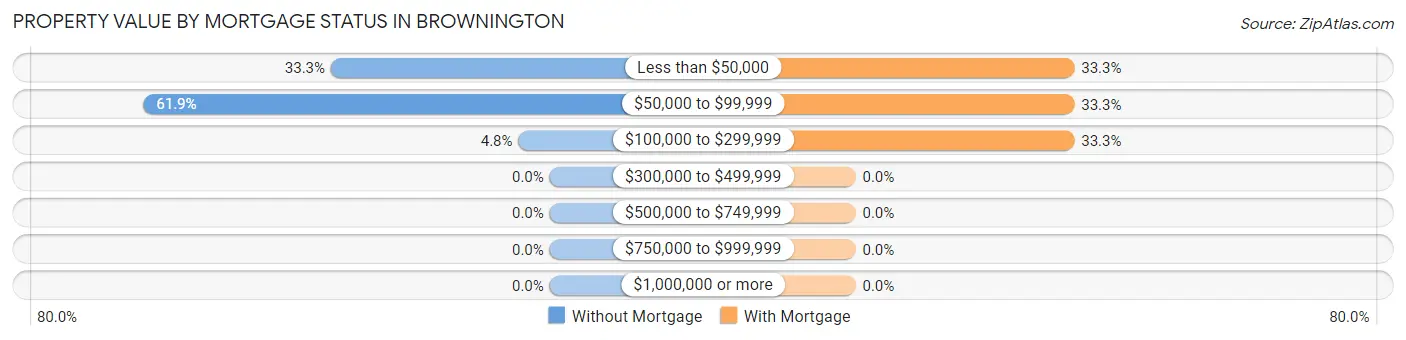
| Property Value | Without Mortgage | With Mortgage |
| Less than $50,000 | 7 (33.3%) | 2 (33.3%) |
| $50,000 to $99,999 | 13 (61.9%) | 2 (33.3%) |
| $100,000 to $299,999 | 1 (4.8%) | 2 (33.3%) |
| $300,000 to $499,999 | 0 (0.0%) | 0 (0.0%) |
| $500,000 to $749,999 | 0 (0.0%) | 0 (0.0%) |
| $750,000 to $999,999 | 0 (0.0%) | 0 (0.0%) |
| $1,000,000 or more | 0 (0.0%) | 0 (0.0%) |
| Total | 21 (100.0%) | 6 (100.0%) |
Household Income by Mortgage Status in Brownington
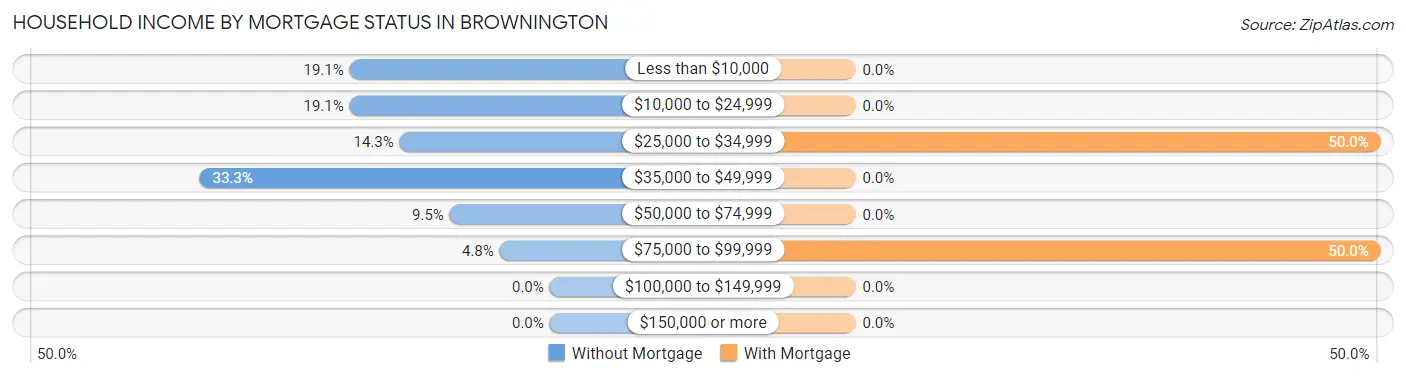
| Household Income | Without Mortgage | With Mortgage |
| Less than $10,000 | 4 (19.1%) | 0 (0.0%) |
| $10,000 to $24,999 | 4 (19.1%) | 0 (0.0%) |
| $25,000 to $34,999 | 3 (14.3%) | 3 (50.0%) |
| $35,000 to $49,999 | 7 (33.3%) | 0 (0.0%) |
| $50,000 to $74,999 | 2 (9.5%) | 0 (0.0%) |
| $75,000 to $99,999 | 1 (4.8%) | 3 (50.0%) |
| $100,000 to $149,999 | 0 (0.0%) | 0 (0.0%) |
| $150,000 or more | 0 (0.0%) | 0 (0.0%) |
| Total | 21 (100.0%) | 6 (100.0%) |
Property Value to Household Income Ratio in Brownington
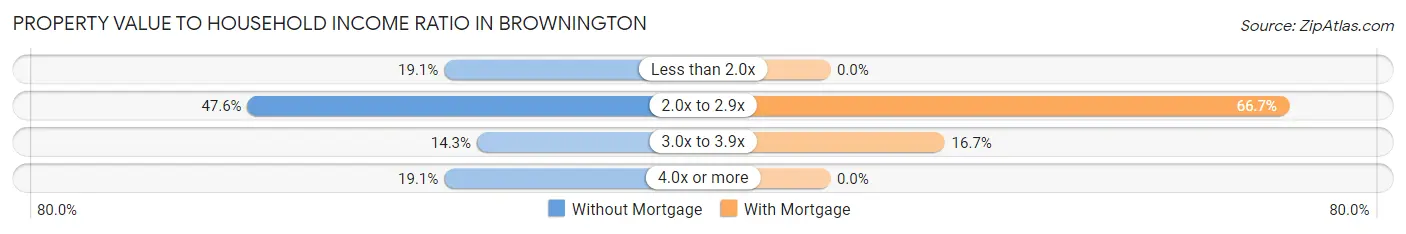
| Value-to-Income Ratio | Without Mortgage | With Mortgage |
| Less than 2.0x | 4 (19.1%) | 0 (0.0%) |
| 2.0x to 2.9x | 10 (47.6%) | 4 (66.7%) |
| 3.0x to 3.9x | 3 (14.3%) | 1 (16.7%) |
| 4.0x or more | 4 (19.1%) | 0 (0.0%) |
| Total | 21 (100.0%) | 6 (100.0%) |
Real Estate Taxes by Mortgage Status in Brownington
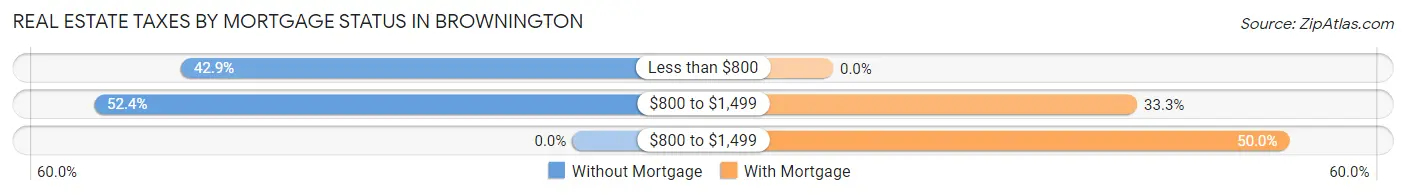
| Property Taxes | Without Mortgage | With Mortgage |
| Less than $800 | 9 (42.9%) | 0 (0.0%) |
| $800 to $1,499 | 11 (52.4%) | 2 (33.3%) |
| $800 to $1,499 | 0 (0.0%) | 3 (50.0%) |
| Total | 21 (100.0%) | 6 (100.0%) |
Health & Disability in Brownington
Health Insurance Coverage by Age in Brownington
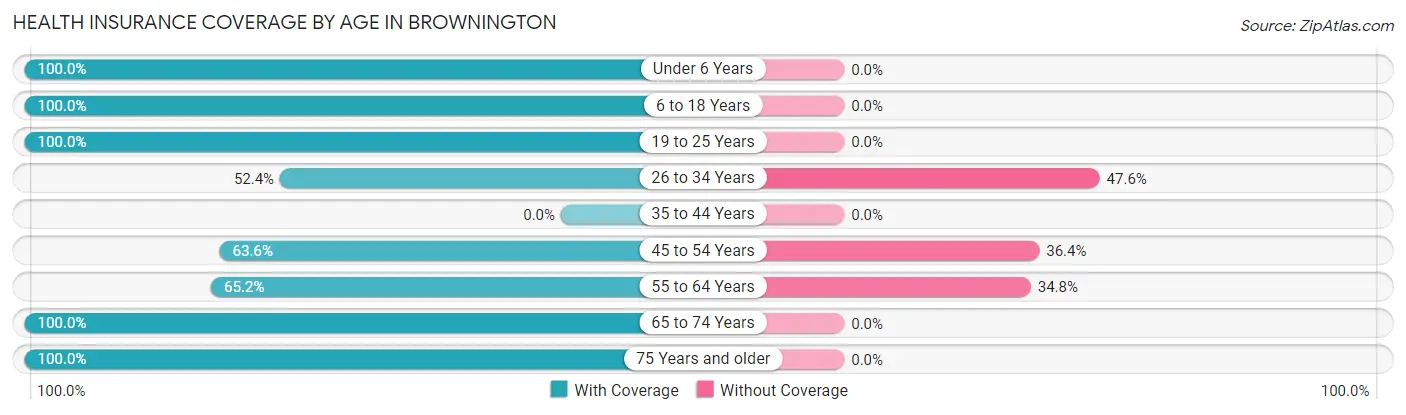
| Age Bracket | With Coverage | Without Coverage |
| Under 6 Years | 5 (100.0%) | 0 (0.0%) |
| 6 to 18 Years | 7 (100.0%) | 0 (0.0%) |
| 19 to 25 Years | 5 (100.0%) | 0 (0.0%) |
| 26 to 34 Years | 11 (52.4%) | 10 (47.6%) |
| 35 to 44 Years | 0 (0.0%) | 0 (0.0%) |
| 45 to 54 Years | 7 (63.6%) | 4 (36.4%) |
| 55 to 64 Years | 15 (65.2%) | 8 (34.8%) |
| 65 to 74 Years | 5 (100.0%) | 0 (0.0%) |
| 75 Years and older | 9 (100.0%) | 0 (0.0%) |
| Total | 64 (74.4%) | 22 (25.6%) |
Health Insurance Coverage by Citizenship Status in Brownington
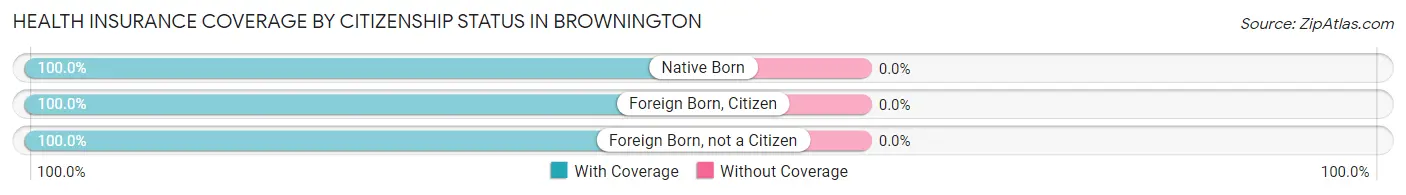
| Citizenship Status | With Coverage | Without Coverage |
| Native Born | 5 (100.0%) | 0 (0.0%) |
| Foreign Born, Citizen | 7 (100.0%) | 0 (0.0%) |
| Foreign Born, not a Citizen | 5 (100.0%) | 0 (0.0%) |
Health Insurance Coverage by Household Income in Brownington
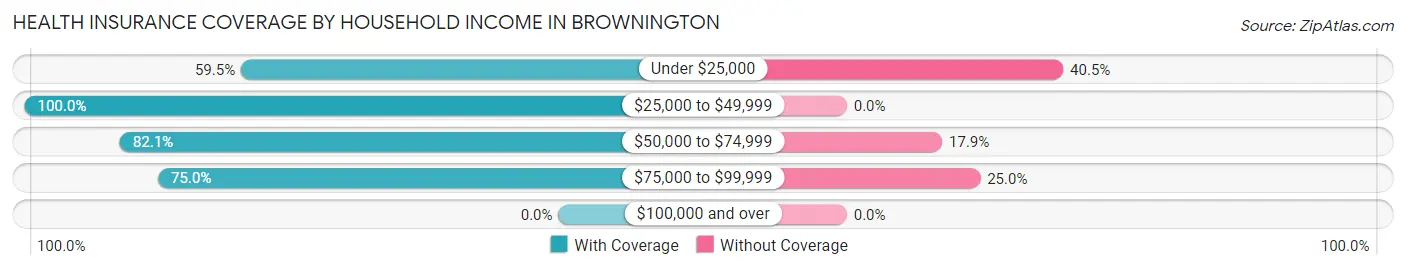
| Household Income | With Coverage | Without Coverage |
| Under $25,000 | 22 (59.5%) | 15 (40.5%) |
| $25,000 to $49,999 | 13 (100.0%) | 0 (0.0%) |
| $50,000 to $74,999 | 23 (82.1%) | 5 (17.9%) |
| $75,000 to $99,999 | 6 (75.0%) | 2 (25.0%) |
| $100,000 and over | 0 (0.0%) | 0 (0.0%) |
Public vs Private Health Insurance Coverage by Age in Brownington
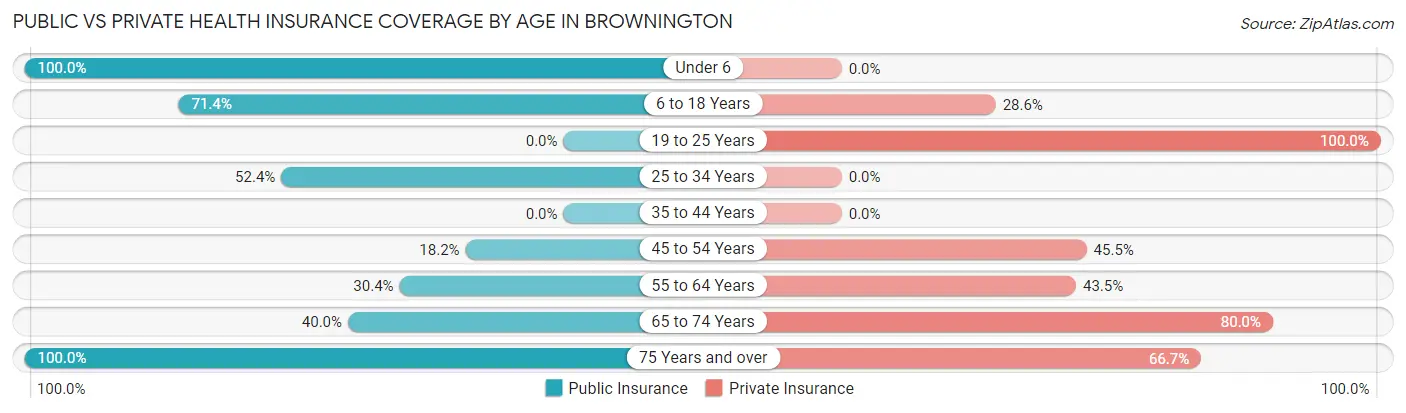
| Age Bracket | Public Insurance | Private Insurance |
| Under 6 | 5 (100.0%) | 0 (0.0%) |
| 6 to 18 Years | 5 (71.4%) | 2 (28.6%) |
| 19 to 25 Years | 0 (0.0%) | 5 (100.0%) |
| 25 to 34 Years | 11 (52.4%) | 0 (0.0%) |
| 35 to 44 Years | 0 (0.0%) | 0 (0.0%) |
| 45 to 54 Years | 2 (18.2%) | 5 (45.5%) |
| 55 to 64 Years | 7 (30.4%) | 10 (43.5%) |
| 65 to 74 Years | 2 (40.0%) | 4 (80.0%) |
| 75 Years and over | 9 (100.0%) | 6 (66.7%) |
| Total | 41 (47.7%) | 32 (37.2%) |
Disability Status by Sex by Age in Brownington
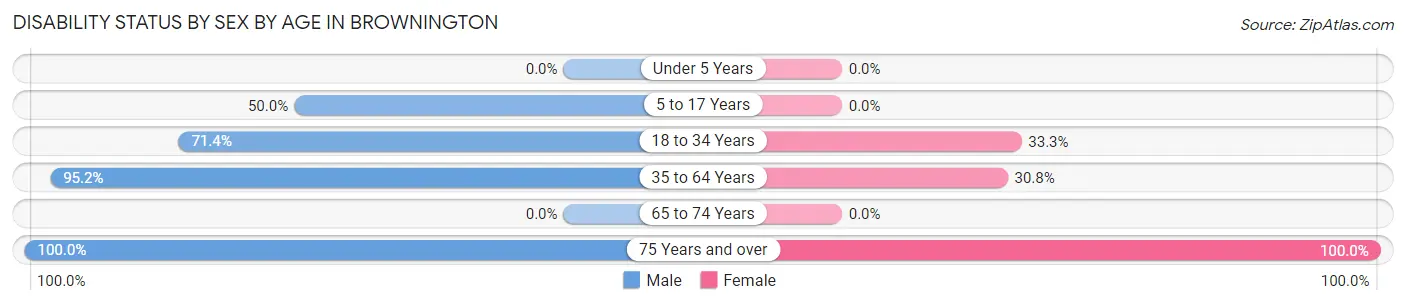
| Age Bracket | Male | Female |
| Under 5 Years | 0 (0.0%) | 0 (0.0%) |
| 5 to 17 Years | 3 (50.0%) | 0 (0.0%) |
| 18 to 34 Years | 10 (71.4%) | 4 (33.3%) |
| 35 to 64 Years | 20 (95.2%) | 4 (30.8%) |
| 65 to 74 Years | 0 (0.0%) | 0 (0.0%) |
| 75 Years and over | 3 (100.0%) | 6 (100.0%) |
Disability Class by Sex by Age in Brownington
Disability Class: Hearing Difficulty
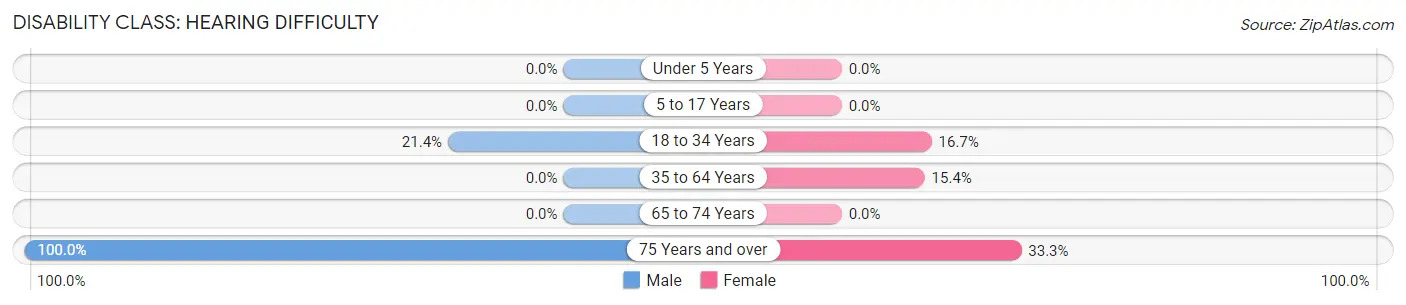
| Age Bracket | Male | Female |
| Under 5 Years | 0 (0.0%) | 0 (0.0%) |
| 5 to 17 Years | 0 (0.0%) | 0 (0.0%) |
| 18 to 34 Years | 3 (21.4%) | 2 (16.7%) |
| 35 to 64 Years | 0 (0.0%) | 2 (15.4%) |
| 65 to 74 Years | 0 (0.0%) | 0 (0.0%) |
| 75 Years and over | 3 (100.0%) | 2 (33.3%) |
Disability Class: Vision Difficulty
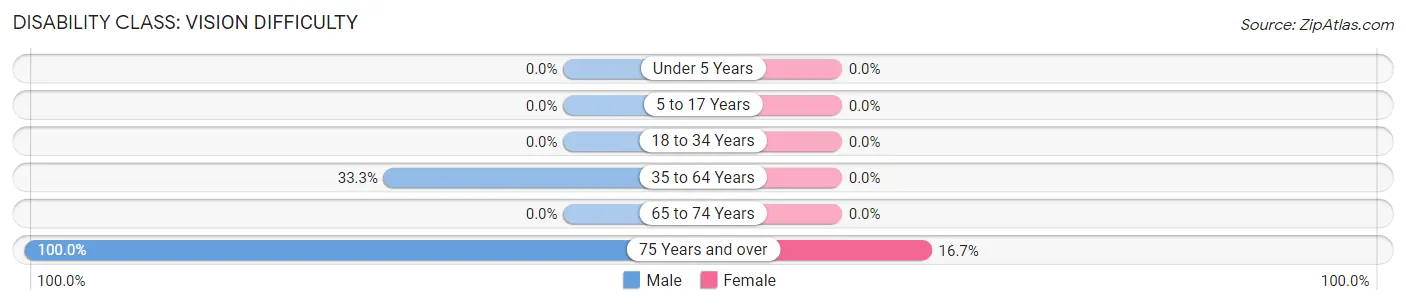
| Age Bracket | Male | Female |
| Under 5 Years | 0 (0.0%) | 0 (0.0%) |
| 5 to 17 Years | 0 (0.0%) | 0 (0.0%) |
| 18 to 34 Years | 0 (0.0%) | 0 (0.0%) |
| 35 to 64 Years | 7 (33.3%) | 0 (0.0%) |
| 65 to 74 Years | 0 (0.0%) | 0 (0.0%) |
| 75 Years and over | 3 (100.0%) | 1 (16.7%) |
Disability Class: Cognitive Difficulty
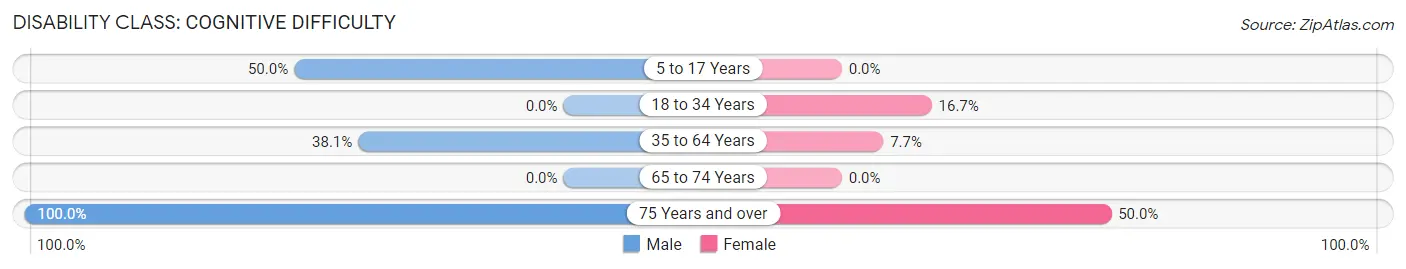
| Age Bracket | Male | Female |
| 5 to 17 Years | 3 (50.0%) | 0 (0.0%) |
| 18 to 34 Years | 0 (0.0%) | 2 (16.7%) |
| 35 to 64 Years | 8 (38.1%) | 1 (7.7%) |
| 65 to 74 Years | 0 (0.0%) | 0 (0.0%) |
| 75 Years and over | 3 (100.0%) | 3 (50.0%) |
Disability Class: Ambulatory Difficulty
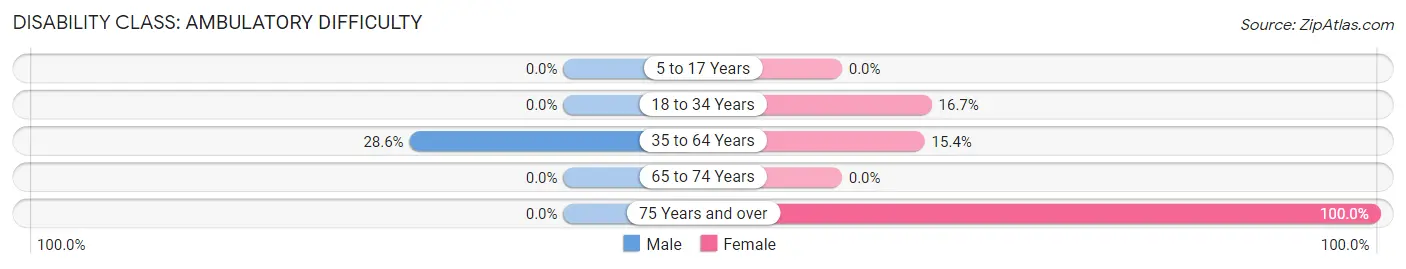
| Age Bracket | Male | Female |
| 5 to 17 Years | 0 (0.0%) | 0 (0.0%) |
| 18 to 34 Years | 0 (0.0%) | 2 (16.7%) |
| 35 to 64 Years | 6 (28.6%) | 2 (15.4%) |
| 65 to 74 Years | 0 (0.0%) | 0 (0.0%) |
| 75 Years and over | 0 (0.0%) | 6 (100.0%) |
Disability Class: Self-Care Difficulty
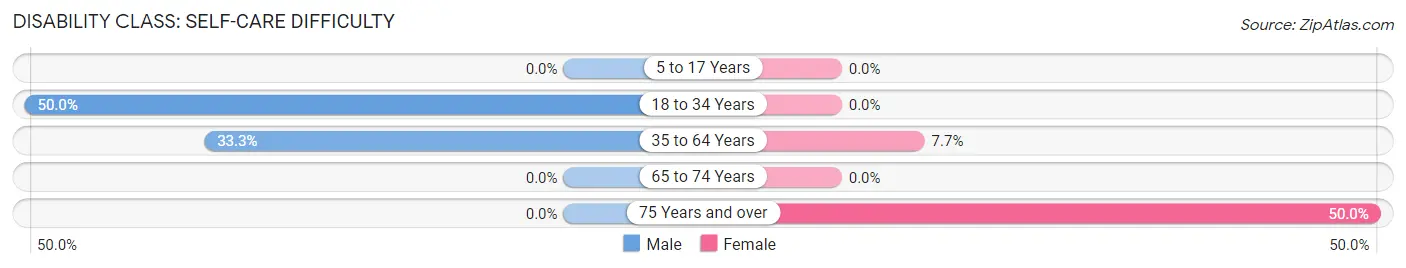
| Age Bracket | Male | Female |
| 5 to 17 Years | 0 (0.0%) | 0 (0.0%) |
| 18 to 34 Years | 7 (50.0%) | 0 (0.0%) |
| 35 to 64 Years | 7 (33.3%) | 1 (7.7%) |
| 65 to 74 Years | 0 (0.0%) | 0 (0.0%) |
| 75 Years and over | 0 (0.0%) | 3 (50.0%) |
Technology Access in Brownington
Computing Device Access in Brownington
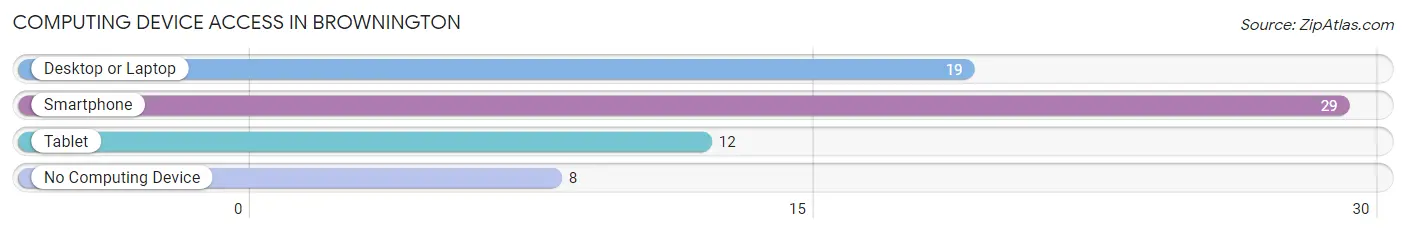
| Device Type | # Households | % Households |
| Desktop or Laptop | 19 | 50.0% |
| Smartphone | 29 | 76.3% |
| Tablet | 12 | 31.6% |
| No Computing Device | 8 | 21.0% |
| Total | 38 | 100.0% |
Internet Access in Brownington
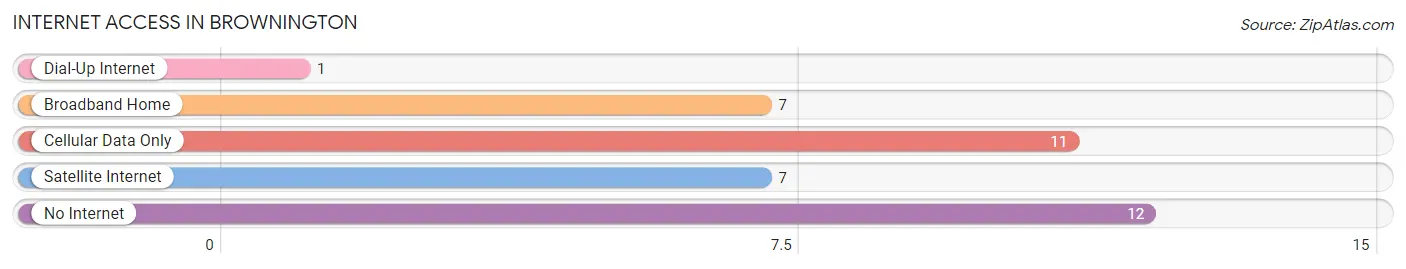
| Internet Type | # Households | % Households |
| Dial-Up Internet | 1 | 2.6% |
| Broadband Home | 7 | 18.4% |
| Cellular Data Only | 11 | 28.9% |
| Satellite Internet | 7 | 18.4% |
| No Internet | 12 | 31.6% |
| Total | 38 | 100.0% |
Brownington Summary
History
Brownington, Missouri is a small town located in the Ozark Mountains of the state. It was founded in 1845 by William Brown, a settler from Kentucky. Brownington was originally known as Brown's Station, and was the first settlement in the area. The town was officially incorporated in 1872.
Brownington was a small farming community for much of its history. The town was home to a variety of businesses, including a general store, a blacksmith shop, a sawmill, and a grist mill. The town also had a post office, a school, and a church.
In the early 1900s, Brownington began to experience a period of growth. The town was connected to the railroad in 1906, and the population began to increase. The town also saw the construction of a new school and a new church.
In the 1950s, Brownington began to experience a decline in population. The railroad was abandoned, and many of the businesses in town closed. The population of the town dropped to just over 200 people by the year 2000.
Geography
Brownington is located in the Ozark Mountains of Missouri. The town is situated in the Ozark Plateau, which is characterized by rolling hills and valleys. The town is located in the Mark Twain National Forest, and is surrounded by forests and farmland.
The town is located in the Ozark Highlands, which is a region of the Ozarks that is characterized by steep hills and deep valleys. The town is located in the Ozark Mountains, which are part of the Appalachian Mountains.
The town is located in the Ozark Plateau, which is characterized by rolling hills and valleys. The town is located in the Mark Twain National Forest, and is surrounded by forests and farmland.
Economy
The economy of Brownington is largely based on agriculture. The town is home to several farms, which produce a variety of crops, including corn, soybeans, wheat, and hay. The town is also home to several small businesses, including a general store, a hardware store, and a restaurant.
The town is also home to a number of tourist attractions, including the Ozark National Scenic Riverways, which is a popular destination for canoeing and fishing. The town is also home to the Ozark Caverns, which is a popular tourist destination.
Demographics
As of the 2010 census, the population of Brownington was 203. The town has a total area of 0.6 square miles, all of which is land. The town has a population density of 339.7 people per square mile.
The racial makeup of the town is 97.5% White, 0.5% African American, 0.5% Native American, 0.5% Asian, and 1.0% from other races. The median household income in the town is $31,250, and the median family income is $37,500.
Conclusion
Brownington, Missouri is a small town located in the Ozark Mountains of the state. The town was founded in 1845 by William Brown, and was officially incorporated in 1872. The town has a population of 203, and the economy is largely based on agriculture. The town is also home to several tourist attractions, including the Ozark National Scenic Riverways and the Ozark Caverns.
Common Questions
What is Per Capita Income in Brownington?
Per Capita income in Brownington is $19,698.
What is the Median Family Income in Brownington?
Median Family Income in Brownington is $63,250.
What is the Median Household income in Brownington?
Median Household Income in Brownington is $35,357.
What is Income or Wage Gap in Brownington?
Income or Wage Gap in Brownington is 28.3%.
Women in Brownington earn 71.7 cents for every dollar earned by a man.
What is Inequality or Gini Index in Brownington?
Inequality or Gini Index in Brownington is 0.38.
What is the Total Population of Brownington?
Total Population of Brownington is 86.
What is the Total Male Population of Brownington?
Total Male Population of Brownington is 49.
What is the Total Female Population of Brownington?
Total Female Population of Brownington is 37.
What is the Ratio of Males per 100 Females in Brownington?
There are 132.43 Males per 100 Females in Brownington.
What is the Ratio of Females per 100 Males in Brownington?
There are 75.51 Females per 100 Males in Brownington.
What is the Median Population Age in Brownington?
Median Population Age in Brownington is 50.6 Years.
What is the Average Family Size in Brownington
Average Family Size in Brownington is 3.0 People.
What is the Average Household Size in Brownington
Average Household Size in Brownington is 2.3 People.
How Large is the Labor Force in Brownington?
There are 38 People in the Labor Forcein in Brownington.
What is the Percentage of People in the Labor Force in Brownington?
51.4% of People are in the Labor Force in Brownington.
What is the Unemployment Rate in Brownington?
Unemployment Rate in Brownington is 10.5%.