Wilson City, MO Map & Demographics
Wilson City Map
Wilson City Overview
$25,323
PER CAPITA INCOME
0.42
INEQUALITY / GINI INDEX
71
TOTAL POPULATION
44
MALE POPULATION
27
FEMALE POPULATION
162.96
MALES / 100 FEMALES
61.36
FEMALES / 100 MALES
54.6
MEDIAN AGE
2.2
AVG FAMILY SIZE
1.8
AVG HOUSEHOLD SIZE
32
LABOR FORCE [ PEOPLE ]
59.3%
PERCENT IN LABOR FORCE
12.5%
UNEMPLOYMENT RATE
Income in Wilson City
Income Overview in Wilson City
| Characteristic | Number | Measure |
| Per Capita Income | 71 | $25,323 |
| Median Family Income | 27 | $0 |
| Mean Family Income | 27 | $66,163 |
| Median Household Income | 39 | $0 |
| Mean Household Income | 39 | $55,879 |
| Income Deficit | 27 | $0 |
| Wage / Income Gap (%) | 71 | 0.00% |
| Wage / Income Gap ($) | 71 | 100.00¢ per $1 |
| Gini / Inequality Index | 71 | 0.42 |
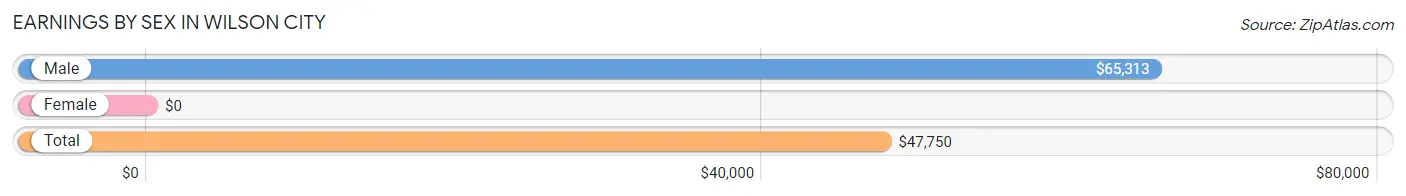
Earnings by Sex in Wilson City
| Sex | Number | Average Earnings |
| Male | 21 (63.6%) | $65,313 |
| Female | 12 (36.4%) | $0 |
| Total | 33 (100.0%) | $47,750 |
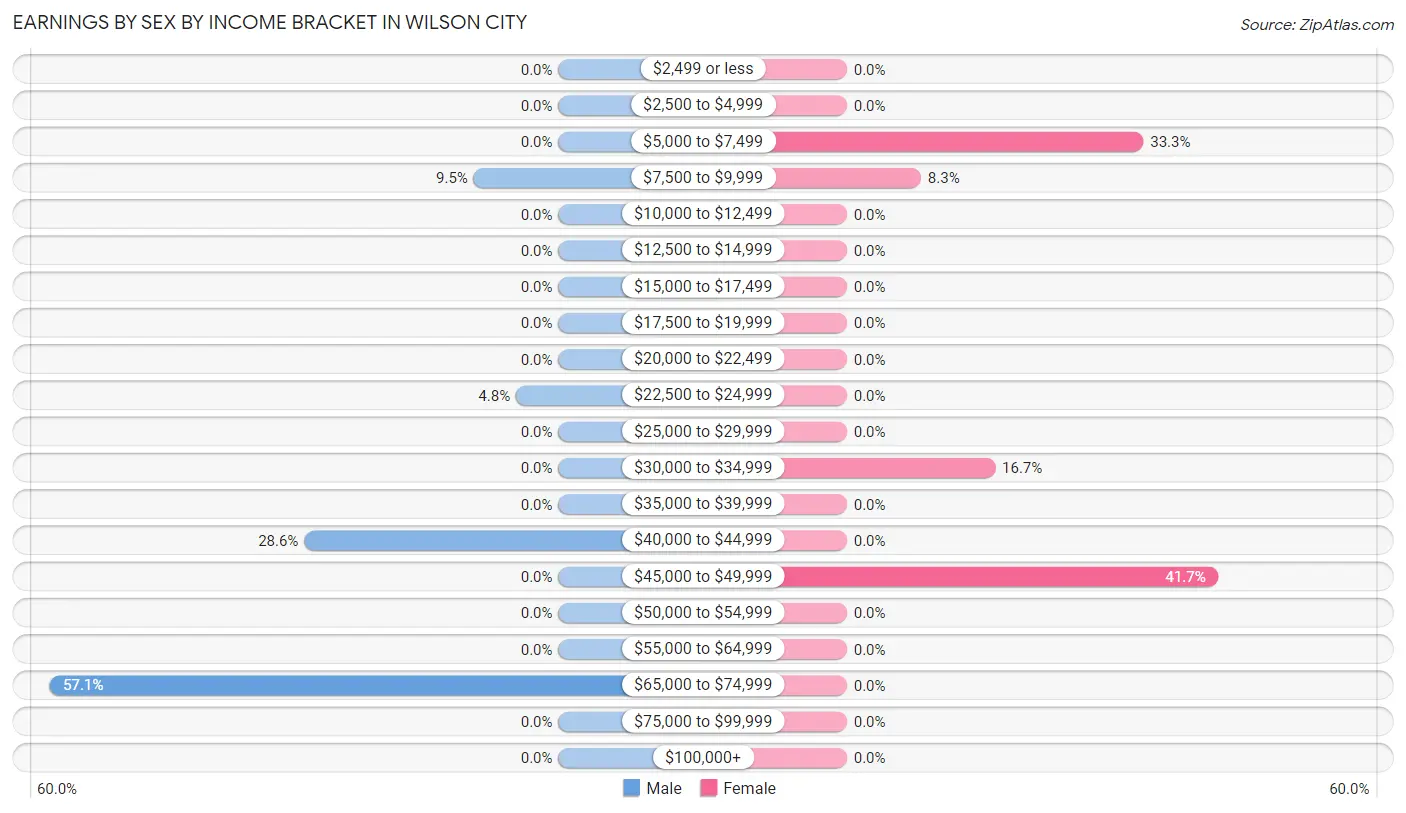
Earnings by Sex by Income Bracket in Wilson City
The most common earnings brackets in Wilson City are $65,000 to $74,999 for men (12 | 57.1%) and $45,000 to $49,999 for women (5 | 41.7%).
| Income | Male | Female |
| $2,499 or less | 0 (0.0%) | 0 (0.0%) |
| $2,500 to $4,999 | 0 (0.0%) | 0 (0.0%) |
| $5,000 to $7,499 | 0 (0.0%) | 4 (33.3%) |
| $7,500 to $9,999 | 2 (9.5%) | 1 (8.3%) |
| $10,000 to $12,499 | 0 (0.0%) | 0 (0.0%) |
| $12,500 to $14,999 | 0 (0.0%) | 0 (0.0%) |
| $15,000 to $17,499 | 0 (0.0%) | 0 (0.0%) |
| $17,500 to $19,999 | 0 (0.0%) | 0 (0.0%) |
| $20,000 to $22,499 | 0 (0.0%) | 0 (0.0%) |
| $22,500 to $24,999 | 1 (4.8%) | 0 (0.0%) |
| $25,000 to $29,999 | 0 (0.0%) | 0 (0.0%) |
| $30,000 to $34,999 | 0 (0.0%) | 2 (16.7%) |
| $35,000 to $39,999 | 0 (0.0%) | 0 (0.0%) |
| $40,000 to $44,999 | 6 (28.6%) | 0 (0.0%) |
| $45,000 to $49,999 | 0 (0.0%) | 5 (41.7%) |
| $50,000 to $54,999 | 0 (0.0%) | 0 (0.0%) |
| $55,000 to $64,999 | 0 (0.0%) | 0 (0.0%) |
| $65,000 to $74,999 | 12 (57.1%) | 0 (0.0%) |
| $75,000 to $99,999 | 0 (0.0%) | 0 (0.0%) |
| $100,000+ | 0 (0.0%) | 0 (0.0%) |
| Total | 21 (100.0%) | 12 (100.0%) |
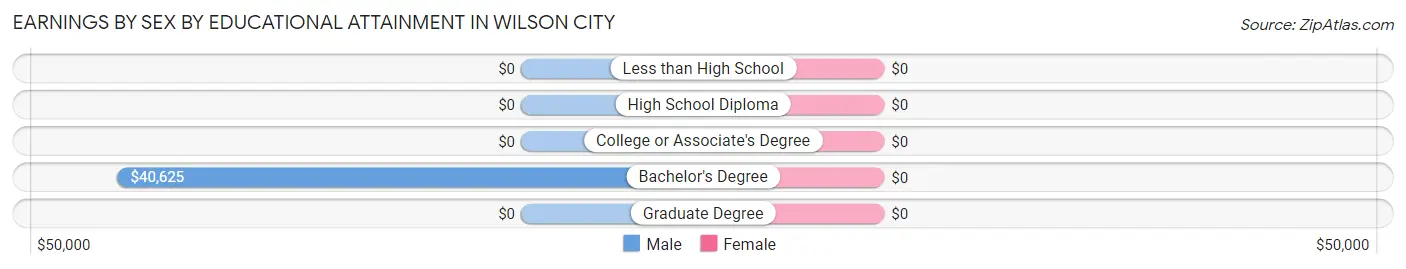
Earnings by Sex by Educational Attainment in Wilson City
| Educational Attainment | Male Income | Female Income |
| Less than High School | - | - |
| High School Diploma | - | - |
| College or Associate's Degree | - | - |
| Bachelor's Degree | $40,625 | $0 |
| Graduate Degree | - | - |
| Total | $65,313 | $0 |
Family Income in Wilson City
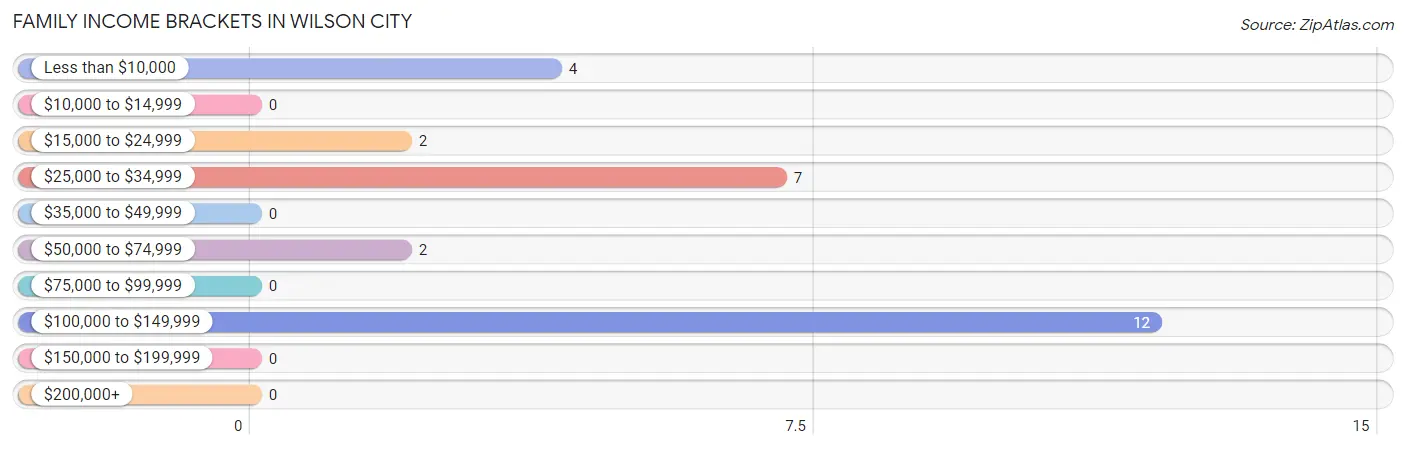
Family Income Brackets in Wilson City
According to the Wilson City family income data, there are 12 families falling into the $100,000 to $149,999 income range, which is the most common income bracket and makes up 44.4% of all families.
| Income Bracket | # Families | % Families |
| Less than $10,000 | 4 | 14.8% |
| $10,000 to $14,999 | 0 | 0.0% |
| $15,000 to $24,999 | 2 | 7.4% |
| $25,000 to $34,999 | 7 | 25.9% |
| $35,000 to $49,999 | 0 | 0.0% |
| $50,000 to $74,999 | 2 | 7.4% |
| $75,000 to $99,999 | 0 | 0.0% |
| $100,000 to $149,999 | 12 | 44.4% |
| $150,000 to $199,999 | 0 | 0.0% |
| $200,000+ | 0 | 0.0% |
Family Income by Famaliy Size in Wilson City
| Income Bracket | # Families | Median Income |
| 2-Person Families | 21 (77.8%) | $0 |
| 3-Person Families | 4 (14.8%) | $0 |
| 4-Person Families | 2 (7.4%) | $0 |
| 5-Person Families | 0 (0.0%) | $0 |
| 6-Person Families | 0 (0.0%) | $0 |
| 7+ Person Families | 0 (0.0%) | $0 |
| Total | 27 (100.0%) | $0 |
Family Income by Number of Earners in Wilson City
| Number of Earners | # Families | Median Income |
| No Earners | 7 (25.9%) | $0 |
| 1 Earner | 6 (22.2%) | $0 |
| 2 Earners | 14 (51.8%) | $0 |
| 3+ Earners | 0 (0.0%) | $0 |
| Total | 27 (100.0%) | $0 |
Household Income in Wilson City
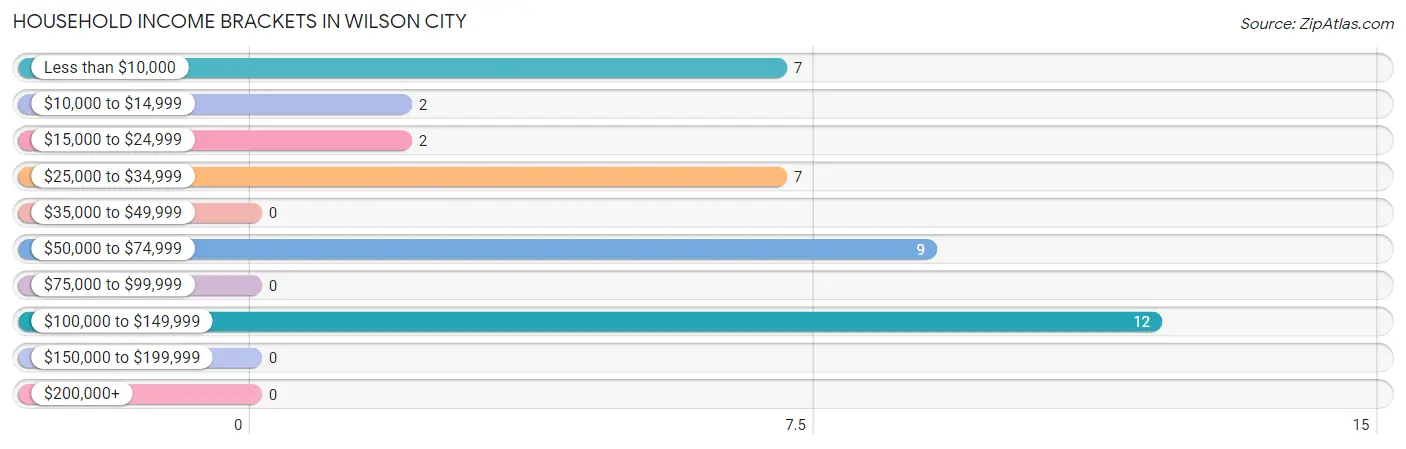
Household Income Brackets in Wilson City
With 12 households falling in the category, the $100,000 to $149,999 income range is the most frequent in Wilson City, accounting for 30.8% of all households.
| Income Bracket | # Households | % Households |
| Less than $10,000 | 7 | 17.9% |
| $10,000 to $14,999 | 2 | 5.1% |
| $15,000 to $24,999 | 2 | 5.1% |
| $25,000 to $34,999 | 7 | 17.9% |
| $35,000 to $49,999 | 0 | 0.0% |
| $50,000 to $74,999 | 9 | 23.1% |
| $75,000 to $99,999 | 0 | 0.0% |
| $100,000 to $149,999 | 12 | 30.8% |
| $150,000 to $199,999 | 0 | 0.0% |
| $200,000+ | 0 | 0.0% |
Household Income by Householder Age in Wilson City
| Income Bracket | # Households | Median Income |
| 15 to 24 Years | 0 (0.0%) | $0 |
| 25 to 44 Years | 4 (10.3%) | $0 |
| 45 to 64 Years | 12 (30.8%) | $0 |
| 65+ Years | 23 (59.0%) | $0 |
| Total | 39 (100.0%) | $0 |
Poverty in Wilson City
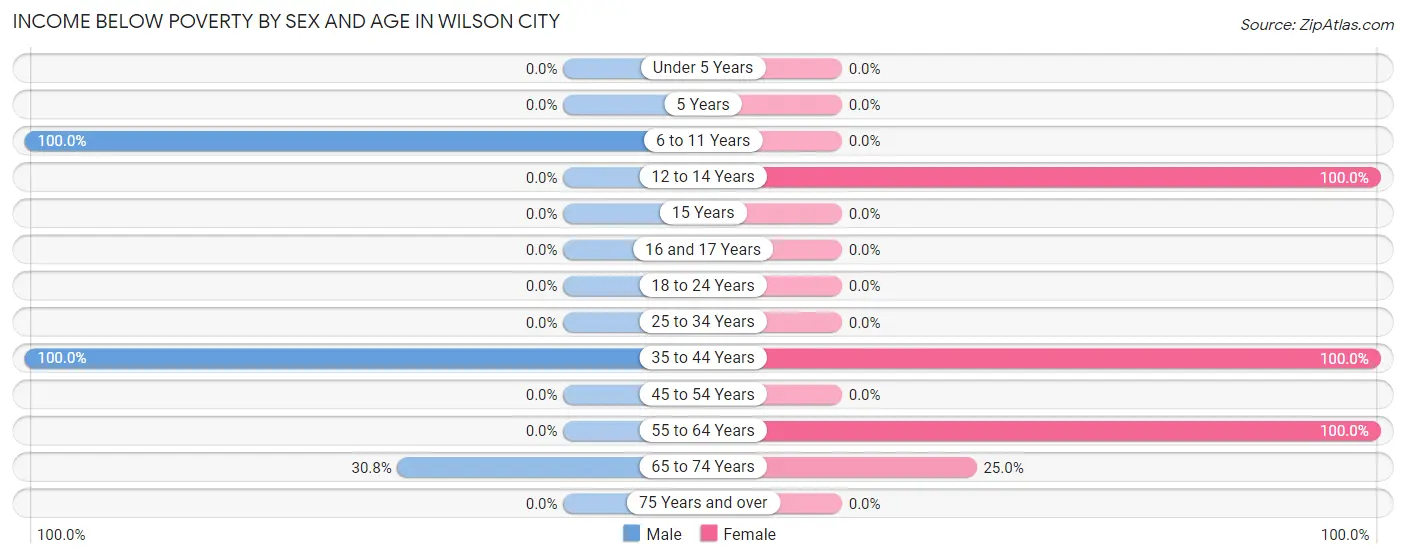
Income Below Poverty by Sex and Age in Wilson City
With 40.9% poverty level for males and 48.1% for females among the residents of Wilson City, 6 to 11 year old males and 12 to 14 year old females are the most vulnerable to poverty, with 12 males (100.0%) and 5 females (100.0%) in their respective age groups living below the poverty level.
| Age Bracket | Male | Female |
| Under 5 Years | 0 (0.0%) | 0 (0.0%) |
| 5 Years | 0 (0.0%) | 0 (0.0%) |
| 6 to 11 Years | 12 (100.0%) | 0 (0.0%) |
| 12 to 14 Years | 0 (0.0%) | 5 (100.0%) |
| 15 Years | 0 (0.0%) | 0 (0.0%) |
| 16 and 17 Years | 0 (0.0%) | 0 (0.0%) |
| 18 to 24 Years | 0 (0.0%) | 0 (0.0%) |
| 25 to 34 Years | 0 (0.0%) | 0 (0.0%) |
| 35 to 44 Years | 2 (100.0%) | 4 (100.0%) |
| 45 to 54 Years | 0 (0.0%) | 0 (0.0%) |
| 55 to 64 Years | 0 (0.0%) | 1 (100.0%) |
| 65 to 74 Years | 4 (30.8%) | 3 (25.0%) |
| 75 Years and over | 0 (0.0%) | 0 (0.0%) |
| Total | 18 (40.9%) | 13 (48.1%) |
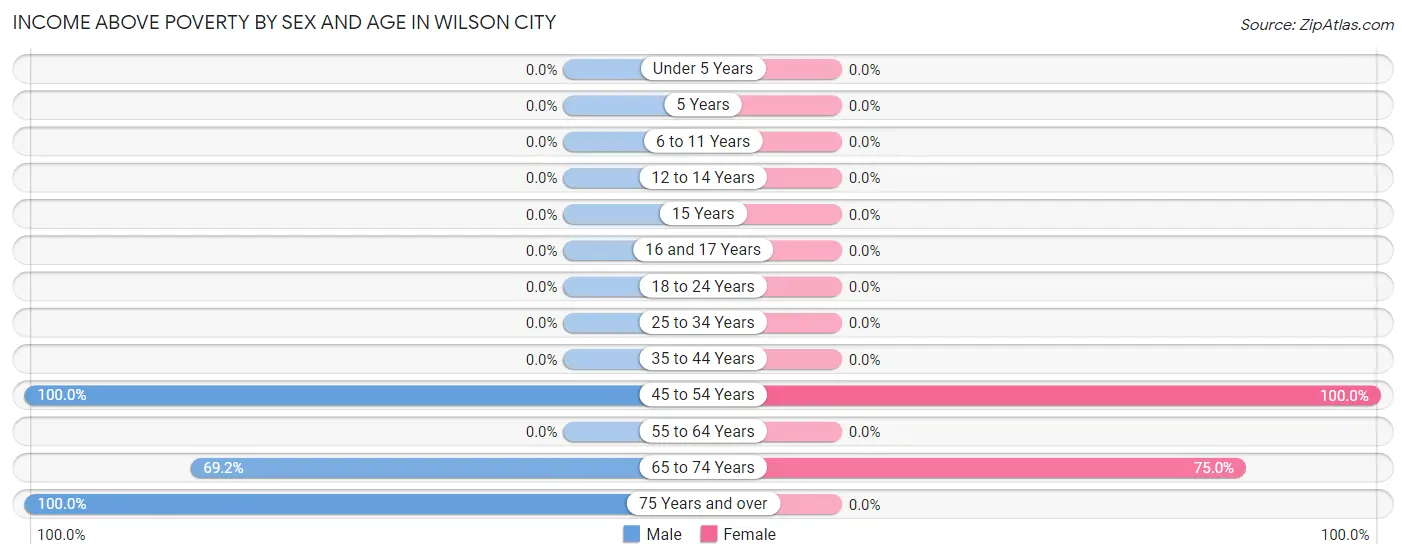
Income Above Poverty by Sex and Age in Wilson City
According to the poverty statistics in Wilson City, males aged 45 to 54 years and females aged 45 to 54 years are the age groups that are most secure financially, with 100.0% of males and 100.0% of females in these age groups living above the poverty line.
| Age Bracket | Male | Female |
| Under 5 Years | 0 (0.0%) | 0 (0.0%) |
| 5 Years | 0 (0.0%) | 0 (0.0%) |
| 6 to 11 Years | 0 (0.0%) | 0 (0.0%) |
| 12 to 14 Years | 0 (0.0%) | 0 (0.0%) |
| 15 Years | 0 (0.0%) | 0 (0.0%) |
| 16 and 17 Years | 0 (0.0%) | 0 (0.0%) |
| 18 to 24 Years | 0 (0.0%) | 0 (0.0%) |
| 25 to 34 Years | 0 (0.0%) | 0 (0.0%) |
| 35 to 44 Years | 0 (0.0%) | 0 (0.0%) |
| 45 to 54 Years | 12 (100.0%) | 5 (100.0%) |
| 55 to 64 Years | 0 (0.0%) | 0 (0.0%) |
| 65 to 74 Years | 9 (69.2%) | 9 (75.0%) |
| 75 Years and over | 5 (100.0%) | 0 (0.0%) |
| Total | 26 (59.1%) | 14 (51.8%) |
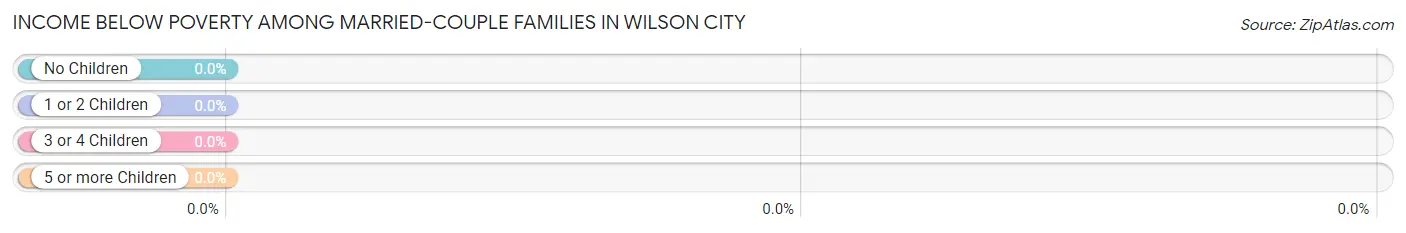
Income Below Poverty Among Married-Couple Families in Wilson City
| Children | Above Poverty | Below Poverty |
| No Children | 19 (100.0%) | 0 (0.0%) |
| 1 or 2 Children | 0 (0.0%) | 0 (0.0%) |
| 3 or 4 Children | 0 (0.0%) | 0 (0.0%) |
| 5 or more Children | 0 (0.0%) | 0 (0.0%) |
| Total | 19 (100.0%) | 0 (0.0%) |
Income Below Poverty Among Single-Parent Households in Wilson City
According to the poverty data in Wilson City, 50.0% or 2 single-father households and 100.0% or 4 single-mother households are living below the poverty line. Among single-father households, those with 1 or 2 children have the highest poverty rate, with 2 households (100.0%) experiencing poverty. Likewise, among single-mother households, those with 1 or 2 children have the highest poverty rate, with 4 households (100.0%) falling below the poverty line.
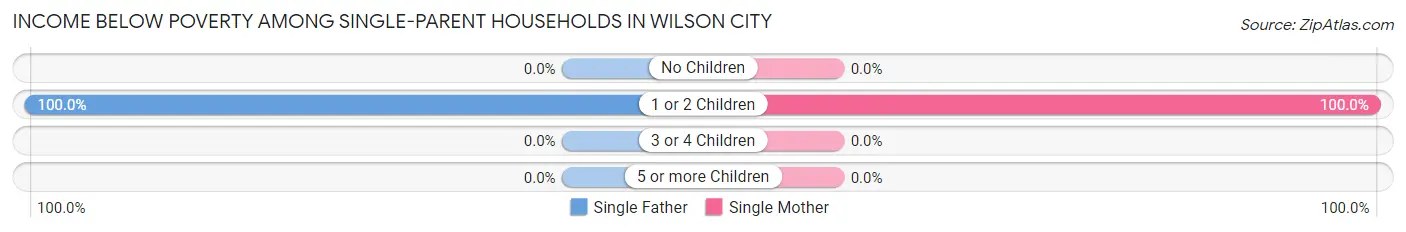
| Children | Single Father | Single Mother |
| No Children | 0 (0.0%) | 0 (0.0%) |
| 1 or 2 Children | 2 (100.0%) | 4 (100.0%) |
| 3 or 4 Children | 0 (0.0%) | 0 (0.0%) |
| 5 or more Children | 0 (0.0%) | 0 (0.0%) |
| Total | 2 (50.0%) | 4 (100.0%) |
Income Below Poverty Among Married-Couple vs Single-Parent Households in Wilson City
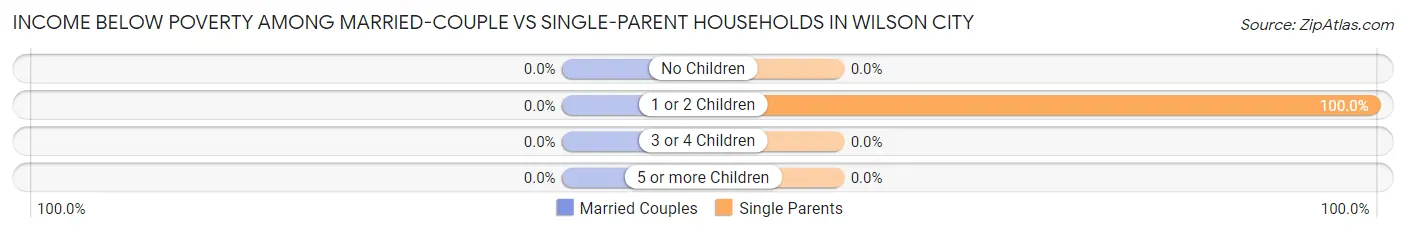
| Children | Married-Couple Families | Single-Parent Households |
| No Children | 0 (0.0%) | 0 (0.0%) |
| 1 or 2 Children | 0 (0.0%) | 6 (100.0%) |
| 3 or 4 Children | 0 (0.0%) | 0 (0.0%) |
| 5 or more Children | 0 (0.0%) | 0 (0.0%) |
| Total | 0 (0.0%) | 6 (75.0%) |
Race in Wilson City
The most populous races in Wilson City are Black / African American (44 | 62.0%), Two or more Races (25 | 35.2%), and White / Caucasian (2 | 2.8%).
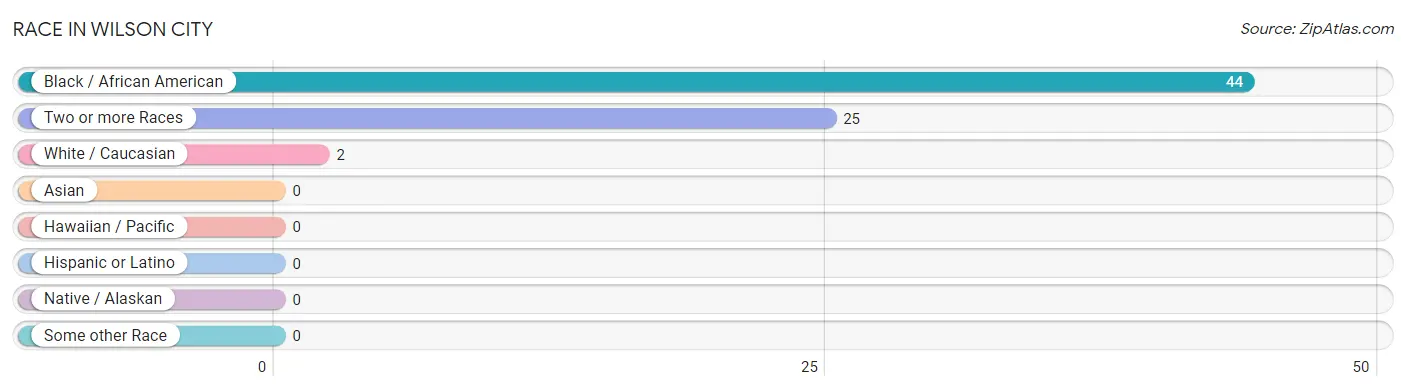
| Race | # Population | % Population |
| Asian | 0 | 0.0% |
| Black / African American | 44 | 62.0% |
| Hawaiian / Pacific | 0 | 0.0% |
| Hispanic or Latino | 0 | 0.0% |
| Native / Alaskan | 0 | 0.0% |
| White / Caucasian | 2 | 2.8% |
| Two or more Races | 25 | 35.2% |
| Some other Race | 0 | 0.0% |
| Total | 71 | 100.0% |
Ancestry in Wilson City
The most populous ancestries reported in Wilson City are Apache (12 | 16.9%), Cherokee (5 | 7.0%), and English (2 | 2.8%), together accounting for 26.8% of all Wilson City residents.
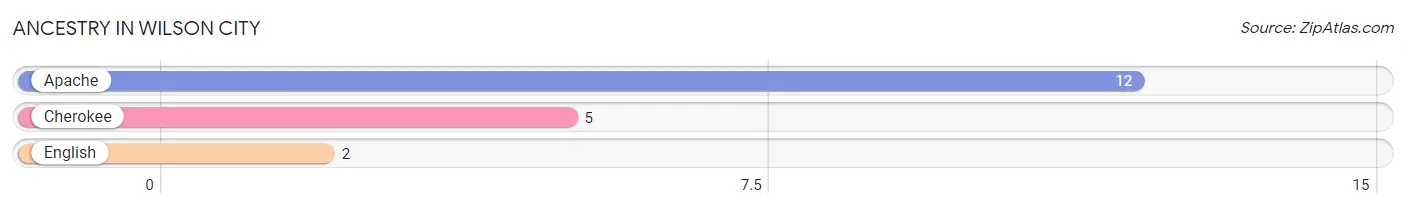
| Ancestry | # Population | % Population |
| Apache | 12 | 16.9% |
| Cherokee | 5 | 7.0% |
| English | 2 | 2.8% | View All 3 Rows |
Immigrants in Wilson City

| Immigration Origin | # Population | % Population | View All 0 Rows |
Sex and Age in Wilson City
Sex and Age in Wilson City
The most populous age groups in Wilson City are 50 to 54 Years (12 | 27.3%) for men and 70 to 74 Years (7 | 25.9%) for women.
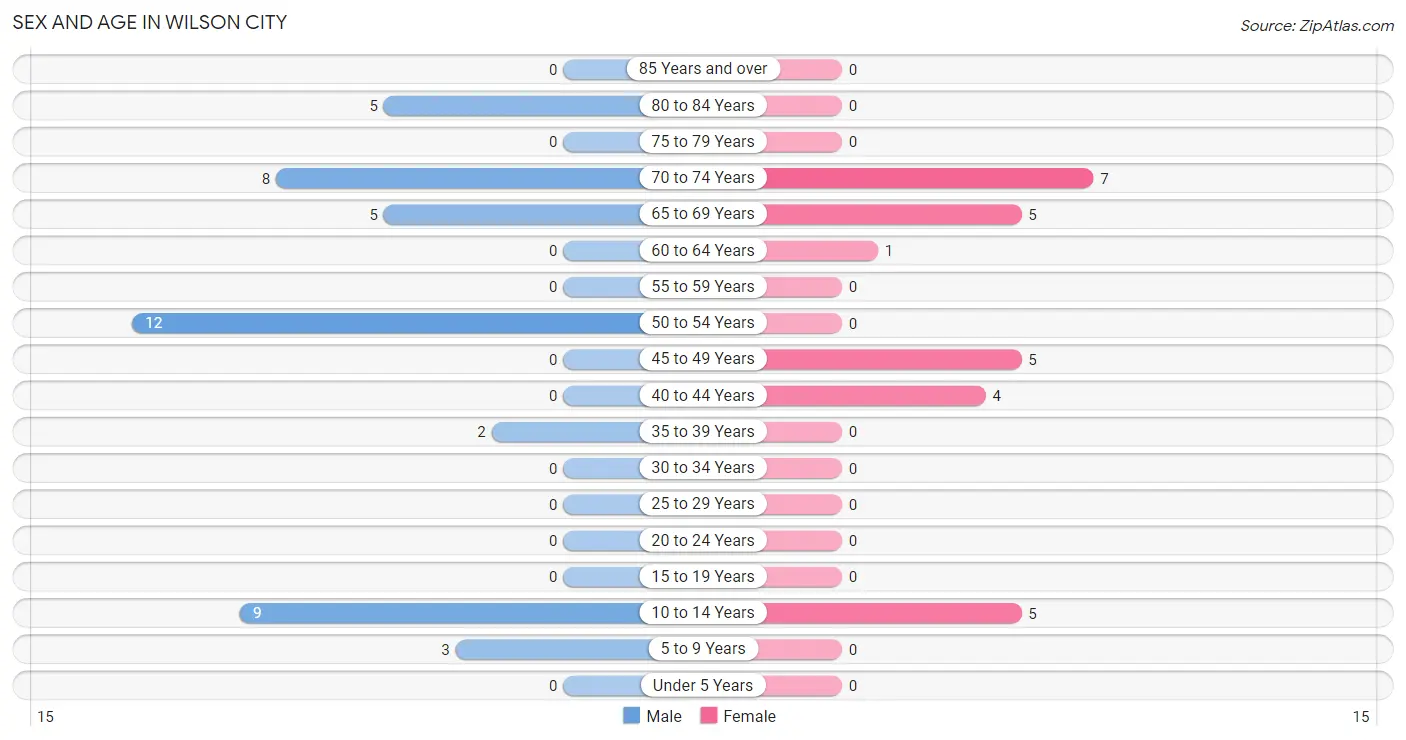
| Age Bracket | Male | Female |
| Under 5 Years | 0 (0.0%) | 0 (0.0%) |
| 5 to 9 Years | 3 (6.8%) | 0 (0.0%) |
| 10 to 14 Years | 9 (20.4%) | 5 (18.5%) |
| 15 to 19 Years | 0 (0.0%) | 0 (0.0%) |
| 20 to 24 Years | 0 (0.0%) | 0 (0.0%) |
| 25 to 29 Years | 0 (0.0%) | 0 (0.0%) |
| 30 to 34 Years | 0 (0.0%) | 0 (0.0%) |
| 35 to 39 Years | 2 (4.5%) | 0 (0.0%) |
| 40 to 44 Years | 0 (0.0%) | 4 (14.8%) |
| 45 to 49 Years | 0 (0.0%) | 5 (18.5%) |
| 50 to 54 Years | 12 (27.3%) | 0 (0.0%) |
| 55 to 59 Years | 0 (0.0%) | 0 (0.0%) |
| 60 to 64 Years | 0 (0.0%) | 1 (3.7%) |
| 65 to 69 Years | 5 (11.4%) | 5 (18.5%) |
| 70 to 74 Years | 8 (18.2%) | 7 (25.9%) |
| 75 to 79 Years | 0 (0.0%) | 0 (0.0%) |
| 80 to 84 Years | 5 (11.4%) | 0 (0.0%) |
| 85 Years and over | 0 (0.0%) | 0 (0.0%) |
| Total | 44 (100.0%) | 27 (100.0%) |
Families and Households in Wilson City
Median Family Size in Wilson City
The median family size in Wilson City is 2.19 persons per family, with single female/mother families (4 | 14.8%) accounting for the largest median family size of 4.5 persons per family. On the other hand, married-couple families (19 | 70.4%) represent the smallest median family size with 1.53 persons per family.
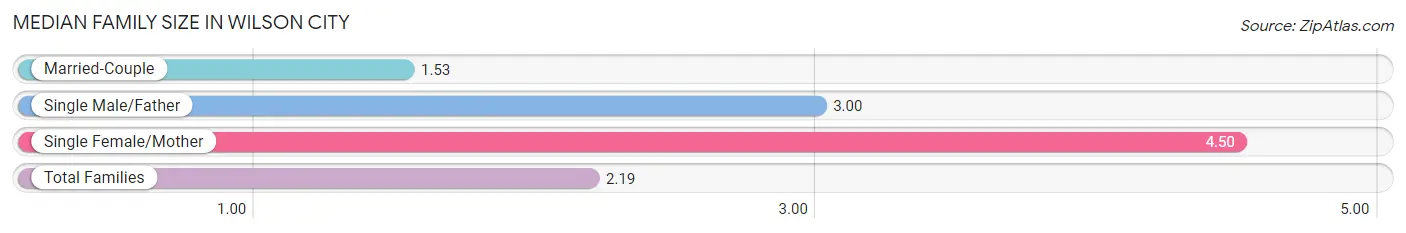
| Family Type | # Families | Family Size |
| Married-Couple | 19 (70.4%) | 1.53 |
| Single Male/Father | 4 (14.8%) | 3.00 |
| Single Female/Mother | 4 (14.8%) | 4.50 |
| Total Families | 27 (100.0%) | 2.19 |
Median Household Size in Wilson City
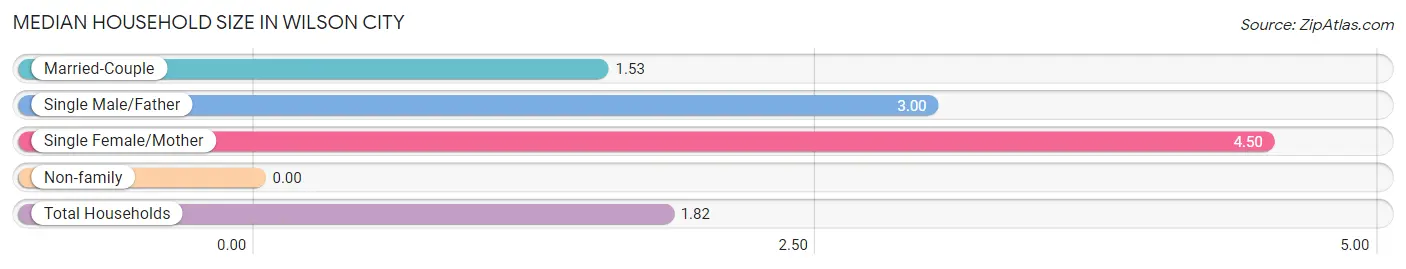
| Household Type | # Households | Household Size |
| Married-Couple | 19 (48.7%) | 1.53 |
| Single Male/Father | 4 (10.3%) | 3.00 |
| Single Female/Mother | 4 (10.3%) | 4.50 |
| Non-family | 12 (30.8%) | - |
| Total Households | 39 (100.0%) | 1.82 |
Household Size by Marriage Status in Wilson City
Out of a total of 39 households in Wilson City, 27 (69.2%) are family households, while 12 (30.8%) are nonfamily households. The most numerous type of family households are 2-person households, comprising 21, and the most common type of nonfamily households are 1-person households, comprising 12.
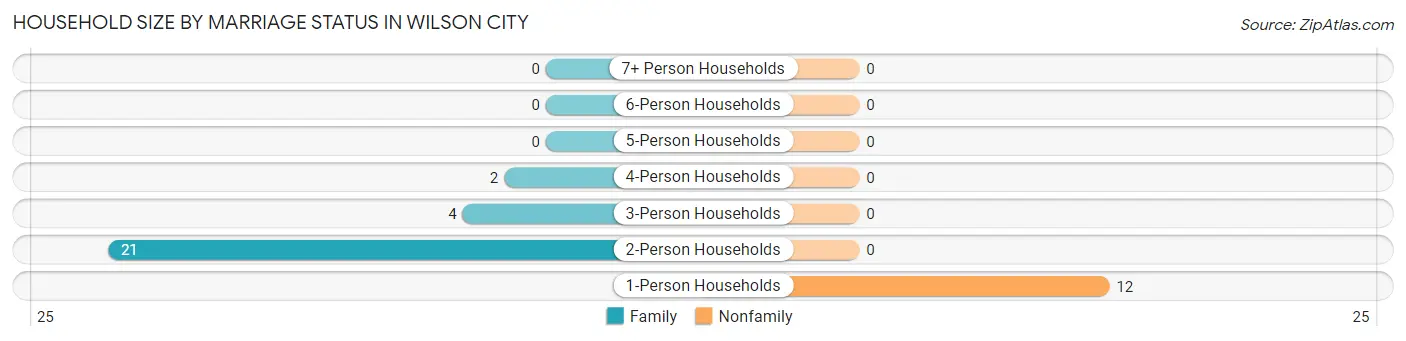
| Household Size | Family Households | Nonfamily Households |
| 1-Person Households | - | 12 (30.8%) |
| 2-Person Households | 21 (53.8%) | 0 (0.0%) |
| 3-Person Households | 4 (10.3%) | 0 (0.0%) |
| 4-Person Households | 2 (5.1%) | 0 (0.0%) |
| 5-Person Households | 0 (0.0%) | 0 (0.0%) |
| 6-Person Households | 0 (0.0%) | 0 (0.0%) |
| 7+ Person Households | 0 (0.0%) | 0 (0.0%) |
| Total | 27 (69.2%) | 12 (30.8%) |
Female Fertility in Wilson City
Fertility by Age in Wilson City
| Age Bracket | Women with Births | Births / 1,000 Women |
| 15 to 19 years | 0 (0.0%) | 0.0 |
| 20 to 34 years | 0 (0.0%) | 0.0 |
| 35 to 50 years | 0 (0.0%) | 0.0 |
| Total | 0 (0.0%) | 0.0 |
Fertility by Age by Marriage Status in Wilson City
| Age Bracket | Married | Unmarried |
| 15 to 19 years | 0 (0.0%) | 0 (0.0%) |
| 20 to 34 years | 0 (0.0%) | 0 (0.0%) |
| 35 to 50 years | 0 (0.0%) | 0 (0.0%) |
| Total | 0 (0.0%) | 0 (0.0%) |
Fertility by Education in Wilson City
| Educational Attainment | Women with Births | Births / 1,000 Women |
| Less than High School | 0 (0.0%) | 0.0 |
| High School Diploma | 0 (0.0%) | 0.0 |
| College or Associate's Degree | 0 (0.0%) | 0.0 |
| Bachelor's Degree | 0 (0.0%) | 0.0 |
| Graduate Degree | 0 (0.0%) | 0.0 |
| Total | 0 (0.0%) | 0.0 |
Fertility by Education by Marriage Status in Wilson City
| Educational Attainment | Married | Unmarried |
| Less than High School | 0 (0.0%) | 0 (0.0%) |
| High School Diploma | 0 (0.0%) | 0 (0.0%) |
| College or Associate's Degree | 0 (0.0%) | 0 (0.0%) |
| Bachelor's Degree | 0 (0.0%) | 0 (0.0%) |
| Graduate Degree | 0 (0.0%) | 0 (0.0%) |
| Total | 0 (0.0%) | 0 (0.0%) |
Employment Characteristics in Wilson City
Employment by Class of Employer in Wilson City
Among the 28 employed individuals in Wilson City, private company employees (20 | 71.4%), state government employees (7 | 25.0%), and not-for-profit organizations (1 | 3.6%) make up the most common classes of employment.
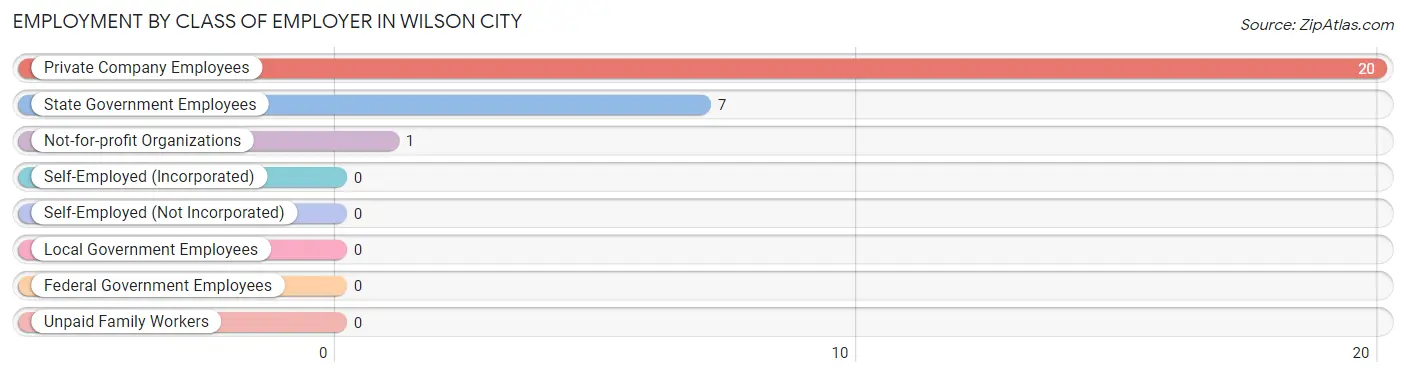
| Employer Class | # Employees | % Employees |
| Private Company Employees | 20 | 71.4% |
| Self-Employed (Incorporated) | 0 | 0.0% |
| Self-Employed (Not Incorporated) | 0 | 0.0% |
| Not-for-profit Organizations | 1 | 3.6% |
| Local Government Employees | 0 | 0.0% |
| State Government Employees | 7 | 25.0% |
| Federal Government Employees | 0 | 0.0% |
| Unpaid Family Workers | 0 | 0.0% |
| Total | 28 | 100.0% |
Employment Status by Age in Wilson City
According to the labor force statistics for Wilson City, out of the total population over 16 years of age (54), 59.3% or 32 individuals are in the labor force, with 12.5% or 4 of them unemployed. The age group with the highest labor force participation rate is 45 to 54 years, with 100.0% or 17 individuals in the labor force. Within the labor force, the 35 to 44 years age range has the highest percentage of unemployed individuals, with 100.0% or 4 of them being unemployed.
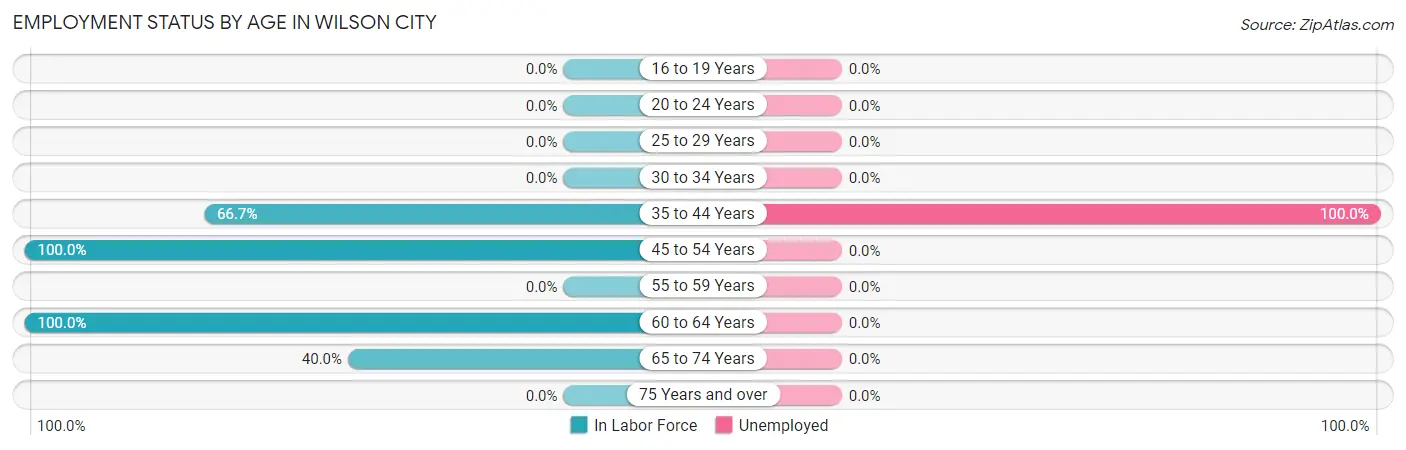
| Age Bracket | In Labor Force | Unemployed |
| 16 to 19 Years | 0 (0.0%) | 0 (0.0%) |
| 20 to 24 Years | 0 (0.0%) | 0 (0.0%) |
| 25 to 29 Years | 0 (0.0%) | 0 (0.0%) |
| 30 to 34 Years | 0 (0.0%) | 0 (0.0%) |
| 35 to 44 Years | 4 (66.7%) | 4 (100.0%) |
| 45 to 54 Years | 17 (100.0%) | 0 (0.0%) |
| 55 to 59 Years | 0 (0.0%) | 0 (0.0%) |
| 60 to 64 Years | 1 (100.0%) | 0 (0.0%) |
| 65 to 74 Years | 10 (40.0%) | 0 (0.0%) |
| 75 Years and over | 0 (0.0%) | 0 (0.0%) |
| Total | 32 (59.3%) | 4 (12.5%) |
Employment Status by Educational Attainment in Wilson City
According to labor force statistics for Wilson City, 91.7% of individuals (22) out of the total population between 25 and 64 years of age (24) are in the labor force, with 18.2% or 4 of them being unemployed. The group with the highest labor force participation rate are those with the educational attainment of high school diploma, with 100.0% or 16 individuals in the labor force. Within the labor force, individuals with high school diploma education have the highest percentage of unemployment, with 25.0% or 4 of them being unemployed.
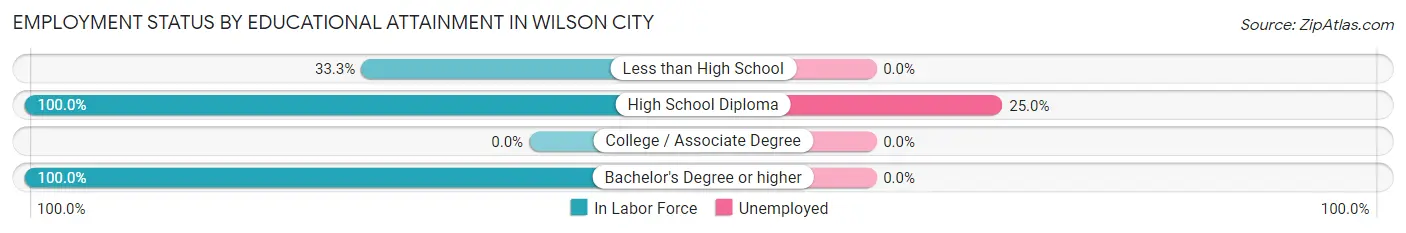
| Educational Attainment | In Labor Force | Unemployed |
| Less than High School | 1 (33.3%) | 0 (0.0%) |
| High School Diploma | 16 (100.0%) | 4 (25.0%) |
| College / Associate Degree | 0 (0.0%) | 0 (0.0%) |
| Bachelor's Degree or higher | 5 (100.0%) | 0 (0.0%) |
| Total | 22 (91.7%) | 4 (18.2%) |
Employment Occupations by Sex in Wilson City
Management, Business, Science and Arts Occupations
The most common Management, Business, Science and Arts occupations in Wilson City are , and Management (5 | 17.9%).
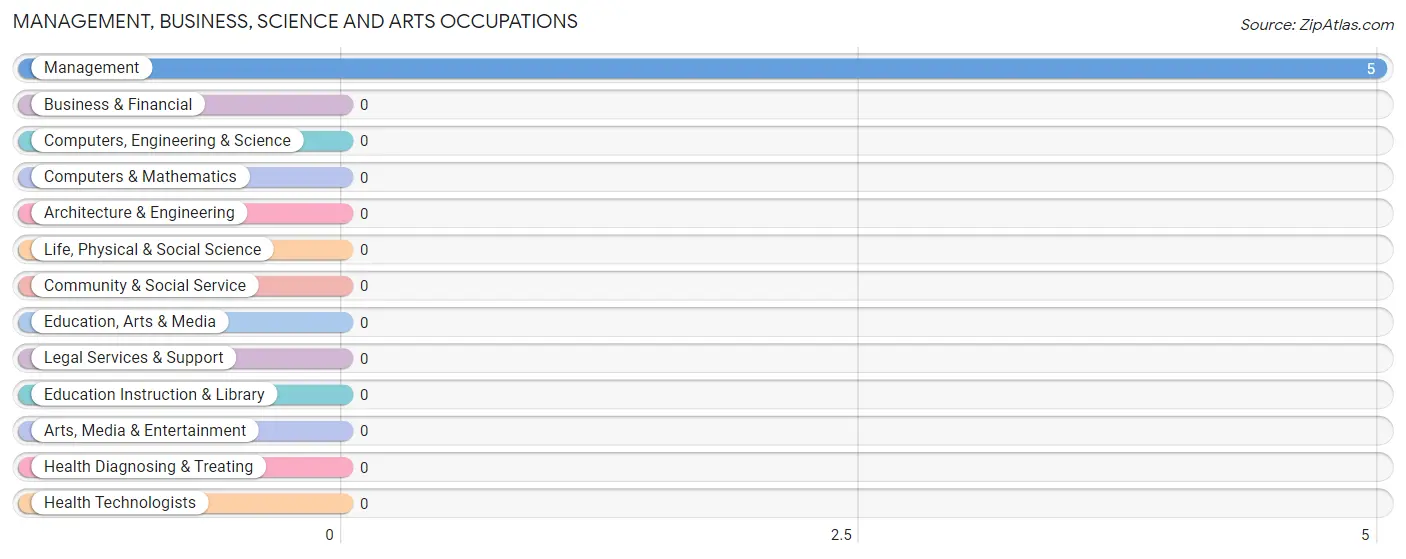
Management, Business, Science and Arts Occupations by Sex
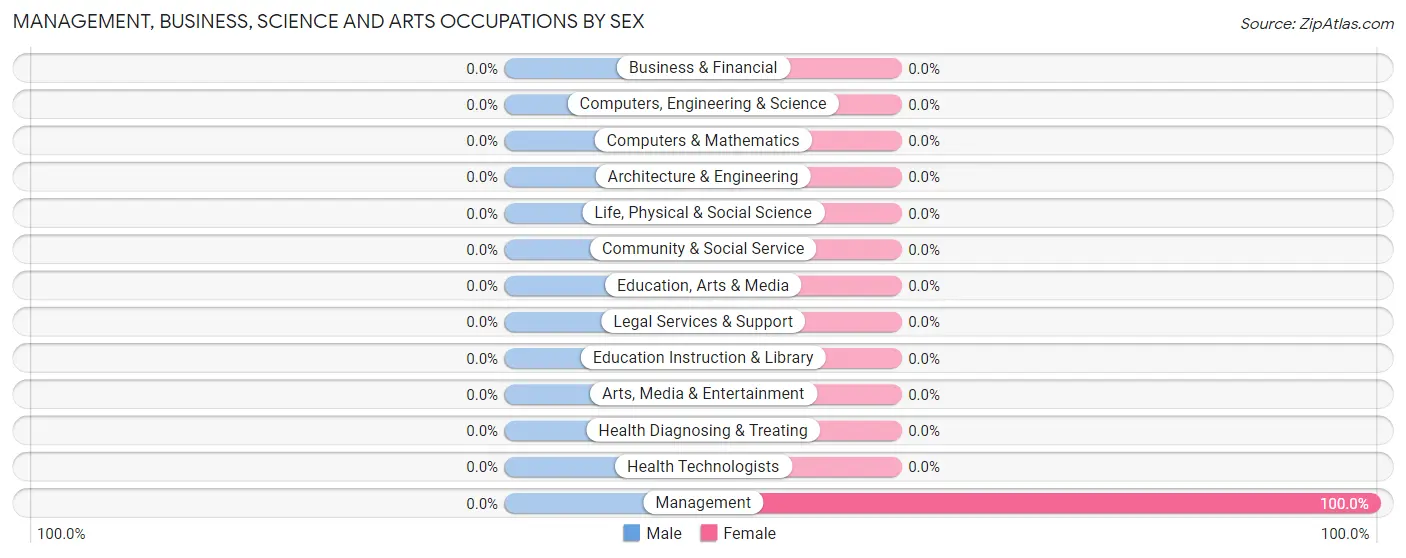
| Occupation | Male | Female |
| Management | 0 (0.0%) | 5 (100.0%) |
| Business & Financial | 0 (0.0%) | 0 (0.0%) |
| Computers, Engineering & Science | 0 (0.0%) | 0 (0.0%) |
| Computers & Mathematics | 0 (0.0%) | 0 (0.0%) |
| Architecture & Engineering | 0 (0.0%) | 0 (0.0%) |
| Life, Physical & Social Science | 0 (0.0%) | 0 (0.0%) |
| Community & Social Service | 0 (0.0%) | 0 (0.0%) |
| Education, Arts & Media | 0 (0.0%) | 0 (0.0%) |
| Legal Services & Support | 0 (0.0%) | 0 (0.0%) |
| Education Instruction & Library | 0 (0.0%) | 0 (0.0%) |
| Arts, Media & Entertainment | 0 (0.0%) | 0 (0.0%) |
| Health Diagnosing & Treating | 0 (0.0%) | 0 (0.0%) |
| Health Technologists | 0 (0.0%) | 0 (0.0%) |
| Total (Category) | 0 (0.0%) | 5 (100.0%) |
| Total (Overall) | 20 (71.4%) | 8 (28.6%) |
Services Occupations
The most common Services occupations in Wilson City are , and Food Preparation & Serving (1 | 3.6%).
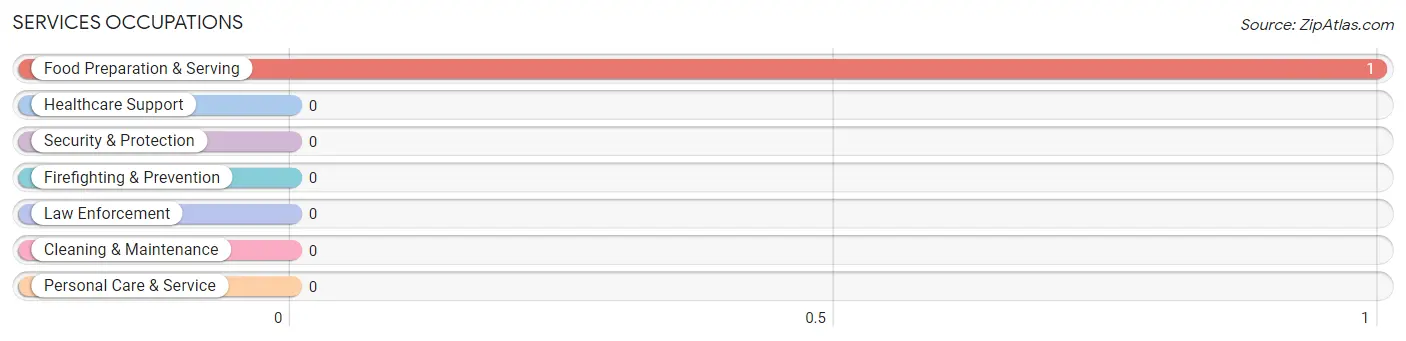
Services Occupations by Sex
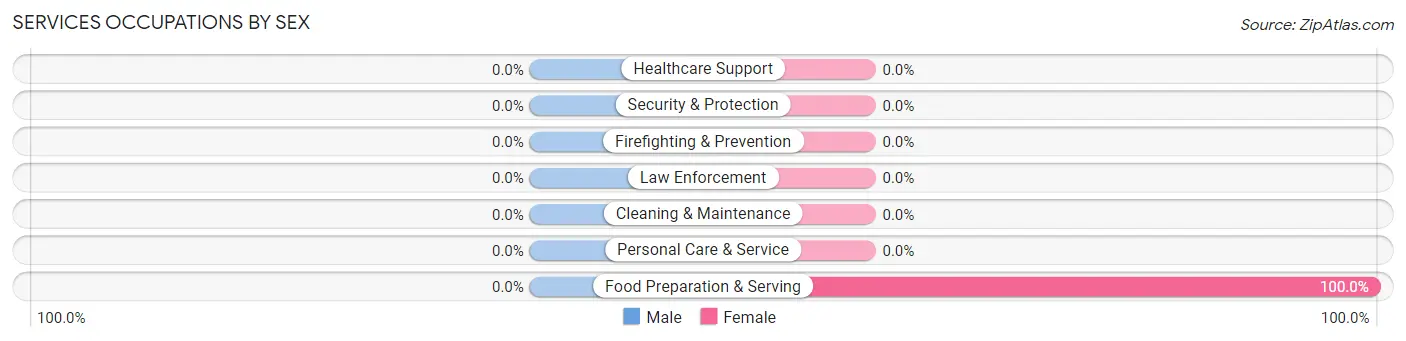
| Occupation | Male | Female |
| Healthcare Support | 0 (0.0%) | 0 (0.0%) |
| Security & Protection | 0 (0.0%) | 0 (0.0%) |
| Firefighting & Prevention | 0 (0.0%) | 0 (0.0%) |
| Law Enforcement | 0 (0.0%) | 0 (0.0%) |
| Food Preparation & Serving | 0 (0.0%) | 1 (100.0%) |
| Cleaning & Maintenance | 0 (0.0%) | 0 (0.0%) |
| Personal Care & Service | 0 (0.0%) | 0 (0.0%) |
| Total (Category) | 0 (0.0%) | 1 (100.0%) |
| Total (Overall) | 20 (71.4%) | 8 (28.6%) |
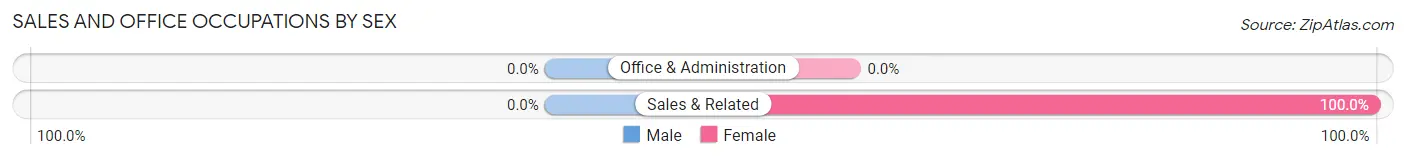
Sales and Office Occupations
The most common Sales and Office occupations in Wilson City are , and Sales & Related (2 | 7.1%).
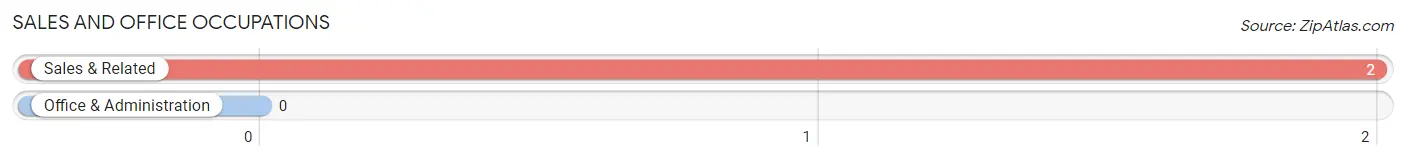
Sales and Office Occupations by Sex
| Occupation | Male | Female |
| Sales & Related | 0 (0.0%) | 2 (100.0%) |
| Office & Administration | 0 (0.0%) | 0 (0.0%) |
| Total (Category) | 0 (0.0%) | 2 (100.0%) |
| Total (Overall) | 20 (71.4%) | 8 (28.6%) |
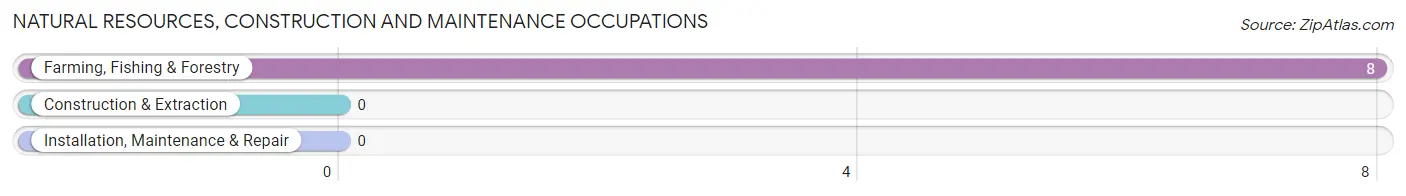
Natural Resources, Construction and Maintenance Occupations
The most common Natural Resources, Construction and Maintenance occupations in Wilson City are , and Farming, Fishing & Forestry (8 | 28.6%).
Natural Resources, Construction and Maintenance Occupations by Sex
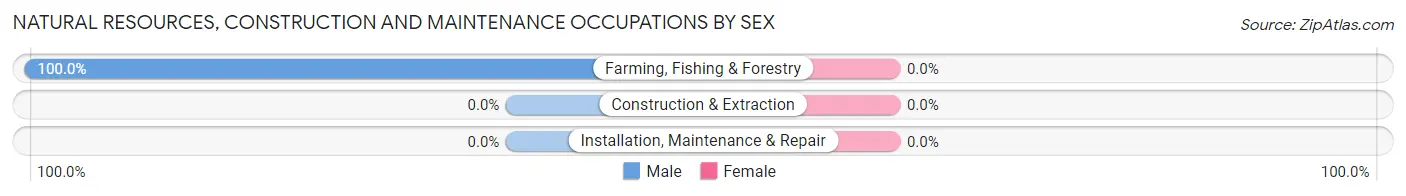
| Occupation | Male | Female |
| Farming, Fishing & Forestry | 8 (100.0%) | 0 (0.0%) |
| Construction & Extraction | 0 (0.0%) | 0 (0.0%) |
| Installation, Maintenance & Repair | 0 (0.0%) | 0 (0.0%) |
| Total (Category) | 8 (100.0%) | 0 (0.0%) |
| Total (Overall) | 20 (71.4%) | 8 (28.6%) |
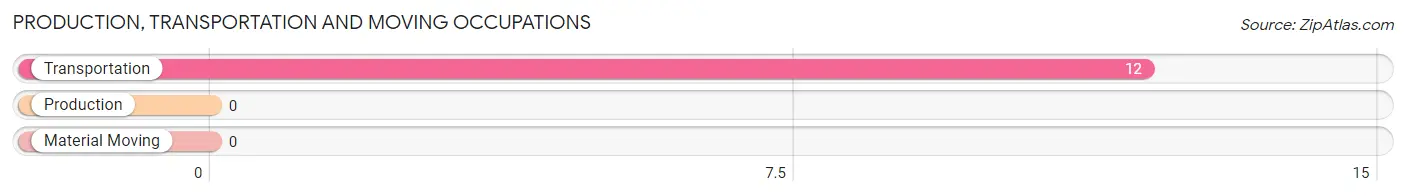
Production, Transportation and Moving Occupations
The most common Production, Transportation and Moving occupations in Wilson City are , and Transportation (12 | 42.9%).
Production, Transportation and Moving Occupations by Sex
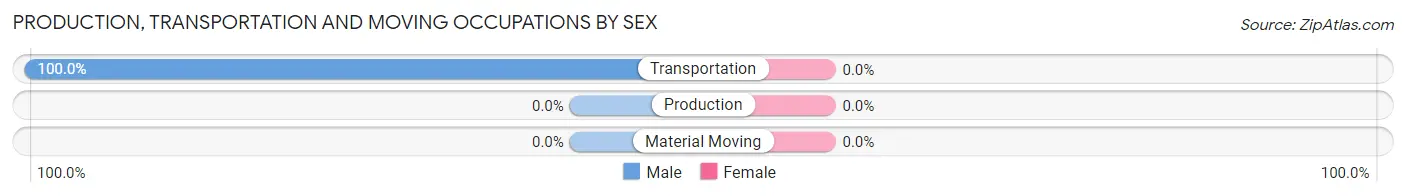
| Occupation | Male | Female |
| Production | 0 (0.0%) | 0 (0.0%) |
| Transportation | 12 (100.0%) | 0 (0.0%) |
| Material Moving | 0 (0.0%) | 0 (0.0%) |
| Total (Category) | 12 (100.0%) | 0 (0.0%) |
| Total (Overall) | 20 (71.4%) | 8 (28.6%) |
Employment Industries by Sex in Wilson City
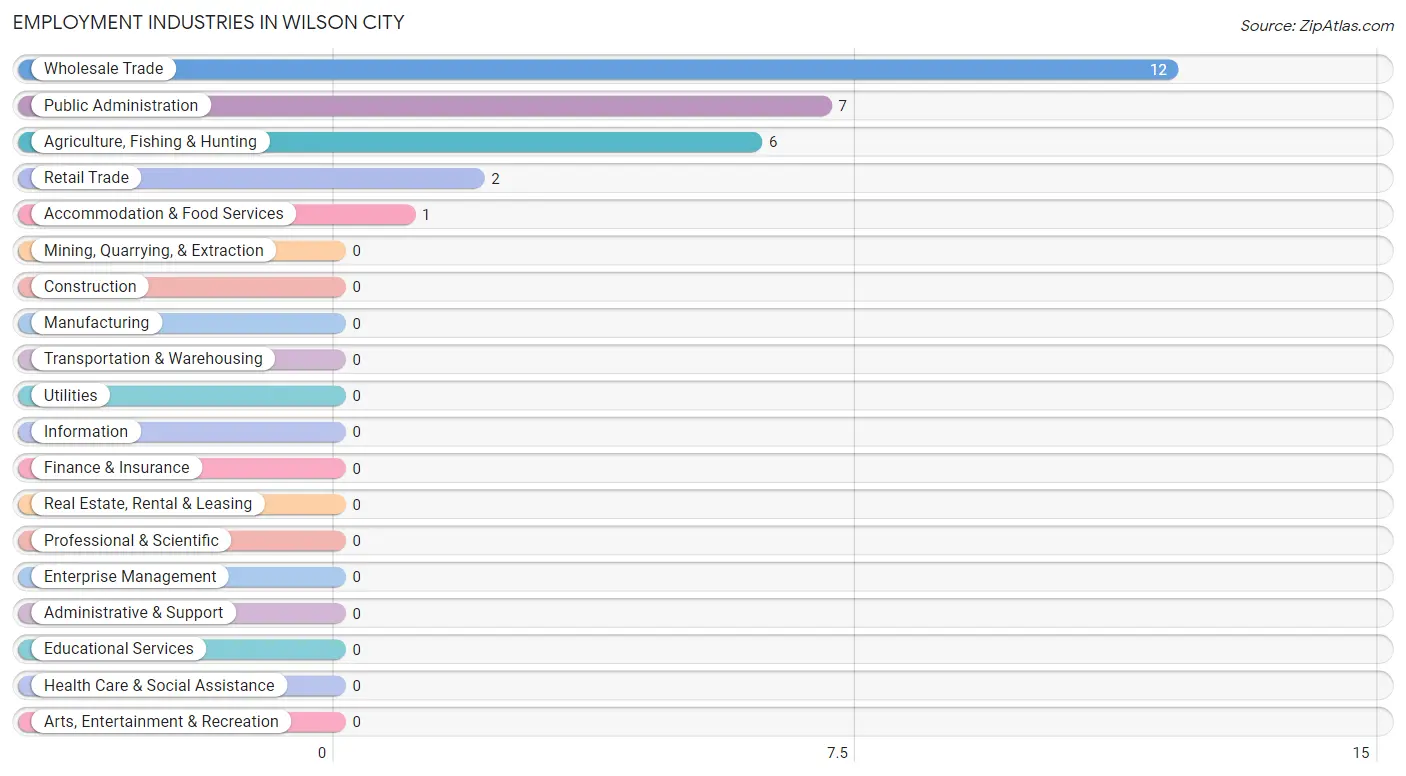
Employment Industries in Wilson City
The major employment industries in Wilson City include Wholesale Trade (12 | 42.9%), Public Administration (7 | 25.0%), Agriculture, Fishing & Hunting (6 | 21.4%), Retail Trade (2 | 7.1%), and Accommodation & Food Services (1 | 3.6%).
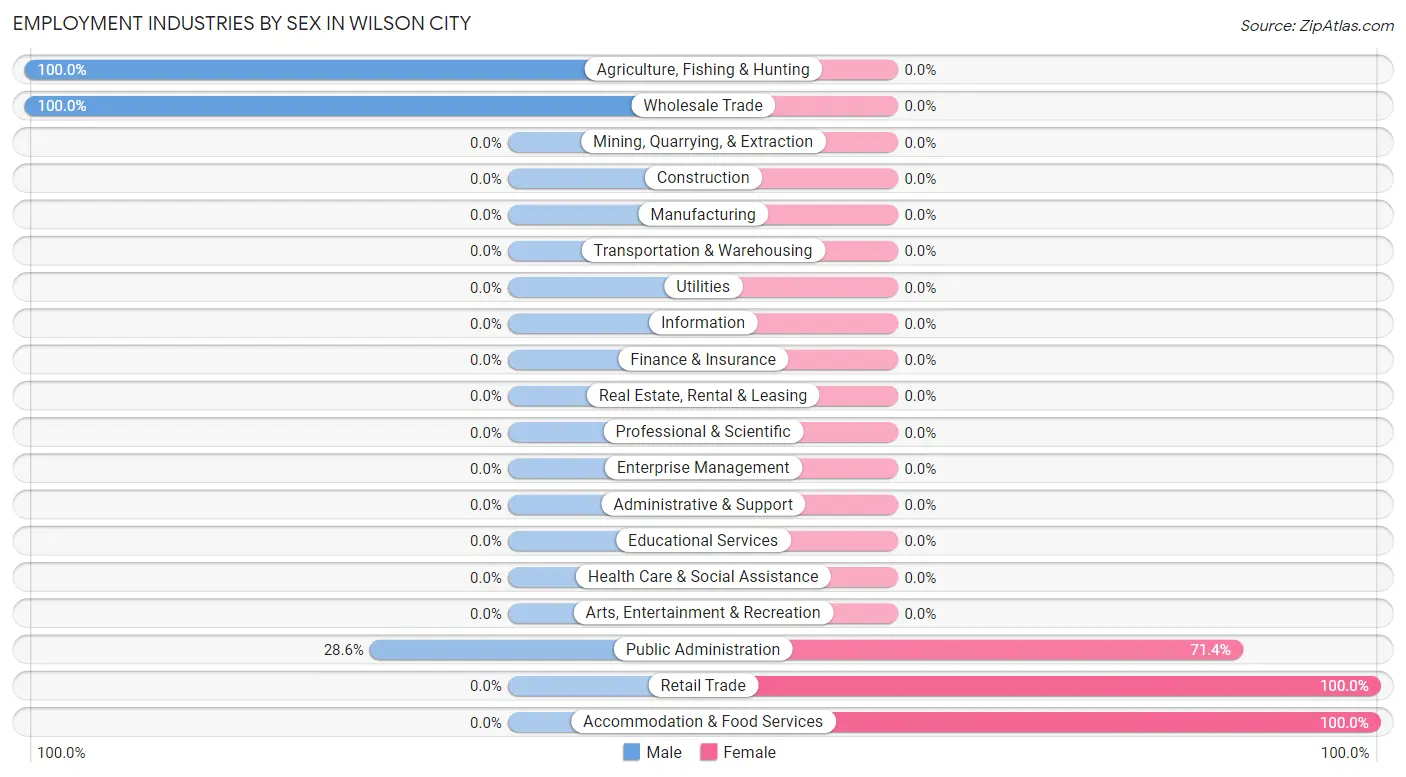
Employment Industries by Sex in Wilson City
The Wilson City industries that see more men than women are Agriculture, Fishing & Hunting (100.0%), Wholesale Trade (100.0%), and Public Administration (28.6%), whereas the industries that tend to have a higher number of women are Retail Trade (100.0%), Accommodation & Food Services (100.0%), and Public Administration (71.4%).
| Industry | Male | Female |
| Agriculture, Fishing & Hunting | 6 (100.0%) | 0 (0.0%) |
| Mining, Quarrying, & Extraction | 0 (0.0%) | 0 (0.0%) |
| Construction | 0 (0.0%) | 0 (0.0%) |
| Manufacturing | 0 (0.0%) | 0 (0.0%) |
| Wholesale Trade | 12 (100.0%) | 0 (0.0%) |
| Retail Trade | 0 (0.0%) | 2 (100.0%) |
| Transportation & Warehousing | 0 (0.0%) | 0 (0.0%) |
| Utilities | 0 (0.0%) | 0 (0.0%) |
| Information | 0 (0.0%) | 0 (0.0%) |
| Finance & Insurance | 0 (0.0%) | 0 (0.0%) |
| Real Estate, Rental & Leasing | 0 (0.0%) | 0 (0.0%) |
| Professional & Scientific | 0 (0.0%) | 0 (0.0%) |
| Enterprise Management | 0 (0.0%) | 0 (0.0%) |
| Administrative & Support | 0 (0.0%) | 0 (0.0%) |
| Educational Services | 0 (0.0%) | 0 (0.0%) |
| Health Care & Social Assistance | 0 (0.0%) | 0 (0.0%) |
| Arts, Entertainment & Recreation | 0 (0.0%) | 0 (0.0%) |
| Accommodation & Food Services | 0 (0.0%) | 1 (100.0%) |
| Public Administration | 2 (28.6%) | 5 (71.4%) |
| Total | 20 (71.4%) | 8 (28.6%) |
Education in Wilson City
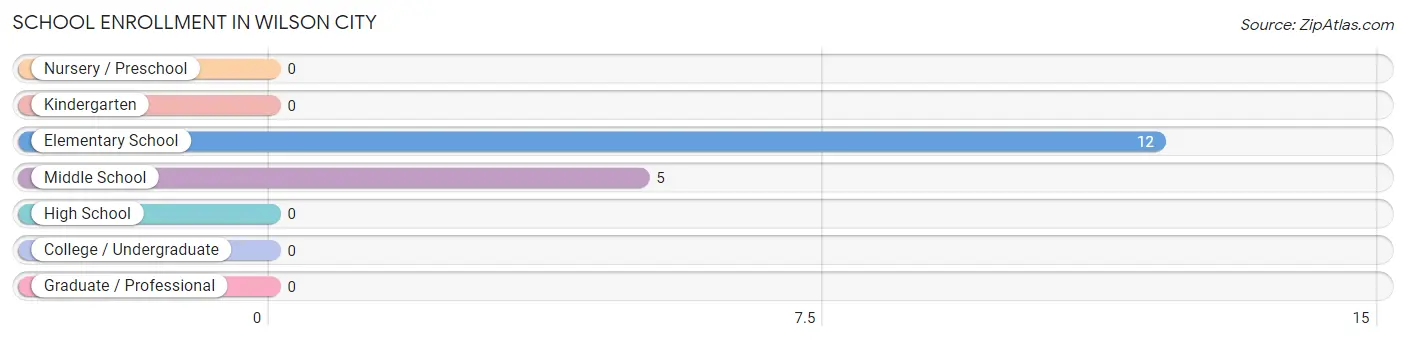
School Enrollment in Wilson City
The most common levels of schooling among the 17 students in Wilson City are elementary school (12 | 70.6%), and middle school (5 | 29.4%).
| School Level | # Students | % Students |
| Nursery / Preschool | 0 | 0.0% |
| Kindergarten | 0 | 0.0% |
| Elementary School | 12 | 70.6% |
| Middle School | 5 | 29.4% |
| High School | 0 | 0.0% |
| College / Undergraduate | 0 | 0.0% |
| Graduate / Professional | 0 | 0.0% |
| Total | 17 | 100.0% |
School Enrollment by Age by Funding Source in Wilson City
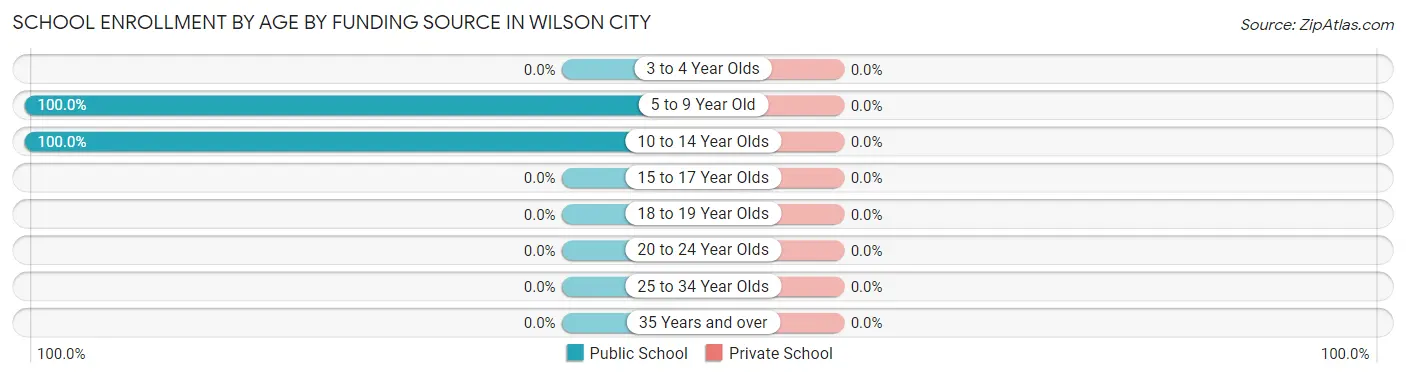
| Age Bracket | Public School | Private School |
| 3 to 4 Year Olds | 0 (0.0%) | 0 (0.0%) |
| 5 to 9 Year Old | 3 (100.0%) | 0 (0.0%) |
| 10 to 14 Year Olds | 14 (100.0%) | 0 (0.0%) |
| 15 to 17 Year Olds | 0 (0.0%) | 0 (0.0%) |
| 18 to 19 Year Olds | 0 (0.0%) | 0 (0.0%) |
| 20 to 24 Year Olds | 0 (0.0%) | 0 (0.0%) |
| 25 to 34 Year Olds | 0 (0.0%) | 0 (0.0%) |
| 35 Years and over | 0 (0.0%) | 0 (0.0%) |
| Total | 17 (100.0%) | 0 (0.0%) |
Educational Attainment by Field of Study in Wilson City
Education (6 | 31.6%), arts & humanities (5 | 26.3%), psychology (3 | 15.8%), bio, nature & agricultural (2 | 10.5%), and literature & languages (2 | 10.5%) are the most common fields of study among 19 individuals in Wilson City who have obtained a bachelor's degree or higher.
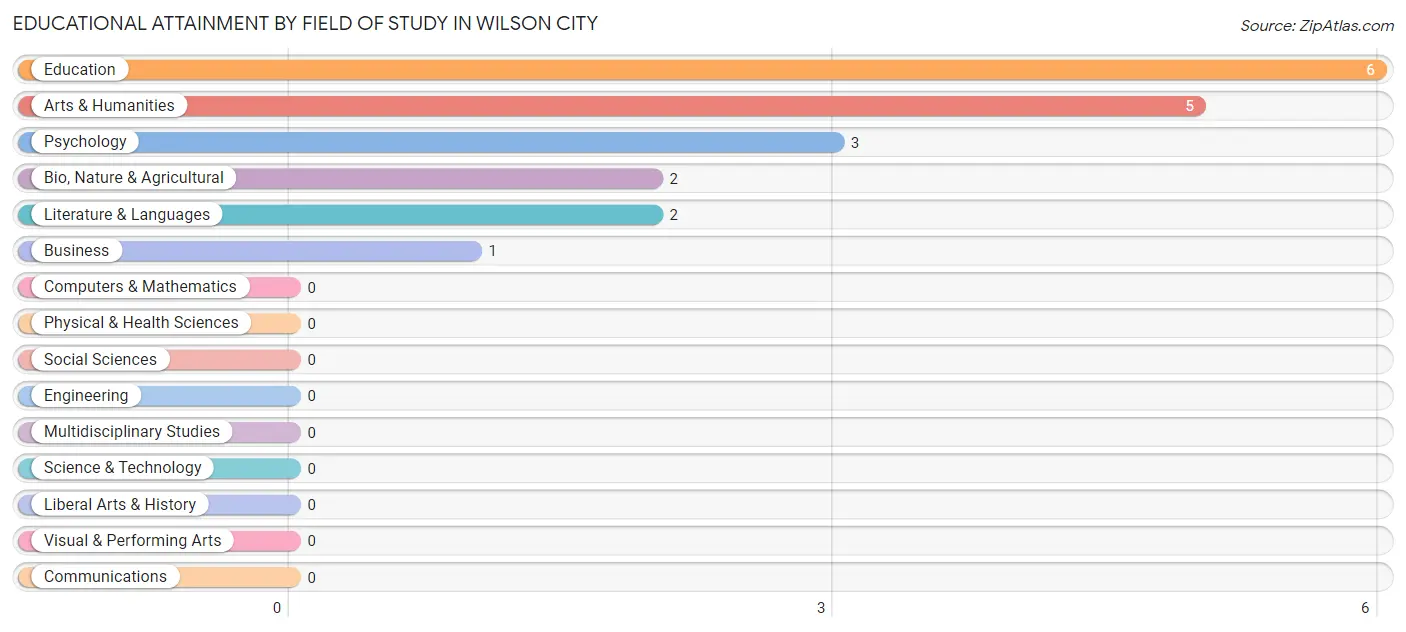
| Field of Study | # Graduates | % Graduates |
| Computers & Mathematics | 0 | 0.0% |
| Bio, Nature & Agricultural | 2 | 10.5% |
| Physical & Health Sciences | 0 | 0.0% |
| Psychology | 3 | 15.8% |
| Social Sciences | 0 | 0.0% |
| Engineering | 0 | 0.0% |
| Multidisciplinary Studies | 0 | 0.0% |
| Science & Technology | 0 | 0.0% |
| Business | 1 | 5.3% |
| Education | 6 | 31.6% |
| Literature & Languages | 2 | 10.5% |
| Liberal Arts & History | 0 | 0.0% |
| Visual & Performing Arts | 0 | 0.0% |
| Communications | 0 | 0.0% |
| Arts & Humanities | 5 | 26.3% |
| Total | 19 | 100.0% |
Transportation & Commute in Wilson City
Vehicle Availability by Sex in Wilson City
The most prevalent vehicle ownership categories in Wilson City are males with 3 vehicles (12, accounting for 60.0%) and females with 3 vehicles (6, making up 150.0%).
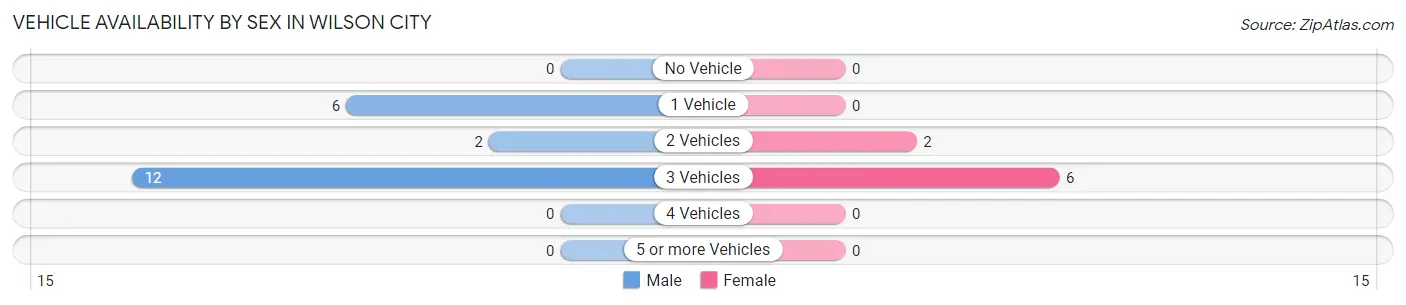
| Vehicles Available | Male | Female |
| No Vehicle | 0 (0.0%) | 0 (0.0%) |
| 1 Vehicle | 6 (30.0%) | 0 (0.0%) |
| 2 Vehicles | 2 (10.0%) | 2 (25.0%) |
| 3 Vehicles | 12 (60.0%) | 6 (75.0%) |
| 4 Vehicles | 0 (0.0%) | 0 (0.0%) |
| 5 or more Vehicles | 0 (0.0%) | 0 (0.0%) |
| Total | 20 (100.0%) | 8 (100.0%) |
Commute Time in Wilson City
The most frequently occuring commute durations in Wilson City are 60 to 89 minutes (12 commuters, 42.9%), 5 to 9 minutes (6 commuters, 21.4%), and 10 to 14 minutes (5 commuters, 17.9%).
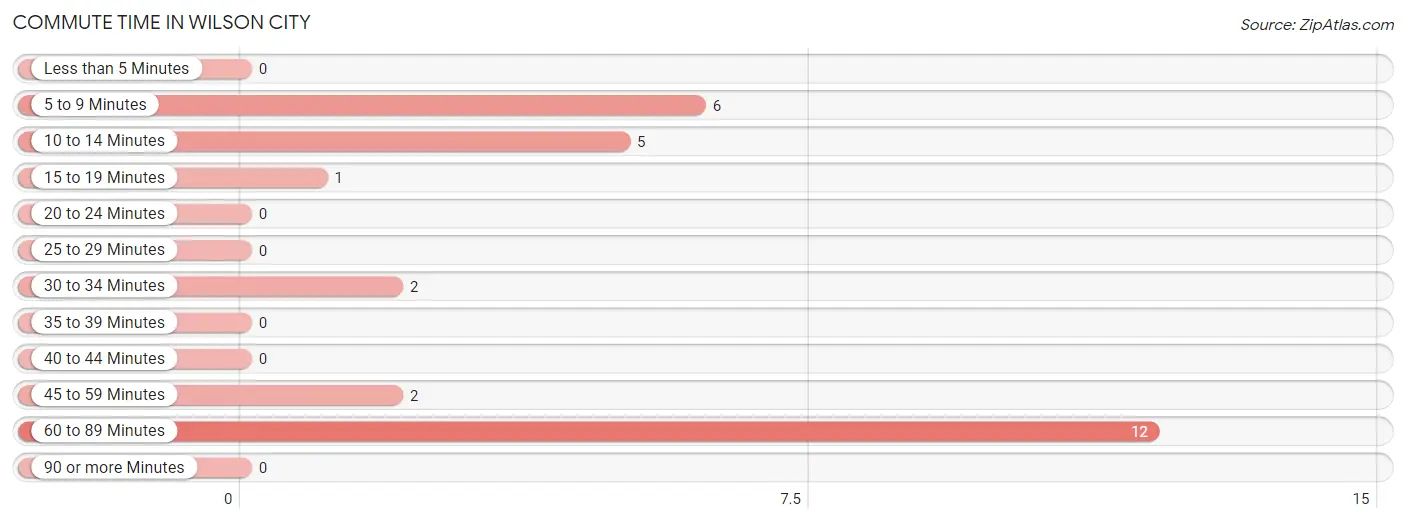
| Commute Time | # Commuters | % Commuters |
| Less than 5 Minutes | 0 | 0.0% |
| 5 to 9 Minutes | 6 | 21.4% |
| 10 to 14 Minutes | 5 | 17.9% |
| 15 to 19 Minutes | 1 | 3.6% |
| 20 to 24 Minutes | 0 | 0.0% |
| 25 to 29 Minutes | 0 | 0.0% |
| 30 to 34 Minutes | 2 | 7.1% |
| 35 to 39 Minutes | 0 | 0.0% |
| 40 to 44 Minutes | 0 | 0.0% |
| 45 to 59 Minutes | 2 | 7.1% |
| 60 to 89 Minutes | 12 | 42.9% |
| 90 or more Minutes | 0 | 0.0% |
Commute Time by Sex in Wilson City
The most common commute times in Wilson City are 60 to 89 minutes (12 commuters, 60.0%) for males and 10 to 14 minutes (5 commuters, 62.5%) for females.
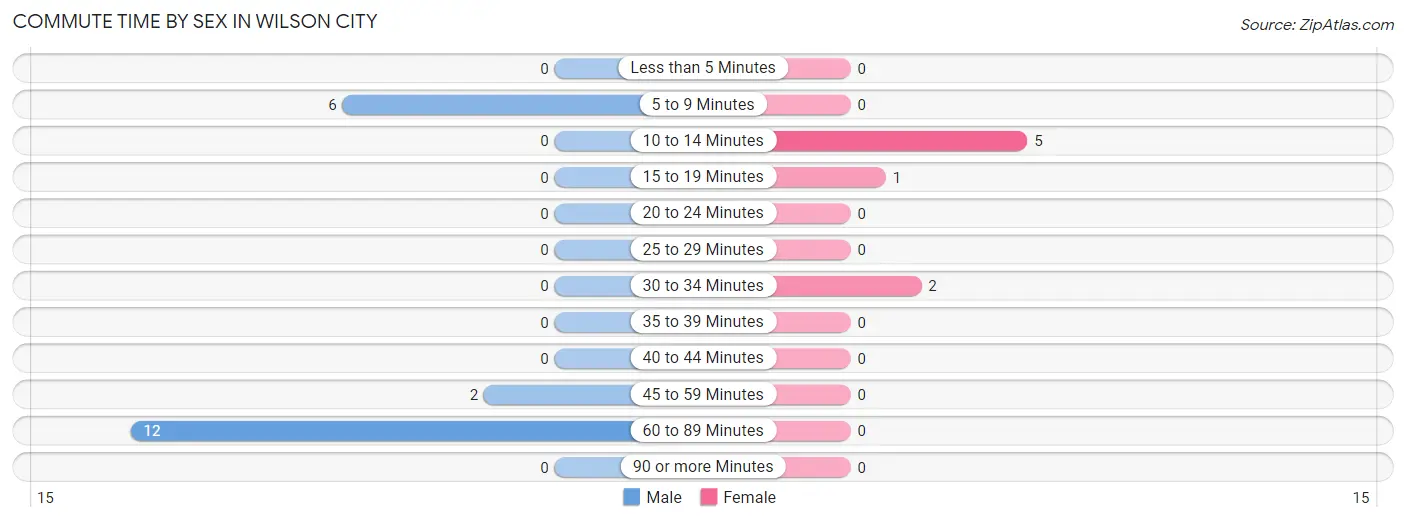
| Commute Time | Male | Female |
| Less than 5 Minutes | 0 (0.0%) | 0 (0.0%) |
| 5 to 9 Minutes | 6 (30.0%) | 0 (0.0%) |
| 10 to 14 Minutes | 0 (0.0%) | 5 (62.5%) |
| 15 to 19 Minutes | 0 (0.0%) | 1 (12.5%) |
| 20 to 24 Minutes | 0 (0.0%) | 0 (0.0%) |
| 25 to 29 Minutes | 0 (0.0%) | 0 (0.0%) |
| 30 to 34 Minutes | 0 (0.0%) | 2 (25.0%) |
| 35 to 39 Minutes | 0 (0.0%) | 0 (0.0%) |
| 40 to 44 Minutes | 0 (0.0%) | 0 (0.0%) |
| 45 to 59 Minutes | 2 (10.0%) | 0 (0.0%) |
| 60 to 89 Minutes | 12 (60.0%) | 0 (0.0%) |
| 90 or more Minutes | 0 (0.0%) | 0 (0.0%) |
Time of Departure to Work by Sex in Wilson City
The most frequent times of departure to work in Wilson City are 12:00 AM to 4:59 AM (12, 60.0%) for males and 8:00 AM to 8:29 AM (6, 75.0%) for females.
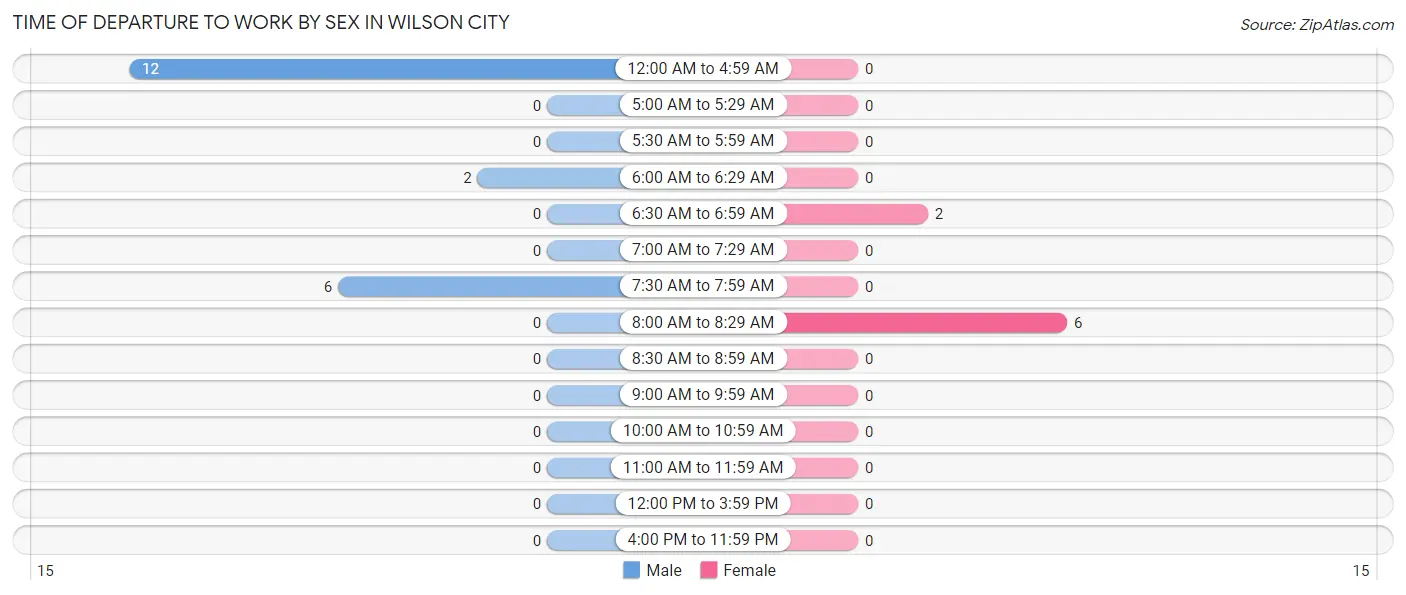
| Time of Departure | Male | Female |
| 12:00 AM to 4:59 AM | 12 (60.0%) | 0 (0.0%) |
| 5:00 AM to 5:29 AM | 0 (0.0%) | 0 (0.0%) |
| 5:30 AM to 5:59 AM | 0 (0.0%) | 0 (0.0%) |
| 6:00 AM to 6:29 AM | 2 (10.0%) | 0 (0.0%) |
| 6:30 AM to 6:59 AM | 0 (0.0%) | 2 (25.0%) |
| 7:00 AM to 7:29 AM | 0 (0.0%) | 0 (0.0%) |
| 7:30 AM to 7:59 AM | 6 (30.0%) | 0 (0.0%) |
| 8:00 AM to 8:29 AM | 0 (0.0%) | 6 (75.0%) |
| 8:30 AM to 8:59 AM | 0 (0.0%) | 0 (0.0%) |
| 9:00 AM to 9:59 AM | 0 (0.0%) | 0 (0.0%) |
| 10:00 AM to 10:59 AM | 0 (0.0%) | 0 (0.0%) |
| 11:00 AM to 11:59 AM | 0 (0.0%) | 0 (0.0%) |
| 12:00 PM to 3:59 PM | 0 (0.0%) | 0 (0.0%) |
| 4:00 PM to 11:59 PM | 0 (0.0%) | 0 (0.0%) |
| Total | 20 (100.0%) | 8 (100.0%) |
Housing Occupancy in Wilson City
Occupancy by Ownership in Wilson City
Of the total 39 dwellings in Wilson City, owner-occupied units account for 33 (84.6%), while renter-occupied units make up 6 (15.4%).
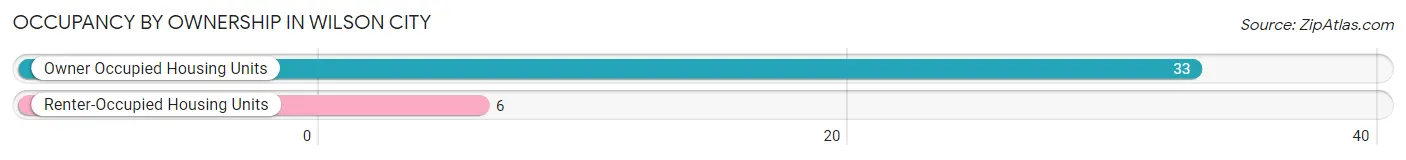
| Occupancy | # Housing Units | % Housing Units |
| Owner Occupied Housing Units | 33 | 84.6% |
| Renter-Occupied Housing Units | 6 | 15.4% |
| Total Occupied Housing Units | 39 | 100.0% |
Occupancy by Household Size in Wilson City
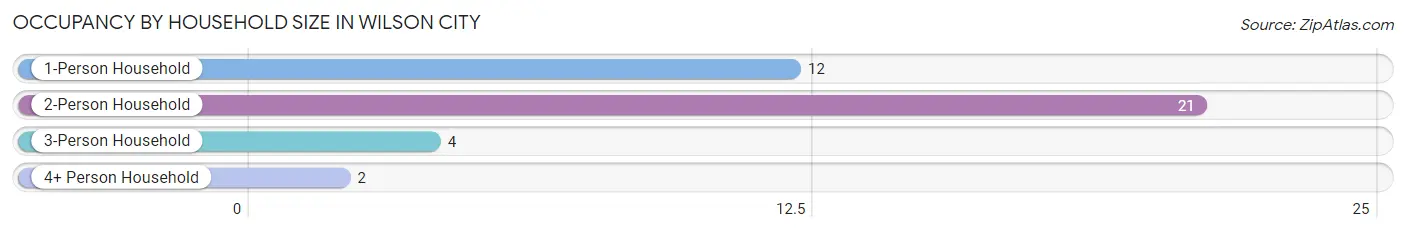
| Household Size | # Housing Units | % Housing Units |
| 1-Person Household | 12 | 30.8% |
| 2-Person Household | 21 | 53.8% |
| 3-Person Household | 4 | 10.3% |
| 4+ Person Household | 2 | 5.1% |
| Total Housing Units | 39 | 100.0% |
Occupancy by Ownership by Household Size in Wilson City
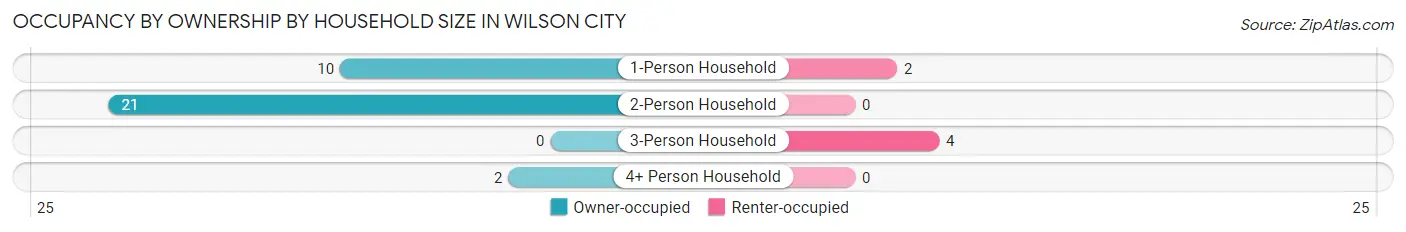
| Household Size | Owner-occupied | Renter-occupied |
| 1-Person Household | 10 (83.3%) | 2 (16.7%) |
| 2-Person Household | 21 (100.0%) | 0 (0.0%) |
| 3-Person Household | 0 (0.0%) | 4 (100.0%) |
| 4+ Person Household | 2 (100.0%) | 0 (0.0%) |
| Total Housing Units | 33 (84.6%) | 6 (15.4%) |
Occupancy by Educational Attainment in Wilson City
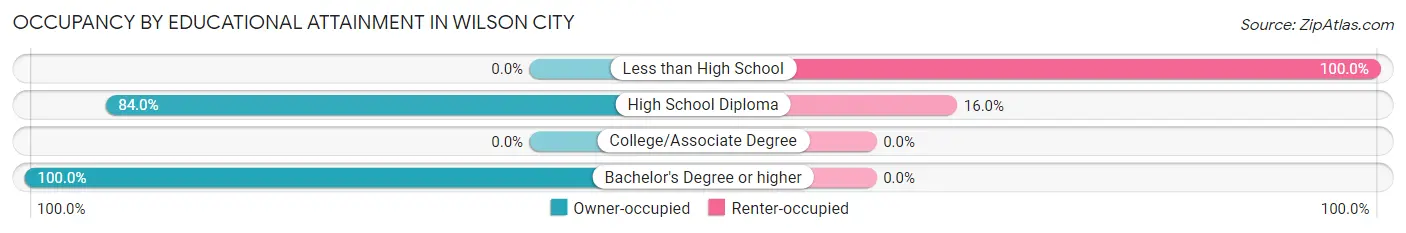
| Household Size | Owner-occupied | Renter-occupied |
| Less than High School | 0 (0.0%) | 2 (100.0%) |
| High School Diploma | 21 (84.0%) | 4 (16.0%) |
| College/Associate Degree | 0 (0.0%) | 0 (0.0%) |
| Bachelor's Degree or higher | 12 (100.0%) | 0 (0.0%) |
Occupancy by Age of Householder in Wilson City
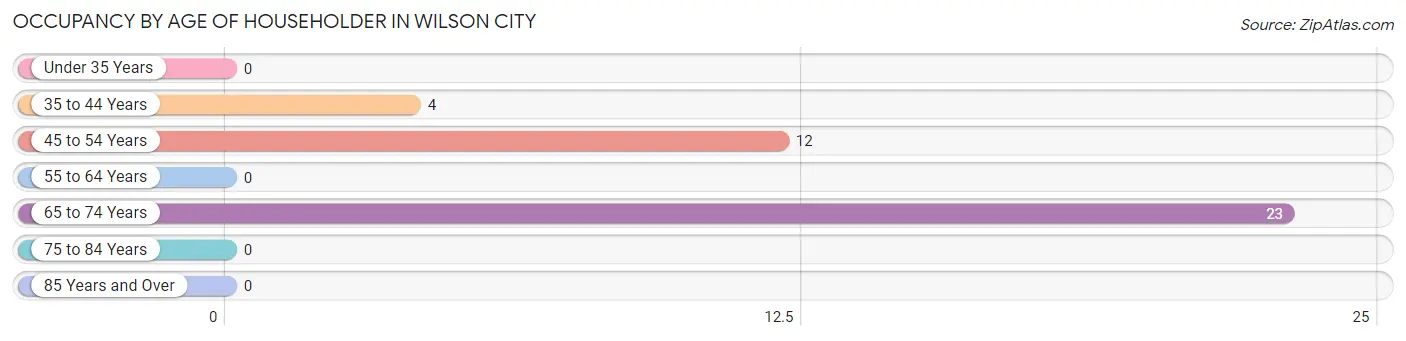
| Age Bracket | # Households | % Households |
| Under 35 Years | 0 | 0.0% |
| 35 to 44 Years | 4 | 10.3% |
| 45 to 54 Years | 12 | 30.8% |
| 55 to 64 Years | 0 | 0.0% |
| 65 to 74 Years | 23 | 59.0% |
| 75 to 84 Years | 0 | 0.0% |
| 85 Years and Over | 0 | 0.0% |
| Total | 39 | 100.0% |
Housing Finances in Wilson City
Median Income by Occupancy in Wilson City
| Occupancy Type | # Households | Median Income |
| Owner-Occupied | 33 (84.6%) | $0 |
| Renter-Occupied | 6 (15.4%) | $0 |
| Average | 39 (100.0%) | $0 |
Occupancy by Householder Income Bracket in Wilson City
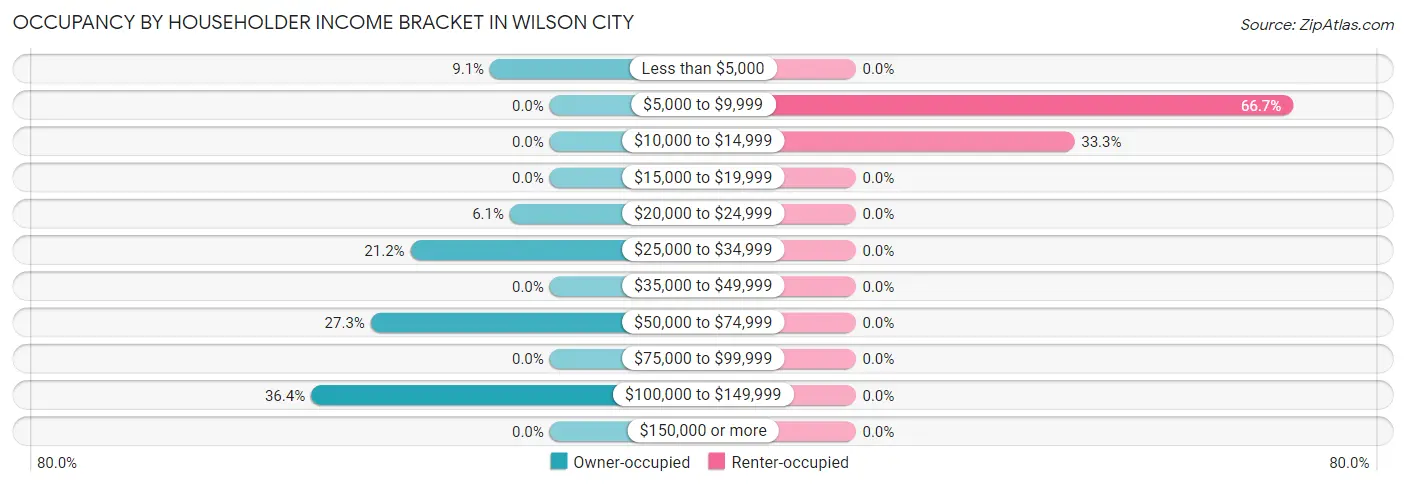
| Income Bracket | Owner-occupied | Renter-occupied |
| Less than $5,000 | 3 (9.1%) | 0 (0.0%) |
| $5,000 to $9,999 | 0 (0.0%) | 4 (66.7%) |
| $10,000 to $14,999 | 0 (0.0%) | 2 (33.3%) |
| $15,000 to $19,999 | 0 (0.0%) | 0 (0.0%) |
| $20,000 to $24,999 | 2 (6.1%) | 0 (0.0%) |
| $25,000 to $34,999 | 7 (21.2%) | 0 (0.0%) |
| $35,000 to $49,999 | 0 (0.0%) | 0 (0.0%) |
| $50,000 to $74,999 | 9 (27.3%) | 0 (0.0%) |
| $75,000 to $99,999 | 0 (0.0%) | 0 (0.0%) |
| $100,000 to $149,999 | 12 (36.4%) | 0 (0.0%) |
| $150,000 or more | 0 (0.0%) | 0 (0.0%) |
| Total | 33 (100.0%) | 6 (100.0%) |
Monthly Housing Cost Tiers in Wilson City
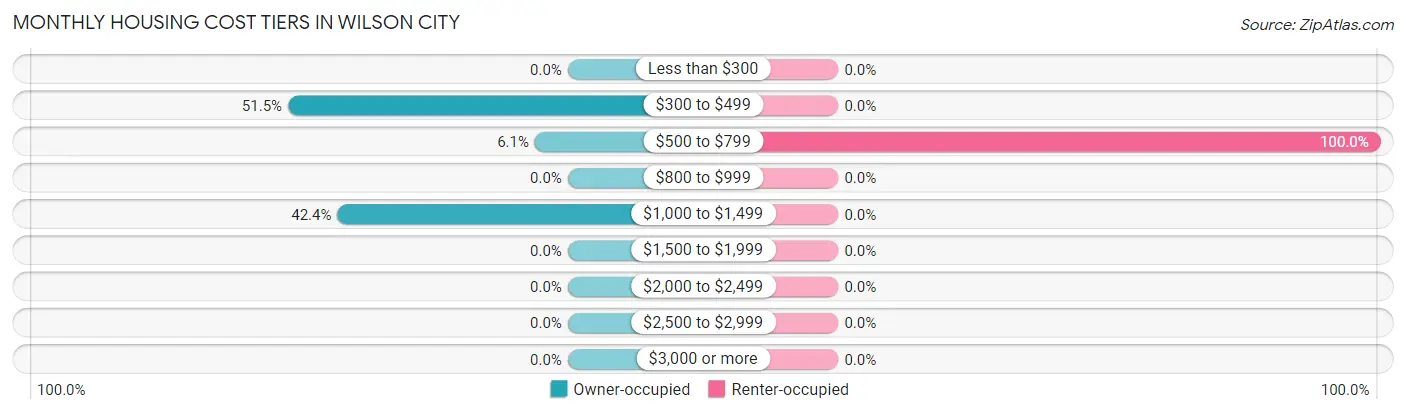
| Monthly Cost | Owner-occupied | Renter-occupied |
| Less than $300 | 0 (0.0%) | 0 (0.0%) |
| $300 to $499 | 17 (51.5%) | 0 (0.0%) |
| $500 to $799 | 2 (6.1%) | 6 (100.0%) |
| $800 to $999 | 0 (0.0%) | 0 (0.0%) |
| $1,000 to $1,499 | 14 (42.4%) | 0 (0.0%) |
| $1,500 to $1,999 | 0 (0.0%) | 0 (0.0%) |
| $2,000 to $2,499 | 0 (0.0%) | 0 (0.0%) |
| $2,500 to $2,999 | 0 (0.0%) | 0 (0.0%) |
| $3,000 or more | 0 (0.0%) | 0 (0.0%) |
| Total | 33 (100.0%) | 6 (100.0%) |
Physical Housing Characteristics in Wilson City
Housing Structures in Wilson City
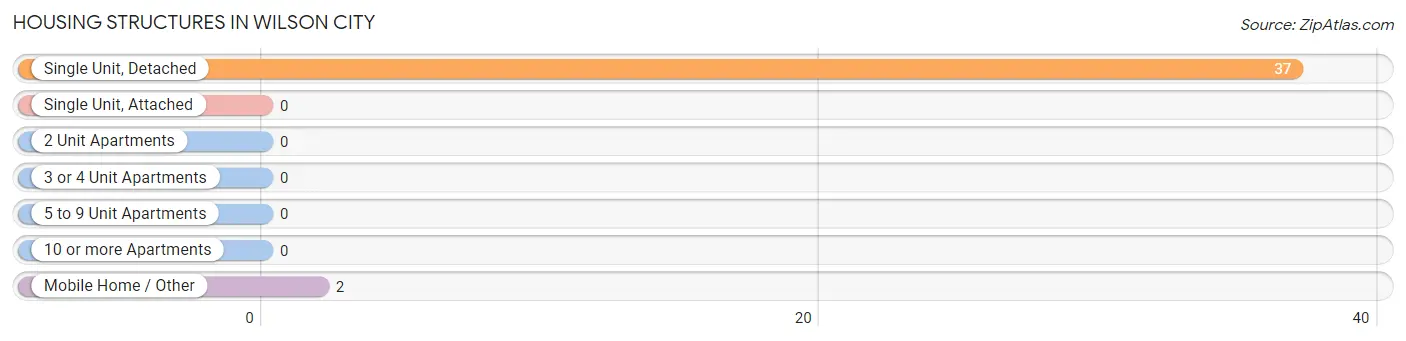
| Structure Type | # Housing Units | % Housing Units |
| Single Unit, Detached | 37 | 94.9% |
| Single Unit, Attached | 0 | 0.0% |
| 2 Unit Apartments | 0 | 0.0% |
| 3 or 4 Unit Apartments | 0 | 0.0% |
| 5 to 9 Unit Apartments | 0 | 0.0% |
| 10 or more Apartments | 0 | 0.0% |
| Mobile Home / Other | 2 | 5.1% |
| Total | 39 | 100.0% |
Housing Structures by Occupancy in Wilson City
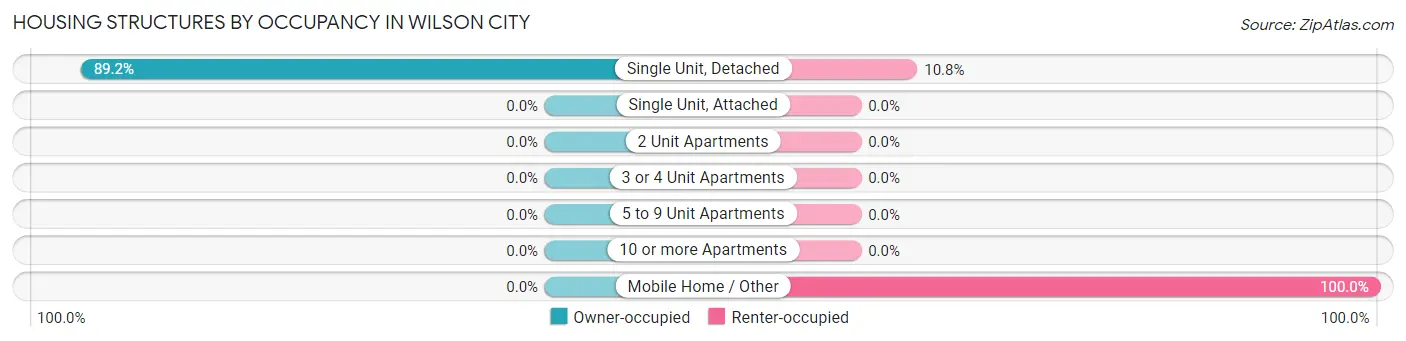
| Structure Type | Owner-occupied | Renter-occupied |
| Single Unit, Detached | 33 (89.2%) | 4 (10.8%) |
| Single Unit, Attached | 0 (0.0%) | 0 (0.0%) |
| 2 Unit Apartments | 0 (0.0%) | 0 (0.0%) |
| 3 or 4 Unit Apartments | 0 (0.0%) | 0 (0.0%) |
| 5 to 9 Unit Apartments | 0 (0.0%) | 0 (0.0%) |
| 10 or more Apartments | 0 (0.0%) | 0 (0.0%) |
| Mobile Home / Other | 0 (0.0%) | 2 (100.0%) |
| Total | 33 (84.6%) | 6 (15.4%) |
Housing Structures by Number of Rooms in Wilson City
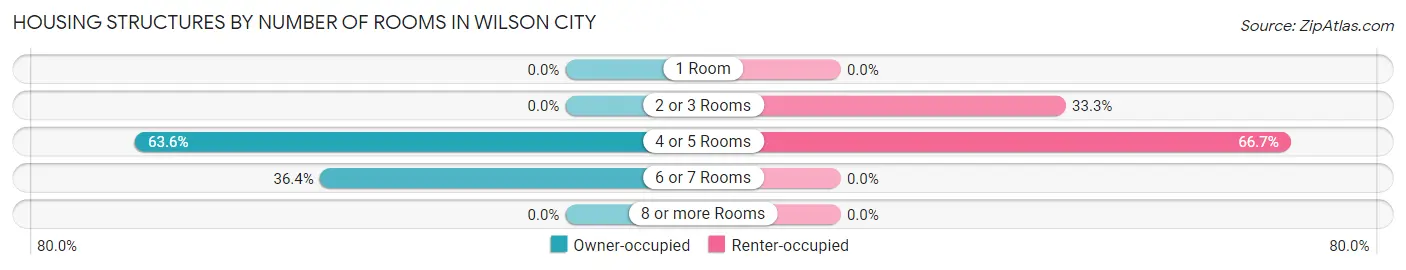
| Number of Rooms | Owner-occupied | Renter-occupied |
| 1 Room | 0 (0.0%) | 0 (0.0%) |
| 2 or 3 Rooms | 0 (0.0%) | 2 (33.3%) |
| 4 or 5 Rooms | 21 (63.6%) | 4 (66.7%) |
| 6 or 7 Rooms | 12 (36.4%) | 0 (0.0%) |
| 8 or more Rooms | 0 (0.0%) | 0 (0.0%) |
| Total | 33 (100.0%) | 6 (100.0%) |
Housing Structure by Heating Type in Wilson City
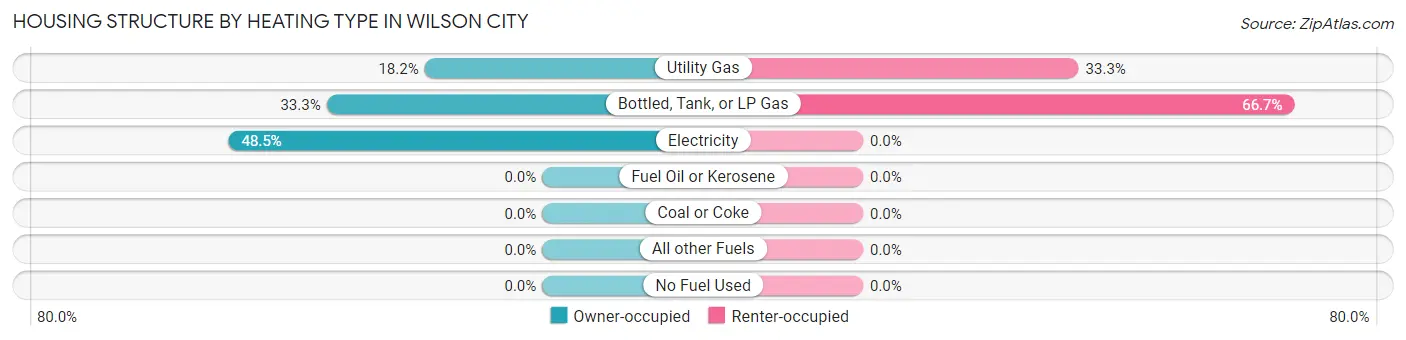
| Heating Type | Owner-occupied | Renter-occupied |
| Utility Gas | 6 (18.2%) | 2 (33.3%) |
| Bottled, Tank, or LP Gas | 11 (33.3%) | 4 (66.7%) |
| Electricity | 16 (48.5%) | 0 (0.0%) |
| Fuel Oil or Kerosene | 0 (0.0%) | 0 (0.0%) |
| Coal or Coke | 0 (0.0%) | 0 (0.0%) |
| All other Fuels | 0 (0.0%) | 0 (0.0%) |
| No Fuel Used | 0 (0.0%) | 0 (0.0%) |
| Total | 33 (100.0%) | 6 (100.0%) |
Household Vehicle Usage in Wilson City
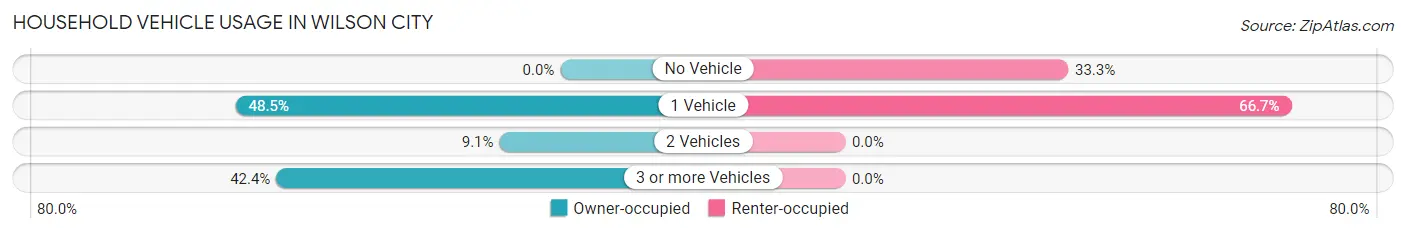
| Vehicles per Household | Owner-occupied | Renter-occupied |
| No Vehicle | 0 (0.0%) | 2 (33.3%) |
| 1 Vehicle | 16 (48.5%) | 4 (66.7%) |
| 2 Vehicles | 3 (9.1%) | 0 (0.0%) |
| 3 or more Vehicles | 14 (42.4%) | 0 (0.0%) |
| Total | 33 (100.0%) | 6 (100.0%) |
Real Estate & Mortgages in Wilson City
Real Estate and Mortgage Overview in Wilson City
| Characteristic | Without Mortgage | With Mortgage |
| Housing Units | 13 | 20 |
| Median Property Value | $84,100 | $61,700 |
| Median Household Income | $28,036 | $0 |
| Monthly Housing Costs | $333 | $0 |
| Real Estate Taxes | $259 | $0 |
Property Value by Mortgage Status in Wilson City
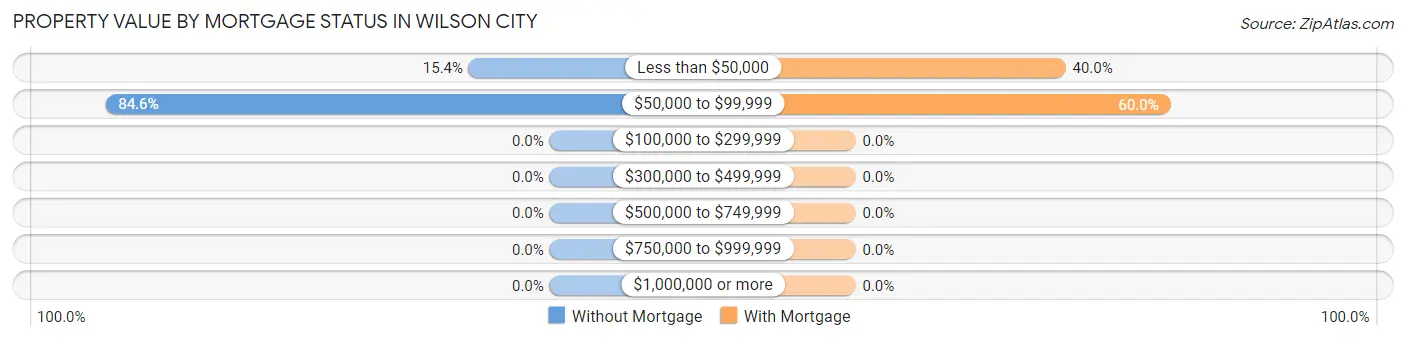
| Property Value | Without Mortgage | With Mortgage |
| Less than $50,000 | 2 (15.4%) | 8 (40.0%) |
| $50,000 to $99,999 | 11 (84.6%) | 12 (60.0%) |
| $100,000 to $299,999 | 0 (0.0%) | 0 (0.0%) |
| $300,000 to $499,999 | 0 (0.0%) | 0 (0.0%) |
| $500,000 to $749,999 | 0 (0.0%) | 0 (0.0%) |
| $750,000 to $999,999 | 0 (0.0%) | 0 (0.0%) |
| $1,000,000 or more | 0 (0.0%) | 0 (0.0%) |
| Total | 13 (100.0%) | 20 (100.0%) |
Household Income by Mortgage Status in Wilson City
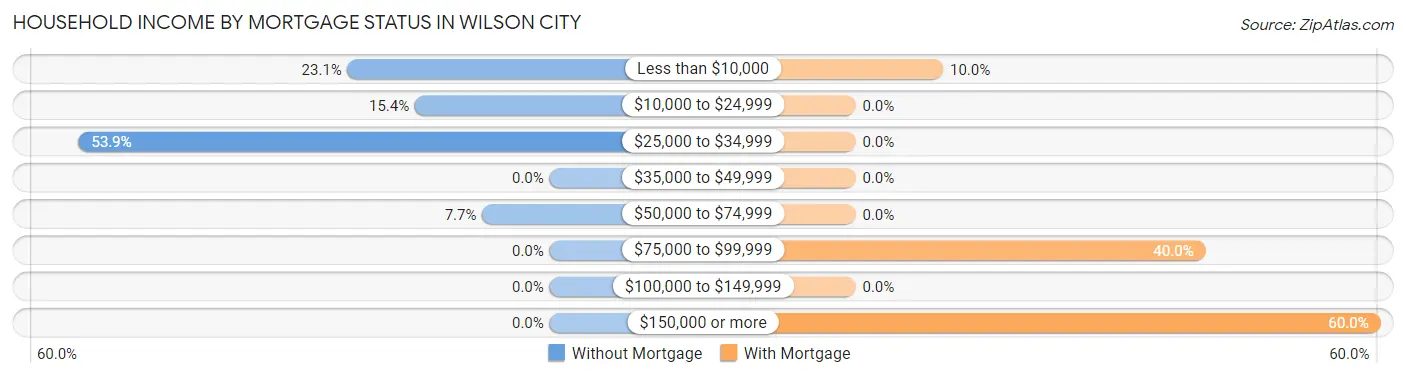
| Household Income | Without Mortgage | With Mortgage |
| Less than $10,000 | 3 (23.1%) | 2 (10.0%) |
| $10,000 to $24,999 | 2 (15.4%) | 0 (0.0%) |
| $25,000 to $34,999 | 7 (53.8%) | 0 (0.0%) |
| $35,000 to $49,999 | 0 (0.0%) | 0 (0.0%) |
| $50,000 to $74,999 | 1 (7.7%) | 0 (0.0%) |
| $75,000 to $99,999 | 0 (0.0%) | 8 (40.0%) |
| $100,000 to $149,999 | 0 (0.0%) | 0 (0.0%) |
| $150,000 or more | 0 (0.0%) | 12 (60.0%) |
| Total | 13 (100.0%) | 20 (100.0%) |
Property Value to Household Income Ratio in Wilson City
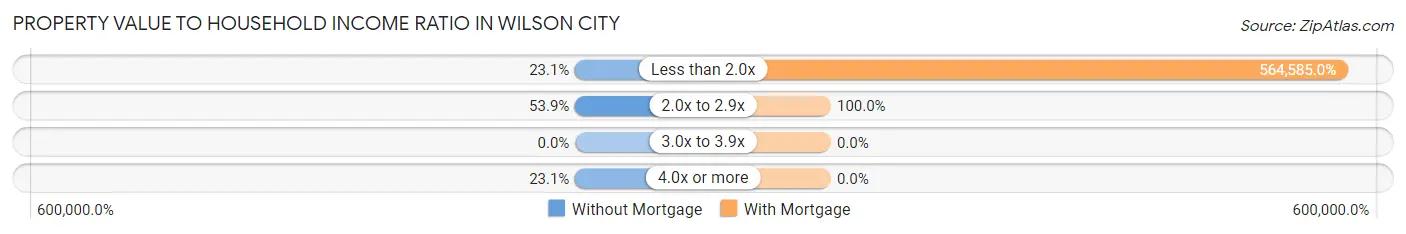
| Value-to-Income Ratio | Without Mortgage | With Mortgage |
| Less than 2.0x | 3 (23.1%) | 112,917 (564,585.0%) |
| 2.0x to 2.9x | 7 (53.8%) | 20 (100.0%) |
| 3.0x to 3.9x | 0 (0.0%) | 0 (0.0%) |
| 4.0x or more | 3 (23.1%) | 0 (0.0%) |
| Total | 13 (100.0%) | 20 (100.0%) |
Real Estate Taxes by Mortgage Status in Wilson City
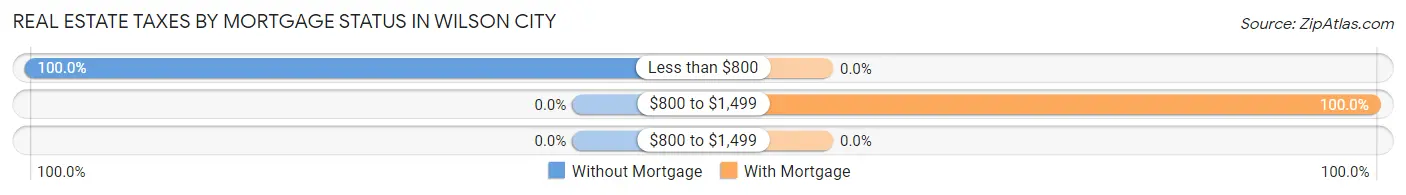
| Property Taxes | Without Mortgage | With Mortgage |
| Less than $800 | 13 (100.0%) | 0 (0.0%) |
| $800 to $1,499 | 0 (0.0%) | 20 (100.0%) |
| $800 to $1,499 | 0 (0.0%) | 0 (0.0%) |
| Total | 13 (100.0%) | 20 (100.0%) |
Health & Disability in Wilson City
Health Insurance Coverage by Age in Wilson City
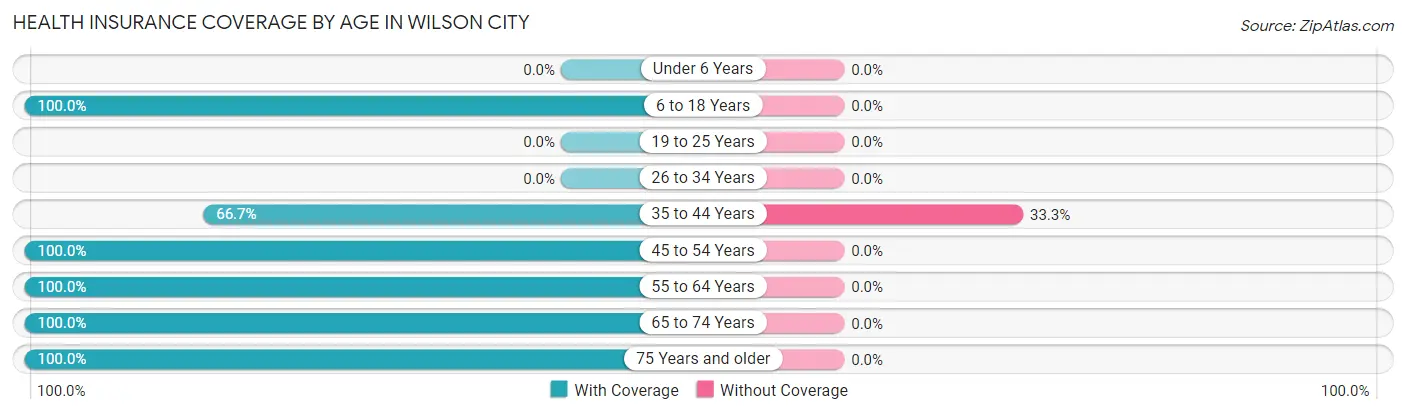
| Age Bracket | With Coverage | Without Coverage |
| Under 6 Years | 0 (0.0%) | 0 (0.0%) |
| 6 to 18 Years | 17 (100.0%) | 0 (0.0%) |
| 19 to 25 Years | 0 (0.0%) | 0 (0.0%) |
| 26 to 34 Years | 0 (0.0%) | 0 (0.0%) |
| 35 to 44 Years | 4 (66.7%) | 2 (33.3%) |
| 45 to 54 Years | 17 (100.0%) | 0 (0.0%) |
| 55 to 64 Years | 1 (100.0%) | 0 (0.0%) |
| 65 to 74 Years | 25 (100.0%) | 0 (0.0%) |
| 75 Years and older | 5 (100.0%) | 0 (0.0%) |
| Total | 69 (97.2%) | 2 (2.8%) |
Health Insurance Coverage by Citizenship Status in Wilson City
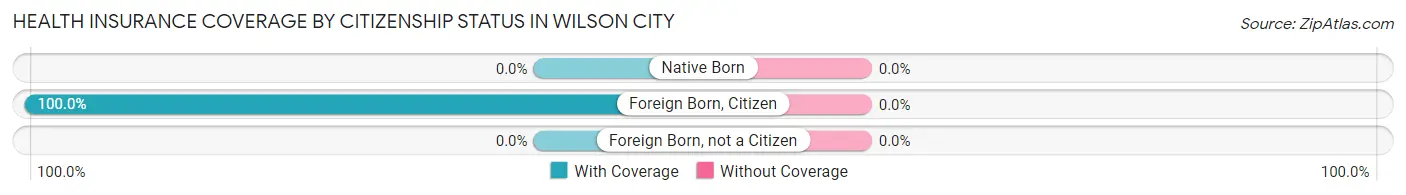
| Citizenship Status | With Coverage | Without Coverage |
| Native Born | 0 (0.0%) | 0 (0.0%) |
| Foreign Born, Citizen | 17 (100.0%) | 0 (0.0%) |
| Foreign Born, not a Citizen | 0 (0.0%) | 0 (0.0%) |
Health Insurance Coverage by Household Income in Wilson City
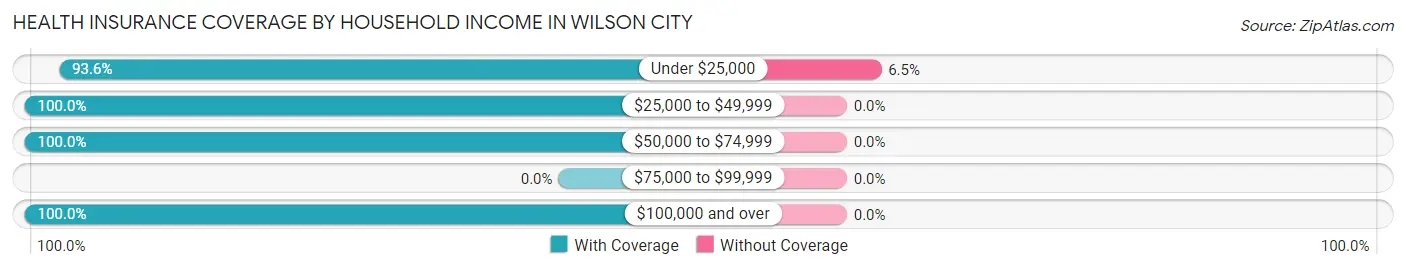
| Household Income | With Coverage | Without Coverage |
| Under $25,000 | 29 (93.5%) | 2 (6.5%) |
| $25,000 to $49,999 | 12 (100.0%) | 0 (0.0%) |
| $50,000 to $74,999 | 11 (100.0%) | 0 (0.0%) |
| $75,000 to $99,999 | 0 (0.0%) | 0 (0.0%) |
| $100,000 and over | 17 (100.0%) | 0 (0.0%) |
Public vs Private Health Insurance Coverage by Age in Wilson City
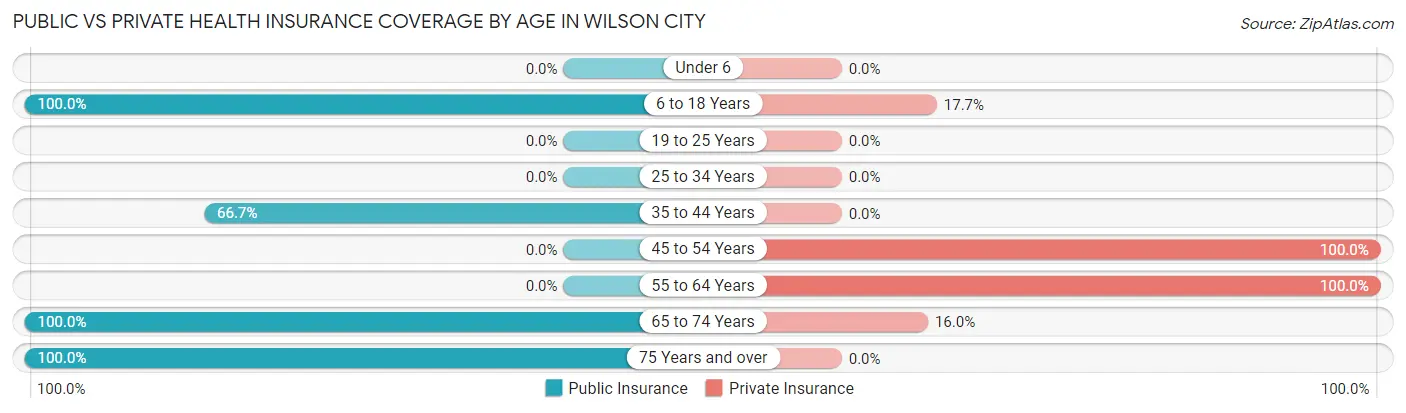
| Age Bracket | Public Insurance | Private Insurance |
| Under 6 | 0 (0.0%) | 0 (0.0%) |
| 6 to 18 Years | 17 (100.0%) | 3 (17.6%) |
| 19 to 25 Years | 0 (0.0%) | 0 (0.0%) |
| 25 to 34 Years | 0 (0.0%) | 0 (0.0%) |
| 35 to 44 Years | 4 (66.7%) | 0 (0.0%) |
| 45 to 54 Years | 0 (0.0%) | 17 (100.0%) |
| 55 to 64 Years | 0 (0.0%) | 1 (100.0%) |
| 65 to 74 Years | 25 (100.0%) | 4 (16.0%) |
| 75 Years and over | 5 (100.0%) | 0 (0.0%) |
| Total | 51 (71.8%) | 25 (35.2%) |
Disability Status by Sex by Age in Wilson City
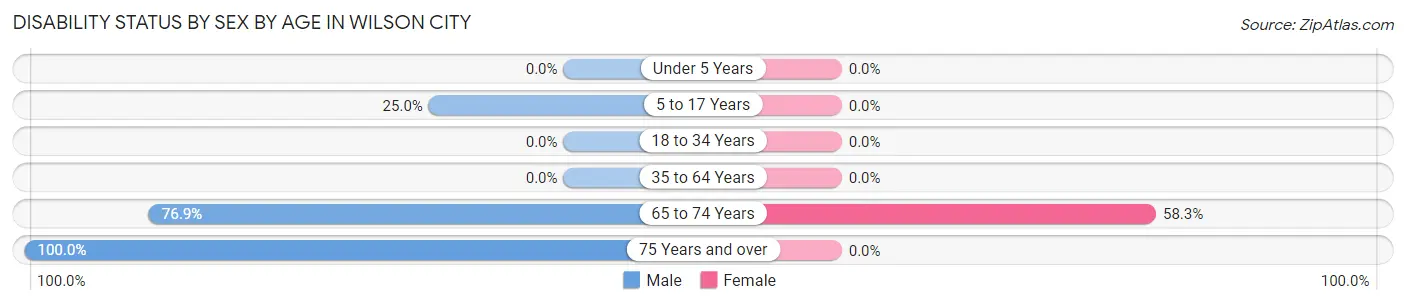
| Age Bracket | Male | Female |
| Under 5 Years | 0 (0.0%) | 0 (0.0%) |
| 5 to 17 Years | 3 (25.0%) | 0 (0.0%) |
| 18 to 34 Years | 0 (0.0%) | 0 (0.0%) |
| 35 to 64 Years | 0 (0.0%) | 0 (0.0%) |
| 65 to 74 Years | 10 (76.9%) | 7 (58.3%) |
| 75 Years and over | 5 (100.0%) | 0 (0.0%) |
Disability Class by Sex by Age in Wilson City
Disability Class: Hearing Difficulty
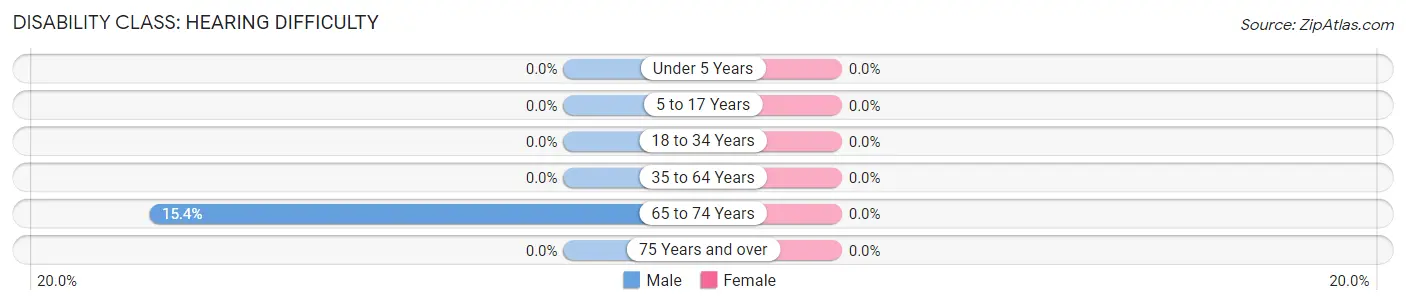
| Age Bracket | Male | Female |
| Under 5 Years | 0 (0.0%) | 0 (0.0%) |
| 5 to 17 Years | 0 (0.0%) | 0 (0.0%) |
| 18 to 34 Years | 0 (0.0%) | 0 (0.0%) |
| 35 to 64 Years | 0 (0.0%) | 0 (0.0%) |
| 65 to 74 Years | 2 (15.4%) | 0 (0.0%) |
| 75 Years and over | 0 (0.0%) | 0 (0.0%) |
Disability Class: Vision Difficulty
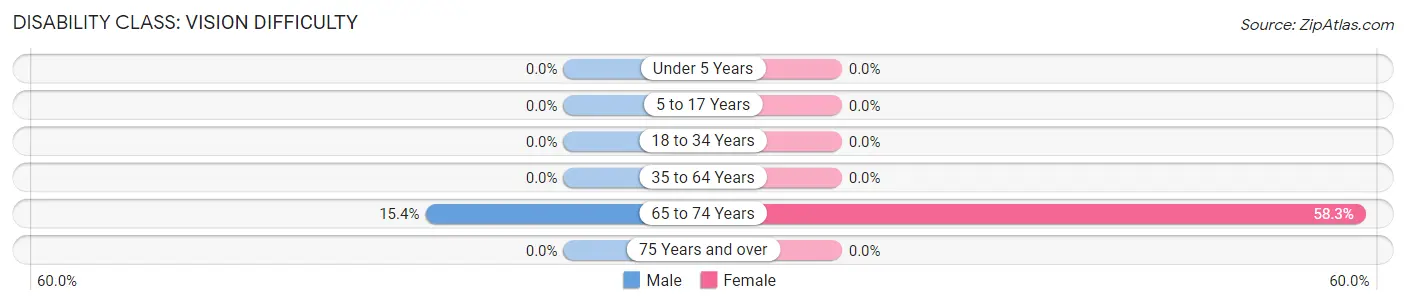
| Age Bracket | Male | Female |
| Under 5 Years | 0 (0.0%) | 0 (0.0%) |
| 5 to 17 Years | 0 (0.0%) | 0 (0.0%) |
| 18 to 34 Years | 0 (0.0%) | 0 (0.0%) |
| 35 to 64 Years | 0 (0.0%) | 0 (0.0%) |
| 65 to 74 Years | 2 (15.4%) | 7 (58.3%) |
| 75 Years and over | 0 (0.0%) | 0 (0.0%) |
Disability Class: Cognitive Difficulty
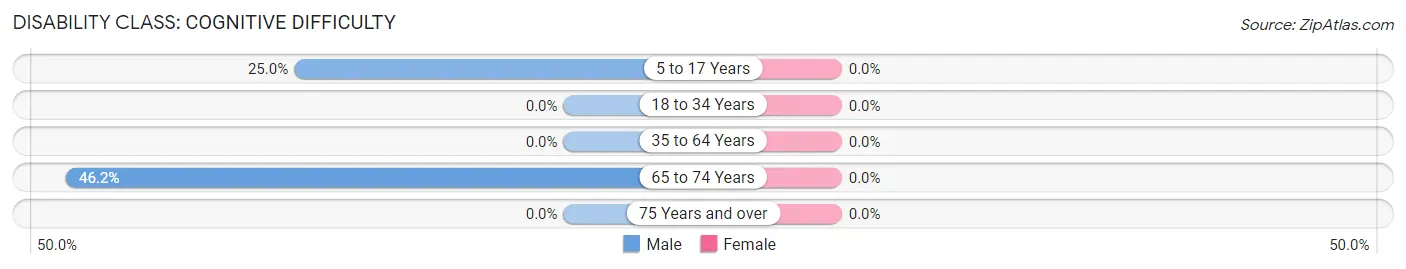
| Age Bracket | Male | Female |
| 5 to 17 Years | 3 (25.0%) | 0 (0.0%) |
| 18 to 34 Years | 0 (0.0%) | 0 (0.0%) |
| 35 to 64 Years | 0 (0.0%) | 0 (0.0%) |
| 65 to 74 Years | 6 (46.2%) | 0 (0.0%) |
| 75 Years and over | 0 (0.0%) | 0 (0.0%) |
Disability Class: Ambulatory Difficulty
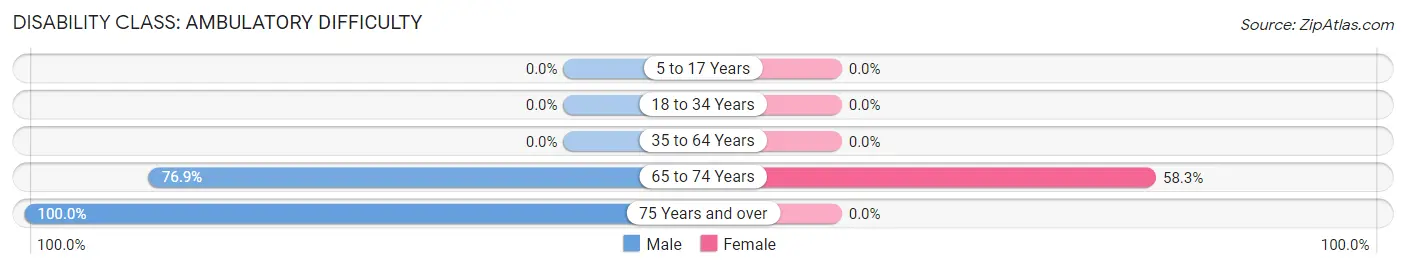
| Age Bracket | Male | Female |
| 5 to 17 Years | 0 (0.0%) | 0 (0.0%) |
| 18 to 34 Years | 0 (0.0%) | 0 (0.0%) |
| 35 to 64 Years | 0 (0.0%) | 0 (0.0%) |
| 65 to 74 Years | 10 (76.9%) | 7 (58.3%) |
| 75 Years and over | 5 (100.0%) | 0 (0.0%) |
Disability Class: Self-Care Difficulty
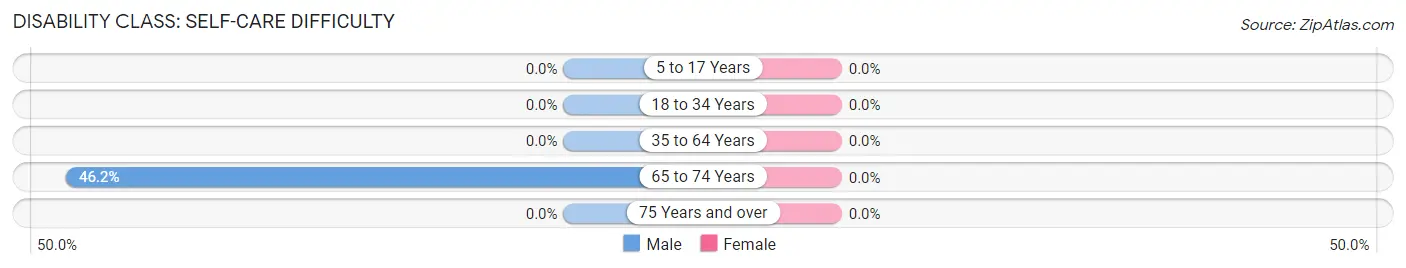
| Age Bracket | Male | Female |
| 5 to 17 Years | 0 (0.0%) | 0 (0.0%) |
| 18 to 34 Years | 0 (0.0%) | 0 (0.0%) |
| 35 to 64 Years | 0 (0.0%) | 0 (0.0%) |
| 65 to 74 Years | 6 (46.2%) | 0 (0.0%) |
| 75 Years and over | 0 (0.0%) | 0 (0.0%) |
Technology Access in Wilson City
Computing Device Access in Wilson City
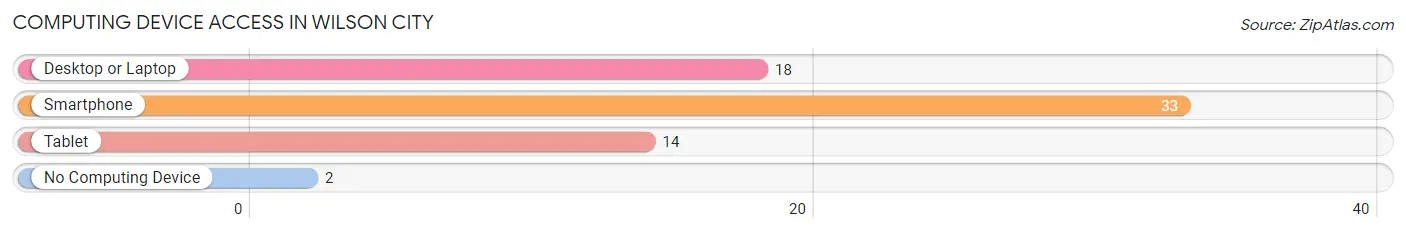
| Device Type | # Households | % Households |
| Desktop or Laptop | 18 | 46.2% |
| Smartphone | 33 | 84.6% |
| Tablet | 14 | 35.9% |
| No Computing Device | 2 | 5.1% |
| Total | 39 | 100.0% |
Internet Access in Wilson City
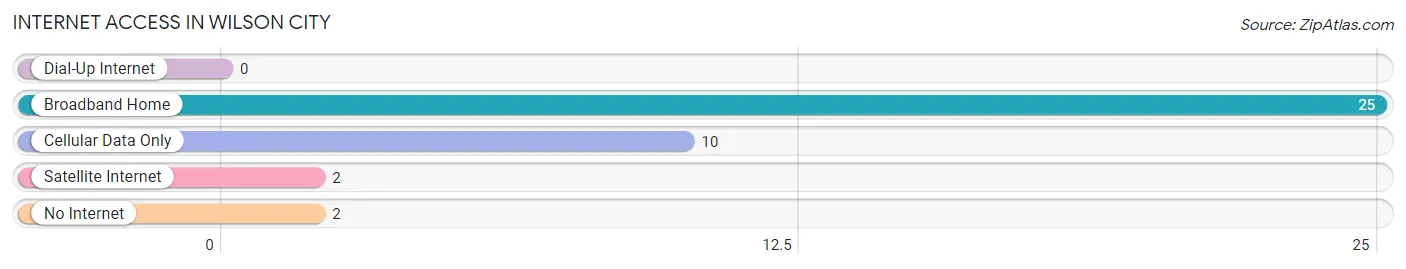
| Internet Type | # Households | % Households |
| Dial-Up Internet | 0 | 0.0% |
| Broadband Home | 25 | 64.1% |
| Cellular Data Only | 10 | 25.6% |
| Satellite Internet | 2 | 5.1% |
| No Internet | 2 | 5.1% |
| Total | 39 | 100.0% |
Wilson City Summary
Wilson City, MO is a small city located in the southeastern corner of Missouri. It is situated in the Ozark Mountains and is part of the Ozark Plateau. The city is located in the county of Carter and is the county seat. The population of Wilson City, MO was estimated to be 1,845 in 2019.
Geography
Wilson City, MO is located in the southeastern corner of Missouri, in the Ozark Mountains. It is situated in the Ozark Plateau, which is a region of rolling hills and valleys. The city is located in the county of Carter and is the county seat. The city is located at an elevation of 890 feet above sea level. The city is located near the Black River, which is a tributary of the White River. The city is located in a humid subtropical climate zone, with hot summers and mild winters.
History
Wilson City, MO was founded in 1845 by William Wilson, who was a settler from Tennessee. The city was originally named Wilsonville, but the name was changed to Wilson City in 1851. The city was incorporated in 1853. The city was a major stop on the Iron Mountain Railroad, which ran from St. Louis to Little Rock. The city was also a major stop on the Missouri Pacific Railroad, which ran from St. Louis to Kansas City.
The city was a major center for the timber industry in the late 19th and early 20th centuries. The city was also a major center for the mining industry, with several coal mines located in the area. The city was also a major center for the manufacturing industry, with several factories located in the area.
Economy
The economy of Wilson City, MO is largely based on agriculture and tourism. The city is home to several farms, which produce a variety of crops, including corn, soybeans, wheat, and hay. The city is also home to several wineries, which produce a variety of wines. The city is also home to several tourist attractions, including the Ozark National Scenic Riverways, which is a national park located in the area.
Demographics
The population of Wilson City, MO was estimated to be 1,845 in 2019. The population is largely white, with a small percentage of African Americans and Hispanics. The median household income in the city is $37,945, and the median home value is $90,000. The city has a high rate of poverty, with 24.3% of the population living below the poverty line. The city has a high rate of unemployment, with 8.2% of the population unemployed.
Conclusion
Wilson City, MO is a small city located in the southeastern corner of Missouri. It is situated in the Ozark Mountains and is part of the Ozark Plateau. The city is located in the county of Carter and is the county seat. The population of Wilson City, MO was estimated to be 1,845 in 2019. The economy of the city is largely based on agriculture and tourism. The population is largely white, with a small percentage of African Americans and Hispanics. The city has a high rate of poverty and unemployment.
Common Questions
What is Per Capita Income in Wilson City?
Per Capita income in Wilson City is $25,323.
What is Inequality or Gini Index in Wilson City?
Inequality or Gini Index in Wilson City is 0.42.
What is the Total Population of Wilson City?
Total Population of Wilson City is 71.
What is the Total Male Population of Wilson City?
Total Male Population of Wilson City is 44.
What is the Total Female Population of Wilson City?
Total Female Population of Wilson City is 27.
What is the Ratio of Males per 100 Females in Wilson City?
There are 162.96 Males per 100 Females in Wilson City.
What is the Ratio of Females per 100 Males in Wilson City?
There are 61.36 Females per 100 Males in Wilson City.
What is the Median Population Age in Wilson City?
Median Population Age in Wilson City is 54.6 Years.
What is the Average Family Size in Wilson City
Average Family Size in Wilson City is 2.2 People.
What is the Average Household Size in Wilson City
Average Household Size in Wilson City is 1.8 People.
How Large is the Labor Force in Wilson City?
There are 32 People in the Labor Forcein in Wilson City.
What is the Percentage of People in the Labor Force in Wilson City?
59.3% of People are in the Labor Force in Wilson City.
What is the Unemployment Rate in Wilson City?
Unemployment Rate in Wilson City is 12.5%.