Alfred, ME Map & Demographics
Alfred Map
Alfred Overview
$26,348
PER CAPITA INCOME
$41,250
AVG FAMILY INCOME
$40,326
AVG HOUSEHOLD INCOME
0.48
INEQUALITY / GINI INDEX
850
TOTAL POPULATION
429
MALE POPULATION
421
FEMALE POPULATION
101.90
MALES / 100 FEMALES
98.14
FEMALES / 100 MALES
44.9
MEDIAN AGE
2.7
AVG FAMILY SIZE
2.4
AVG HOUSEHOLD SIZE
437
LABOR FORCE [ PEOPLE ]
61.6%
PERCENT IN LABOR FORCE
8.5%
UNEMPLOYMENT RATE
Alfred Zip Codes
Alfred Area Codes
Income in Alfred
Income Overview in Alfred
Per Capita Income in Alfred is $26,348, while median incomes of families and households are $41,250 and $40,326 respectively.
| Characteristic | Number | Measure |
| Per Capita Income | 850 | $26,348 |
| Median Family Income | 205 | $41,250 |
| Mean Family Income | 205 | $65,914 |
| Median Household Income | 350 | $40,326 |
| Mean Household Income | 350 | $62,717 |
| Income Deficit | 205 | $0 |
| Wage / Income Gap (%) | 850 | 0.00% |
| Wage / Income Gap ($) | 850 | 100.00¢ per $1 |
| Gini / Inequality Index | 850 | 0.48 |
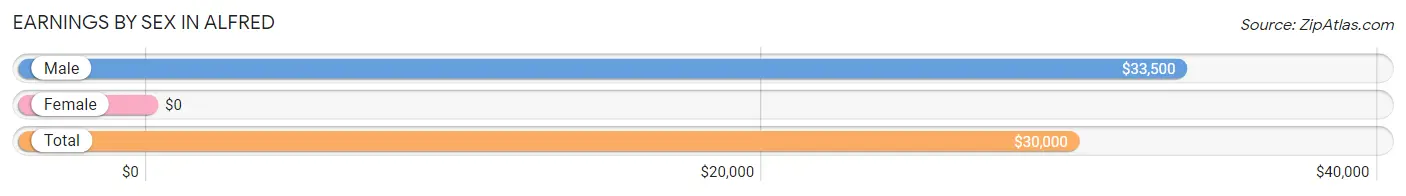
Earnings by Sex in Alfred
| Sex | Number | Average Earnings |
| Male | 218 (51.7%) | $33,500 |
| Female | 204 (48.3%) | $0 |
| Total | 422 (100.0%) | $30,000 |
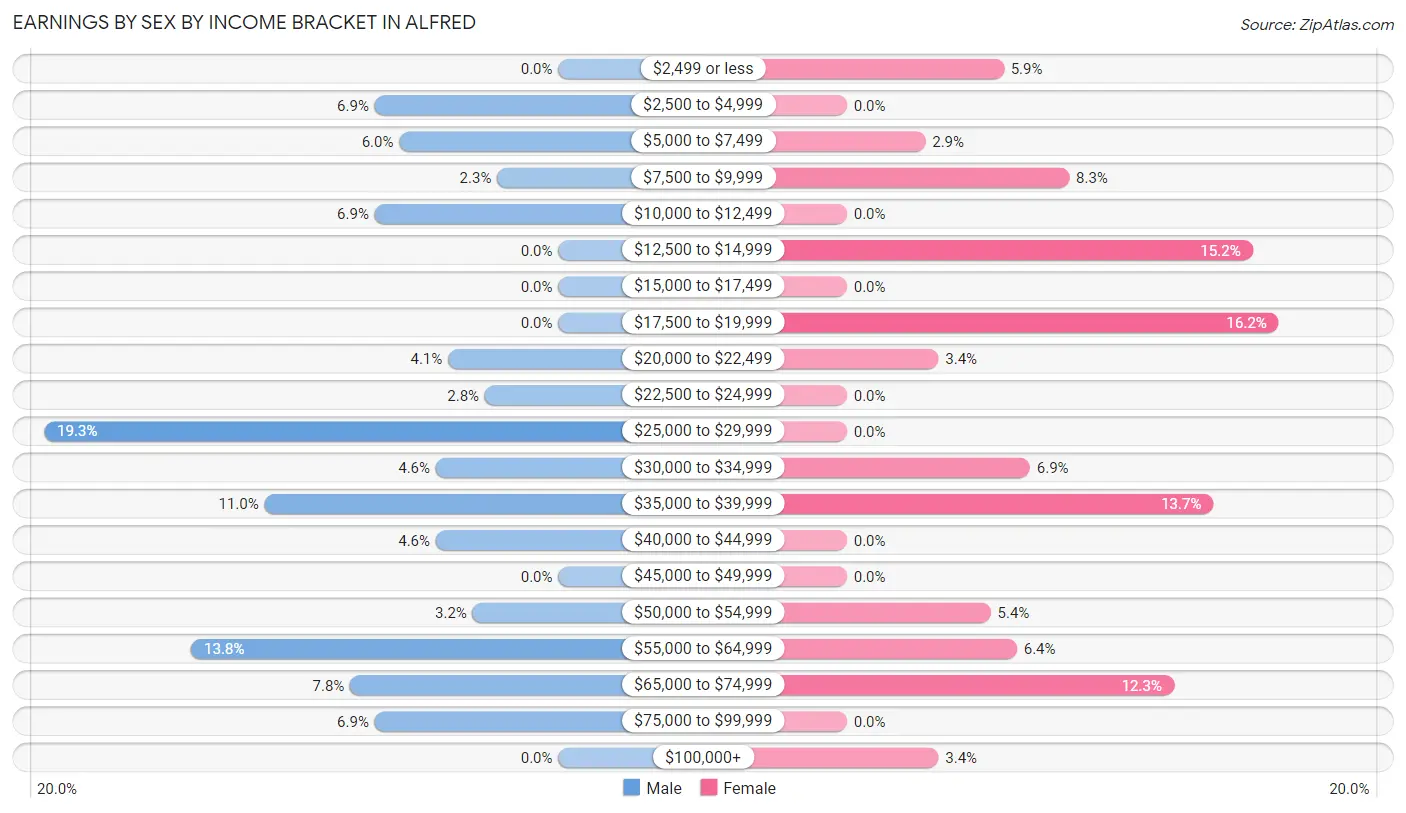
Earnings by Sex by Income Bracket in Alfred
The most common earnings brackets in Alfred are $25,000 to $29,999 for men (42 | 19.3%) and $17,500 to $19,999 for women (33 | 16.2%).
| Income | Male | Female |
| $2,499 or less | 0 (0.0%) | 12 (5.9%) |
| $2,500 to $4,999 | 15 (6.9%) | 0 (0.0%) |
| $5,000 to $7,499 | 13 (6.0%) | 6 (2.9%) |
| $7,500 to $9,999 | 5 (2.3%) | 17 (8.3%) |
| $10,000 to $12,499 | 15 (6.9%) | 0 (0.0%) |
| $12,500 to $14,999 | 0 (0.0%) | 31 (15.2%) |
| $15,000 to $17,499 | 0 (0.0%) | 0 (0.0%) |
| $17,500 to $19,999 | 0 (0.0%) | 33 (16.2%) |
| $20,000 to $22,499 | 9 (4.1%) | 7 (3.4%) |
| $22,500 to $24,999 | 6 (2.8%) | 0 (0.0%) |
| $25,000 to $29,999 | 42 (19.3%) | 0 (0.0%) |
| $30,000 to $34,999 | 10 (4.6%) | 14 (6.9%) |
| $35,000 to $39,999 | 24 (11.0%) | 28 (13.7%) |
| $40,000 to $44,999 | 10 (4.6%) | 0 (0.0%) |
| $45,000 to $49,999 | 0 (0.0%) | 0 (0.0%) |
| $50,000 to $54,999 | 7 (3.2%) | 11 (5.4%) |
| $55,000 to $64,999 | 30 (13.8%) | 13 (6.4%) |
| $65,000 to $74,999 | 17 (7.8%) | 25 (12.2%) |
| $75,000 to $99,999 | 15 (6.9%) | 0 (0.0%) |
| $100,000+ | 0 (0.0%) | 7 (3.4%) |
| Total | 218 (100.0%) | 204 (100.0%) |
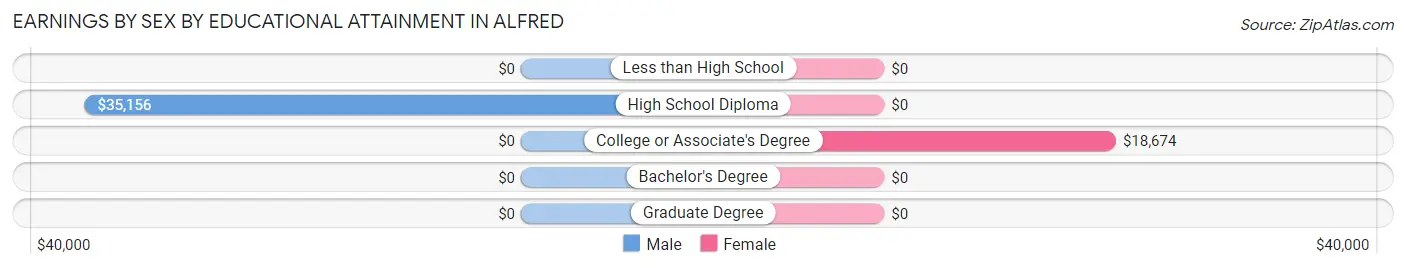
Earnings by Sex by Educational Attainment in Alfred
| Educational Attainment | Male Income | Female Income |
| Less than High School | - | - |
| High School Diploma | $35,156 | $0 |
| College or Associate's Degree | - | - |
| Bachelor's Degree | - | - |
| Graduate Degree | - | - |
| Total | $36,094 | $0 |
Family Income in Alfred
Family Income Brackets in Alfred
According to the Alfred family income data, there are 55 families falling into the $25,000 to $34,999 income range, which is the most common income bracket and makes up 26.8% of all families.
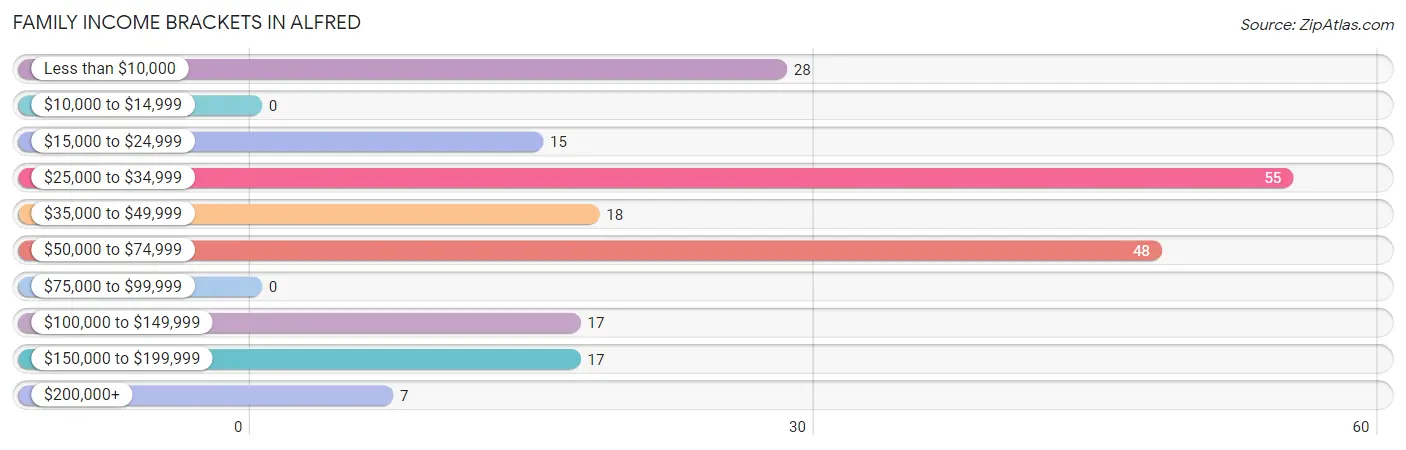
| Income Bracket | # Families | % Families |
| Less than $10,000 | 28 | 13.7% |
| $10,000 to $14,999 | 0 | 0.0% |
| $15,000 to $24,999 | 15 | 7.3% |
| $25,000 to $34,999 | 55 | 26.8% |
| $35,000 to $49,999 | 18 | 8.8% |
| $50,000 to $74,999 | 48 | 23.4% |
| $75,000 to $99,999 | 0 | 0.0% |
| $100,000 to $149,999 | 17 | 8.3% |
| $150,000 to $199,999 | 17 | 8.3% |
| $200,000+ | 7 | 3.4% |
Family Income by Famaliy Size in Alfred
2-person families (122 | 59.5%) account for the highest median family income in Alfred with $31,731 per family, while 2-person families (122 | 59.5%) have the highest median income of $15,866 per family member.
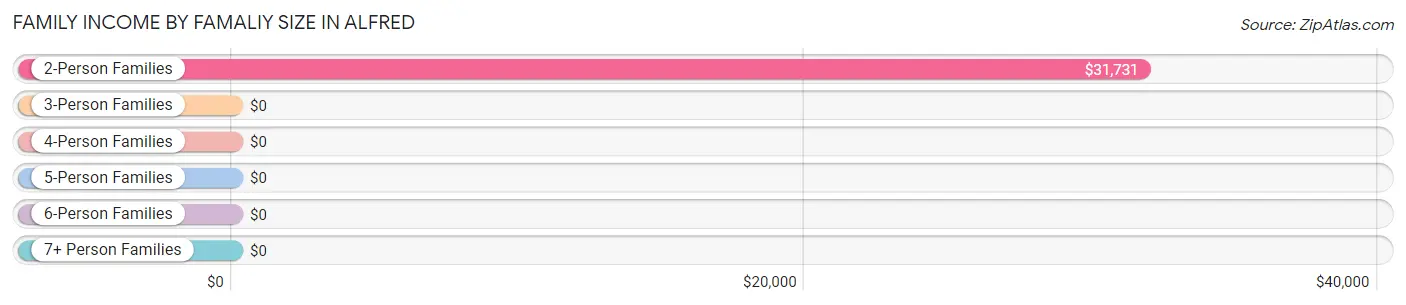
| Income Bracket | # Families | Median Income |
| 2-Person Families | 122 (59.5%) | $31,731 |
| 3-Person Families | 50 (24.4%) | $0 |
| 4-Person Families | 23 (11.2%) | $0 |
| 5-Person Families | 10 (4.9%) | $0 |
| 6-Person Families | 0 (0.0%) | $0 |
| 7+ Person Families | 0 (0.0%) | $0 |
| Total | 205 (100.0%) | $41,250 |
Family Income by Number of Earners in Alfred
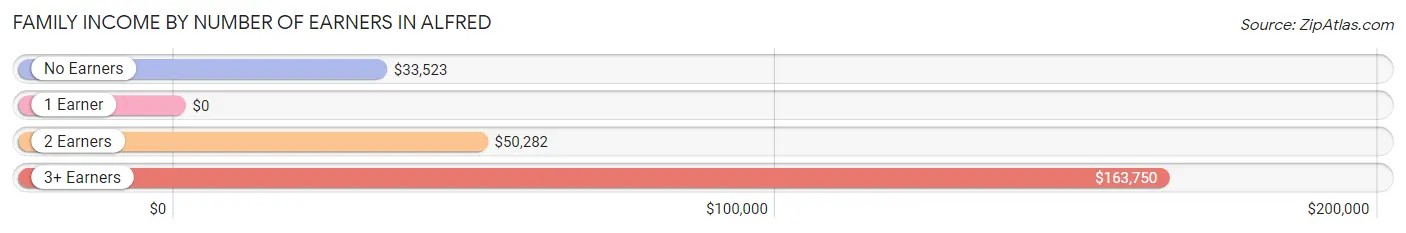
| Number of Earners | # Families | Median Income |
| No Earners | 75 (36.6%) | $33,523 |
| 1 Earner | 41 (20.0%) | $0 |
| 2 Earners | 55 (26.8%) | $50,282 |
| 3+ Earners | 34 (16.6%) | $163,750 |
| Total | 205 (100.0%) | $41,250 |
Household Income in Alfred
Household Income Brackets in Alfred
With 98 households falling in the category, the $25,000 to $34,999 income range is the most frequent in Alfred, accounting for 28.0% of all households. In contrast, only 17 households (4.9%) fall into the $100,000 to $149,999 income bracket, making it the least populous group.
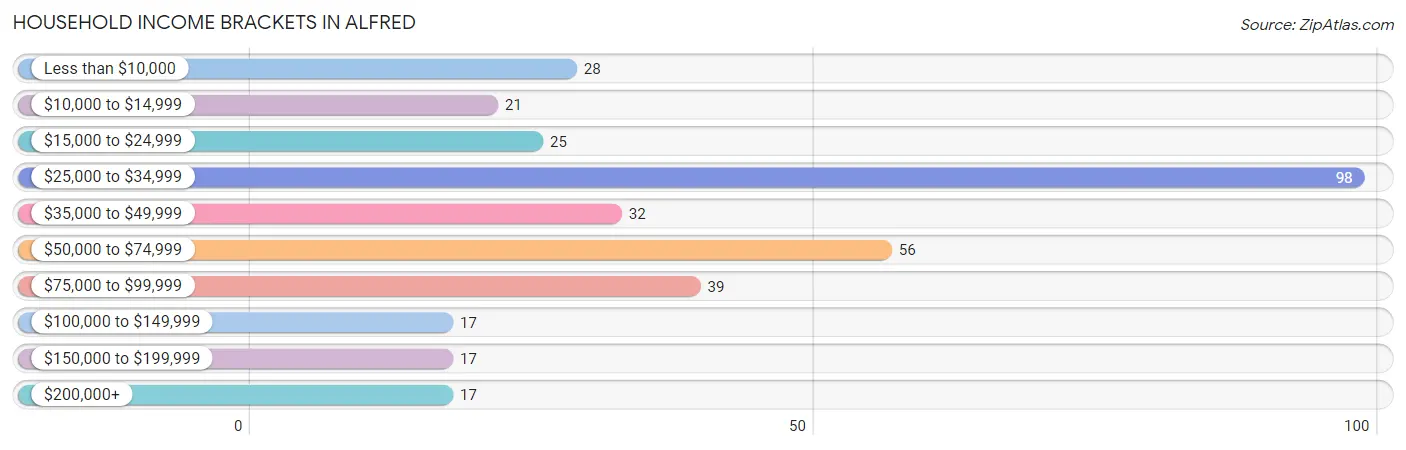
| Income Bracket | # Households | % Households |
| Less than $10,000 | 28 | 8.0% |
| $10,000 to $14,999 | 21 | 6.0% |
| $15,000 to $24,999 | 25 | 7.1% |
| $25,000 to $34,999 | 98 | 28.0% |
| $35,000 to $49,999 | 32 | 9.1% |
| $50,000 to $74,999 | 56 | 16.0% |
| $75,000 to $99,999 | 39 | 11.1% |
| $100,000 to $149,999 | 17 | 4.9% |
| $150,000 to $199,999 | 17 | 4.9% |
| $200,000+ | 17 | 4.9% |
Household Income by Householder Age in Alfred
The median household income in Alfred is $40,326, with the highest median household income of $82,604 found in the 25 to 44 years age bracket for the primary householder. A total of 46 households (13.1%) fall into this category. Meanwhile, the 15 to 24 years age bracket for the primary householder has the lowest median household income of $0, with 10 households (2.9%) in this group.
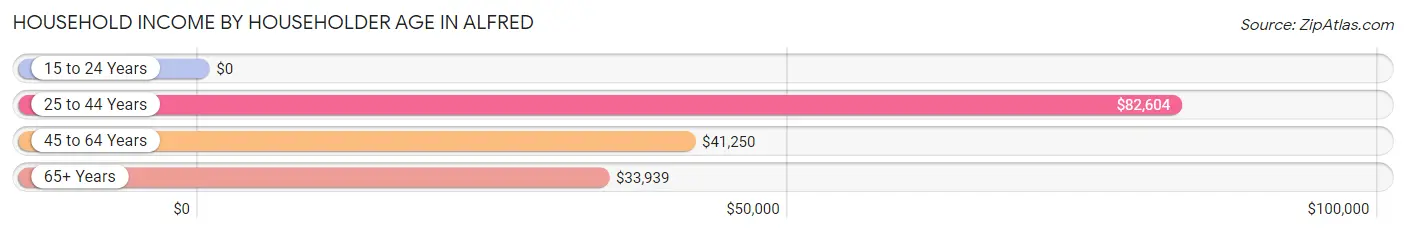
| Income Bracket | # Households | Median Income |
| 15 to 24 Years | 10 (2.9%) | $0 |
| 25 to 44 Years | 46 (13.1%) | $82,604 |
| 45 to 64 Years | 190 (54.3%) | $41,250 |
| 65+ Years | 104 (29.7%) | $33,939 |
| Total | 350 (100.0%) | $40,326 |
Poverty in Alfred
Income Below Poverty by Sex and Age in Alfred
With 19.0% poverty level for males and 12.4% for females among the residents of Alfred, 55 to 64 year old males and 55 to 64 year old females are the most vulnerable to poverty, with 47 males (66.2%) and 29 females (34.9%) in their respective age groups living below the poverty level.
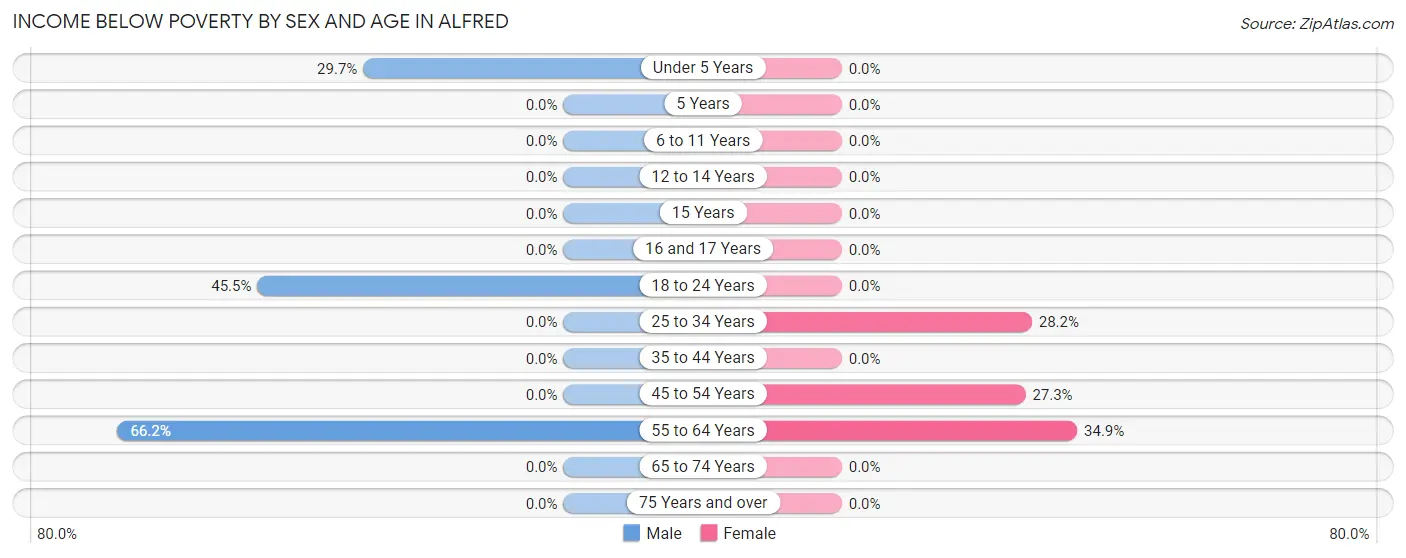
| Age Bracket | Male | Female |
| Under 5 Years | 11 (29.7%) | 0 (0.0%) |
| 5 Years | 0 (0.0%) | 0 (0.0%) |
| 6 to 11 Years | 0 (0.0%) | 0 (0.0%) |
| 12 to 14 Years | 0 (0.0%) | 0 (0.0%) |
| 15 Years | 0 (0.0%) | 0 (0.0%) |
| 16 and 17 Years | 0 (0.0%) | 0 (0.0%) |
| 18 to 24 Years | 15 (45.5%) | 0 (0.0%) |
| 25 to 34 Years | 0 (0.0%) | 11 (28.2%) |
| 35 to 44 Years | 0 (0.0%) | 0 (0.0%) |
| 45 to 54 Years | 0 (0.0%) | 9 (27.3%) |
| 55 to 64 Years | 47 (66.2%) | 29 (34.9%) |
| 65 to 74 Years | 0 (0.0%) | 0 (0.0%) |
| 75 Years and over | 0 (0.0%) | 0 (0.0%) |
| Total | 73 (19.0%) | 49 (12.4%) |
Income Above Poverty by Sex and Age in Alfred
According to the poverty statistics in Alfred, males aged 5 years and females aged 6 to 11 years are the age groups that are most secure financially, with 100.0% of males and 100.0% of females in these age groups living above the poverty line.
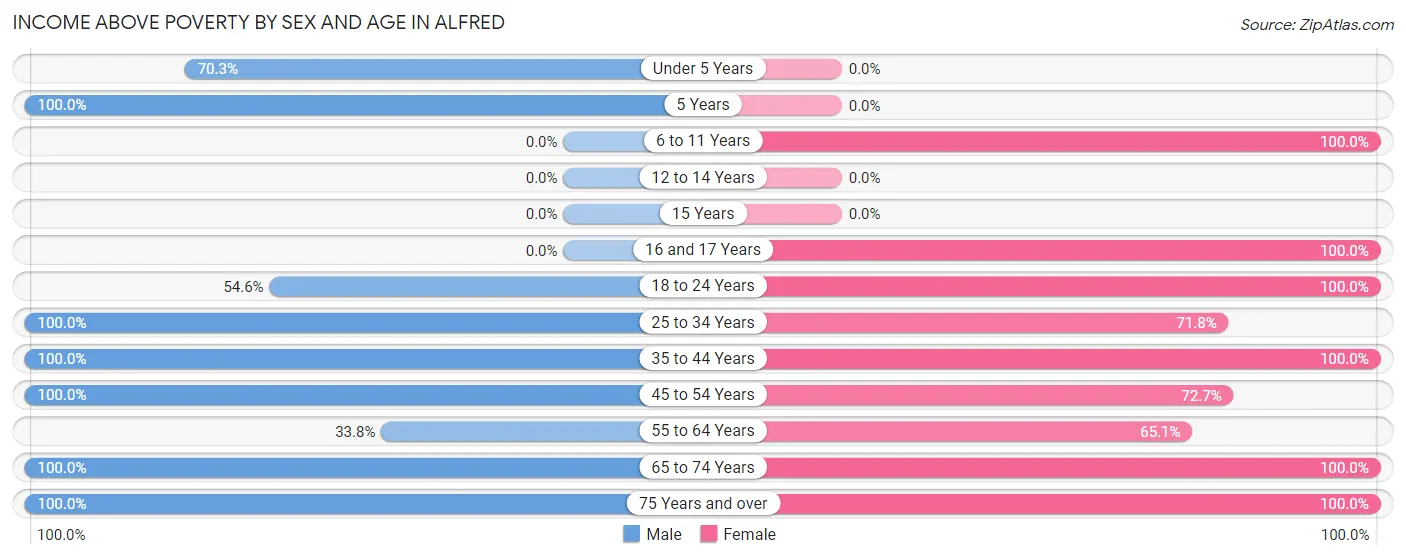
| Age Bracket | Male | Female |
| Under 5 Years | 26 (70.3%) | 0 (0.0%) |
| 5 Years | 11 (100.0%) | 0 (0.0%) |
| 6 to 11 Years | 0 (0.0%) | 21 (100.0%) |
| 12 to 14 Years | 0 (0.0%) | 0 (0.0%) |
| 15 Years | 0 (0.0%) | 0 (0.0%) |
| 16 and 17 Years | 0 (0.0%) | 33 (100.0%) |
| 18 to 24 Years | 18 (54.5%) | 27 (100.0%) |
| 25 to 34 Years | 47 (100.0%) | 28 (71.8%) |
| 35 to 44 Years | 41 (100.0%) | 68 (100.0%) |
| 45 to 54 Years | 66 (100.0%) | 24 (72.7%) |
| 55 to 64 Years | 24 (33.8%) | 54 (65.1%) |
| 65 to 74 Years | 32 (100.0%) | 41 (100.0%) |
| 75 Years and over | 46 (100.0%) | 49 (100.0%) |
| Total | 311 (81.0%) | 345 (87.6%) |
Income Below Poverty Among Married-Couple Families in Alfred
The poverty statistics for married-couple families in Alfred show that 10.6% or 17 of the total 160 families live below the poverty line. Families with no children have the highest poverty rate of 16.0%, comprising of 17 families. On the other hand, families with 1 or 2 children have the lowest poverty rate of 0.0%, which includes 0 families.
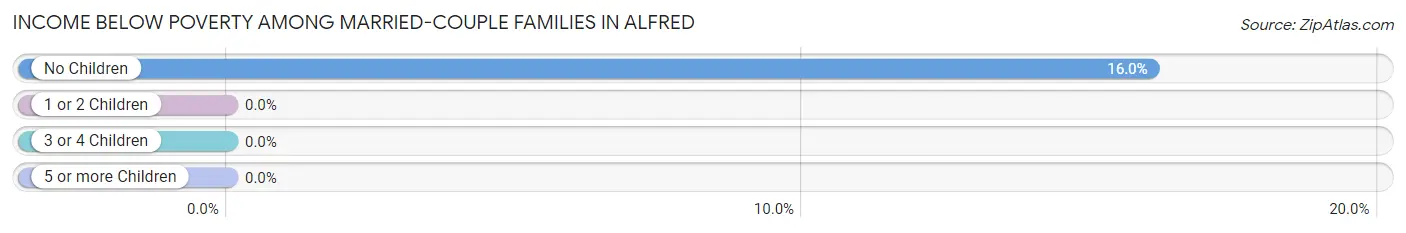
| Children | Above Poverty | Below Poverty |
| No Children | 89 (84.0%) | 17 (16.0%) |
| 1 or 2 Children | 54 (100.0%) | 0 (0.0%) |
| 3 or 4 Children | 0 (0.0%) | 0 (0.0%) |
| 5 or more Children | 0 (0.0%) | 0 (0.0%) |
| Total | 143 (89.4%) | 17 (10.6%) |
Income Below Poverty Among Single-Parent Households in Alfred
According to the poverty data in Alfred, 44.1% or 15 single-father households and 100.0% or 11 single-mother households are living below the poverty line. Among single-father households, those with no children have the highest poverty rate, with 15 households (62.5%) experiencing poverty. Likewise, among single-mother households, those with 1 or 2 children have the highest poverty rate, with 11 households (100.0%) falling below the poverty line.
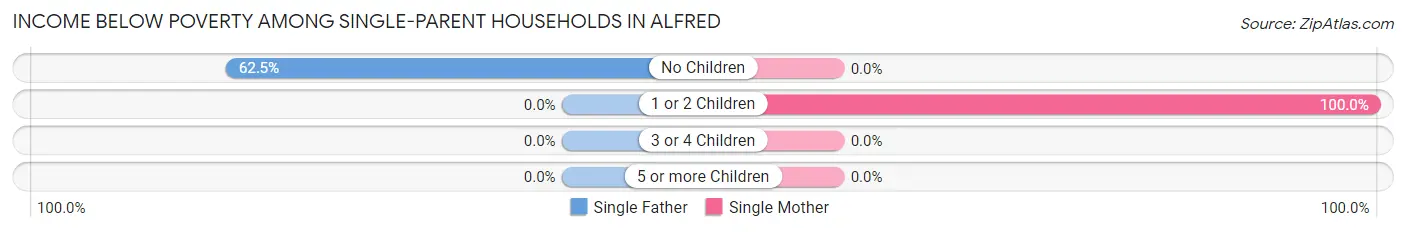
| Children | Single Father | Single Mother |
| No Children | 15 (62.5%) | 0 (0.0%) |
| 1 or 2 Children | 0 (0.0%) | 11 (100.0%) |
| 3 or 4 Children | 0 (0.0%) | 0 (0.0%) |
| 5 or more Children | 0 (0.0%) | 0 (0.0%) |
| Total | 15 (44.1%) | 11 (100.0%) |
Income Below Poverty Among Married-Couple vs Single-Parent Households in Alfred
The poverty data for Alfred shows that 17 of the married-couple family households (10.6%) and 26 of the single-parent households (57.8%) are living below the poverty level. Within the married-couple family households, those with no children have the highest poverty rate, with 17 households (16.0%) falling below the poverty line. Among the single-parent households, those with no children have the highest poverty rate, with 15 household (62.5%) living below poverty.
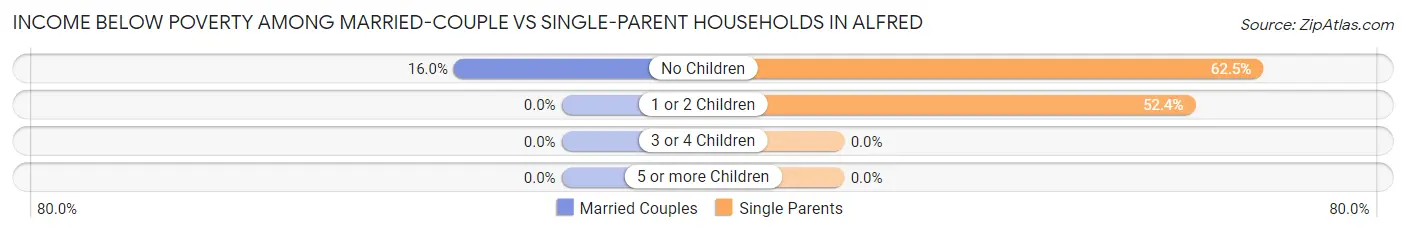
| Children | Married-Couple Families | Single-Parent Households |
| No Children | 17 (16.0%) | 15 (62.5%) |
| 1 or 2 Children | 0 (0.0%) | 11 (52.4%) |
| 3 or 4 Children | 0 (0.0%) | 0 (0.0%) |
| 5 or more Children | 0 (0.0%) | 0 (0.0%) |
| Total | 17 (10.6%) | 26 (57.8%) |
Race in Alfred
The most populous races in Alfred are White / Caucasian (844 | 99.3%), Hispanic or Latino (6 | 0.7%), and Two or more Races (6 | 0.7%).
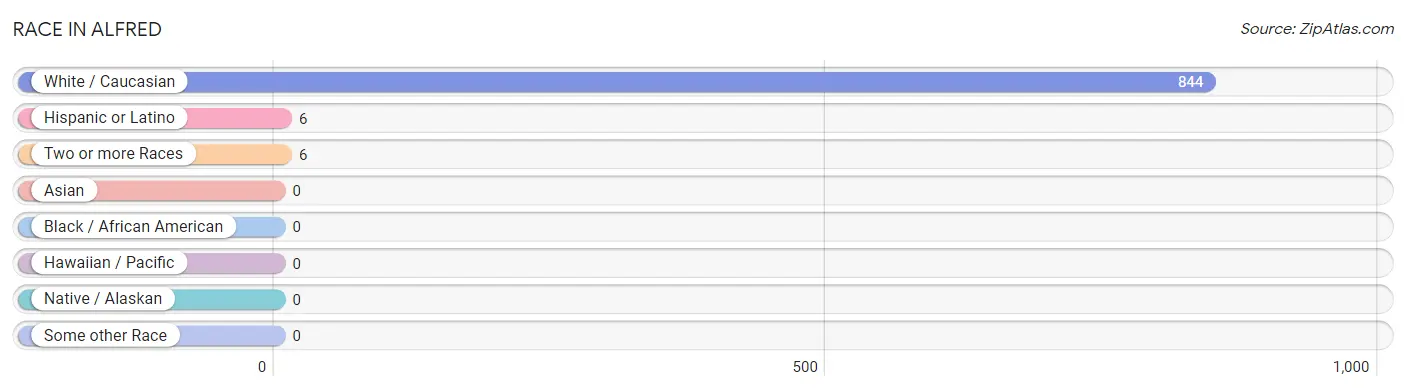
| Race | # Population | % Population |
| Asian | 0 | 0.0% |
| Black / African American | 0 | 0.0% |
| Hawaiian / Pacific | 0 | 0.0% |
| Hispanic or Latino | 6 | 0.7% |
| Native / Alaskan | 0 | 0.0% |
| White / Caucasian | 844 | 99.3% |
| Two or more Races | 6 | 0.7% |
| Some other Race | 0 | 0.0% |
| Total | 850 | 100.0% |
Ancestry in Alfred
The most populous ancestries reported in Alfred are Italian (137 | 16.1%), English (125 | 14.7%), Irish (107 | 12.6%), American (90 | 10.6%), and French (69 | 8.1%), together accounting for 62.1% of all Alfred residents.
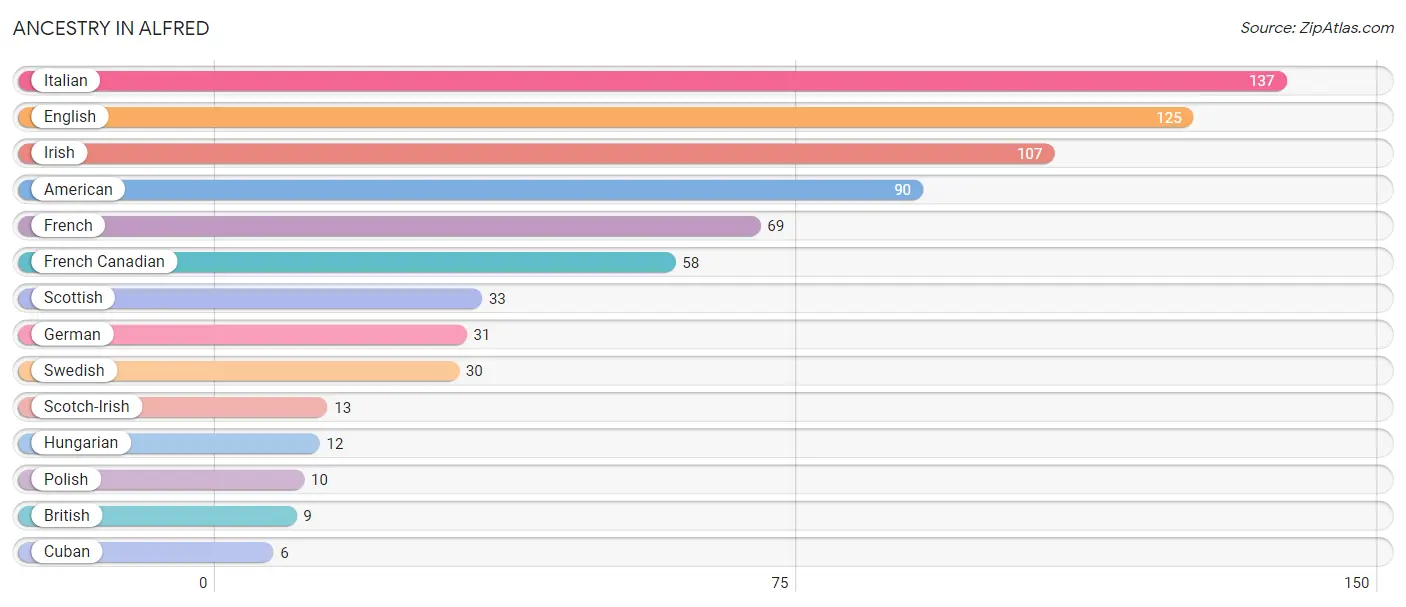
| Ancestry | # Population | % Population |
| American | 90 | 10.6% |
| British | 9 | 1.1% |
| Cuban | 6 | 0.7% |
| English | 125 | 14.7% |
| French | 69 | 8.1% |
| French Canadian | 58 | 6.8% |
| German | 31 | 3.6% |
| Hungarian | 12 | 1.4% |
| Irish | 107 | 12.6% |
| Italian | 137 | 16.1% |
| Polish | 10 | 1.2% |
| Scotch-Irish | 13 | 1.5% |
| Scottish | 33 | 3.9% |
| Swedish | 30 | 3.5% | View All 14 Rows |
Immigrants in Alfred

| Immigration Origin | # Population | % Population | View All 0 Rows |
Sex and Age in Alfred
Sex and Age in Alfred
The most populous age groups in Alfred are 50 to 54 Years (61 | 14.2%) for men and 60 to 64 Years (66 | 15.7%) for women.
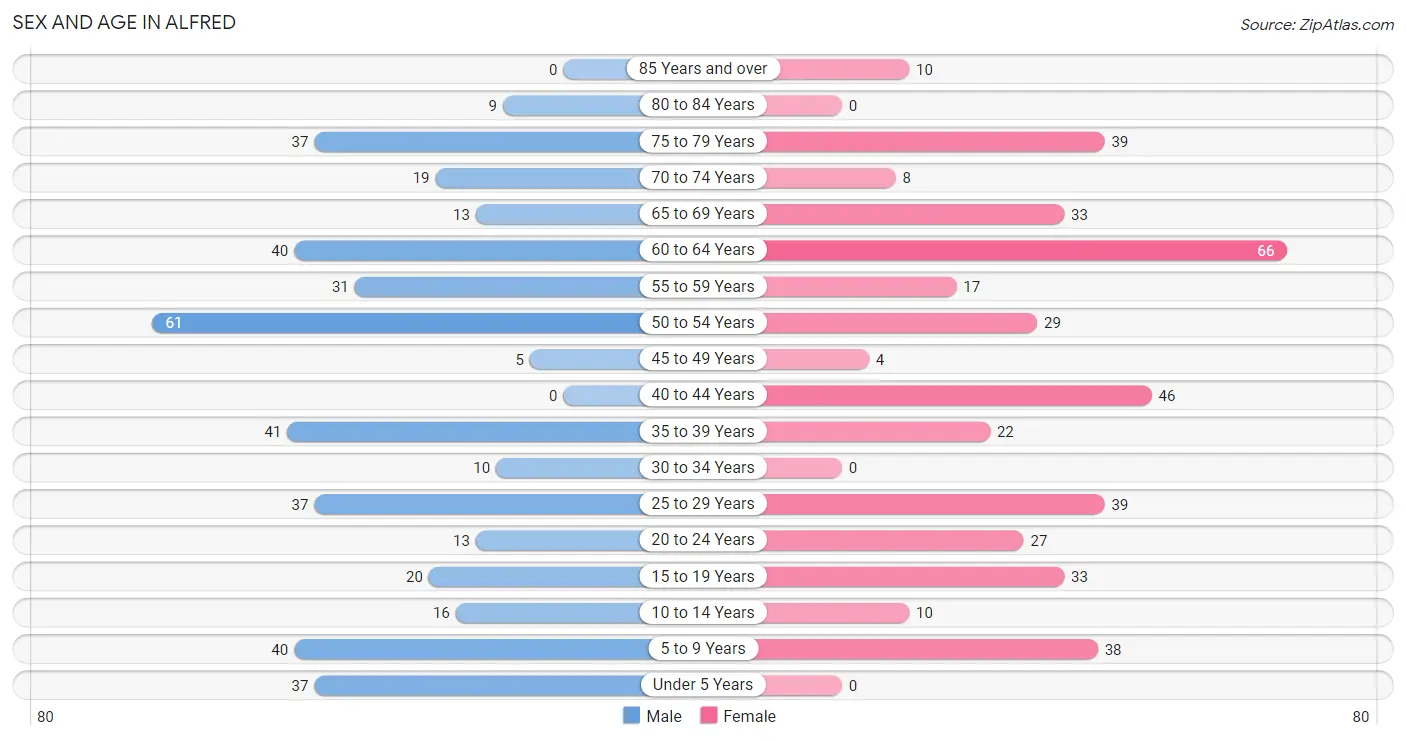
| Age Bracket | Male | Female |
| Under 5 Years | 37 (8.6%) | 0 (0.0%) |
| 5 to 9 Years | 40 (9.3%) | 38 (9.0%) |
| 10 to 14 Years | 16 (3.7%) | 10 (2.4%) |
| 15 to 19 Years | 20 (4.7%) | 33 (7.8%) |
| 20 to 24 Years | 13 (3.0%) | 27 (6.4%) |
| 25 to 29 Years | 37 (8.6%) | 39 (9.3%) |
| 30 to 34 Years | 10 (2.3%) | 0 (0.0%) |
| 35 to 39 Years | 41 (9.6%) | 22 (5.2%) |
| 40 to 44 Years | 0 (0.0%) | 46 (10.9%) |
| 45 to 49 Years | 5 (1.2%) | 4 (0.9%) |
| 50 to 54 Years | 61 (14.2%) | 29 (6.9%) |
| 55 to 59 Years | 31 (7.2%) | 17 (4.0%) |
| 60 to 64 Years | 40 (9.3%) | 66 (15.7%) |
| 65 to 69 Years | 13 (3.0%) | 33 (7.8%) |
| 70 to 74 Years | 19 (4.4%) | 8 (1.9%) |
| 75 to 79 Years | 37 (8.6%) | 39 (9.3%) |
| 80 to 84 Years | 9 (2.1%) | 0 (0.0%) |
| 85 Years and over | 0 (0.0%) | 10 (2.4%) |
| Total | 429 (100.0%) | 421 (100.0%) |
Families and Households in Alfred
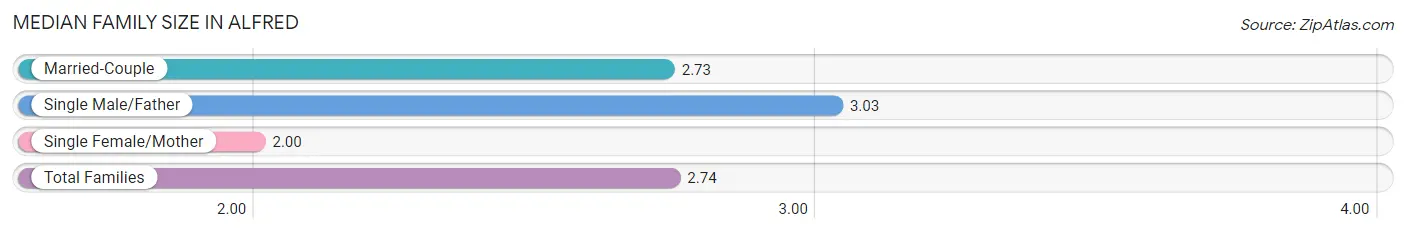
Median Family Size in Alfred
The median family size in Alfred is 2.74 persons per family, with single male/father families (34 | 16.6%) accounting for the largest median family size of 3.03 persons per family. On the other hand, single female/mother families (11 | 5.4%) represent the smallest median family size with 2.00 persons per family.
| Family Type | # Families | Family Size |
| Married-Couple | 160 (78.0%) | 2.73 |
| Single Male/Father | 34 (16.6%) | 3.03 |
| Single Female/Mother | 11 (5.4%) | 2.00 |
| Total Families | 205 (100.0%) | 2.74 |
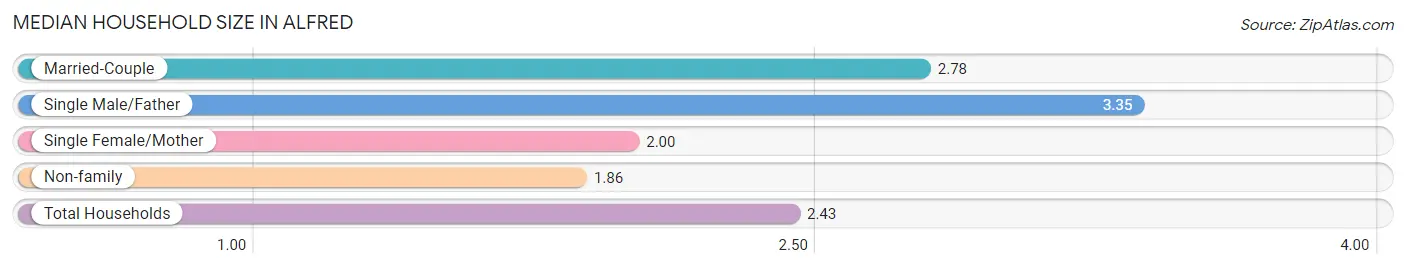
Median Household Size in Alfred
The median household size in Alfred is 2.43 persons per household, with single male/father households (34 | 9.7%) accounting for the largest median household size of 3.35 persons per household. non-family households (145 | 41.4%) represent the smallest median household size with 1.86 persons per household.
| Household Type | # Households | Household Size |
| Married-Couple | 160 (45.7%) | 2.78 |
| Single Male/Father | 34 (9.7%) | 3.35 |
| Single Female/Mother | 11 (3.1%) | 2.00 |
| Non-family | 145 (41.4%) | 1.86 |
| Total Households | 350 (100.0%) | 2.43 |
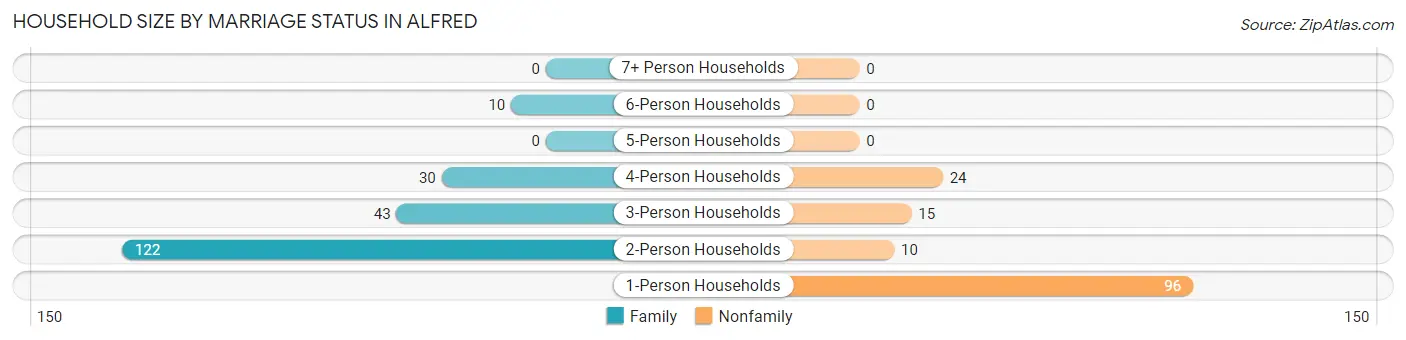
Household Size by Marriage Status in Alfred
Out of a total of 350 households in Alfred, 205 (58.6%) are family households, while 145 (41.4%) are nonfamily households. The most numerous type of family households are 2-person households, comprising 122, and the most common type of nonfamily households are 1-person households, comprising 96.
| Household Size | Family Households | Nonfamily Households |
| 1-Person Households | - | 96 (27.4%) |
| 2-Person Households | 122 (34.9%) | 10 (2.9%) |
| 3-Person Households | 43 (12.3%) | 15 (4.3%) |
| 4-Person Households | 30 (8.6%) | 24 (6.9%) |
| 5-Person Households | 0 (0.0%) | 0 (0.0%) |
| 6-Person Households | 10 (2.9%) | 0 (0.0%) |
| 7+ Person Households | 0 (0.0%) | 0 (0.0%) |
| Total | 205 (58.6%) | 145 (41.4%) |
Female Fertility in Alfred
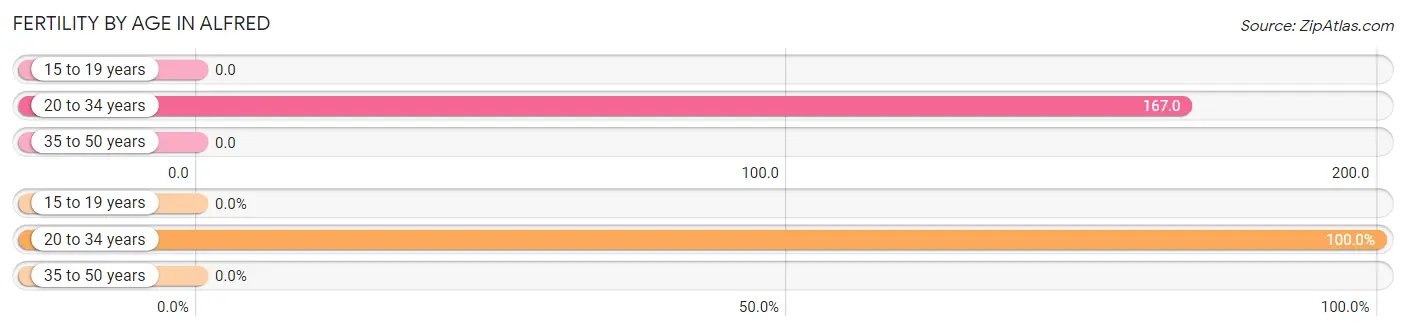
Fertility by Age in Alfred
Average fertility rate in Alfred is 61.0 births per 1,000 women. Women in the age bracket of 20 to 34 years have the highest fertility rate with 167.0 births per 1,000 women. Women in the age bracket of 20 to 34 years acount for 100.0% of all women with births.
| Age Bracket | Women with Births | Births / 1,000 Women |
| 15 to 19 years | 0 (0.0%) | 0.0 |
| 20 to 34 years | 11 (100.0%) | 167.0 |
| 35 to 50 years | 0 (0.0%) | 0.0 |
| Total | 11 (100.0%) | 61.0 |
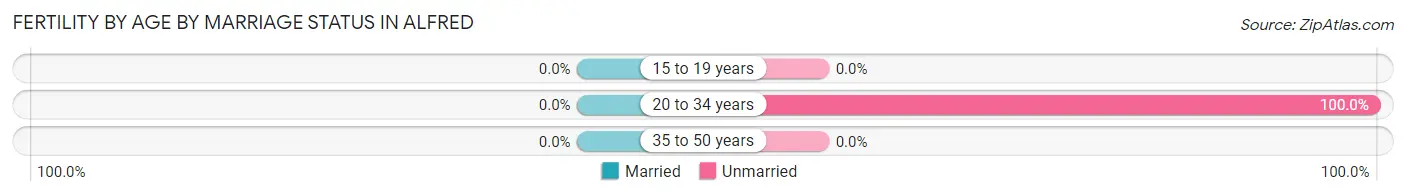
Fertility by Age by Marriage Status in Alfred
| Age Bracket | Married | Unmarried |
| 15 to 19 years | 0 (0.0%) | 0 (0.0%) |
| 20 to 34 years | 0 (0.0%) | 11 (100.0%) |
| 35 to 50 years | 0 (0.0%) | 0 (0.0%) |
| Total | 0 (0.0%) | 11 (100.0%) |
Fertility by Education in Alfred
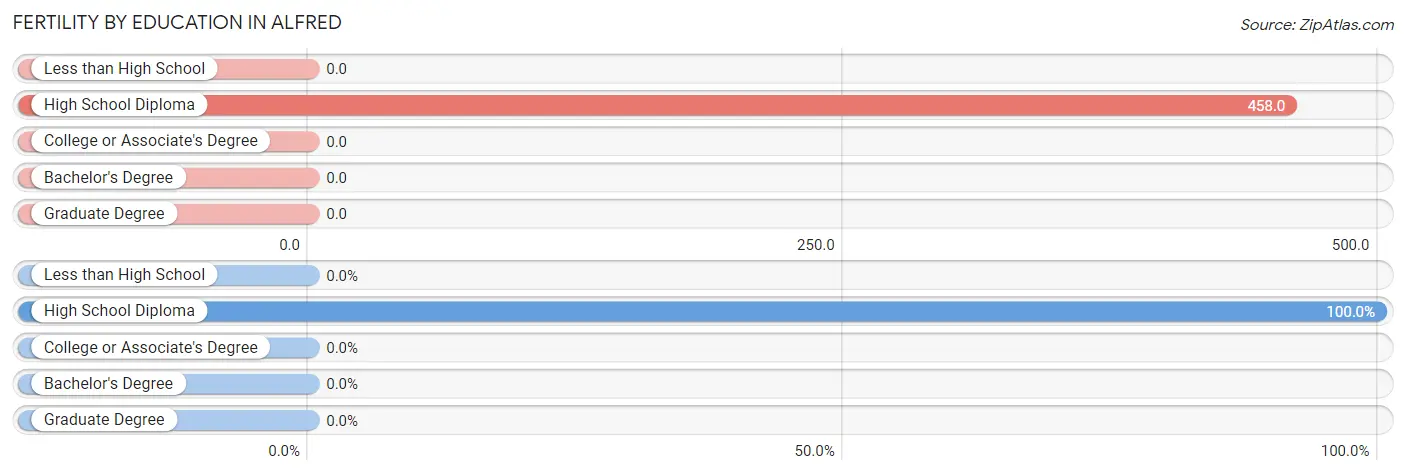
| Educational Attainment | Women with Births | Births / 1,000 Women |
| Less than High School | 0 (0.0%) | 0.0 |
| High School Diploma | 11 (100.0%) | 458.0 |
| College or Associate's Degree | 0 (0.0%) | 0.0 |
| Bachelor's Degree | 0 (0.0%) | 0.0 |
| Graduate Degree | 0 (0.0%) | 0.0 |
| Total | 11 (100.0%) | 61.0 |
Fertility by Education by Marriage Status in Alfred
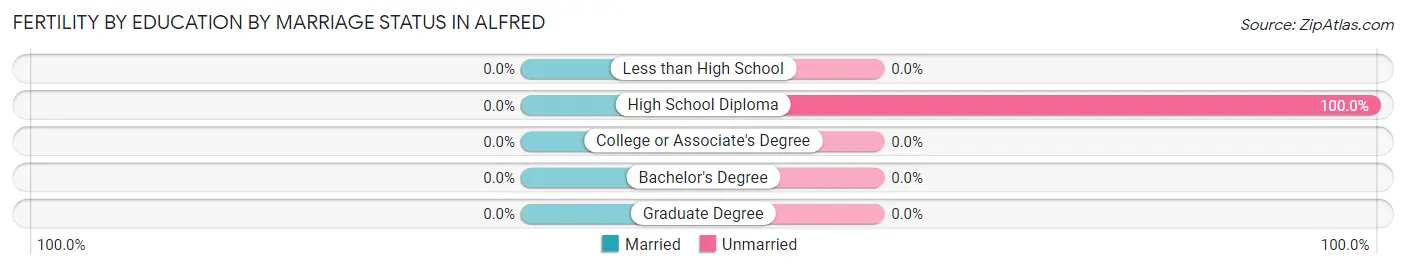
| Educational Attainment | Married | Unmarried |
| Less than High School | 0 (0.0%) | 0 (0.0%) |
| High School Diploma | 0 (0.0%) | 11 (100.0%) |
| College or Associate's Degree | 0 (0.0%) | 0 (0.0%) |
| Bachelor's Degree | 0 (0.0%) | 0 (0.0%) |
| Graduate Degree | 0 (0.0%) | 0 (0.0%) |
| Total | 0 (0.0%) | 11 (100.0%) |
Employment Characteristics in Alfred
Employment by Class of Employer in Alfred
Among the 390 employed individuals in Alfred, private company employees (275 | 70.5%), self-employed (not incorporated) (57 | 14.6%), and not-for-profit organizations (36 | 9.2%) make up the most common classes of employment.
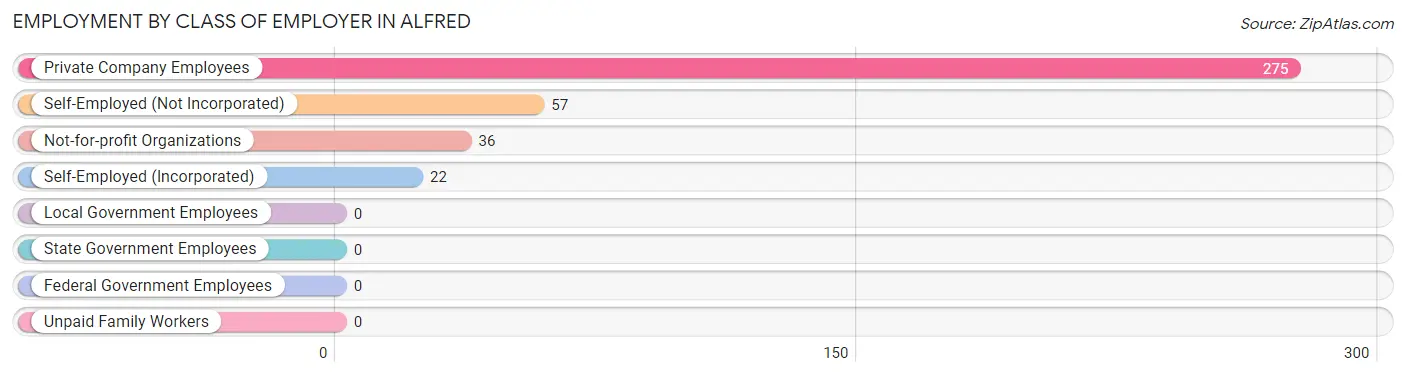
| Employer Class | # Employees | % Employees |
| Private Company Employees | 275 | 70.5% |
| Self-Employed (Incorporated) | 22 | 5.6% |
| Self-Employed (Not Incorporated) | 57 | 14.6% |
| Not-for-profit Organizations | 36 | 9.2% |
| Local Government Employees | 0 | 0.0% |
| State Government Employees | 0 | 0.0% |
| Federal Government Employees | 0 | 0.0% |
| Unpaid Family Workers | 0 | 0.0% |
| Total | 390 | 100.0% |
Employment Status by Age in Alfred
According to the labor force statistics for Alfred, out of the total population over 16 years of age (709), 61.6% or 437 individuals are in the labor force, with 8.5% or 37 of them unemployed. The age group with the highest labor force participation rate is 16 to 19 years, with 100.0% or 53 individuals in the labor force. Within the labor force, the 16 to 19 years age range has the highest percentage of unemployed individuals, with 62.3% or 33 of them being unemployed.
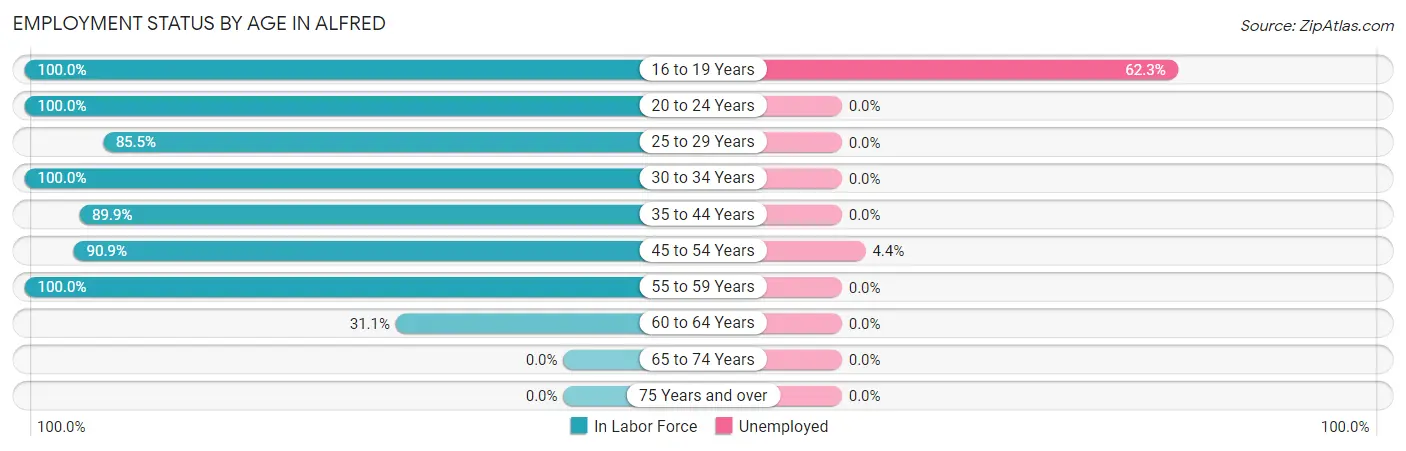
| Age Bracket | In Labor Force | Unemployed |
| 16 to 19 Years | 53 (100.0%) | 33 (62.3%) |
| 20 to 24 Years | 40 (100.0%) | 0 (0.0%) |
| 25 to 29 Years | 65 (85.5%) | 0 (0.0%) |
| 30 to 34 Years | 10 (100.0%) | 0 (0.0%) |
| 35 to 44 Years | 98 (89.9%) | 0 (0.0%) |
| 45 to 54 Years | 90 (90.9%) | 4 (4.4%) |
| 55 to 59 Years | 48 (100.0%) | 0 (0.0%) |
| 60 to 64 Years | 33 (31.1%) | 0 (0.0%) |
| 65 to 74 Years | 0 (0.0%) | 0 (0.0%) |
| 75 Years and over | 0 (0.0%) | 0 (0.0%) |
| Total | 437 (61.6%) | 37 (8.5%) |
Employment Status by Educational Attainment in Alfred
According to labor force statistics for Alfred, 76.8% of individuals (344) out of the total population between 25 and 64 years of age (448) are in the labor force, with 1.2% or 4 of them being unemployed. The group with the highest labor force participation rate are those with the educational attainment of high school diploma, with 81.2% or 147 individuals in the labor force. Within the labor force, individuals with high school diploma education have the highest percentage of unemployment, with 2.7% or 4 of them being unemployed.
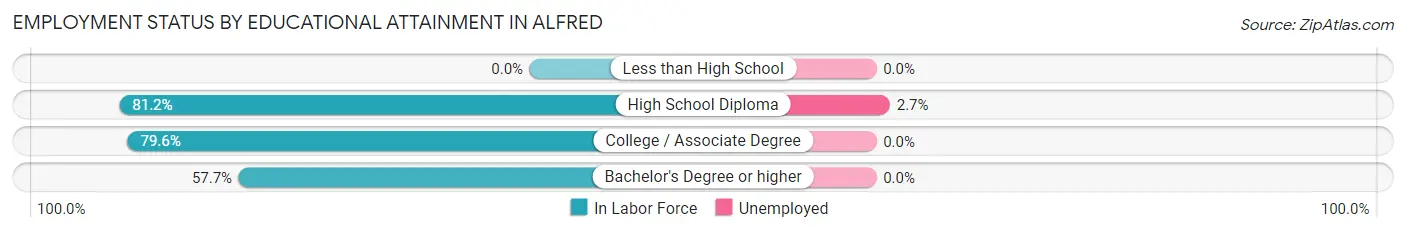
| Educational Attainment | In Labor Force | Unemployed |
| Less than High School | 0 (0.0%) | 0 (0.0%) |
| High School Diploma | 147 (81.2%) | 5 (2.7%) |
| College / Associate Degree | 156 (79.6%) | 0 (0.0%) |
| Bachelor's Degree or higher | 41 (57.7%) | 0 (0.0%) |
| Total | 344 (76.8%) | 5 (1.2%) |
Employment Occupations by Sex in Alfred
Management, Business, Science and Arts Occupations
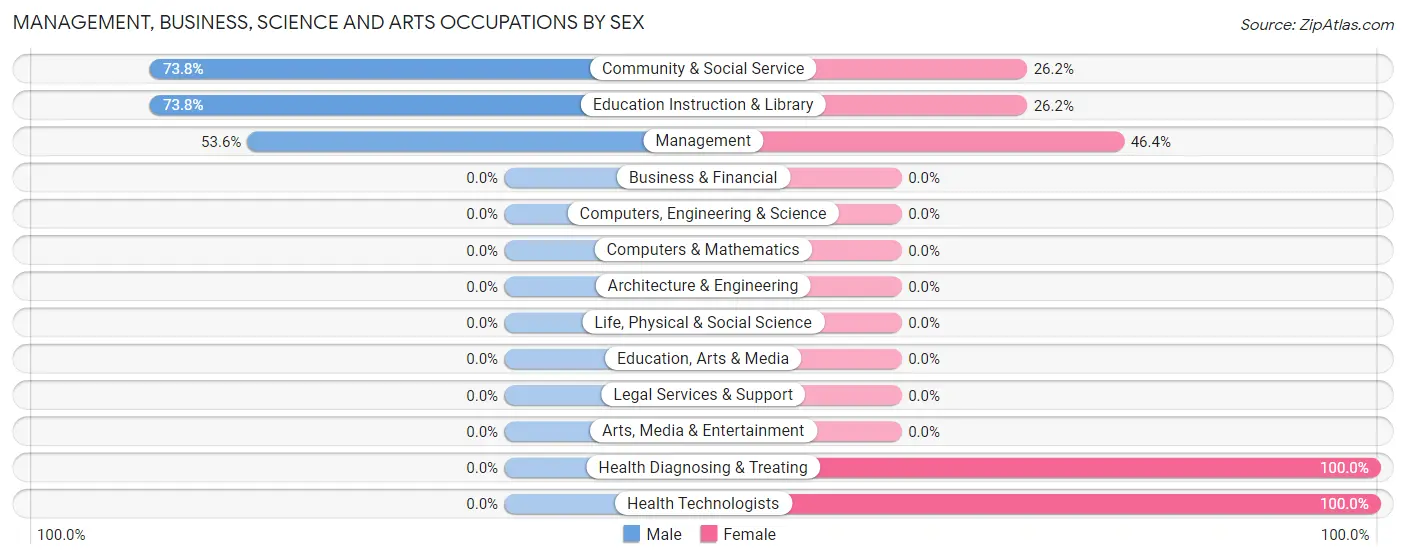
The most common Management, Business, Science and Arts occupations in Alfred are Community & Social Service (42 | 10.5%), Education Instruction & Library (42 | 10.5%), Management (28 | 7.0%), Health Diagnosing & Treating (10 | 2.5%), and Health Technologists (10 | 2.5%).
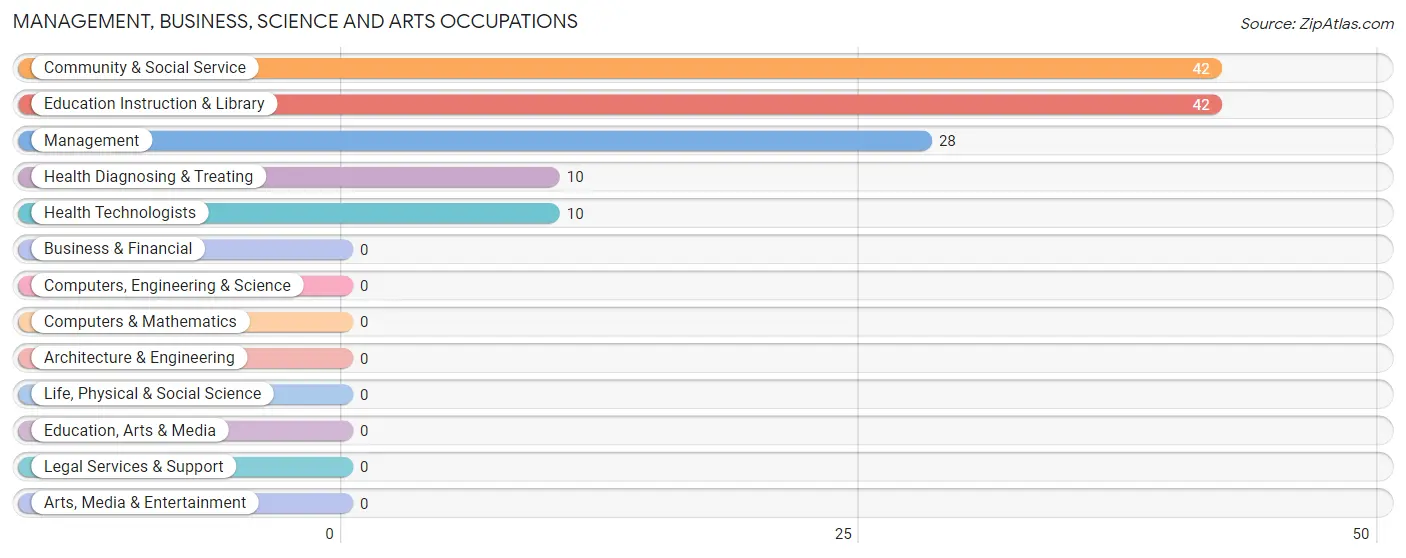
Management, Business, Science and Arts Occupations by Sex
Within the Management, Business, Science and Arts occupations in Alfred, the most male-oriented occupations are Community & Social Service (73.8%), Education Instruction & Library (73.8%), and Management (53.6%), while the most female-oriented occupations are Health Diagnosing & Treating (100.0%), Health Technologists (100.0%), and Management (46.4%).
| Occupation | Male | Female |
| Management | 15 (53.6%) | 13 (46.4%) |
| Business & Financial | 0 (0.0%) | 0 (0.0%) |
| Computers, Engineering & Science | 0 (0.0%) | 0 (0.0%) |
| Computers & Mathematics | 0 (0.0%) | 0 (0.0%) |
| Architecture & Engineering | 0 (0.0%) | 0 (0.0%) |
| Life, Physical & Social Science | 0 (0.0%) | 0 (0.0%) |
| Community & Social Service | 31 (73.8%) | 11 (26.2%) |
| Education, Arts & Media | 0 (0.0%) | 0 (0.0%) |
| Legal Services & Support | 0 (0.0%) | 0 (0.0%) |
| Education Instruction & Library | 31 (73.8%) | 11 (26.2%) |
| Arts, Media & Entertainment | 0 (0.0%) | 0 (0.0%) |
| Health Diagnosing & Treating | 0 (0.0%) | 10 (100.0%) |
| Health Technologists | 0 (0.0%) | 10 (100.0%) |
| Total (Category) | 46 (57.5%) | 34 (42.5%) |
| Total (Overall) | 218 (54.5%) | 182 (45.5%) |
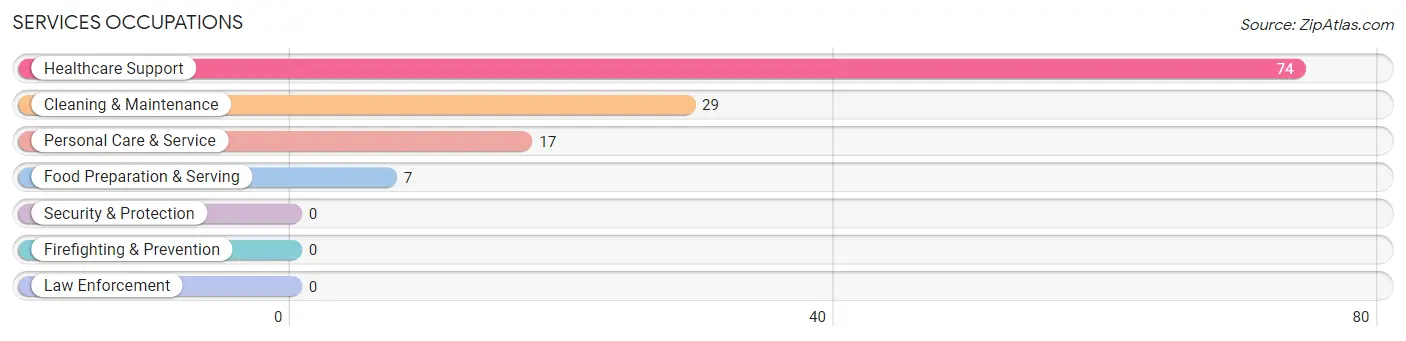
Services Occupations
The most common Services occupations in Alfred are Healthcare Support (74 | 18.5%), Cleaning & Maintenance (29 | 7.2%), Personal Care & Service (17 | 4.3%), and Food Preparation & Serving (7 | 1.8%).
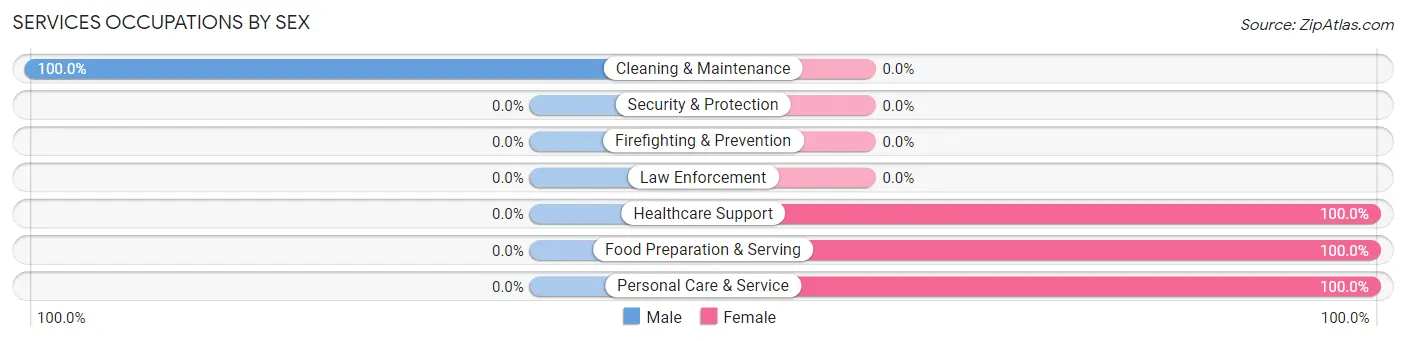
Services Occupations by Sex
| Occupation | Male | Female |
| Healthcare Support | 0 (0.0%) | 74 (100.0%) |
| Security & Protection | 0 (0.0%) | 0 (0.0%) |
| Firefighting & Prevention | 0 (0.0%) | 0 (0.0%) |
| Law Enforcement | 0 (0.0%) | 0 (0.0%) |
| Food Preparation & Serving | 0 (0.0%) | 7 (100.0%) |
| Cleaning & Maintenance | 29 (100.0%) | 0 (0.0%) |
| Personal Care & Service | 0 (0.0%) | 17 (100.0%) |
| Total (Category) | 29 (22.8%) | 98 (77.2%) |
| Total (Overall) | 218 (54.5%) | 182 (45.5%) |
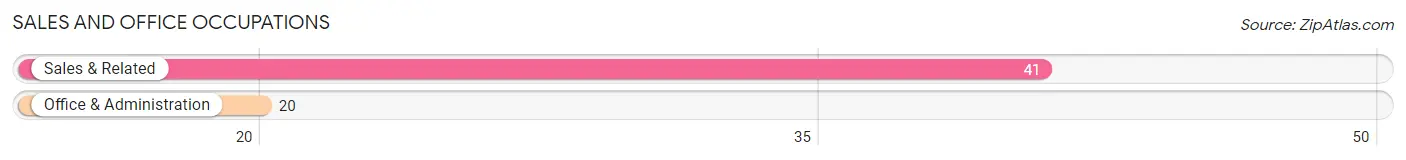
Sales and Office Occupations
The most common Sales and Office occupations in Alfred are Sales & Related (41 | 10.2%), and Office & Administration (20 | 5.0%).
Sales and Office Occupations by Sex
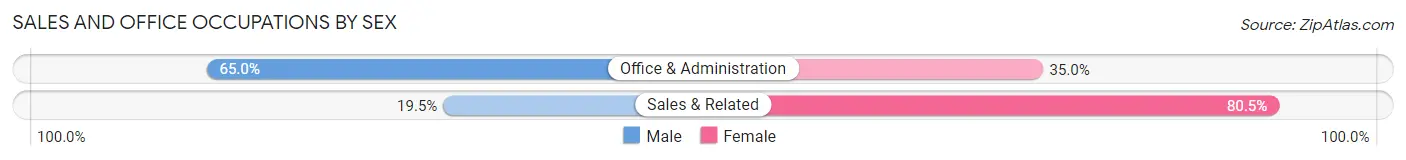
| Occupation | Male | Female |
| Sales & Related | 8 (19.5%) | 33 (80.5%) |
| Office & Administration | 13 (65.0%) | 7 (35.0%) |
| Total (Category) | 21 (34.4%) | 40 (65.6%) |
| Total (Overall) | 218 (54.5%) | 182 (45.5%) |
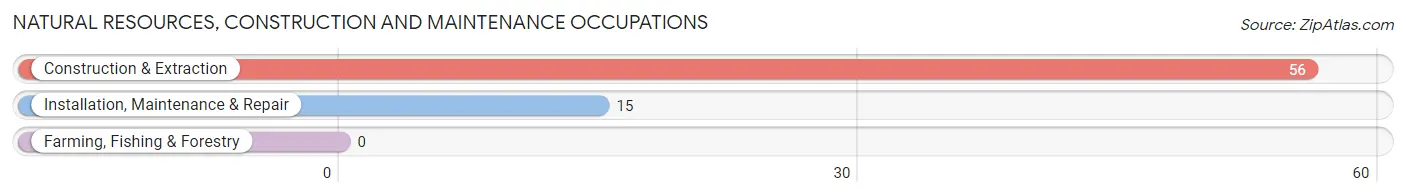
Natural Resources, Construction and Maintenance Occupations
The most common Natural Resources, Construction and Maintenance occupations in Alfred are Construction & Extraction (56 | 14.0%), and Installation, Maintenance & Repair (15 | 3.7%).
Natural Resources, Construction and Maintenance Occupations by Sex
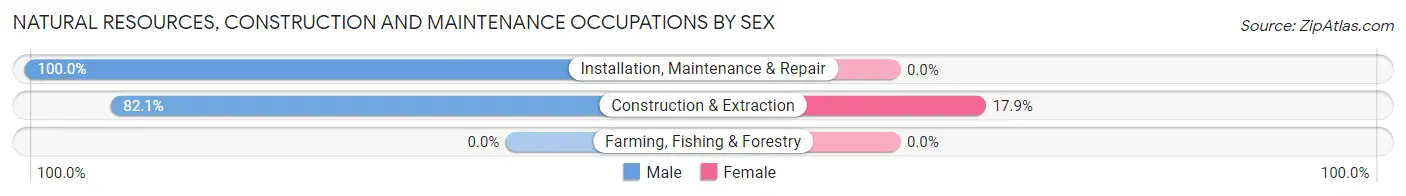
| Occupation | Male | Female |
| Farming, Fishing & Forestry | 0 (0.0%) | 0 (0.0%) |
| Construction & Extraction | 46 (82.1%) | 10 (17.9%) |
| Installation, Maintenance & Repair | 15 (100.0%) | 0 (0.0%) |
| Total (Category) | 61 (85.9%) | 10 (14.1%) |
| Total (Overall) | 218 (54.5%) | 182 (45.5%) |
Production, Transportation and Moving Occupations
The most common Production, Transportation and Moving occupations in Alfred are Production (55 | 13.8%), and Material Moving (6 | 1.5%).
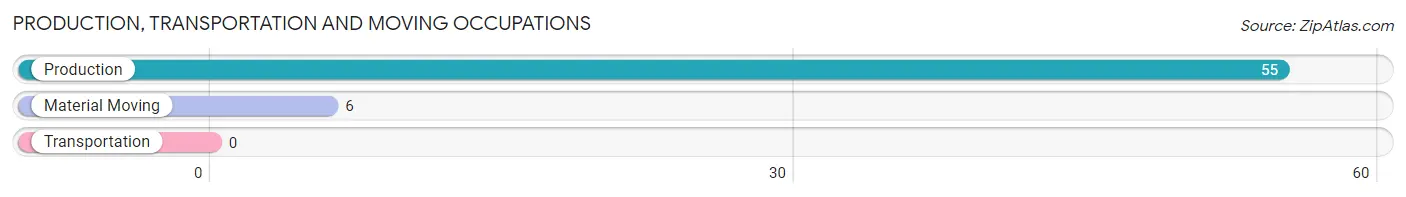
Production, Transportation and Moving Occupations by Sex
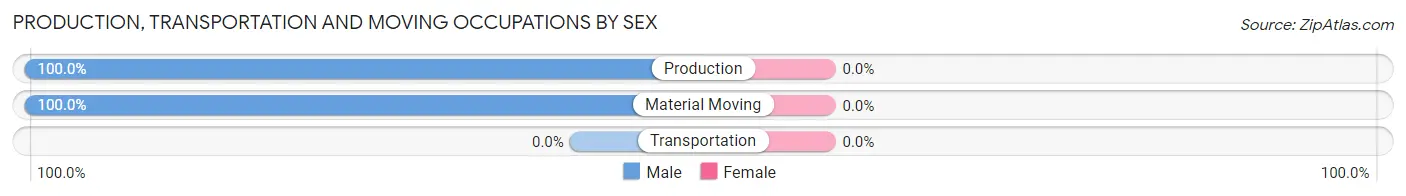
| Occupation | Male | Female |
| Production | 55 (100.0%) | 0 (0.0%) |
| Transportation | 0 (0.0%) | 0 (0.0%) |
| Material Moving | 6 (100.0%) | 0 (0.0%) |
| Total (Category) | 61 (100.0%) | 0 (0.0%) |
| Total (Overall) | 218 (54.5%) | 182 (45.5%) |
Employment Industries by Sex in Alfred
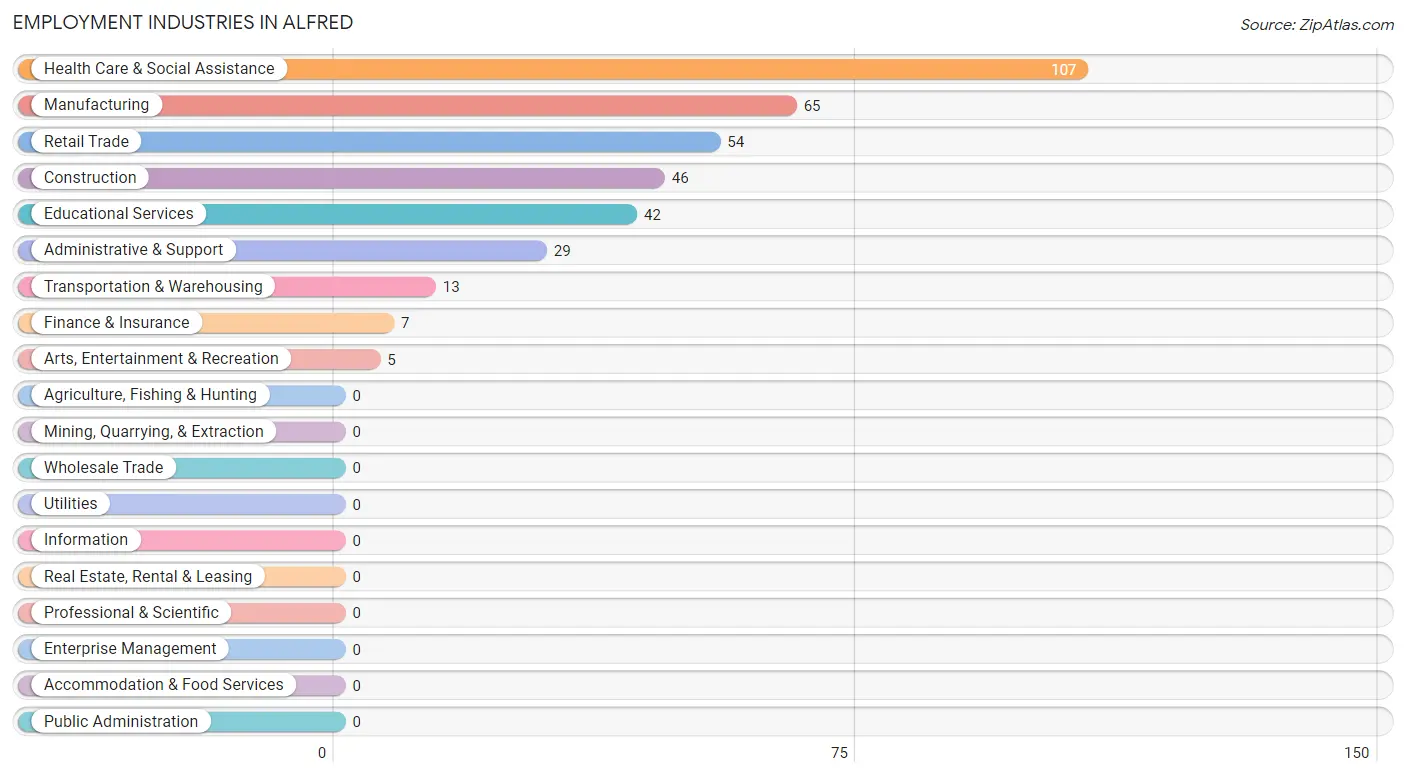
Employment Industries in Alfred
The major employment industries in Alfred include Health Care & Social Assistance (107 | 26.8%), Manufacturing (65 | 16.3%), Retail Trade (54 | 13.5%), Construction (46 | 11.5%), and Educational Services (42 | 10.5%).
Employment Industries by Sex in Alfred
The Alfred industries that see more men than women are Construction (100.0%), Transportation & Warehousing (100.0%), and Administrative & Support (100.0%), whereas the industries that tend to have a higher number of women are Finance & Insurance (100.0%), Health Care & Social Assistance (90.6%), and Retail Trade (74.1%).
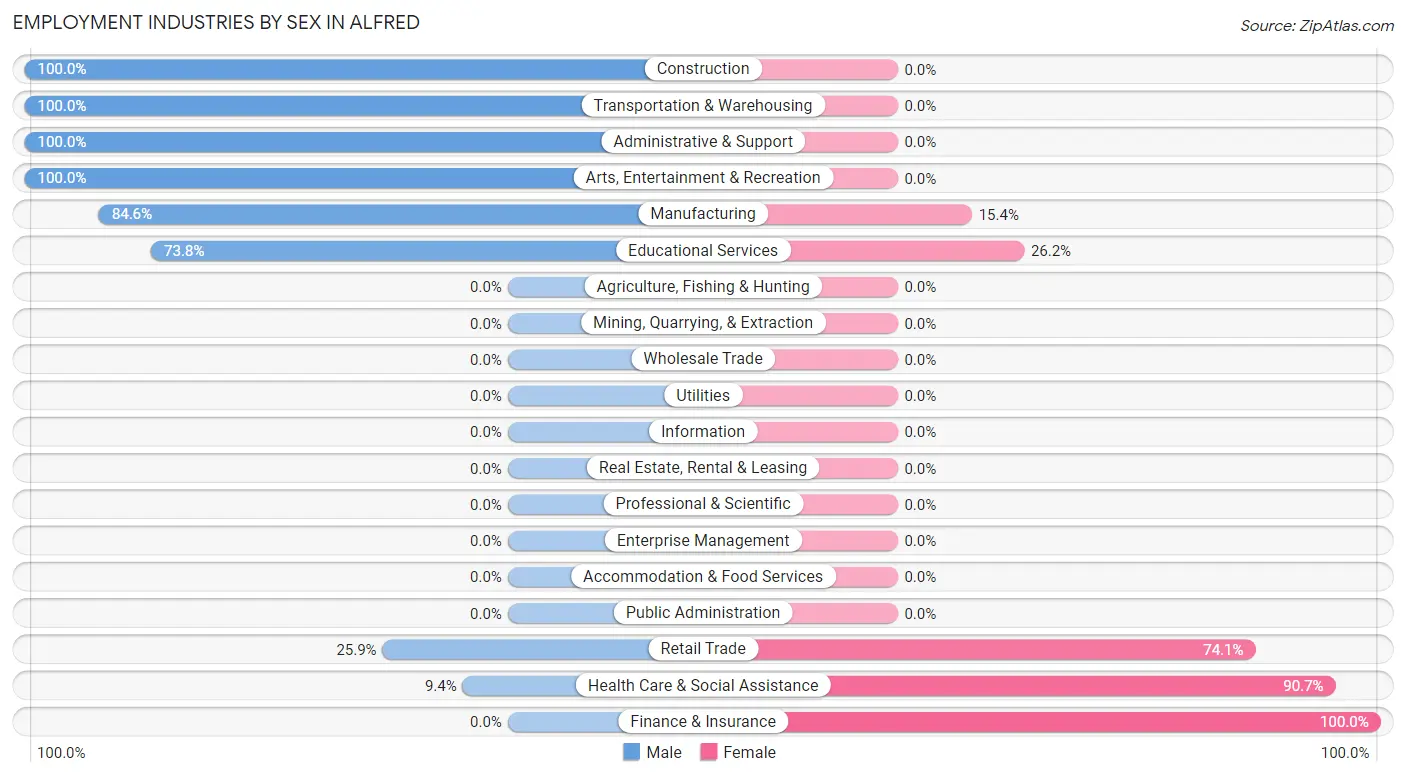
| Industry | Male | Female |
| Agriculture, Fishing & Hunting | 0 (0.0%) | 0 (0.0%) |
| Mining, Quarrying, & Extraction | 0 (0.0%) | 0 (0.0%) |
| Construction | 46 (100.0%) | 0 (0.0%) |
| Manufacturing | 55 (84.6%) | 10 (15.4%) |
| Wholesale Trade | 0 (0.0%) | 0 (0.0%) |
| Retail Trade | 14 (25.9%) | 40 (74.1%) |
| Transportation & Warehousing | 13 (100.0%) | 0 (0.0%) |
| Utilities | 0 (0.0%) | 0 (0.0%) |
| Information | 0 (0.0%) | 0 (0.0%) |
| Finance & Insurance | 0 (0.0%) | 7 (100.0%) |
| Real Estate, Rental & Leasing | 0 (0.0%) | 0 (0.0%) |
| Professional & Scientific | 0 (0.0%) | 0 (0.0%) |
| Enterprise Management | 0 (0.0%) | 0 (0.0%) |
| Administrative & Support | 29 (100.0%) | 0 (0.0%) |
| Educational Services | 31 (73.8%) | 11 (26.2%) |
| Health Care & Social Assistance | 10 (9.3%) | 97 (90.6%) |
| Arts, Entertainment & Recreation | 5 (100.0%) | 0 (0.0%) |
| Accommodation & Food Services | 0 (0.0%) | 0 (0.0%) |
| Public Administration | 0 (0.0%) | 0 (0.0%) |
| Total | 218 (54.5%) | 182 (45.5%) |
Education in Alfred
School Enrollment in Alfred
The most common levels of schooling among the 152 students in Alfred are elementary school (67 | 44.1%), high school (33 | 21.7%), and middle school (26 | 17.1%).
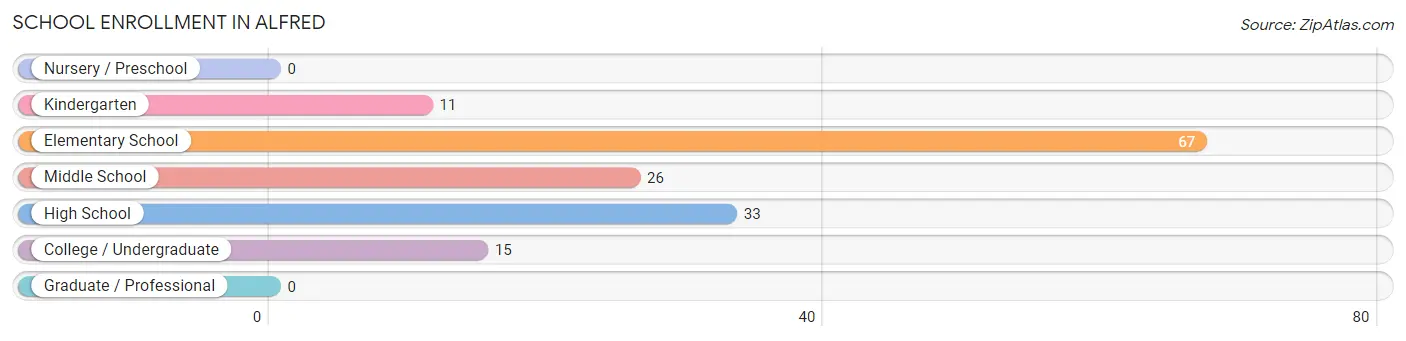
| School Level | # Students | % Students |
| Nursery / Preschool | 0 | 0.0% |
| Kindergarten | 11 | 7.2% |
| Elementary School | 67 | 44.1% |
| Middle School | 26 | 17.1% |
| High School | 33 | 21.7% |
| College / Undergraduate | 15 | 9.9% |
| Graduate / Professional | 0 | 0.0% |
| Total | 152 | 100.0% |
School Enrollment by Age by Funding Source in Alfred
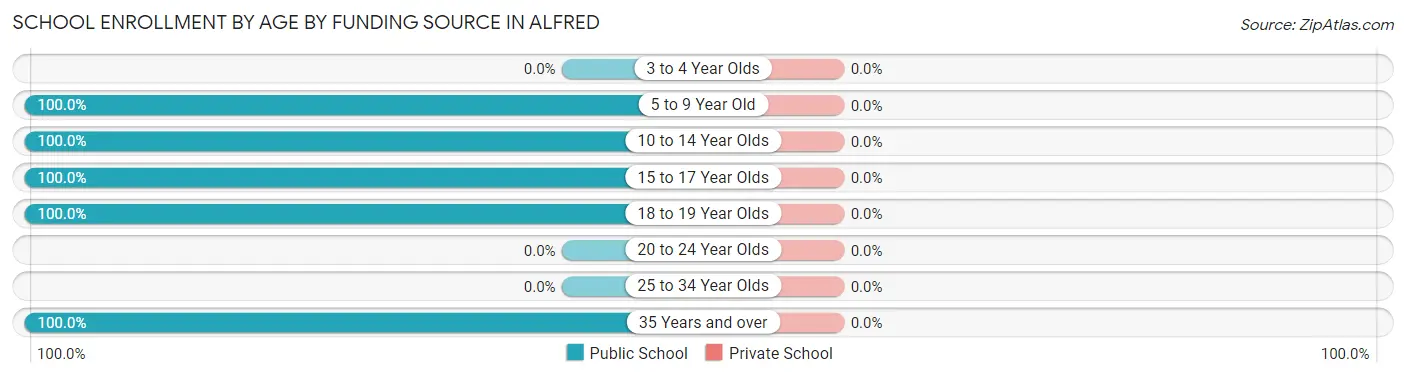
| Age Bracket | Public School | Private School |
| 3 to 4 Year Olds | 0 (0.0%) | 0 (0.0%) |
| 5 to 9 Year Old | 78 (100.0%) | 0 (0.0%) |
| 10 to 14 Year Olds | 26 (100.0%) | 0 (0.0%) |
| 15 to 17 Year Olds | 33 (100.0%) | 0 (0.0%) |
| 18 to 19 Year Olds | 5 (100.0%) | 0 (0.0%) |
| 20 to 24 Year Olds | 0 (0.0%) | 0 (0.0%) |
| 25 to 34 Year Olds | 0 (0.0%) | 0 (0.0%) |
| 35 Years and over | 10 (100.0%) | 0 (0.0%) |
| Total | 152 (100.0%) | 0 (0.0%) |
Educational Attainment by Field of Study in Alfred
Arts & humanities (33 | 31.7%), science & technology (20 | 19.2%), psychology (15 | 14.4%), literature & languages (14 | 13.5%), and social sciences (9 | 8.6%) are the most common fields of study among 104 individuals in Alfred who have obtained a bachelor's degree or higher.
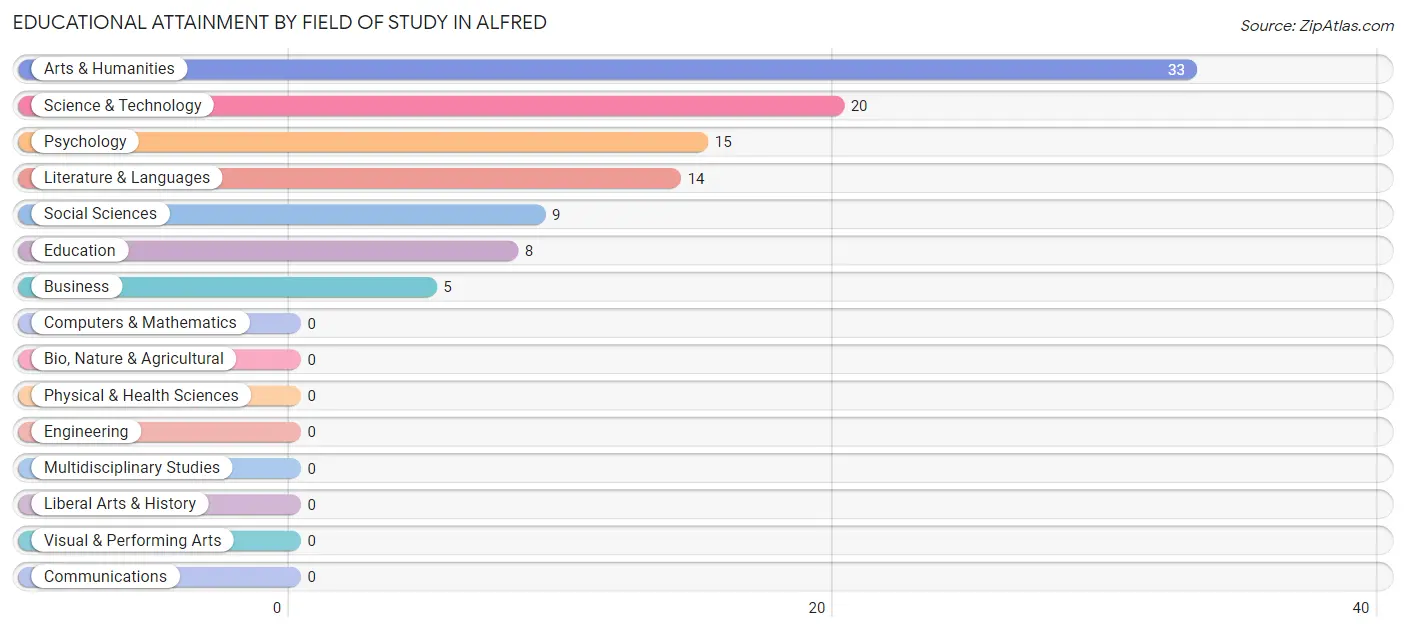
| Field of Study | # Graduates | % Graduates |
| Computers & Mathematics | 0 | 0.0% |
| Bio, Nature & Agricultural | 0 | 0.0% |
| Physical & Health Sciences | 0 | 0.0% |
| Psychology | 15 | 14.4% |
| Social Sciences | 9 | 8.6% |
| Engineering | 0 | 0.0% |
| Multidisciplinary Studies | 0 | 0.0% |
| Science & Technology | 20 | 19.2% |
| Business | 5 | 4.8% |
| Education | 8 | 7.7% |
| Literature & Languages | 14 | 13.5% |
| Liberal Arts & History | 0 | 0.0% |
| Visual & Performing Arts | 0 | 0.0% |
| Communications | 0 | 0.0% |
| Arts & Humanities | 33 | 31.7% |
| Total | 104 | 100.0% |
Transportation & Commute in Alfred
Vehicle Availability by Sex in Alfred
The most prevalent vehicle ownership categories in Alfred are males with 3 vehicles (94, accounting for 45.2%) and females with 3 vehicles (68, making up 51.6%).
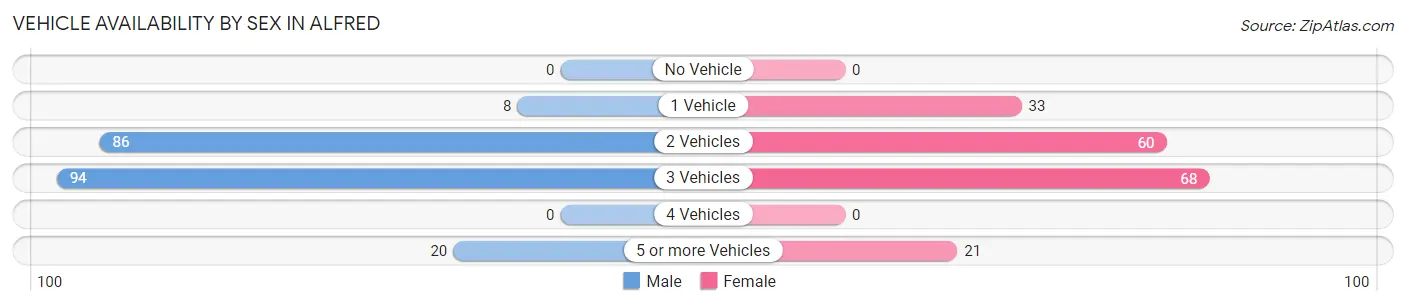
| Vehicles Available | Male | Female |
| No Vehicle | 0 (0.0%) | 0 (0.0%) |
| 1 Vehicle | 8 (3.8%) | 33 (18.1%) |
| 2 Vehicles | 86 (41.3%) | 60 (33.0%) |
| 3 Vehicles | 94 (45.2%) | 68 (37.4%) |
| 4 Vehicles | 0 (0.0%) | 0 (0.0%) |
| 5 or more Vehicles | 20 (9.6%) | 21 (11.5%) |
| Total | 208 (100.0%) | 182 (100.0%) |
Commute Time in Alfred
The most frequently occuring commute durations in Alfred are 20 to 24 minutes (78 commuters, 20.0%), 35 to 39 minutes (76 commuters, 19.5%), and 45 to 59 minutes (45 commuters, 11.5%).
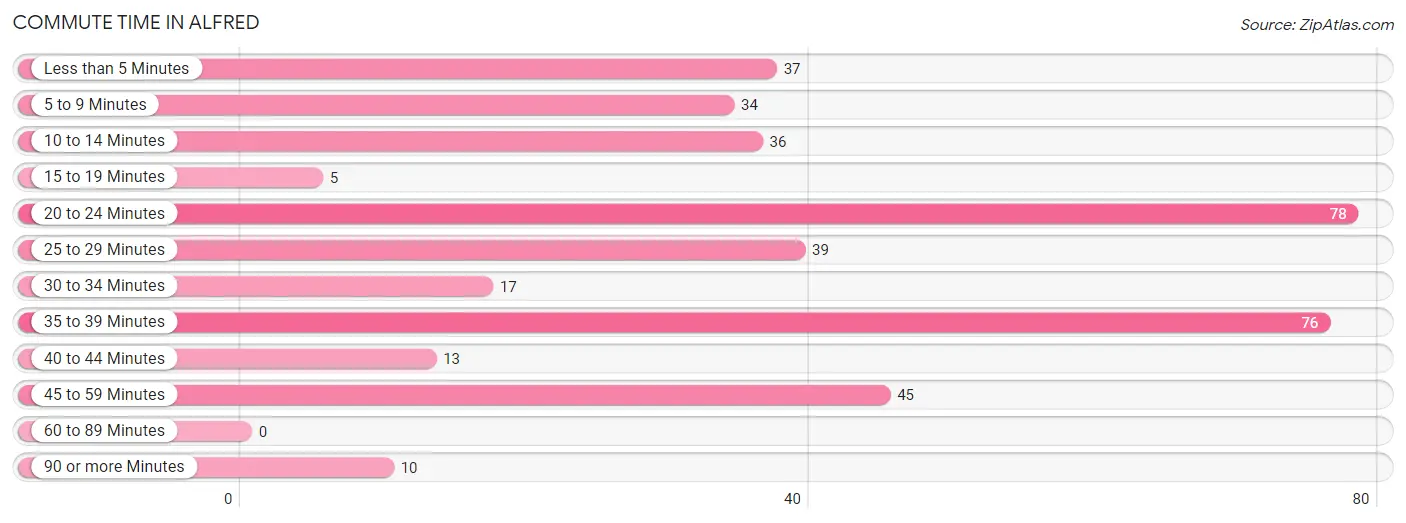
| Commute Time | # Commuters | % Commuters |
| Less than 5 Minutes | 37 | 9.5% |
| 5 to 9 Minutes | 34 | 8.7% |
| 10 to 14 Minutes | 36 | 9.2% |
| 15 to 19 Minutes | 5 | 1.3% |
| 20 to 24 Minutes | 78 | 20.0% |
| 25 to 29 Minutes | 39 | 10.0% |
| 30 to 34 Minutes | 17 | 4.4% |
| 35 to 39 Minutes | 76 | 19.5% |
| 40 to 44 Minutes | 13 | 3.3% |
| 45 to 59 Minutes | 45 | 11.5% |
| 60 to 89 Minutes | 0 | 0.0% |
| 90 or more Minutes | 10 | 2.6% |
Commute Time by Sex in Alfred
The most common commute times in Alfred are 20 to 24 minutes (46 commuters, 22.1%) for males and 35 to 39 minutes (64 commuters, 35.2%) for females.
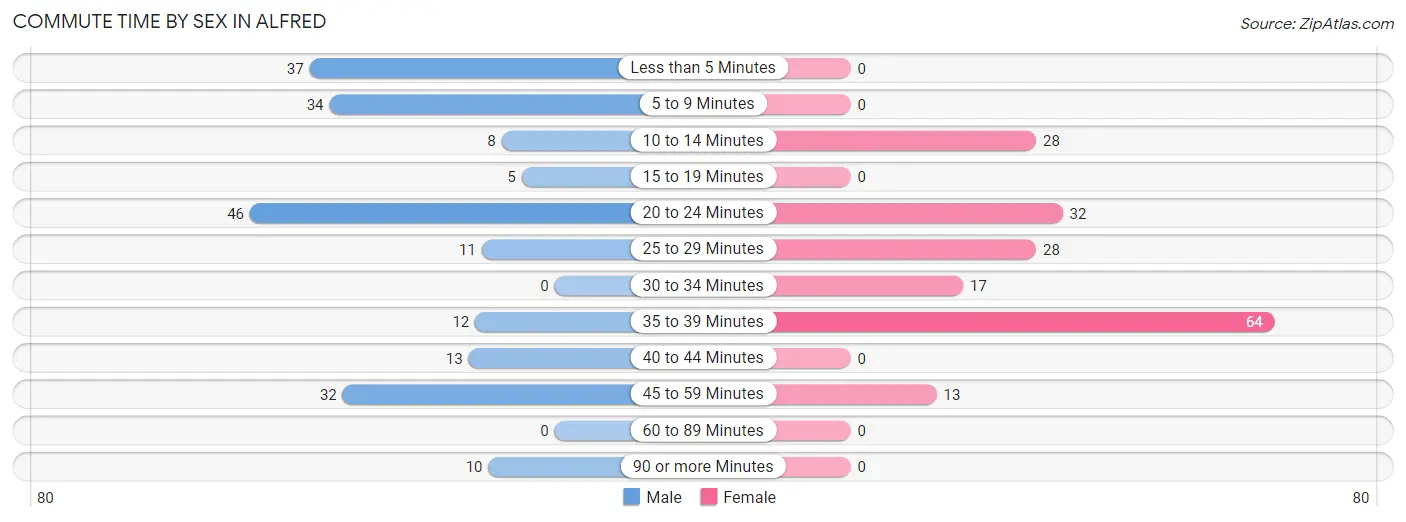
| Commute Time | Male | Female |
| Less than 5 Minutes | 37 (17.8%) | 0 (0.0%) |
| 5 to 9 Minutes | 34 (16.4%) | 0 (0.0%) |
| 10 to 14 Minutes | 8 (3.8%) | 28 (15.4%) |
| 15 to 19 Minutes | 5 (2.4%) | 0 (0.0%) |
| 20 to 24 Minutes | 46 (22.1%) | 32 (17.6%) |
| 25 to 29 Minutes | 11 (5.3%) | 28 (15.4%) |
| 30 to 34 Minutes | 0 (0.0%) | 17 (9.3%) |
| 35 to 39 Minutes | 12 (5.8%) | 64 (35.2%) |
| 40 to 44 Minutes | 13 (6.2%) | 0 (0.0%) |
| 45 to 59 Minutes | 32 (15.4%) | 13 (7.1%) |
| 60 to 89 Minutes | 0 (0.0%) | 0 (0.0%) |
| 90 or more Minutes | 10 (4.8%) | 0 (0.0%) |
Time of Departure to Work by Sex in Alfred
The most frequent times of departure to work in Alfred are 6:00 AM to 6:29 AM (56, 26.9%) for males and 7:00 AM to 7:29 AM (58, 31.9%) for females.
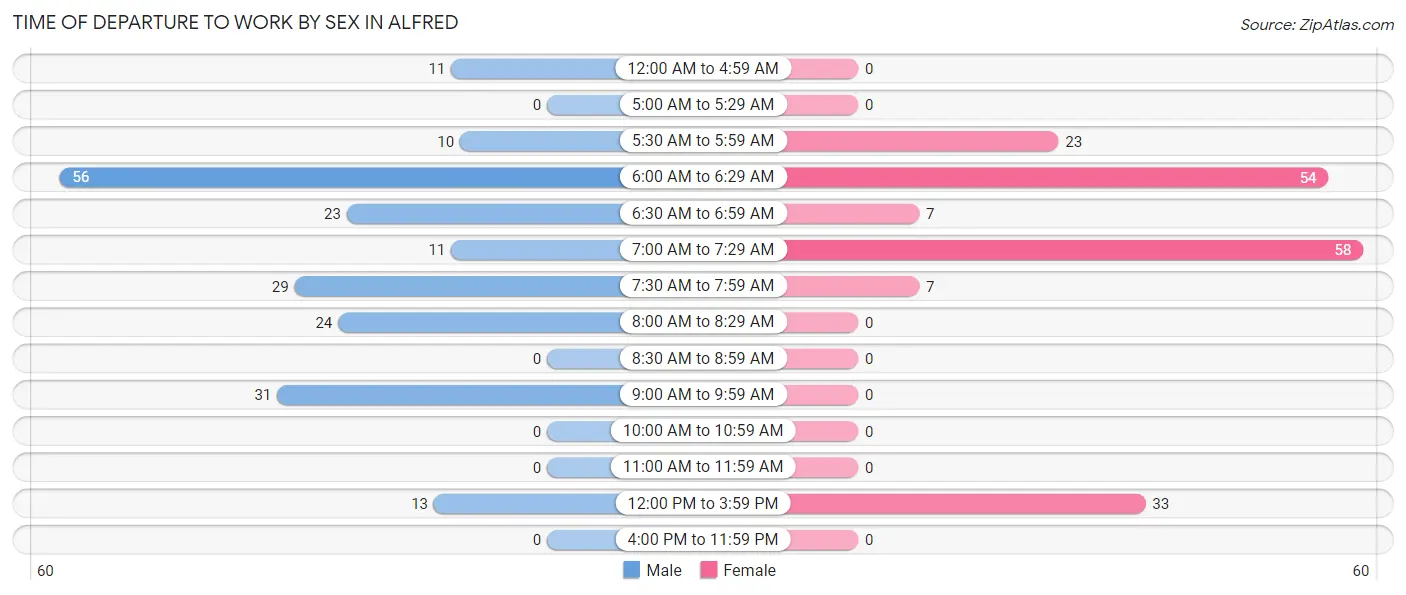
| Time of Departure | Male | Female |
| 12:00 AM to 4:59 AM | 11 (5.3%) | 0 (0.0%) |
| 5:00 AM to 5:29 AM | 0 (0.0%) | 0 (0.0%) |
| 5:30 AM to 5:59 AM | 10 (4.8%) | 23 (12.6%) |
| 6:00 AM to 6:29 AM | 56 (26.9%) | 54 (29.7%) |
| 6:30 AM to 6:59 AM | 23 (11.1%) | 7 (3.8%) |
| 7:00 AM to 7:29 AM | 11 (5.3%) | 58 (31.9%) |
| 7:30 AM to 7:59 AM | 29 (13.9%) | 7 (3.8%) |
| 8:00 AM to 8:29 AM | 24 (11.5%) | 0 (0.0%) |
| 8:30 AM to 8:59 AM | 0 (0.0%) | 0 (0.0%) |
| 9:00 AM to 9:59 AM | 31 (14.9%) | 0 (0.0%) |
| 10:00 AM to 10:59 AM | 0 (0.0%) | 0 (0.0%) |
| 11:00 AM to 11:59 AM | 0 (0.0%) | 0 (0.0%) |
| 12:00 PM to 3:59 PM | 13 (6.2%) | 33 (18.1%) |
| 4:00 PM to 11:59 PM | 0 (0.0%) | 0 (0.0%) |
| Total | 208 (100.0%) | 182 (100.0%) |
Housing Occupancy in Alfred
Occupancy by Ownership in Alfred
Of the total 350 dwellings in Alfred, owner-occupied units account for 233 (66.6%), while renter-occupied units make up 117 (33.4%).
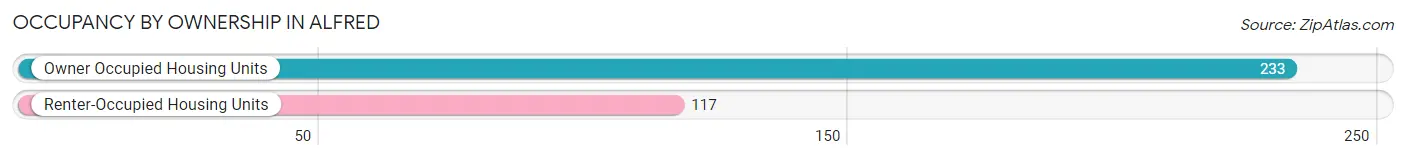
| Occupancy | # Housing Units | % Housing Units |
| Owner Occupied Housing Units | 233 | 66.6% |
| Renter-Occupied Housing Units | 117 | 33.4% |
| Total Occupied Housing Units | 350 | 100.0% |
Occupancy by Household Size in Alfred
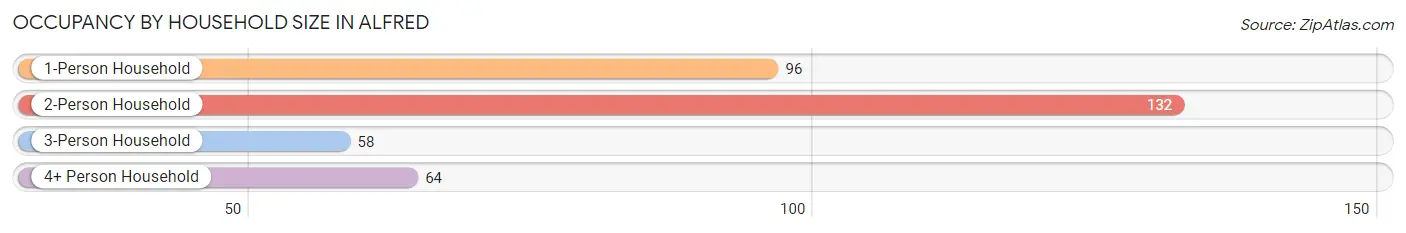
| Household Size | # Housing Units | % Housing Units |
| 1-Person Household | 96 | 27.4% |
| 2-Person Household | 132 | 37.7% |
| 3-Person Household | 58 | 16.6% |
| 4+ Person Household | 64 | 18.3% |
| Total Housing Units | 350 | 100.0% |
Occupancy by Ownership by Household Size in Alfred
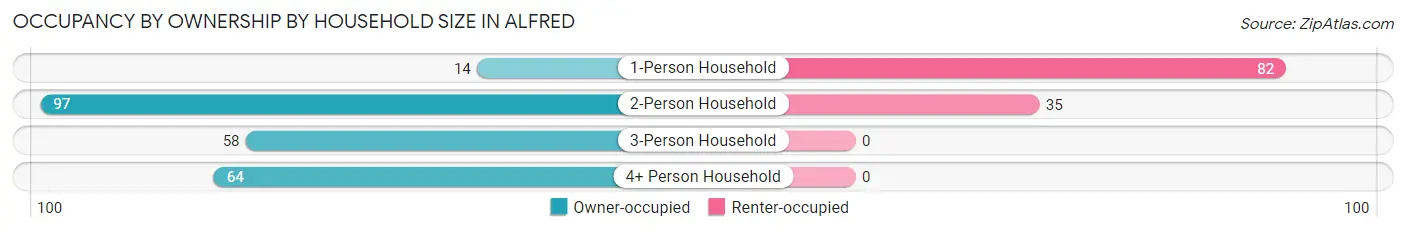
| Household Size | Owner-occupied | Renter-occupied |
| 1-Person Household | 14 (14.6%) | 82 (85.4%) |
| 2-Person Household | 97 (73.5%) | 35 (26.5%) |
| 3-Person Household | 58 (100.0%) | 0 (0.0%) |
| 4+ Person Household | 64 (100.0%) | 0 (0.0%) |
| Total Housing Units | 233 (66.6%) | 117 (33.4%) |
Occupancy by Educational Attainment in Alfred
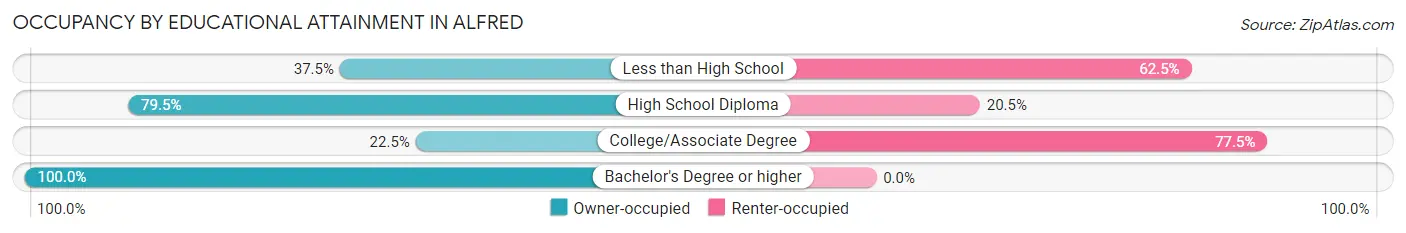
| Household Size | Owner-occupied | Renter-occupied |
| Less than High School | 6 (37.5%) | 10 (62.5%) |
| High School Diploma | 147 (79.5%) | 38 (20.5%) |
| College/Associate Degree | 20 (22.5%) | 69 (77.5%) |
| Bachelor's Degree or higher | 60 (100.0%) | 0 (0.0%) |
Occupancy by Age of Householder in Alfred
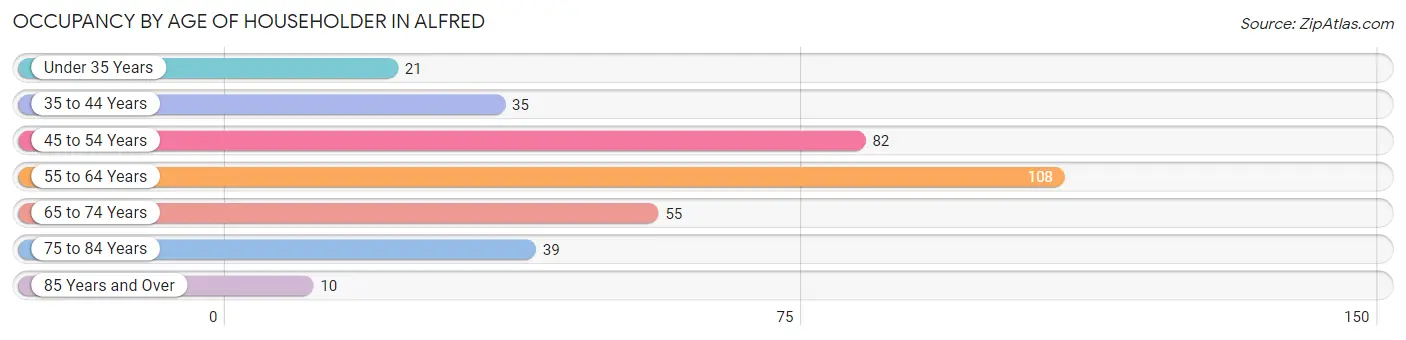
| Age Bracket | # Households | % Households |
| Under 35 Years | 21 | 6.0% |
| 35 to 44 Years | 35 | 10.0% |
| 45 to 54 Years | 82 | 23.4% |
| 55 to 64 Years | 108 | 30.9% |
| 65 to 74 Years | 55 | 15.7% |
| 75 to 84 Years | 39 | 11.1% |
| 85 Years and Over | 10 | 2.9% |
| Total | 350 | 100.0% |
Housing Finances in Alfred
Median Income by Occupancy in Alfred
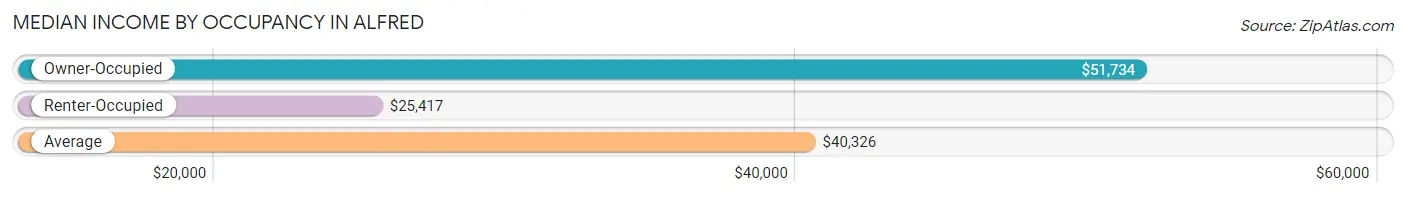
| Occupancy Type | # Households | Median Income |
| Owner-Occupied | 233 (66.6%) | $51,734 |
| Renter-Occupied | 117 (33.4%) | $25,417 |
| Average | 350 (100.0%) | $40,326 |
Occupancy by Householder Income Bracket in Alfred
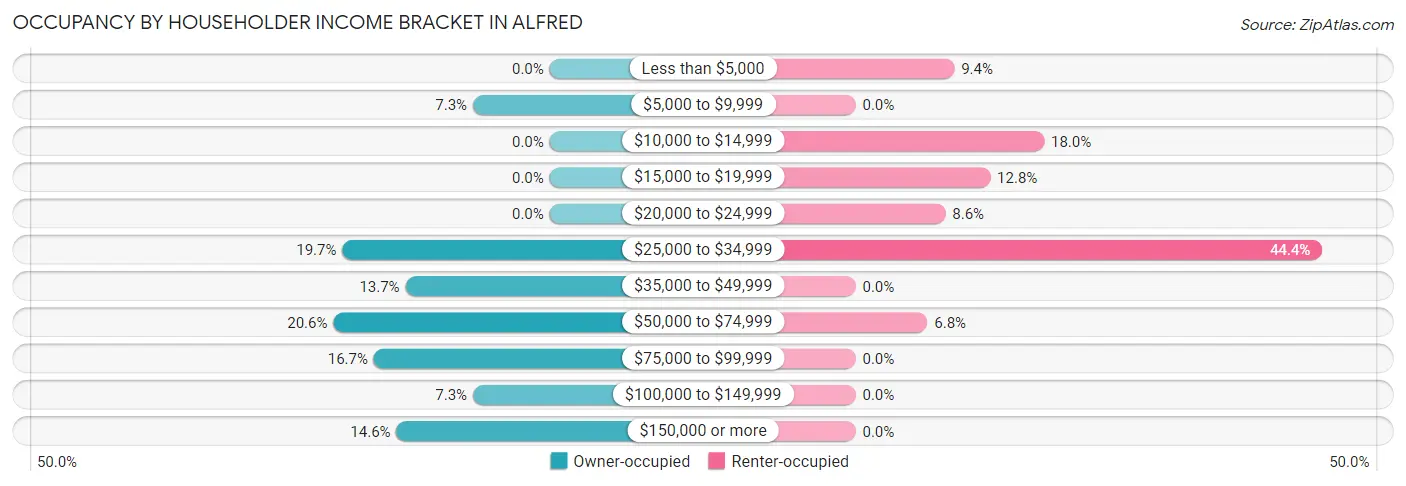
| Income Bracket | Owner-occupied | Renter-occupied |
| Less than $5,000 | 0 (0.0%) | 11 (9.4%) |
| $5,000 to $9,999 | 17 (7.3%) | 0 (0.0%) |
| $10,000 to $14,999 | 0 (0.0%) | 21 (17.9%) |
| $15,000 to $19,999 | 0 (0.0%) | 15 (12.8%) |
| $20,000 to $24,999 | 0 (0.0%) | 10 (8.6%) |
| $25,000 to $34,999 | 46 (19.7%) | 52 (44.4%) |
| $35,000 to $49,999 | 32 (13.7%) | 0 (0.0%) |
| $50,000 to $74,999 | 48 (20.6%) | 8 (6.8%) |
| $75,000 to $99,999 | 39 (16.7%) | 0 (0.0%) |
| $100,000 to $149,999 | 17 (7.3%) | 0 (0.0%) |
| $150,000 or more | 34 (14.6%) | 0 (0.0%) |
| Total | 233 (100.0%) | 117 (100.0%) |
Monthly Housing Cost Tiers in Alfred
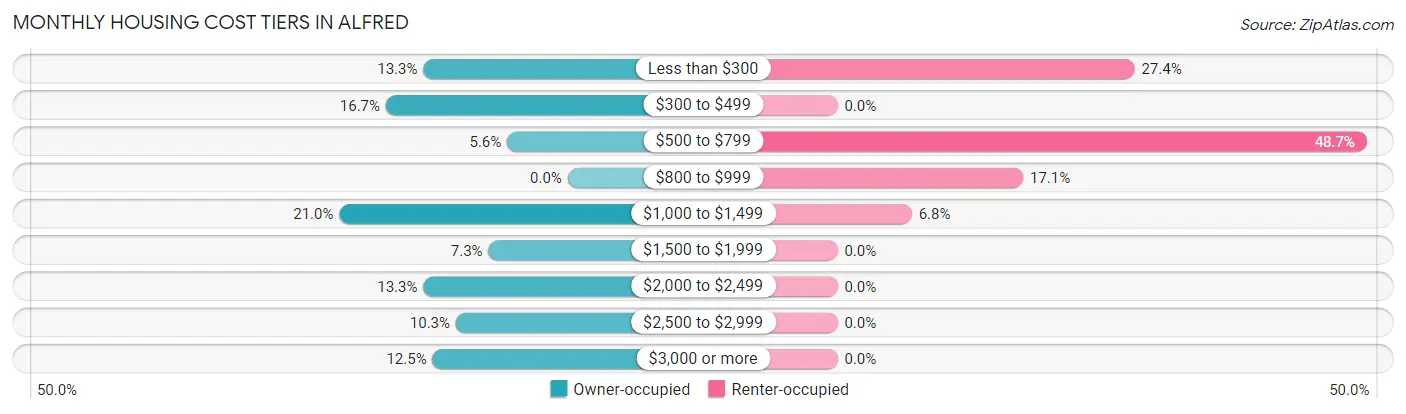
| Monthly Cost | Owner-occupied | Renter-occupied |
| Less than $300 | 31 (13.3%) | 32 (27.4%) |
| $300 to $499 | 39 (16.7%) | 0 (0.0%) |
| $500 to $799 | 13 (5.6%) | 57 (48.7%) |
| $800 to $999 | 0 (0.0%) | 20 (17.1%) |
| $1,000 to $1,499 | 49 (21.0%) | 8 (6.8%) |
| $1,500 to $1,999 | 17 (7.3%) | 0 (0.0%) |
| $2,000 to $2,499 | 31 (13.3%) | 0 (0.0%) |
| $2,500 to $2,999 | 24 (10.3%) | 0 (0.0%) |
| $3,000 or more | 29 (12.4%) | 0 (0.0%) |
| Total | 233 (100.0%) | 117 (100.0%) |
Physical Housing Characteristics in Alfred
Housing Structures in Alfred
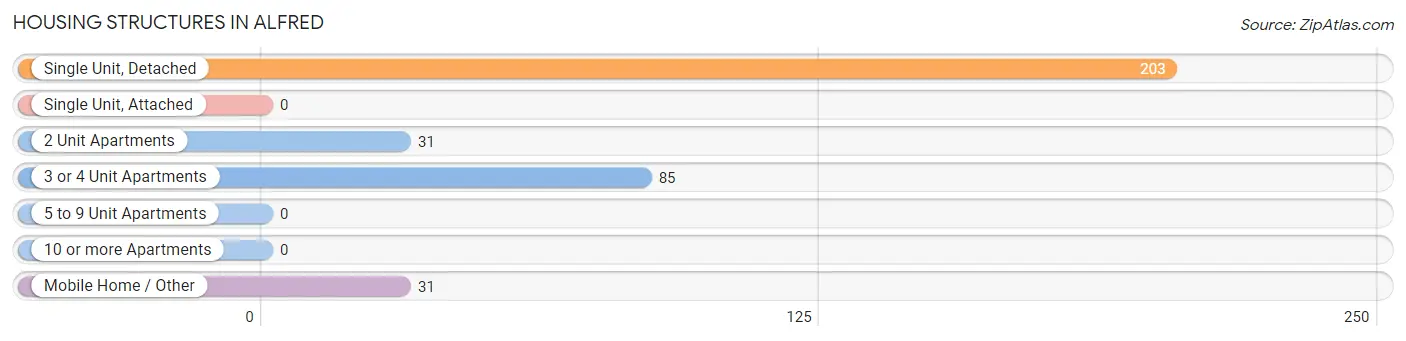
| Structure Type | # Housing Units | % Housing Units |
| Single Unit, Detached | 203 | 58.0% |
| Single Unit, Attached | 0 | 0.0% |
| 2 Unit Apartments | 31 | 8.9% |
| 3 or 4 Unit Apartments | 85 | 24.3% |
| 5 to 9 Unit Apartments | 0 | 0.0% |
| 10 or more Apartments | 0 | 0.0% |
| Mobile Home / Other | 31 | 8.9% |
| Total | 350 | 100.0% |
Housing Structures by Occupancy in Alfred
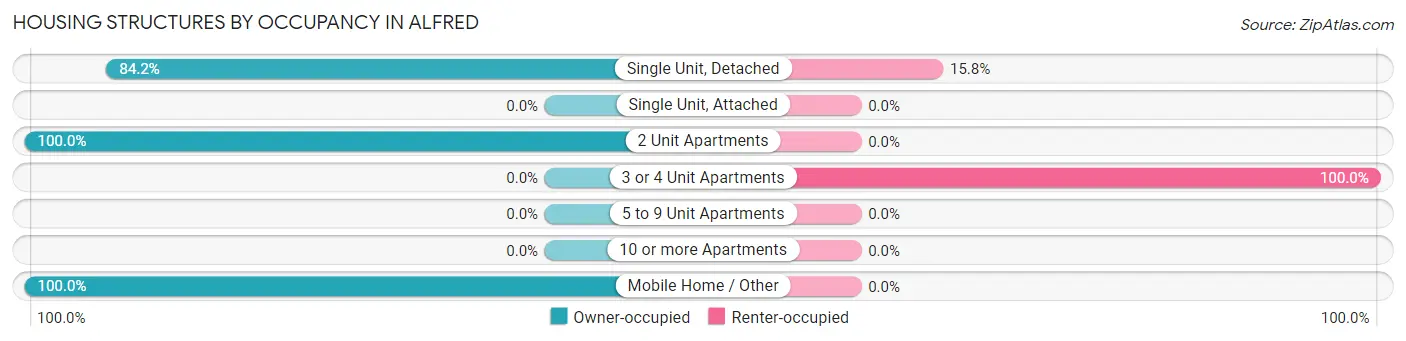
| Structure Type | Owner-occupied | Renter-occupied |
| Single Unit, Detached | 171 (84.2%) | 32 (15.8%) |
| Single Unit, Attached | 0 (0.0%) | 0 (0.0%) |
| 2 Unit Apartments | 31 (100.0%) | 0 (0.0%) |
| 3 or 4 Unit Apartments | 0 (0.0%) | 85 (100.0%) |
| 5 to 9 Unit Apartments | 0 (0.0%) | 0 (0.0%) |
| 10 or more Apartments | 0 (0.0%) | 0 (0.0%) |
| Mobile Home / Other | 31 (100.0%) | 0 (0.0%) |
| Total | 233 (66.6%) | 117 (33.4%) |
Housing Structures by Number of Rooms in Alfred
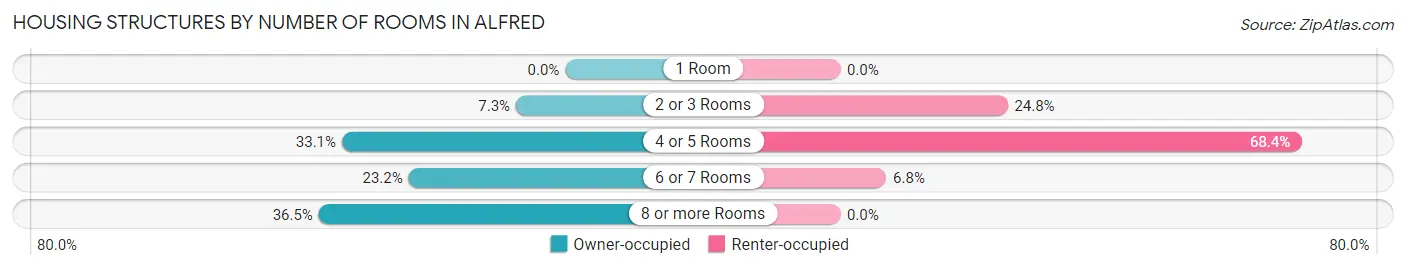
| Number of Rooms | Owner-occupied | Renter-occupied |
| 1 Room | 0 (0.0%) | 0 (0.0%) |
| 2 or 3 Rooms | 17 (7.3%) | 29 (24.8%) |
| 4 or 5 Rooms | 77 (33.1%) | 80 (68.4%) |
| 6 or 7 Rooms | 54 (23.2%) | 8 (6.8%) |
| 8 or more Rooms | 85 (36.5%) | 0 (0.0%) |
| Total | 233 (100.0%) | 117 (100.0%) |
Housing Structure by Heating Type in Alfred
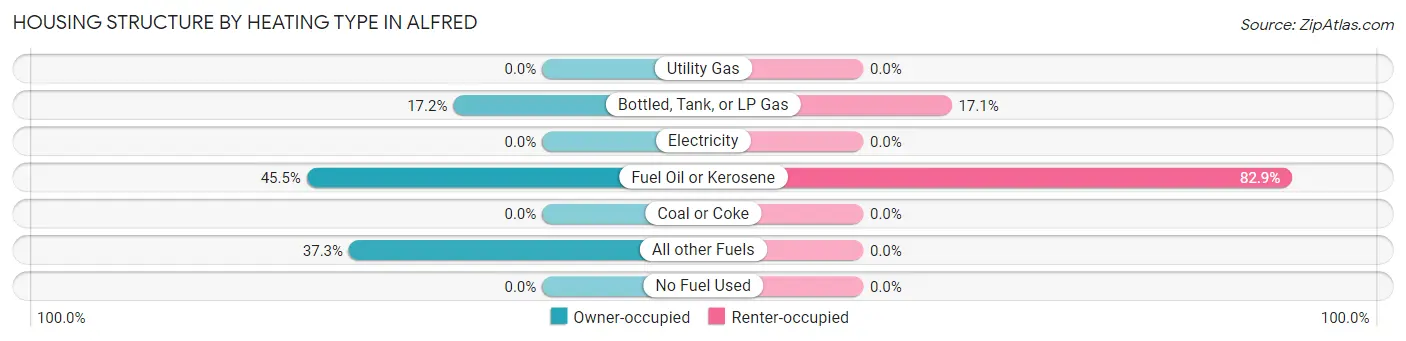
| Heating Type | Owner-occupied | Renter-occupied |
| Utility Gas | 0 (0.0%) | 0 (0.0%) |
| Bottled, Tank, or LP Gas | 40 (17.2%) | 20 (17.1%) |
| Electricity | 0 (0.0%) | 0 (0.0%) |
| Fuel Oil or Kerosene | 106 (45.5%) | 97 (82.9%) |
| Coal or Coke | 0 (0.0%) | 0 (0.0%) |
| All other Fuels | 87 (37.3%) | 0 (0.0%) |
| No Fuel Used | 0 (0.0%) | 0 (0.0%) |
| Total | 233 (100.0%) | 117 (100.0%) |
Household Vehicle Usage in Alfred
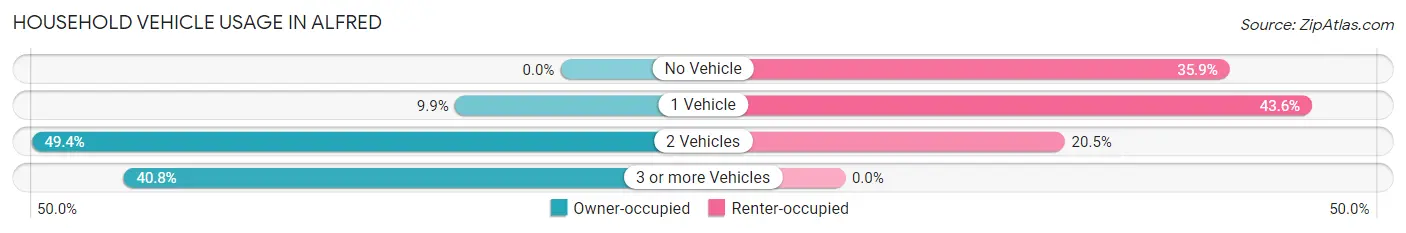
| Vehicles per Household | Owner-occupied | Renter-occupied |
| No Vehicle | 0 (0.0%) | 42 (35.9%) |
| 1 Vehicle | 23 (9.9%) | 51 (43.6%) |
| 2 Vehicles | 115 (49.4%) | 24 (20.5%) |
| 3 or more Vehicles | 95 (40.8%) | 0 (0.0%) |
| Total | 233 (100.0%) | 117 (100.0%) |
Real Estate & Mortgages in Alfred
Real Estate and Mortgage Overview in Alfred
| Characteristic | Without Mortgage | With Mortgage |
| Housing Units | 121 | 112 |
| Median Property Value | $237,800 | $381,600 |
| Median Household Income | $51,169 | $20 |
| Monthly Housing Costs | - | - |
| Real Estate Taxes | $2,756 | $0 |
Property Value by Mortgage Status in Alfred
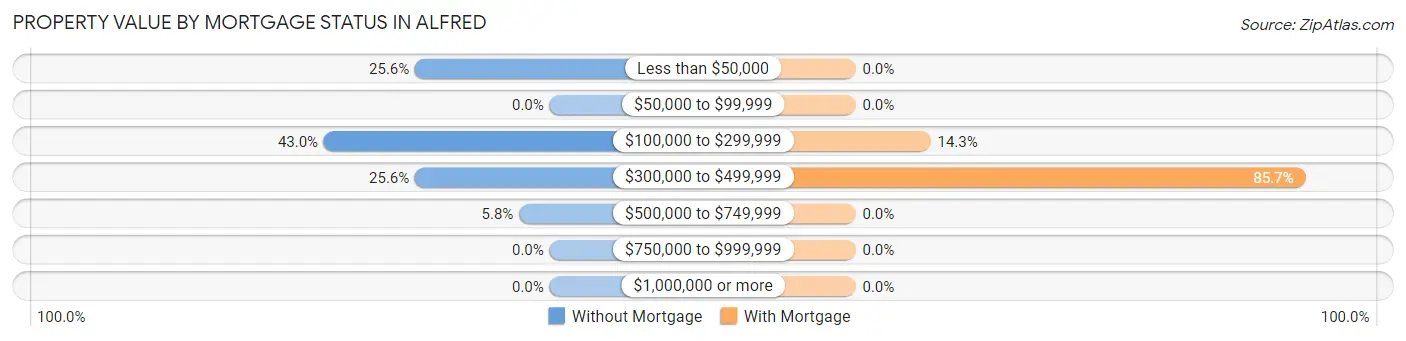
| Property Value | Without Mortgage | With Mortgage |
| Less than $50,000 | 31 (25.6%) | 0 (0.0%) |
| $50,000 to $99,999 | 0 (0.0%) | 0 (0.0%) |
| $100,000 to $299,999 | 52 (43.0%) | 16 (14.3%) |
| $300,000 to $499,999 | 31 (25.6%) | 96 (85.7%) |
| $500,000 to $749,999 | 7 (5.8%) | 0 (0.0%) |
| $750,000 to $999,999 | 0 (0.0%) | 0 (0.0%) |
| $1,000,000 or more | 0 (0.0%) | 0 (0.0%) |
| Total | 121 (100.0%) | 112 (100.0%) |
Household Income by Mortgage Status in Alfred
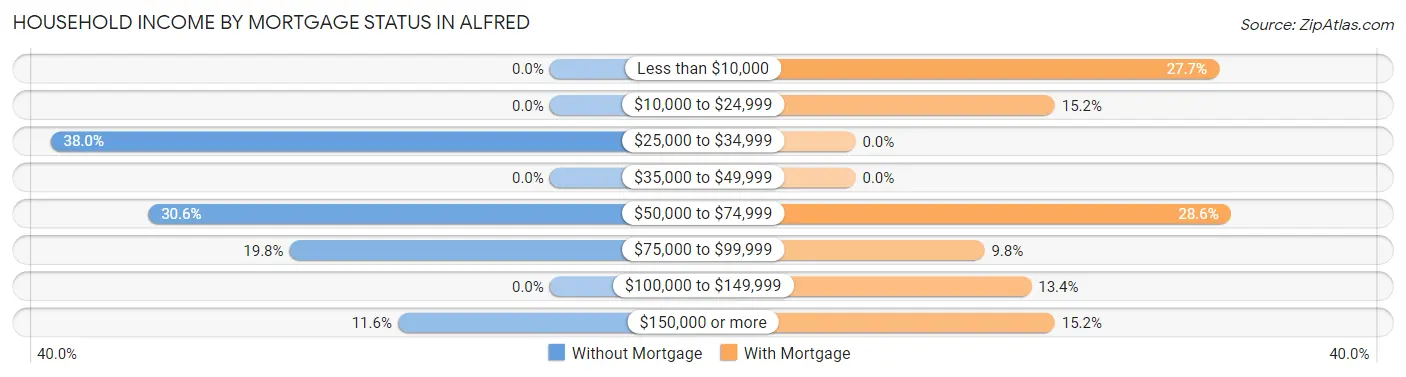
| Household Income | Without Mortgage | With Mortgage |
| Less than $10,000 | 0 (0.0%) | 31 (27.7%) |
| $10,000 to $24,999 | 0 (0.0%) | 17 (15.2%) |
| $25,000 to $34,999 | 46 (38.0%) | 0 (0.0%) |
| $35,000 to $49,999 | 0 (0.0%) | 0 (0.0%) |
| $50,000 to $74,999 | 37 (30.6%) | 32 (28.6%) |
| $75,000 to $99,999 | 24 (19.8%) | 11 (9.8%) |
| $100,000 to $149,999 | 0 (0.0%) | 15 (13.4%) |
| $150,000 or more | 14 (11.6%) | 17 (15.2%) |
| Total | 121 (100.0%) | 112 (100.0%) |
Property Value to Household Income Ratio in Alfred
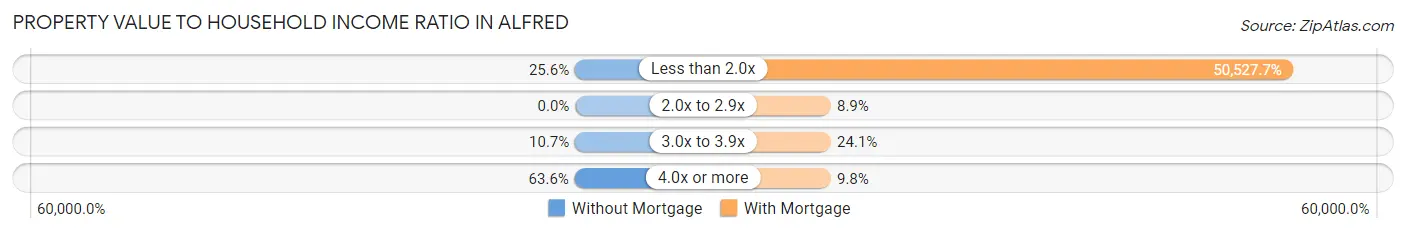
| Value-to-Income Ratio | Without Mortgage | With Mortgage |
| Less than 2.0x | 31 (25.6%) | 56,591 (50,527.7%) |
| 2.0x to 2.9x | 0 (0.0%) | 10 (8.9%) |
| 3.0x to 3.9x | 13 (10.7%) | 27 (24.1%) |
| 4.0x or more | 77 (63.6%) | 11 (9.8%) |
| Total | 121 (100.0%) | 112 (100.0%) |
Real Estate Taxes by Mortgage Status in Alfred
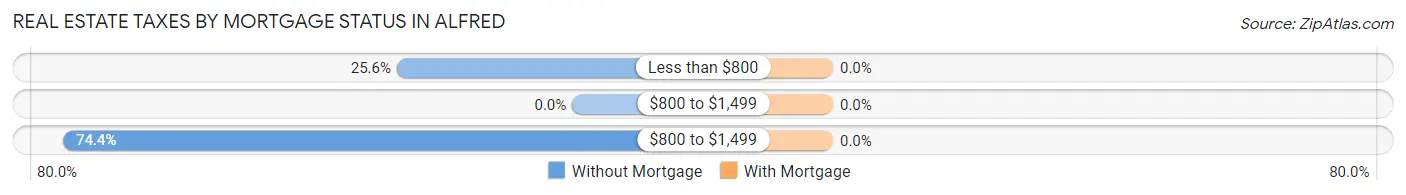
| Property Taxes | Without Mortgage | With Mortgage |
| Less than $800 | 31 (25.6%) | 0 (0.0%) |
| $800 to $1,499 | 0 (0.0%) | 0 (0.0%) |
| $800 to $1,499 | 90 (74.4%) | 0 (0.0%) |
| Total | 121 (100.0%) | 112 (100.0%) |
Health & Disability in Alfred
Health Insurance Coverage by Age in Alfred
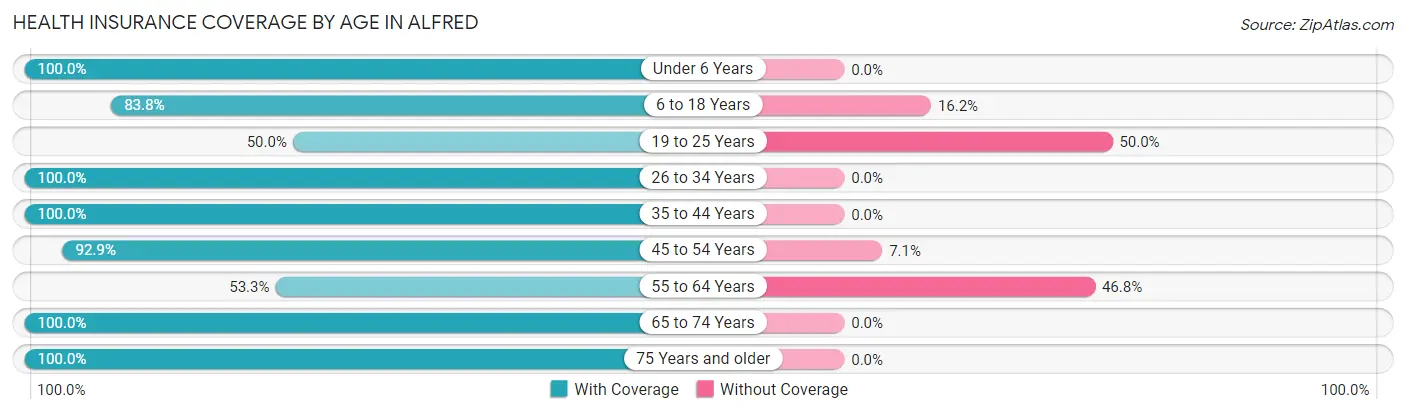
| Age Bracket | With Coverage | Without Coverage |
| Under 6 Years | 75 (100.0%) | 0 (0.0%) |
| 6 to 18 Years | 83 (83.8%) | 16 (16.2%) |
| 19 to 25 Years | 35 (50.0%) | 35 (50.0%) |
| 26 to 34 Years | 76 (100.0%) | 0 (0.0%) |
| 35 to 44 Years | 109 (100.0%) | 0 (0.0%) |
| 45 to 54 Years | 92 (92.9%) | 7 (7.1%) |
| 55 to 64 Years | 82 (53.2%) | 72 (46.8%) |
| 65 to 74 Years | 73 (100.0%) | 0 (0.0%) |
| 75 Years and older | 95 (100.0%) | 0 (0.0%) |
| Total | 720 (84.7%) | 130 (15.3%) |
Health Insurance Coverage by Citizenship Status in Alfred
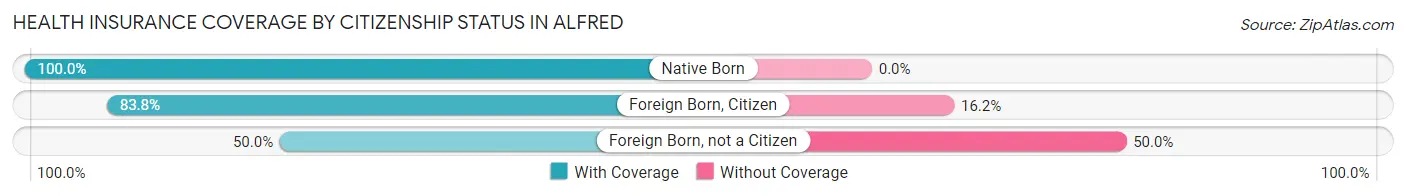
| Citizenship Status | With Coverage | Without Coverage |
| Native Born | 75 (100.0%) | 0 (0.0%) |
| Foreign Born, Citizen | 83 (83.8%) | 16 (16.2%) |
| Foreign Born, not a Citizen | 35 (50.0%) | 35 (50.0%) |
Health Insurance Coverage by Household Income in Alfred
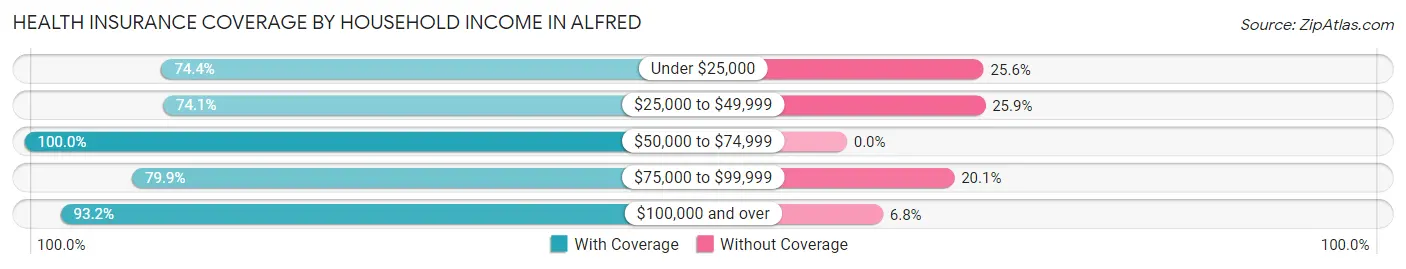
| Household Income | With Coverage | Without Coverage |
| Under $25,000 | 87 (74.4%) | 30 (25.6%) |
| $25,000 to $49,999 | 157 (74.1%) | 55 (25.9%) |
| $50,000 to $74,999 | 160 (100.0%) | 0 (0.0%) |
| $75,000 to $99,999 | 123 (79.9%) | 31 (20.1%) |
| $100,000 and over | 193 (93.2%) | 14 (6.8%) |
Public vs Private Health Insurance Coverage by Age in Alfred
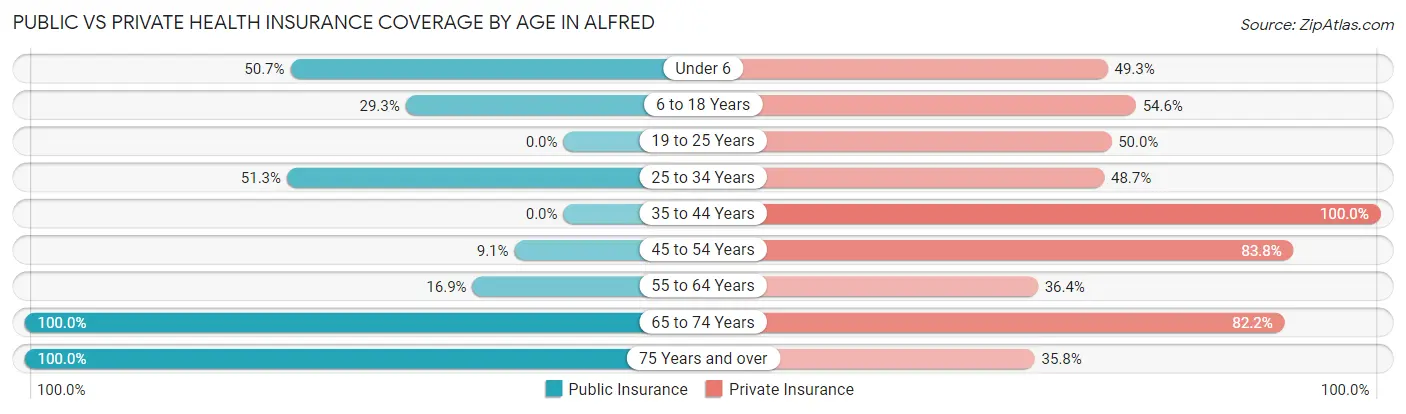
| Age Bracket | Public Insurance | Private Insurance |
| Under 6 | 38 (50.7%) | 37 (49.3%) |
| 6 to 18 Years | 29 (29.3%) | 54 (54.5%) |
| 19 to 25 Years | 0 (0.0%) | 35 (50.0%) |
| 25 to 34 Years | 39 (51.3%) | 37 (48.7%) |
| 35 to 44 Years | 0 (0.0%) | 109 (100.0%) |
| 45 to 54 Years | 9 (9.1%) | 83 (83.8%) |
| 55 to 64 Years | 26 (16.9%) | 56 (36.4%) |
| 65 to 74 Years | 73 (100.0%) | 60 (82.2%) |
| 75 Years and over | 95 (100.0%) | 34 (35.8%) |
| Total | 309 (36.3%) | 505 (59.4%) |
Disability Status by Sex by Age in Alfred
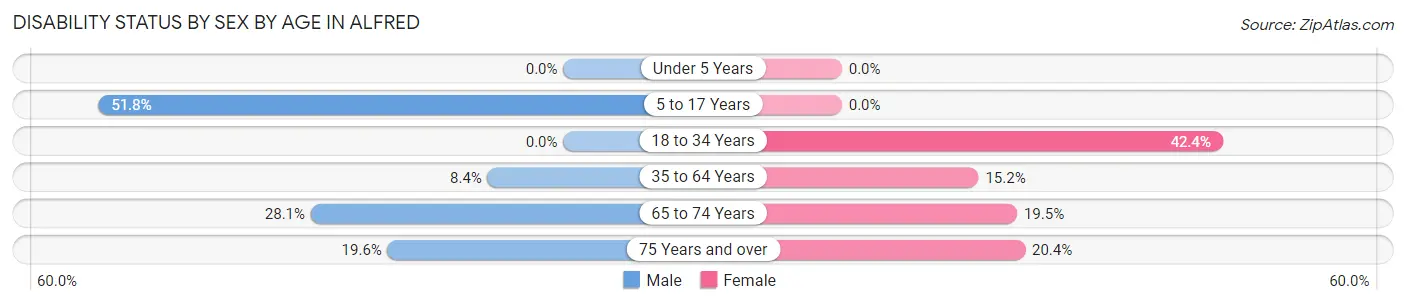
| Age Bracket | Male | Female |
| Under 5 Years | 0 (0.0%) | 0 (0.0%) |
| 5 to 17 Years | 29 (51.8%) | 0 (0.0%) |
| 18 to 34 Years | 0 (0.0%) | 28 (42.4%) |
| 35 to 64 Years | 15 (8.4%) | 28 (15.2%) |
| 65 to 74 Years | 9 (28.1%) | 8 (19.5%) |
| 75 Years and over | 9 (19.6%) | 10 (20.4%) |
Disability Class by Sex by Age in Alfred
Disability Class: Hearing Difficulty
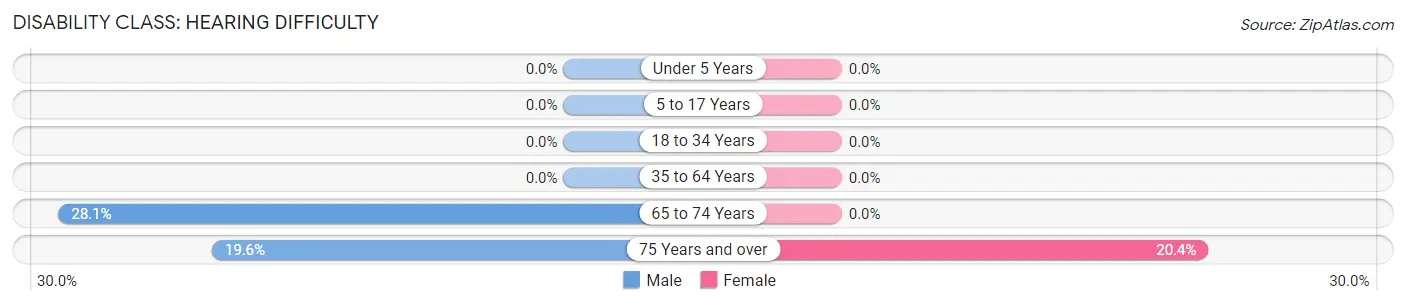
| Age Bracket | Male | Female |
| Under 5 Years | 0 (0.0%) | 0 (0.0%) |
| 5 to 17 Years | 0 (0.0%) | 0 (0.0%) |
| 18 to 34 Years | 0 (0.0%) | 0 (0.0%) |
| 35 to 64 Years | 0 (0.0%) | 0 (0.0%) |
| 65 to 74 Years | 9 (28.1%) | 0 (0.0%) |
| 75 Years and over | 9 (19.6%) | 10 (20.4%) |
Disability Class: Vision Difficulty
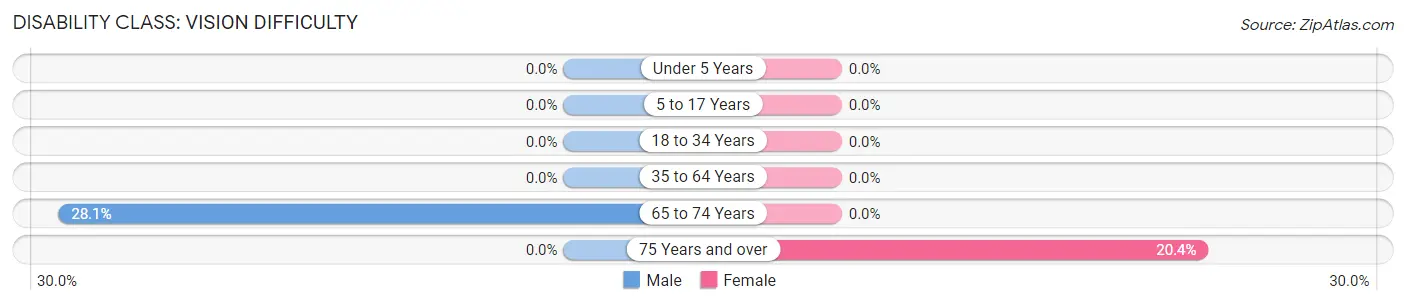
| Age Bracket | Male | Female |
| Under 5 Years | 0 (0.0%) | 0 (0.0%) |
| 5 to 17 Years | 0 (0.0%) | 0 (0.0%) |
| 18 to 34 Years | 0 (0.0%) | 0 (0.0%) |
| 35 to 64 Years | 0 (0.0%) | 0 (0.0%) |
| 65 to 74 Years | 9 (28.1%) | 0 (0.0%) |
| 75 Years and over | 0 (0.0%) | 10 (20.4%) |
Disability Class: Cognitive Difficulty
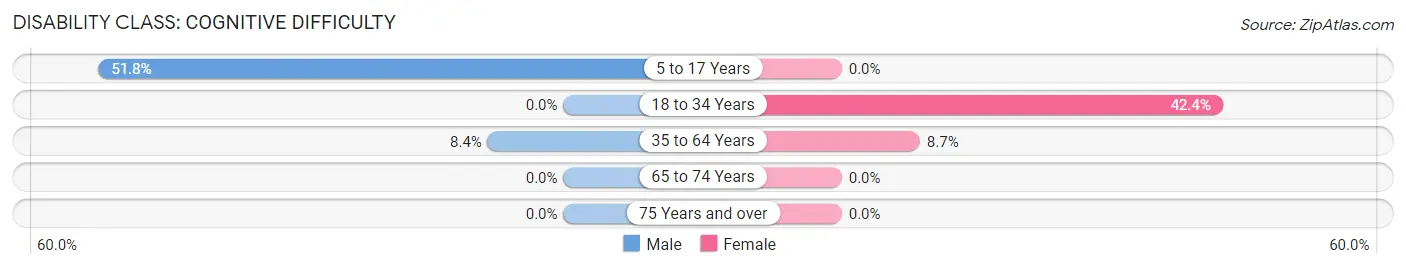
| Age Bracket | Male | Female |
| 5 to 17 Years | 29 (51.8%) | 0 (0.0%) |
| 18 to 34 Years | 0 (0.0%) | 28 (42.4%) |
| 35 to 64 Years | 15 (8.4%) | 16 (8.7%) |
| 65 to 74 Years | 0 (0.0%) | 0 (0.0%) |
| 75 Years and over | 0 (0.0%) | 0 (0.0%) |
Disability Class: Ambulatory Difficulty
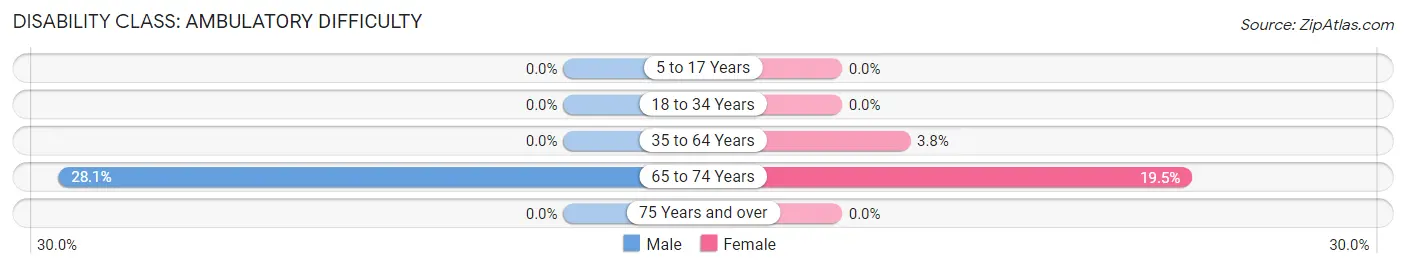
| Age Bracket | Male | Female |
| 5 to 17 Years | 0 (0.0%) | 0 (0.0%) |
| 18 to 34 Years | 0 (0.0%) | 0 (0.0%) |
| 35 to 64 Years | 0 (0.0%) | 7 (3.8%) |
| 65 to 74 Years | 9 (28.1%) | 8 (19.5%) |
| 75 Years and over | 0 (0.0%) | 0 (0.0%) |
Disability Class: Self-Care Difficulty
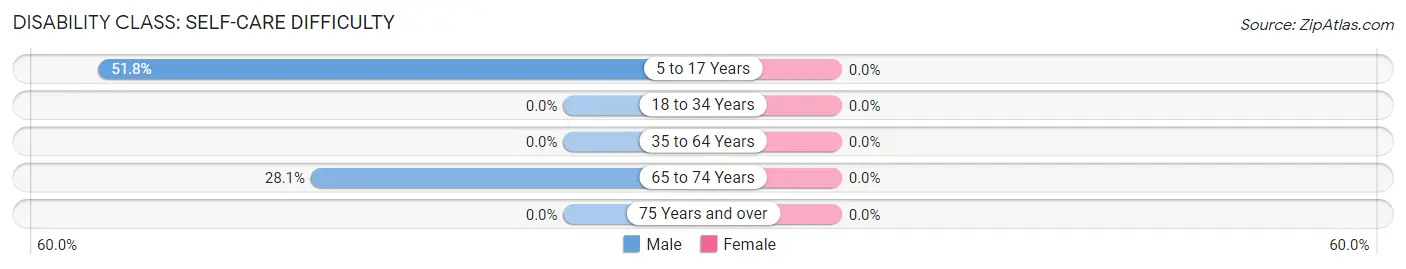
| Age Bracket | Male | Female |
| 5 to 17 Years | 29 (51.8%) | 0 (0.0%) |
| 18 to 34 Years | 0 (0.0%) | 0 (0.0%) |
| 35 to 64 Years | 0 (0.0%) | 0 (0.0%) |
| 65 to 74 Years | 9 (28.1%) | 0 (0.0%) |
| 75 Years and over | 0 (0.0%) | 0 (0.0%) |
Technology Access in Alfred
Computing Device Access in Alfred
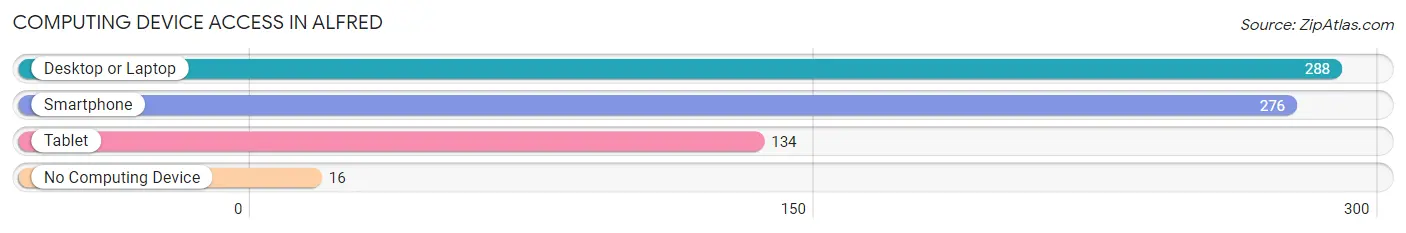
| Device Type | # Households | % Households |
| Desktop or Laptop | 288 | 82.3% |
| Smartphone | 276 | 78.9% |
| Tablet | 134 | 38.3% |
| No Computing Device | 16 | 4.6% |
| Total | 350 | 100.0% |
Internet Access in Alfred
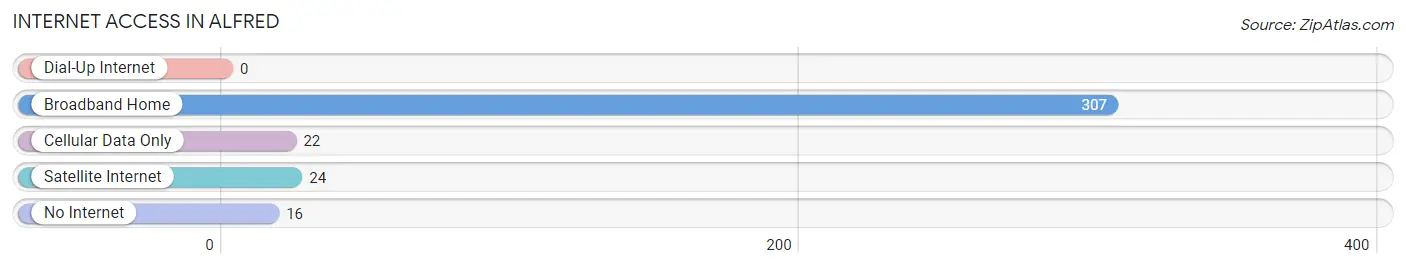
| Internet Type | # Households | % Households |
| Dial-Up Internet | 0 | 0.0% |
| Broadband Home | 307 | 87.7% |
| Cellular Data Only | 22 | 6.3% |
| Satellite Internet | 24 | 6.9% |
| No Internet | 16 | 4.6% |
| Total | 350 | 100.0% |
Alfred Summary
Alfred, Maine is a small town located in York County, in the southern part of the state. It is situated on the banks of the Mousam River, and is bordered by the towns of Sanford, Shapleigh, Waterboro, and Lyman. The town has a population of approximately 3,000 people, and is home to a variety of businesses, including a number of small farms, a sawmill, and a variety of other small businesses.
History
Alfred was first settled in 1763 by a group of settlers from Kittery, Maine. The town was named after King Alfred the Great, who was the ruler of England from 871 to 899. The town was incorporated in 1794, and was originally part of Sanford. In 1820, Alfred was separated from Sanford and became its own town.
Geography
Alfred is located in the southern part of York County, and is bordered by the towns of Sanford, Shapleigh, Waterboro, and Lyman. The town is situated on the banks of the Mousam River, and is home to a variety of natural features, including the Mousam River, the Alfred Marsh, and the Alfred Bog. The town is also home to a variety of wildlife, including deer, moose, and a variety of birds.
Economy
Alfred is home to a variety of businesses, including a number of small farms, a sawmill, and a variety of other small businesses. The town is also home to a number of restaurants, stores, and other businesses. The town is also home to a number of recreational activities, including fishing, hunting, and camping.
Demographics
As of the 2010 census, Alfred had a population of 3,000 people. The town is predominantly white, with a small percentage of African Americans, Native Americans, and other races. The median household income in Alfred is $45,000, and the median home value is $150,000. The town has a high rate of homeownership, with over 80% of the population owning their own homes.
Alfred is a small town with a rich history and a variety of businesses and recreational activities. The town is home to a variety of people, and is a great place to live and work. The town is also home to a variety of natural features, and is a great place to explore and enjoy the outdoors.
Common Questions
What is Per Capita Income in Alfred?
Per Capita income in Alfred is $26,348.
What is the Median Family Income in Alfred?
Median Family Income in Alfred is $41,250.
What is the Median Household income in Alfred?
Median Household Income in Alfred is $40,326.
What is Inequality or Gini Index in Alfred?
Inequality or Gini Index in Alfred is 0.48.
What is the Total Population of Alfred?
Total Population of Alfred is 850.
What is the Total Male Population of Alfred?
Total Male Population of Alfred is 429.
What is the Total Female Population of Alfred?
Total Female Population of Alfred is 421.
What is the Ratio of Males per 100 Females in Alfred?
There are 101.90 Males per 100 Females in Alfred.
What is the Ratio of Females per 100 Males in Alfred?
There are 98.14 Females per 100 Males in Alfred.
What is the Median Population Age in Alfred?
Median Population Age in Alfred is 44.9 Years.
What is the Average Family Size in Alfred
Average Family Size in Alfred is 2.7 People.
What is the Average Household Size in Alfred
Average Household Size in Alfred is 2.4 People.
How Large is the Labor Force in Alfred?
There are 437 People in the Labor Forcein in Alfred.
What is the Percentage of People in the Labor Force in Alfred?
61.6% of People are in the Labor Force in Alfred.
What is the Unemployment Rate in Alfred?
Unemployment Rate in Alfred is 8.5%.