Eagle Lake, ME Map & Demographics
Eagle Lake Map
Eagle Lake Overview
$27,295
PER CAPITA INCOME
$59,750
AVG FAMILY INCOME
$37,813
AVG HOUSEHOLD INCOME
0.45
INEQUALITY / GINI INDEX
383
TOTAL POPULATION
182
MALE POPULATION
201
FEMALE POPULATION
90.55
MALES / 100 FEMALES
110.44
FEMALES / 100 MALES
67.4
MEDIAN AGE
2.7
AVG FAMILY SIZE
2.2
AVG HOUSEHOLD SIZE
72
LABOR FORCE [ PEOPLE ]
19.8%
PERCENT IN LABOR FORCE
12.5%
UNEMPLOYMENT RATE
Eagle Lake Zip Codes
Eagle Lake Area Codes
Income in Eagle Lake
Income Overview in Eagle Lake
Per Capita Income in Eagle Lake is $27,295, while median incomes of families and households are $59,750 and $37,813 respectively.
| Characteristic | Number | Measure |
| Per Capita Income | 383 | $27,295 |
| Median Family Income | 85 | $59,750 |
| Mean Family Income | 85 | $73,545 |
| Median Household Income | 135 | $37,813 |
| Mean Household Income | 135 | $59,670 |
| Income Deficit | 85 | $0 |
| Wage / Income Gap (%) | 383 | 0.00% |
| Wage / Income Gap ($) | 383 | 100.00¢ per $1 |
| Gini / Inequality Index | 383 | 0.45 |
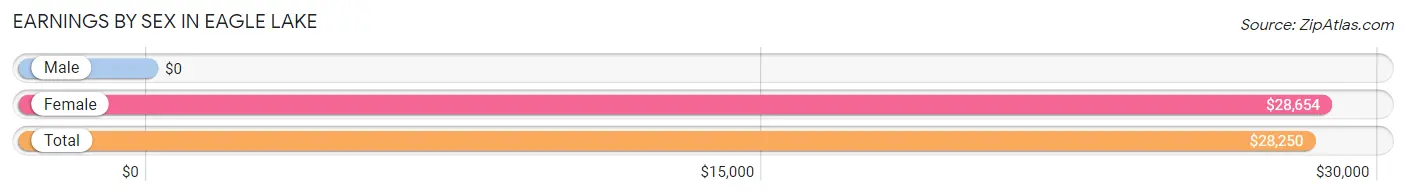
Earnings by Sex in Eagle Lake
| Sex | Number | Average Earnings |
| Male | 50 (54.3%) | $0 |
| Female | 42 (45.7%) | $28,654 |
| Total | 92 (100.0%) | $28,250 |
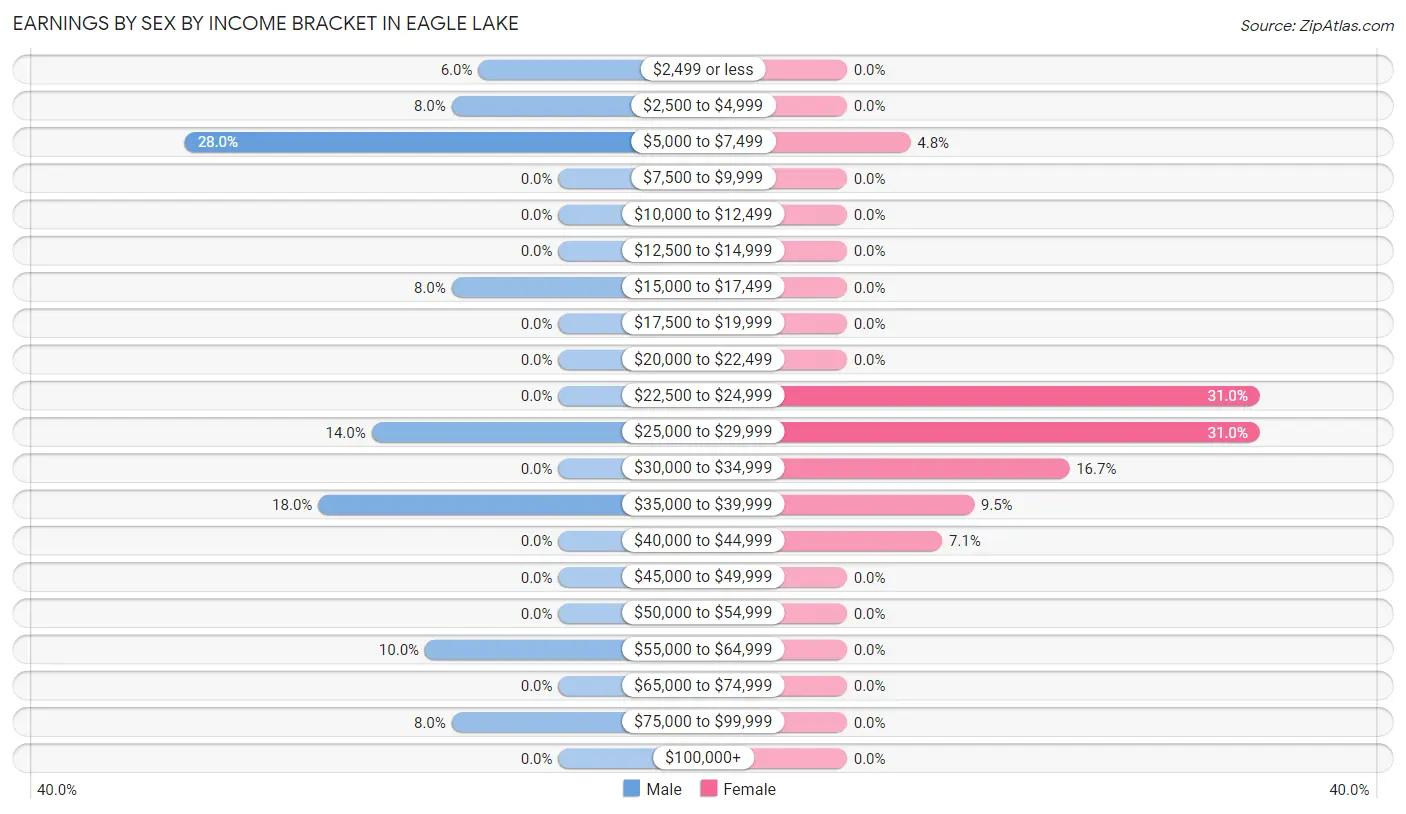
Earnings by Sex by Income Bracket in Eagle Lake
The most common earnings brackets in Eagle Lake are $5,000 to $7,499 for men (14 | 28.0%) and $22,500 to $24,999 for women (13 | 30.9%).
| Income | Male | Female |
| $2,499 or less | 3 (6.0%) | 0 (0.0%) |
| $2,500 to $4,999 | 4 (8.0%) | 0 (0.0%) |
| $5,000 to $7,499 | 14 (28.0%) | 2 (4.8%) |
| $7,500 to $9,999 | 0 (0.0%) | 0 (0.0%) |
| $10,000 to $12,499 | 0 (0.0%) | 0 (0.0%) |
| $12,500 to $14,999 | 0 (0.0%) | 0 (0.0%) |
| $15,000 to $17,499 | 4 (8.0%) | 0 (0.0%) |
| $17,500 to $19,999 | 0 (0.0%) | 0 (0.0%) |
| $20,000 to $22,499 | 0 (0.0%) | 0 (0.0%) |
| $22,500 to $24,999 | 0 (0.0%) | 13 (30.9%) |
| $25,000 to $29,999 | 7 (14.0%) | 13 (30.9%) |
| $30,000 to $34,999 | 0 (0.0%) | 7 (16.7%) |
| $35,000 to $39,999 | 9 (18.0%) | 4 (9.5%) |
| $40,000 to $44,999 | 0 (0.0%) | 3 (7.1%) |
| $45,000 to $49,999 | 0 (0.0%) | 0 (0.0%) |
| $50,000 to $54,999 | 0 (0.0%) | 0 (0.0%) |
| $55,000 to $64,999 | 5 (10.0%) | 0 (0.0%) |
| $65,000 to $74,999 | 0 (0.0%) | 0 (0.0%) |
| $75,000 to $99,999 | 4 (8.0%) | 0 (0.0%) |
| $100,000+ | 0 (0.0%) | 0 (0.0%) |
| Total | 50 (100.0%) | 42 (100.0%) |
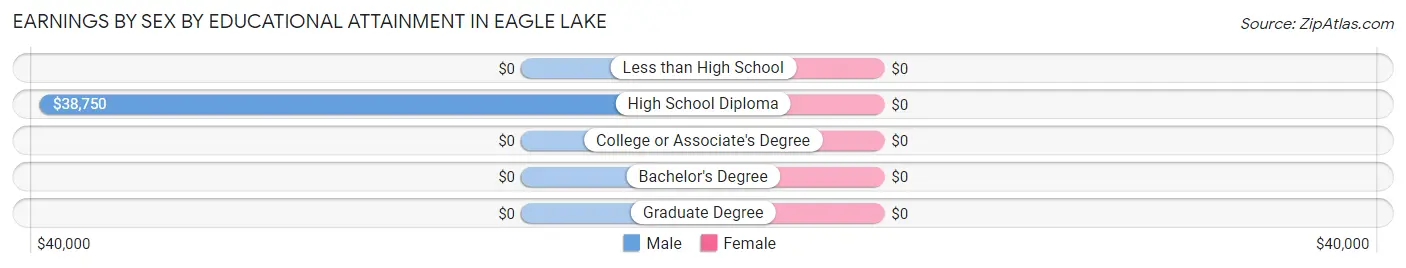
Earnings by Sex by Educational Attainment in Eagle Lake
| Educational Attainment | Male Income | Female Income |
| Less than High School | - | - |
| High School Diploma | $38,750 | $0 |
| College or Associate's Degree | - | - |
| Bachelor's Degree | - | - |
| Graduate Degree | - | - |
| Total | $28,214 | $28,269 |
Family Income in Eagle Lake
Family Income Brackets in Eagle Lake
According to the Eagle Lake family income data, there are 22 families falling into the $50,000 to $74,999 income range, which is the most common income bracket and makes up 25.9% of all families.
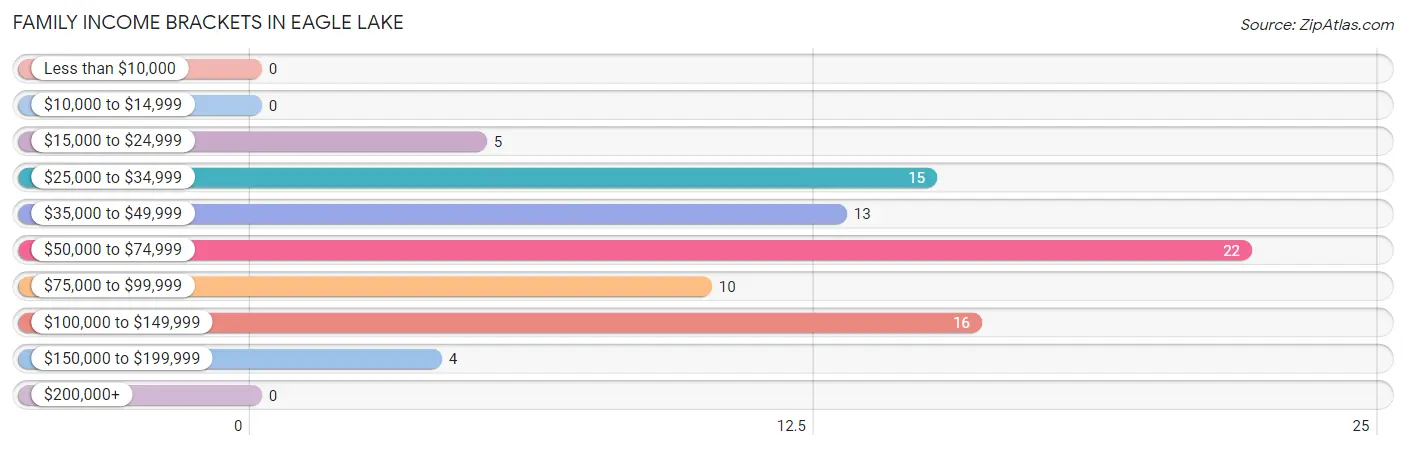
| Income Bracket | # Families | % Families |
| Less than $10,000 | 0 | 0.0% |
| $10,000 to $14,999 | 0 | 0.0% |
| $15,000 to $24,999 | 5 | 5.9% |
| $25,000 to $34,999 | 15 | 17.6% |
| $35,000 to $49,999 | 13 | 15.3% |
| $50,000 to $74,999 | 22 | 25.9% |
| $75,000 to $99,999 | 10 | 11.8% |
| $100,000 to $149,999 | 16 | 18.8% |
| $150,000 to $199,999 | 4 | 4.7% |
| $200,000+ | 0 | 0.0% |
Family Income by Famaliy Size in Eagle Lake
3-person families (17 | 20.0%) account for the highest median family income in Eagle Lake with $117,875 per family, while 3-person families (17 | 20.0%) have the highest median income of $39,292 per family member.
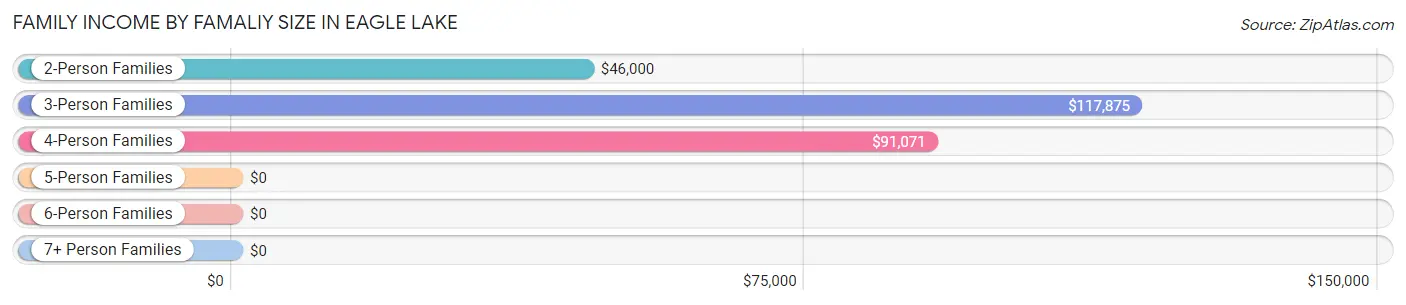
| Income Bracket | # Families | Median Income |
| 2-Person Families | 52 (61.2%) | $46,000 |
| 3-Person Families | 17 (20.0%) | $117,875 |
| 4-Person Families | 16 (18.8%) | $91,071 |
| 5-Person Families | 0 (0.0%) | $0 |
| 6-Person Families | 0 (0.0%) | $0 |
| 7+ Person Families | 0 (0.0%) | $0 |
| Total | 85 (100.0%) | $59,750 |
Family Income by Number of Earners in Eagle Lake
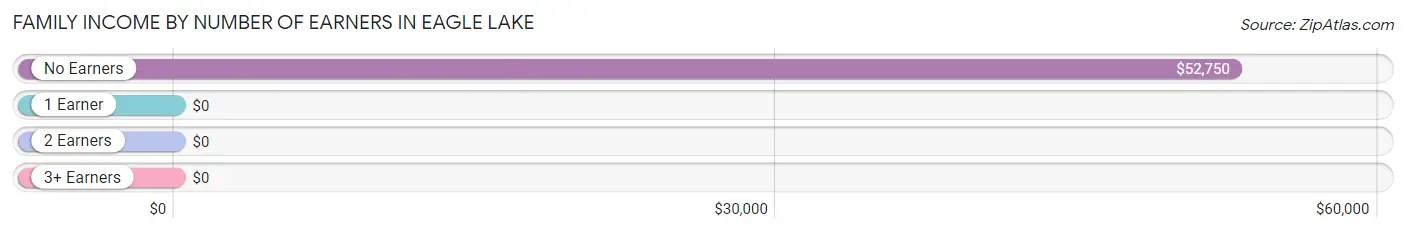
| Number of Earners | # Families | Median Income |
| No Earners | 23 (27.1%) | $52,750 |
| 1 Earner | 48 (56.5%) | $0 |
| 2 Earners | 10 (11.8%) | $0 |
| 3+ Earners | 4 (4.7%) | $0 |
| Total | 85 (100.0%) | $59,750 |
Household Income in Eagle Lake
Household Income Brackets in Eagle Lake
With 29 households falling in the category, the $25,000 to $34,999 income range is the most frequent in Eagle Lake, accounting for 21.5% of all households. In contrast, only 3 households (2.2%) fall into the $200,000+ income bracket, making it the least populous group.
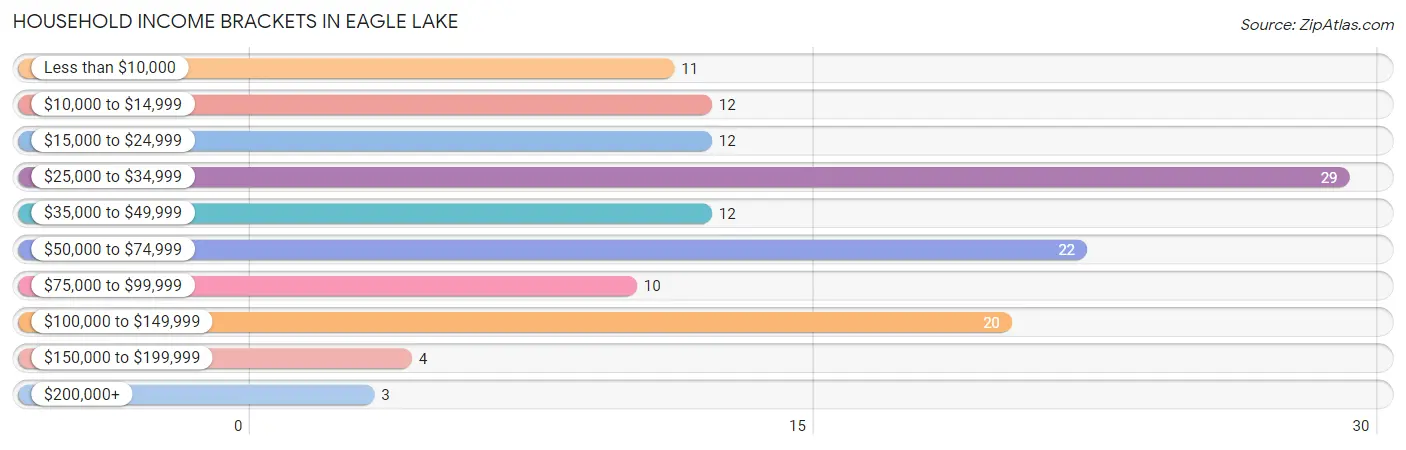
| Income Bracket | # Households | % Households |
| Less than $10,000 | 11 | 8.1% |
| $10,000 to $14,999 | 12 | 8.9% |
| $15,000 to $24,999 | 12 | 8.9% |
| $25,000 to $34,999 | 29 | 21.5% |
| $35,000 to $49,999 | 12 | 8.9% |
| $50,000 to $74,999 | 22 | 16.3% |
| $75,000 to $99,999 | 10 | 7.4% |
| $100,000 to $149,999 | 20 | 14.8% |
| $150,000 to $199,999 | 4 | 3.0% |
| $200,000+ | 3 | 2.2% |
Household Income by Householder Age in Eagle Lake
The median household income in Eagle Lake is $37,813, with the highest median household income of $91,071 found in the 45 to 64 years age bracket for the primary householder. A total of 42 households (31.1%) fall into this category. Meanwhile, the 15 to 24 years age bracket for the primary householder has the lowest median household income of $0, with 4 households (3.0%) in this group.
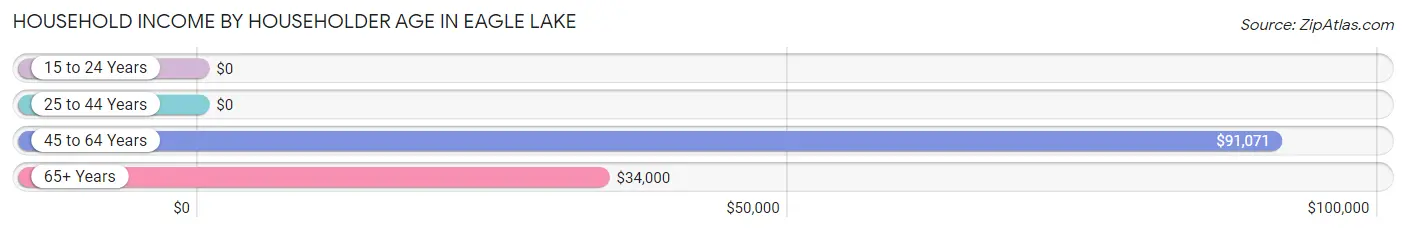
| Income Bracket | # Households | Median Income |
| 15 to 24 Years | 4 (3.0%) | $0 |
| 25 to 44 Years | 17 (12.6%) | $0 |
| 45 to 64 Years | 42 (31.1%) | $91,071 |
| 65+ Years | 72 (53.3%) | $34,000 |
| Total | 135 (100.0%) | $37,813 |
Poverty in Eagle Lake
Income Below Poverty by Sex and Age in Eagle Lake
With 5.3% poverty level for males and 13.0% for females among the residents of Eagle Lake, 45 to 54 year old males and 25 to 34 year old females are the most vulnerable to poverty, with 7 males (63.6%) and 8 females (100.0%) in their respective age groups living below the poverty level.
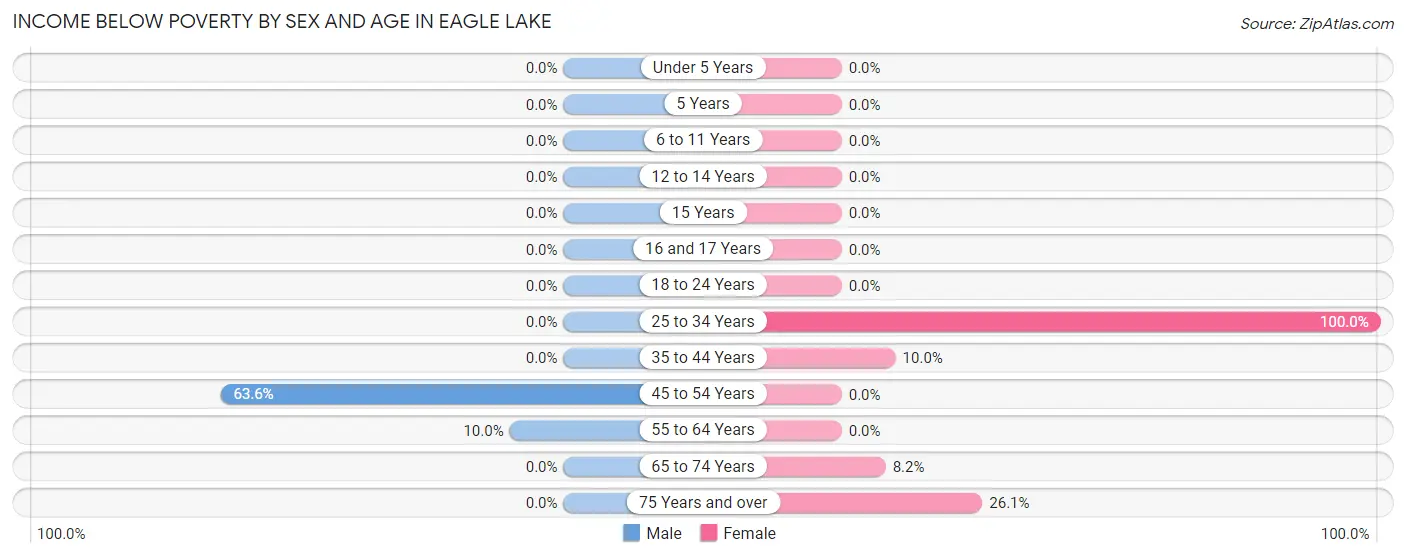
| Age Bracket | Male | Female |
| Under 5 Years | 0 (0.0%) | 0 (0.0%) |
| 5 Years | 0 (0.0%) | 0 (0.0%) |
| 6 to 11 Years | 0 (0.0%) | 0 (0.0%) |
| 12 to 14 Years | 0 (0.0%) | 0 (0.0%) |
| 15 Years | 0 (0.0%) | 0 (0.0%) |
| 16 and 17 Years | 0 (0.0%) | 0 (0.0%) |
| 18 to 24 Years | 0 (0.0%) | 0 (0.0%) |
| 25 to 34 Years | 0 (0.0%) | 8 (100.0%) |
| 35 to 44 Years | 0 (0.0%) | 4 (10.0%) |
| 45 to 54 Years | 7 (63.6%) | 0 (0.0%) |
| 55 to 64 Years | 1 (10.0%) | 0 (0.0%) |
| 65 to 74 Years | 0 (0.0%) | 4 (8.2%) |
| 75 Years and over | 0 (0.0%) | 6 (26.1%) |
| Total | 8 (5.3%) | 22 (13.0%) |
Income Above Poverty by Sex and Age in Eagle Lake
According to the poverty statistics in Eagle Lake, males aged under 5 years and females aged under 5 years are the age groups that are most secure financially, with 100.0% of males and 100.0% of females in these age groups living above the poverty line.
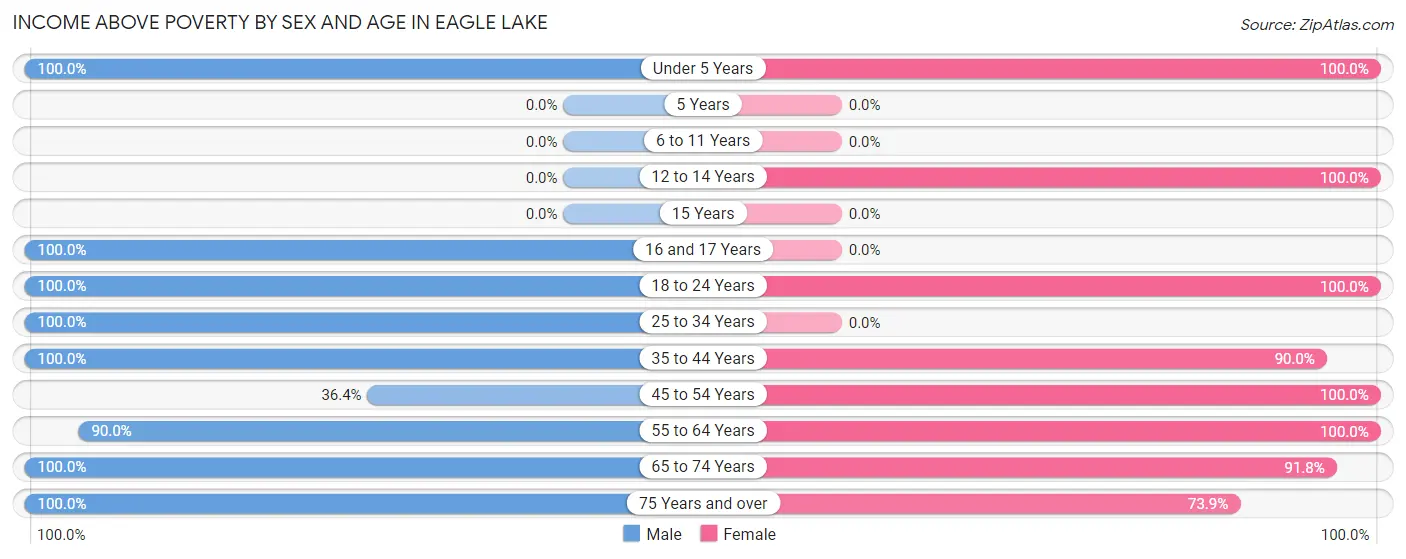
| Age Bracket | Male | Female |
| Under 5 Years | 7 (100.0%) | 6 (100.0%) |
| 5 Years | 0 (0.0%) | 0 (0.0%) |
| 6 to 11 Years | 0 (0.0%) | 0 (0.0%) |
| 12 to 14 Years | 0 (0.0%) | 3 (100.0%) |
| 15 Years | 0 (0.0%) | 0 (0.0%) |
| 16 and 17 Years | 4 (100.0%) | 0 (0.0%) |
| 18 to 24 Years | 7 (100.0%) | 4 (100.0%) |
| 25 to 34 Years | 6 (100.0%) | 0 (0.0%) |
| 35 to 44 Years | 15 (100.0%) | 36 (90.0%) |
| 45 to 54 Years | 4 (36.4%) | 20 (100.0%) |
| 55 to 64 Years | 9 (90.0%) | 16 (100.0%) |
| 65 to 74 Years | 36 (100.0%) | 45 (91.8%) |
| 75 Years and over | 55 (100.0%) | 17 (73.9%) |
| Total | 143 (94.7%) | 147 (87.0%) |
Income Below Poverty Among Married-Couple Families in Eagle Lake
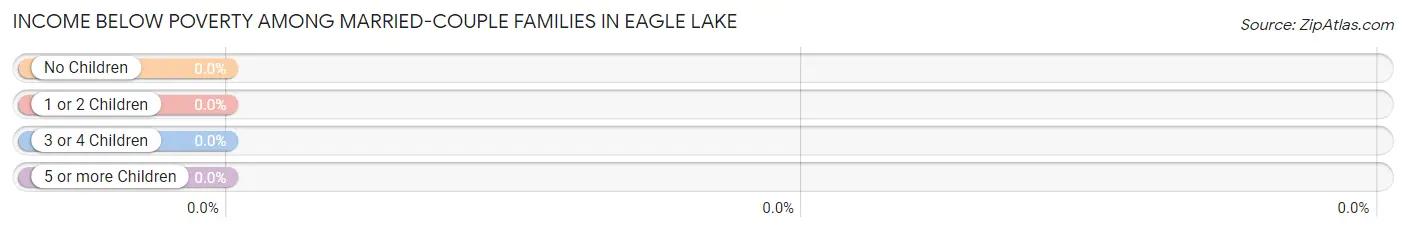
| Children | Above Poverty | Below Poverty |
| No Children | 70 (100.0%) | 0 (0.0%) |
| 1 or 2 Children | 4 (100.0%) | 0 (0.0%) |
| 3 or 4 Children | 0 (0.0%) | 0 (0.0%) |
| 5 or more Children | 0 (0.0%) | 0 (0.0%) |
| Total | 74 (100.0%) | 0 (0.0%) |
Income Below Poverty Among Single-Parent Households in Eagle Lake
| Children | Single Father | Single Mother |
| No Children | 0 (0.0%) | 0 (0.0%) |
| 1 or 2 Children | 0 (0.0%) | 0 (0.0%) |
| 3 or 4 Children | 0 (0.0%) | 0 (0.0%) |
| 5 or more Children | 0 (0.0%) | 0 (0.0%) |
| Total | 0 (0.0%) | 0 (0.0%) |
Income Below Poverty Among Married-Couple vs Single-Parent Households in Eagle Lake
| Children | Married-Couple Families | Single-Parent Households |
| No Children | 0 (0.0%) | 0 (0.0%) |
| 1 or 2 Children | 0 (0.0%) | 0 (0.0%) |
| 3 or 4 Children | 0 (0.0%) | 0 (0.0%) |
| 5 or more Children | 0 (0.0%) | 0 (0.0%) |
| Total | 0 (0.0%) | 0 (0.0%) |
Race in Eagle Lake
The most populous races in Eagle Lake are White / Caucasian (375 | 97.9%), Black / African American (4 | 1.0%), and Two or more Races (4 | 1.0%).
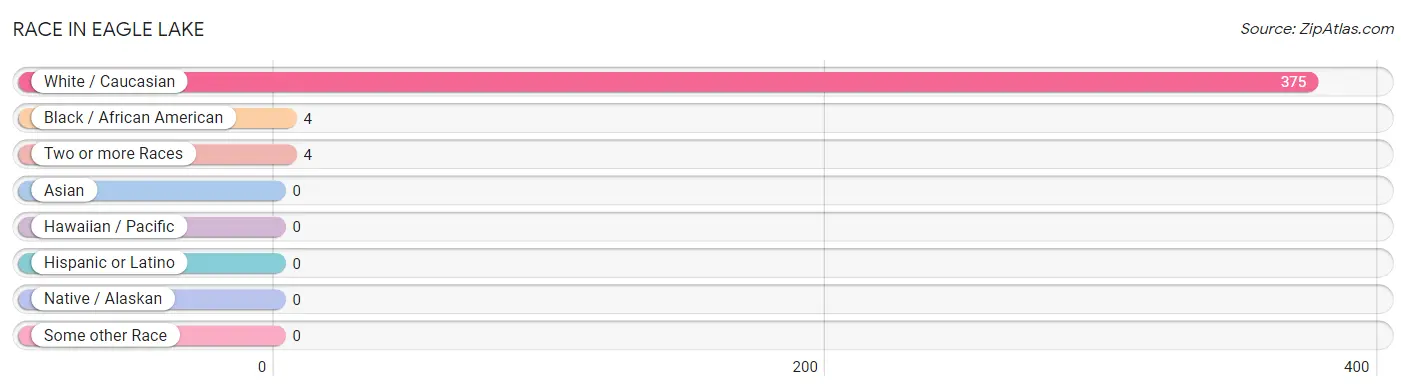
| Race | # Population | % Population |
| Asian | 0 | 0.0% |
| Black / African American | 4 | 1.0% |
| Hawaiian / Pacific | 0 | 0.0% |
| Hispanic or Latino | 0 | 0.0% |
| Native / Alaskan | 0 | 0.0% |
| White / Caucasian | 375 | 97.9% |
| Two or more Races | 4 | 1.0% |
| Some other Race | 0 | 0.0% |
| Total | 383 | 100.0% |
Ancestry in Eagle Lake
The most populous ancestries reported in Eagle Lake are French (152 | 39.7%), English (66 | 17.2%), French Canadian (38 | 9.9%), Irish (23 | 6.0%), and American (15 | 3.9%), together accounting for 76.8% of all Eagle Lake residents.
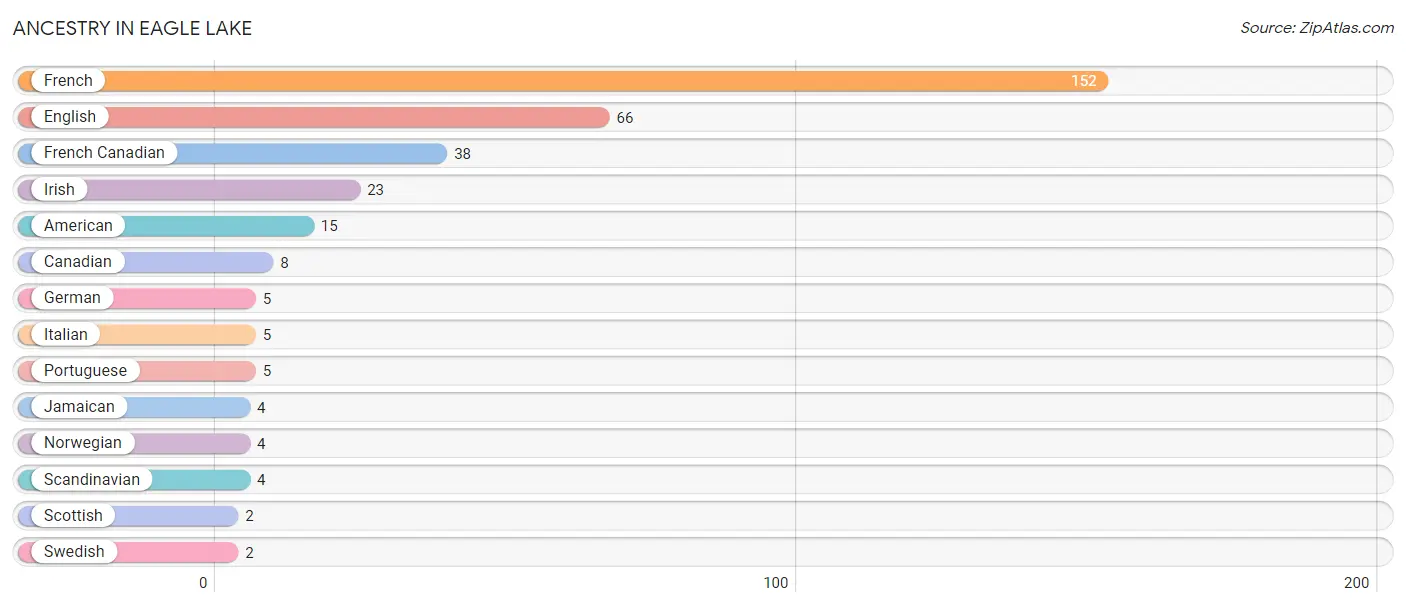
| Ancestry | # Population | % Population |
| American | 15 | 3.9% |
| Canadian | 8 | 2.1% |
| English | 66 | 17.2% |
| French | 152 | 39.7% |
| French Canadian | 38 | 9.9% |
| German | 5 | 1.3% |
| Irish | 23 | 6.0% |
| Italian | 5 | 1.3% |
| Jamaican | 4 | 1.0% |
| Norwegian | 4 | 1.0% |
| Portuguese | 5 | 1.3% |
| Scandinavian | 4 | 1.0% |
| Scottish | 2 | 0.5% |
| Swedish | 2 | 0.5% | View All 14 Rows |
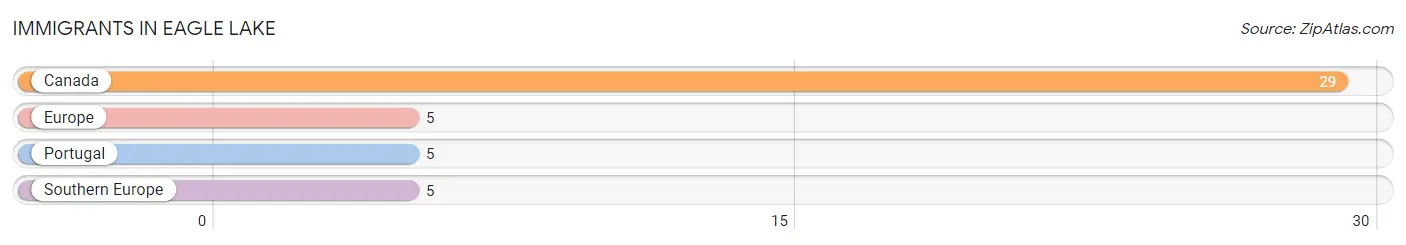
Immigrants in Eagle Lake
The most numerous immigrant groups reported in Eagle Lake came from Canada (29 | 7.6%), Europe (5 | 1.3%), Portugal (5 | 1.3%), and Southern Europe (5 | 1.3%), together accounting for 11.5% of all Eagle Lake residents.
| Immigration Origin | # Population | % Population |
| Canada | 29 | 7.6% |
| Europe | 5 | 1.3% |
| Portugal | 5 | 1.3% |
| Southern Europe | 5 | 1.3% | View All 4 Rows |
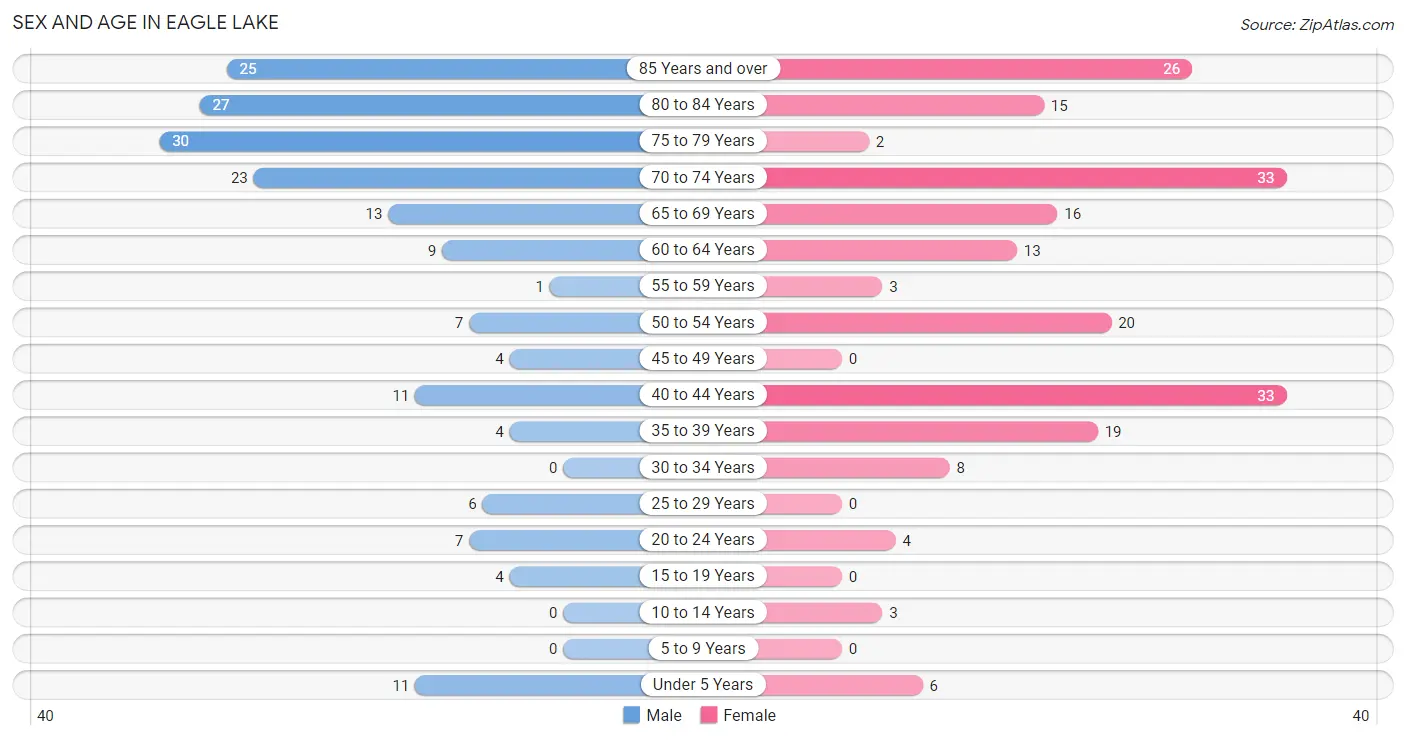
Sex and Age in Eagle Lake
Sex and Age in Eagle Lake
The most populous age groups in Eagle Lake are 75 to 79 Years (30 | 16.5%) for men and 40 to 44 Years (33 | 16.4%) for women.
| Age Bracket | Male | Female |
| Under 5 Years | 11 (6.0%) | 6 (3.0%) |
| 5 to 9 Years | 0 (0.0%) | 0 (0.0%) |
| 10 to 14 Years | 0 (0.0%) | 3 (1.5%) |
| 15 to 19 Years | 4 (2.2%) | 0 (0.0%) |
| 20 to 24 Years | 7 (3.8%) | 4 (2.0%) |
| 25 to 29 Years | 6 (3.3%) | 0 (0.0%) |
| 30 to 34 Years | 0 (0.0%) | 8 (4.0%) |
| 35 to 39 Years | 4 (2.2%) | 19 (9.5%) |
| 40 to 44 Years | 11 (6.0%) | 33 (16.4%) |
| 45 to 49 Years | 4 (2.2%) | 0 (0.0%) |
| 50 to 54 Years | 7 (3.8%) | 20 (10.0%) |
| 55 to 59 Years | 1 (0.5%) | 3 (1.5%) |
| 60 to 64 Years | 9 (5.0%) | 13 (6.5%) |
| 65 to 69 Years | 13 (7.1%) | 16 (8.0%) |
| 70 to 74 Years | 23 (12.6%) | 33 (16.4%) |
| 75 to 79 Years | 30 (16.5%) | 2 (1.0%) |
| 80 to 84 Years | 27 (14.8%) | 15 (7.5%) |
| 85 Years and over | 25 (13.7%) | 26 (12.9%) |
| Total | 182 (100.0%) | 201 (100.0%) |
Families and Households in Eagle Lake
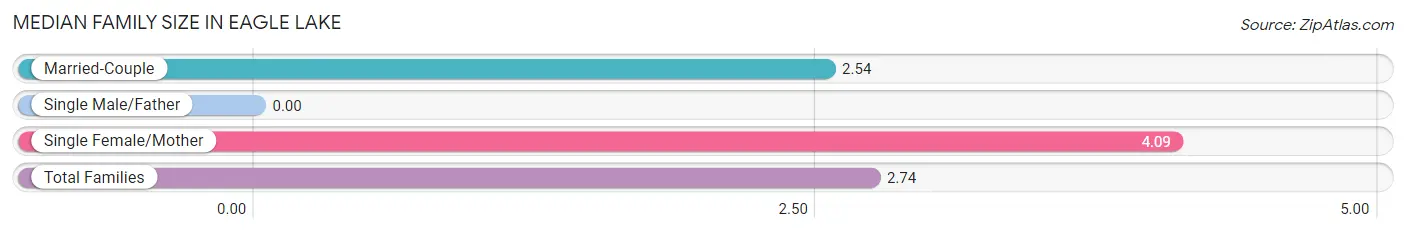
Median Family Size in Eagle Lake
| Family Type | # Families | Family Size |
| Married-Couple | 74 (87.1%) | 2.54 |
| Single Male/Father | 0 (0.0%) | - |
| Single Female/Mother | 11 (12.9%) | 4.09 |
| Total Families | 85 (100.0%) | 2.74 |
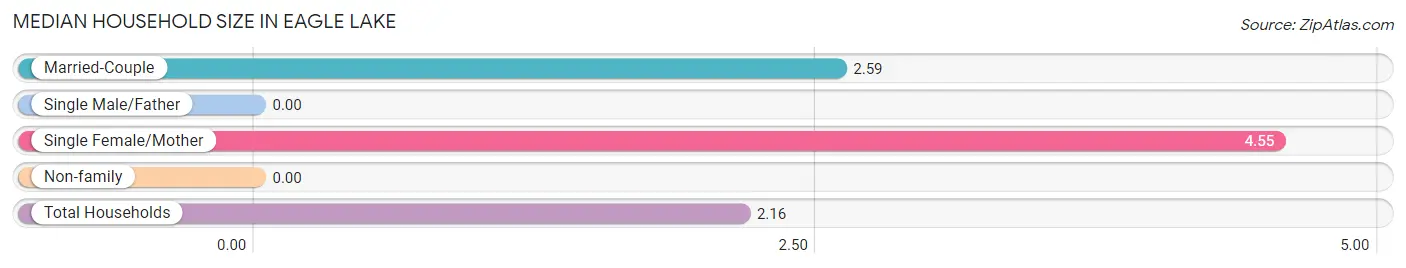
Median Household Size in Eagle Lake
| Household Type | # Households | Household Size |
| Married-Couple | 74 (54.8%) | 2.59 |
| Single Male/Father | 0 (0.0%) | - |
| Single Female/Mother | 11 (8.2%) | 4.55 |
| Non-family | 50 (37.0%) | - |
| Total Households | 135 (100.0%) | 2.16 |
Household Size by Marriage Status in Eagle Lake
Out of a total of 135 households in Eagle Lake, 85 (63.0%) are family households, while 50 (37.0%) are nonfamily households. The most numerous type of family households are 2-person households, comprising 52, and the most common type of nonfamily households are 1-person households, comprising 50.
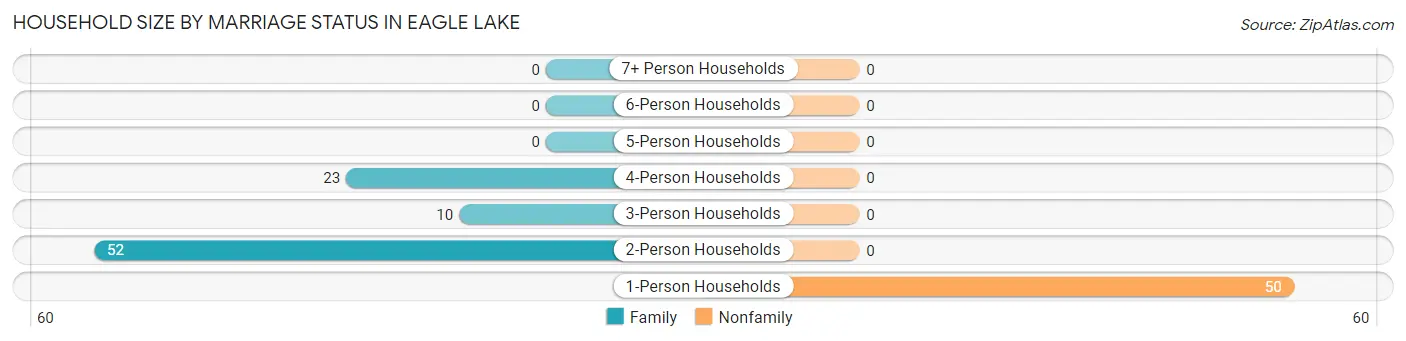
| Household Size | Family Households | Nonfamily Households |
| 1-Person Households | - | 50 (37.0%) |
| 2-Person Households | 52 (38.5%) | 0 (0.0%) |
| 3-Person Households | 10 (7.4%) | 0 (0.0%) |
| 4-Person Households | 23 (17.0%) | 0 (0.0%) |
| 5-Person Households | 0 (0.0%) | 0 (0.0%) |
| 6-Person Households | 0 (0.0%) | 0 (0.0%) |
| 7+ Person Households | 0 (0.0%) | 0 (0.0%) |
| Total | 85 (63.0%) | 50 (37.0%) |
Female Fertility in Eagle Lake
Fertility by Age in Eagle Lake
Average fertility rate in Eagle Lake is 63.0 births per 1,000 women. Women in the age bracket of 20 to 34 years have the highest fertility rate with 333.0 births per 1,000 women. Women in the age bracket of 20 to 34 years acount for 100.0% of all women with births.
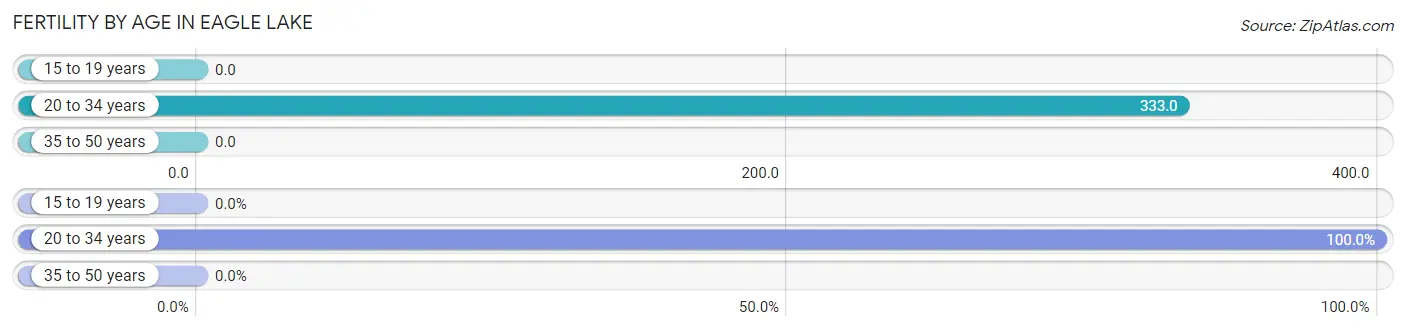
| Age Bracket | Women with Births | Births / 1,000 Women |
| 15 to 19 years | 0 (0.0%) | 0.0 |
| 20 to 34 years | 4 (100.0%) | 333.0 |
| 35 to 50 years | 0 (0.0%) | 0.0 |
| Total | 4 (100.0%) | 63.0 |
Fertility by Age by Marriage Status in Eagle Lake
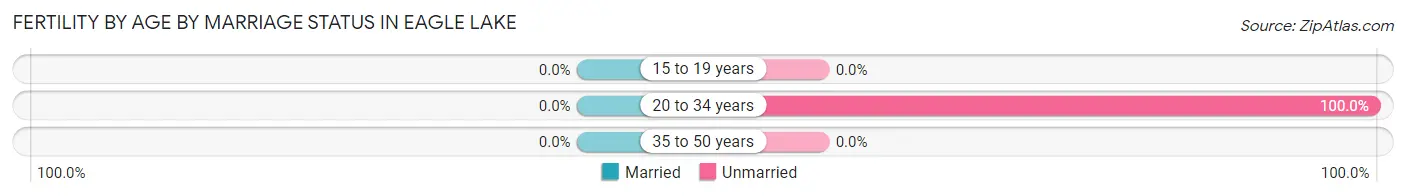
| Age Bracket | Married | Unmarried |
| 15 to 19 years | 0 (0.0%) | 0 (0.0%) |
| 20 to 34 years | 0 (0.0%) | 4 (100.0%) |
| 35 to 50 years | 0 (0.0%) | 0 (0.0%) |
| Total | 0 (0.0%) | 4 (100.0%) |
Fertility by Education in Eagle Lake
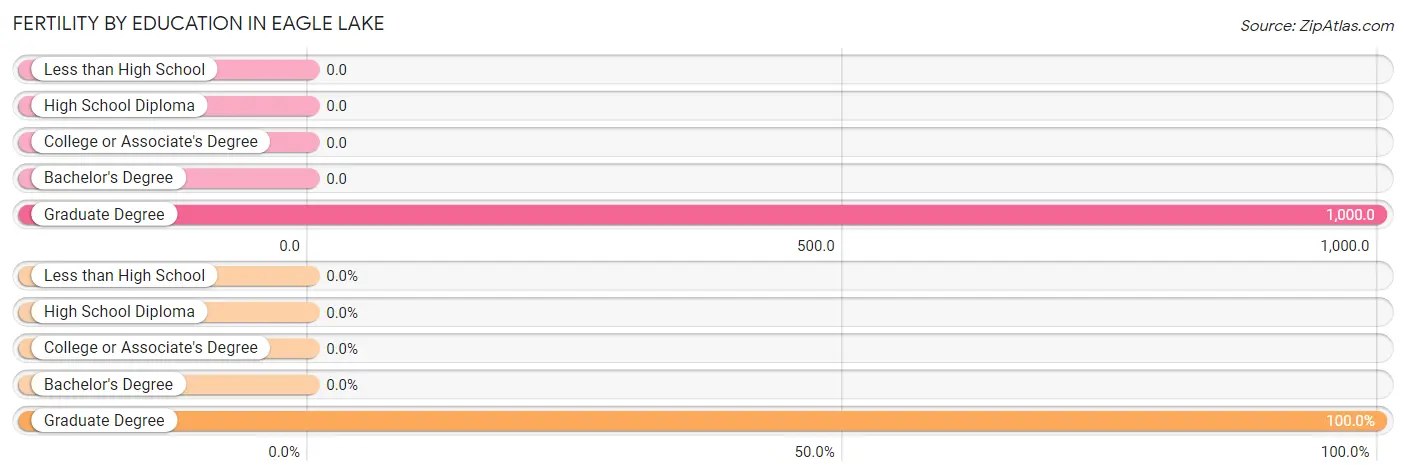
| Educational Attainment | Women with Births | Births / 1,000 Women |
| Less than High School | 0 (0.0%) | 0.0 |
| High School Diploma | 0 (0.0%) | 0.0 |
| College or Associate's Degree | 0 (0.0%) | 0.0 |
| Bachelor's Degree | 0 (0.0%) | 0.0 |
| Graduate Degree | 4 (100.0%) | 1,000.0 |
| Total | 4 (100.0%) | 63.0 |
Fertility by Education by Marriage Status in Eagle Lake
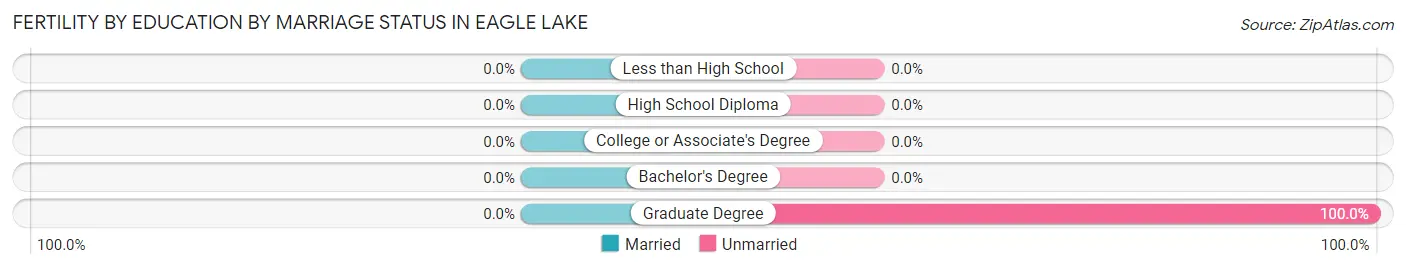
| Educational Attainment | Married | Unmarried |
| Less than High School | 0 (0.0%) | 0 (0.0%) |
| High School Diploma | 0 (0.0%) | 0 (0.0%) |
| College or Associate's Degree | 0 (0.0%) | 0 (0.0%) |
| Bachelor's Degree | 0 (0.0%) | 0 (0.0%) |
| Graduate Degree | 0 (0.0%) | 4 (100.0%) |
| Total | 0 (0.0%) | 4 (100.0%) |
Employment Characteristics in Eagle Lake
Employment by Class of Employer in Eagle Lake
Among the 63 employed individuals in Eagle Lake, not-for-profit organizations (20 | 31.8%), private company employees (19 | 30.2%), and self-employed (not incorporated) (17 | 27.0%) make up the most common classes of employment.
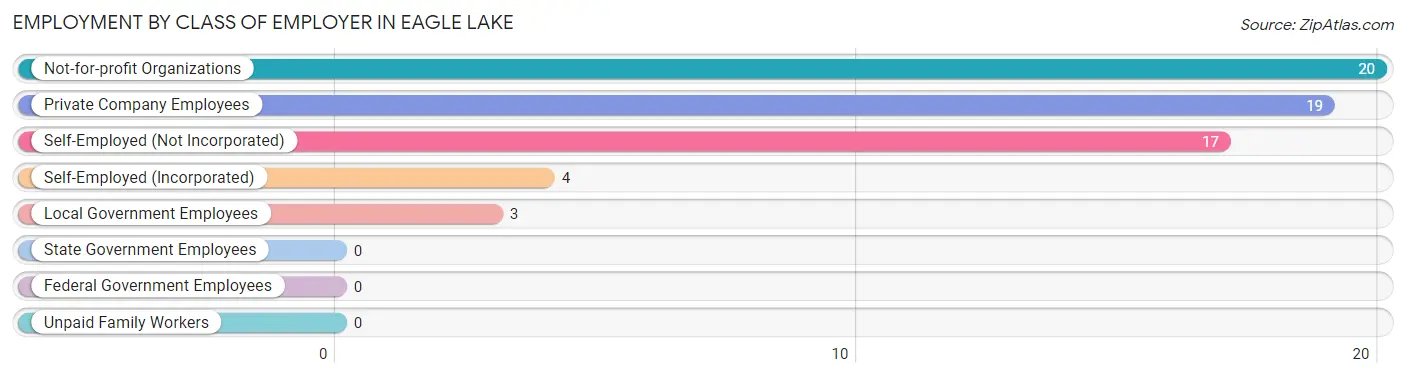
| Employer Class | # Employees | % Employees |
| Private Company Employees | 19 | 30.2% |
| Self-Employed (Incorporated) | 4 | 6.4% |
| Self-Employed (Not Incorporated) | 17 | 27.0% |
| Not-for-profit Organizations | 20 | 31.8% |
| Local Government Employees | 3 | 4.8% |
| State Government Employees | 0 | 0.0% |
| Federal Government Employees | 0 | 0.0% |
| Unpaid Family Workers | 0 | 0.0% |
| Total | 63 | 100.0% |
Employment Status by Age in Eagle Lake
According to the labor force statistics for Eagle Lake, out of the total population over 16 years of age (363), 19.8% or 72 individuals are in the labor force, with 12.5% or 9 of them unemployed. The age group with the highest labor force participation rate is 16 to 19 years, with 100.0% or 4 individuals in the labor force. Within the labor force, the 60 to 64 years age range has the highest percentage of unemployed individuals, with 100.0% or 9 of them being unemployed.
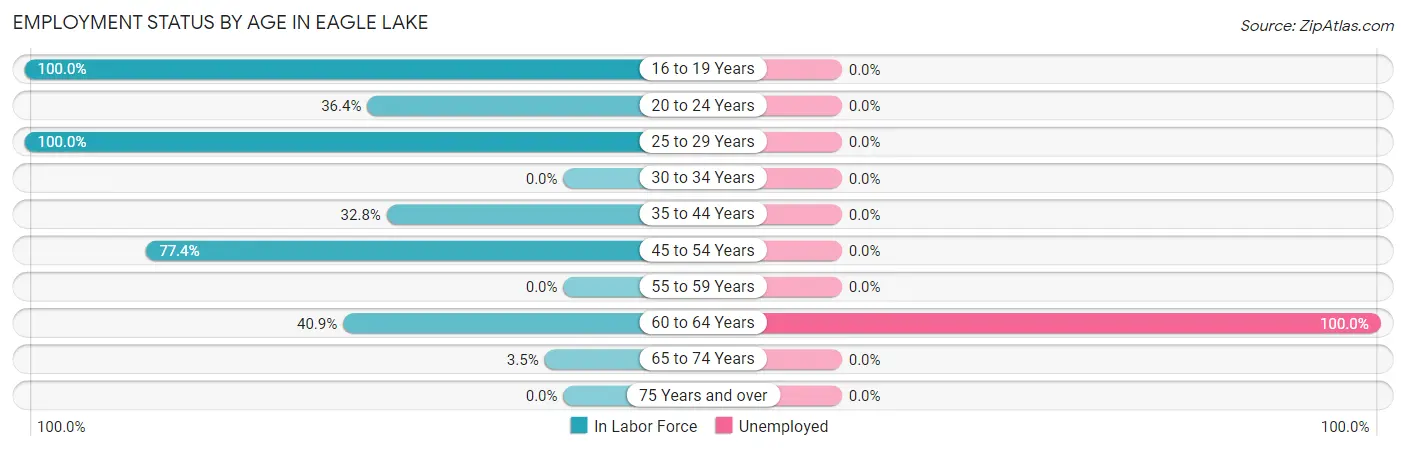
| Age Bracket | In Labor Force | Unemployed |
| 16 to 19 Years | 4 (100.0%) | 0 (0.0%) |
| 20 to 24 Years | 4 (36.4%) | 0 (0.0%) |
| 25 to 29 Years | 6 (100.0%) | 0 (0.0%) |
| 30 to 34 Years | 0 (0.0%) | 0 (0.0%) |
| 35 to 44 Years | 22 (32.8%) | 0 (0.0%) |
| 45 to 54 Years | 24 (77.4%) | 0 (0.0%) |
| 55 to 59 Years | 0 (0.0%) | 0 (0.0%) |
| 60 to 64 Years | 9 (40.9%) | 9 (100.0%) |
| 65 to 74 Years | 3 (3.5%) | 0 (0.0%) |
| 75 Years and over | 0 (0.0%) | 0 (0.0%) |
| Total | 72 (19.8%) | 9 (12.5%) |
Employment Status by Educational Attainment in Eagle Lake
According to labor force statistics for Eagle Lake, 44.2% of individuals (61) out of the total population between 25 and 64 years of age (138) are in the labor force, with 14.8% or 9 of them being unemployed. The group with the highest labor force participation rate are those with the educational attainment of bachelor's degree or higher, with 53.8% or 14 individuals in the labor force. Within the labor force, individuals with high school diploma education have the highest percentage of unemployment, with 47.4% or 9 of them being unemployed.
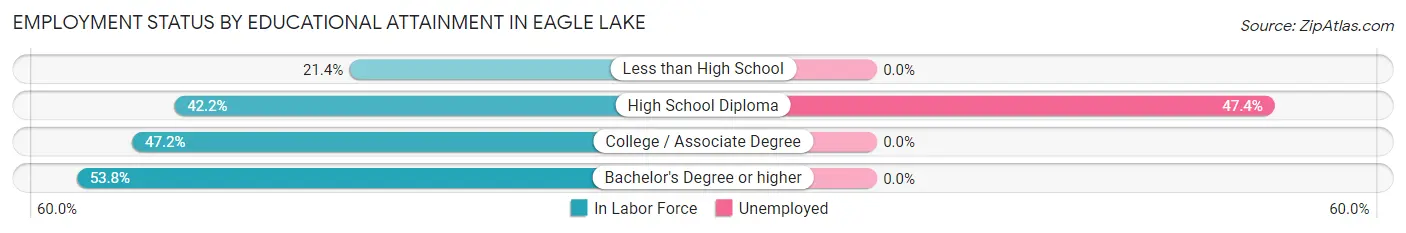
| Educational Attainment | In Labor Force | Unemployed |
| Less than High School | 3 (21.4%) | 0 (0.0%) |
| High School Diploma | 19 (42.2%) | 21 (47.4%) |
| College / Associate Degree | 25 (47.2%) | 0 (0.0%) |
| Bachelor's Degree or higher | 14 (53.8%) | 0 (0.0%) |
| Total | 61 (44.2%) | 20 (14.8%) |
Employment Occupations by Sex in Eagle Lake
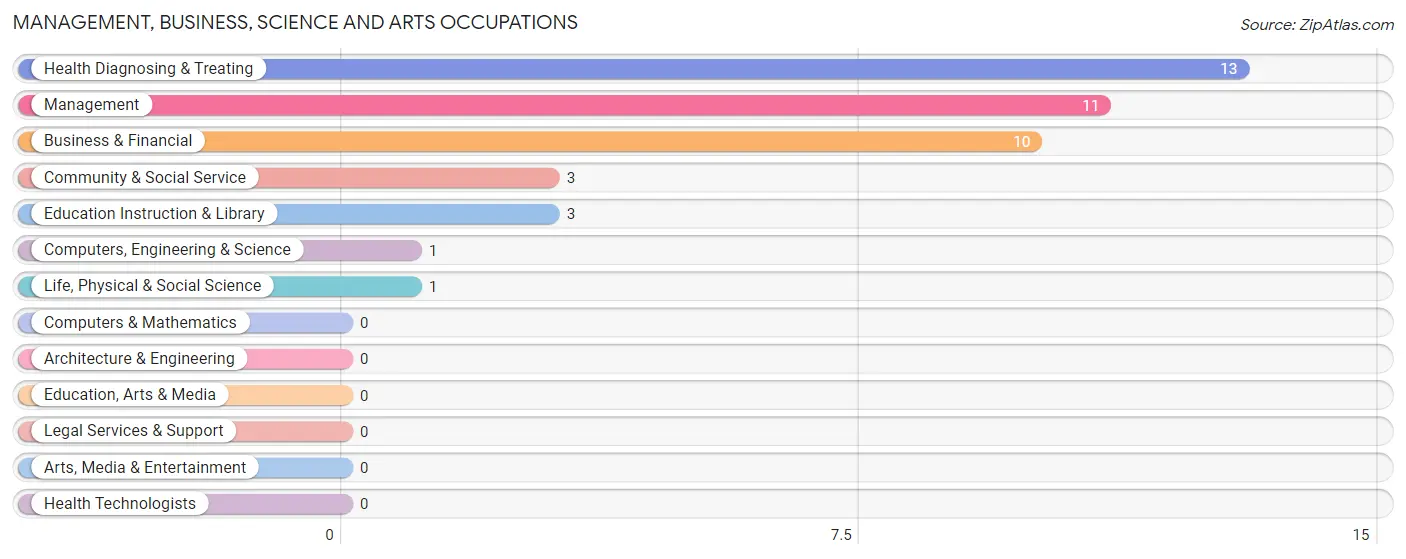
Management, Business, Science and Arts Occupations
The most common Management, Business, Science and Arts occupations in Eagle Lake are Health Diagnosing & Treating (13 | 20.6%), Management (11 | 17.5%), Business & Financial (10 | 15.9%), Community & Social Service (3 | 4.8%), and Education Instruction & Library (3 | 4.8%).
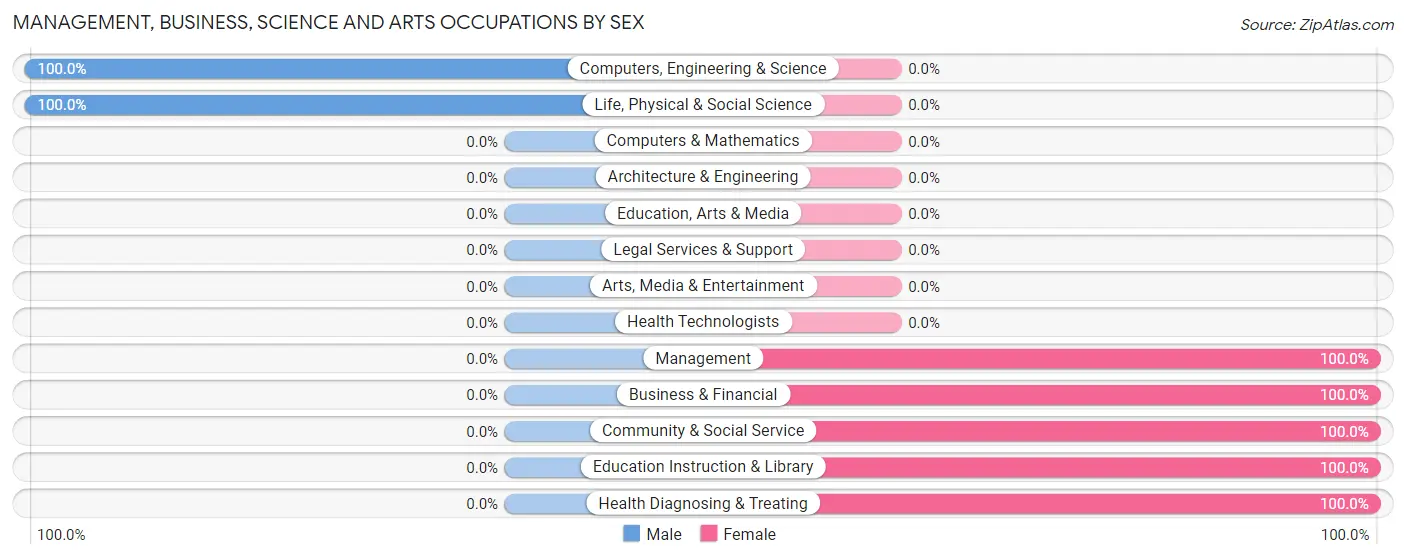
Management, Business, Science and Arts Occupations by Sex
Within the Management, Business, Science and Arts occupations in Eagle Lake, the most male-oriented occupations are Computers, Engineering & Science (100.0%), and Life, Physical & Social Science (100.0%), while the most female-oriented occupations are Management (100.0%), Business & Financial (100.0%), and Community & Social Service (100.0%).
| Occupation | Male | Female |
| Management | 0 (0.0%) | 11 (100.0%) |
| Business & Financial | 0 (0.0%) | 10 (100.0%) |
| Computers, Engineering & Science | 1 (100.0%) | 0 (0.0%) |
| Computers & Mathematics | 0 (0.0%) | 0 (0.0%) |
| Architecture & Engineering | 0 (0.0%) | 0 (0.0%) |
| Life, Physical & Social Science | 1 (100.0%) | 0 (0.0%) |
| Community & Social Service | 0 (0.0%) | 3 (100.0%) |
| Education, Arts & Media | 0 (0.0%) | 0 (0.0%) |
| Legal Services & Support | 0 (0.0%) | 0 (0.0%) |
| Education Instruction & Library | 0 (0.0%) | 3 (100.0%) |
| Arts, Media & Entertainment | 0 (0.0%) | 0 (0.0%) |
| Health Diagnosing & Treating | 0 (0.0%) | 13 (100.0%) |
| Health Technologists | 0 (0.0%) | 0 (0.0%) |
| Total (Category) | 1 (2.6%) | 37 (97.4%) |
| Total (Overall) | 21 (33.3%) | 42 (66.7%) |
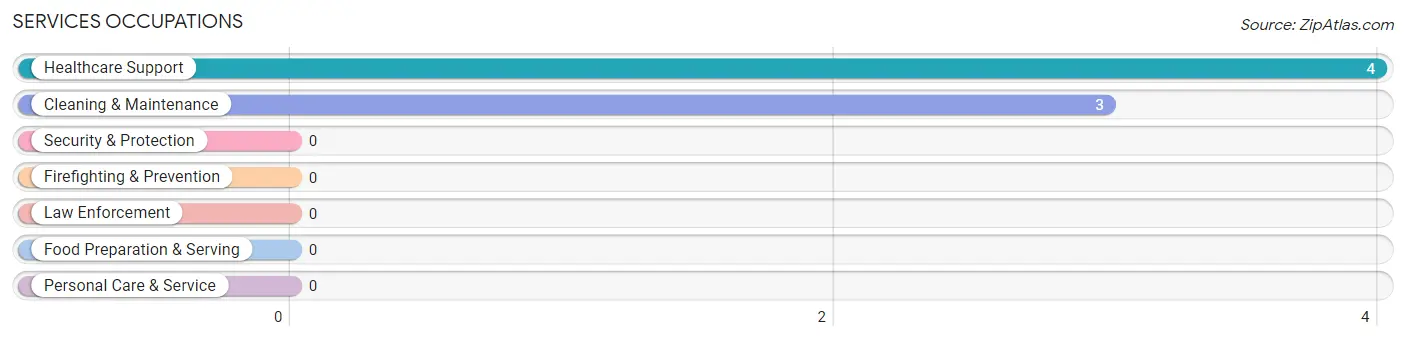
Services Occupations
The most common Services occupations in Eagle Lake are Healthcare Support (4 | 6.4%), and Cleaning & Maintenance (3 | 4.8%).
Services Occupations by Sex
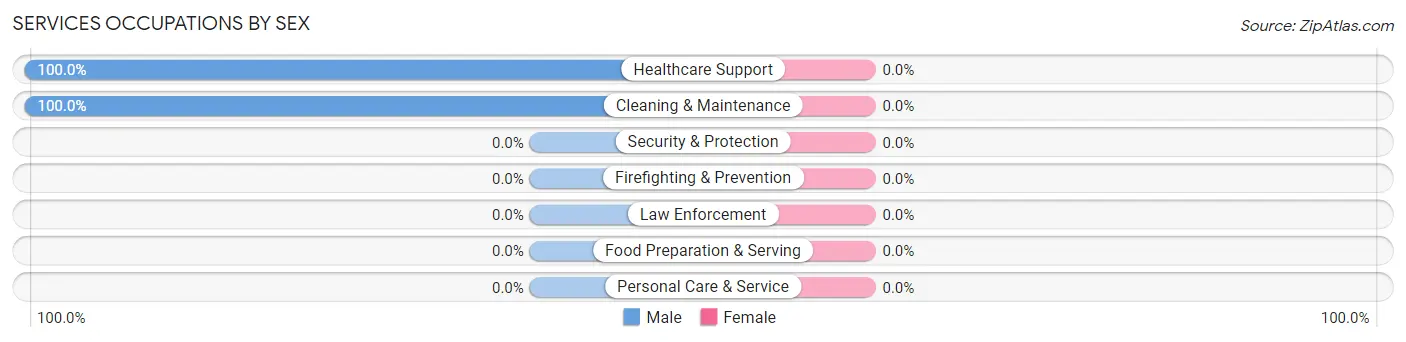
| Occupation | Male | Female |
| Healthcare Support | 4 (100.0%) | 0 (0.0%) |
| Security & Protection | 0 (0.0%) | 0 (0.0%) |
| Firefighting & Prevention | 0 (0.0%) | 0 (0.0%) |
| Law Enforcement | 0 (0.0%) | 0 (0.0%) |
| Food Preparation & Serving | 0 (0.0%) | 0 (0.0%) |
| Cleaning & Maintenance | 3 (100.0%) | 0 (0.0%) |
| Personal Care & Service | 0 (0.0%) | 0 (0.0%) |
| Total (Category) | 7 (100.0%) | 0 (0.0%) |
| Total (Overall) | 21 (33.3%) | 42 (66.7%) |
Sales and Office Occupations
Sales and Office Occupations by Sex
| Occupation | Male | Female |
| Sales & Related | 0 (0.0%) | 0 (0.0%) |
| Office & Administration | 0 (0.0%) | 0 (0.0%) |
| Total (Category) | 0 (0.0%) | 0 (0.0%) |
| Total (Overall) | 21 (33.3%) | 42 (66.7%) |
Natural Resources, Construction and Maintenance Occupations
The most common Natural Resources, Construction and Maintenance occupations in Eagle Lake are Farming, Fishing & Forestry (4 | 6.4%), and Construction & Extraction (4 | 6.4%).
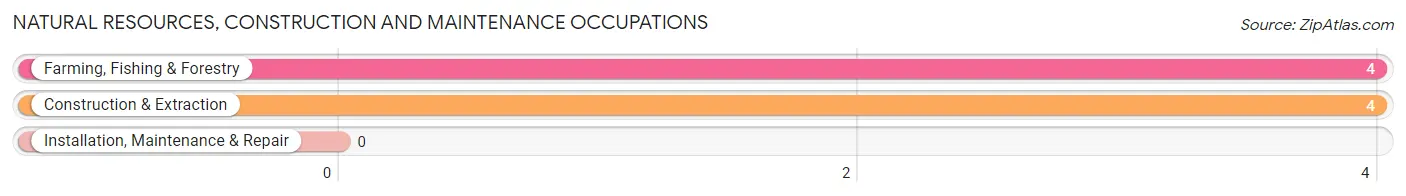
Natural Resources, Construction and Maintenance Occupations by Sex
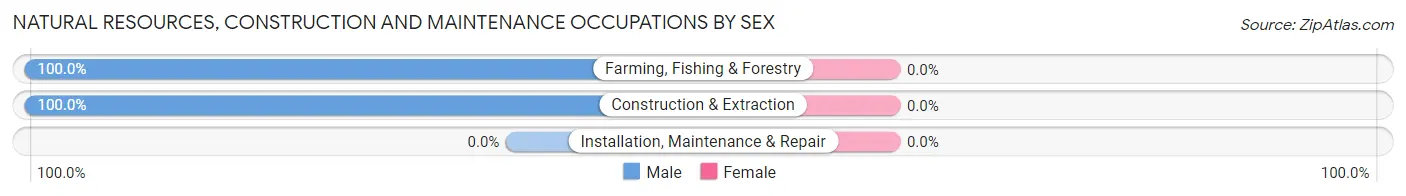
| Occupation | Male | Female |
| Farming, Fishing & Forestry | 4 (100.0%) | 0 (0.0%) |
| Construction & Extraction | 4 (100.0%) | 0 (0.0%) |
| Installation, Maintenance & Repair | 0 (0.0%) | 0 (0.0%) |
| Total (Category) | 8 (100.0%) | 0 (0.0%) |
| Total (Overall) | 21 (33.3%) | 42 (66.7%) |
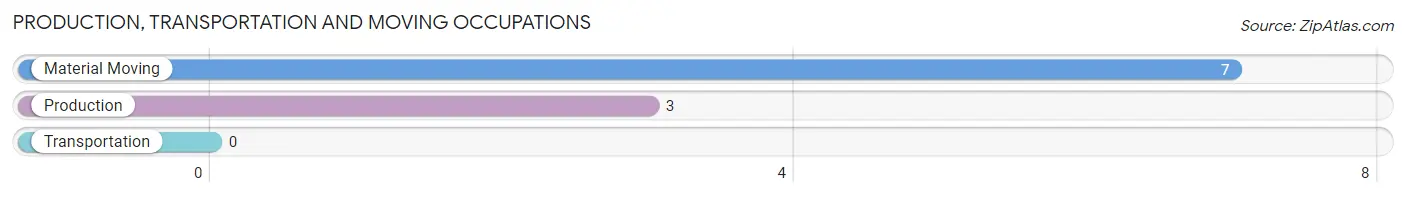
Production, Transportation and Moving Occupations
The most common Production, Transportation and Moving occupations in Eagle Lake are Material Moving (7 | 11.1%), and Production (3 | 4.8%).
Production, Transportation and Moving Occupations by Sex
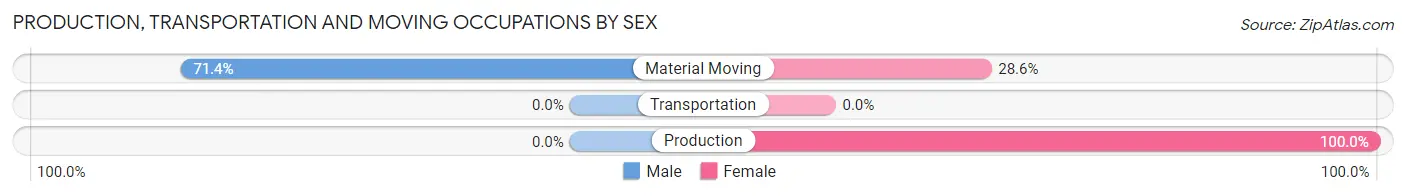
| Occupation | Male | Female |
| Production | 0 (0.0%) | 3 (100.0%) |
| Transportation | 0 (0.0%) | 0 (0.0%) |
| Material Moving | 5 (71.4%) | 2 (28.6%) |
| Total (Category) | 5 (50.0%) | 5 (50.0%) |
| Total (Overall) | 21 (33.3%) | 42 (66.7%) |
Employment Industries by Sex in Eagle Lake
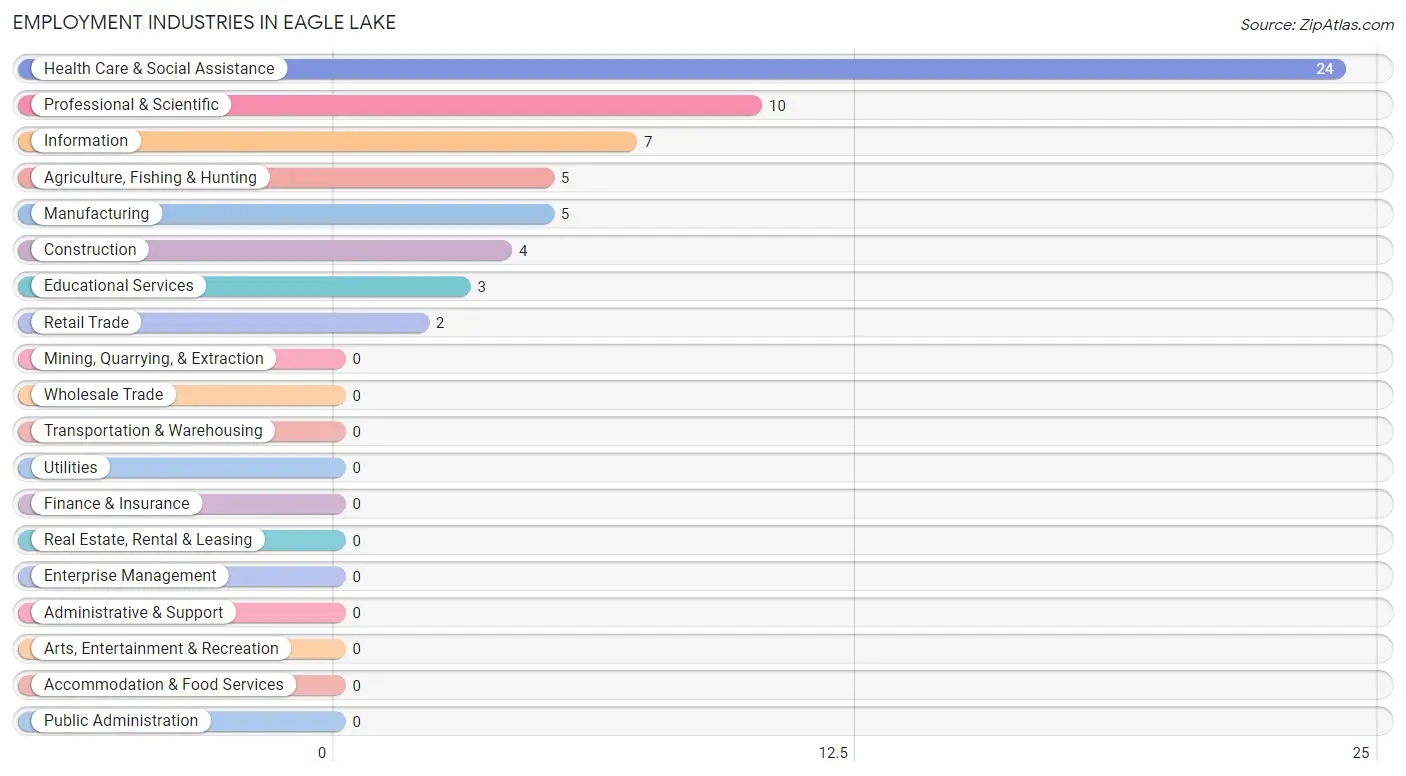
Employment Industries in Eagle Lake
The major employment industries in Eagle Lake include Health Care & Social Assistance (24 | 38.1%), Professional & Scientific (10 | 15.9%), Information (7 | 11.1%), Agriculture, Fishing & Hunting (5 | 7.9%), and Manufacturing (5 | 7.9%).
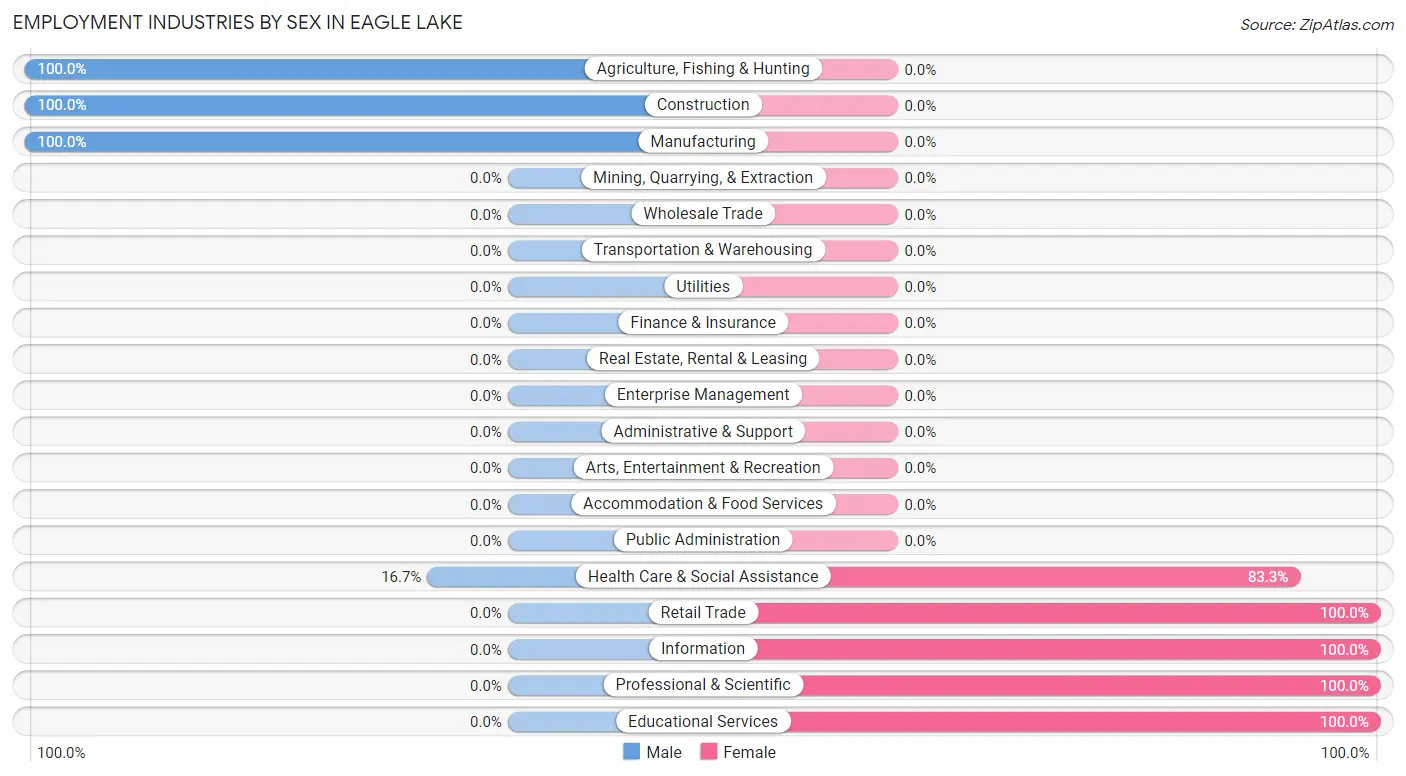
Employment Industries by Sex in Eagle Lake
The Eagle Lake industries that see more men than women are Agriculture, Fishing & Hunting (100.0%), Construction (100.0%), and Manufacturing (100.0%), whereas the industries that tend to have a higher number of women are Retail Trade (100.0%), Information (100.0%), and Professional & Scientific (100.0%).
| Industry | Male | Female |
| Agriculture, Fishing & Hunting | 5 (100.0%) | 0 (0.0%) |
| Mining, Quarrying, & Extraction | 0 (0.0%) | 0 (0.0%) |
| Construction | 4 (100.0%) | 0 (0.0%) |
| Manufacturing | 5 (100.0%) | 0 (0.0%) |
| Wholesale Trade | 0 (0.0%) | 0 (0.0%) |
| Retail Trade | 0 (0.0%) | 2 (100.0%) |
| Transportation & Warehousing | 0 (0.0%) | 0 (0.0%) |
| Utilities | 0 (0.0%) | 0 (0.0%) |
| Information | 0 (0.0%) | 7 (100.0%) |
| Finance & Insurance | 0 (0.0%) | 0 (0.0%) |
| Real Estate, Rental & Leasing | 0 (0.0%) | 0 (0.0%) |
| Professional & Scientific | 0 (0.0%) | 10 (100.0%) |
| Enterprise Management | 0 (0.0%) | 0 (0.0%) |
| Administrative & Support | 0 (0.0%) | 0 (0.0%) |
| Educational Services | 0 (0.0%) | 3 (100.0%) |
| Health Care & Social Assistance | 4 (16.7%) | 20 (83.3%) |
| Arts, Entertainment & Recreation | 0 (0.0%) | 0 (0.0%) |
| Accommodation & Food Services | 0 (0.0%) | 0 (0.0%) |
| Public Administration | 0 (0.0%) | 0 (0.0%) |
| Total | 21 (33.3%) | 42 (66.7%) |
Education in Eagle Lake
School Enrollment in Eagle Lake
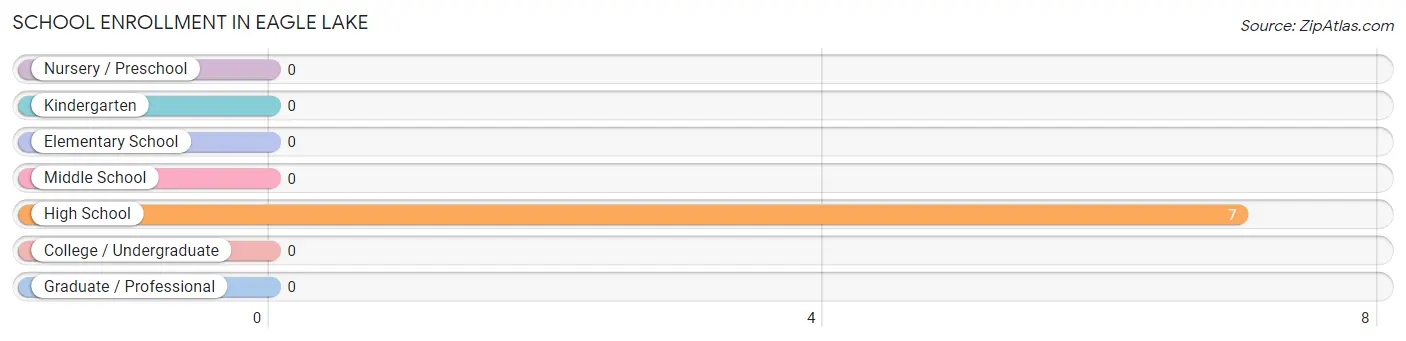
| School Level | # Students | % Students |
| Nursery / Preschool | 0 | 0.0% |
| Kindergarten | 0 | 0.0% |
| Elementary School | 0 | 0.0% |
| Middle School | 0 | 0.0% |
| High School | 7 | 100.0% |
| College / Undergraduate | 0 | 0.0% |
| Graduate / Professional | 0 | 0.0% |
| Total | 7 | 100.0% |
School Enrollment by Age by Funding Source in Eagle Lake
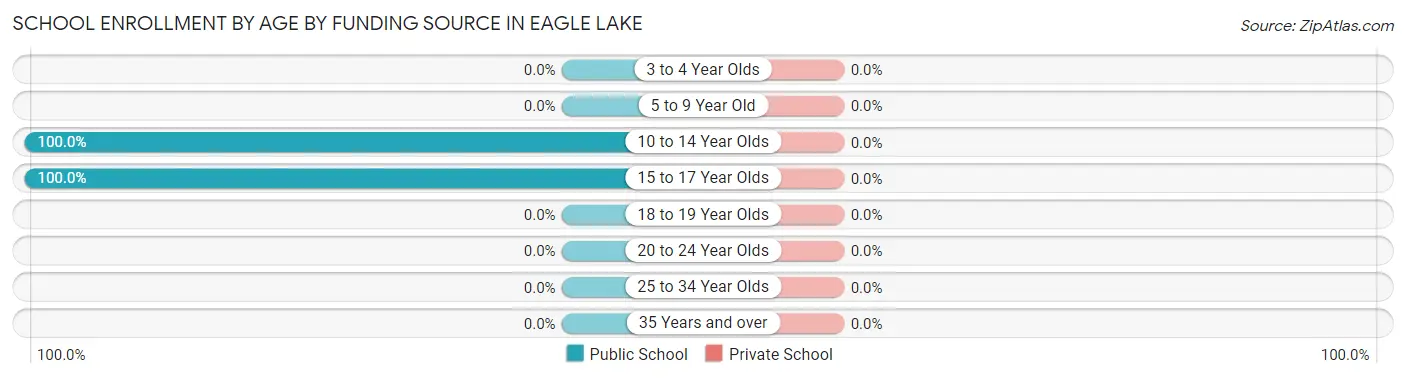
| Age Bracket | Public School | Private School |
| 3 to 4 Year Olds | 0 (0.0%) | 0 (0.0%) |
| 5 to 9 Year Old | 0 (0.0%) | 0 (0.0%) |
| 10 to 14 Year Olds | 3 (100.0%) | 0 (0.0%) |
| 15 to 17 Year Olds | 4 (100.0%) | 0 (0.0%) |
| 18 to 19 Year Olds | 0 (0.0%) | 0 (0.0%) |
| 20 to 24 Year Olds | 0 (0.0%) | 0 (0.0%) |
| 25 to 34 Year Olds | 0 (0.0%) | 0 (0.0%) |
| 35 Years and over | 0 (0.0%) | 0 (0.0%) |
| Total | 7 (100.0%) | 0 (0.0%) |
Educational Attainment by Field of Study in Eagle Lake
Social sciences (20 | 26.3%), business (15 | 19.7%), literature & languages (13 | 17.1%), science & technology (9 | 11.8%), and computers & mathematics (7 | 9.2%) are the most common fields of study among 76 individuals in Eagle Lake who have obtained a bachelor's degree or higher.
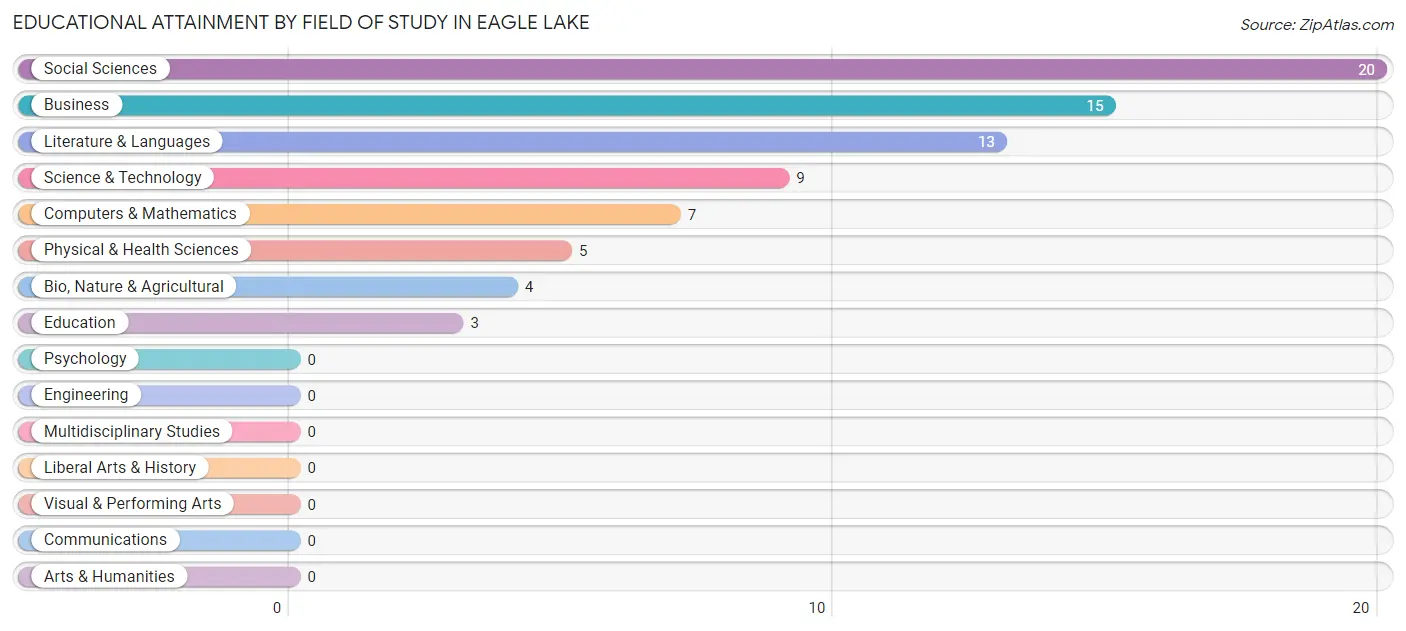
| Field of Study | # Graduates | % Graduates |
| Computers & Mathematics | 7 | 9.2% |
| Bio, Nature & Agricultural | 4 | 5.3% |
| Physical & Health Sciences | 5 | 6.6% |
| Psychology | 0 | 0.0% |
| Social Sciences | 20 | 26.3% |
| Engineering | 0 | 0.0% |
| Multidisciplinary Studies | 0 | 0.0% |
| Science & Technology | 9 | 11.8% |
| Business | 15 | 19.7% |
| Education | 3 | 4.0% |
| Literature & Languages | 13 | 17.1% |
| Liberal Arts & History | 0 | 0.0% |
| Visual & Performing Arts | 0 | 0.0% |
| Communications | 0 | 0.0% |
| Arts & Humanities | 0 | 0.0% |
| Total | 76 | 100.0% |
Transportation & Commute in Eagle Lake
Vehicle Availability by Sex in Eagle Lake
The most prevalent vehicle ownership categories in Eagle Lake are males with 5 or more vehicles (8, accounting for 44.4%) and females with 5 or more vehicles (3, making up 20.0%).
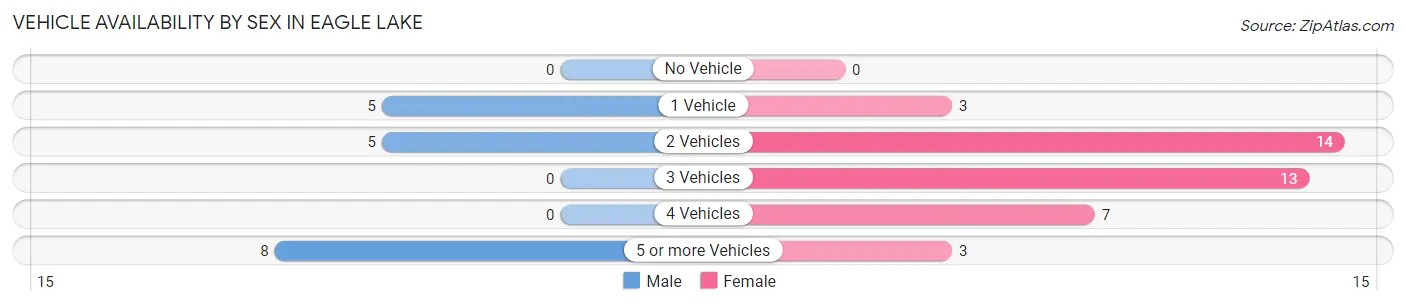
| Vehicles Available | Male | Female |
| No Vehicle | 0 (0.0%) | 0 (0.0%) |
| 1 Vehicle | 5 (27.8%) | 3 (7.5%) |
| 2 Vehicles | 5 (27.8%) | 14 (35.0%) |
| 3 Vehicles | 0 (0.0%) | 13 (32.5%) |
| 4 Vehicles | 0 (0.0%) | 7 (17.5%) |
| 5 or more Vehicles | 8 (44.4%) | 3 (7.5%) |
| Total | 18 (100.0%) | 40 (100.0%) |
Commute Time in Eagle Lake
The most frequently occuring commute durations in Eagle Lake are 10 to 14 minutes (17 commuters, 27.0%), 60 to 89 minutes (10 commuters, 15.9%), and less than 5 minutes (7 commuters, 11.1%).
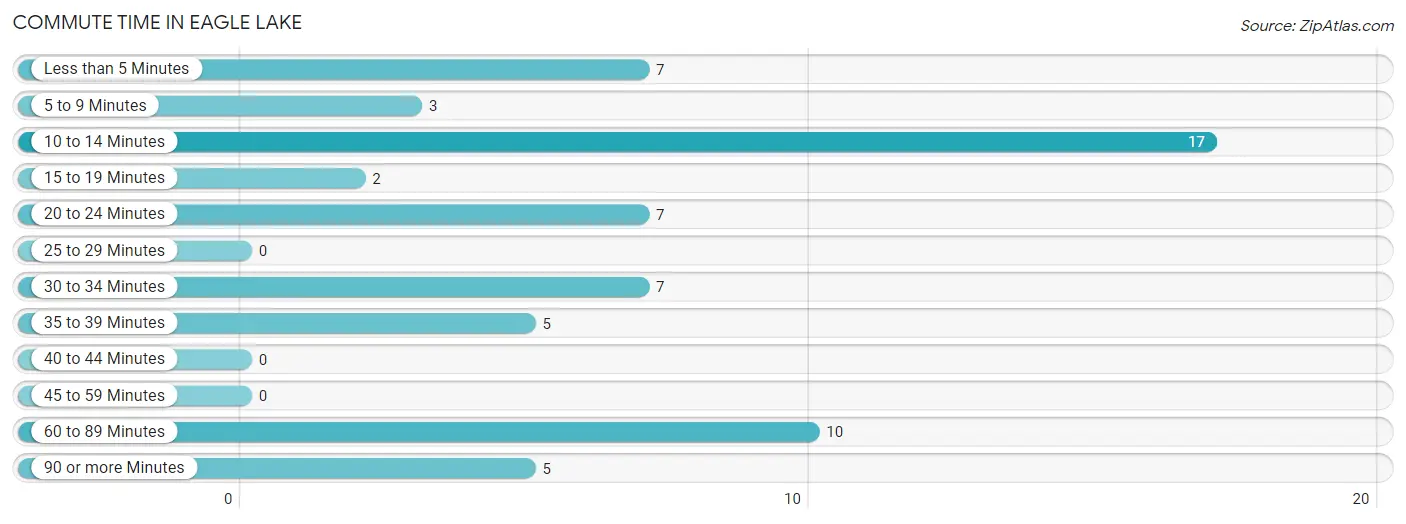
| Commute Time | # Commuters | % Commuters |
| Less than 5 Minutes | 7 | 11.1% |
| 5 to 9 Minutes | 3 | 4.8% |
| 10 to 14 Minutes | 17 | 27.0% |
| 15 to 19 Minutes | 2 | 3.2% |
| 20 to 24 Minutes | 7 | 11.1% |
| 25 to 29 Minutes | 0 | 0.0% |
| 30 to 34 Minutes | 7 | 11.1% |
| 35 to 39 Minutes | 5 | 7.9% |
| 40 to 44 Minutes | 0 | 0.0% |
| 45 to 59 Minutes | 0 | 0.0% |
| 60 to 89 Minutes | 10 | 15.9% |
| 90 or more Minutes | 5 | 7.9% |
Commute Time by Sex in Eagle Lake
The most common commute times in Eagle Lake are 35 to 39 minutes (5 commuters, 23.8%) for males and 10 to 14 minutes (13 commuters, 30.9%) for females.
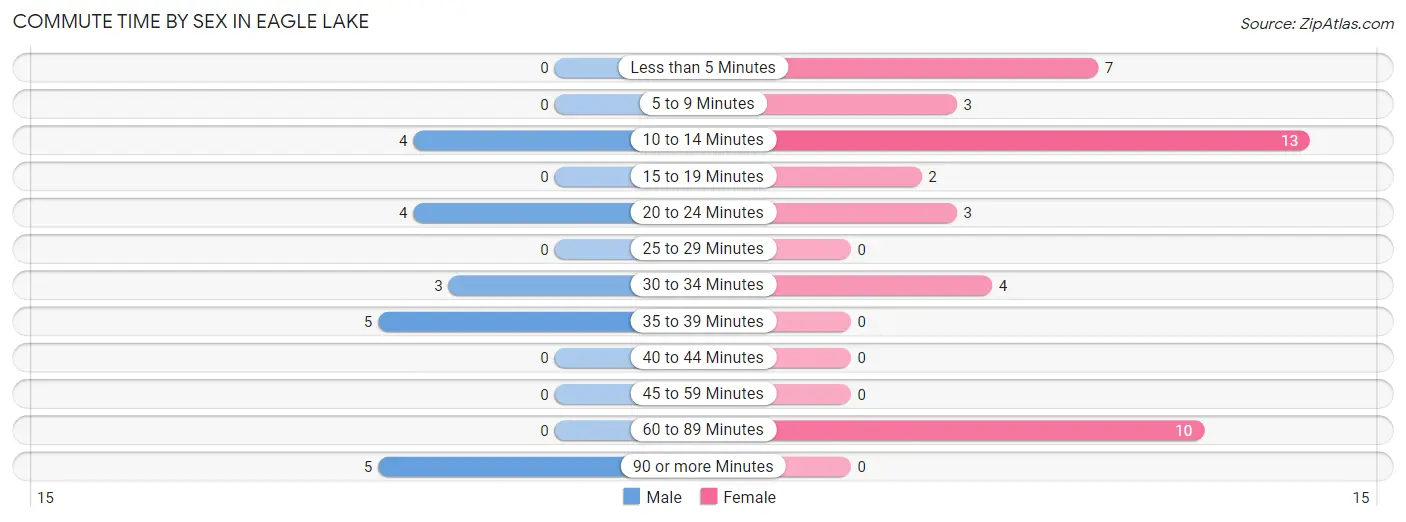
| Commute Time | Male | Female |
| Less than 5 Minutes | 0 (0.0%) | 7 (16.7%) |
| 5 to 9 Minutes | 0 (0.0%) | 3 (7.1%) |
| 10 to 14 Minutes | 4 (19.1%) | 13 (30.9%) |
| 15 to 19 Minutes | 0 (0.0%) | 2 (4.8%) |
| 20 to 24 Minutes | 4 (19.1%) | 3 (7.1%) |
| 25 to 29 Minutes | 0 (0.0%) | 0 (0.0%) |
| 30 to 34 Minutes | 3 (14.3%) | 4 (9.5%) |
| 35 to 39 Minutes | 5 (23.8%) | 0 (0.0%) |
| 40 to 44 Minutes | 0 (0.0%) | 0 (0.0%) |
| 45 to 59 Minutes | 0 (0.0%) | 0 (0.0%) |
| 60 to 89 Minutes | 0 (0.0%) | 10 (23.8%) |
| 90 or more Minutes | 5 (23.8%) | 0 (0.0%) |
Time of Departure to Work by Sex in Eagle Lake
The most frequent times of departure to work in Eagle Lake are 12:00 PM to 3:59 PM (8, 38.1%) for males and 7:00 AM to 7:29 AM (17, 40.5%) for females.
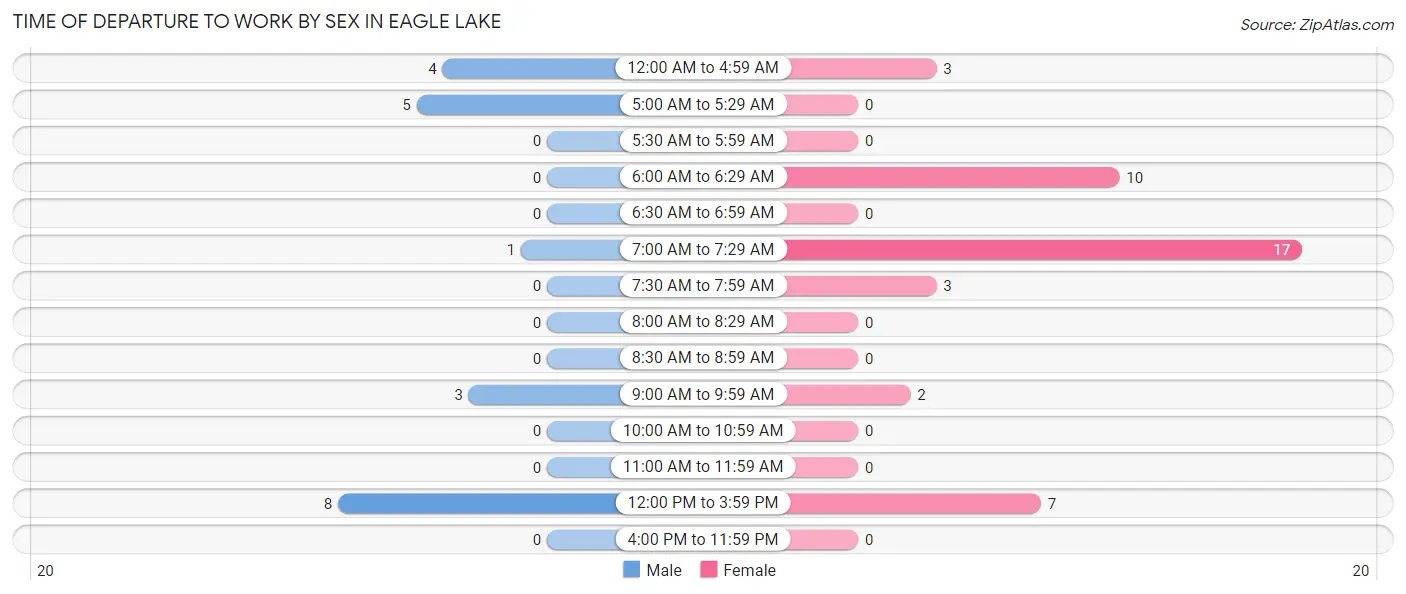
| Time of Departure | Male | Female |
| 12:00 AM to 4:59 AM | 4 (19.1%) | 3 (7.1%) |
| 5:00 AM to 5:29 AM | 5 (23.8%) | 0 (0.0%) |
| 5:30 AM to 5:59 AM | 0 (0.0%) | 0 (0.0%) |
| 6:00 AM to 6:29 AM | 0 (0.0%) | 10 (23.8%) |
| 6:30 AM to 6:59 AM | 0 (0.0%) | 0 (0.0%) |
| 7:00 AM to 7:29 AM | 1 (4.8%) | 17 (40.5%) |
| 7:30 AM to 7:59 AM | 0 (0.0%) | 3 (7.1%) |
| 8:00 AM to 8:29 AM | 0 (0.0%) | 0 (0.0%) |
| 8:30 AM to 8:59 AM | 0 (0.0%) | 0 (0.0%) |
| 9:00 AM to 9:59 AM | 3 (14.3%) | 2 (4.8%) |
| 10:00 AM to 10:59 AM | 0 (0.0%) | 0 (0.0%) |
| 11:00 AM to 11:59 AM | 0 (0.0%) | 0 (0.0%) |
| 12:00 PM to 3:59 PM | 8 (38.1%) | 7 (16.7%) |
| 4:00 PM to 11:59 PM | 0 (0.0%) | 0 (0.0%) |
| Total | 21 (100.0%) | 42 (100.0%) |
Housing Occupancy in Eagle Lake
Occupancy by Ownership in Eagle Lake
Of the total 135 dwellings in Eagle Lake, owner-occupied units account for 82 (60.7%), while renter-occupied units make up 53 (39.3%).
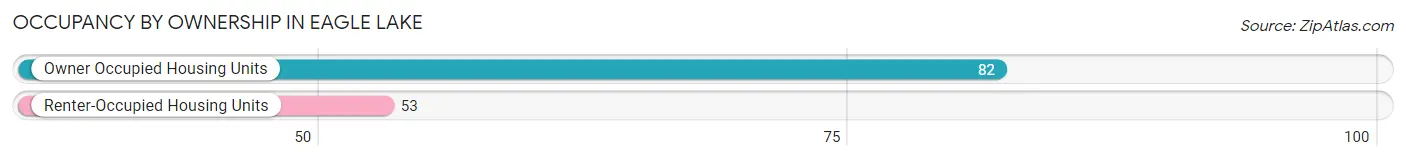
| Occupancy | # Housing Units | % Housing Units |
| Owner Occupied Housing Units | 82 | 60.7% |
| Renter-Occupied Housing Units | 53 | 39.3% |
| Total Occupied Housing Units | 135 | 100.0% |
Occupancy by Household Size in Eagle Lake
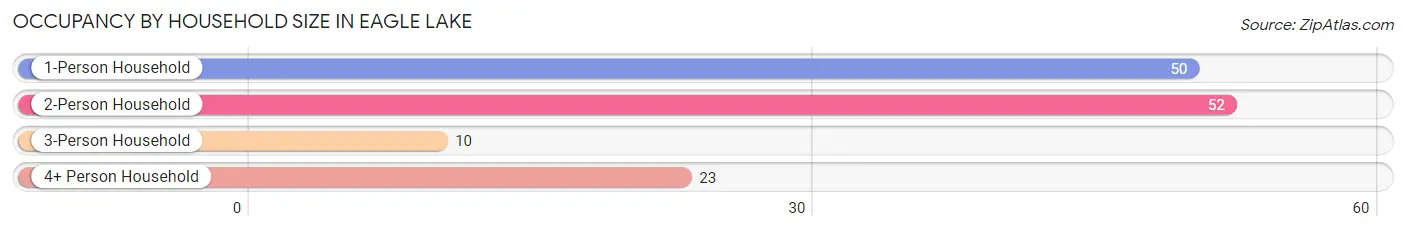
| Household Size | # Housing Units | % Housing Units |
| 1-Person Household | 50 | 37.0% |
| 2-Person Household | 52 | 38.5% |
| 3-Person Household | 10 | 7.4% |
| 4+ Person Household | 23 | 17.0% |
| Total Housing Units | 135 | 100.0% |
Occupancy by Ownership by Household Size in Eagle Lake
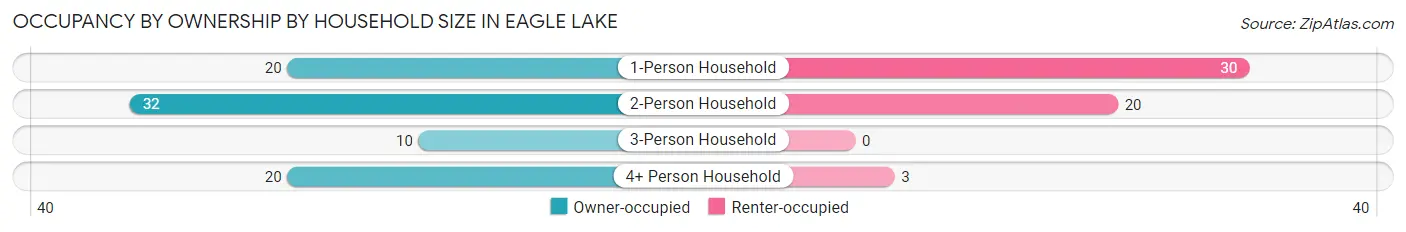
| Household Size | Owner-occupied | Renter-occupied |
| 1-Person Household | 20 (40.0%) | 30 (60.0%) |
| 2-Person Household | 32 (61.5%) | 20 (38.5%) |
| 3-Person Household | 10 (100.0%) | 0 (0.0%) |
| 4+ Person Household | 20 (87.0%) | 3 (13.0%) |
| Total Housing Units | 82 (60.7%) | 53 (39.3%) |
Occupancy by Educational Attainment in Eagle Lake
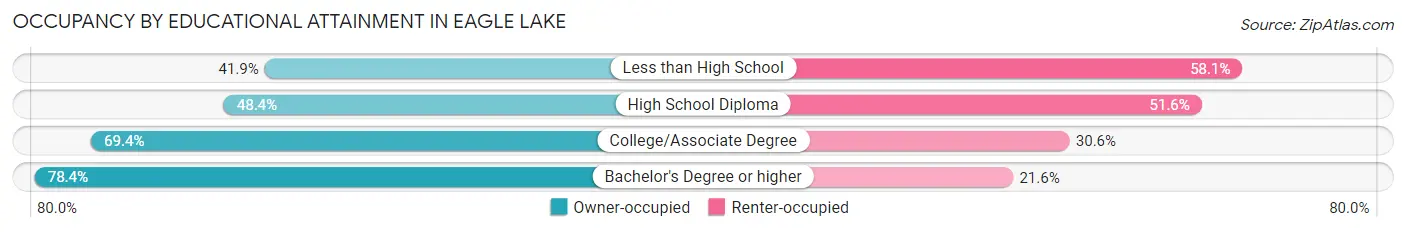
| Household Size | Owner-occupied | Renter-occupied |
| Less than High School | 13 (41.9%) | 18 (58.1%) |
| High School Diploma | 15 (48.4%) | 16 (51.6%) |
| College/Associate Degree | 25 (69.4%) | 11 (30.6%) |
| Bachelor's Degree or higher | 29 (78.4%) | 8 (21.6%) |
Occupancy by Age of Householder in Eagle Lake
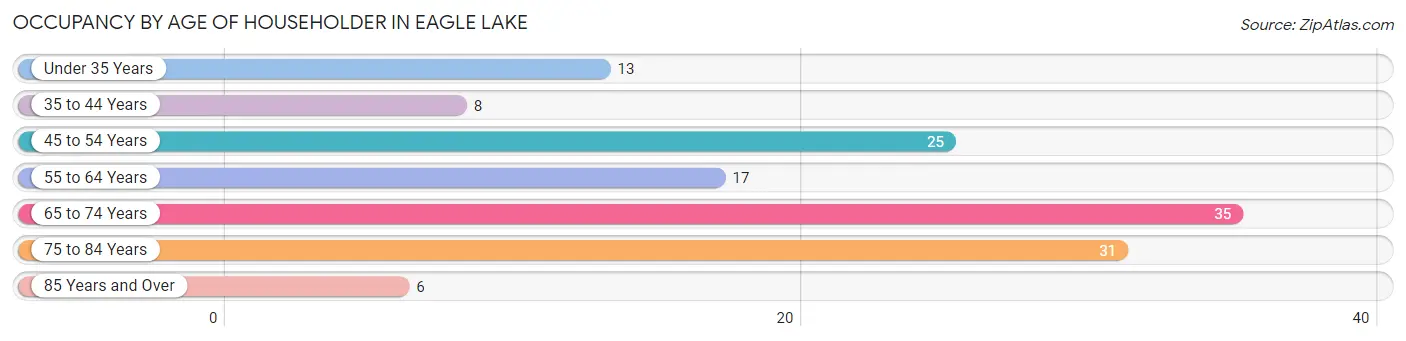
| Age Bracket | # Households | % Households |
| Under 35 Years | 13 | 9.6% |
| 35 to 44 Years | 8 | 5.9% |
| 45 to 54 Years | 25 | 18.5% |
| 55 to 64 Years | 17 | 12.6% |
| 65 to 74 Years | 35 | 25.9% |
| 75 to 84 Years | 31 | 23.0% |
| 85 Years and Over | 6 | 4.4% |
| Total | 135 | 100.0% |
Housing Finances in Eagle Lake
Median Income by Occupancy in Eagle Lake
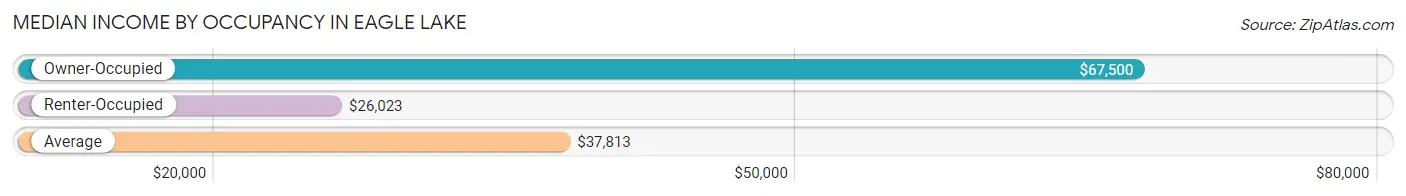
| Occupancy Type | # Households | Median Income |
| Owner-Occupied | 82 (60.7%) | $67,500 |
| Renter-Occupied | 53 (39.3%) | $26,023 |
| Average | 135 (100.0%) | $37,813 |
Occupancy by Householder Income Bracket in Eagle Lake
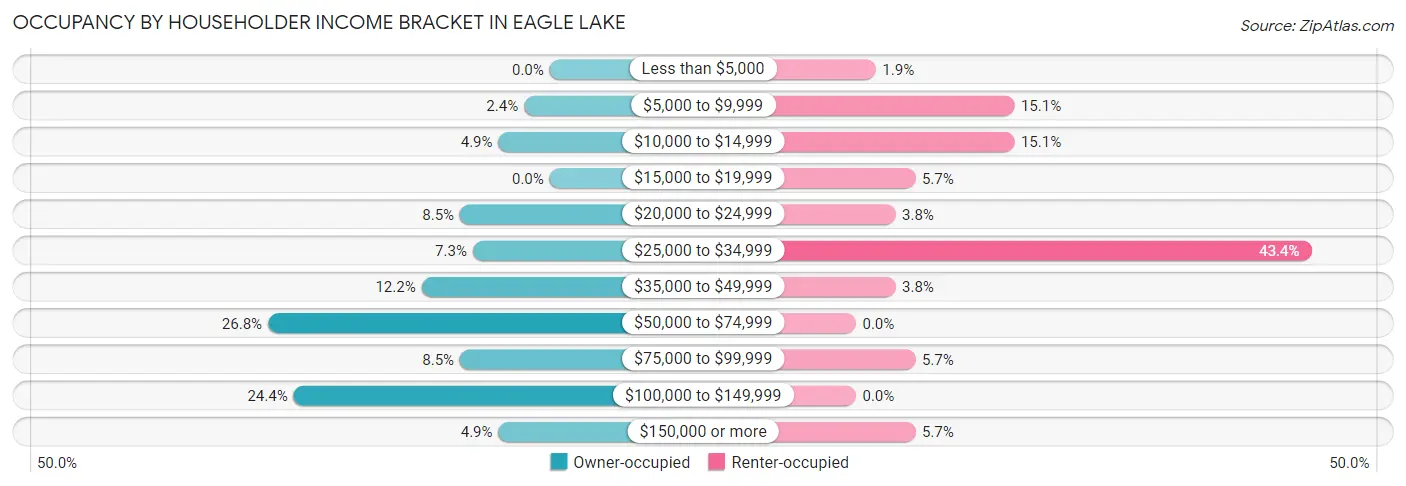
| Income Bracket | Owner-occupied | Renter-occupied |
| Less than $5,000 | 0 (0.0%) | 1 (1.9%) |
| $5,000 to $9,999 | 2 (2.4%) | 8 (15.1%) |
| $10,000 to $14,999 | 4 (4.9%) | 8 (15.1%) |
| $15,000 to $19,999 | 0 (0.0%) | 3 (5.7%) |
| $20,000 to $24,999 | 7 (8.5%) | 2 (3.8%) |
| $25,000 to $34,999 | 6 (7.3%) | 23 (43.4%) |
| $35,000 to $49,999 | 10 (12.2%) | 2 (3.8%) |
| $50,000 to $74,999 | 22 (26.8%) | 0 (0.0%) |
| $75,000 to $99,999 | 7 (8.5%) | 3 (5.7%) |
| $100,000 to $149,999 | 20 (24.4%) | 0 (0.0%) |
| $150,000 or more | 4 (4.9%) | 3 (5.7%) |
| Total | 82 (100.0%) | 53 (100.0%) |
Monthly Housing Cost Tiers in Eagle Lake
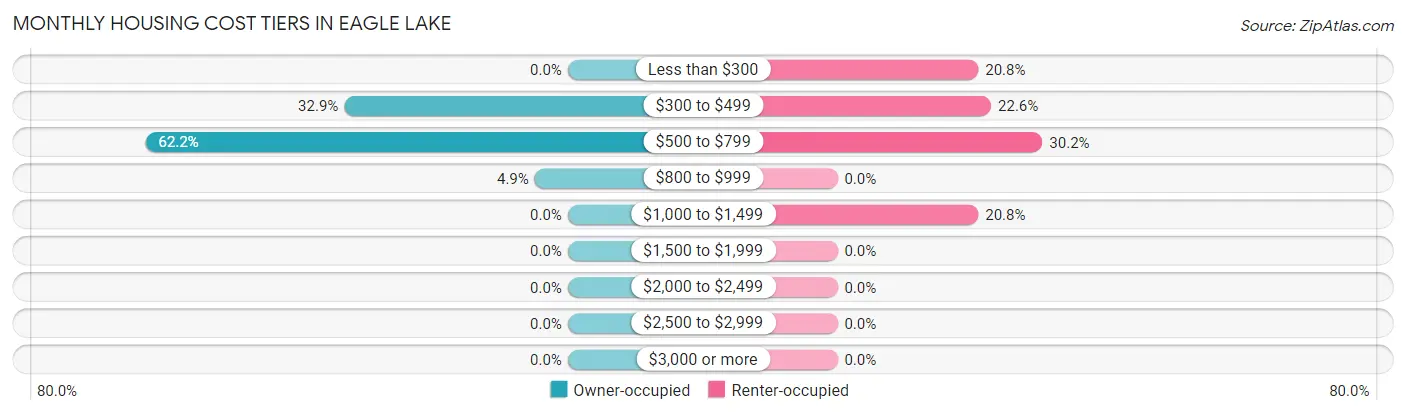
| Monthly Cost | Owner-occupied | Renter-occupied |
| Less than $300 | 0 (0.0%) | 11 (20.7%) |
| $300 to $499 | 27 (32.9%) | 12 (22.6%) |
| $500 to $799 | 51 (62.2%) | 16 (30.2%) |
| $800 to $999 | 4 (4.9%) | 0 (0.0%) |
| $1,000 to $1,499 | 0 (0.0%) | 11 (20.7%) |
| $1,500 to $1,999 | 0 (0.0%) | 0 (0.0%) |
| $2,000 to $2,499 | 0 (0.0%) | 0 (0.0%) |
| $2,500 to $2,999 | 0 (0.0%) | 0 (0.0%) |
| $3,000 or more | 0 (0.0%) | 0 (0.0%) |
| Total | 82 (100.0%) | 53 (100.0%) |
Physical Housing Characteristics in Eagle Lake
Housing Structures in Eagle Lake
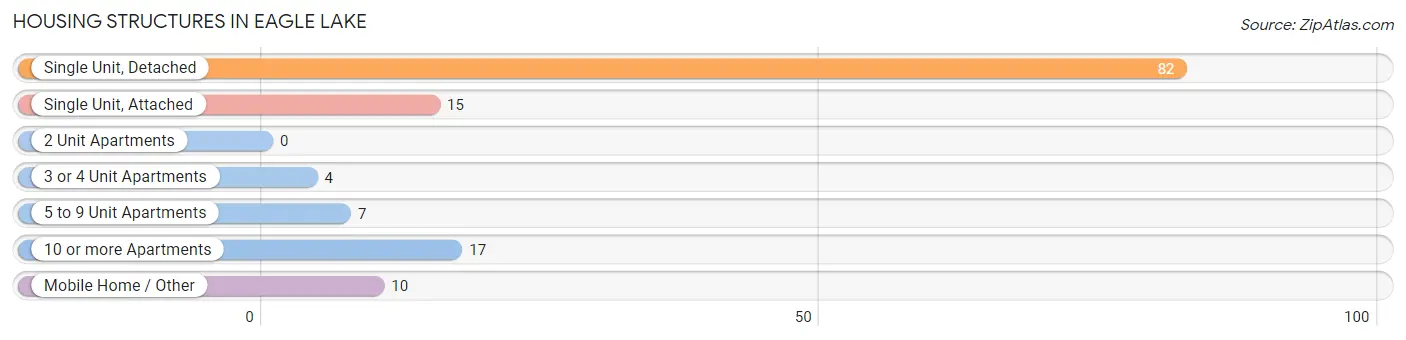
| Structure Type | # Housing Units | % Housing Units |
| Single Unit, Detached | 82 | 60.7% |
| Single Unit, Attached | 15 | 11.1% |
| 2 Unit Apartments | 0 | 0.0% |
| 3 or 4 Unit Apartments | 4 | 3.0% |
| 5 to 9 Unit Apartments | 7 | 5.2% |
| 10 or more Apartments | 17 | 12.6% |
| Mobile Home / Other | 10 | 7.4% |
| Total | 135 | 100.0% |
Housing Structures by Occupancy in Eagle Lake
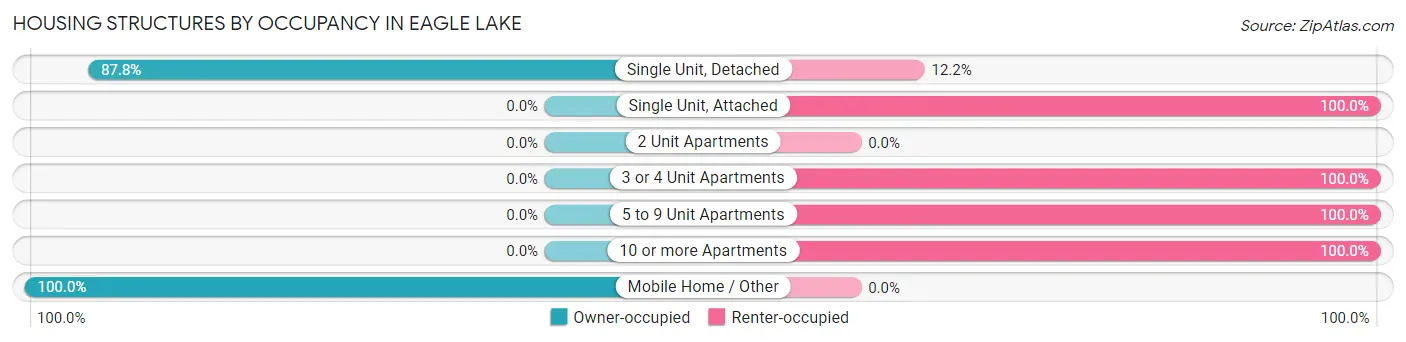
| Structure Type | Owner-occupied | Renter-occupied |
| Single Unit, Detached | 72 (87.8%) | 10 (12.2%) |
| Single Unit, Attached | 0 (0.0%) | 15 (100.0%) |
| 2 Unit Apartments | 0 (0.0%) | 0 (0.0%) |
| 3 or 4 Unit Apartments | 0 (0.0%) | 4 (100.0%) |
| 5 to 9 Unit Apartments | 0 (0.0%) | 7 (100.0%) |
| 10 or more Apartments | 0 (0.0%) | 17 (100.0%) |
| Mobile Home / Other | 10 (100.0%) | 0 (0.0%) |
| Total | 82 (60.7%) | 53 (39.3%) |
Housing Structures by Number of Rooms in Eagle Lake
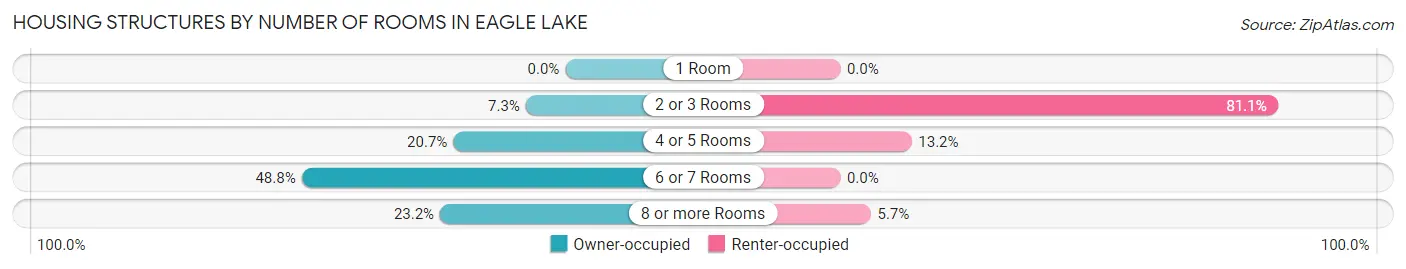
| Number of Rooms | Owner-occupied | Renter-occupied |
| 1 Room | 0 (0.0%) | 0 (0.0%) |
| 2 or 3 Rooms | 6 (7.3%) | 43 (81.1%) |
| 4 or 5 Rooms | 17 (20.7%) | 7 (13.2%) |
| 6 or 7 Rooms | 40 (48.8%) | 0 (0.0%) |
| 8 or more Rooms | 19 (23.2%) | 3 (5.7%) |
| Total | 82 (100.0%) | 53 (100.0%) |
Housing Structure by Heating Type in Eagle Lake
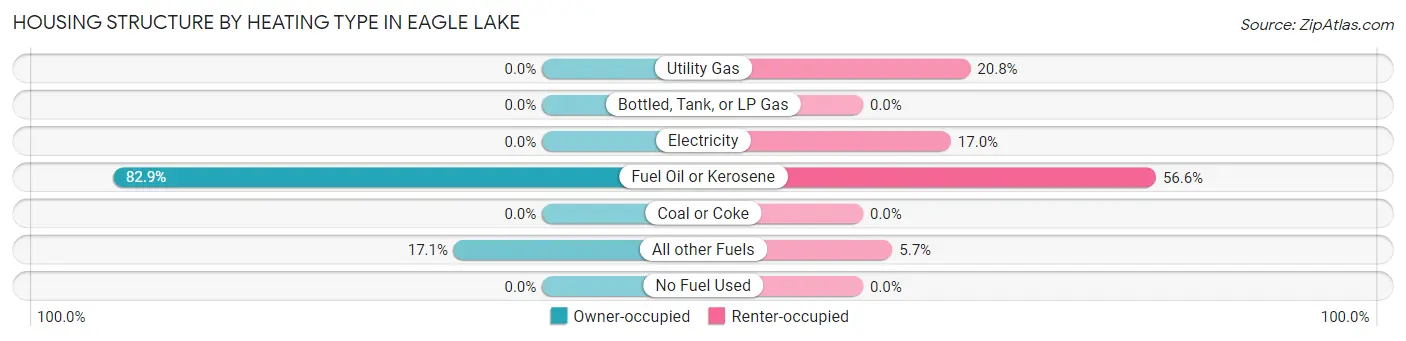
| Heating Type | Owner-occupied | Renter-occupied |
| Utility Gas | 0 (0.0%) | 11 (20.7%) |
| Bottled, Tank, or LP Gas | 0 (0.0%) | 0 (0.0%) |
| Electricity | 0 (0.0%) | 9 (17.0%) |
| Fuel Oil or Kerosene | 68 (82.9%) | 30 (56.6%) |
| Coal or Coke | 0 (0.0%) | 0 (0.0%) |
| All other Fuels | 14 (17.1%) | 3 (5.7%) |
| No Fuel Used | 0 (0.0%) | 0 (0.0%) |
| Total | 82 (100.0%) | 53 (100.0%) |
Household Vehicle Usage in Eagle Lake
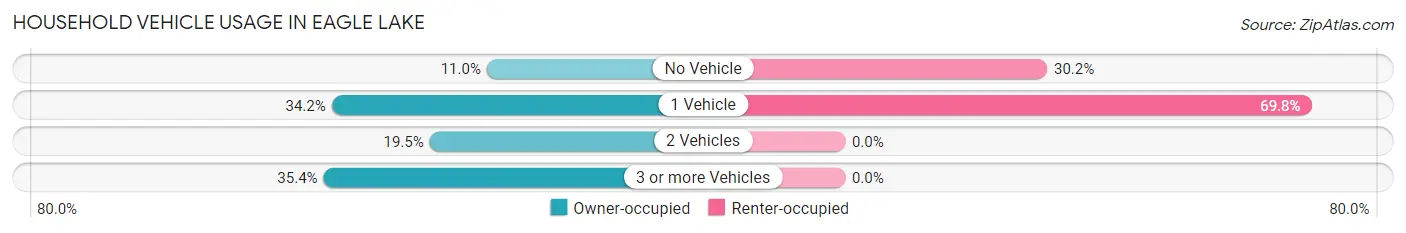
| Vehicles per Household | Owner-occupied | Renter-occupied |
| No Vehicle | 9 (11.0%) | 16 (30.2%) |
| 1 Vehicle | 28 (34.2%) | 37 (69.8%) |
| 2 Vehicles | 16 (19.5%) | 0 (0.0%) |
| 3 or more Vehicles | 29 (35.4%) | 0 (0.0%) |
| Total | 82 (100.0%) | 53 (100.0%) |
Real Estate & Mortgages in Eagle Lake
Real Estate and Mortgage Overview in Eagle Lake
| Characteristic | Without Mortgage | With Mortgage |
| Housing Units | 73 | 9 |
| Median Property Value | $103,800 | $0 |
| Median Household Income | $70,125 | $0 |
| Monthly Housing Costs | $573 | $0 |
| Real Estate Taxes | $1,539 | $0 |
Property Value by Mortgage Status in Eagle Lake
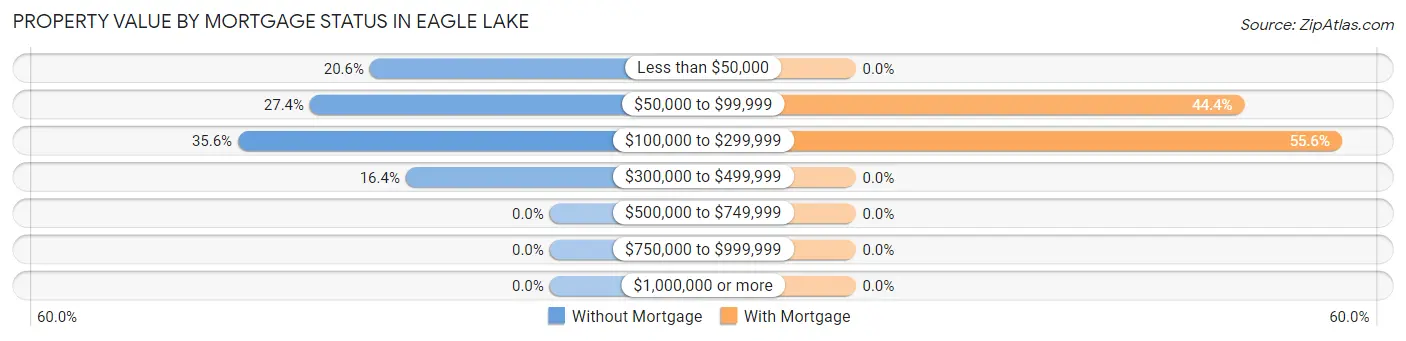
| Property Value | Without Mortgage | With Mortgage |
| Less than $50,000 | 15 (20.5%) | 0 (0.0%) |
| $50,000 to $99,999 | 20 (27.4%) | 4 (44.4%) |
| $100,000 to $299,999 | 26 (35.6%) | 5 (55.6%) |
| $300,000 to $499,999 | 12 (16.4%) | 0 (0.0%) |
| $500,000 to $749,999 | 0 (0.0%) | 0 (0.0%) |
| $750,000 to $999,999 | 0 (0.0%) | 0 (0.0%) |
| $1,000,000 or more | 0 (0.0%) | 0 (0.0%) |
| Total | 73 (100.0%) | 9 (100.0%) |
Household Income by Mortgage Status in Eagle Lake
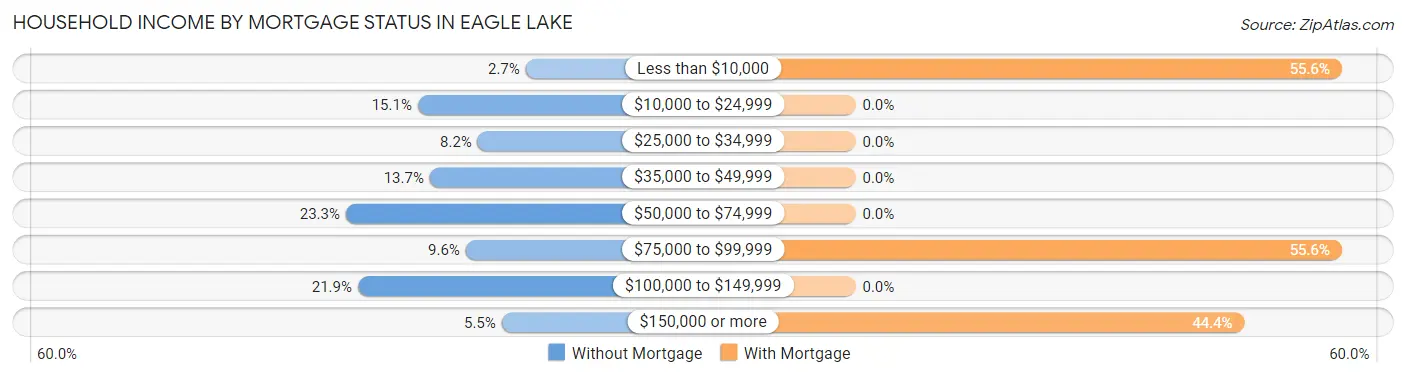
| Household Income | Without Mortgage | With Mortgage |
| Less than $10,000 | 2 (2.7%) | 5 (55.6%) |
| $10,000 to $24,999 | 11 (15.1%) | 0 (0.0%) |
| $25,000 to $34,999 | 6 (8.2%) | 0 (0.0%) |
| $35,000 to $49,999 | 10 (13.7%) | 0 (0.0%) |
| $50,000 to $74,999 | 17 (23.3%) | 0 (0.0%) |
| $75,000 to $99,999 | 7 (9.6%) | 5 (55.6%) |
| $100,000 to $149,999 | 16 (21.9%) | 0 (0.0%) |
| $150,000 or more | 4 (5.5%) | 4 (44.4%) |
| Total | 73 (100.0%) | 9 (100.0%) |
Property Value to Household Income Ratio in Eagle Lake
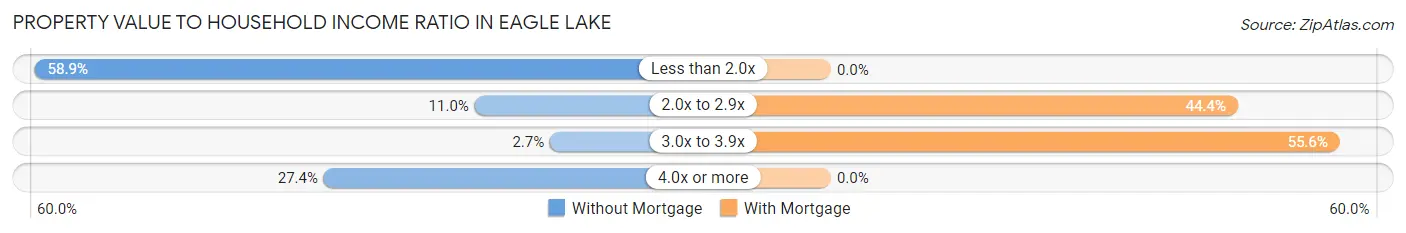
| Value-to-Income Ratio | Without Mortgage | With Mortgage |
| Less than 2.0x | 43 (58.9%) | 0 (0.0%) |
| 2.0x to 2.9x | 8 (11.0%) | 4 (44.4%) |
| 3.0x to 3.9x | 2 (2.7%) | 5 (55.6%) |
| 4.0x or more | 20 (27.4%) | 0 (0.0%) |
| Total | 73 (100.0%) | 9 (100.0%) |
Real Estate Taxes by Mortgage Status in Eagle Lake
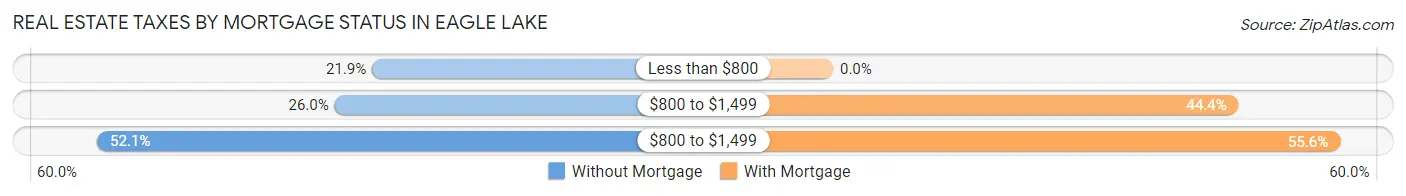
| Property Taxes | Without Mortgage | With Mortgage |
| Less than $800 | 16 (21.9%) | 0 (0.0%) |
| $800 to $1,499 | 19 (26.0%) | 4 (44.4%) |
| $800 to $1,499 | 38 (52.0%) | 5 (55.6%) |
| Total | 73 (100.0%) | 9 (100.0%) |
Health & Disability in Eagle Lake
Health Insurance Coverage by Age in Eagle Lake
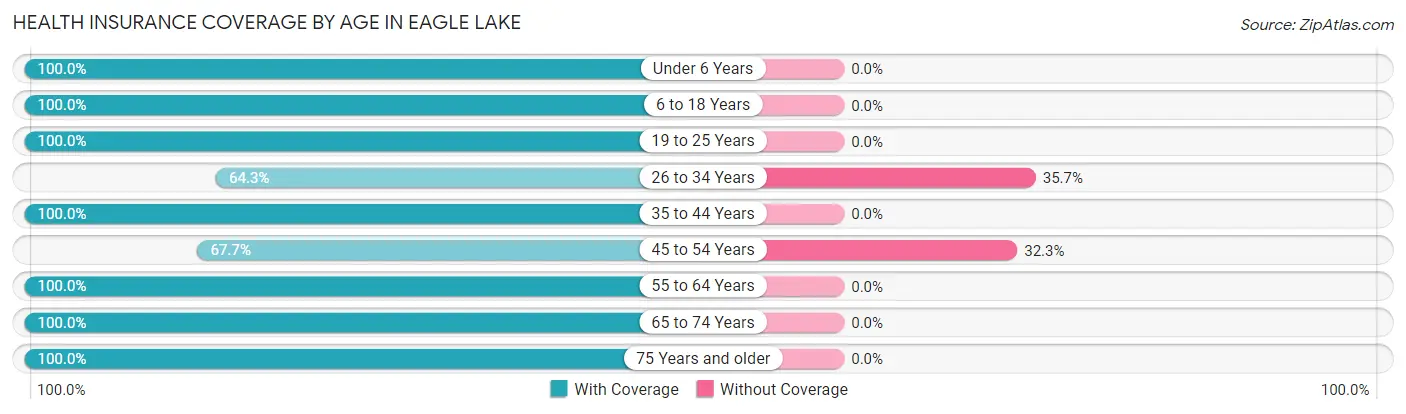
| Age Bracket | With Coverage | Without Coverage |
| Under 6 Years | 17 (100.0%) | 0 (0.0%) |
| 6 to 18 Years | 7 (100.0%) | 0 (0.0%) |
| 19 to 25 Years | 11 (100.0%) | 0 (0.0%) |
| 26 to 34 Years | 9 (64.3%) | 5 (35.7%) |
| 35 to 44 Years | 55 (100.0%) | 0 (0.0%) |
| 45 to 54 Years | 21 (67.7%) | 10 (32.3%) |
| 55 to 64 Years | 26 (100.0%) | 0 (0.0%) |
| 65 to 74 Years | 85 (100.0%) | 0 (0.0%) |
| 75 Years and older | 78 (100.0%) | 0 (0.0%) |
| Total | 309 (95.4%) | 15 (4.6%) |
Health Insurance Coverage by Citizenship Status in Eagle Lake
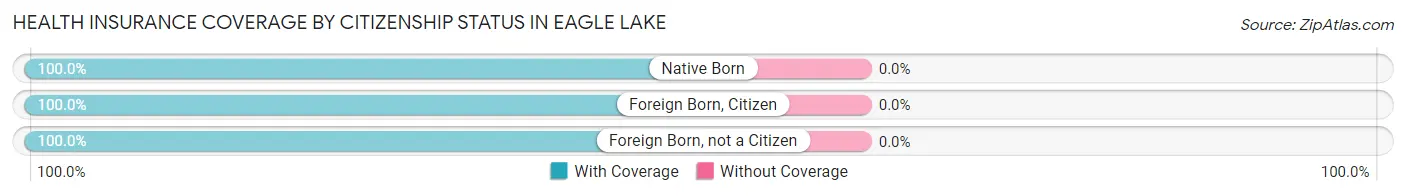
| Citizenship Status | With Coverage | Without Coverage |
| Native Born | 17 (100.0%) | 0 (0.0%) |
| Foreign Born, Citizen | 7 (100.0%) | 0 (0.0%) |
| Foreign Born, not a Citizen | 11 (100.0%) | 0 (0.0%) |
Health Insurance Coverage by Household Income in Eagle Lake
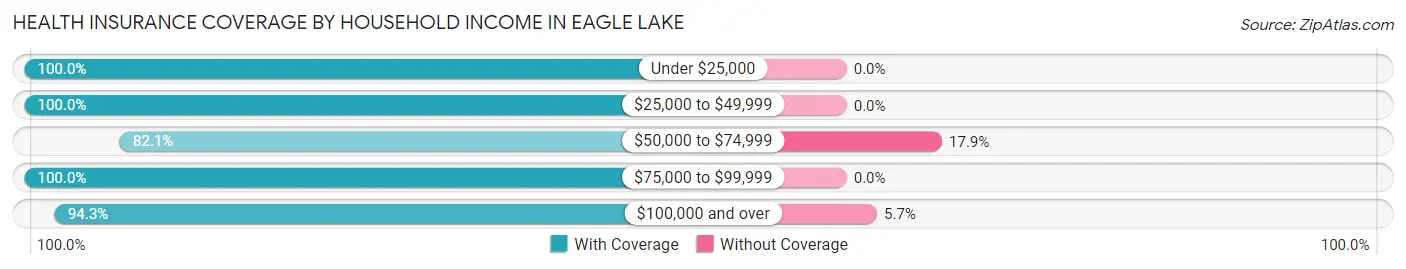
| Household Income | With Coverage | Without Coverage |
| Under $25,000 | 41 (100.0%) | 0 (0.0%) |
| $25,000 to $49,999 | 66 (100.0%) | 0 (0.0%) |
| $50,000 to $74,999 | 46 (82.1%) | 10 (17.9%) |
| $75,000 to $99,999 | 41 (100.0%) | 0 (0.0%) |
| $100,000 and over | 83 (94.3%) | 5 (5.7%) |
Public vs Private Health Insurance Coverage by Age in Eagle Lake
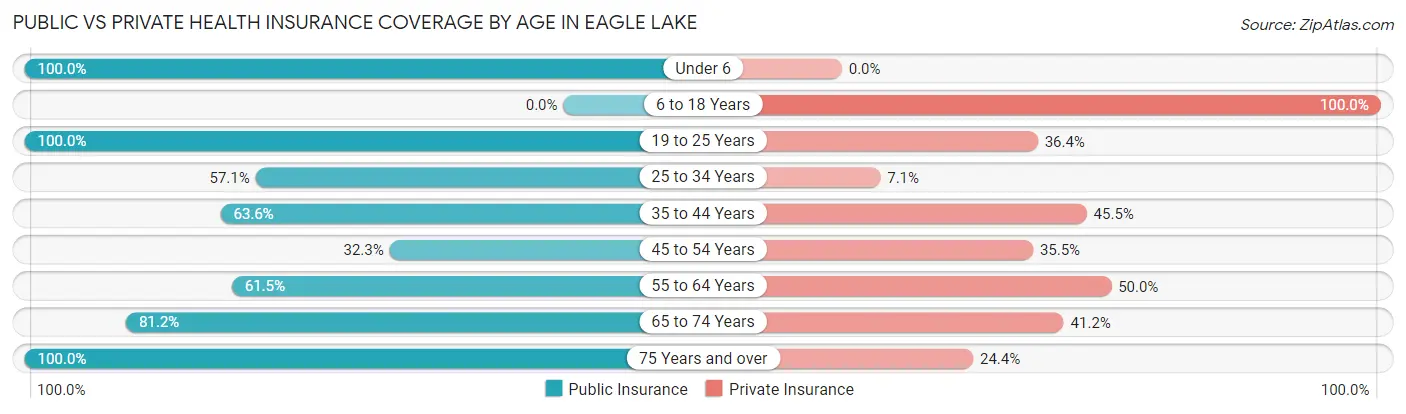
| Age Bracket | Public Insurance | Private Insurance |
| Under 6 | 17 (100.0%) | 0 (0.0%) |
| 6 to 18 Years | 0 (0.0%) | 7 (100.0%) |
| 19 to 25 Years | 11 (100.0%) | 4 (36.4%) |
| 25 to 34 Years | 8 (57.1%) | 1 (7.1%) |
| 35 to 44 Years | 35 (63.6%) | 25 (45.5%) |
| 45 to 54 Years | 10 (32.3%) | 11 (35.5%) |
| 55 to 64 Years | 16 (61.5%) | 13 (50.0%) |
| 65 to 74 Years | 69 (81.2%) | 35 (41.2%) |
| 75 Years and over | 78 (100.0%) | 19 (24.4%) |
| Total | 244 (75.3%) | 115 (35.5%) |
Disability Status by Sex by Age in Eagle Lake
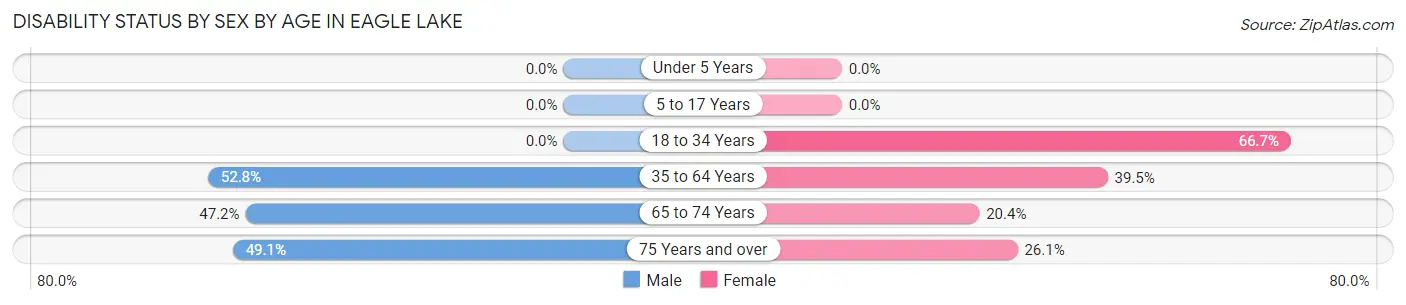
| Age Bracket | Male | Female |
| Under 5 Years | 0 (0.0%) | 0 (0.0%) |
| 5 to 17 Years | 0 (0.0%) | 0 (0.0%) |
| 18 to 34 Years | 0 (0.0%) | 8 (66.7%) |
| 35 to 64 Years | 19 (52.8%) | 30 (39.5%) |
| 65 to 74 Years | 17 (47.2%) | 10 (20.4%) |
| 75 Years and over | 27 (49.1%) | 6 (26.1%) |
Disability Class by Sex by Age in Eagle Lake
Disability Class: Hearing Difficulty
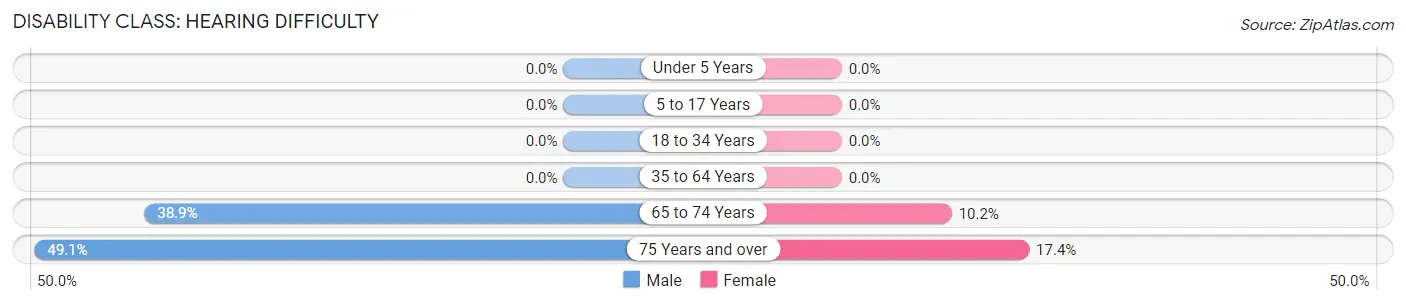
| Age Bracket | Male | Female |
| Under 5 Years | 0 (0.0%) | 0 (0.0%) |
| 5 to 17 Years | 0 (0.0%) | 0 (0.0%) |
| 18 to 34 Years | 0 (0.0%) | 0 (0.0%) |
| 35 to 64 Years | 0 (0.0%) | 0 (0.0%) |
| 65 to 74 Years | 14 (38.9%) | 5 (10.2%) |
| 75 Years and over | 27 (49.1%) | 4 (17.4%) |
Disability Class: Vision Difficulty
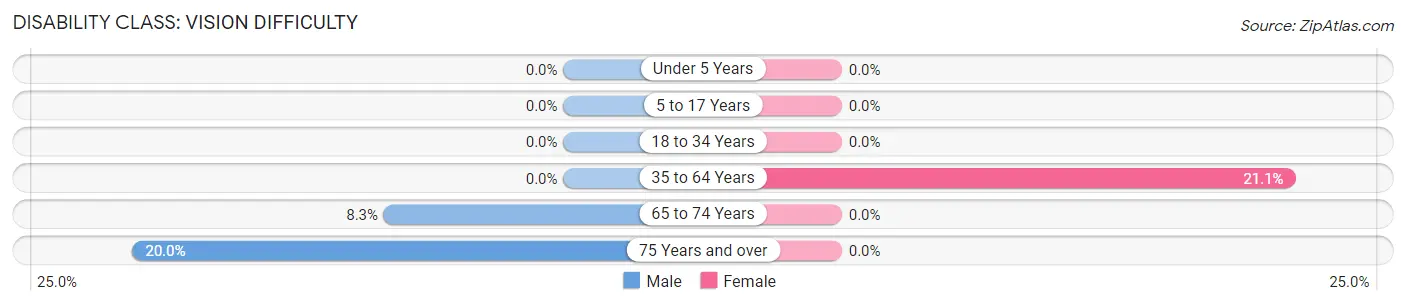
| Age Bracket | Male | Female |
| Under 5 Years | 0 (0.0%) | 0 (0.0%) |
| 5 to 17 Years | 0 (0.0%) | 0 (0.0%) |
| 18 to 34 Years | 0 (0.0%) | 0 (0.0%) |
| 35 to 64 Years | 0 (0.0%) | 16 (21.0%) |
| 65 to 74 Years | 3 (8.3%) | 0 (0.0%) |
| 75 Years and over | 11 (20.0%) | 0 (0.0%) |
Disability Class: Cognitive Difficulty
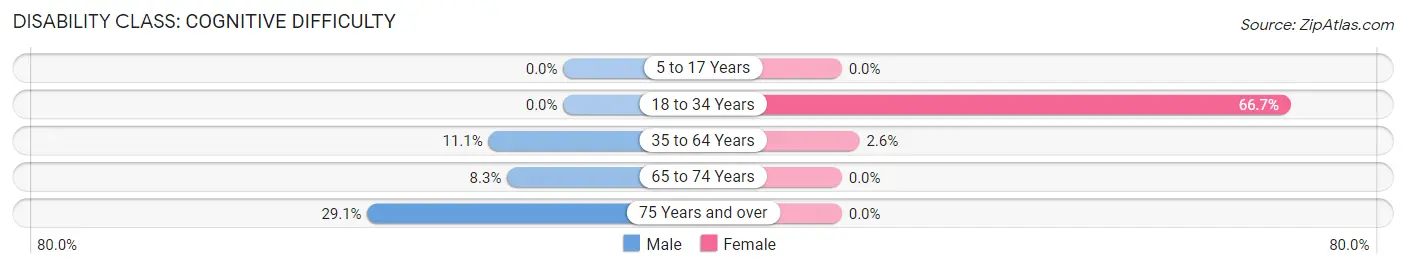
| Age Bracket | Male | Female |
| 5 to 17 Years | 0 (0.0%) | 0 (0.0%) |
| 18 to 34 Years | 0 (0.0%) | 8 (66.7%) |
| 35 to 64 Years | 4 (11.1%) | 2 (2.6%) |
| 65 to 74 Years | 3 (8.3%) | 0 (0.0%) |
| 75 Years and over | 16 (29.1%) | 0 (0.0%) |
Disability Class: Ambulatory Difficulty
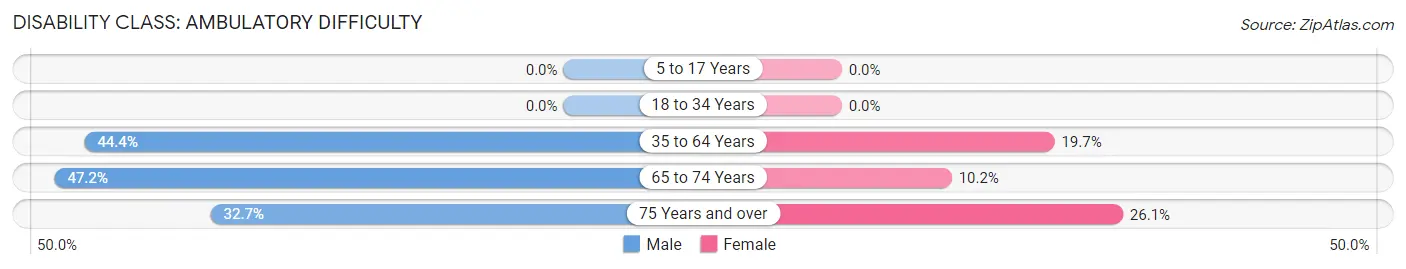
| Age Bracket | Male | Female |
| 5 to 17 Years | 0 (0.0%) | 0 (0.0%) |
| 18 to 34 Years | 0 (0.0%) | 0 (0.0%) |
| 35 to 64 Years | 16 (44.4%) | 15 (19.7%) |
| 65 to 74 Years | 17 (47.2%) | 5 (10.2%) |
| 75 Years and over | 18 (32.7%) | 6 (26.1%) |
Disability Class: Self-Care Difficulty
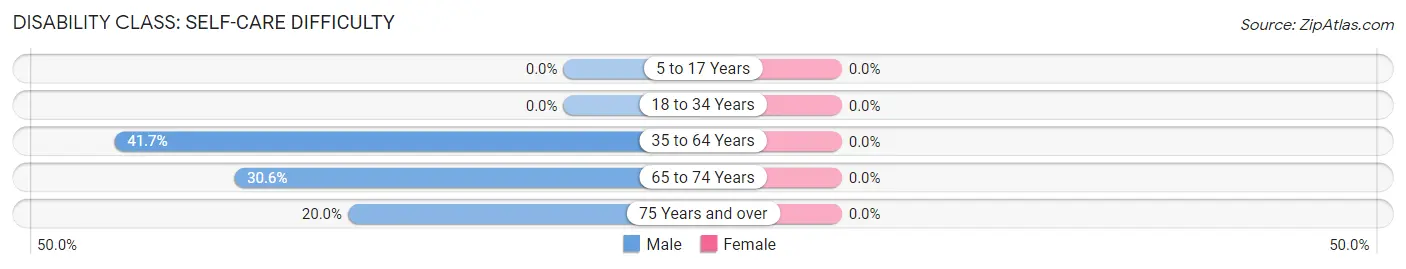
| Age Bracket | Male | Female |
| 5 to 17 Years | 0 (0.0%) | 0 (0.0%) |
| 18 to 34 Years | 0 (0.0%) | 0 (0.0%) |
| 35 to 64 Years | 15 (41.7%) | 0 (0.0%) |
| 65 to 74 Years | 11 (30.6%) | 0 (0.0%) |
| 75 Years and over | 11 (20.0%) | 0 (0.0%) |
Technology Access in Eagle Lake
Computing Device Access in Eagle Lake
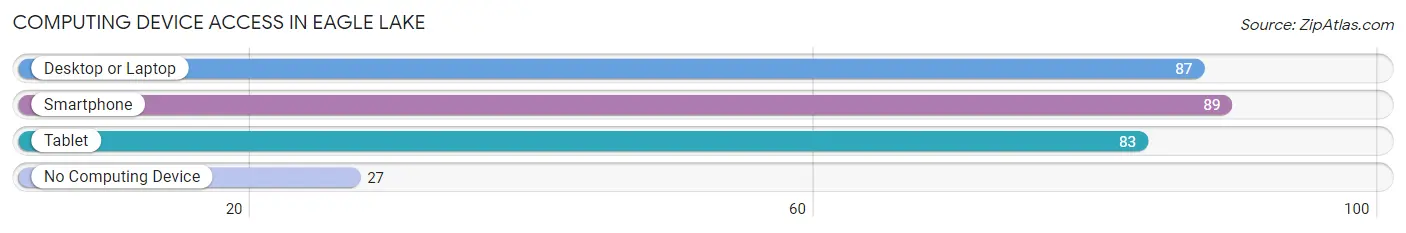
| Device Type | # Households | % Households |
| Desktop or Laptop | 87 | 64.4% |
| Smartphone | 89 | 65.9% |
| Tablet | 83 | 61.5% |
| No Computing Device | 27 | 20.0% |
| Total | 135 | 100.0% |
Internet Access in Eagle Lake
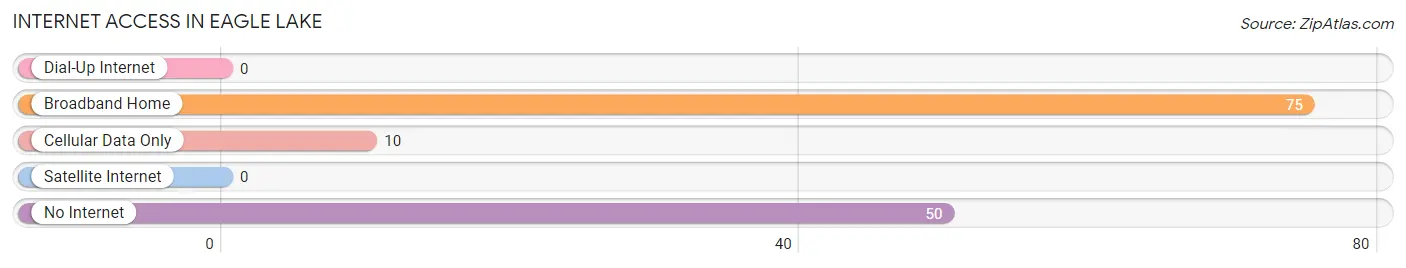
| Internet Type | # Households | % Households |
| Dial-Up Internet | 0 | 0.0% |
| Broadband Home | 75 | 55.6% |
| Cellular Data Only | 10 | 7.4% |
| Satellite Internet | 0 | 0.0% |
| No Internet | 50 | 37.0% |
| Total | 135 | 100.0% |
Eagle Lake Summary
Eagle Lake is a small town located in Aroostook County, Maine, United States. It is situated on the northern shore of Eagle Lake, a large body of water that is part of the Allagash Wilderness Waterway. The town is home to a population of approximately 500 people, and is a popular destination for outdoor recreation.
History
The area around Eagle Lake has been inhabited for thousands of years by the Wabanaki people, who used the lake for fishing and hunting. The first European settlers arrived in the area in the early 19th century, and the town was officially incorporated in 1845. The town was named after the lake, which was named for the large number of bald eagles that lived in the area.
In the late 19th century, the town became a popular destination for sportsmen, who came to hunt and fish in the area. The town also became a popular destination for vacationers, who came to enjoy the lake and the surrounding wilderness.
Geography
Eagle Lake is located in northern Maine, in Aroostook County. The town is situated on the northern shore of Eagle Lake, a large body of water that is part of the Allagash Wilderness Waterway. The lake is approximately 8 miles long and 2 miles wide, and is surrounded by dense forests. The town is located approximately 30 miles north of the city of Presque Isle.
The town is located in a rural area, and is surrounded by forests and lakes. The nearest major city is Bangor, which is located approximately 100 miles to the south.
Economy
The economy of Eagle Lake is largely based on tourism and outdoor recreation. The town is a popular destination for fishing, hunting, and other outdoor activities. The town is also home to several small businesses, including a general store, a restaurant, and a few small shops.
Demographics
As of the 2010 census, the population of Eagle Lake was 498. The racial makeup of the town was 97.2% White, 0.2% African American, 0.4% Native American, 0.2% Asian, 0.2% from other races, and 1.8% from two or more races. Hispanic or Latino of any race were 0.6% of the population.
The median household income in Eagle Lake was $35,000, and the median family income was $41,000. The per capita income for the town was $17,000. About 11.2% of families and 14.2% of the population were below the poverty line, including 18.2% of those under age 18 and 8.2% of those age 65 or over.
Common Questions
What is Per Capita Income in Eagle Lake?
Per Capita income in Eagle Lake is $27,295.
What is the Median Family Income in Eagle Lake?
Median Family Income in Eagle Lake is $59,750.
What is the Median Household income in Eagle Lake?
Median Household Income in Eagle Lake is $37,813.
What is Inequality or Gini Index in Eagle Lake?
Inequality or Gini Index in Eagle Lake is 0.45.
What is the Total Population of Eagle Lake?
Total Population of Eagle Lake is 383.
What is the Total Male Population of Eagle Lake?
Total Male Population of Eagle Lake is 182.
What is the Total Female Population of Eagle Lake?
Total Female Population of Eagle Lake is 201.
What is the Ratio of Males per 100 Females in Eagle Lake?
There are 90.55 Males per 100 Females in Eagle Lake.
What is the Ratio of Females per 100 Males in Eagle Lake?
There are 110.44 Females per 100 Males in Eagle Lake.
What is the Median Population Age in Eagle Lake?
Median Population Age in Eagle Lake is 67.4 Years.
What is the Average Family Size in Eagle Lake
Average Family Size in Eagle Lake is 2.7 People.
What is the Average Household Size in Eagle Lake
Average Household Size in Eagle Lake is 2.2 People.
How Large is the Labor Force in Eagle Lake?
There are 72 People in the Labor Forcein in Eagle Lake.
What is the Percentage of People in the Labor Force in Eagle Lake?
19.8% of People are in the Labor Force in Eagle Lake.
What is the Unemployment Rate in Eagle Lake?
Unemployment Rate in Eagle Lake is 12.5%.