Hartland, ME Map & Demographics
Hartland Map
Hartland Overview
$28,007
PER CAPITA INCOME
$58,889
AVG FAMILY INCOME
$49,521
AVG HOUSEHOLD INCOME
6.2%
WAGE / INCOME GAP [ % ]
93.8¢/ $1
WAGE / INCOME GAP [ $ ]
0.45
INEQUALITY / GINI INDEX
603
TOTAL POPULATION
273
MALE POPULATION
330
FEMALE POPULATION
82.73
MALES / 100 FEMALES
120.88
FEMALES / 100 MALES
48.5
MEDIAN AGE
2.8
AVG FAMILY SIZE
2.4
AVG HOUSEHOLD SIZE
272
LABOR FORCE [ PEOPLE ]
51.8%
PERCENT IN LABOR FORCE
2.6%
UNEMPLOYMENT RATE
Hartland Zip Codes
Hartland Area Codes
Income in Hartland
Income Overview in Hartland
Per Capita Income in Hartland is $28,007, while median incomes of families and households are $58,889 and $49,521 respectively.
| Characteristic | Number | Measure |
| Per Capita Income | 603 | $28,007 |
| Median Family Income | 134 | $58,889 |
| Mean Family Income | 134 | $91,987 |
| Median Household Income | 230 | $49,521 |
| Mean Household Income | 230 | $72,873 |
| Income Deficit | 134 | $0 |
| Wage / Income Gap (%) | 603 | 6.19% |
| Wage / Income Gap ($) | 603 | 93.81¢ per $1 |
| Gini / Inequality Index | 603 | 0.45 |
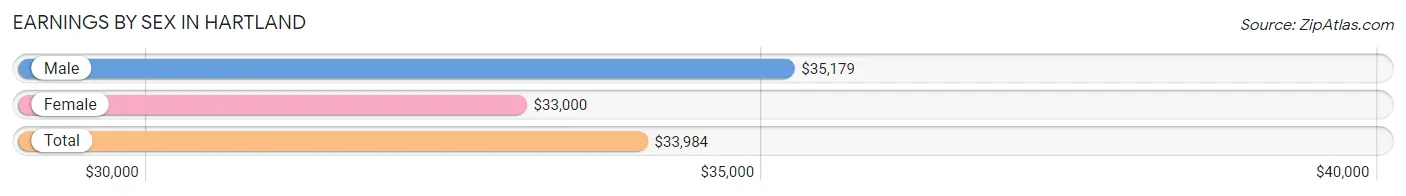
Earnings by Sex in Hartland
Average Earnings in Hartland are $33,984, $35,179 for men and $33,000 for women, a difference of 6.2%.
| Sex | Number | Average Earnings |
| Male | 173 (59.9%) | $35,179 |
| Female | 116 (40.1%) | $33,000 |
| Total | 289 (100.0%) | $33,984 |
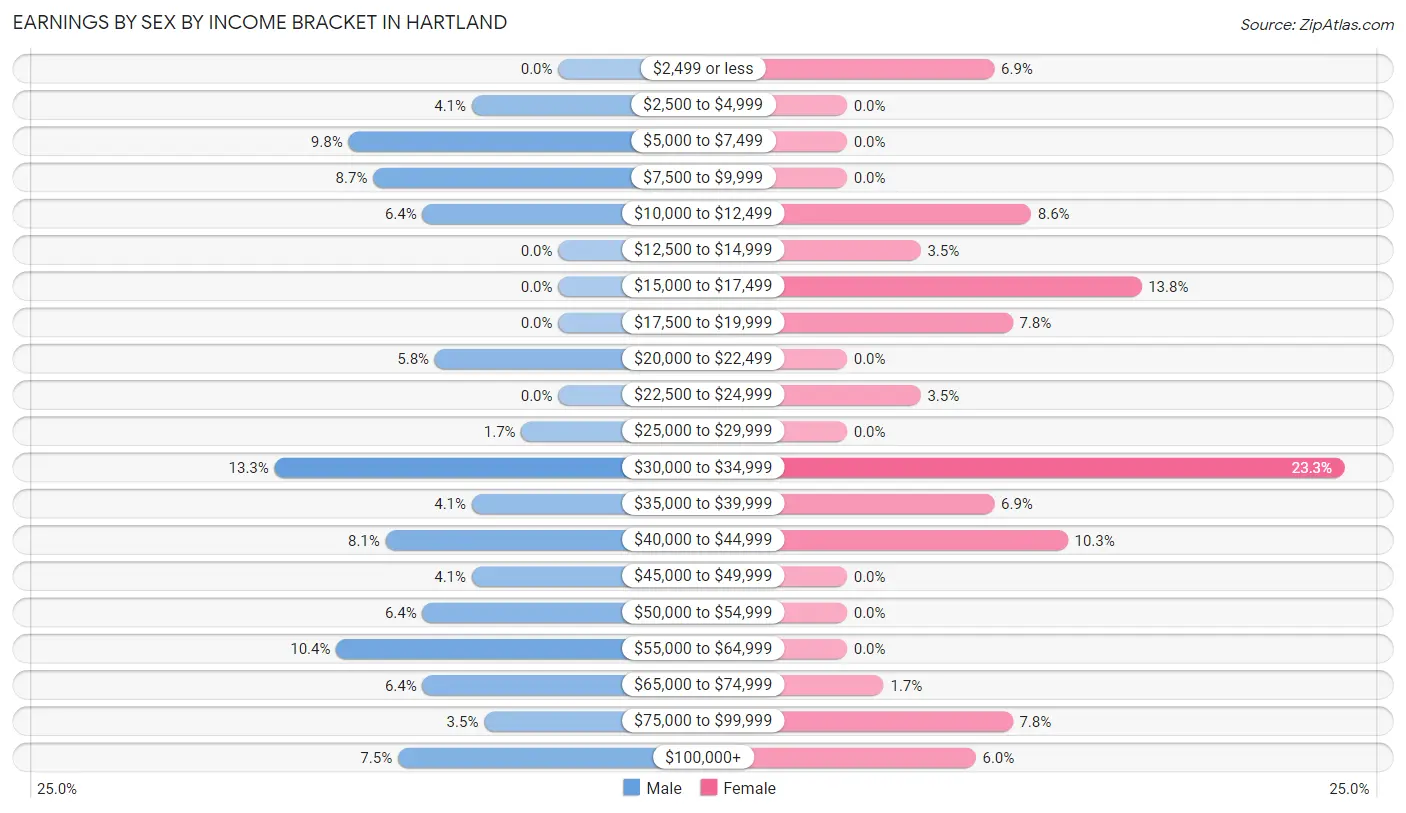
Earnings by Sex by Income Bracket in Hartland
The most common earnings brackets in Hartland are $30,000 to $34,999 for men (23 | 13.3%) and $30,000 to $34,999 for women (27 | 23.3%).
| Income | Male | Female |
| $2,499 or less | 0 (0.0%) | 8 (6.9%) |
| $2,500 to $4,999 | 7 (4.1%) | 0 (0.0%) |
| $5,000 to $7,499 | 17 (9.8%) | 0 (0.0%) |
| $7,500 to $9,999 | 15 (8.7%) | 0 (0.0%) |
| $10,000 to $12,499 | 11 (6.4%) | 10 (8.6%) |
| $12,500 to $14,999 | 0 (0.0%) | 4 (3.5%) |
| $15,000 to $17,499 | 0 (0.0%) | 16 (13.8%) |
| $17,500 to $19,999 | 0 (0.0%) | 9 (7.8%) |
| $20,000 to $22,499 | 10 (5.8%) | 0 (0.0%) |
| $22,500 to $24,999 | 0 (0.0%) | 4 (3.5%) |
| $25,000 to $29,999 | 3 (1.7%) | 0 (0.0%) |
| $30,000 to $34,999 | 23 (13.3%) | 27 (23.3%) |
| $35,000 to $39,999 | 7 (4.1%) | 8 (6.9%) |
| $40,000 to $44,999 | 14 (8.1%) | 12 (10.3%) |
| $45,000 to $49,999 | 7 (4.1%) | 0 (0.0%) |
| $50,000 to $54,999 | 11 (6.4%) | 0 (0.0%) |
| $55,000 to $64,999 | 18 (10.4%) | 0 (0.0%) |
| $65,000 to $74,999 | 11 (6.4%) | 2 (1.7%) |
| $75,000 to $99,999 | 6 (3.5%) | 9 (7.8%) |
| $100,000+ | 13 (7.5%) | 7 (6.0%) |
| Total | 173 (100.0%) | 116 (100.0%) |
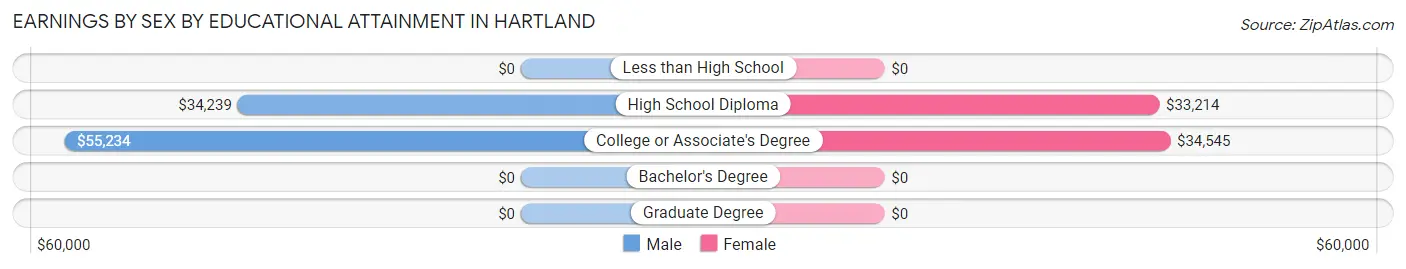
Earnings by Sex by Educational Attainment in Hartland
Average earnings in Hartland are $41,161 for men and $34,050 for women, a difference of 17.3%. Men with an educational attainment of college or associate's degree enjoy the highest average annual earnings of $55,234, while those with high school diploma education earn the least with $34,239. Women with an educational attainment of college or associate's degree earn the most with the average annual earnings of $34,545, while those with high school diploma education have the smallest earnings of $33,214.
| Educational Attainment | Male Income | Female Income |
| Less than High School | - | - |
| High School Diploma | $34,239 | $33,214 |
| College or Associate's Degree | $55,234 | $34,545 |
| Bachelor's Degree | - | - |
| Graduate Degree | - | - |
| Total | $41,161 | $34,050 |
Family Income in Hartland
Family Income Brackets in Hartland
According to the Hartland family income data, there are 31 families falling into the $75,000 to $99,999 income range, which is the most common income bracket and makes up 23.1% of all families.
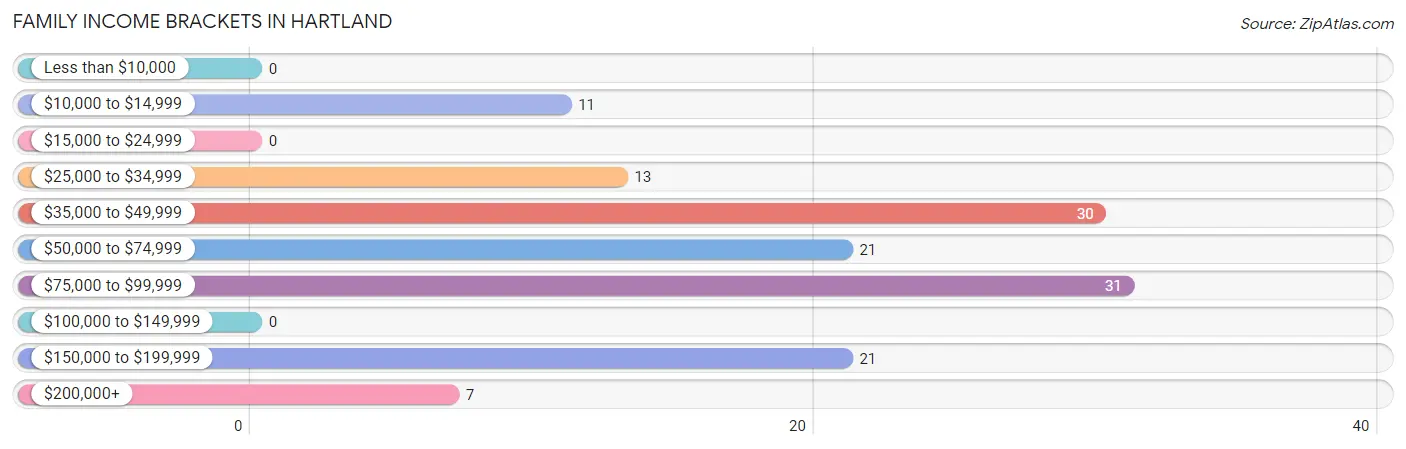
| Income Bracket | # Families | % Families |
| Less than $10,000 | 0 | 0.0% |
| $10,000 to $14,999 | 11 | 8.2% |
| $15,000 to $24,999 | 0 | 0.0% |
| $25,000 to $34,999 | 13 | 9.7% |
| $35,000 to $49,999 | 30 | 22.4% |
| $50,000 to $74,999 | 21 | 15.7% |
| $75,000 to $99,999 | 31 | 23.1% |
| $100,000 to $149,999 | 0 | 0.0% |
| $150,000 to $199,999 | 21 | 15.7% |
| $200,000+ | 7 | 5.2% |
Family Income by Famaliy Size in Hartland
2-person families (86 | 64.2%) account for the highest median family income in Hartland with $49,083 per family, while 2-person families (86 | 64.2%) have the highest median income of $24,542 per family member.
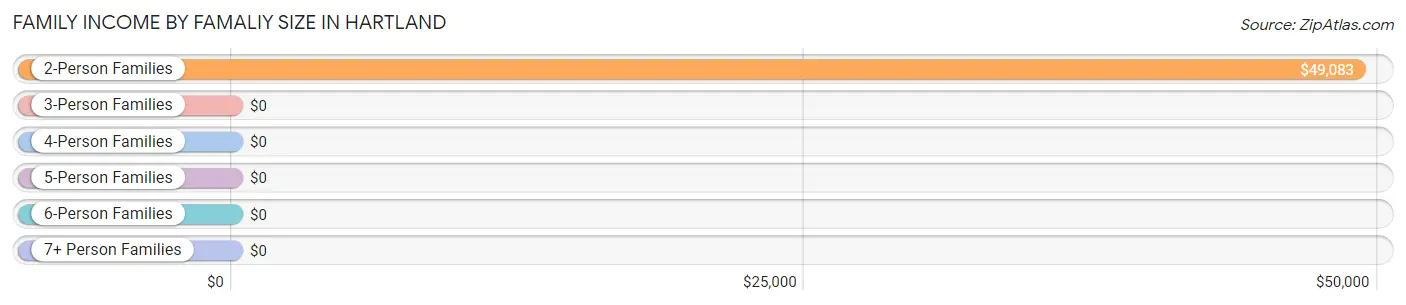
| Income Bracket | # Families | Median Income |
| 2-Person Families | 86 (64.2%) | $49,083 |
| 3-Person Families | 14 (10.4%) | $0 |
| 4-Person Families | 15 (11.2%) | $0 |
| 5-Person Families | 11 (8.2%) | $0 |
| 6-Person Families | 8 (6.0%) | $0 |
| 7+ Person Families | 0 (0.0%) | $0 |
| Total | 134 (100.0%) | $58,889 |
Family Income by Number of Earners in Hartland
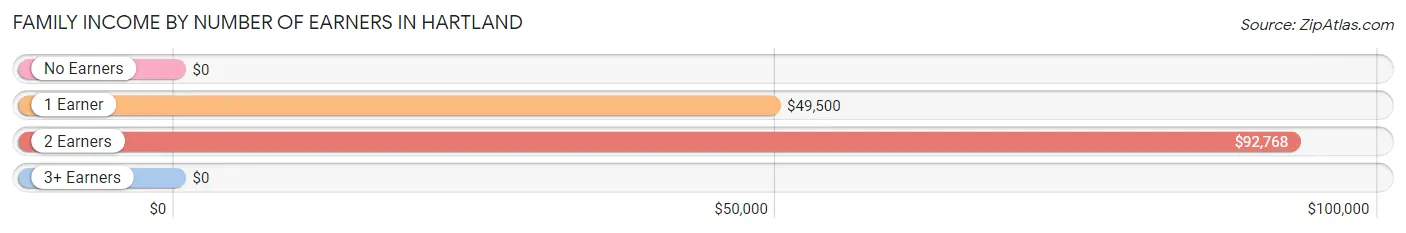
| Number of Earners | # Families | Median Income |
| No Earners | 6 (4.5%) | $0 |
| 1 Earner | 70 (52.2%) | $49,500 |
| 2 Earners | 43 (32.1%) | $92,768 |
| 3+ Earners | 15 (11.2%) | $0 |
| Total | 134 (100.0%) | $58,889 |
Household Income in Hartland
Household Income Brackets in Hartland
With 64 households falling in the category, the $35,000 to $49,999 income range is the most frequent in Hartland, accounting for 27.8% of all households. In contrast, only 3 households (1.3%) fall into the less than $10,000 income bracket, making it the least populous group.
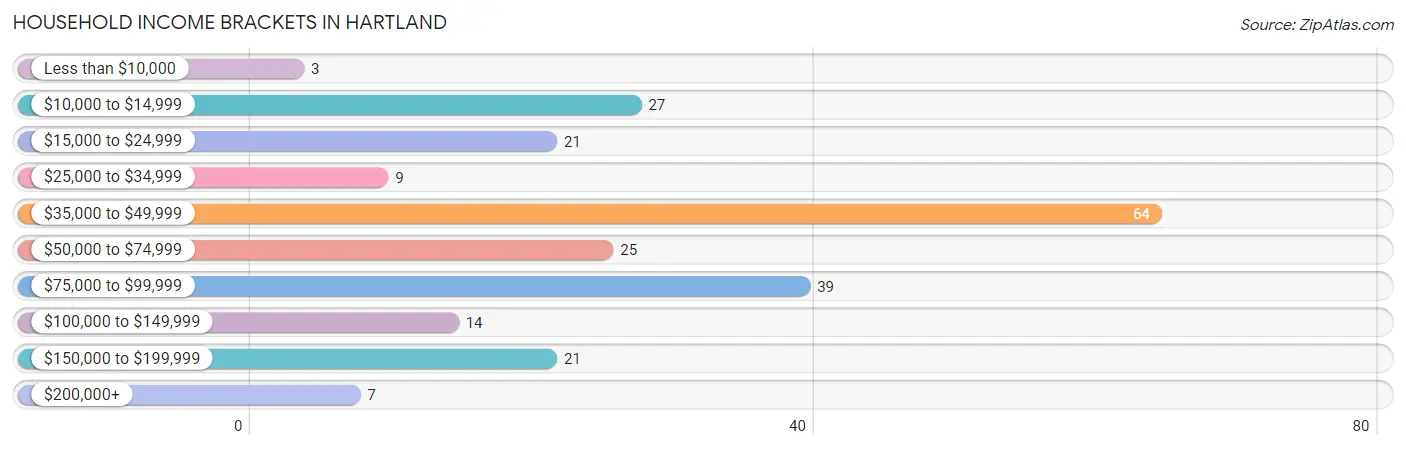
| Income Bracket | # Households | % Households |
| Less than $10,000 | 3 | 1.3% |
| $10,000 to $14,999 | 27 | 11.7% |
| $15,000 to $24,999 | 21 | 9.1% |
| $25,000 to $34,999 | 9 | 3.9% |
| $35,000 to $49,999 | 64 | 27.8% |
| $50,000 to $74,999 | 25 | 10.9% |
| $75,000 to $99,999 | 39 | 17.0% |
| $100,000 to $149,999 | 14 | 6.1% |
| $150,000 to $199,999 | 21 | 9.1% |
| $200,000+ | 7 | 3.0% |
Household Income by Householder Age in Hartland
The median household income in Hartland is $49,521, with the highest median household income of $86,667 found in the 25 to 44 years age bracket for the primary householder. A total of 64 households (27.8%) fall into this category. Meanwhile, the 15 to 24 years age bracket for the primary householder has the lowest median household income of $0, with 11 households (4.8%) in this group.
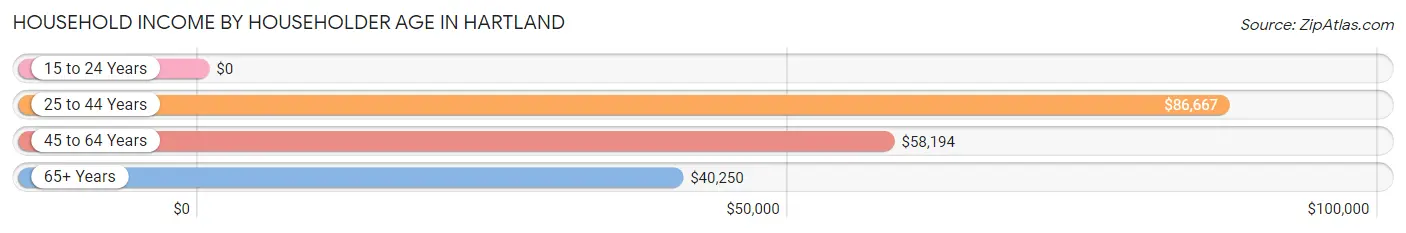
| Income Bracket | # Households | Median Income |
| 15 to 24 Years | 11 (4.8%) | $0 |
| 25 to 44 Years | 64 (27.8%) | $86,667 |
| 45 to 64 Years | 112 (48.7%) | $58,194 |
| 65+ Years | 43 (18.7%) | $40,250 |
| Total | 230 (100.0%) | $49,521 |
Poverty in Hartland
Income Below Poverty by Sex and Age in Hartland
With 10.8% poverty level for males and 22.9% for females among the residents of Hartland, 18 to 24 year old males and 16 and 17 year old females are the most vulnerable to poverty, with 11 males (42.3%) and 23 females (74.2%) in their respective age groups living below the poverty level.
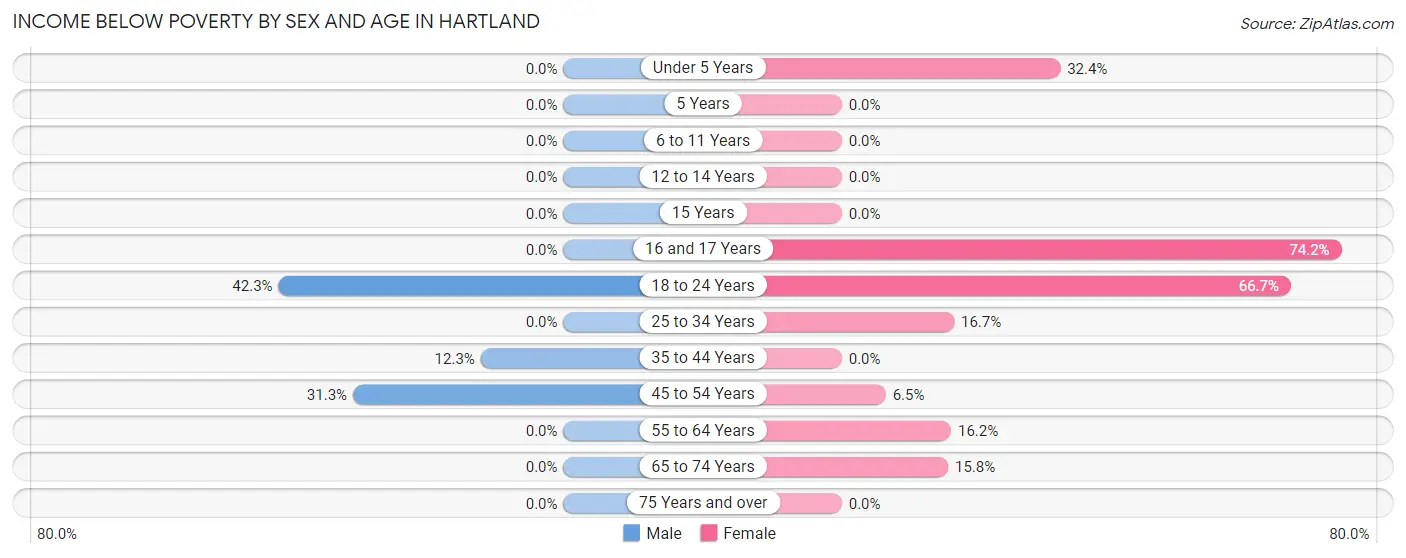
| Age Bracket | Male | Female |
| Under 5 Years | 0 (0.0%) | 12 (32.4%) |
| 5 Years | 0 (0.0%) | 0 (0.0%) |
| 6 to 11 Years | 0 (0.0%) | 0 (0.0%) |
| 12 to 14 Years | 0 (0.0%) | 0 (0.0%) |
| 15 Years | 0 (0.0%) | 0 (0.0%) |
| 16 and 17 Years | 0 (0.0%) | 23 (74.2%) |
| 18 to 24 Years | 11 (42.3%) | 18 (66.7%) |
| 25 to 34 Years | 0 (0.0%) | 4 (16.7%) |
| 35 to 44 Years | 7 (12.3%) | 0 (0.0%) |
| 45 to 54 Years | 10 (31.2%) | 3 (6.5%) |
| 55 to 64 Years | 0 (0.0%) | 6 (16.2%) |
| 65 to 74 Years | 0 (0.0%) | 3 (15.8%) |
| 75 Years and over | 0 (0.0%) | 0 (0.0%) |
| Total | 28 (10.8%) | 69 (22.9%) |
Income Above Poverty by Sex and Age in Hartland
According to the poverty statistics in Hartland, males aged 6 to 11 years and females aged 5 years are the age groups that are most secure financially, with 100.0% of males and 100.0% of females in these age groups living above the poverty line.
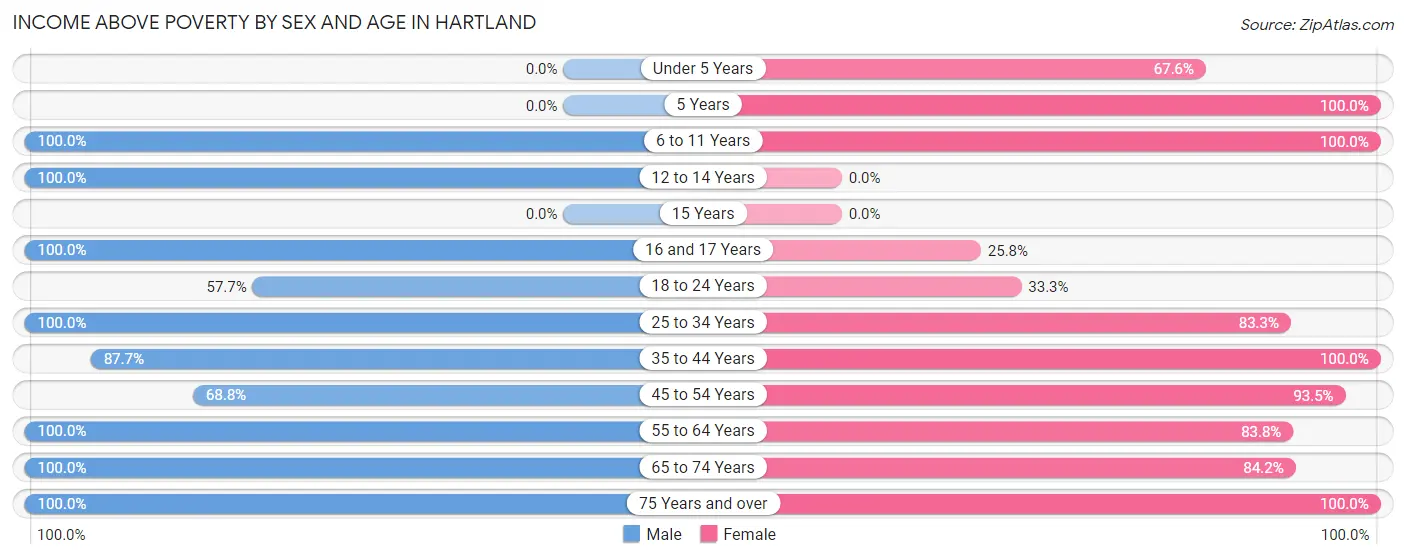
| Age Bracket | Male | Female |
| Under 5 Years | 0 (0.0%) | 25 (67.6%) |
| 5 Years | 0 (0.0%) | 4 (100.0%) |
| 6 to 11 Years | 9 (100.0%) | 19 (100.0%) |
| 12 to 14 Years | 9 (100.0%) | 0 (0.0%) |
| 15 Years | 0 (0.0%) | 0 (0.0%) |
| 16 and 17 Years | 6 (100.0%) | 8 (25.8%) |
| 18 to 24 Years | 15 (57.7%) | 9 (33.3%) |
| 25 to 34 Years | 13 (100.0%) | 20 (83.3%) |
| 35 to 44 Years | 50 (87.7%) | 31 (100.0%) |
| 45 to 54 Years | 22 (68.8%) | 43 (93.5%) |
| 55 to 64 Years | 75 (100.0%) | 31 (83.8%) |
| 65 to 74 Years | 17 (100.0%) | 16 (84.2%) |
| 75 Years and over | 14 (100.0%) | 27 (100.0%) |
| Total | 230 (89.1%) | 233 (77.1%) |
Income Below Poverty Among Married-Couple Families in Hartland
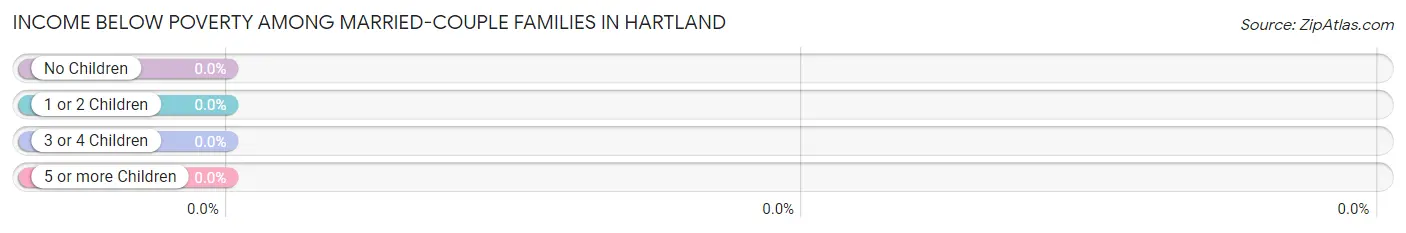
| Children | Above Poverty | Below Poverty |
| No Children | 68 (100.0%) | 0 (0.0%) |
| 1 or 2 Children | 7 (100.0%) | 0 (0.0%) |
| 3 or 4 Children | 4 (100.0%) | 0 (0.0%) |
| 5 or more Children | 0 (0.0%) | 0 (0.0%) |
| Total | 79 (100.0%) | 0 (0.0%) |
Income Below Poverty Among Single-Parent Households in Hartland
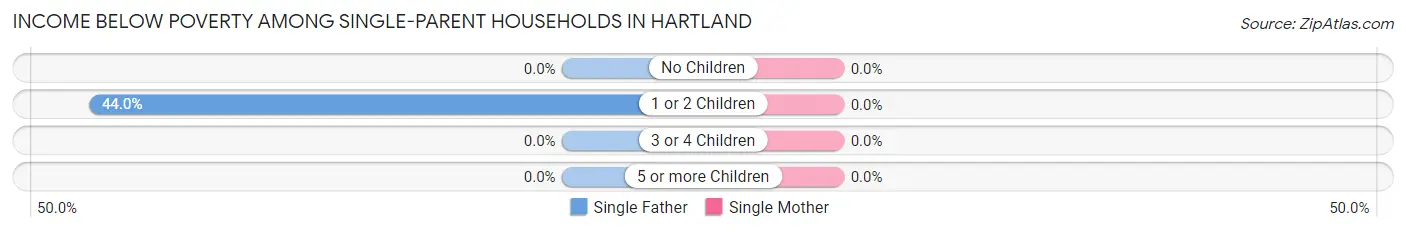
| Children | Single Father | Single Mother |
| No Children | 0 (0.0%) | 0 (0.0%) |
| 1 or 2 Children | 11 (44.0%) | 0 (0.0%) |
| 3 or 4 Children | 0 (0.0%) | 0 (0.0%) |
| 5 or more Children | 0 (0.0%) | 0 (0.0%) |
| Total | 11 (28.9%) | 0 (0.0%) |
Income Below Poverty Among Married-Couple vs Single-Parent Households in Hartland
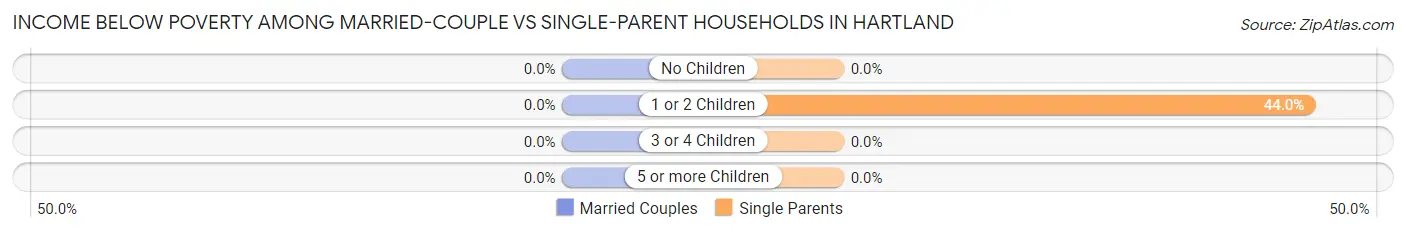
| Children | Married-Couple Families | Single-Parent Households |
| No Children | 0 (0.0%) | 0 (0.0%) |
| 1 or 2 Children | 0 (0.0%) | 11 (44.0%) |
| 3 or 4 Children | 0 (0.0%) | 0 (0.0%) |
| 5 or more Children | 0 (0.0%) | 0 (0.0%) |
| Total | 0 (0.0%) | 11 (20.0%) |
Race in Hartland
The most populous races in Hartland are White / Caucasian (599 | 99.3%), and Native / Alaskan (4 | 0.7%).
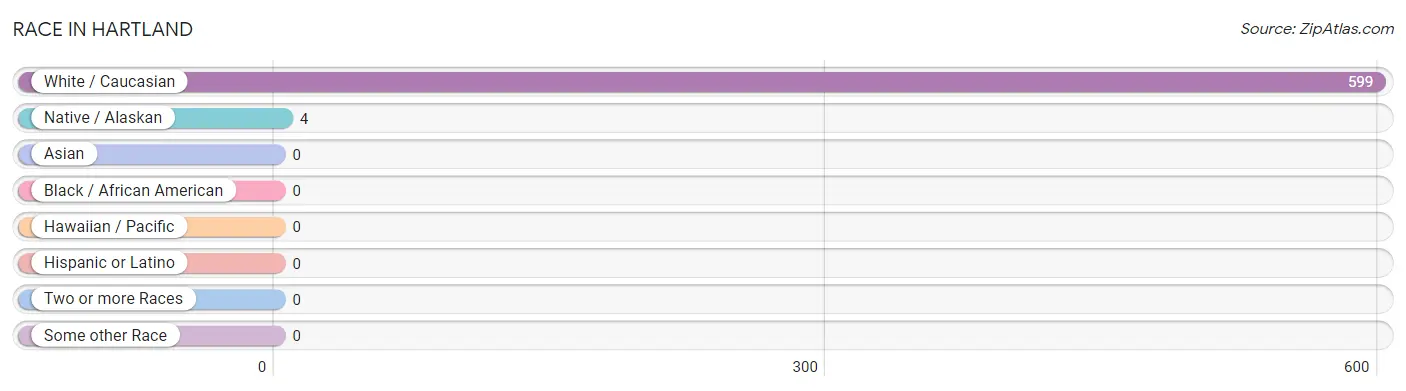
| Race | # Population | % Population |
| Asian | 0 | 0.0% |
| Black / African American | 0 | 0.0% |
| Hawaiian / Pacific | 0 | 0.0% |
| Hispanic or Latino | 0 | 0.0% |
| Native / Alaskan | 4 | 0.7% |
| White / Caucasian | 599 | 99.3% |
| Two or more Races | 0 | 0.0% |
| Some other Race | 0 | 0.0% |
| Total | 603 | 100.0% |
Ancestry in Hartland
The most populous ancestries reported in Hartland are English (139 | 23.1%), American (48 | 8.0%), Irish (47 | 7.8%), German (36 | 6.0%), and French (25 | 4.2%), together accounting for 48.9% of all Hartland residents.
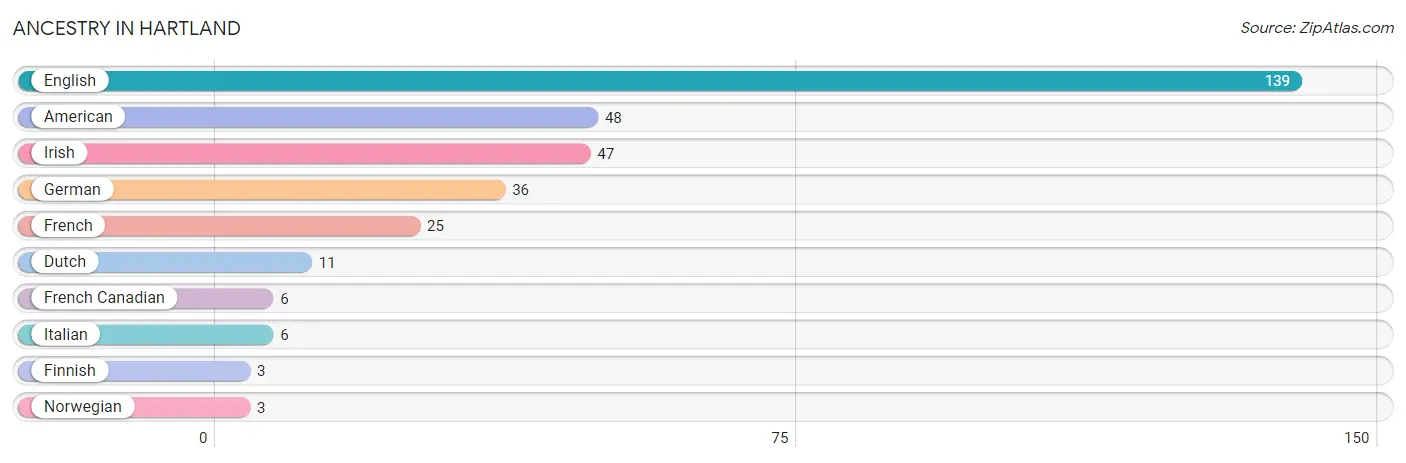
| Ancestry | # Population | % Population |
| American | 48 | 8.0% |
| Dutch | 11 | 1.8% |
| English | 139 | 23.1% |
| Finnish | 3 | 0.5% |
| French | 25 | 4.2% |
| French Canadian | 6 | 1.0% |
| German | 36 | 6.0% |
| Irish | 47 | 7.8% |
| Italian | 6 | 1.0% |
| Norwegian | 3 | 0.5% | View All 10 Rows |
Immigrants in Hartland

| Immigration Origin | # Population | % Population | View All 0 Rows |
Sex and Age in Hartland
Sex and Age in Hartland
The most populous age groups in Hartland are 55 to 59 Years (42 | 15.4%) for men and 15 to 19 Years (40 | 12.1%) for women.
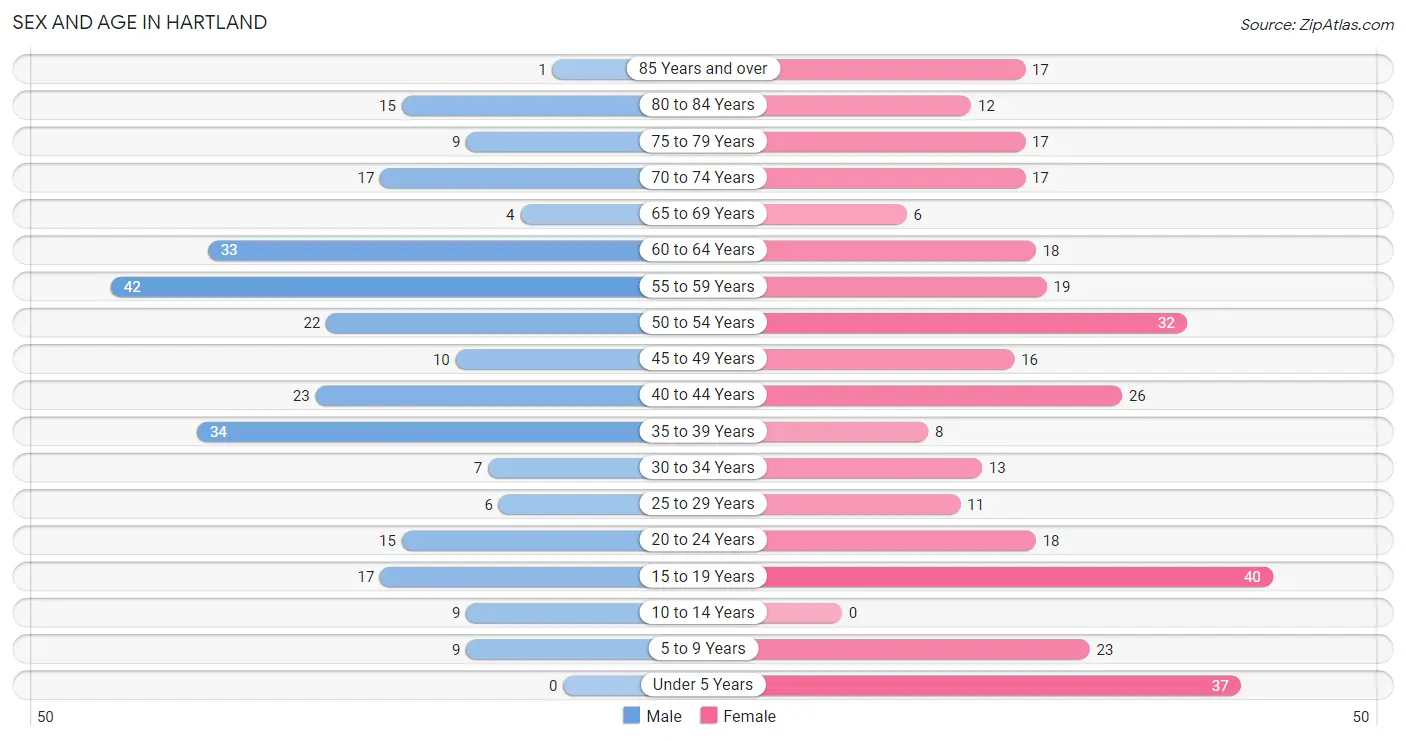
| Age Bracket | Male | Female |
| Under 5 Years | 0 (0.0%) | 37 (11.2%) |
| 5 to 9 Years | 9 (3.3%) | 23 (7.0%) |
| 10 to 14 Years | 9 (3.3%) | 0 (0.0%) |
| 15 to 19 Years | 17 (6.2%) | 40 (12.1%) |
| 20 to 24 Years | 15 (5.5%) | 18 (5.4%) |
| 25 to 29 Years | 6 (2.2%) | 11 (3.3%) |
| 30 to 34 Years | 7 (2.6%) | 13 (3.9%) |
| 35 to 39 Years | 34 (12.4%) | 8 (2.4%) |
| 40 to 44 Years | 23 (8.4%) | 26 (7.9%) |
| 45 to 49 Years | 10 (3.7%) | 16 (4.9%) |
| 50 to 54 Years | 22 (8.1%) | 32 (9.7%) |
| 55 to 59 Years | 42 (15.4%) | 19 (5.8%) |
| 60 to 64 Years | 33 (12.1%) | 18 (5.4%) |
| 65 to 69 Years | 4 (1.5%) | 6 (1.8%) |
| 70 to 74 Years | 17 (6.2%) | 17 (5.1%) |
| 75 to 79 Years | 9 (3.3%) | 17 (5.1%) |
| 80 to 84 Years | 15 (5.5%) | 12 (3.6%) |
| 85 Years and over | 1 (0.4%) | 17 (5.1%) |
| Total | 273 (100.0%) | 330 (100.0%) |
Families and Households in Hartland
Median Family Size in Hartland
The median family size in Hartland is 2.82 persons per family, with single female/mother families (17 | 12.7%) accounting for the largest median family size of 4.12 persons per family. On the other hand, married-couple families (79 | 59.0%) represent the smallest median family size with 2.61 persons per family.
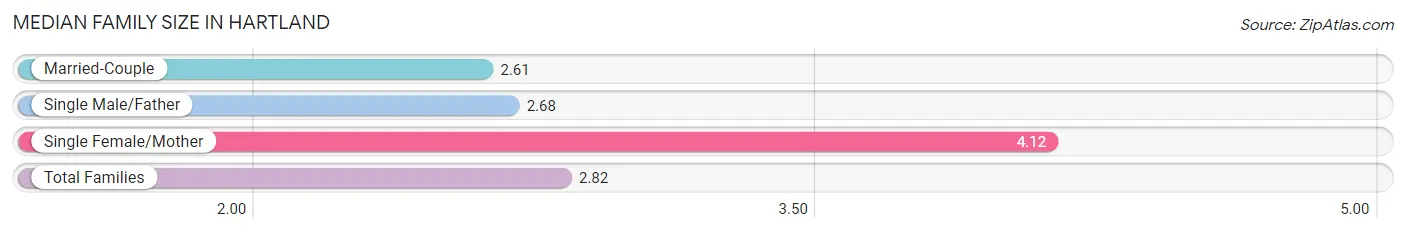
| Family Type | # Families | Family Size |
| Married-Couple | 79 (59.0%) | 2.61 |
| Single Male/Father | 38 (28.4%) | 2.68 |
| Single Female/Mother | 17 (12.7%) | 4.12 |
| Total Families | 134 (100.0%) | 2.82 |
Median Household Size in Hartland
The median household size in Hartland is 2.43 persons per household, with single female/mother households (17 | 7.4%) accounting for the largest median household size of 4.53 persons per household. non-family households (96 | 41.7%) represent the smallest median household size with 1.28 persons per household.
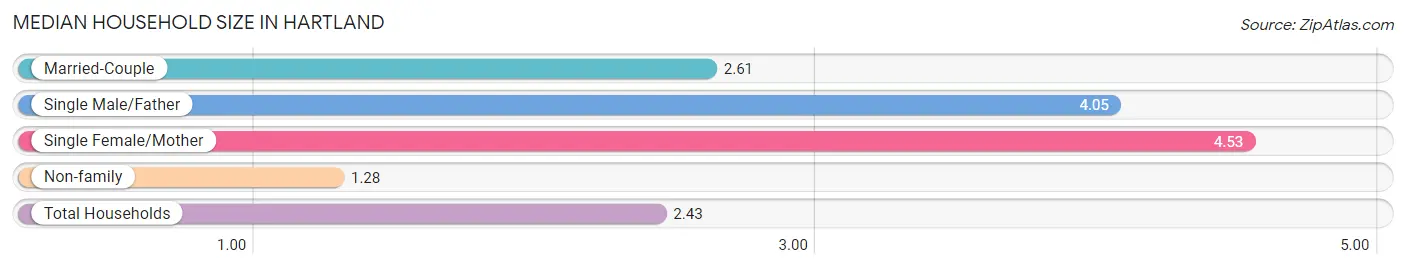
| Household Type | # Households | Household Size |
| Married-Couple | 79 (34.4%) | 2.61 |
| Single Male/Father | 38 (16.5%) | 4.05 |
| Single Female/Mother | 17 (7.4%) | 4.53 |
| Non-family | 96 (41.7%) | 1.28 |
| Total Households | 230 (100.0%) | 2.43 |
Household Size by Marriage Status in Hartland
Out of a total of 230 households in Hartland, 134 (58.3%) are family households, while 96 (41.7%) are nonfamily households. The most numerous type of family households are 2-person households, comprising 65, and the most common type of nonfamily households are 1-person households, comprising 73.
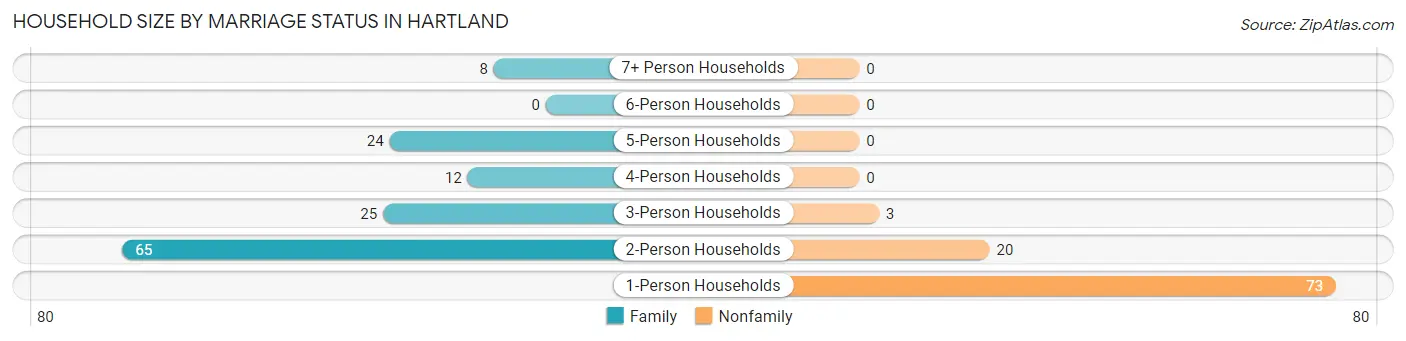
| Household Size | Family Households | Nonfamily Households |
| 1-Person Households | - | 73 (31.7%) |
| 2-Person Households | 65 (28.3%) | 20 (8.7%) |
| 3-Person Households | 25 (10.9%) | 3 (1.3%) |
| 4-Person Households | 12 (5.2%) | 0 (0.0%) |
| 5-Person Households | 24 (10.4%) | 0 (0.0%) |
| 6-Person Households | 0 (0.0%) | 0 (0.0%) |
| 7+ Person Households | 8 (3.5%) | 0 (0.0%) |
| Total | 134 (58.3%) | 96 (41.7%) |
Female Fertility in Hartland
Fertility by Age in Hartland
Average fertility rate in Hartland is 97.0 births per 1,000 women. Women in the age bracket of 20 to 34 years have the highest fertility rate with 333.0 births per 1,000 women. Women in the age bracket of 20 to 34 years acount for 100.0% of all women with births.
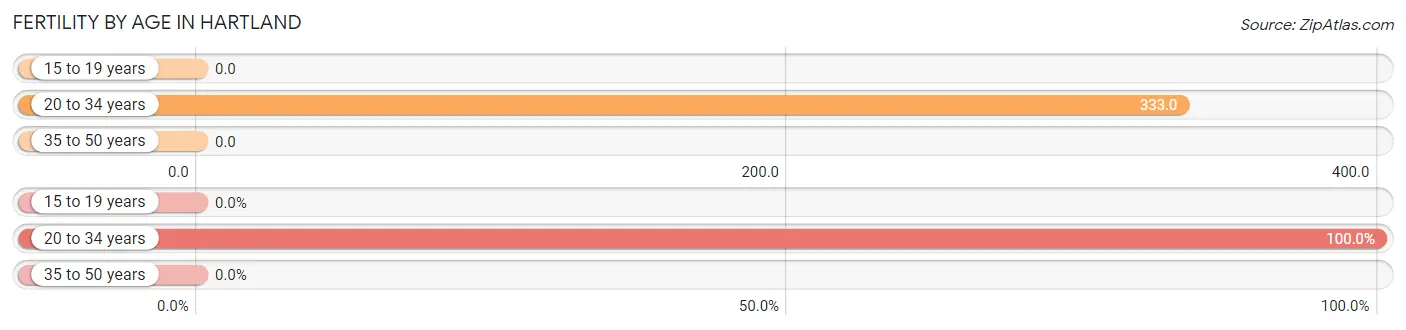
| Age Bracket | Women with Births | Births / 1,000 Women |
| 15 to 19 years | 0 (0.0%) | 0.0 |
| 20 to 34 years | 14 (100.0%) | 333.0 |
| 35 to 50 years | 0 (0.0%) | 0.0 |
| Total | 14 (100.0%) | 97.0 |
Fertility by Age by Marriage Status in Hartland
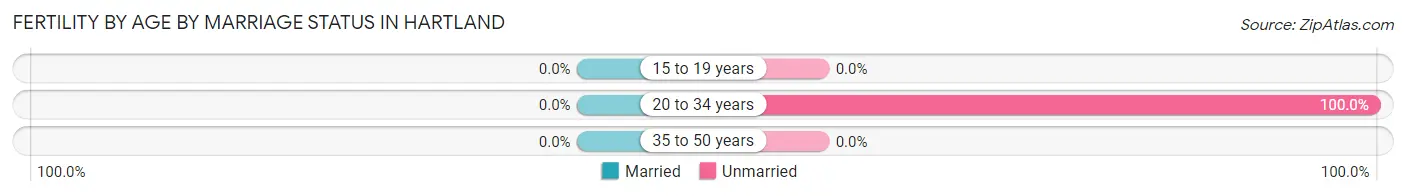
| Age Bracket | Married | Unmarried |
| 15 to 19 years | 0 (0.0%) | 0 (0.0%) |
| 20 to 34 years | 0 (0.0%) | 14 (100.0%) |
| 35 to 50 years | 0 (0.0%) | 0 (0.0%) |
| Total | 0 (0.0%) | 14 (100.0%) |
Fertility by Education in Hartland
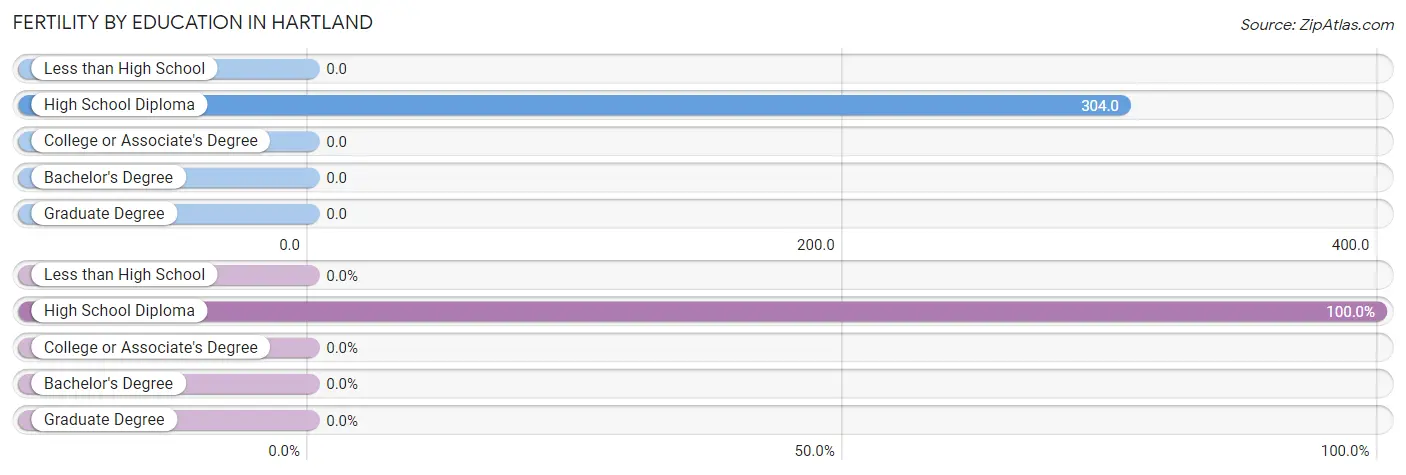
| Educational Attainment | Women with Births | Births / 1,000 Women |
| Less than High School | 0 (0.0%) | 0.0 |
| High School Diploma | 14 (100.0%) | 304.0 |
| College or Associate's Degree | 0 (0.0%) | 0.0 |
| Bachelor's Degree | 0 (0.0%) | 0.0 |
| Graduate Degree | 0 (0.0%) | 0.0 |
| Total | 14 (100.0%) | 97.0 |
Fertility by Education by Marriage Status in Hartland
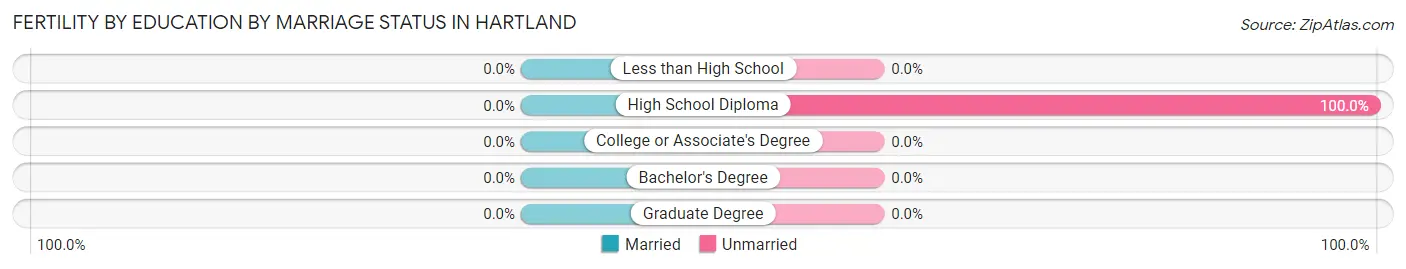
| Educational Attainment | Married | Unmarried |
| Less than High School | 0 (0.0%) | 0 (0.0%) |
| High School Diploma | 0 (0.0%) | 14 (100.0%) |
| College or Associate's Degree | 0 (0.0%) | 0 (0.0%) |
| Bachelor's Degree | 0 (0.0%) | 0 (0.0%) |
| Graduate Degree | 0 (0.0%) | 0 (0.0%) |
| Total | 0 (0.0%) | 14 (100.0%) |
Employment Characteristics in Hartland
Employment by Class of Employer in Hartland
Among the 265 employed individuals in Hartland, private company employees (180 | 67.9%), local government employees (26 | 9.8%), and state government employees (21 | 7.9%) make up the most common classes of employment.
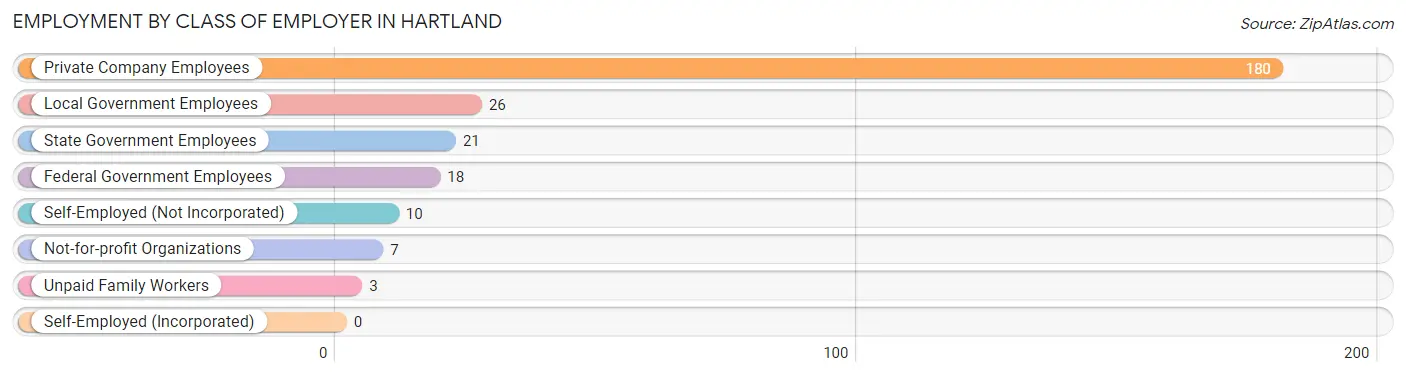
| Employer Class | # Employees | % Employees |
| Private Company Employees | 180 | 67.9% |
| Self-Employed (Incorporated) | 0 | 0.0% |
| Self-Employed (Not Incorporated) | 10 | 3.8% |
| Not-for-profit Organizations | 7 | 2.6% |
| Local Government Employees | 26 | 9.8% |
| State Government Employees | 21 | 7.9% |
| Federal Government Employees | 18 | 6.8% |
| Unpaid Family Workers | 3 | 1.1% |
| Total | 265 | 100.0% |
Employment Status by Age in Hartland
According to the labor force statistics for Hartland, out of the total population over 16 years of age (525), 51.8% or 272 individuals are in the labor force, with 2.6% or 7 of them unemployed. The age group with the highest labor force participation rate is 35 to 44 years, with 96.7% or 88 individuals in the labor force. Within the labor force, the 35 to 44 years age range has the highest percentage of unemployed individuals, with 8.0% or 7 of them being unemployed.
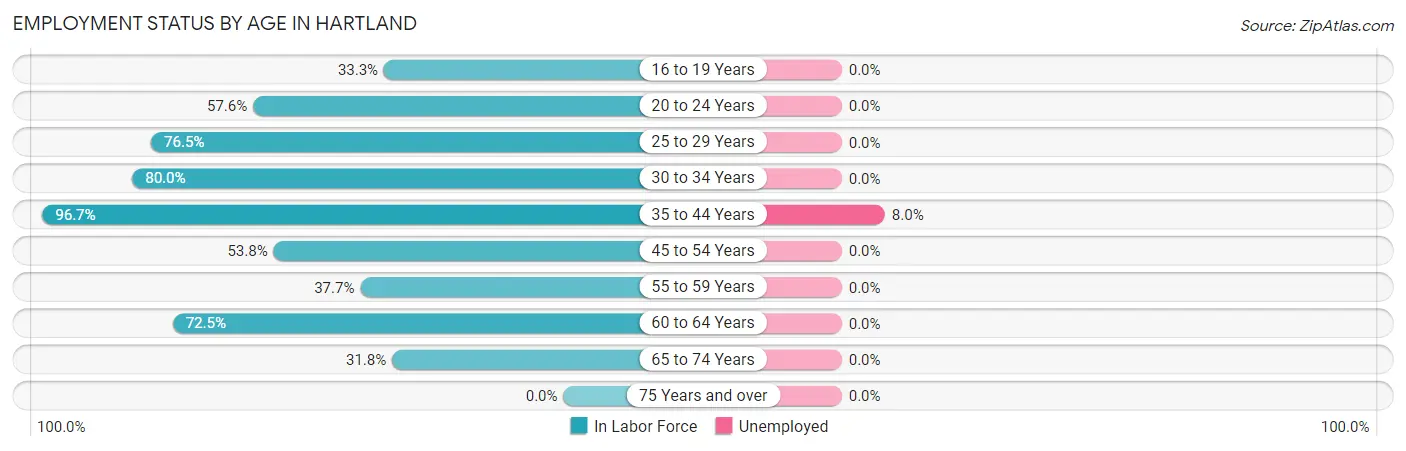
| Age Bracket | In Labor Force | Unemployed |
| 16 to 19 Years | 19 (33.3%) | 0 (0.0%) |
| 20 to 24 Years | 19 (57.6%) | 0 (0.0%) |
| 25 to 29 Years | 13 (76.5%) | 0 (0.0%) |
| 30 to 34 Years | 16 (80.0%) | 0 (0.0%) |
| 35 to 44 Years | 88 (96.7%) | 7 (8.0%) |
| 45 to 54 Years | 43 (53.8%) | 0 (0.0%) |
| 55 to 59 Years | 23 (37.7%) | 0 (0.0%) |
| 60 to 64 Years | 37 (72.5%) | 0 (0.0%) |
| 65 to 74 Years | 14 (31.8%) | 0 (0.0%) |
| 75 Years and over | 0 (0.0%) | 0 (0.0%) |
| Total | 272 (51.8%) | 7 (2.6%) |
Employment Status by Educational Attainment in Hartland
According to labor force statistics for Hartland, 68.8% of individuals (220) out of the total population between 25 and 64 years of age (320) are in the labor force, with 3.2% or 7 of them being unemployed. The group with the highest labor force participation rate are those with the educational attainment of college / associate degree, with 91.0% or 101 individuals in the labor force. Within the labor force, individuals with high school diploma education have the highest percentage of unemployment, with 6.4% or 7 of them being unemployed.
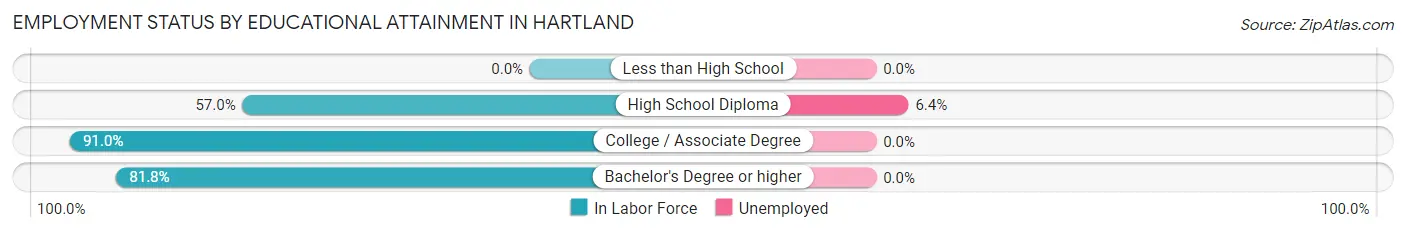
| Educational Attainment | In Labor Force | Unemployed |
| Less than High School | 0 (0.0%) | 0 (0.0%) |
| High School Diploma | 110 (57.0%) | 12 (6.4%) |
| College / Associate Degree | 101 (91.0%) | 0 (0.0%) |
| Bachelor's Degree or higher | 9 (81.8%) | 0 (0.0%) |
| Total | 220 (68.8%) | 10 (3.2%) |
Employment Occupations by Sex in Hartland
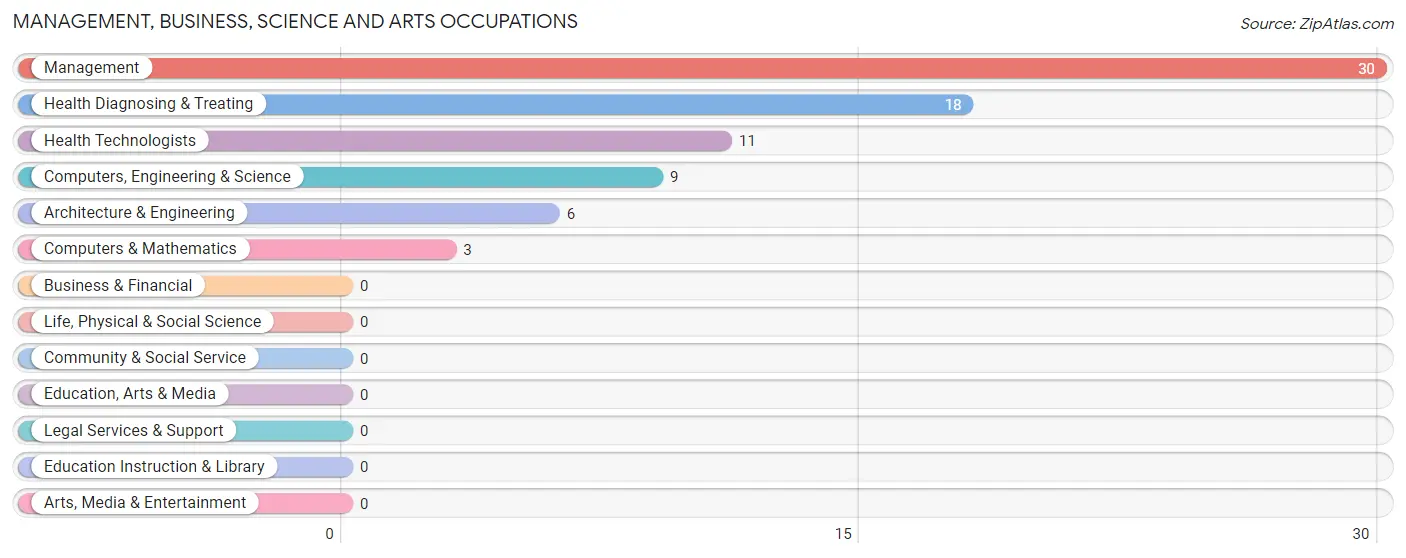
Management, Business, Science and Arts Occupations
The most common Management, Business, Science and Arts occupations in Hartland are Management (30 | 11.3%), Health Diagnosing & Treating (18 | 6.8%), Health Technologists (11 | 4.2%), Computers, Engineering & Science (9 | 3.4%), and Architecture & Engineering (6 | 2.3%).
Management, Business, Science and Arts Occupations by Sex
Within the Management, Business, Science and Arts occupations in Hartland, the most male-oriented occupations are Computers, Engineering & Science (100.0%), Computers & Mathematics (100.0%), and Architecture & Engineering (100.0%), while the most female-oriented occupations are Management (100.0%), Health Diagnosing & Treating (100.0%), and Health Technologists (100.0%).
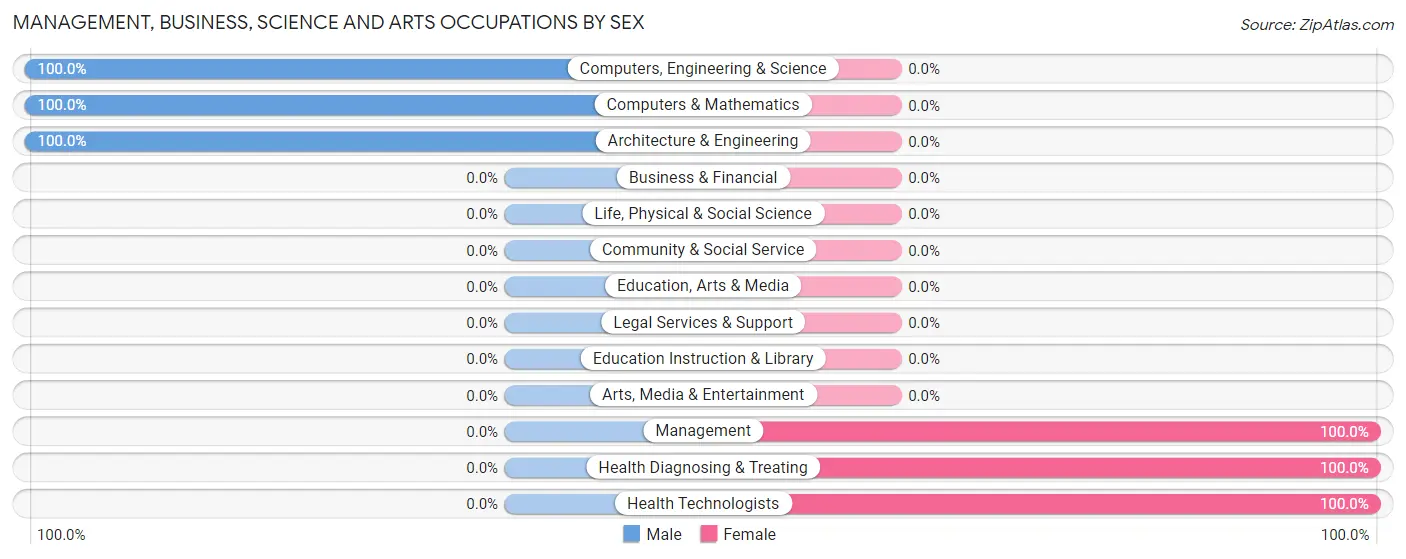
| Occupation | Male | Female |
| Management | 0 (0.0%) | 30 (100.0%) |
| Business & Financial | 0 (0.0%) | 0 (0.0%) |
| Computers, Engineering & Science | 9 (100.0%) | 0 (0.0%) |
| Computers & Mathematics | 3 (100.0%) | 0 (0.0%) |
| Architecture & Engineering | 6 (100.0%) | 0 (0.0%) |
| Life, Physical & Social Science | 0 (0.0%) | 0 (0.0%) |
| Community & Social Service | 0 (0.0%) | 0 (0.0%) |
| Education, Arts & Media | 0 (0.0%) | 0 (0.0%) |
| Legal Services & Support | 0 (0.0%) | 0 (0.0%) |
| Education Instruction & Library | 0 (0.0%) | 0 (0.0%) |
| Arts, Media & Entertainment | 0 (0.0%) | 0 (0.0%) |
| Health Diagnosing & Treating | 0 (0.0%) | 18 (100.0%) |
| Health Technologists | 0 (0.0%) | 11 (100.0%) |
| Total (Category) | 9 (15.8%) | 48 (84.2%) |
| Total (Overall) | 166 (62.6%) | 99 (37.4%) |
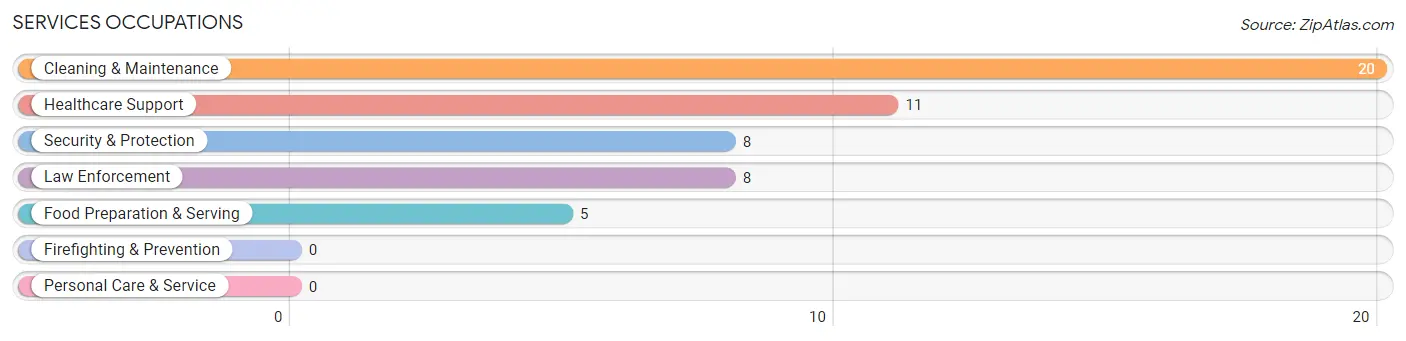
Services Occupations
The most common Services occupations in Hartland are Cleaning & Maintenance (20 | 7.5%), Healthcare Support (11 | 4.2%), Security & Protection (8 | 3.0%), Law Enforcement (8 | 3.0%), and Food Preparation & Serving (5 | 1.9%).
Services Occupations by Sex
Within the Services occupations in Hartland, the most male-oriented occupations are Security & Protection (100.0%), Law Enforcement (100.0%), and Cleaning & Maintenance (90.0%), while the most female-oriented occupations are Food Preparation & Serving (100.0%), Healthcare Support (54.5%), and Cleaning & Maintenance (10.0%).
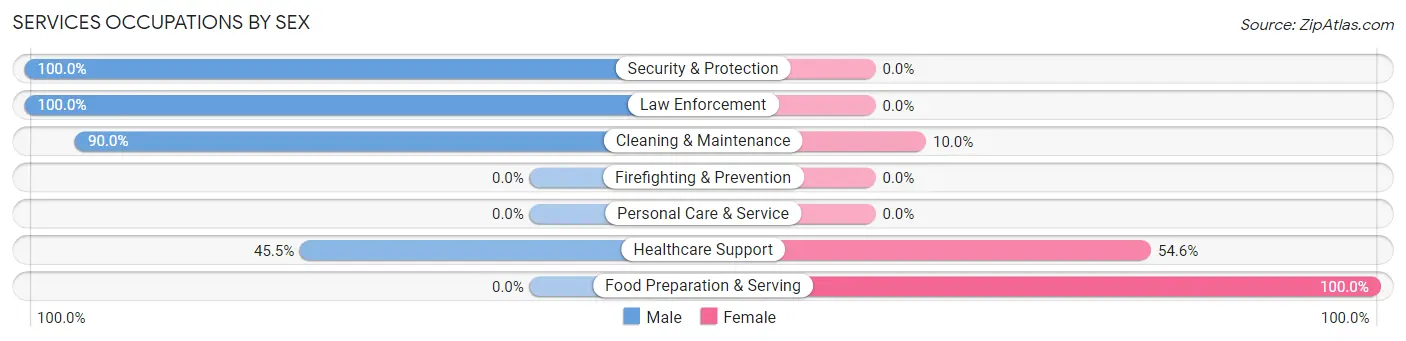
| Occupation | Male | Female |
| Healthcare Support | 5 (45.5%) | 6 (54.5%) |
| Security & Protection | 8 (100.0%) | 0 (0.0%) |
| Firefighting & Prevention | 0 (0.0%) | 0 (0.0%) |
| Law Enforcement | 8 (100.0%) | 0 (0.0%) |
| Food Preparation & Serving | 0 (0.0%) | 5 (100.0%) |
| Cleaning & Maintenance | 18 (90.0%) | 2 (10.0%) |
| Personal Care & Service | 0 (0.0%) | 0 (0.0%) |
| Total (Category) | 31 (70.5%) | 13 (29.5%) |
| Total (Overall) | 166 (62.6%) | 99 (37.4%) |
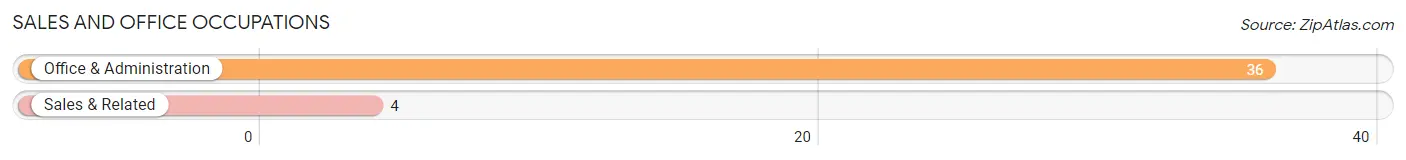
Sales and Office Occupations
The most common Sales and Office occupations in Hartland are Office & Administration (36 | 13.6%), and Sales & Related (4 | 1.5%).
Sales and Office Occupations by Sex
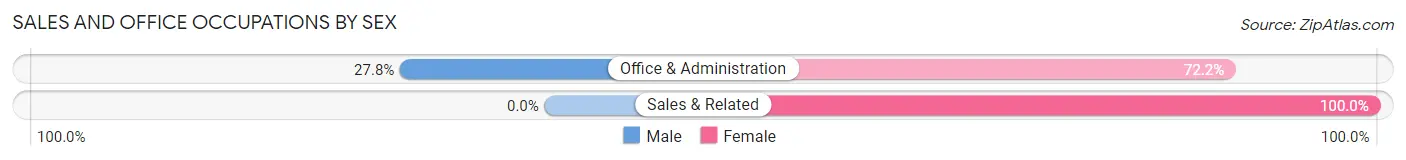
| Occupation | Male | Female |
| Sales & Related | 0 (0.0%) | 4 (100.0%) |
| Office & Administration | 10 (27.8%) | 26 (72.2%) |
| Total (Category) | 10 (25.0%) | 30 (75.0%) |
| Total (Overall) | 166 (62.6%) | 99 (37.4%) |
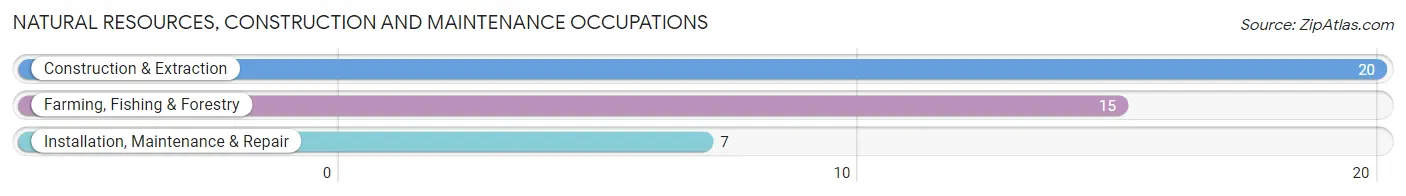
Natural Resources, Construction and Maintenance Occupations
The most common Natural Resources, Construction and Maintenance occupations in Hartland are Construction & Extraction (20 | 7.5%), Farming, Fishing & Forestry (15 | 5.7%), and Installation, Maintenance & Repair (7 | 2.6%).
Natural Resources, Construction and Maintenance Occupations by Sex
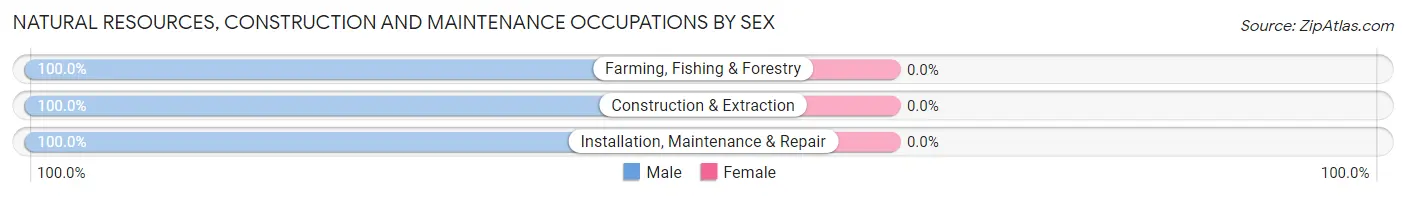
| Occupation | Male | Female |
| Farming, Fishing & Forestry | 15 (100.0%) | 0 (0.0%) |
| Construction & Extraction | 20 (100.0%) | 0 (0.0%) |
| Installation, Maintenance & Repair | 7 (100.0%) | 0 (0.0%) |
| Total (Category) | 42 (100.0%) | 0 (0.0%) |
| Total (Overall) | 166 (62.6%) | 99 (37.4%) |
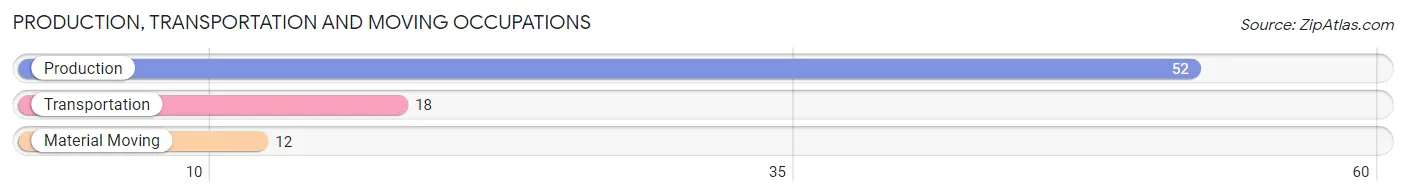
Production, Transportation and Moving Occupations
The most common Production, Transportation and Moving occupations in Hartland are Production (52 | 19.6%), Transportation (18 | 6.8%), and Material Moving (12 | 4.5%).
Production, Transportation and Moving Occupations by Sex
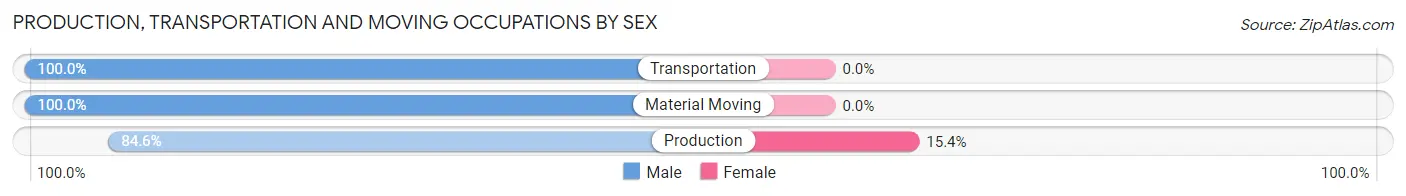
| Occupation | Male | Female |
| Production | 44 (84.6%) | 8 (15.4%) |
| Transportation | 18 (100.0%) | 0 (0.0%) |
| Material Moving | 12 (100.0%) | 0 (0.0%) |
| Total (Category) | 74 (90.2%) | 8 (9.8%) |
| Total (Overall) | 166 (62.6%) | 99 (37.4%) |
Employment Industries by Sex in Hartland
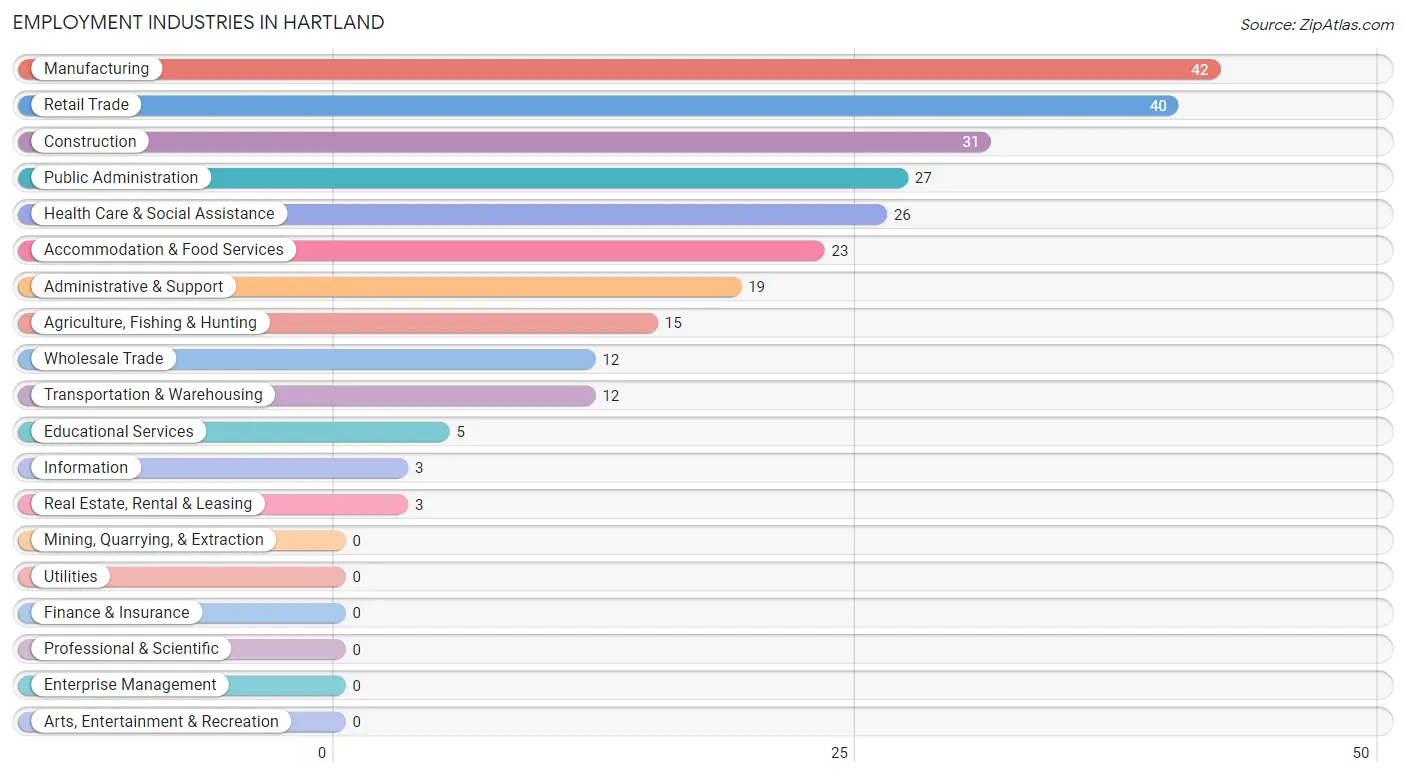
Employment Industries in Hartland
The major employment industries in Hartland include Manufacturing (42 | 15.9%), Retail Trade (40 | 15.1%), Construction (31 | 11.7%), Public Administration (27 | 10.2%), and Health Care & Social Assistance (26 | 9.8%).
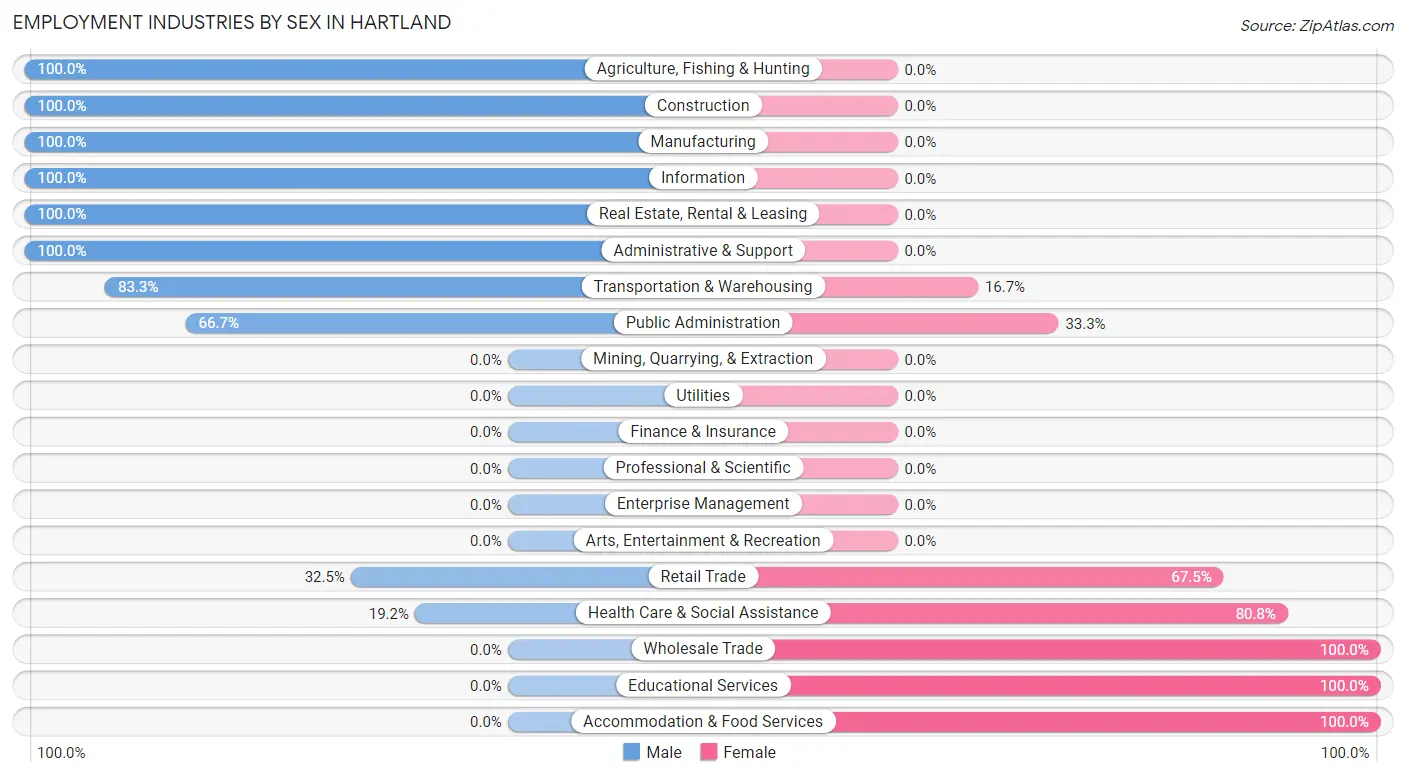
Employment Industries by Sex in Hartland
The Hartland industries that see more men than women are Agriculture, Fishing & Hunting (100.0%), Construction (100.0%), and Manufacturing (100.0%), whereas the industries that tend to have a higher number of women are Wholesale Trade (100.0%), Educational Services (100.0%), and Accommodation & Food Services (100.0%).
| Industry | Male | Female |
| Agriculture, Fishing & Hunting | 15 (100.0%) | 0 (0.0%) |
| Mining, Quarrying, & Extraction | 0 (0.0%) | 0 (0.0%) |
| Construction | 31 (100.0%) | 0 (0.0%) |
| Manufacturing | 42 (100.0%) | 0 (0.0%) |
| Wholesale Trade | 0 (0.0%) | 12 (100.0%) |
| Retail Trade | 13 (32.5%) | 27 (67.5%) |
| Transportation & Warehousing | 10 (83.3%) | 2 (16.7%) |
| Utilities | 0 (0.0%) | 0 (0.0%) |
| Information | 3 (100.0%) | 0 (0.0%) |
| Finance & Insurance | 0 (0.0%) | 0 (0.0%) |
| Real Estate, Rental & Leasing | 3 (100.0%) | 0 (0.0%) |
| Professional & Scientific | 0 (0.0%) | 0 (0.0%) |
| Enterprise Management | 0 (0.0%) | 0 (0.0%) |
| Administrative & Support | 19 (100.0%) | 0 (0.0%) |
| Educational Services | 0 (0.0%) | 5 (100.0%) |
| Health Care & Social Assistance | 5 (19.2%) | 21 (80.8%) |
| Arts, Entertainment & Recreation | 0 (0.0%) | 0 (0.0%) |
| Accommodation & Food Services | 0 (0.0%) | 23 (100.0%) |
| Public Administration | 18 (66.7%) | 9 (33.3%) |
| Total | 166 (62.6%) | 99 (37.4%) |
Education in Hartland
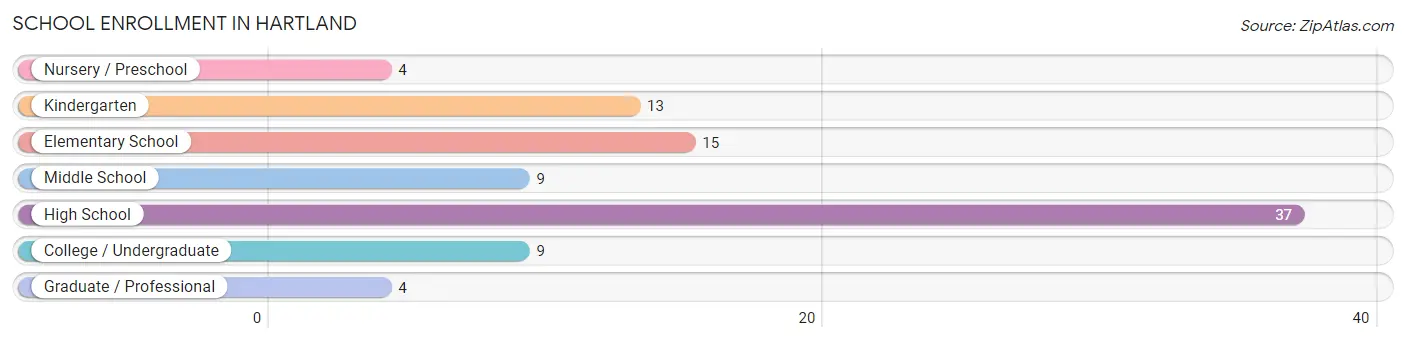
School Enrollment in Hartland
The most common levels of schooling among the 91 students in Hartland are high school (37 | 40.7%), elementary school (15 | 16.5%), and kindergarten (13 | 14.3%).
| School Level | # Students | % Students |
| Nursery / Preschool | 4 | 4.4% |
| Kindergarten | 13 | 14.3% |
| Elementary School | 15 | 16.5% |
| Middle School | 9 | 9.9% |
| High School | 37 | 40.7% |
| College / Undergraduate | 9 | 9.9% |
| Graduate / Professional | 4 | 4.4% |
| Total | 91 | 100.0% |
School Enrollment by Age by Funding Source in Hartland
Out of a total of 91 students who are enrolled in schools in Hartland, 9 (9.9%) attend a private institution, while the remaining 82 (90.1%) are enrolled in public schools. The age group of 5 to 9 year old has the highest likelihood of being enrolled in private schools, with 9 (28.1% in the age bracket) enrolled. Conversely, the age group of 10 to 14 year olds has the lowest likelihood of being enrolled in a private school, with 9 (100.0% in the age bracket) attending a public institution.
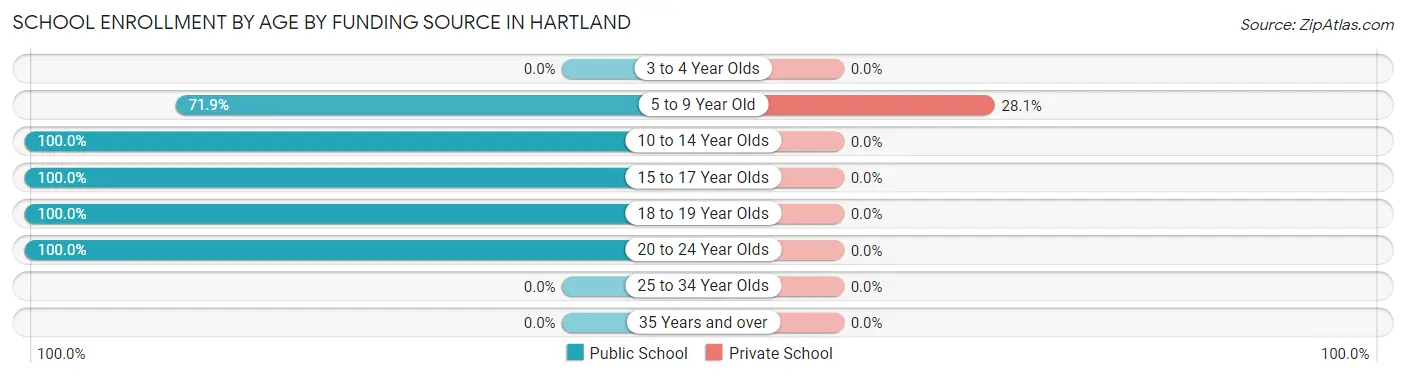
| Age Bracket | Public School | Private School |
| 3 to 4 Year Olds | 0 (0.0%) | 0 (0.0%) |
| 5 to 9 Year Old | 23 (71.9%) | 9 (28.1%) |
| 10 to 14 Year Olds | 9 (100.0%) | 0 (0.0%) |
| 15 to 17 Year Olds | 37 (100.0%) | 0 (0.0%) |
| 18 to 19 Year Olds | 9 (100.0%) | 0 (0.0%) |
| 20 to 24 Year Olds | 4 (100.0%) | 0 (0.0%) |
| 25 to 34 Year Olds | 0 (0.0%) | 0 (0.0%) |
| 35 Years and over | 0 (0.0%) | 0 (0.0%) |
| Total | 82 (90.1%) | 9 (9.9%) |
Educational Attainment by Field of Study in Hartland
Science & technology (9 | 34.6%), arts & humanities (9 | 34.6%), education (6 | 23.1%), and literature & languages (2 | 7.7%) are the most common fields of study among 26 individuals in Hartland who have obtained a bachelor's degree or higher.
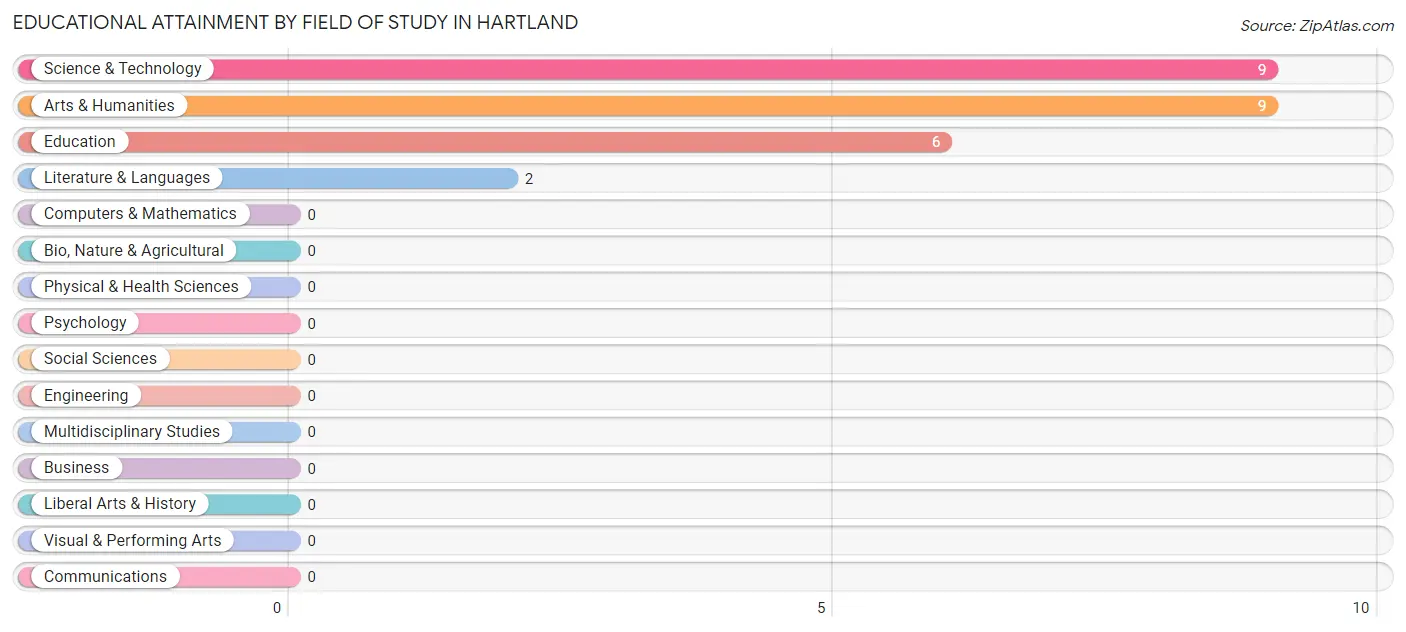
| Field of Study | # Graduates | % Graduates |
| Computers & Mathematics | 0 | 0.0% |
| Bio, Nature & Agricultural | 0 | 0.0% |
| Physical & Health Sciences | 0 | 0.0% |
| Psychology | 0 | 0.0% |
| Social Sciences | 0 | 0.0% |
| Engineering | 0 | 0.0% |
| Multidisciplinary Studies | 0 | 0.0% |
| Science & Technology | 9 | 34.6% |
| Business | 0 | 0.0% |
| Education | 6 | 23.1% |
| Literature & Languages | 2 | 7.7% |
| Liberal Arts & History | 0 | 0.0% |
| Visual & Performing Arts | 0 | 0.0% |
| Communications | 0 | 0.0% |
| Arts & Humanities | 9 | 34.6% |
| Total | 26 | 100.0% |
Transportation & Commute in Hartland
Vehicle Availability by Sex in Hartland
The most prevalent vehicle ownership categories in Hartland are males with 1 vehicle (77, accounting for 46.4%) and females with 1 vehicle (35, making up 77.8%).
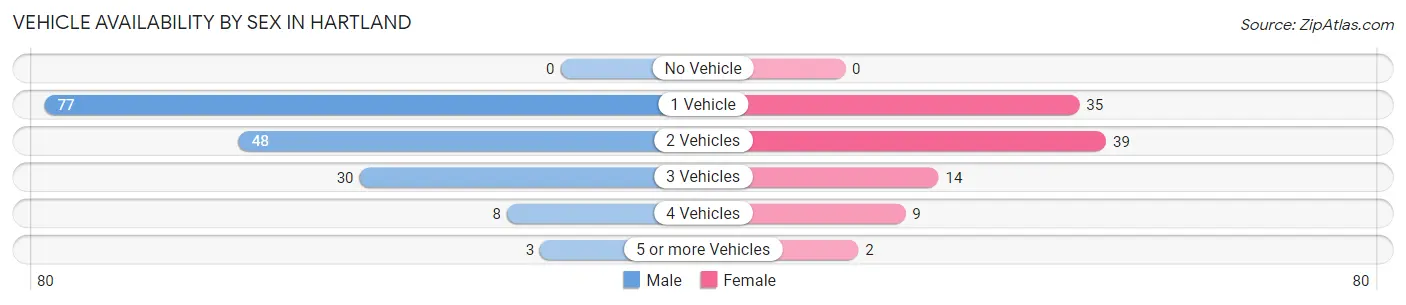
| Vehicles Available | Male | Female |
| No Vehicle | 0 (0.0%) | 0 (0.0%) |
| 1 Vehicle | 77 (46.4%) | 35 (35.3%) |
| 2 Vehicles | 48 (28.9%) | 39 (39.4%) |
| 3 Vehicles | 30 (18.1%) | 14 (14.1%) |
| 4 Vehicles | 8 (4.8%) | 9 (9.1%) |
| 5 or more Vehicles | 3 (1.8%) | 2 (2.0%) |
| Total | 166 (100.0%) | 99 (100.0%) |
Commute Time in Hartland
The most frequently occuring commute durations in Hartland are 15 to 19 minutes (69 commuters, 26.0%), 45 to 59 minutes (52 commuters, 19.6%), and 30 to 34 minutes (30 commuters, 11.3%).
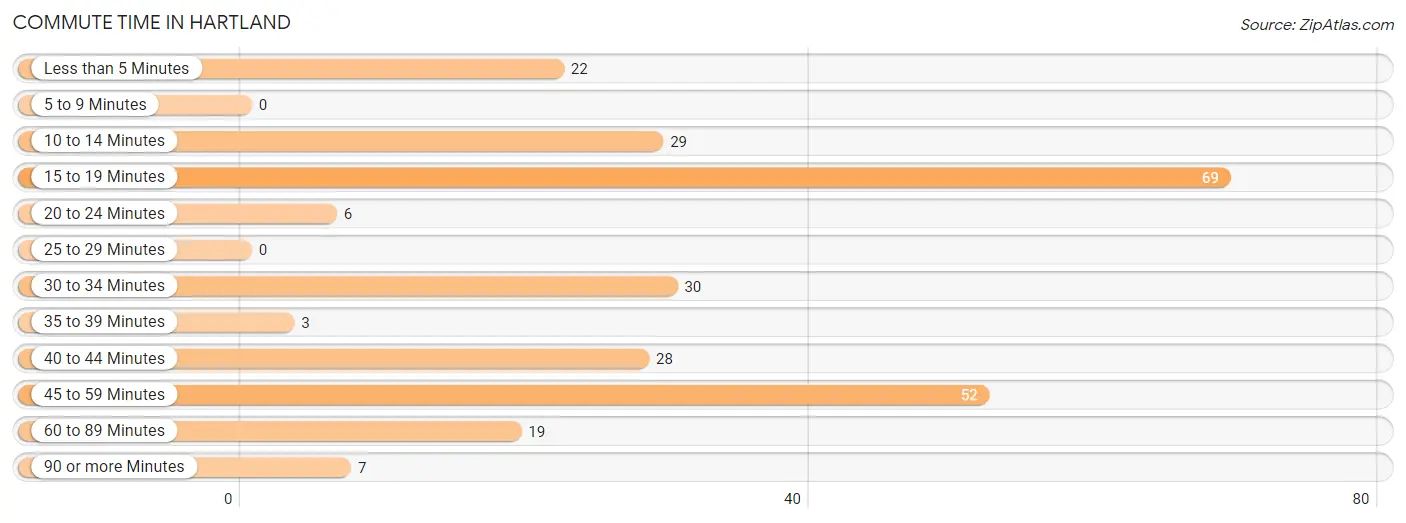
| Commute Time | # Commuters | % Commuters |
| Less than 5 Minutes | 22 | 8.3% |
| 5 to 9 Minutes | 0 | 0.0% |
| 10 to 14 Minutes | 29 | 10.9% |
| 15 to 19 Minutes | 69 | 26.0% |
| 20 to 24 Minutes | 6 | 2.3% |
| 25 to 29 Minutes | 0 | 0.0% |
| 30 to 34 Minutes | 30 | 11.3% |
| 35 to 39 Minutes | 3 | 1.1% |
| 40 to 44 Minutes | 28 | 10.6% |
| 45 to 59 Minutes | 52 | 19.6% |
| 60 to 89 Minutes | 19 | 7.2% |
| 90 or more Minutes | 7 | 2.6% |
Commute Time by Sex in Hartland
The most common commute times in Hartland are 15 to 19 minutes (41 commuters, 24.7%) for males and 15 to 19 minutes (28 commuters, 28.3%) for females.
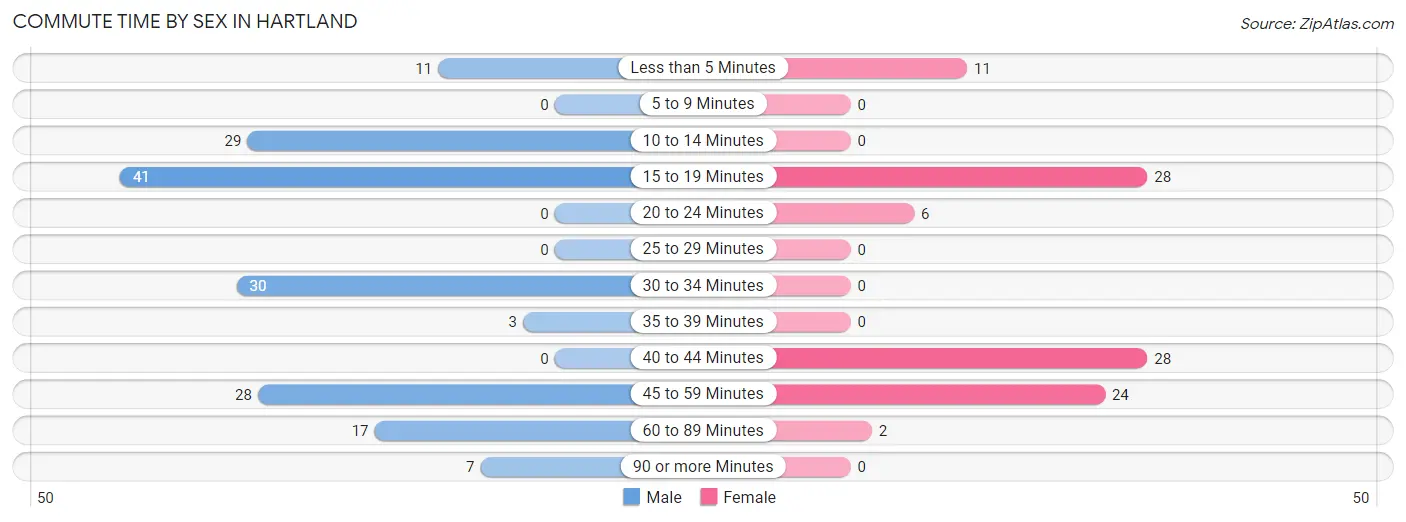
| Commute Time | Male | Female |
| Less than 5 Minutes | 11 (6.6%) | 11 (11.1%) |
| 5 to 9 Minutes | 0 (0.0%) | 0 (0.0%) |
| 10 to 14 Minutes | 29 (17.5%) | 0 (0.0%) |
| 15 to 19 Minutes | 41 (24.7%) | 28 (28.3%) |
| 20 to 24 Minutes | 0 (0.0%) | 6 (6.1%) |
| 25 to 29 Minutes | 0 (0.0%) | 0 (0.0%) |
| 30 to 34 Minutes | 30 (18.1%) | 0 (0.0%) |
| 35 to 39 Minutes | 3 (1.8%) | 0 (0.0%) |
| 40 to 44 Minutes | 0 (0.0%) | 28 (28.3%) |
| 45 to 59 Minutes | 28 (16.9%) | 24 (24.2%) |
| 60 to 89 Minutes | 17 (10.2%) | 2 (2.0%) |
| 90 or more Minutes | 7 (4.2%) | 0 (0.0%) |
Time of Departure to Work by Sex in Hartland
The most frequent times of departure to work in Hartland are 12:00 AM to 4:59 AM (72, 43.4%) for males and 8:00 AM to 8:29 AM (21, 21.2%) for females.
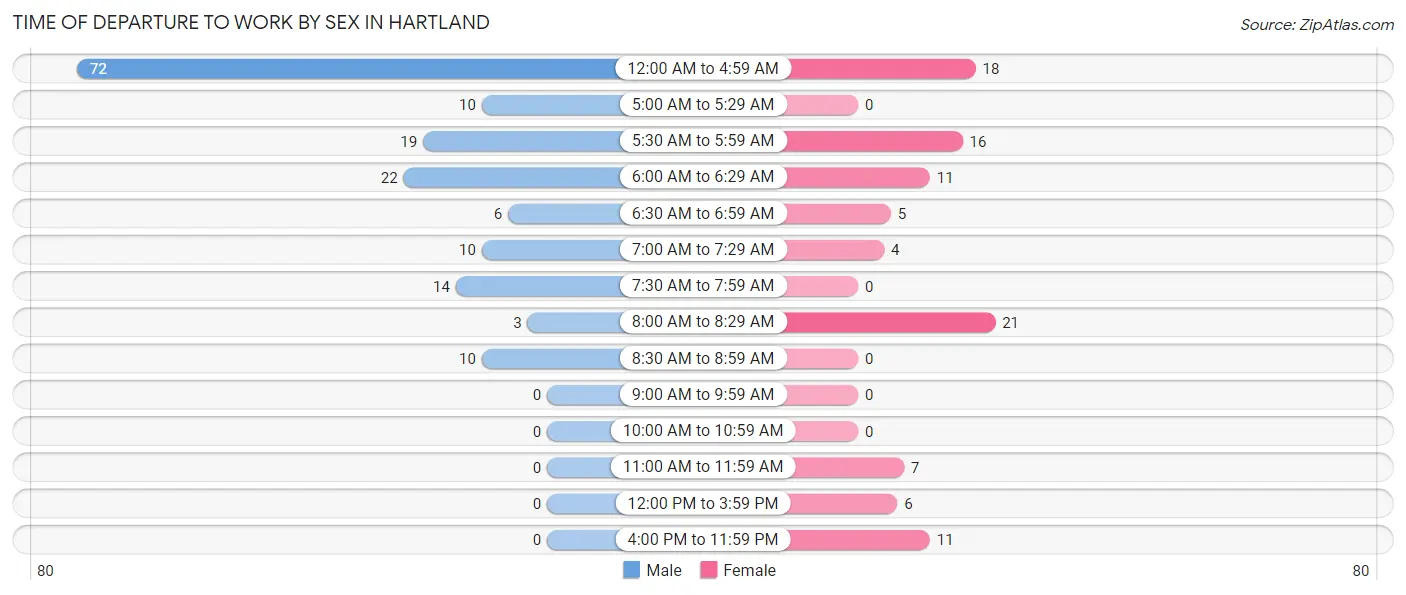
| Time of Departure | Male | Female |
| 12:00 AM to 4:59 AM | 72 (43.4%) | 18 (18.2%) |
| 5:00 AM to 5:29 AM | 10 (6.0%) | 0 (0.0%) |
| 5:30 AM to 5:59 AM | 19 (11.5%) | 16 (16.2%) |
| 6:00 AM to 6:29 AM | 22 (13.3%) | 11 (11.1%) |
| 6:30 AM to 6:59 AM | 6 (3.6%) | 5 (5.1%) |
| 7:00 AM to 7:29 AM | 10 (6.0%) | 4 (4.0%) |
| 7:30 AM to 7:59 AM | 14 (8.4%) | 0 (0.0%) |
| 8:00 AM to 8:29 AM | 3 (1.8%) | 21 (21.2%) |
| 8:30 AM to 8:59 AM | 10 (6.0%) | 0 (0.0%) |
| 9:00 AM to 9:59 AM | 0 (0.0%) | 0 (0.0%) |
| 10:00 AM to 10:59 AM | 0 (0.0%) | 0 (0.0%) |
| 11:00 AM to 11:59 AM | 0 (0.0%) | 7 (7.1%) |
| 12:00 PM to 3:59 PM | 0 (0.0%) | 6 (6.1%) |
| 4:00 PM to 11:59 PM | 0 (0.0%) | 11 (11.1%) |
| Total | 166 (100.0%) | 99 (100.0%) |
Housing Occupancy in Hartland
Occupancy by Ownership in Hartland
Of the total 230 dwellings in Hartland, owner-occupied units account for 112 (48.7%), while renter-occupied units make up 118 (51.3%).
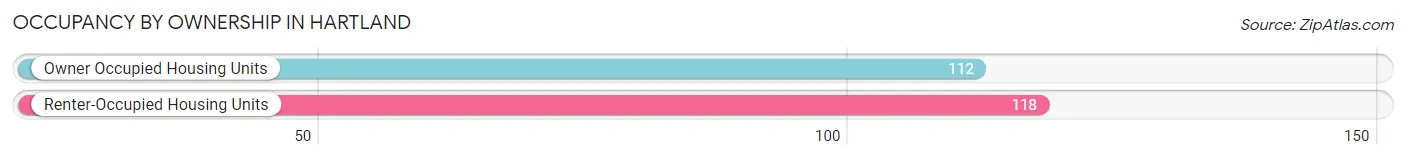
| Occupancy | # Housing Units | % Housing Units |
| Owner Occupied Housing Units | 112 | 48.7% |
| Renter-Occupied Housing Units | 118 | 51.3% |
| Total Occupied Housing Units | 230 | 100.0% |
Occupancy by Household Size in Hartland
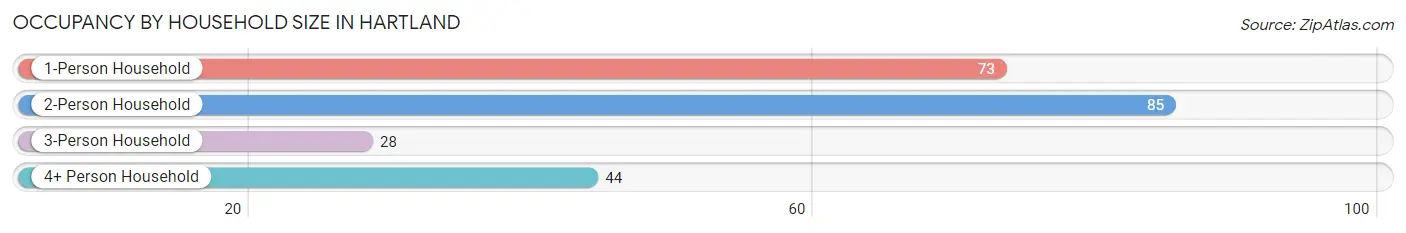
| Household Size | # Housing Units | % Housing Units |
| 1-Person Household | 73 | 31.7% |
| 2-Person Household | 85 | 37.0% |
| 3-Person Household | 28 | 12.2% |
| 4+ Person Household | 44 | 19.1% |
| Total Housing Units | 230 | 100.0% |
Occupancy by Ownership by Household Size in Hartland
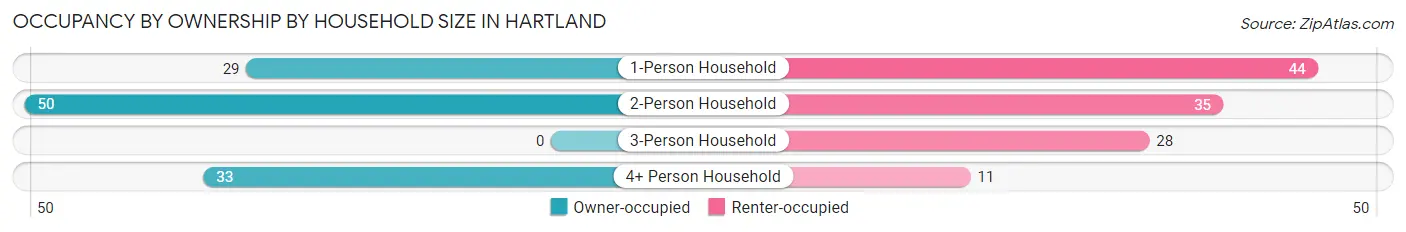
| Household Size | Owner-occupied | Renter-occupied |
| 1-Person Household | 29 (39.7%) | 44 (60.3%) |
| 2-Person Household | 50 (58.8%) | 35 (41.2%) |
| 3-Person Household | 0 (0.0%) | 28 (100.0%) |
| 4+ Person Household | 33 (75.0%) | 11 (25.0%) |
| Total Housing Units | 112 (48.7%) | 118 (51.3%) |
Occupancy by Educational Attainment in Hartland
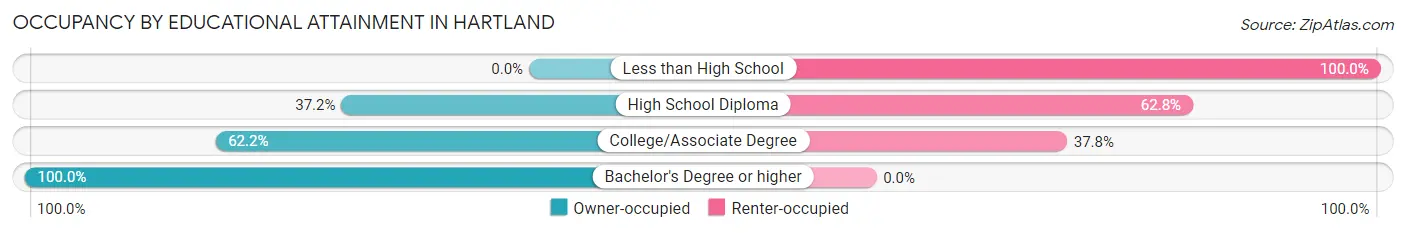
| Household Size | Owner-occupied | Renter-occupied |
| Less than High School | 0 (0.0%) | 6 (100.0%) |
| High School Diploma | 48 (37.2%) | 81 (62.8%) |
| College/Associate Degree | 51 (62.2%) | 31 (37.8%) |
| Bachelor's Degree or higher | 13 (100.0%) | 0 (0.0%) |
Occupancy by Age of Householder in Hartland
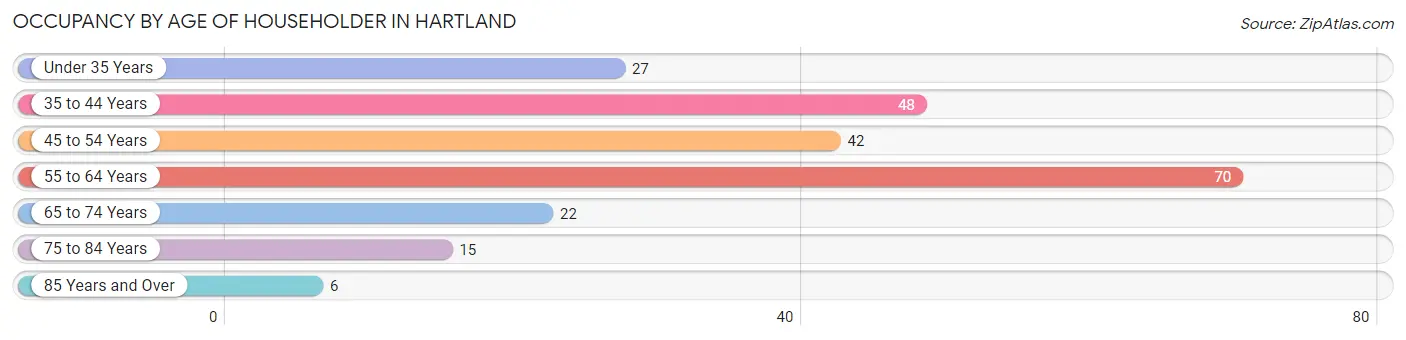
| Age Bracket | # Households | % Households |
| Under 35 Years | 27 | 11.7% |
| 35 to 44 Years | 48 | 20.9% |
| 45 to 54 Years | 42 | 18.3% |
| 55 to 64 Years | 70 | 30.4% |
| 65 to 74 Years | 22 | 9.6% |
| 75 to 84 Years | 15 | 6.5% |
| 85 Years and Over | 6 | 2.6% |
| Total | 230 | 100.0% |
Housing Finances in Hartland
Median Income by Occupancy in Hartland
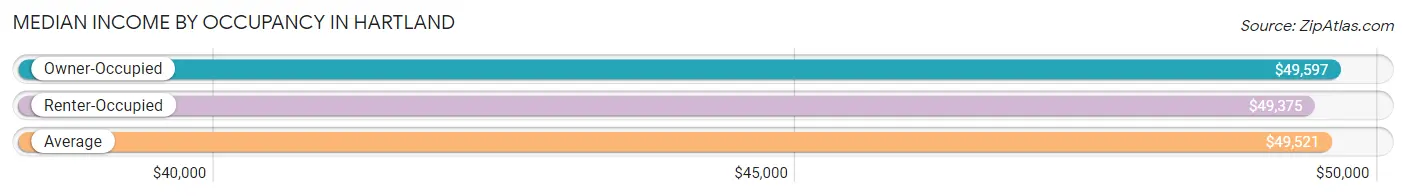
| Occupancy Type | # Households | Median Income |
| Owner-Occupied | 112 (48.7%) | $49,597 |
| Renter-Occupied | 118 (51.3%) | $49,375 |
| Average | 230 (100.0%) | $49,521 |
Occupancy by Householder Income Bracket in Hartland
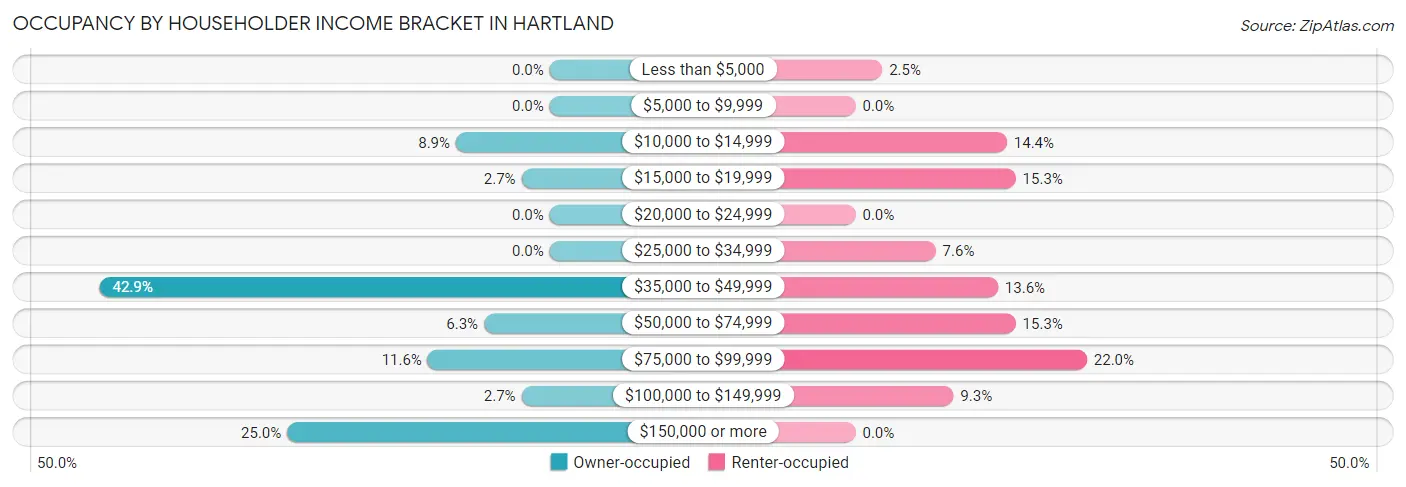
| Income Bracket | Owner-occupied | Renter-occupied |
| Less than $5,000 | 0 (0.0%) | 3 (2.5%) |
| $5,000 to $9,999 | 0 (0.0%) | 0 (0.0%) |
| $10,000 to $14,999 | 10 (8.9%) | 17 (14.4%) |
| $15,000 to $19,999 | 3 (2.7%) | 18 (15.2%) |
| $20,000 to $24,999 | 0 (0.0%) | 0 (0.0%) |
| $25,000 to $34,999 | 0 (0.0%) | 9 (7.6%) |
| $35,000 to $49,999 | 48 (42.9%) | 16 (13.6%) |
| $50,000 to $74,999 | 7 (6.2%) | 18 (15.2%) |
| $75,000 to $99,999 | 13 (11.6%) | 26 (22.0%) |
| $100,000 to $149,999 | 3 (2.7%) | 11 (9.3%) |
| $150,000 or more | 28 (25.0%) | 0 (0.0%) |
| Total | 112 (100.0%) | 118 (100.0%) |
Monthly Housing Cost Tiers in Hartland
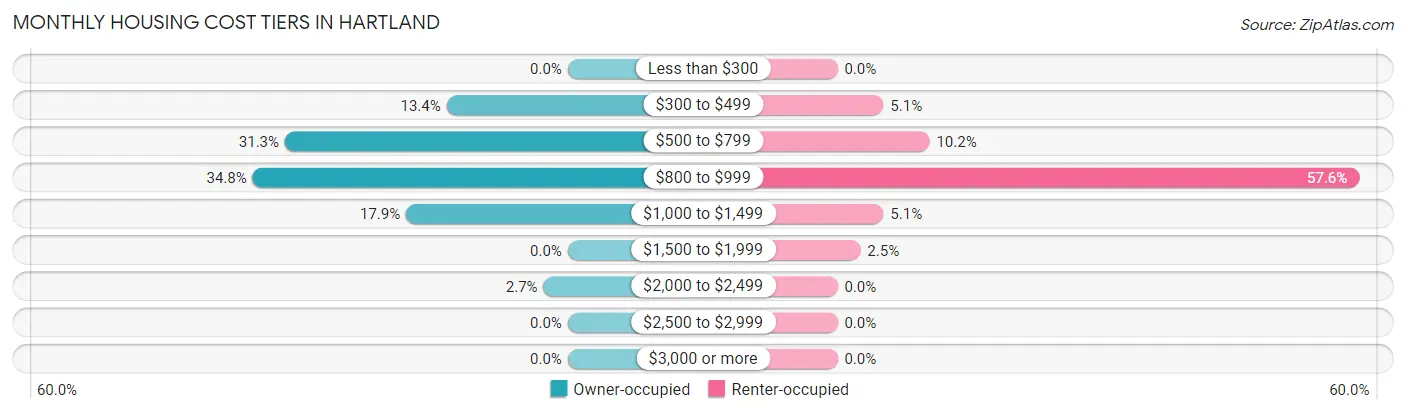
| Monthly Cost | Owner-occupied | Renter-occupied |
| Less than $300 | 0 (0.0%) | 0 (0.0%) |
| $300 to $499 | 15 (13.4%) | 6 (5.1%) |
| $500 to $799 | 35 (31.2%) | 12 (10.2%) |
| $800 to $999 | 39 (34.8%) | 68 (57.6%) |
| $1,000 to $1,499 | 20 (17.9%) | 6 (5.1%) |
| $1,500 to $1,999 | 0 (0.0%) | 3 (2.5%) |
| $2,000 to $2,499 | 3 (2.7%) | 0 (0.0%) |
| $2,500 to $2,999 | 0 (0.0%) | 0 (0.0%) |
| $3,000 or more | 0 (0.0%) | 0 (0.0%) |
| Total | 112 (100.0%) | 118 (100.0%) |
Physical Housing Characteristics in Hartland
Housing Structures in Hartland
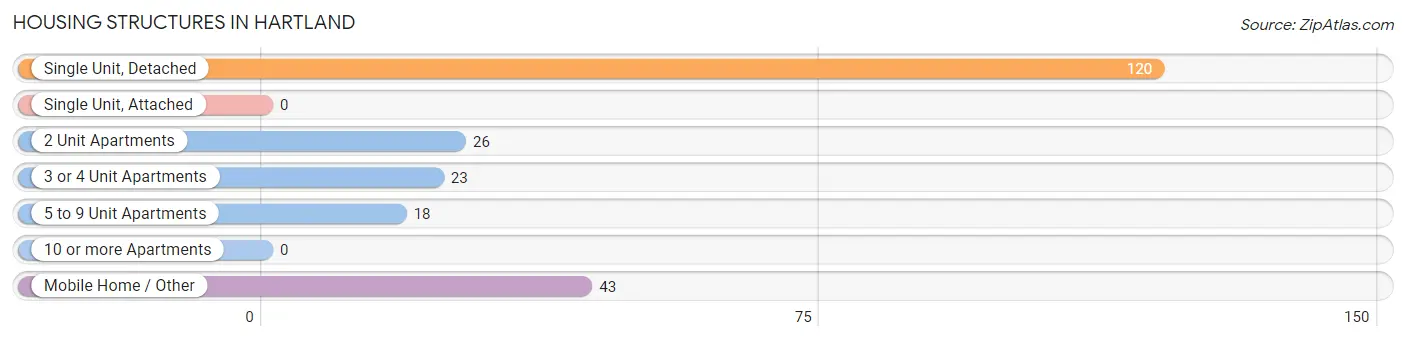
| Structure Type | # Housing Units | % Housing Units |
| Single Unit, Detached | 120 | 52.2% |
| Single Unit, Attached | 0 | 0.0% |
| 2 Unit Apartments | 26 | 11.3% |
| 3 or 4 Unit Apartments | 23 | 10.0% |
| 5 to 9 Unit Apartments | 18 | 7.8% |
| 10 or more Apartments | 0 | 0.0% |
| Mobile Home / Other | 43 | 18.7% |
| Total | 230 | 100.0% |
Housing Structures by Occupancy in Hartland
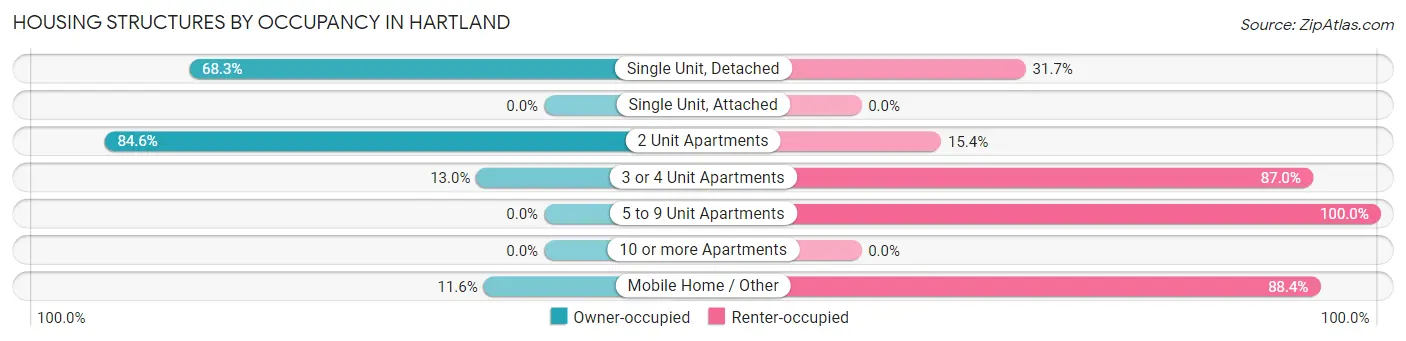
| Structure Type | Owner-occupied | Renter-occupied |
| Single Unit, Detached | 82 (68.3%) | 38 (31.7%) |
| Single Unit, Attached | 0 (0.0%) | 0 (0.0%) |
| 2 Unit Apartments | 22 (84.6%) | 4 (15.4%) |
| 3 or 4 Unit Apartments | 3 (13.0%) | 20 (87.0%) |
| 5 to 9 Unit Apartments | 0 (0.0%) | 18 (100.0%) |
| 10 or more Apartments | 0 (0.0%) | 0 (0.0%) |
| Mobile Home / Other | 5 (11.6%) | 38 (88.4%) |
| Total | 112 (48.7%) | 118 (51.3%) |
Housing Structures by Number of Rooms in Hartland
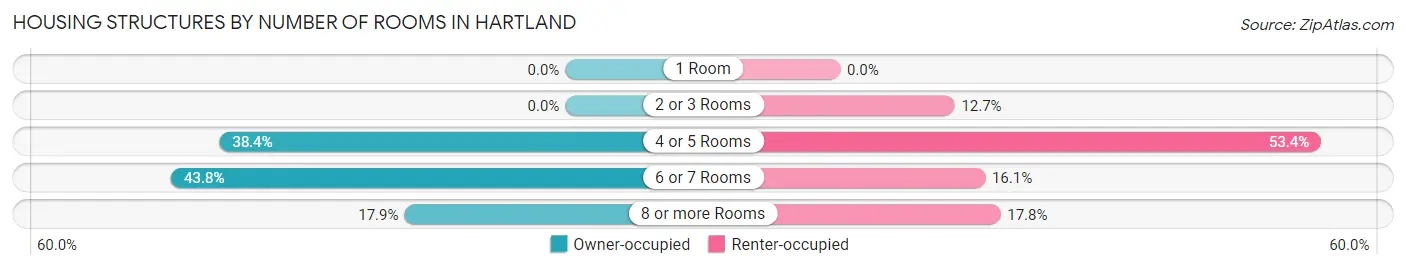
| Number of Rooms | Owner-occupied | Renter-occupied |
| 1 Room | 0 (0.0%) | 0 (0.0%) |
| 2 or 3 Rooms | 0 (0.0%) | 15 (12.7%) |
| 4 or 5 Rooms | 43 (38.4%) | 63 (53.4%) |
| 6 or 7 Rooms | 49 (43.8%) | 19 (16.1%) |
| 8 or more Rooms | 20 (17.9%) | 21 (17.8%) |
| Total | 112 (100.0%) | 118 (100.0%) |
Housing Structure by Heating Type in Hartland
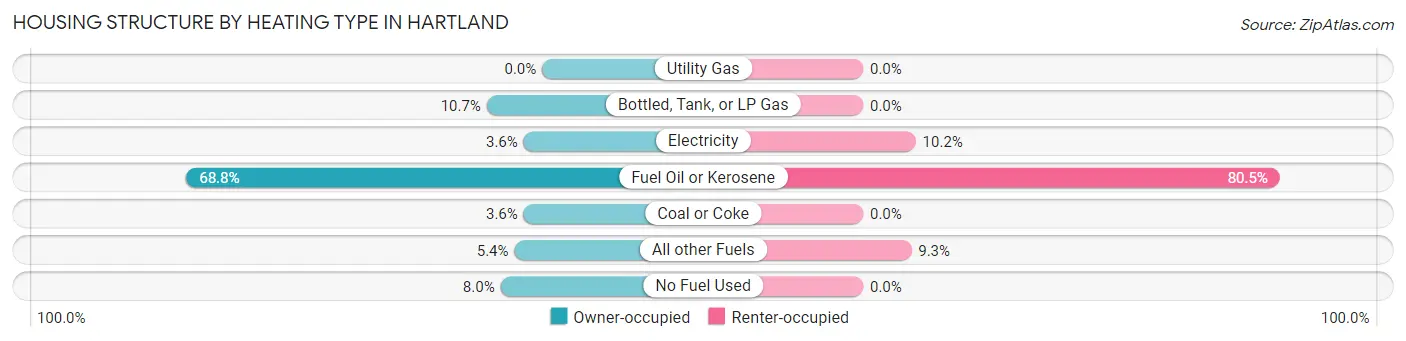
| Heating Type | Owner-occupied | Renter-occupied |
| Utility Gas | 0 (0.0%) | 0 (0.0%) |
| Bottled, Tank, or LP Gas | 12 (10.7%) | 0 (0.0%) |
| Electricity | 4 (3.6%) | 12 (10.2%) |
| Fuel Oil or Kerosene | 77 (68.8%) | 95 (80.5%) |
| Coal or Coke | 4 (3.6%) | 0 (0.0%) |
| All other Fuels | 6 (5.4%) | 11 (9.3%) |
| No Fuel Used | 9 (8.0%) | 0 (0.0%) |
| Total | 112 (100.0%) | 118 (100.0%) |
Household Vehicle Usage in Hartland
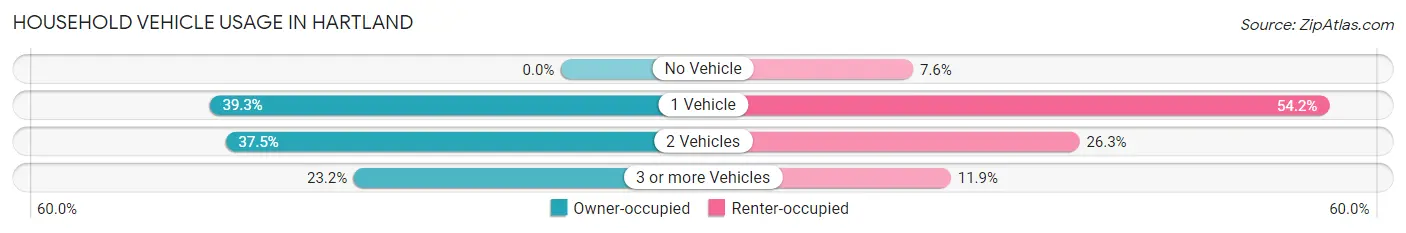
| Vehicles per Household | Owner-occupied | Renter-occupied |
| No Vehicle | 0 (0.0%) | 9 (7.6%) |
| 1 Vehicle | 44 (39.3%) | 64 (54.2%) |
| 2 Vehicles | 42 (37.5%) | 31 (26.3%) |
| 3 or more Vehicles | 26 (23.2%) | 14 (11.9%) |
| Total | 112 (100.0%) | 118 (100.0%) |
Real Estate & Mortgages in Hartland
Real Estate and Mortgage Overview in Hartland
| Characteristic | Without Mortgage | With Mortgage |
| Housing Units | 51 | 61 |
| Median Property Value | $76,300 | $108,900 |
| Median Household Income | - | - |
| Monthly Housing Costs | $555 | $0 |
| Real Estate Taxes | $1,304 | $0 |
Property Value by Mortgage Status in Hartland
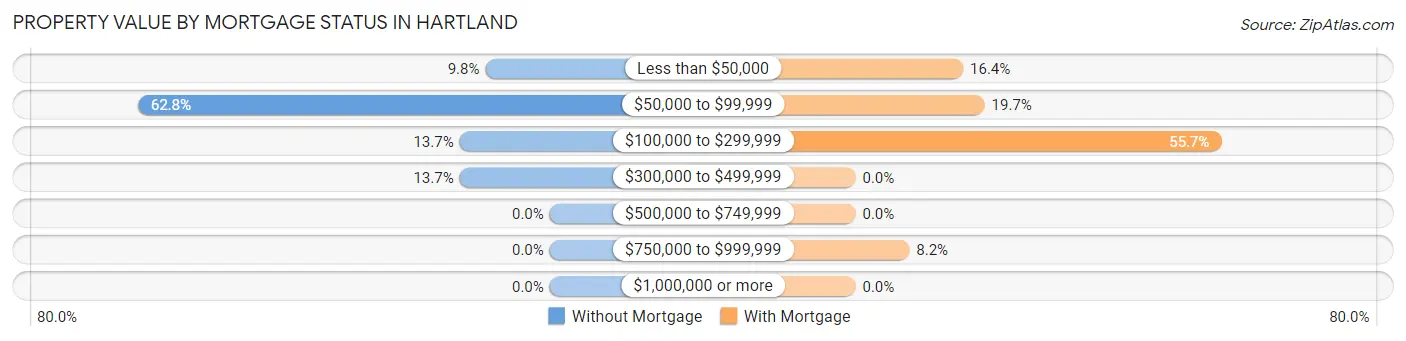
| Property Value | Without Mortgage | With Mortgage |
| Less than $50,000 | 5 (9.8%) | 10 (16.4%) |
| $50,000 to $99,999 | 32 (62.7%) | 12 (19.7%) |
| $100,000 to $299,999 | 7 (13.7%) | 34 (55.7%) |
| $300,000 to $499,999 | 7 (13.7%) | 0 (0.0%) |
| $500,000 to $749,999 | 0 (0.0%) | 0 (0.0%) |
| $750,000 to $999,999 | 0 (0.0%) | 5 (8.2%) |
| $1,000,000 or more | 0 (0.0%) | 0 (0.0%) |
| Total | 51 (100.0%) | 61 (100.0%) |
Household Income by Mortgage Status in Hartland
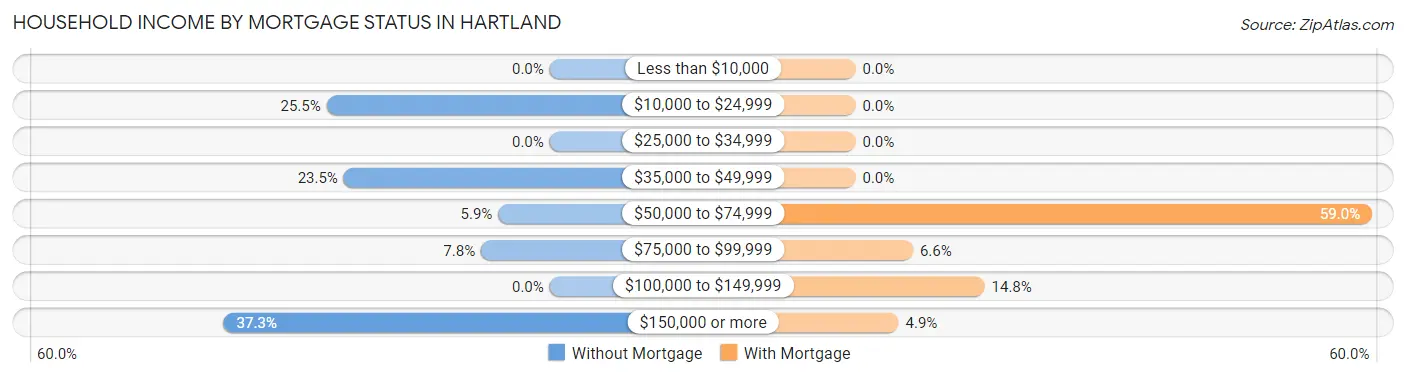
| Household Income | Without Mortgage | With Mortgage |
| Less than $10,000 | 0 (0.0%) | 0 (0.0%) |
| $10,000 to $24,999 | 13 (25.5%) | 0 (0.0%) |
| $25,000 to $34,999 | 0 (0.0%) | 0 (0.0%) |
| $35,000 to $49,999 | 12 (23.5%) | 0 (0.0%) |
| $50,000 to $74,999 | 3 (5.9%) | 36 (59.0%) |
| $75,000 to $99,999 | 4 (7.8%) | 4 (6.6%) |
| $100,000 to $149,999 | 0 (0.0%) | 9 (14.7%) |
| $150,000 or more | 19 (37.2%) | 3 (4.9%) |
| Total | 51 (100.0%) | 61 (100.0%) |
Property Value to Household Income Ratio in Hartland
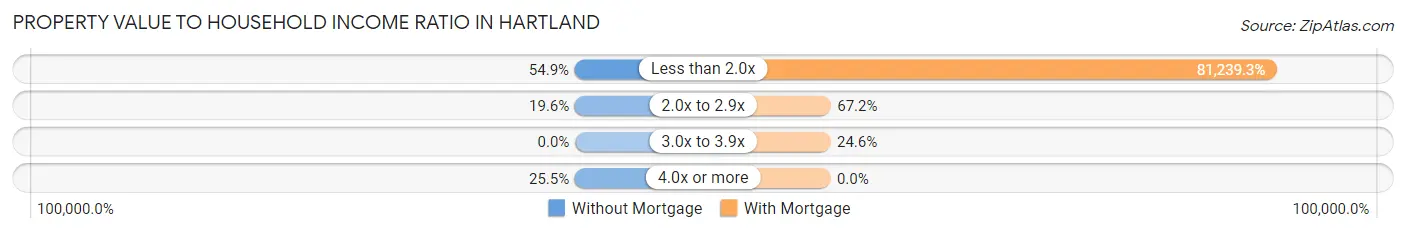
| Value-to-Income Ratio | Without Mortgage | With Mortgage |
| Less than 2.0x | 28 (54.9%) | 49,556 (81,239.3%) |
| 2.0x to 2.9x | 10 (19.6%) | 41 (67.2%) |
| 3.0x to 3.9x | 0 (0.0%) | 15 (24.6%) |
| 4.0x or more | 13 (25.5%) | 0 (0.0%) |
| Total | 51 (100.0%) | 61 (100.0%) |
Real Estate Taxes by Mortgage Status in Hartland
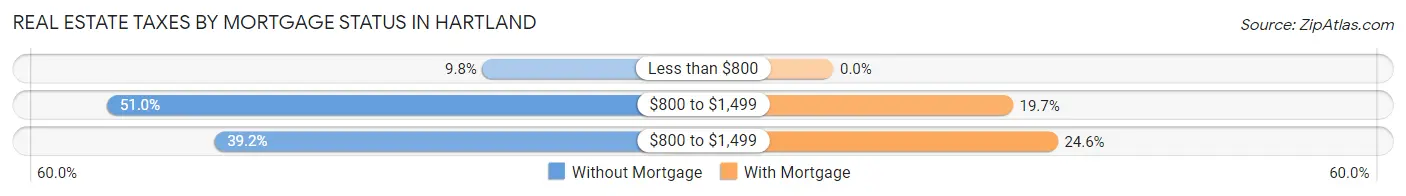
| Property Taxes | Without Mortgage | With Mortgage |
| Less than $800 | 5 (9.8%) | 0 (0.0%) |
| $800 to $1,499 | 26 (51.0%) | 12 (19.7%) |
| $800 to $1,499 | 20 (39.2%) | 15 (24.6%) |
| Total | 51 (100.0%) | 61 (100.0%) |
Health & Disability in Hartland
Health Insurance Coverage by Age in Hartland
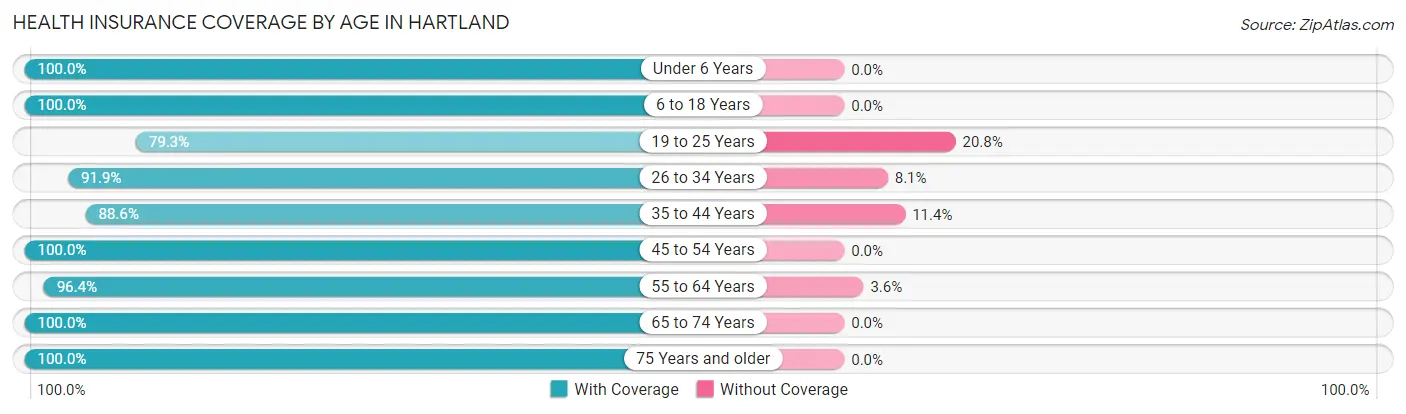
| Age Bracket | With Coverage | Without Coverage |
| Under 6 Years | 41 (100.0%) | 0 (0.0%) |
| 6 to 18 Years | 74 (100.0%) | 0 (0.0%) |
| 19 to 25 Years | 42 (79.2%) | 11 (20.7%) |
| 26 to 34 Years | 34 (91.9%) | 3 (8.1%) |
| 35 to 44 Years | 78 (88.6%) | 10 (11.4%) |
| 45 to 54 Years | 78 (100.0%) | 0 (0.0%) |
| 55 to 64 Years | 108 (96.4%) | 4 (3.6%) |
| 65 to 74 Years | 36 (100.0%) | 0 (0.0%) |
| 75 Years and older | 41 (100.0%) | 0 (0.0%) |
| Total | 532 (95.0%) | 28 (5.0%) |
Health Insurance Coverage by Citizenship Status in Hartland
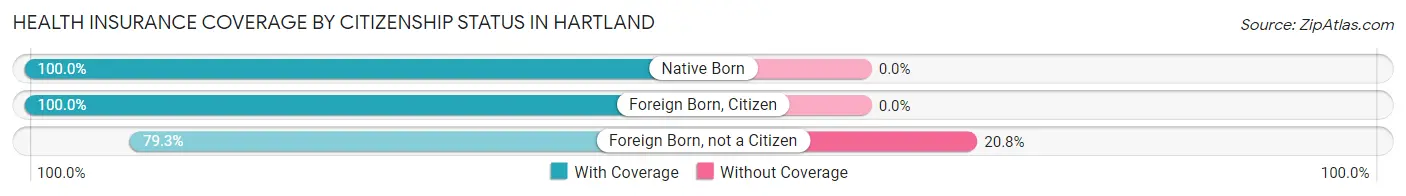
| Citizenship Status | With Coverage | Without Coverage |
| Native Born | 41 (100.0%) | 0 (0.0%) |
| Foreign Born, Citizen | 74 (100.0%) | 0 (0.0%) |
| Foreign Born, not a Citizen | 42 (79.2%) | 11 (20.7%) |
Health Insurance Coverage by Household Income in Hartland
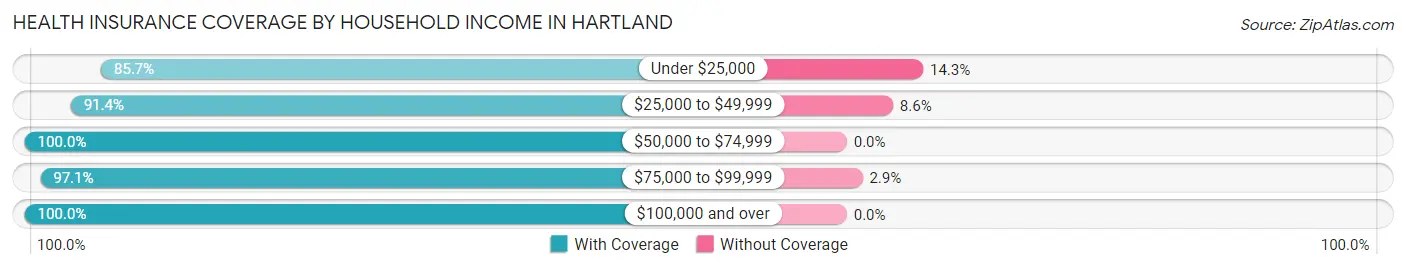
| Household Income | With Coverage | Without Coverage |
| Under $25,000 | 66 (85.7%) | 11 (14.3%) |
| $25,000 to $49,999 | 148 (91.4%) | 14 (8.6%) |
| $50,000 to $74,999 | 58 (100.0%) | 0 (0.0%) |
| $75,000 to $99,999 | 99 (97.1%) | 3 (2.9%) |
| $100,000 and over | 161 (100.0%) | 0 (0.0%) |
Public vs Private Health Insurance Coverage by Age in Hartland
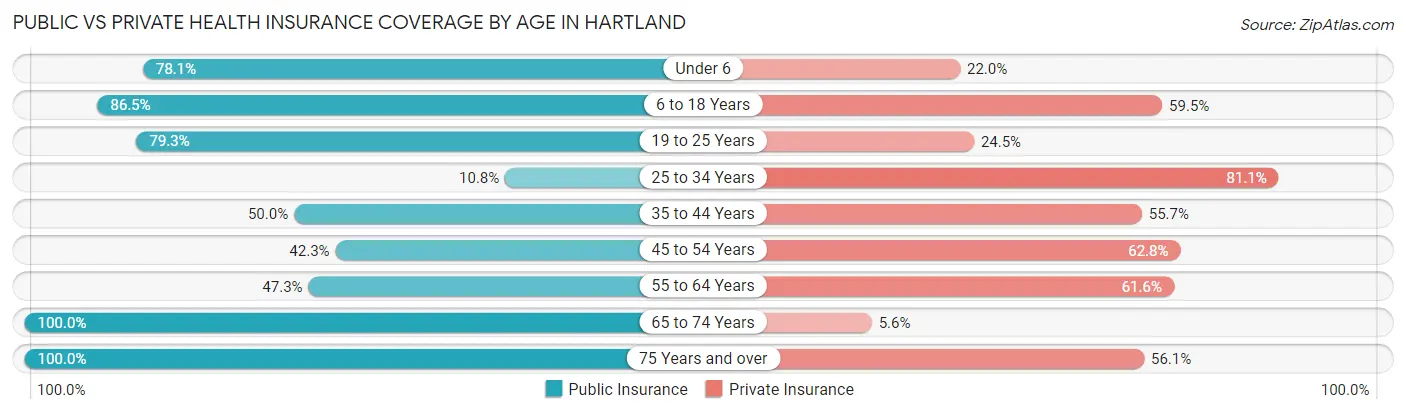
| Age Bracket | Public Insurance | Private Insurance |
| Under 6 | 32 (78.0%) | 9 (22.0%) |
| 6 to 18 Years | 64 (86.5%) | 44 (59.5%) |
| 19 to 25 Years | 42 (79.2%) | 13 (24.5%) |
| 25 to 34 Years | 4 (10.8%) | 30 (81.1%) |
| 35 to 44 Years | 44 (50.0%) | 49 (55.7%) |
| 45 to 54 Years | 33 (42.3%) | 49 (62.8%) |
| 55 to 64 Years | 53 (47.3%) | 69 (61.6%) |
| 65 to 74 Years | 36 (100.0%) | 2 (5.6%) |
| 75 Years and over | 41 (100.0%) | 23 (56.1%) |
| Total | 349 (62.3%) | 288 (51.4%) |
Disability Status by Sex by Age in Hartland
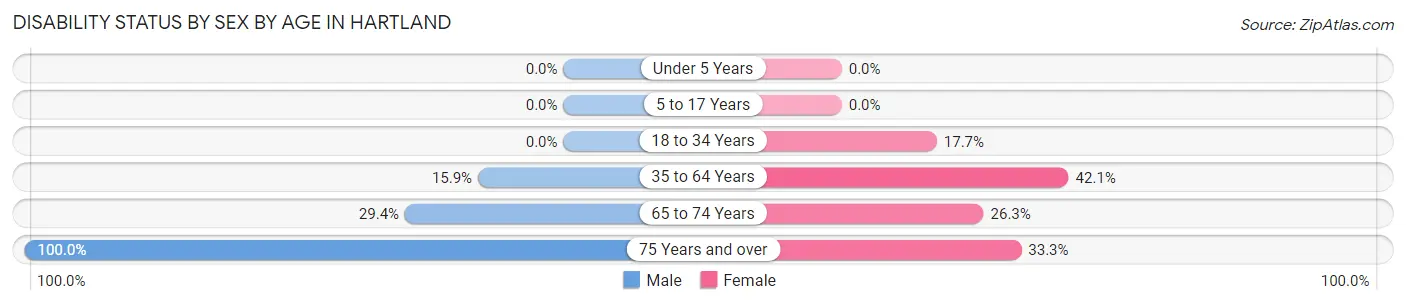
| Age Bracket | Male | Female |
| Under 5 Years | 0 (0.0%) | 0 (0.0%) |
| 5 to 17 Years | 0 (0.0%) | 0 (0.0%) |
| 18 to 34 Years | 0 (0.0%) | 9 (17.6%) |
| 35 to 64 Years | 26 (15.9%) | 48 (42.1%) |
| 65 to 74 Years | 5 (29.4%) | 5 (26.3%) |
| 75 Years and over | 14 (100.0%) | 9 (33.3%) |
Disability Class by Sex by Age in Hartland
Disability Class: Hearing Difficulty
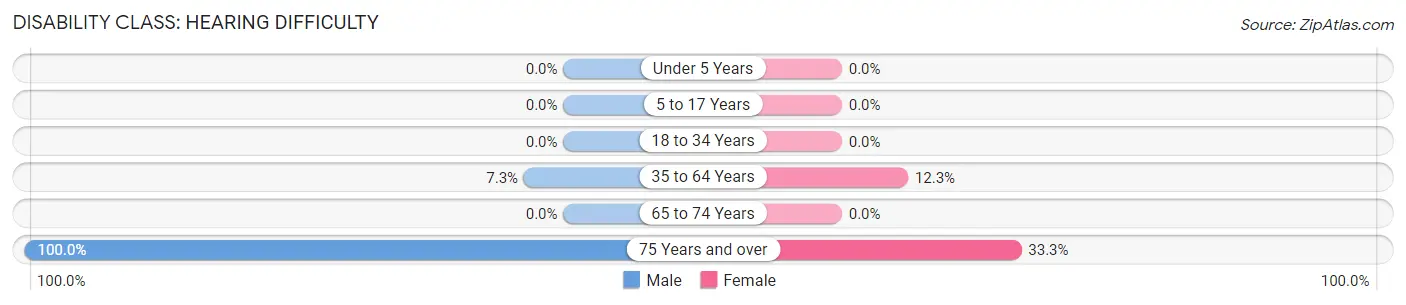
| Age Bracket | Male | Female |
| Under 5 Years | 0 (0.0%) | 0 (0.0%) |
| 5 to 17 Years | 0 (0.0%) | 0 (0.0%) |
| 18 to 34 Years | 0 (0.0%) | 0 (0.0%) |
| 35 to 64 Years | 12 (7.3%) | 14 (12.3%) |
| 65 to 74 Years | 0 (0.0%) | 0 (0.0%) |
| 75 Years and over | 14 (100.0%) | 9 (33.3%) |
Disability Class: Vision Difficulty
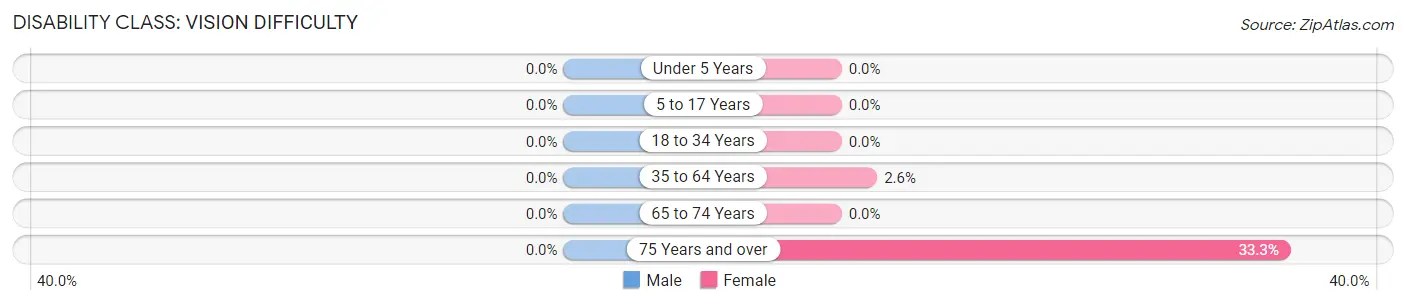
| Age Bracket | Male | Female |
| Under 5 Years | 0 (0.0%) | 0 (0.0%) |
| 5 to 17 Years | 0 (0.0%) | 0 (0.0%) |
| 18 to 34 Years | 0 (0.0%) | 0 (0.0%) |
| 35 to 64 Years | 0 (0.0%) | 3 (2.6%) |
| 65 to 74 Years | 0 (0.0%) | 0 (0.0%) |
| 75 Years and over | 0 (0.0%) | 9 (33.3%) |
Disability Class: Cognitive Difficulty
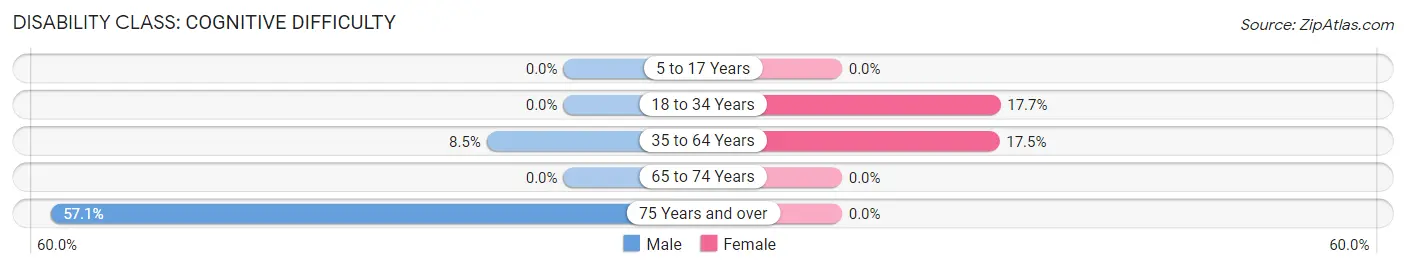
| Age Bracket | Male | Female |
| 5 to 17 Years | 0 (0.0%) | 0 (0.0%) |
| 18 to 34 Years | 0 (0.0%) | 9 (17.6%) |
| 35 to 64 Years | 14 (8.5%) | 20 (17.5%) |
| 65 to 74 Years | 0 (0.0%) | 0 (0.0%) |
| 75 Years and over | 8 (57.1%) | 0 (0.0%) |
Disability Class: Ambulatory Difficulty
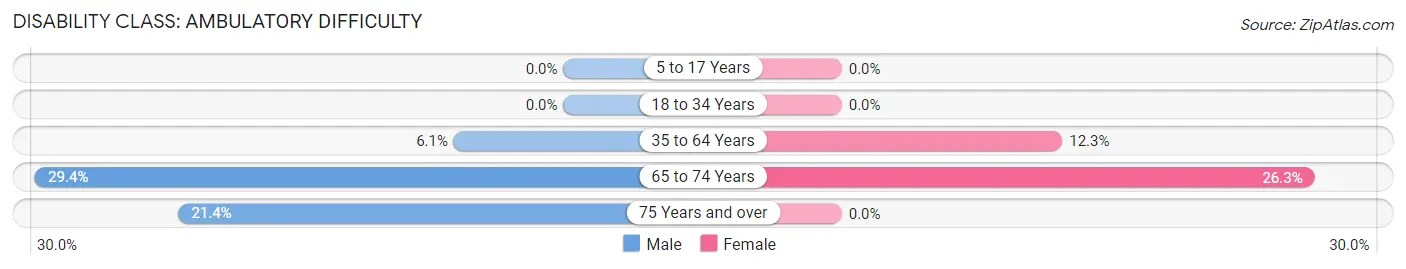
| Age Bracket | Male | Female |
| 5 to 17 Years | 0 (0.0%) | 0 (0.0%) |
| 18 to 34 Years | 0 (0.0%) | 0 (0.0%) |
| 35 to 64 Years | 10 (6.1%) | 14 (12.3%) |
| 65 to 74 Years | 5 (29.4%) | 5 (26.3%) |
| 75 Years and over | 3 (21.4%) | 0 (0.0%) |
Disability Class: Self-Care Difficulty
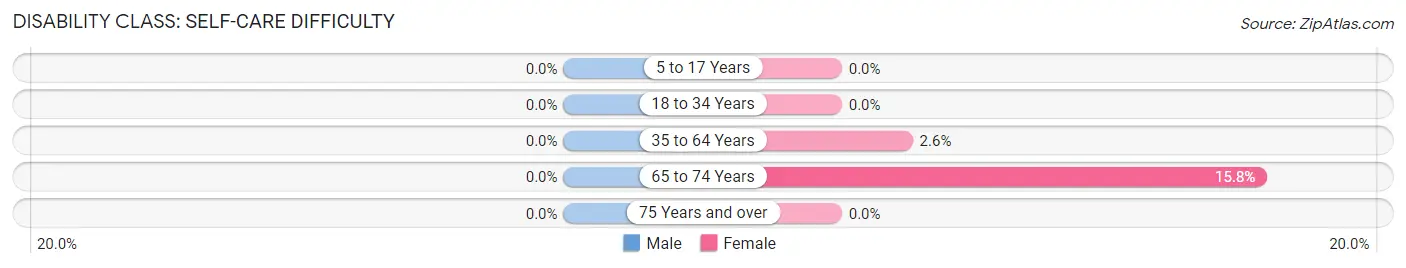
| Age Bracket | Male | Female |
| 5 to 17 Years | 0 (0.0%) | 0 (0.0%) |
| 18 to 34 Years | 0 (0.0%) | 0 (0.0%) |
| 35 to 64 Years | 0 (0.0%) | 3 (2.6%) |
| 65 to 74 Years | 0 (0.0%) | 3 (15.8%) |
| 75 Years and over | 0 (0.0%) | 0 (0.0%) |
Technology Access in Hartland
Computing Device Access in Hartland
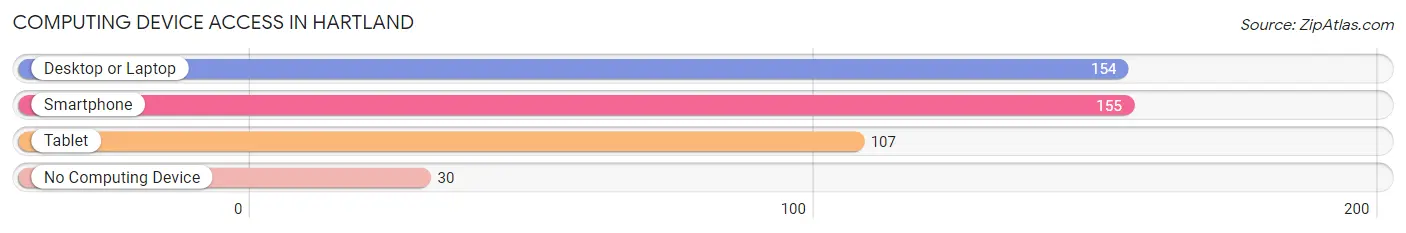
| Device Type | # Households | % Households |
| Desktop or Laptop | 154 | 67.0% |
| Smartphone | 155 | 67.4% |
| Tablet | 107 | 46.5% |
| No Computing Device | 30 | 13.0% |
| Total | 230 | 100.0% |
Internet Access in Hartland
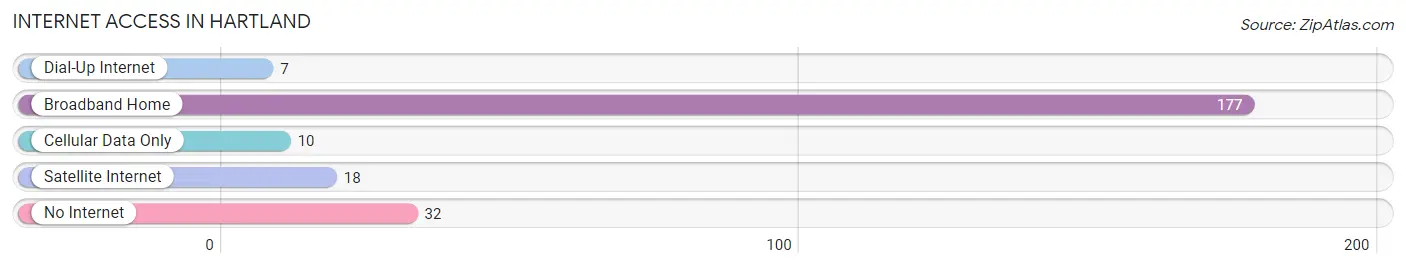
| Internet Type | # Households | % Households |
| Dial-Up Internet | 7 | 3.0% |
| Broadband Home | 177 | 77.0% |
| Cellular Data Only | 10 | 4.3% |
| Satellite Internet | 18 | 7.8% |
| No Internet | 32 | 13.9% |
| Total | 230 | 100.0% |
Hartland Summary
Hartland, Maine is a small town located in the western part of the state, in the foothills of the White Mountains. It is situated on the banks of the Androscoggin River, and is part of the Oxford County. The town was first settled in 1790, and was incorporated in 1820. The population of Hartland in 2000 was 1,845.
Geography
Hartland is located in western Maine, in the foothills of the White Mountains. It is situated on the banks of the Androscoggin River, and is part of the Oxford County. The town is bordered by the towns of Sumner to the north, Woodstock to the east, and Hebron to the south. The town covers an area of approximately 25 square miles, and is located at an elevation of about 1,000 feet.
The terrain of Hartland is mostly hilly, with some flat areas along the river. The town is mostly forested, with some open fields and pastures. The climate is typical of the region, with cold winters and warm summers.
Economy
The economy of Hartland is largely based on agriculture and forestry. The town is home to several small farms, which produce a variety of crops, including potatoes, corn, and hay. The town also has several sawmills, which produce lumber for the local market.
In addition to agriculture and forestry, Hartland also has a small tourism industry. The town is home to several small inns and bed and breakfasts, which attract visitors from all over the region. The town also has several small shops and restaurants, which cater to tourists and locals alike.
Demographics
The population of Hartland in 2000 was 1,845. The town is predominantly white, with a small minority population. The median household income in 2000 was $35,000, and the median home value was $90,000.
The town is served by the Hartland School District, which consists of one elementary school, one middle school, and one high school. The town also has a public library, and several churches.
Conclusion
Hartland, Maine is a small town located in the western part of the state, in the foothills of the White Mountains. It is situated on the banks of the Androscoggin River, and is part of the Oxford County. The town was first settled in 1790, and was incorporated in 1820. The population of Hartland in 2000 was 1,845. The economy of Hartland is largely based on agriculture and forestry, and the town also has a small tourism industry. The town is predominantly white, with a small minority population. The median household income in 2000 was $35,000, and the median home value was $90,000. Hartland is served by the Hartland School District, and has a public library and several churches.
Common Questions
What is Per Capita Income in Hartland?
Per Capita income in Hartland is $28,007.
What is the Median Family Income in Hartland?
Median Family Income in Hartland is $58,889.
What is the Median Household income in Hartland?
Median Household Income in Hartland is $49,521.
What is Income or Wage Gap in Hartland?
Income or Wage Gap in Hartland is 6.2%.
Women in Hartland earn 93.8 cents for every dollar earned by a man.
What is Inequality or Gini Index in Hartland?
Inequality or Gini Index in Hartland is 0.45.
What is the Total Population of Hartland?
Total Population of Hartland is 603.
What is the Total Male Population of Hartland?
Total Male Population of Hartland is 273.
What is the Total Female Population of Hartland?
Total Female Population of Hartland is 330.
What is the Ratio of Males per 100 Females in Hartland?
There are 82.73 Males per 100 Females in Hartland.
What is the Ratio of Females per 100 Males in Hartland?
There are 120.88 Females per 100 Males in Hartland.
What is the Median Population Age in Hartland?
Median Population Age in Hartland is 48.5 Years.
What is the Average Family Size in Hartland
Average Family Size in Hartland is 2.8 People.
What is the Average Household Size in Hartland
Average Household Size in Hartland is 2.4 People.
How Large is the Labor Force in Hartland?
There are 272 People in the Labor Forcein in Hartland.
What is the Percentage of People in the Labor Force in Hartland?
51.8% of People are in the Labor Force in Hartland.
What is the Unemployment Rate in Hartland?
Unemployment Rate in Hartland is 2.6%.