Ashland, ME Map & Demographics
Ashland Map
Ashland Overview
$27,402
PER CAPITA INCOME
$83,611
AVG FAMILY INCOME
60.0%
WAGE / INCOME GAP [ % ]
40.0¢/ $1
WAGE / INCOME GAP [ $ ]
0.50
INEQUALITY / GINI INDEX
663
TOTAL POPULATION
294
MALE POPULATION
369
FEMALE POPULATION
79.67
MALES / 100 FEMALES
125.51
FEMALES / 100 MALES
50.1
MEDIAN AGE
2.6
AVG FAMILY SIZE
1.9
AVG HOUSEHOLD SIZE
275
LABOR FORCE [ PEOPLE ]
46.9%
PERCENT IN LABOR FORCE
Ashland Zip Codes
Ashland Area Codes
Income in Ashland
Income Overview in Ashland
| Characteristic | Number | Measure |
| Per Capita Income | 663 | $27,402 |
| Median Family Income | 174 | $83,611 |
| Mean Family Income | 174 | $83,783 |
| Median Household Income | 351 | $0 |
| Mean Household Income | 351 | $51,308 |
| Income Deficit | 174 | $0 |
| Wage / Income Gap (%) | 663 | 60.04% |
| Wage / Income Gap ($) | 663 | 39.96¢ per $1 |
| Gini / Inequality Index | 663 | 0.50 |
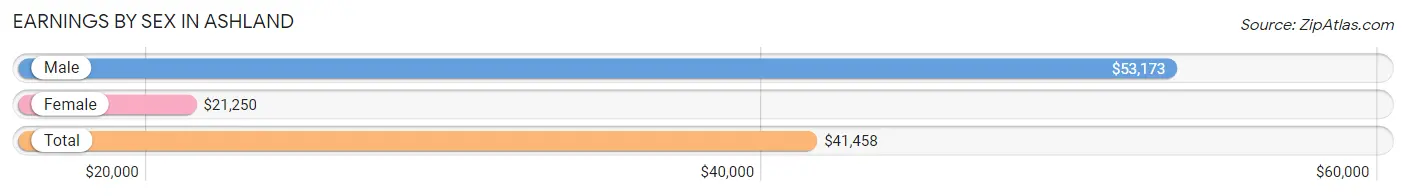
Earnings by Sex in Ashland
Average Earnings in Ashland are $41,458, $53,173 for men and $21,250 for women, a difference of 60.0%.
| Sex | Number | Average Earnings |
| Male | 177 (60.8%) | $53,173 |
| Female | 114 (39.2%) | $21,250 |
| Total | 291 (100.0%) | $41,458 |
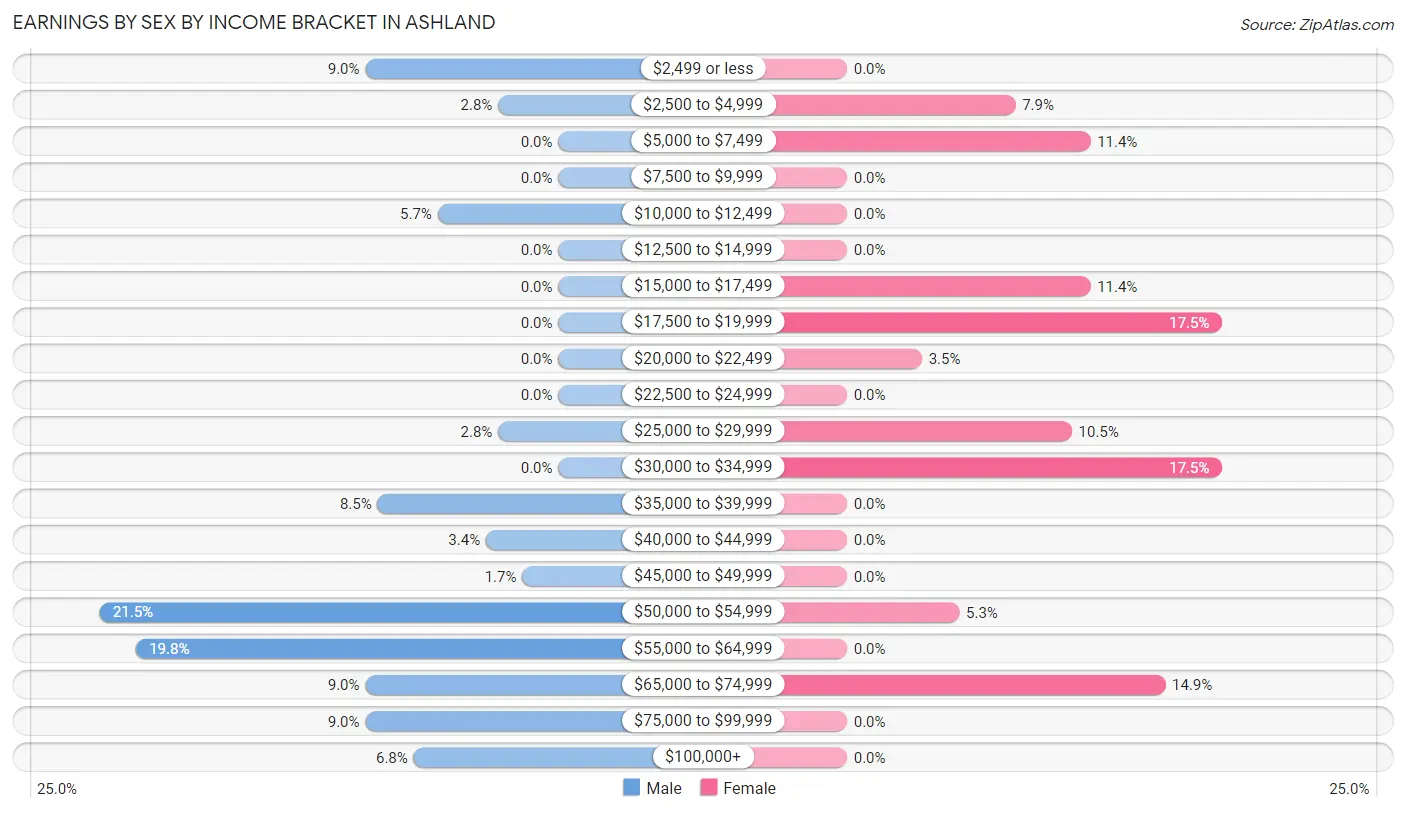
Earnings by Sex by Income Bracket in Ashland
The most common earnings brackets in Ashland are $50,000 to $54,999 for men (38 | 21.5%) and $17,500 to $19,999 for women (20 | 17.5%).
| Income | Male | Female |
| $2,499 or less | 16 (9.0%) | 0 (0.0%) |
| $2,500 to $4,999 | 5 (2.8%) | 9 (7.9%) |
| $5,000 to $7,499 | 0 (0.0%) | 13 (11.4%) |
| $7,500 to $9,999 | 0 (0.0%) | 0 (0.0%) |
| $10,000 to $12,499 | 10 (5.7%) | 0 (0.0%) |
| $12,500 to $14,999 | 0 (0.0%) | 0 (0.0%) |
| $15,000 to $17,499 | 0 (0.0%) | 13 (11.4%) |
| $17,500 to $19,999 | 0 (0.0%) | 20 (17.5%) |
| $20,000 to $22,499 | 0 (0.0%) | 4 (3.5%) |
| $22,500 to $24,999 | 0 (0.0%) | 0 (0.0%) |
| $25,000 to $29,999 | 5 (2.8%) | 12 (10.5%) |
| $30,000 to $34,999 | 0 (0.0%) | 20 (17.5%) |
| $35,000 to $39,999 | 15 (8.5%) | 0 (0.0%) |
| $40,000 to $44,999 | 6 (3.4%) | 0 (0.0%) |
| $45,000 to $49,999 | 3 (1.7%) | 0 (0.0%) |
| $50,000 to $54,999 | 38 (21.5%) | 6 (5.3%) |
| $55,000 to $64,999 | 35 (19.8%) | 0 (0.0%) |
| $65,000 to $74,999 | 16 (9.0%) | 17 (14.9%) |
| $75,000 to $99,999 | 16 (9.0%) | 0 (0.0%) |
| $100,000+ | 12 (6.8%) | 0 (0.0%) |
| Total | 177 (100.0%) | 114 (100.0%) |
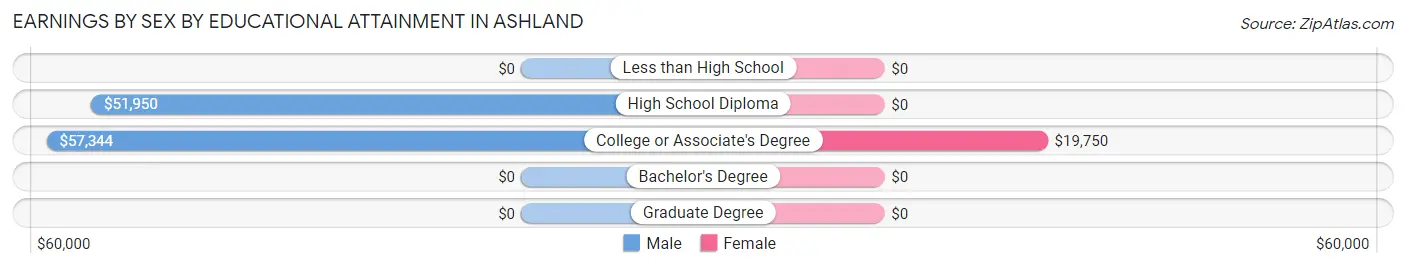
Earnings by Sex by Educational Attainment in Ashland
Average earnings in Ashland are $54,423 for men and $28,438 for women, a difference of 47.7%. Men with an educational attainment of college or associate's degree enjoy the highest average annual earnings of $57,344, while those with high school diploma education earn the least with $51,950. Women with an educational attainment of college or associate's degree earn the most with the average annual earnings of $19,750, while those with college or associate's degree education have the smallest earnings of $19,750.
| Educational Attainment | Male Income | Female Income |
| Less than High School | - | - |
| High School Diploma | $51,950 | $0 |
| College or Associate's Degree | $57,344 | $19,750 |
| Bachelor's Degree | - | - |
| Graduate Degree | - | - |
| Total | $54,423 | $28,438 |
Family Income in Ashland
Family Income Brackets in Ashland
According to the Ashland family income data, there are 61 families falling into the $100,000 to $149,999 income range, which is the most common income bracket and makes up 35.1% of all families.
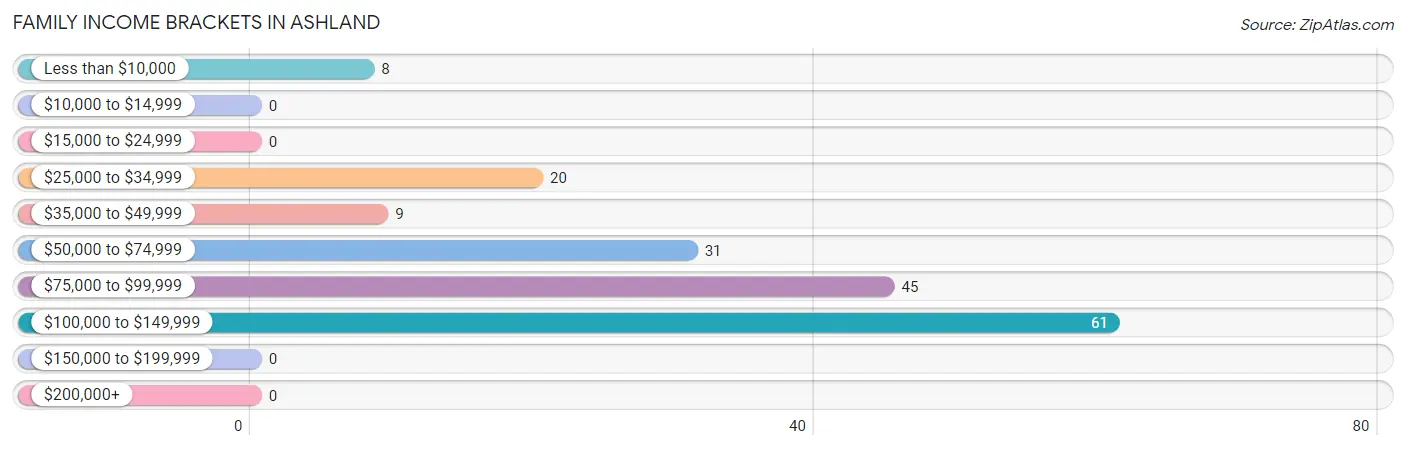
| Income Bracket | # Families | % Families |
| Less than $10,000 | 8 | 4.6% |
| $10,000 to $14,999 | 0 | 0.0% |
| $15,000 to $24,999 | 0 | 0.0% |
| $25,000 to $34,999 | 20 | 11.5% |
| $35,000 to $49,999 | 9 | 5.2% |
| $50,000 to $74,999 | 31 | 17.8% |
| $75,000 to $99,999 | 45 | 25.9% |
| $100,000 to $149,999 | 61 | 35.1% |
| $150,000 to $199,999 | 0 | 0.0% |
| $200,000+ | 0 | 0.0% |
Family Income by Famaliy Size in Ashland
2-person families (117 | 67.2%) account for the highest median family income in Ashland with $81,354 per family, while 2-person families (117 | 67.2%) have the highest median income of $40,677 per family member.
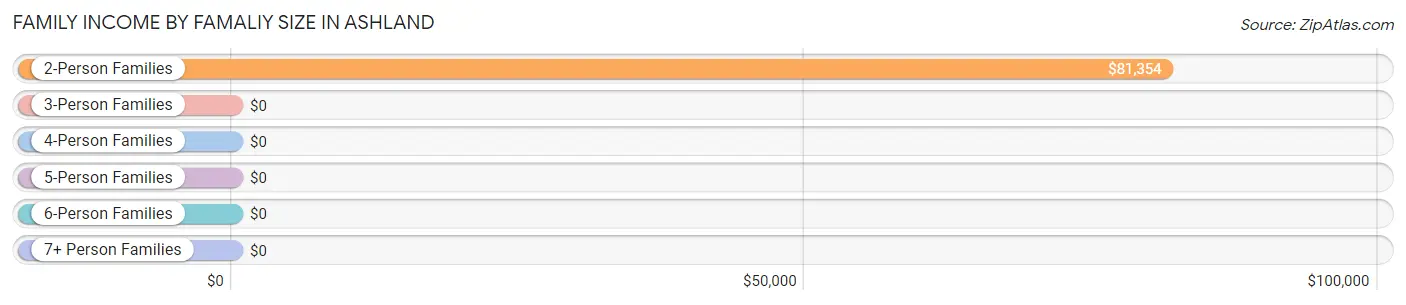
| Income Bracket | # Families | Median Income |
| 2-Person Families | 117 (67.2%) | $81,354 |
| 3-Person Families | 19 (10.9%) | $0 |
| 4-Person Families | 18 (10.3%) | $0 |
| 5-Person Families | 15 (8.6%) | $0 |
| 6-Person Families | 5 (2.9%) | $0 |
| 7+ Person Families | 0 (0.0%) | $0 |
| Total | 174 (100.0%) | $83,611 |
Family Income by Number of Earners in Ashland
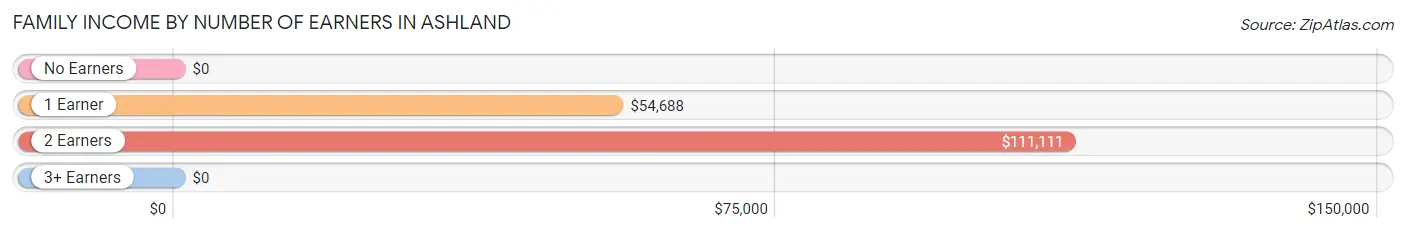
| Number of Earners | # Families | Median Income |
| No Earners | 43 (24.7%) | $0 |
| 1 Earner | 61 (35.1%) | $54,688 |
| 2 Earners | 52 (29.9%) | $111,111 |
| 3+ Earners | 18 (10.3%) | $0 |
| Total | 174 (100.0%) | $83,611 |
Household Income in Ashland
Household Income Brackets in Ashland
With 84 households falling in the category, the $10,000 to $14,999 income range is the most frequent in Ashland, accounting for 23.9% of all households.
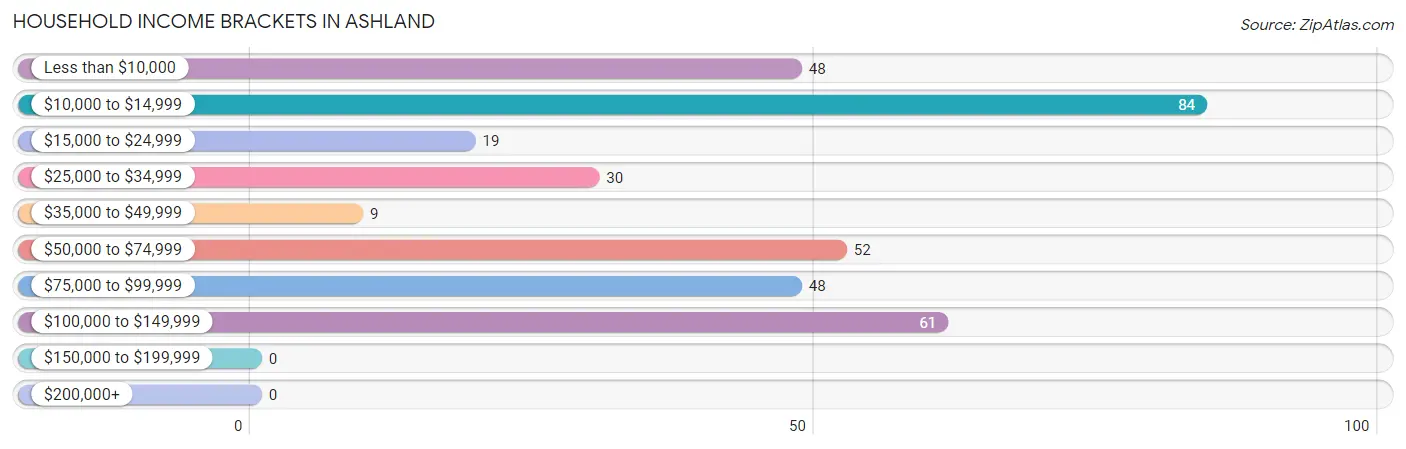
| Income Bracket | # Households | % Households |
| Less than $10,000 | 48 | 13.7% |
| $10,000 to $14,999 | 84 | 23.9% |
| $15,000 to $24,999 | 19 | 5.4% |
| $25,000 to $34,999 | 30 | 8.5% |
| $35,000 to $49,999 | 9 | 2.6% |
| $50,000 to $74,999 | 52 | 14.8% |
| $75,000 to $99,999 | 48 | 13.7% |
| $100,000 to $149,999 | 61 | 17.4% |
| $150,000 to $199,999 | 0 | 0.0% |
| $200,000+ | 0 | 0.0% |
Household Income by Householder Age in Ashland
The median household income in Ashland is $0, with the highest median household income of $81,354 found in the 45 to 64 years age bracket for the primary householder. A total of 93 households (26.5%) fall into this category.
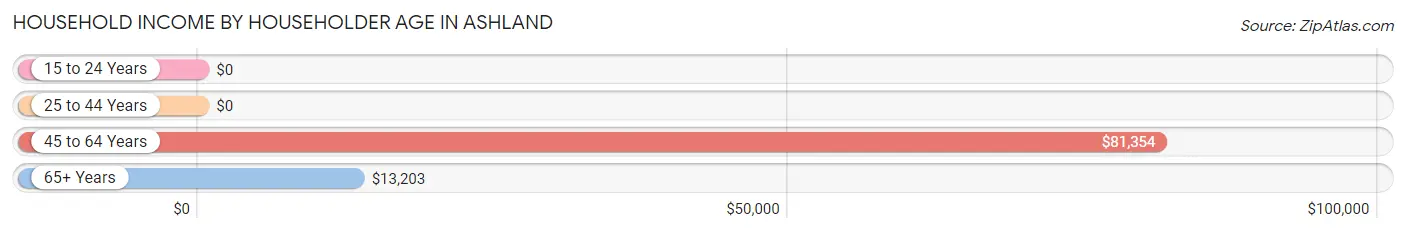
| Income Bracket | # Households | Median Income |
| 15 to 24 Years | 0 (0.0%) | $0 |
| 25 to 44 Years | 83 (23.6%) | $0 |
| 45 to 64 Years | 93 (26.5%) | $81,354 |
| 65+ Years | 175 (49.9%) | $13,203 |
| Total | 351 (100.0%) | $0 |
Poverty in Ashland
Income Below Poverty by Sex and Age in Ashland
With 1.7% poverty level for males and 35.8% for females among the residents of Ashland, 6 to 11 year old males and 75 year old and over females are the most vulnerable to poverty, with 5 males (62.5%) and 99 females (97.1%) in their respective age groups living below the poverty level.
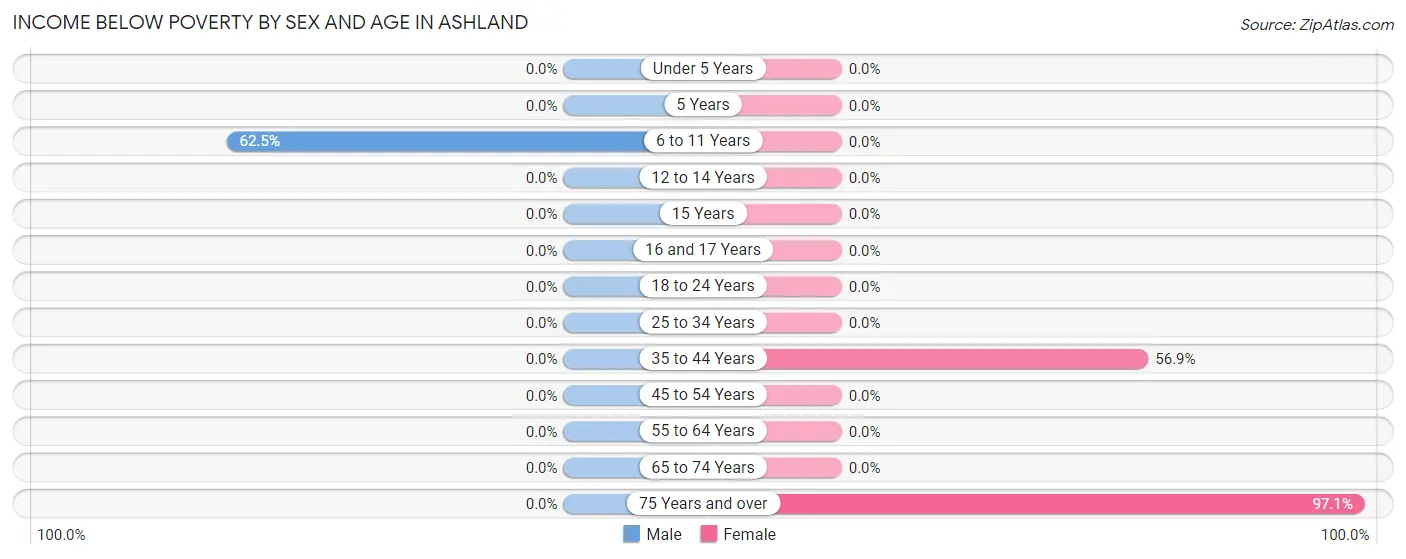
| Age Bracket | Male | Female |
| Under 5 Years | 0 (0.0%) | 0 (0.0%) |
| 5 Years | 0 (0.0%) | 0 (0.0%) |
| 6 to 11 Years | 5 (62.5%) | 0 (0.0%) |
| 12 to 14 Years | 0 (0.0%) | 0 (0.0%) |
| 15 Years | 0 (0.0%) | 0 (0.0%) |
| 16 and 17 Years | 0 (0.0%) | 0 (0.0%) |
| 18 to 24 Years | 0 (0.0%) | 0 (0.0%) |
| 25 to 34 Years | 0 (0.0%) | 0 (0.0%) |
| 35 to 44 Years | 0 (0.0%) | 33 (56.9%) |
| 45 to 54 Years | 0 (0.0%) | 0 (0.0%) |
| 55 to 64 Years | 0 (0.0%) | 0 (0.0%) |
| 65 to 74 Years | 0 (0.0%) | 0 (0.0%) |
| 75 Years and over | 0 (0.0%) | 99 (97.1%) |
| Total | 5 (1.7%) | 132 (35.8%) |
Income Above Poverty by Sex and Age in Ashland
According to the poverty statistics in Ashland, males aged under 5 years and females aged under 5 years are the age groups that are most secure financially, with 100.0% of males and 100.0% of females in these age groups living above the poverty line.
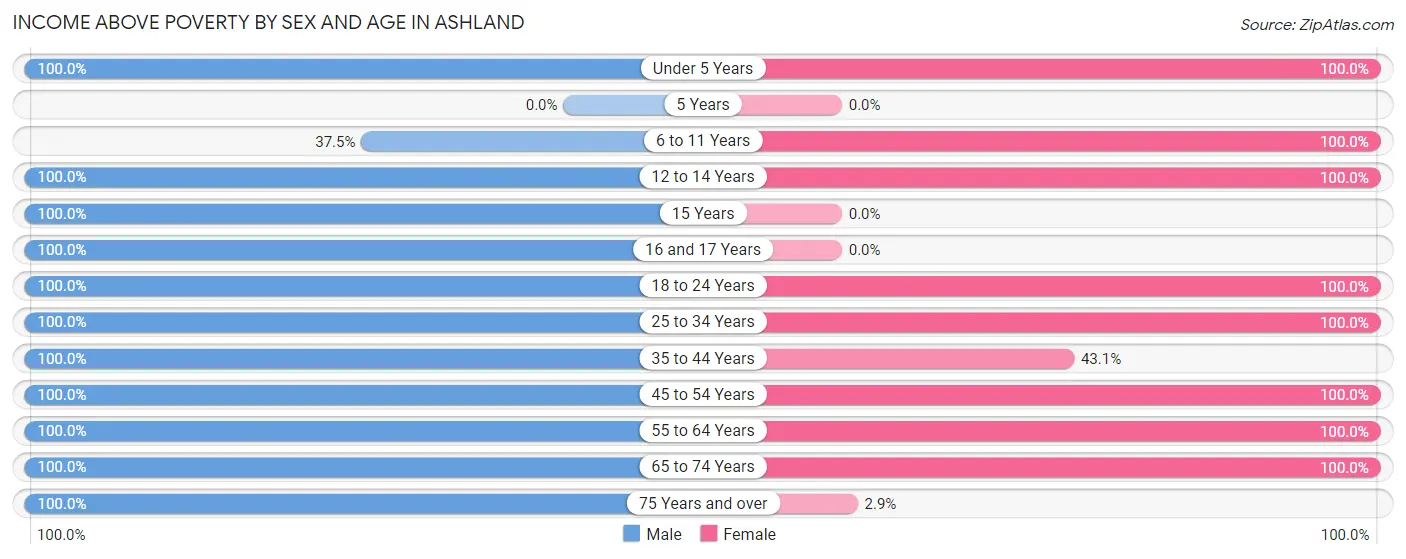
| Age Bracket | Male | Female |
| Under 5 Years | 3 (100.0%) | 3 (100.0%) |
| 5 Years | 0 (0.0%) | 0 (0.0%) |
| 6 to 11 Years | 3 (37.5%) | 18 (100.0%) |
| 12 to 14 Years | 25 (100.0%) | 8 (100.0%) |
| 15 Years | 12 (100.0%) | 0 (0.0%) |
| 16 and 17 Years | 25 (100.0%) | 0 (0.0%) |
| 18 to 24 Years | 27 (100.0%) | 13 (100.0%) |
| 25 to 34 Years | 16 (100.0%) | 21 (100.0%) |
| 35 to 44 Years | 34 (100.0%) | 25 (43.1%) |
| 45 to 54 Years | 50 (100.0%) | 33 (100.0%) |
| 55 to 64 Years | 43 (100.0%) | 40 (100.0%) |
| 65 to 74 Years | 22 (100.0%) | 73 (100.0%) |
| 75 Years and over | 29 (100.0%) | 3 (2.9%) |
| Total | 289 (98.3%) | 237 (64.2%) |
Income Below Poverty Among Married-Couple Families in Ashland
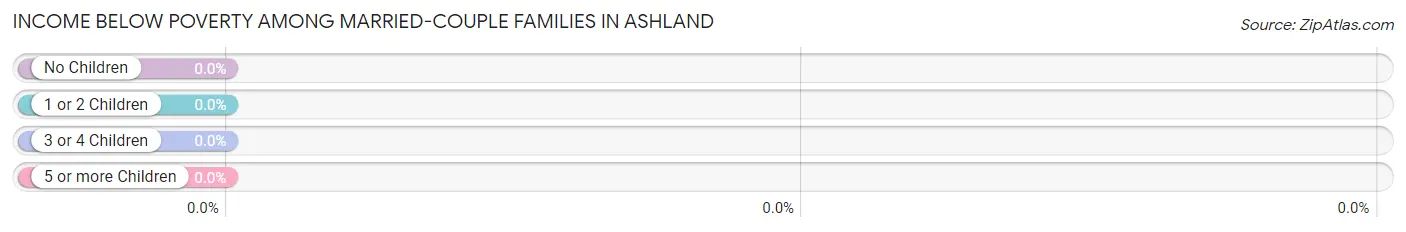
| Children | Above Poverty | Below Poverty |
| No Children | 97 (100.0%) | 0 (0.0%) |
| 1 or 2 Children | 20 (100.0%) | 0 (0.0%) |
| 3 or 4 Children | 20 (100.0%) | 0 (0.0%) |
| 5 or more Children | 0 (0.0%) | 0 (0.0%) |
| Total | 137 (100.0%) | 0 (0.0%) |
Income Below Poverty Among Single-Parent Households in Ashland
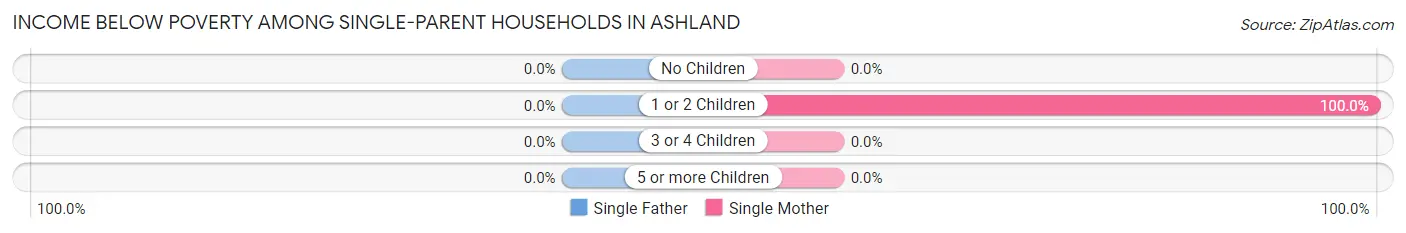
| Children | Single Father | Single Mother |
| No Children | 0 (0.0%) | 0 (0.0%) |
| 1 or 2 Children | 0 (0.0%) | 8 (100.0%) |
| 3 or 4 Children | 0 (0.0%) | 0 (0.0%) |
| 5 or more Children | 0 (0.0%) | 0 (0.0%) |
| Total | 0 (0.0%) | 8 (100.0%) |
Income Below Poverty Among Married-Couple vs Single-Parent Households in Ashland
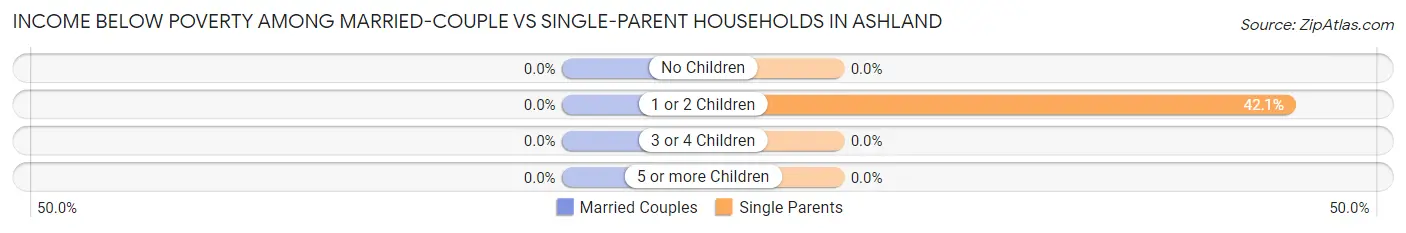
| Children | Married-Couple Families | Single-Parent Households |
| No Children | 0 (0.0%) | 0 (0.0%) |
| 1 or 2 Children | 0 (0.0%) | 8 (42.1%) |
| 3 or 4 Children | 0 (0.0%) | 0 (0.0%) |
| 5 or more Children | 0 (0.0%) | 0 (0.0%) |
| Total | 0 (0.0%) | 8 (21.6%) |
Race in Ashland
The most populous races in Ashland are White / Caucasian (638 | 96.2%), Two or more Races (25 | 3.8%), and Hispanic or Latino (5 | 0.7%).
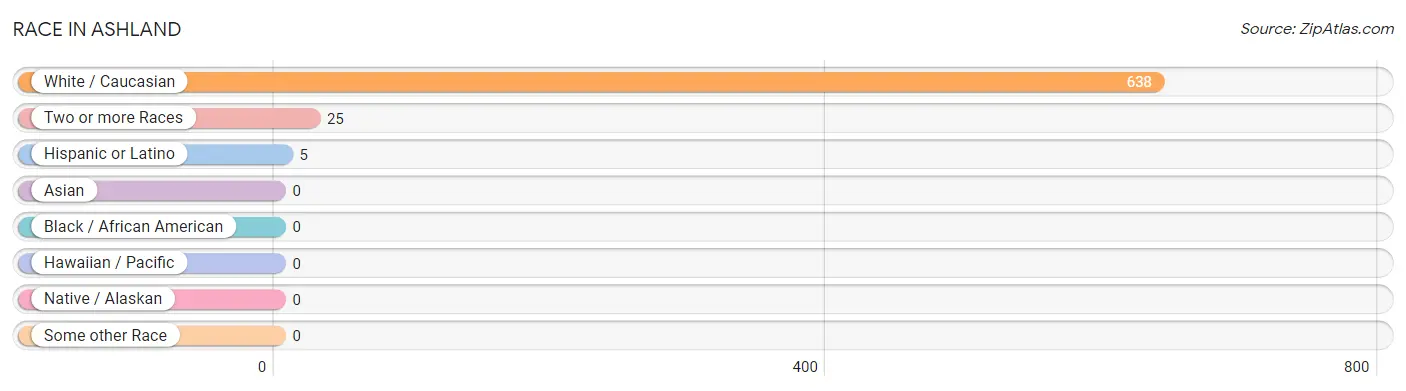
| Race | # Population | % Population |
| Asian | 0 | 0.0% |
| Black / African American | 0 | 0.0% |
| Hawaiian / Pacific | 0 | 0.0% |
| Hispanic or Latino | 5 | 0.7% |
| Native / Alaskan | 0 | 0.0% |
| White / Caucasian | 638 | 96.2% |
| Two or more Races | 25 | 3.8% |
| Some other Race | 0 | 0.0% |
| Total | 663 | 100.0% |
Ancestry in Ashland
The most populous ancestries reported in Ashland are French (219 | 33.0%), English (115 | 17.3%), Irish (97 | 14.6%), Scottish (44 | 6.6%), and American (27 | 4.1%), together accounting for 75.7% of all Ashland residents.
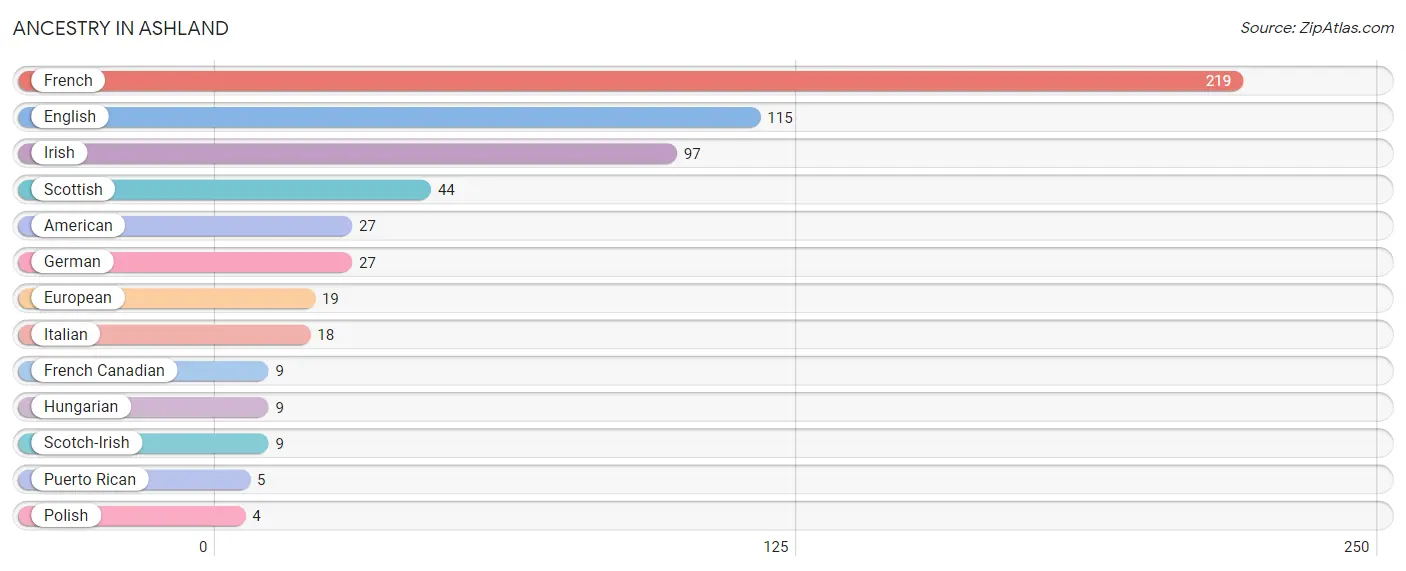
| Ancestry | # Population | % Population |
| American | 27 | 4.1% |
| English | 115 | 17.3% |
| European | 19 | 2.9% |
| French | 219 | 33.0% |
| French Canadian | 9 | 1.4% |
| German | 27 | 4.1% |
| Hungarian | 9 | 1.4% |
| Irish | 97 | 14.6% |
| Italian | 18 | 2.7% |
| Polish | 4 | 0.6% |
| Puerto Rican | 5 | 0.7% |
| Scotch-Irish | 9 | 1.4% |
| Scottish | 44 | 6.6% | View All 13 Rows |
Immigrants in Ashland

| Immigration Origin | # Population | % Population | View All 0 Rows |
Sex and Age in Ashland
Sex and Age in Ashland
The most populous age groups in Ashland are 15 to 19 Years (47 | 16.0%) for men and 85 Years and over (84 | 22.8%) for women.
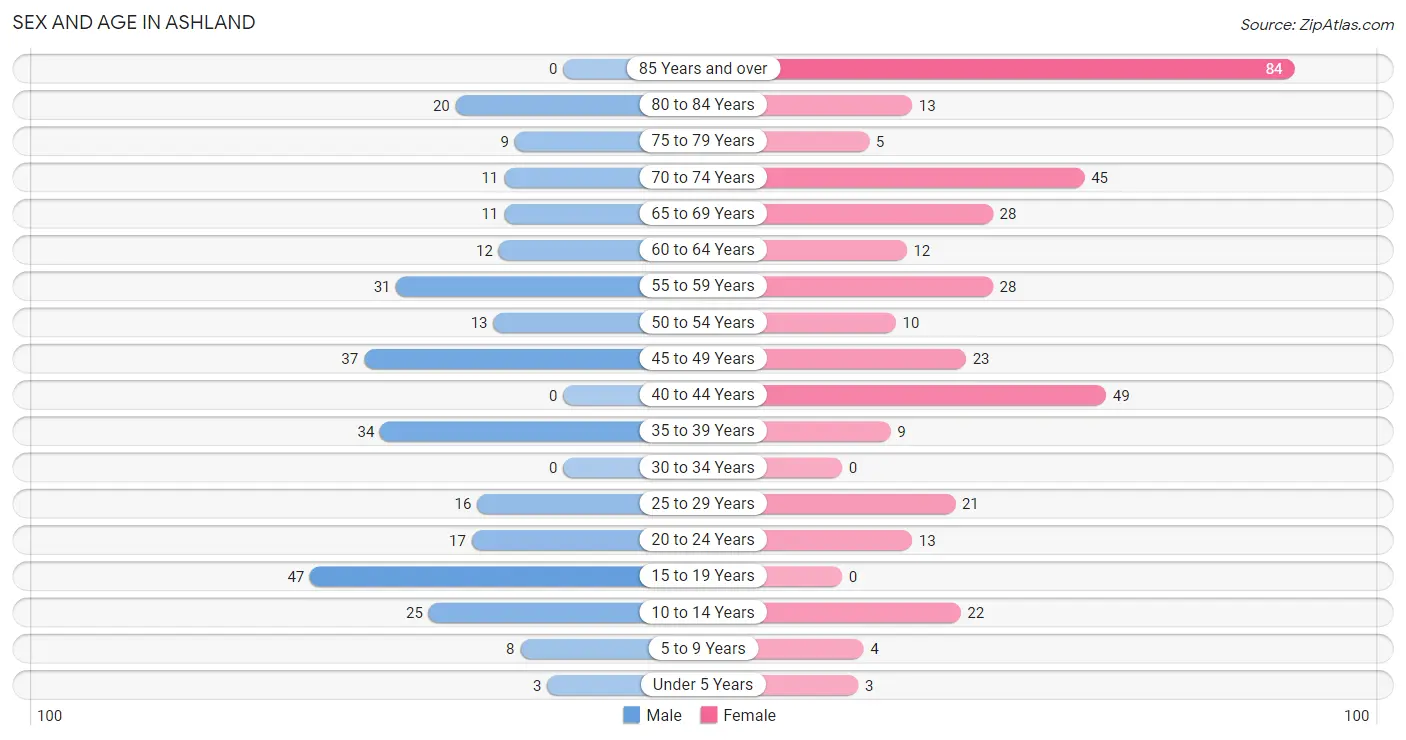
| Age Bracket | Male | Female |
| Under 5 Years | 3 (1.0%) | 3 (0.8%) |
| 5 to 9 Years | 8 (2.7%) | 4 (1.1%) |
| 10 to 14 Years | 25 (8.5%) | 22 (6.0%) |
| 15 to 19 Years | 47 (16.0%) | 0 (0.0%) |
| 20 to 24 Years | 17 (5.8%) | 13 (3.5%) |
| 25 to 29 Years | 16 (5.4%) | 21 (5.7%) |
| 30 to 34 Years | 0 (0.0%) | 0 (0.0%) |
| 35 to 39 Years | 34 (11.6%) | 9 (2.4%) |
| 40 to 44 Years | 0 (0.0%) | 49 (13.3%) |
| 45 to 49 Years | 37 (12.6%) | 23 (6.2%) |
| 50 to 54 Years | 13 (4.4%) | 10 (2.7%) |
| 55 to 59 Years | 31 (10.5%) | 28 (7.6%) |
| 60 to 64 Years | 12 (4.1%) | 12 (3.3%) |
| 65 to 69 Years | 11 (3.7%) | 28 (7.6%) |
| 70 to 74 Years | 11 (3.7%) | 45 (12.2%) |
| 75 to 79 Years | 9 (3.1%) | 5 (1.4%) |
| 80 to 84 Years | 20 (6.8%) | 13 (3.5%) |
| 85 Years and over | 0 (0.0%) | 84 (22.8%) |
| Total | 294 (100.0%) | 369 (100.0%) |
Families and Households in Ashland
Median Family Size in Ashland
The median family size in Ashland is 2.62 persons per family, with married-couple families (137 | 78.7%) accounting for the largest median family size of 2.73 persons per family. On the other hand, single female/mother families (8 | 4.6%) represent the smallest median family size with 1.63 persons per family.
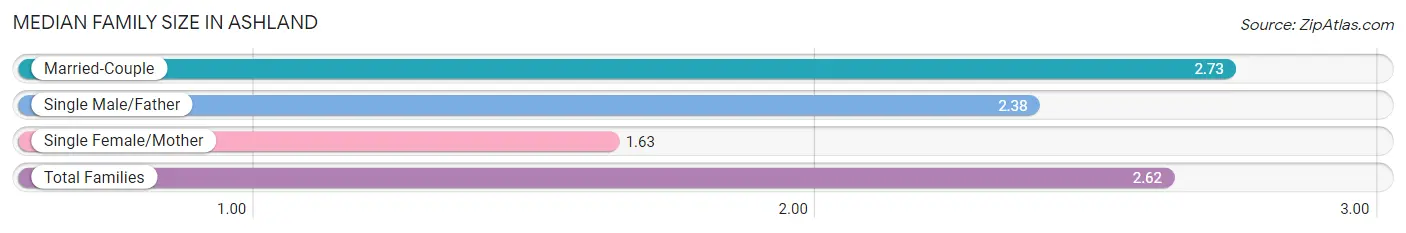
| Family Type | # Families | Family Size |
| Married-Couple | 137 (78.7%) | 2.73 |
| Single Male/Father | 29 (16.7%) | 2.38 |
| Single Female/Mother | 8 (4.6%) | 1.63 |
| Total Families | 174 (100.0%) | 2.62 |
Median Household Size in Ashland
The median household size in Ashland is 1.89 persons per household, with single male/father households (29 | 8.3%) accounting for the largest median household size of 2.83 persons per household. non-family households (177 | 50.4%) represent the smallest median household size with 1.10 persons per household.
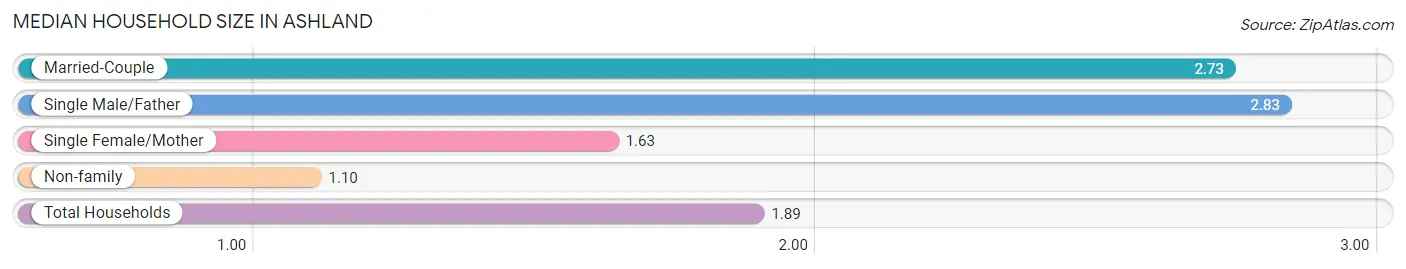
| Household Type | # Households | Household Size |
| Married-Couple | 137 (39.0%) | 2.73 |
| Single Male/Father | 29 (8.3%) | 2.83 |
| Single Female/Mother | 8 (2.3%) | 1.63 |
| Non-family | 177 (50.4%) | 1.10 |
| Total Households | 351 (100.0%) | 1.89 |
Household Size by Marriage Status in Ashland
Out of a total of 351 households in Ashland, 174 (49.6%) are family households, while 177 (50.4%) are nonfamily households. The most numerous type of family households are 2-person households, comprising 103, and the most common type of nonfamily households are 1-person households, comprising 162.
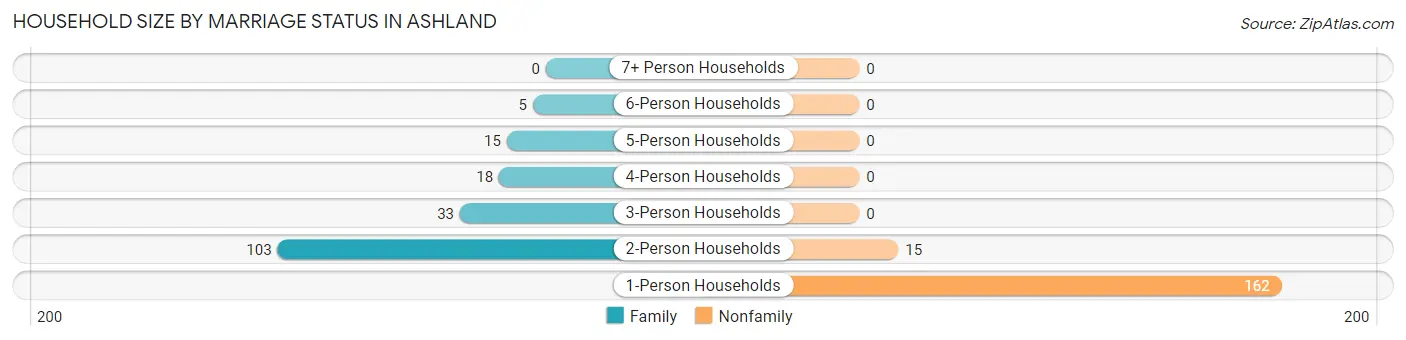
| Household Size | Family Households | Nonfamily Households |
| 1-Person Households | - | 162 (46.2%) |
| 2-Person Households | 103 (29.3%) | 15 (4.3%) |
| 3-Person Households | 33 (9.4%) | 0 (0.0%) |
| 4-Person Households | 18 (5.1%) | 0 (0.0%) |
| 5-Person Households | 15 (4.3%) | 0 (0.0%) |
| 6-Person Households | 5 (1.4%) | 0 (0.0%) |
| 7+ Person Households | 0 (0.0%) | 0 (0.0%) |
| Total | 174 (49.6%) | 177 (50.4%) |
Female Fertility in Ashland
Fertility by Age in Ashland
| Age Bracket | Women with Births | Births / 1,000 Women |
| 15 to 19 years | 0 (0.0%) | 0.0 |
| 20 to 34 years | 0 (0.0%) | 0.0 |
| 35 to 50 years | 0 (0.0%) | 0.0 |
| Total | 0 (0.0%) | 0.0 |
Fertility by Age by Marriage Status in Ashland
| Age Bracket | Married | Unmarried |
| 15 to 19 years | 0 (0.0%) | 0 (0.0%) |
| 20 to 34 years | 0 (0.0%) | 0 (0.0%) |
| 35 to 50 years | 0 (0.0%) | 0 (0.0%) |
| Total | 0 (0.0%) | 0 (0.0%) |
Fertility by Education in Ashland
| Educational Attainment | Women with Births | Births / 1,000 Women |
| Less than High School | 0 (0.0%) | 0.0 |
| High School Diploma | 0 (0.0%) | 0.0 |
| College or Associate's Degree | 0 (0.0%) | 0.0 |
| Bachelor's Degree | 0 (0.0%) | 0.0 |
| Graduate Degree | 0 (0.0%) | 0.0 |
| Total | 0 (0.0%) | 0.0 |
Fertility by Education by Marriage Status in Ashland
| Educational Attainment | Married | Unmarried |
| Less than High School | 0 (0.0%) | 0 (0.0%) |
| High School Diploma | 0 (0.0%) | 0 (0.0%) |
| College or Associate's Degree | 0 (0.0%) | 0 (0.0%) |
| Bachelor's Degree | 0 (0.0%) | 0 (0.0%) |
| Graduate Degree | 0 (0.0%) | 0 (0.0%) |
| Total | 0 (0.0%) | 0 (0.0%) |
Employment Characteristics in Ashland
Employment by Class of Employer in Ashland
Among the 245 employed individuals in Ashland, private company employees (176 | 71.8%), not-for-profit organizations (36 | 14.7%), and local government employees (17 | 6.9%) make up the most common classes of employment.
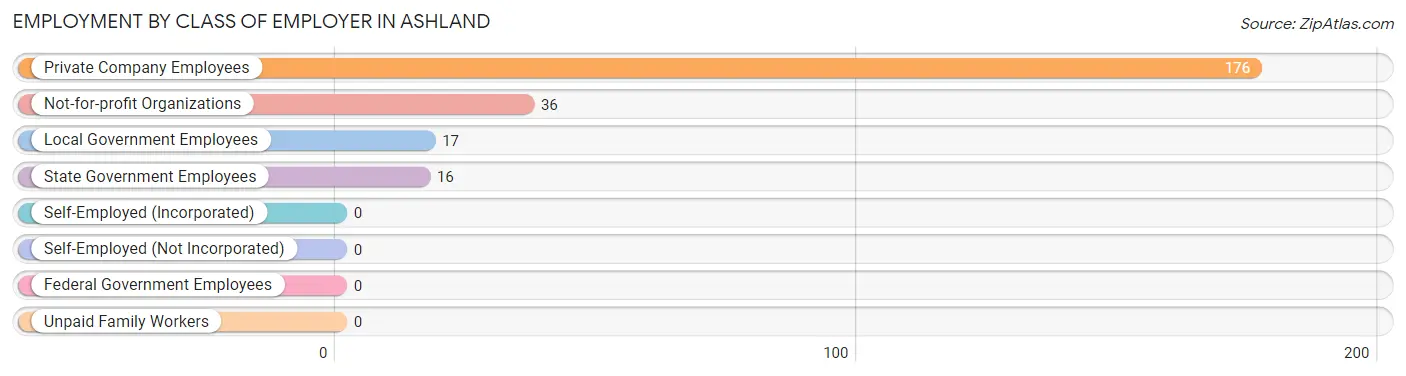
| Employer Class | # Employees | % Employees |
| Private Company Employees | 176 | 71.8% |
| Self-Employed (Incorporated) | 0 | 0.0% |
| Self-Employed (Not Incorporated) | 0 | 0.0% |
| Not-for-profit Organizations | 36 | 14.7% |
| Local Government Employees | 17 | 6.9% |
| State Government Employees | 16 | 6.5% |
| Federal Government Employees | 0 | 0.0% |
| Unpaid Family Workers | 0 | 0.0% |
| Total | 245 | 100.0% |
Employment Status by Age in Ashland
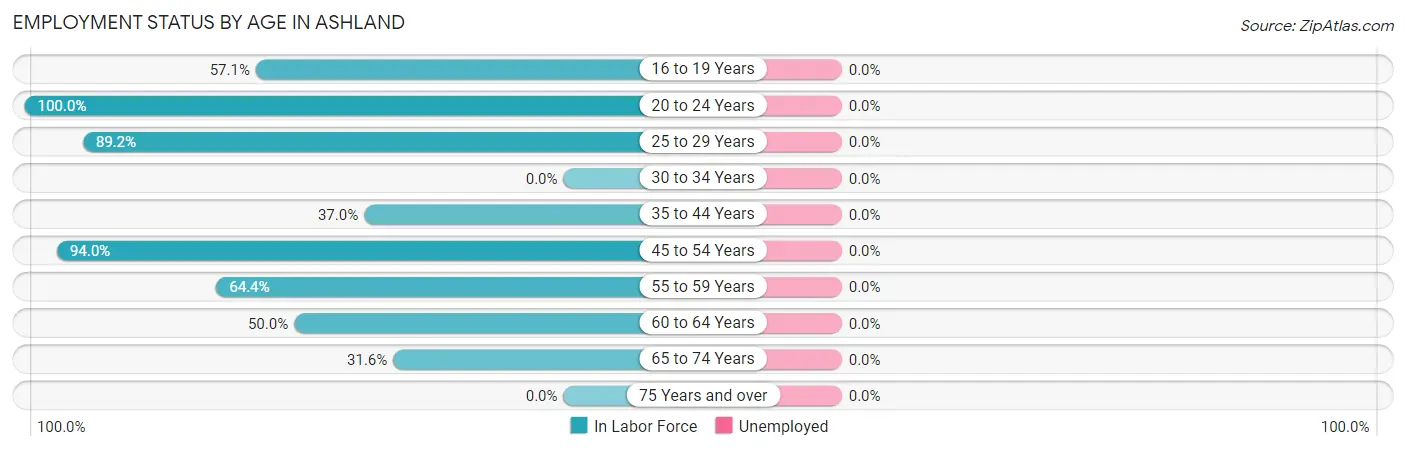
| Age Bracket | In Labor Force | Unemployed |
| 16 to 19 Years | 20 (57.1%) | 0 (0.0%) |
| 20 to 24 Years | 30 (100.0%) | 0 (0.0%) |
| 25 to 29 Years | 33 (89.2%) | 0 (0.0%) |
| 30 to 34 Years | 0 (0.0%) | 0 (0.0%) |
| 35 to 44 Years | 34 (37.0%) | 0 (0.0%) |
| 45 to 54 Years | 78 (94.0%) | 0 (0.0%) |
| 55 to 59 Years | 38 (64.4%) | 0 (0.0%) |
| 60 to 64 Years | 12 (50.0%) | 0 (0.0%) |
| 65 to 74 Years | 30 (31.6%) | 0 (0.0%) |
| 75 Years and over | 0 (0.0%) | 0 (0.0%) |
| Total | 275 (46.9%) | 0 (0.0%) |
Employment Status by Educational Attainment in Ashland
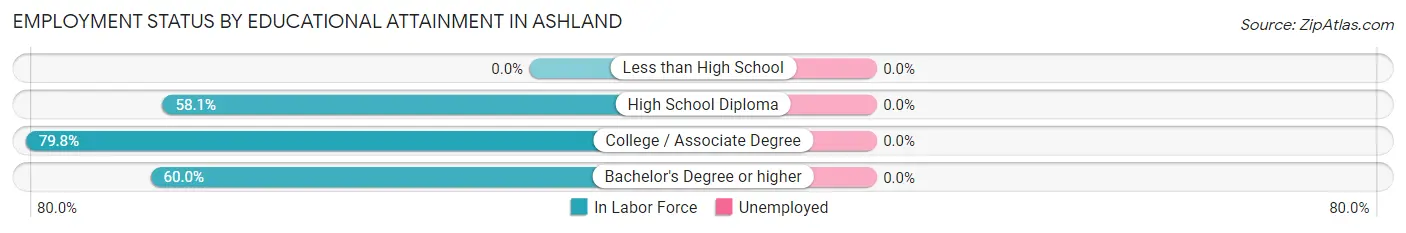
| Educational Attainment | In Labor Force | Unemployed |
| Less than High School | 0 (0.0%) | 0 (0.0%) |
| High School Diploma | 79 (58.1%) | 0 (0.0%) |
| College / Associate Degree | 83 (79.8%) | 0 (0.0%) |
| Bachelor's Degree or higher | 33 (60.0%) | 0 (0.0%) |
| Total | 195 (66.1%) | 0 (0.0%) |
Employment Occupations by Sex in Ashland
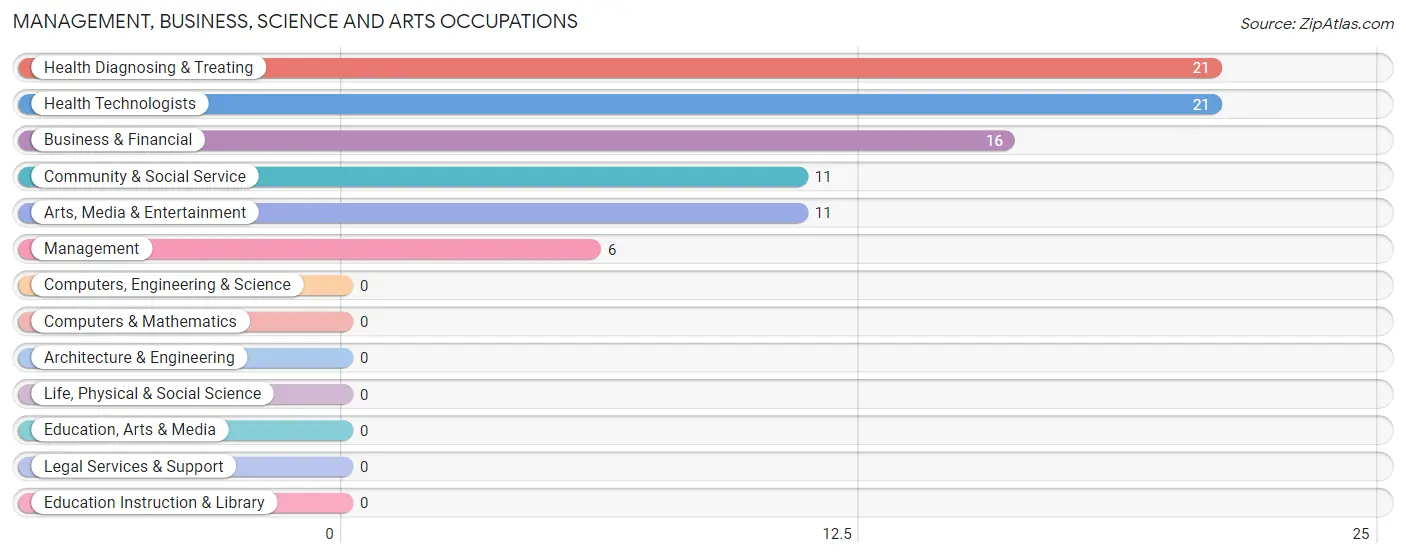
Management, Business, Science and Arts Occupations
The most common Management, Business, Science and Arts occupations in Ashland are Health Diagnosing & Treating (21 | 7.6%), Health Technologists (21 | 7.6%), Business & Financial (16 | 5.8%), Community & Social Service (11 | 4.0%), and Arts, Media & Entertainment (11 | 4.0%).
Management, Business, Science and Arts Occupations by Sex
Within the Management, Business, Science and Arts occupations in Ashland, the most male-oriented occupations are Community & Social Service (100.0%), Arts, Media & Entertainment (100.0%), and Business & Financial (37.5%), while the most female-oriented occupations are Management (100.0%), Health Diagnosing & Treating (80.9%), and Health Technologists (80.9%).
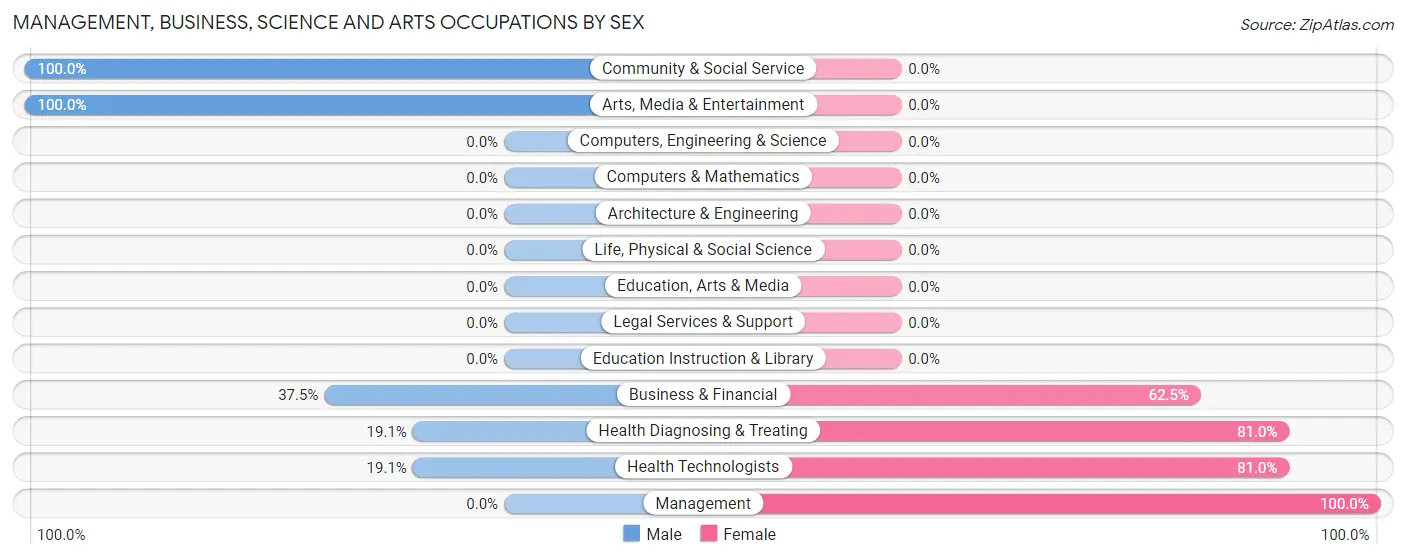
| Occupation | Male | Female |
| Management | 0 (0.0%) | 6 (100.0%) |
| Business & Financial | 6 (37.5%) | 10 (62.5%) |
| Computers, Engineering & Science | 0 (0.0%) | 0 (0.0%) |
| Computers & Mathematics | 0 (0.0%) | 0 (0.0%) |
| Architecture & Engineering | 0 (0.0%) | 0 (0.0%) |
| Life, Physical & Social Science | 0 (0.0%) | 0 (0.0%) |
| Community & Social Service | 11 (100.0%) | 0 (0.0%) |
| Education, Arts & Media | 0 (0.0%) | 0 (0.0%) |
| Legal Services & Support | 0 (0.0%) | 0 (0.0%) |
| Education Instruction & Library | 0 (0.0%) | 0 (0.0%) |
| Arts, Media & Entertainment | 11 (100.0%) | 0 (0.0%) |
| Health Diagnosing & Treating | 4 (19.1%) | 17 (80.9%) |
| Health Technologists | 4 (19.1%) | 17 (80.9%) |
| Total (Category) | 21 (38.9%) | 33 (61.1%) |
| Total (Overall) | 177 (64.4%) | 98 (35.6%) |
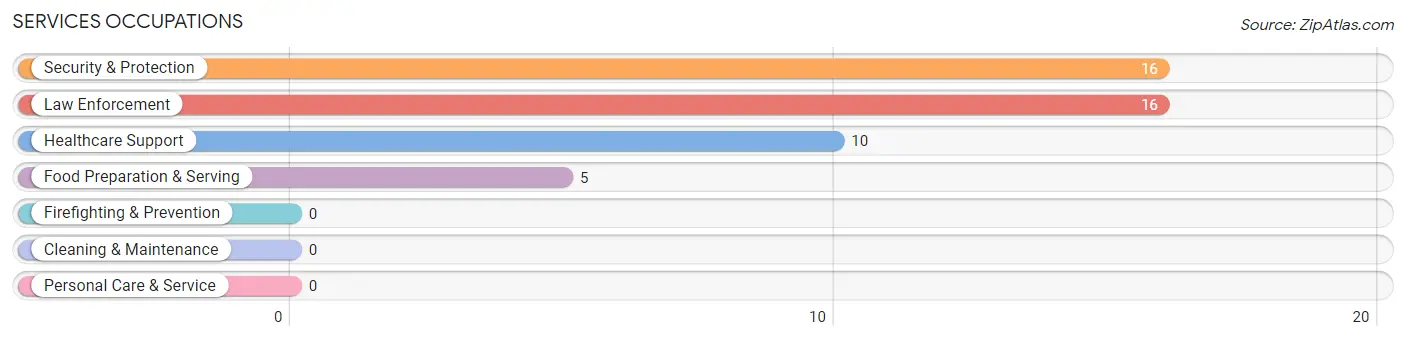
Services Occupations
The most common Services occupations in Ashland are Security & Protection (16 | 5.8%), Law Enforcement (16 | 5.8%), Healthcare Support (10 | 3.6%), and Food Preparation & Serving (5 | 1.8%).
Services Occupations by Sex
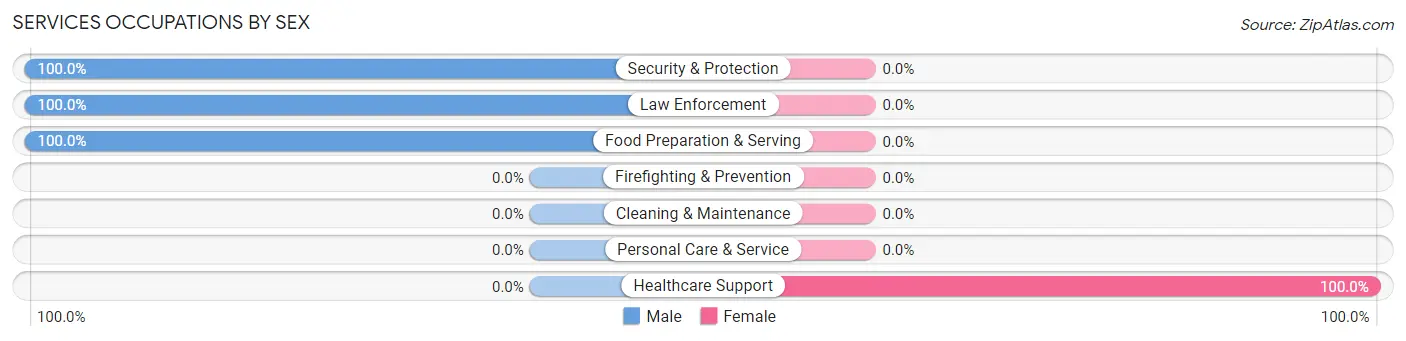
| Occupation | Male | Female |
| Healthcare Support | 0 (0.0%) | 10 (100.0%) |
| Security & Protection | 16 (100.0%) | 0 (0.0%) |
| Firefighting & Prevention | 0 (0.0%) | 0 (0.0%) |
| Law Enforcement | 16 (100.0%) | 0 (0.0%) |
| Food Preparation & Serving | 5 (100.0%) | 0 (0.0%) |
| Cleaning & Maintenance | 0 (0.0%) | 0 (0.0%) |
| Personal Care & Service | 0 (0.0%) | 0 (0.0%) |
| Total (Category) | 21 (67.7%) | 10 (32.3%) |
| Total (Overall) | 177 (64.4%) | 98 (35.6%) |
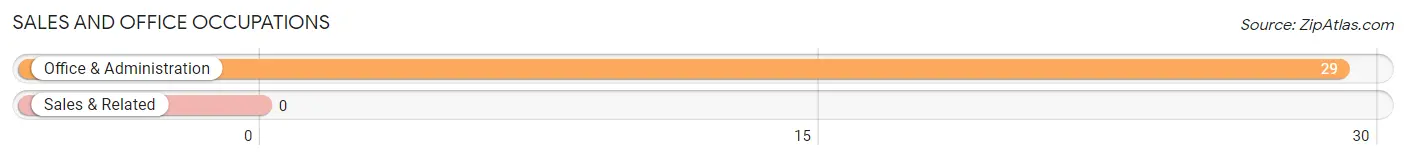
Sales and Office Occupations
The most common Sales and Office occupations in Ashland are , and Office & Administration (29 | 10.5%).
Sales and Office Occupations by Sex
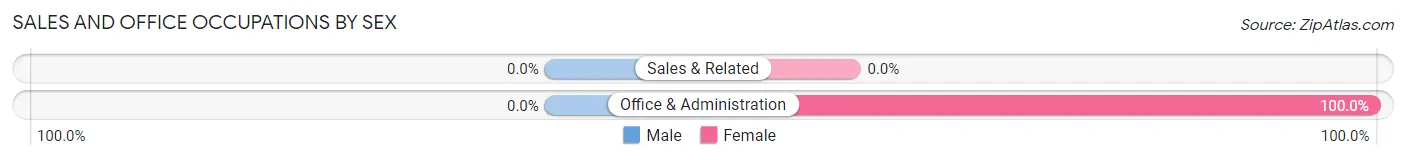
| Occupation | Male | Female |
| Sales & Related | 0 (0.0%) | 0 (0.0%) |
| Office & Administration | 0 (0.0%) | 29 (100.0%) |
| Total (Category) | 0 (0.0%) | 29 (100.0%) |
| Total (Overall) | 177 (64.4%) | 98 (35.6%) |
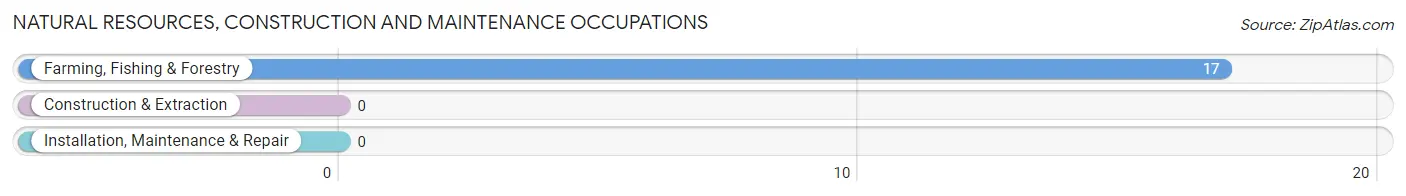
Natural Resources, Construction and Maintenance Occupations
The most common Natural Resources, Construction and Maintenance occupations in Ashland are , and Farming, Fishing & Forestry (17 | 6.2%).
Natural Resources, Construction and Maintenance Occupations by Sex
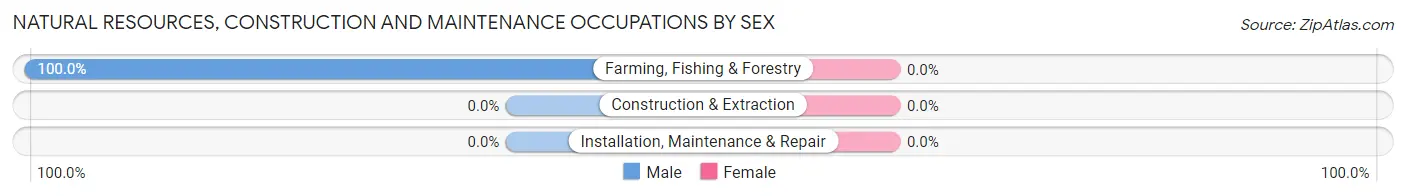
| Occupation | Male | Female |
| Farming, Fishing & Forestry | 17 (100.0%) | 0 (0.0%) |
| Construction & Extraction | 0 (0.0%) | 0 (0.0%) |
| Installation, Maintenance & Repair | 0 (0.0%) | 0 (0.0%) |
| Total (Category) | 17 (100.0%) | 0 (0.0%) |
| Total (Overall) | 177 (64.4%) | 98 (35.6%) |
Production, Transportation and Moving Occupations
The most common Production, Transportation and Moving occupations in Ashland are Material Moving (60 | 21.8%), Production (44 | 16.0%), and Transportation (40 | 14.5%).
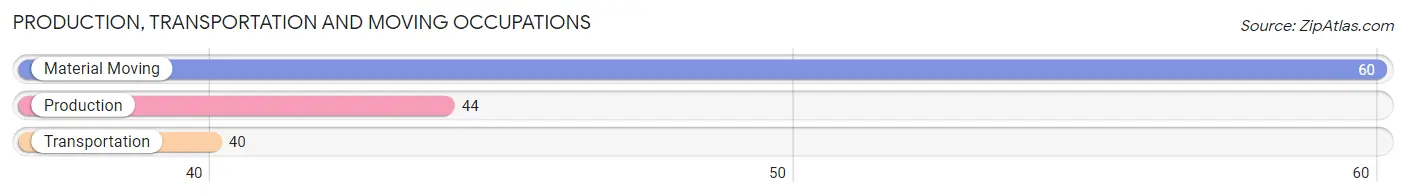
Production, Transportation and Moving Occupations by Sex
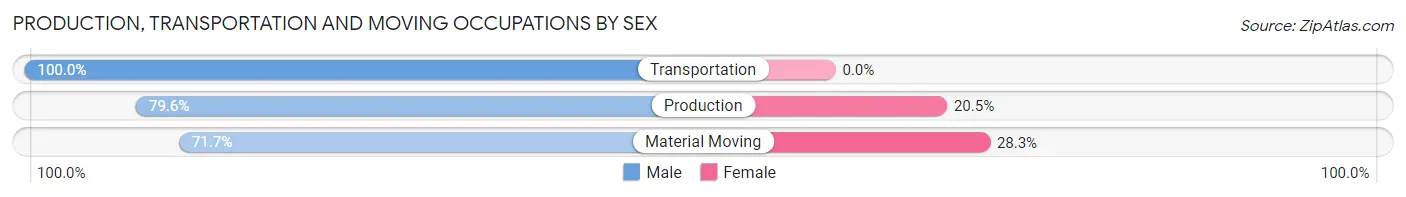
| Occupation | Male | Female |
| Production | 35 (79.5%) | 9 (20.4%) |
| Transportation | 40 (100.0%) | 0 (0.0%) |
| Material Moving | 43 (71.7%) | 17 (28.3%) |
| Total (Category) | 118 (81.9%) | 26 (18.1%) |
| Total (Overall) | 177 (64.4%) | 98 (35.6%) |
Employment Industries by Sex in Ashland
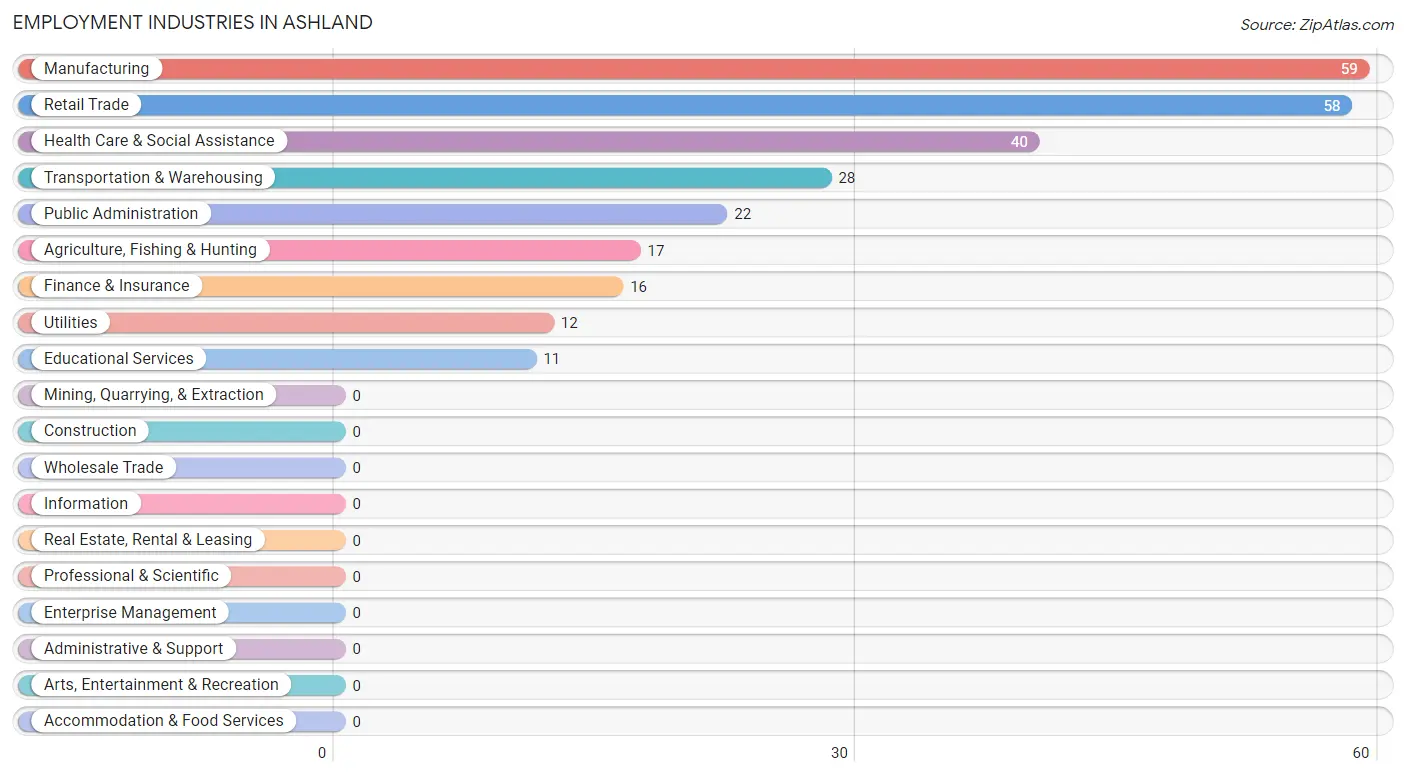
Employment Industries in Ashland
The major employment industries in Ashland include Manufacturing (59 | 21.4%), Retail Trade (58 | 21.1%), Health Care & Social Assistance (40 | 14.5%), Transportation & Warehousing (28 | 10.2%), and Public Administration (22 | 8.0%).
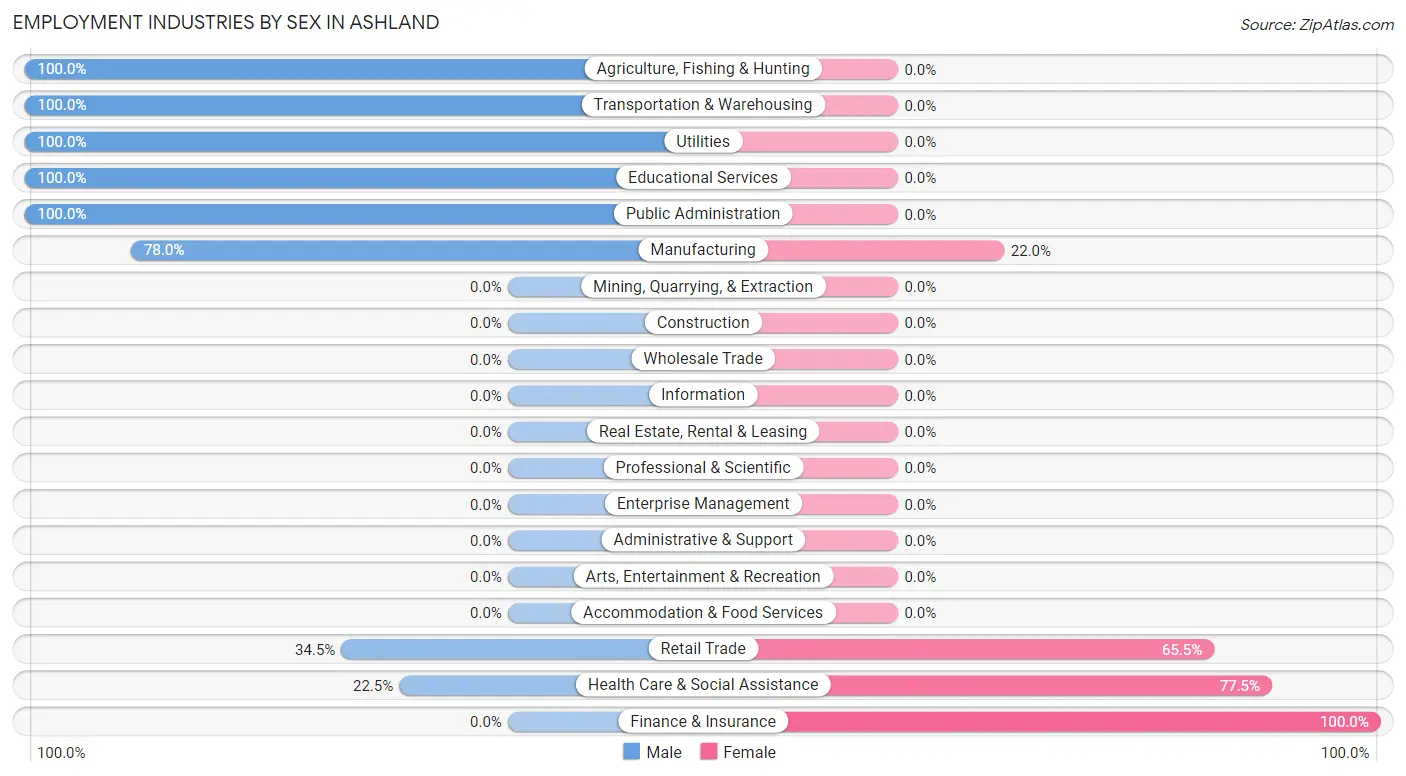
Employment Industries by Sex in Ashland
The Ashland industries that see more men than women are Agriculture, Fishing & Hunting (100.0%), Transportation & Warehousing (100.0%), and Utilities (100.0%), whereas the industries that tend to have a higher number of women are Finance & Insurance (100.0%), Health Care & Social Assistance (77.5%), and Retail Trade (65.5%).
| Industry | Male | Female |
| Agriculture, Fishing & Hunting | 17 (100.0%) | 0 (0.0%) |
| Mining, Quarrying, & Extraction | 0 (0.0%) | 0 (0.0%) |
| Construction | 0 (0.0%) | 0 (0.0%) |
| Manufacturing | 46 (78.0%) | 13 (22.0%) |
| Wholesale Trade | 0 (0.0%) | 0 (0.0%) |
| Retail Trade | 20 (34.5%) | 38 (65.5%) |
| Transportation & Warehousing | 28 (100.0%) | 0 (0.0%) |
| Utilities | 12 (100.0%) | 0 (0.0%) |
| Information | 0 (0.0%) | 0 (0.0%) |
| Finance & Insurance | 0 (0.0%) | 16 (100.0%) |
| Real Estate, Rental & Leasing | 0 (0.0%) | 0 (0.0%) |
| Professional & Scientific | 0 (0.0%) | 0 (0.0%) |
| Enterprise Management | 0 (0.0%) | 0 (0.0%) |
| Administrative & Support | 0 (0.0%) | 0 (0.0%) |
| Educational Services | 11 (100.0%) | 0 (0.0%) |
| Health Care & Social Assistance | 9 (22.5%) | 31 (77.5%) |
| Arts, Entertainment & Recreation | 0 (0.0%) | 0 (0.0%) |
| Accommodation & Food Services | 0 (0.0%) | 0 (0.0%) |
| Public Administration | 22 (100.0%) | 0 (0.0%) |
| Total | 177 (64.4%) | 98 (35.6%) |
Education in Ashland
School Enrollment in Ashland
The most common levels of schooling among the 122 students in Ashland are high school (58 | 47.5%), middle school (36 | 29.5%), and college / undergraduate (13 | 10.7%).
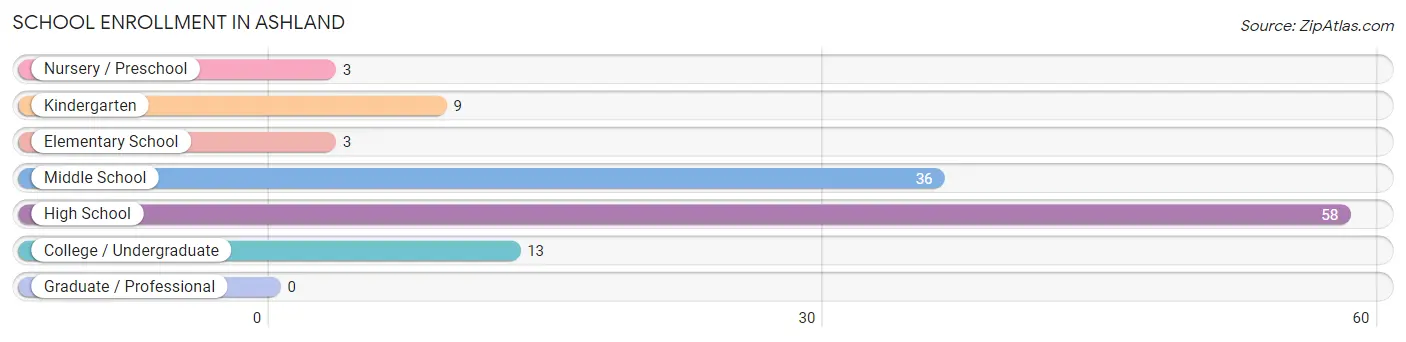
| School Level | # Students | % Students |
| Nursery / Preschool | 3 | 2.5% |
| Kindergarten | 9 | 7.4% |
| Elementary School | 3 | 2.5% |
| Middle School | 36 | 29.5% |
| High School | 58 | 47.5% |
| College / Undergraduate | 13 | 10.7% |
| Graduate / Professional | 0 | 0.0% |
| Total | 122 | 100.0% |
School Enrollment by Age by Funding Source in Ashland
Out of a total of 122 students who are enrolled in schools in Ashland, 13 (10.7%) attend a private institution, while the remaining 109 (89.3%) are enrolled in public schools. The age group of 20 to 24 year olds has the highest likelihood of being enrolled in private schools, with 13 (100.0% in the age bracket) enrolled. Conversely, the age group of 3 to 4 year olds has the lowest likelihood of being enrolled in a private school, with 3 (100.0% in the age bracket) attending a public institution.
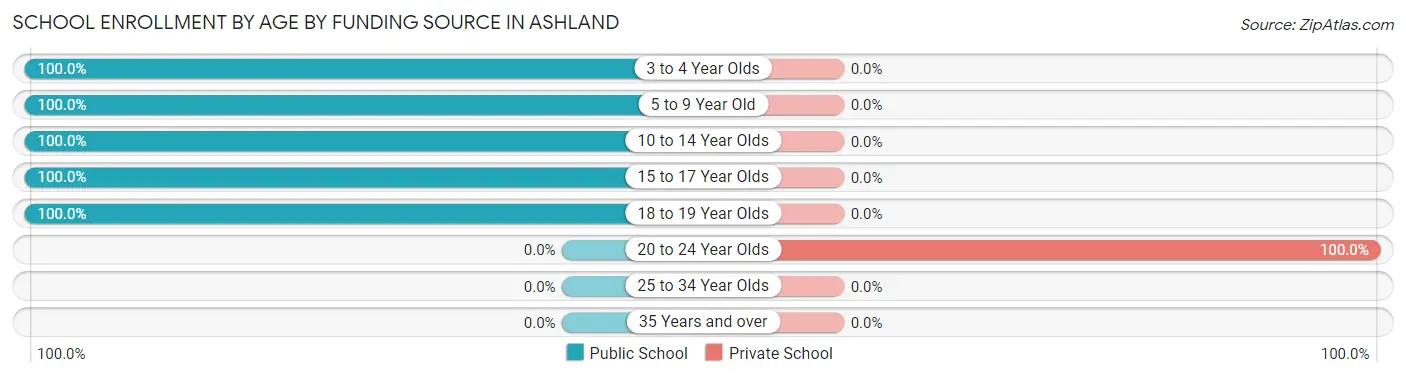
| Age Bracket | Public School | Private School |
| 3 to 4 Year Olds | 3 (100.0%) | 0 (0.0%) |
| 5 to 9 Year Old | 12 (100.0%) | 0 (0.0%) |
| 10 to 14 Year Olds | 47 (100.0%) | 0 (0.0%) |
| 15 to 17 Year Olds | 37 (100.0%) | 0 (0.0%) |
| 18 to 19 Year Olds | 10 (100.0%) | 0 (0.0%) |
| 20 to 24 Year Olds | 0 (0.0%) | 13 (100.0%) |
| 25 to 34 Year Olds | 0 (0.0%) | 0 (0.0%) |
| 35 Years and over | 0 (0.0%) | 0 (0.0%) |
| Total | 109 (89.3%) | 13 (10.7%) |
Educational Attainment by Field of Study in Ashland
Arts & humanities (21 | 28.4%), education (19 | 25.7%), science & technology (17 | 23.0%), computers & mathematics (9 | 12.2%), and business (8 | 10.8%) are the most common fields of study among 74 individuals in Ashland who have obtained a bachelor's degree or higher.
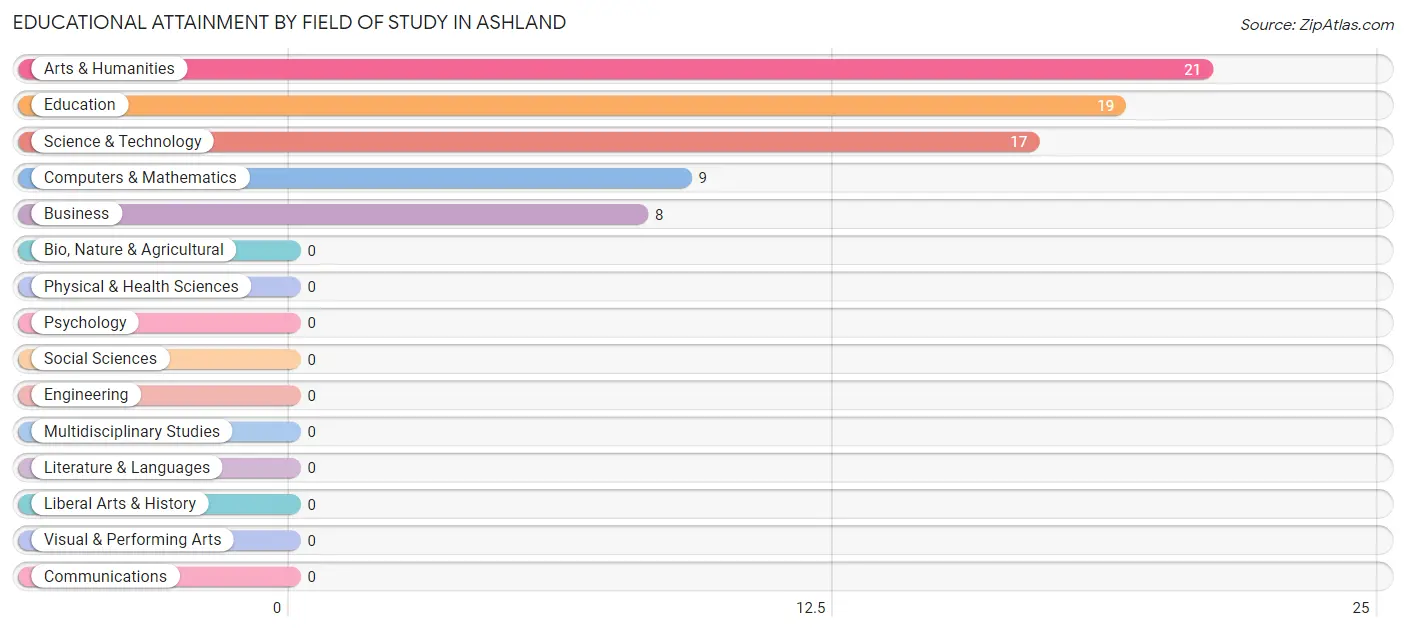
| Field of Study | # Graduates | % Graduates |
| Computers & Mathematics | 9 | 12.2% |
| Bio, Nature & Agricultural | 0 | 0.0% |
| Physical & Health Sciences | 0 | 0.0% |
| Psychology | 0 | 0.0% |
| Social Sciences | 0 | 0.0% |
| Engineering | 0 | 0.0% |
| Multidisciplinary Studies | 0 | 0.0% |
| Science & Technology | 17 | 23.0% |
| Business | 8 | 10.8% |
| Education | 19 | 25.7% |
| Literature & Languages | 0 | 0.0% |
| Liberal Arts & History | 0 | 0.0% |
| Visual & Performing Arts | 0 | 0.0% |
| Communications | 0 | 0.0% |
| Arts & Humanities | 21 | 28.4% |
| Total | 74 | 100.0% |
Transportation & Commute in Ashland
Vehicle Availability by Sex in Ashland
The most prevalent vehicle ownership categories in Ashland are males with 2 vehicles (78, accounting for 53.1%) and females with 2 vehicles (65, making up 79.6%).
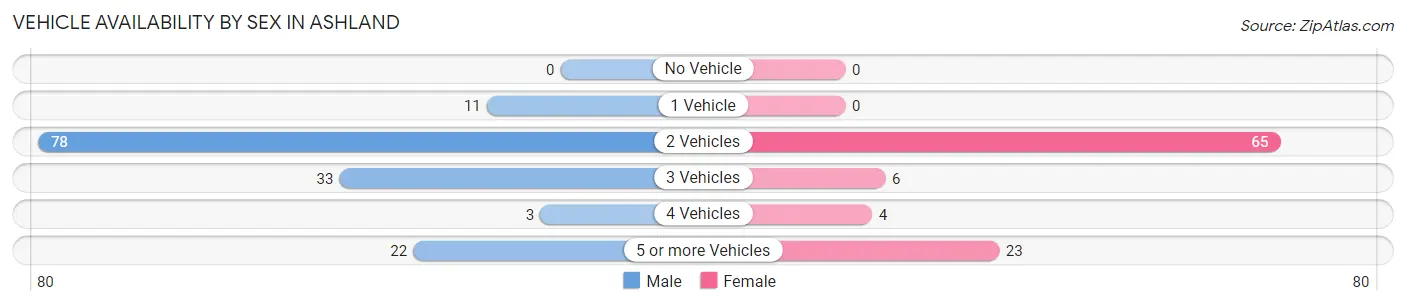
| Vehicles Available | Male | Female |
| No Vehicle | 0 (0.0%) | 0 (0.0%) |
| 1 Vehicle | 11 (7.5%) | 0 (0.0%) |
| 2 Vehicles | 78 (53.1%) | 65 (66.3%) |
| 3 Vehicles | 33 (22.5%) | 6 (6.1%) |
| 4 Vehicles | 3 (2.0%) | 4 (4.1%) |
| 5 or more Vehicles | 22 (15.0%) | 23 (23.5%) |
| Total | 147 (100.0%) | 98 (100.0%) |
Commute Time in Ashland
The most frequently occuring commute durations in Ashland are less than 5 minutes (59 commuters, 24.1%), 5 to 9 minutes (54 commuters, 22.0%), and 30 to 34 minutes (54 commuters, 22.0%).
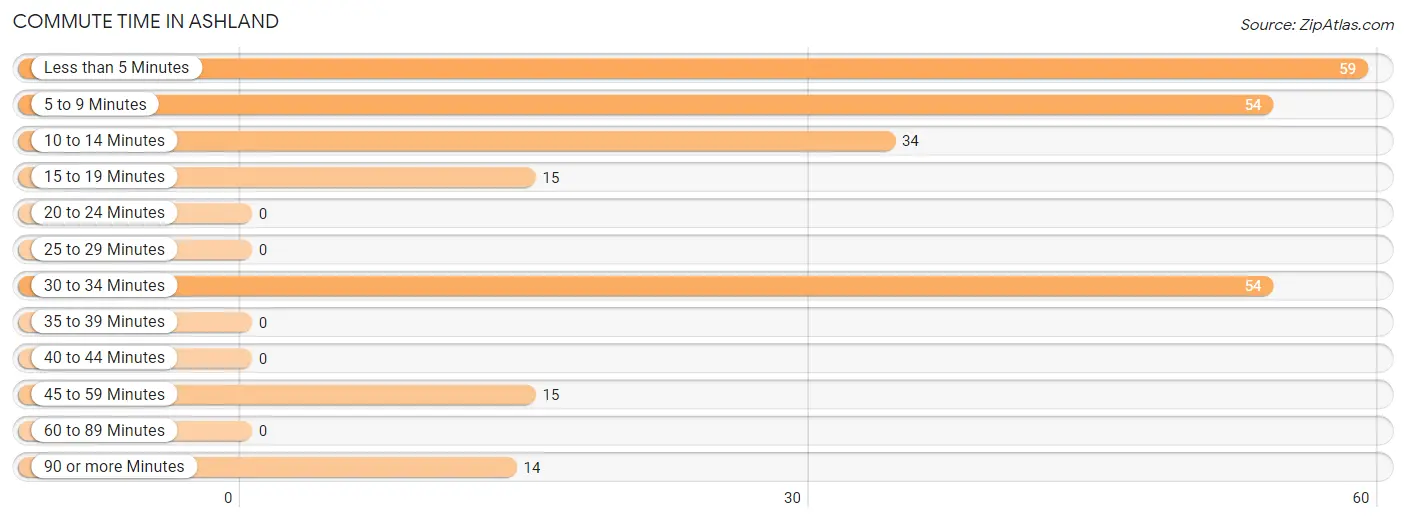
| Commute Time | # Commuters | % Commuters |
| Less than 5 Minutes | 59 | 24.1% |
| 5 to 9 Minutes | 54 | 22.0% |
| 10 to 14 Minutes | 34 | 13.9% |
| 15 to 19 Minutes | 15 | 6.1% |
| 20 to 24 Minutes | 0 | 0.0% |
| 25 to 29 Minutes | 0 | 0.0% |
| 30 to 34 Minutes | 54 | 22.0% |
| 35 to 39 Minutes | 0 | 0.0% |
| 40 to 44 Minutes | 0 | 0.0% |
| 45 to 59 Minutes | 15 | 6.1% |
| 60 to 89 Minutes | 0 | 0.0% |
| 90 or more Minutes | 14 | 5.7% |
Commute Time by Sex in Ashland
The most common commute times in Ashland are 5 to 9 minutes (32 commuters, 21.8%) for males and less than 5 minutes (35 commuters, 35.7%) for females.
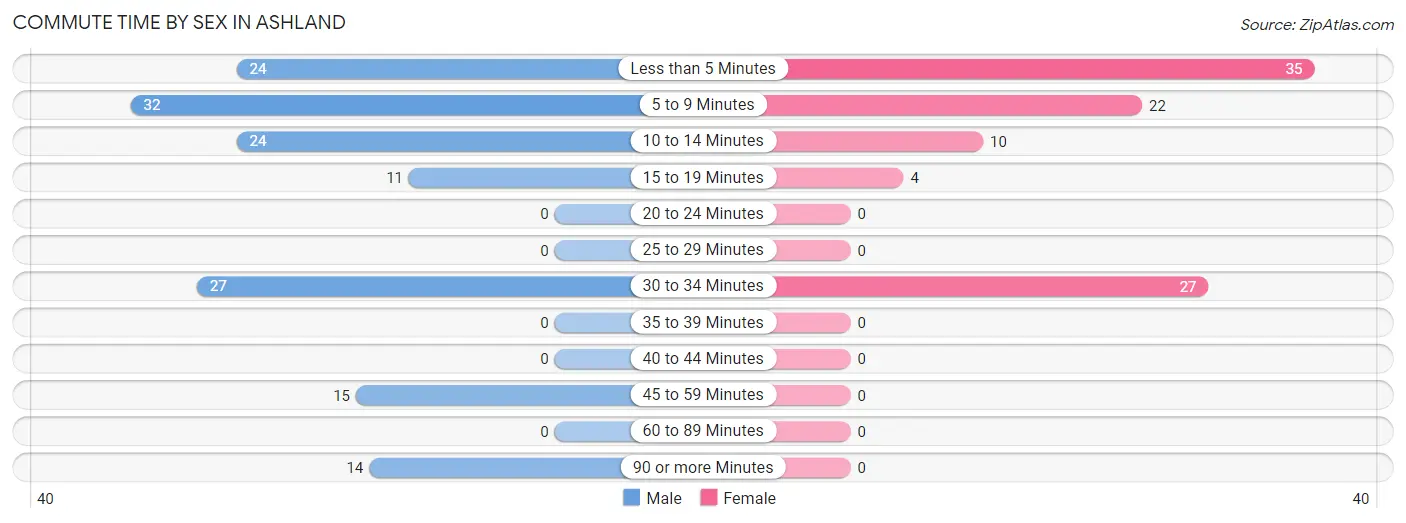
| Commute Time | Male | Female |
| Less than 5 Minutes | 24 (16.3%) | 35 (35.7%) |
| 5 to 9 Minutes | 32 (21.8%) | 22 (22.5%) |
| 10 to 14 Minutes | 24 (16.3%) | 10 (10.2%) |
| 15 to 19 Minutes | 11 (7.5%) | 4 (4.1%) |
| 20 to 24 Minutes | 0 (0.0%) | 0 (0.0%) |
| 25 to 29 Minutes | 0 (0.0%) | 0 (0.0%) |
| 30 to 34 Minutes | 27 (18.4%) | 27 (27.6%) |
| 35 to 39 Minutes | 0 (0.0%) | 0 (0.0%) |
| 40 to 44 Minutes | 0 (0.0%) | 0 (0.0%) |
| 45 to 59 Minutes | 15 (10.2%) | 0 (0.0%) |
| 60 to 89 Minutes | 0 (0.0%) | 0 (0.0%) |
| 90 or more Minutes | 14 (9.5%) | 0 (0.0%) |
Time of Departure to Work by Sex in Ashland
The most frequent times of departure to work in Ashland are 12:00 AM to 4:59 AM (38, 25.9%) for males and 7:30 AM to 7:59 AM (25, 25.5%) for females.
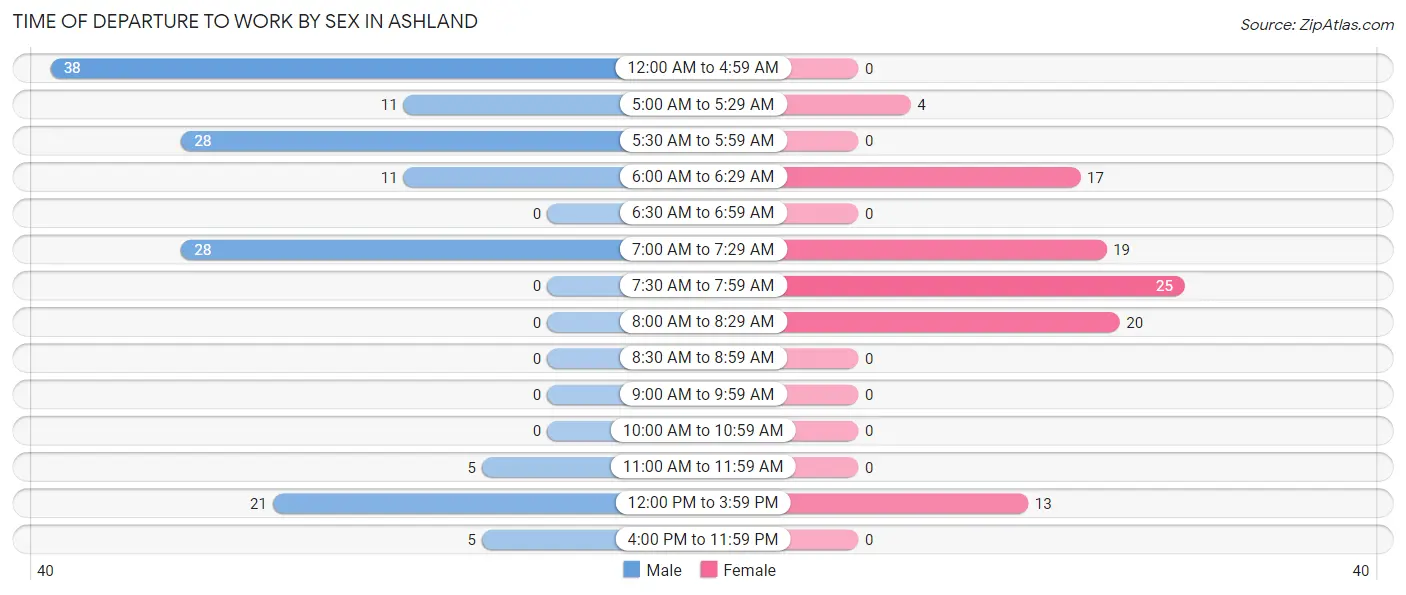
| Time of Departure | Male | Female |
| 12:00 AM to 4:59 AM | 38 (25.9%) | 0 (0.0%) |
| 5:00 AM to 5:29 AM | 11 (7.5%) | 4 (4.1%) |
| 5:30 AM to 5:59 AM | 28 (19.1%) | 0 (0.0%) |
| 6:00 AM to 6:29 AM | 11 (7.5%) | 17 (17.3%) |
| 6:30 AM to 6:59 AM | 0 (0.0%) | 0 (0.0%) |
| 7:00 AM to 7:29 AM | 28 (19.1%) | 19 (19.4%) |
| 7:30 AM to 7:59 AM | 0 (0.0%) | 25 (25.5%) |
| 8:00 AM to 8:29 AM | 0 (0.0%) | 20 (20.4%) |
| 8:30 AM to 8:59 AM | 0 (0.0%) | 0 (0.0%) |
| 9:00 AM to 9:59 AM | 0 (0.0%) | 0 (0.0%) |
| 10:00 AM to 10:59 AM | 0 (0.0%) | 0 (0.0%) |
| 11:00 AM to 11:59 AM | 5 (3.4%) | 0 (0.0%) |
| 12:00 PM to 3:59 PM | 21 (14.3%) | 13 (13.3%) |
| 4:00 PM to 11:59 PM | 5 (3.4%) | 0 (0.0%) |
| Total | 147 (100.0%) | 98 (100.0%) |
Housing Occupancy in Ashland
Occupancy by Ownership in Ashland
Of the total 351 dwellings in Ashland, owner-occupied units account for 190 (54.1%), while renter-occupied units make up 161 (45.9%).
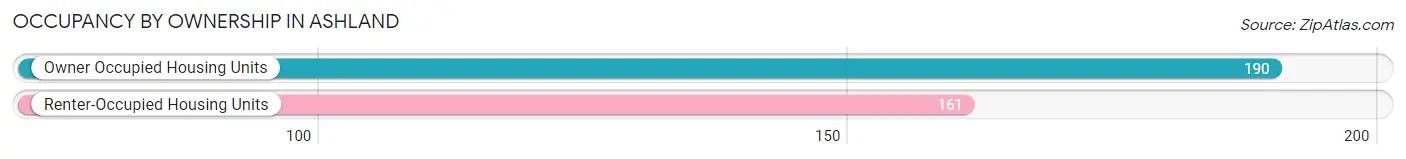
| Occupancy | # Housing Units | % Housing Units |
| Owner Occupied Housing Units | 190 | 54.1% |
| Renter-Occupied Housing Units | 161 | 45.9% |
| Total Occupied Housing Units | 351 | 100.0% |
Occupancy by Household Size in Ashland
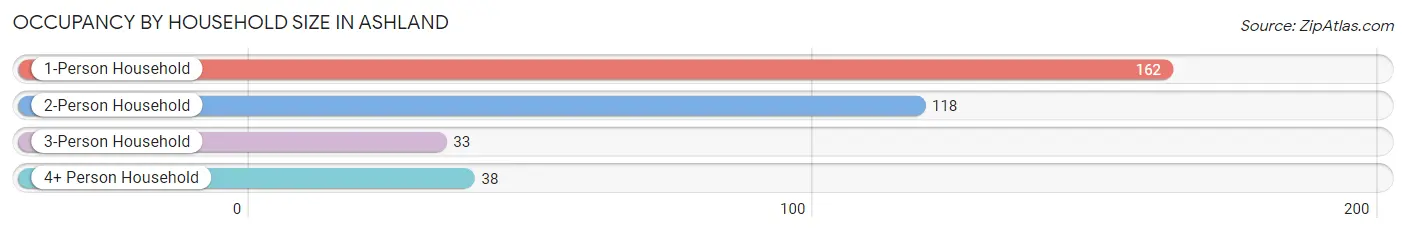
| Household Size | # Housing Units | % Housing Units |
| 1-Person Household | 162 | 46.2% |
| 2-Person Household | 118 | 33.6% |
| 3-Person Household | 33 | 9.4% |
| 4+ Person Household | 38 | 10.8% |
| Total Housing Units | 351 | 100.0% |
Occupancy by Ownership by Household Size in Ashland
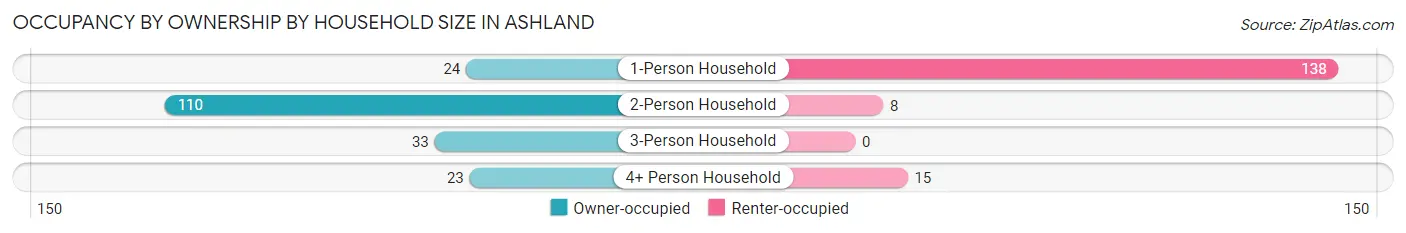
| Household Size | Owner-occupied | Renter-occupied |
| 1-Person Household | 24 (14.8%) | 138 (85.2%) |
| 2-Person Household | 110 (93.2%) | 8 (6.8%) |
| 3-Person Household | 33 (100.0%) | 0 (0.0%) |
| 4+ Person Household | 23 (60.5%) | 15 (39.5%) |
| Total Housing Units | 190 (54.1%) | 161 (45.9%) |
Occupancy by Educational Attainment in Ashland
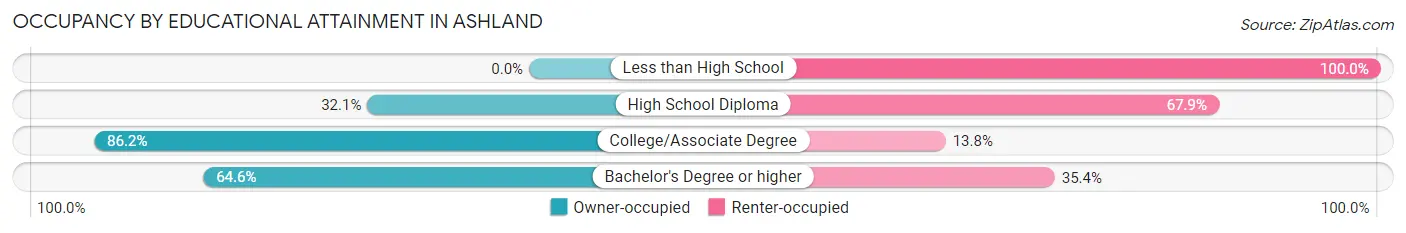
| Household Size | Owner-occupied | Renter-occupied |
| Less than High School | 0 (0.0%) | 3 (100.0%) |
| High School Diploma | 59 (32.1%) | 125 (67.9%) |
| College/Associate Degree | 100 (86.2%) | 16 (13.8%) |
| Bachelor's Degree or higher | 31 (64.6%) | 17 (35.4%) |
Occupancy by Age of Householder in Ashland
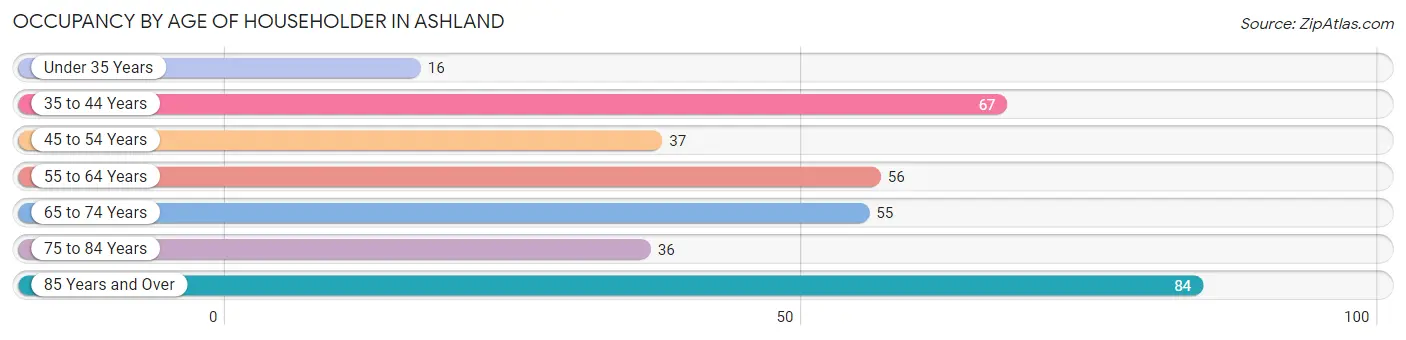
| Age Bracket | # Households | % Households |
| Under 35 Years | 16 | 4.6% |
| 35 to 44 Years | 67 | 19.1% |
| 45 to 54 Years | 37 | 10.5% |
| 55 to 64 Years | 56 | 16.0% |
| 65 to 74 Years | 55 | 15.7% |
| 75 to 84 Years | 36 | 10.3% |
| 85 Years and Over | 84 | 23.9% |
| Total | 351 | 100.0% |
Housing Finances in Ashland
Median Income by Occupancy in Ashland
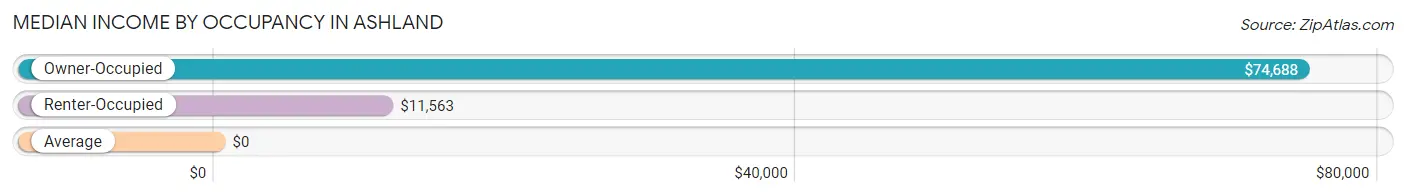
| Occupancy Type | # Households | Median Income |
| Owner-Occupied | 190 (54.1%) | $74,688 |
| Renter-Occupied | 161 (45.9%) | $11,563 |
| Average | 351 (100.0%) | $0 |
Occupancy by Householder Income Bracket in Ashland
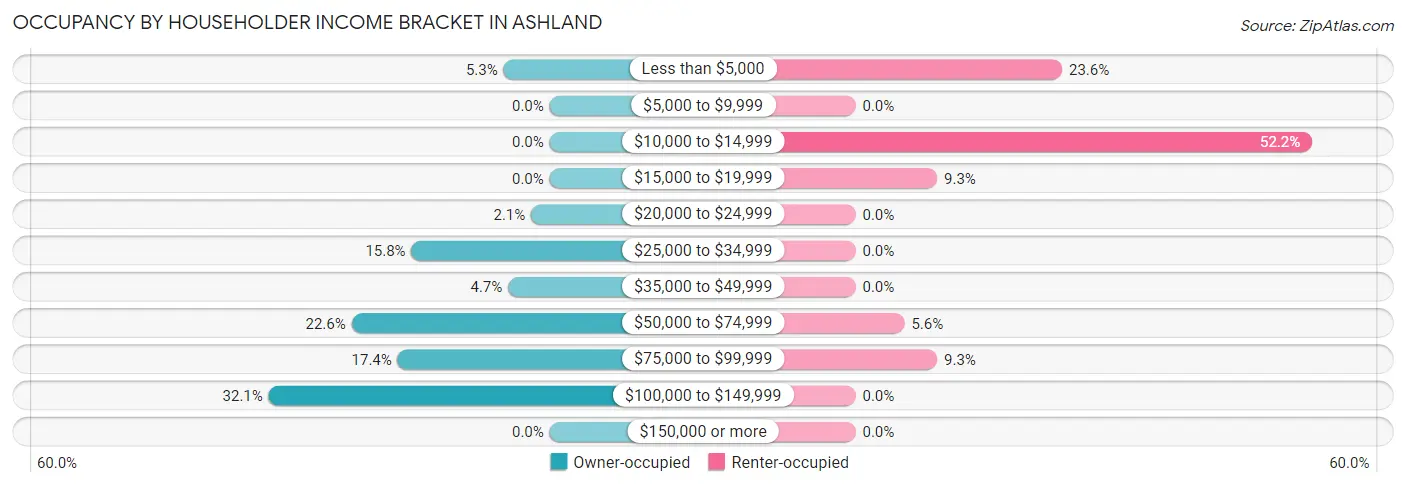
| Income Bracket | Owner-occupied | Renter-occupied |
| Less than $5,000 | 10 (5.3%) | 38 (23.6%) |
| $5,000 to $9,999 | 0 (0.0%) | 0 (0.0%) |
| $10,000 to $14,999 | 0 (0.0%) | 84 (52.2%) |
| $15,000 to $19,999 | 0 (0.0%) | 15 (9.3%) |
| $20,000 to $24,999 | 4 (2.1%) | 0 (0.0%) |
| $25,000 to $34,999 | 30 (15.8%) | 0 (0.0%) |
| $35,000 to $49,999 | 9 (4.7%) | 0 (0.0%) |
| $50,000 to $74,999 | 43 (22.6%) | 9 (5.6%) |
| $75,000 to $99,999 | 33 (17.4%) | 15 (9.3%) |
| $100,000 to $149,999 | 61 (32.1%) | 0 (0.0%) |
| $150,000 or more | 0 (0.0%) | 0 (0.0%) |
| Total | 190 (100.0%) | 161 (100.0%) |
Monthly Housing Cost Tiers in Ashland
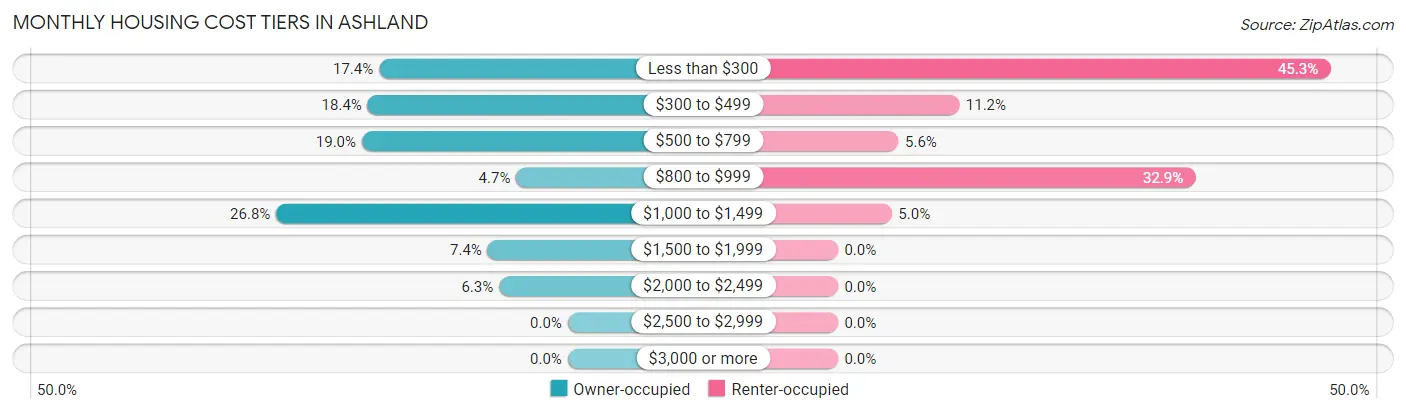
| Monthly Cost | Owner-occupied | Renter-occupied |
| Less than $300 | 33 (17.4%) | 73 (45.3%) |
| $300 to $499 | 35 (18.4%) | 18 (11.2%) |
| $500 to $799 | 36 (19.0%) | 9 (5.6%) |
| $800 to $999 | 9 (4.7%) | 53 (32.9%) |
| $1,000 to $1,499 | 51 (26.8%) | 8 (5.0%) |
| $1,500 to $1,999 | 14 (7.4%) | 0 (0.0%) |
| $2,000 to $2,499 | 12 (6.3%) | 0 (0.0%) |
| $2,500 to $2,999 | 0 (0.0%) | 0 (0.0%) |
| $3,000 or more | 0 (0.0%) | 0 (0.0%) |
| Total | 190 (100.0%) | 161 (100.0%) |
Physical Housing Characteristics in Ashland
Housing Structures in Ashland
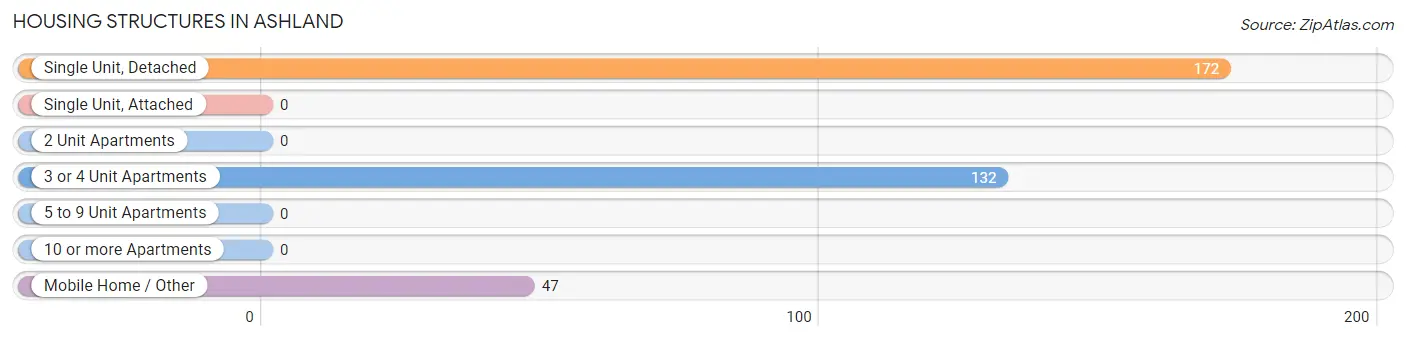
| Structure Type | # Housing Units | % Housing Units |
| Single Unit, Detached | 172 | 49.0% |
| Single Unit, Attached | 0 | 0.0% |
| 2 Unit Apartments | 0 | 0.0% |
| 3 or 4 Unit Apartments | 132 | 37.6% |
| 5 to 9 Unit Apartments | 0 | 0.0% |
| 10 or more Apartments | 0 | 0.0% |
| Mobile Home / Other | 47 | 13.4% |
| Total | 351 | 100.0% |
Housing Structures by Occupancy in Ashland
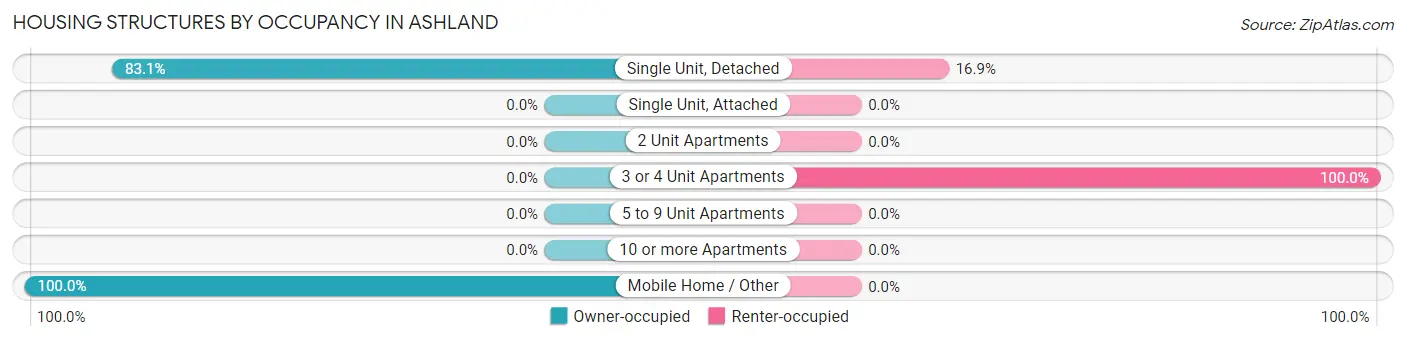
| Structure Type | Owner-occupied | Renter-occupied |
| Single Unit, Detached | 143 (83.1%) | 29 (16.9%) |
| Single Unit, Attached | 0 (0.0%) | 0 (0.0%) |
| 2 Unit Apartments | 0 (0.0%) | 0 (0.0%) |
| 3 or 4 Unit Apartments | 0 (0.0%) | 132 (100.0%) |
| 5 to 9 Unit Apartments | 0 (0.0%) | 0 (0.0%) |
| 10 or more Apartments | 0 (0.0%) | 0 (0.0%) |
| Mobile Home / Other | 47 (100.0%) | 0 (0.0%) |
| Total | 190 (54.1%) | 161 (45.9%) |
Housing Structures by Number of Rooms in Ashland
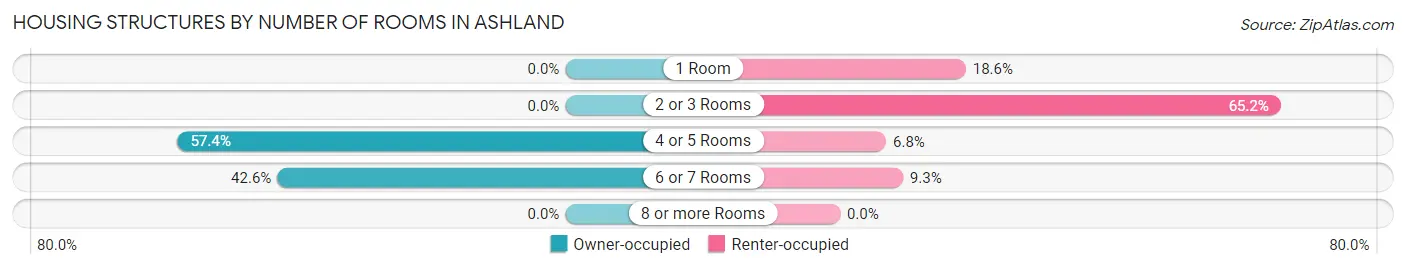
| Number of Rooms | Owner-occupied | Renter-occupied |
| 1 Room | 0 (0.0%) | 30 (18.6%) |
| 2 or 3 Rooms | 0 (0.0%) | 105 (65.2%) |
| 4 or 5 Rooms | 109 (57.4%) | 11 (6.8%) |
| 6 or 7 Rooms | 81 (42.6%) | 15 (9.3%) |
| 8 or more Rooms | 0 (0.0%) | 0 (0.0%) |
| Total | 190 (100.0%) | 161 (100.0%) |
Housing Structure by Heating Type in Ashland
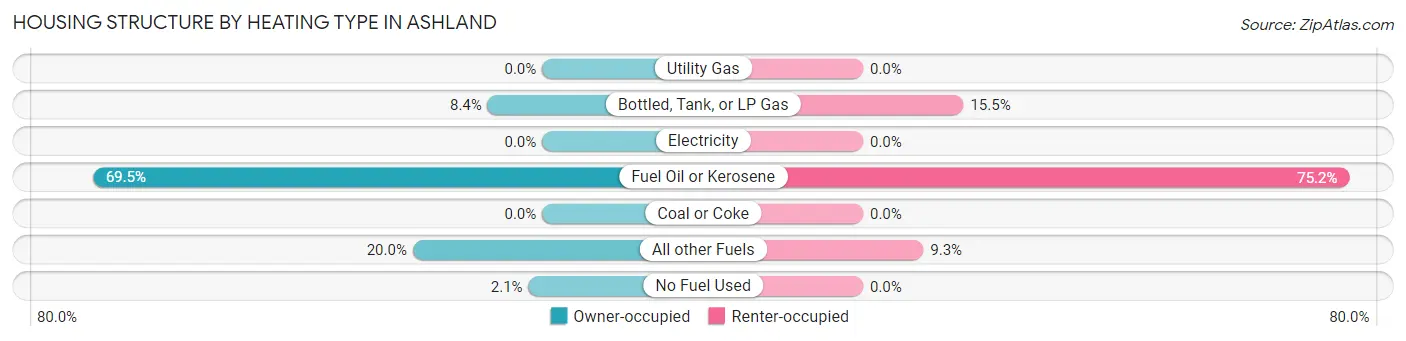
| Heating Type | Owner-occupied | Renter-occupied |
| Utility Gas | 0 (0.0%) | 0 (0.0%) |
| Bottled, Tank, or LP Gas | 16 (8.4%) | 25 (15.5%) |
| Electricity | 0 (0.0%) | 0 (0.0%) |
| Fuel Oil or Kerosene | 132 (69.5%) | 121 (75.2%) |
| Coal or Coke | 0 (0.0%) | 0 (0.0%) |
| All other Fuels | 38 (20.0%) | 15 (9.3%) |
| No Fuel Used | 4 (2.1%) | 0 (0.0%) |
| Total | 190 (100.0%) | 161 (100.0%) |
Household Vehicle Usage in Ashland
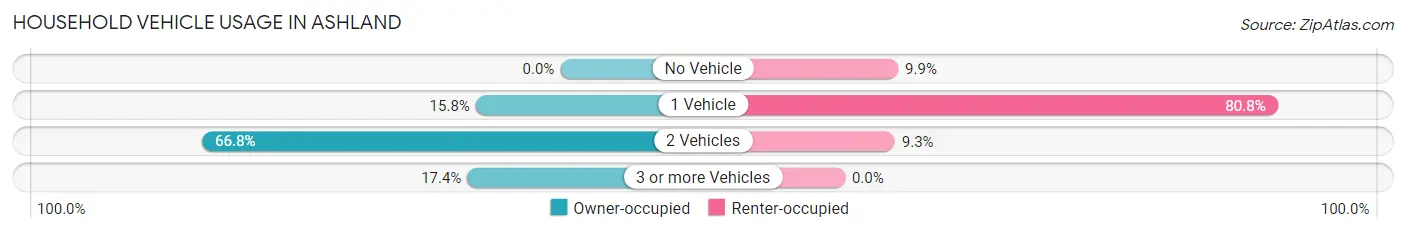
| Vehicles per Household | Owner-occupied | Renter-occupied |
| No Vehicle | 0 (0.0%) | 16 (9.9%) |
| 1 Vehicle | 30 (15.8%) | 130 (80.7%) |
| 2 Vehicles | 127 (66.8%) | 15 (9.3%) |
| 3 or more Vehicles | 33 (17.4%) | 0 (0.0%) |
| Total | 190 (100.0%) | 161 (100.0%) |
Real Estate & Mortgages in Ashland
Real Estate and Mortgage Overview in Ashland
| Characteristic | Without Mortgage | With Mortgage |
| Housing Units | 104 | 86 |
| Median Property Value | $117,300 | $113,900 |
| Median Household Income | $66,458 | $0 |
| Monthly Housing Costs | $348 | $0 |
| Real Estate Taxes | $1,773 | $0 |
Property Value by Mortgage Status in Ashland
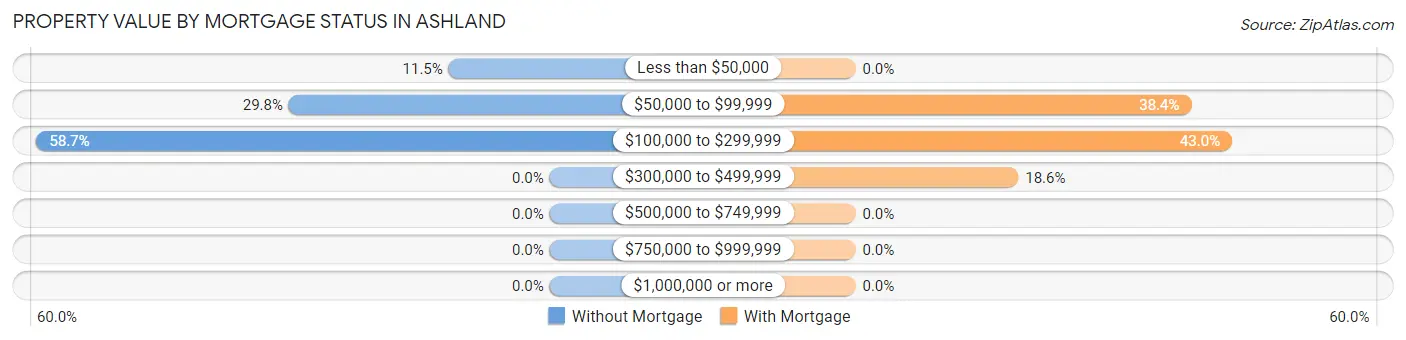
| Property Value | Without Mortgage | With Mortgage |
| Less than $50,000 | 12 (11.5%) | 0 (0.0%) |
| $50,000 to $99,999 | 31 (29.8%) | 33 (38.4%) |
| $100,000 to $299,999 | 61 (58.7%) | 37 (43.0%) |
| $300,000 to $499,999 | 0 (0.0%) | 16 (18.6%) |
| $500,000 to $749,999 | 0 (0.0%) | 0 (0.0%) |
| $750,000 to $999,999 | 0 (0.0%) | 0 (0.0%) |
| $1,000,000 or more | 0 (0.0%) | 0 (0.0%) |
| Total | 104 (100.0%) | 86 (100.0%) |
Household Income by Mortgage Status in Ashland
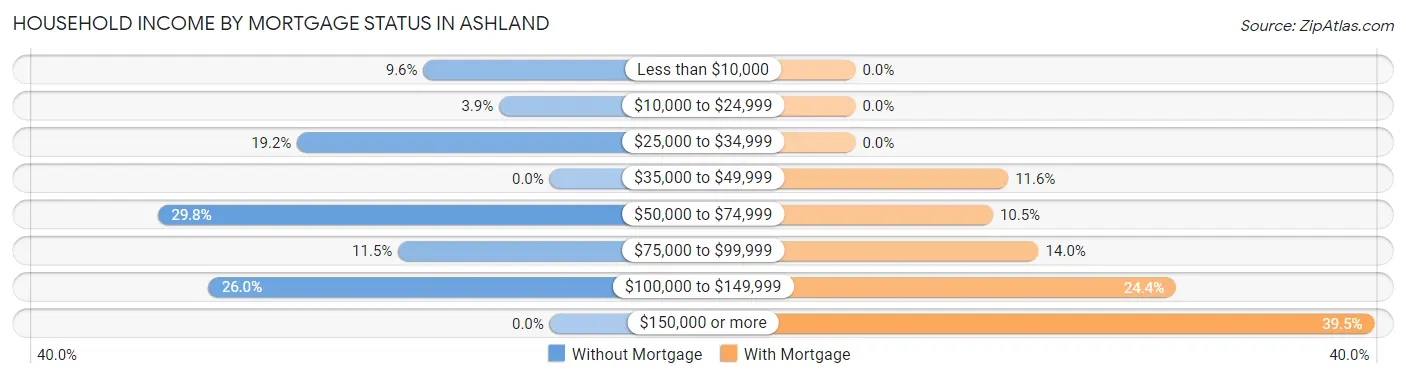
| Household Income | Without Mortgage | With Mortgage |
| Less than $10,000 | 10 (9.6%) | 0 (0.0%) |
| $10,000 to $24,999 | 4 (3.8%) | 0 (0.0%) |
| $25,000 to $34,999 | 20 (19.2%) | 0 (0.0%) |
| $35,000 to $49,999 | 0 (0.0%) | 10 (11.6%) |
| $50,000 to $74,999 | 31 (29.8%) | 9 (10.5%) |
| $75,000 to $99,999 | 12 (11.5%) | 12 (14.0%) |
| $100,000 to $149,999 | 27 (26.0%) | 21 (24.4%) |
| $150,000 or more | 0 (0.0%) | 34 (39.5%) |
| Total | 104 (100.0%) | 86 (100.0%) |
Property Value to Household Income Ratio in Ashland
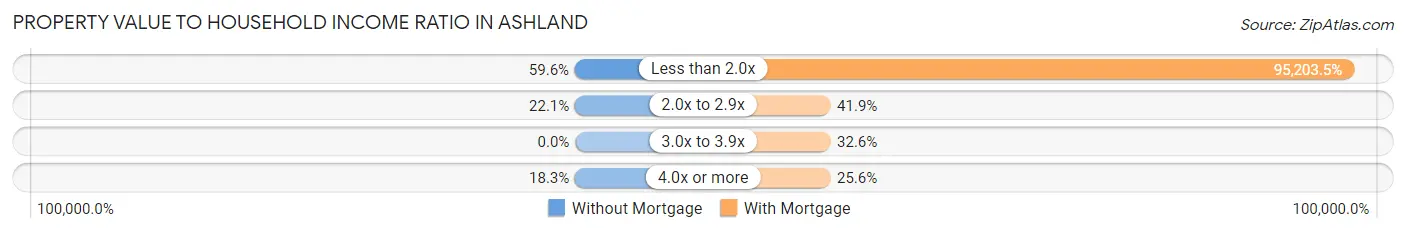
| Value-to-Income Ratio | Without Mortgage | With Mortgage |
| Less than 2.0x | 62 (59.6%) | 81,875 (95,203.5%) |
| 2.0x to 2.9x | 23 (22.1%) | 36 (41.9%) |
| 3.0x to 3.9x | 0 (0.0%) | 28 (32.6%) |
| 4.0x or more | 19 (18.3%) | 22 (25.6%) |
| Total | 104 (100.0%) | 86 (100.0%) |
Real Estate Taxes by Mortgage Status in Ashland
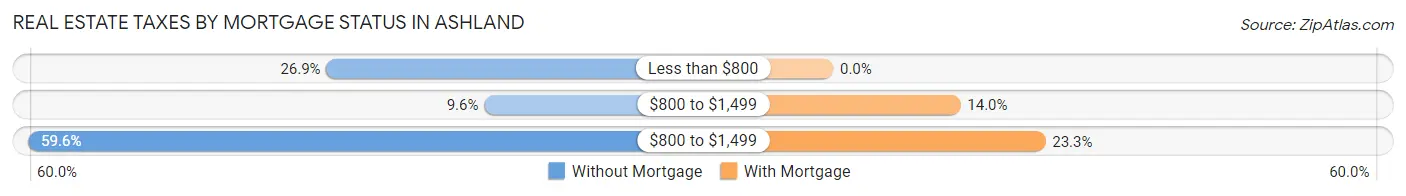
| Property Taxes | Without Mortgage | With Mortgage |
| Less than $800 | 28 (26.9%) | 0 (0.0%) |
| $800 to $1,499 | 10 (9.6%) | 12 (14.0%) |
| $800 to $1,499 | 62 (59.6%) | 20 (23.3%) |
| Total | 104 (100.0%) | 86 (100.0%) |
Health & Disability in Ashland
Health Insurance Coverage by Age in Ashland
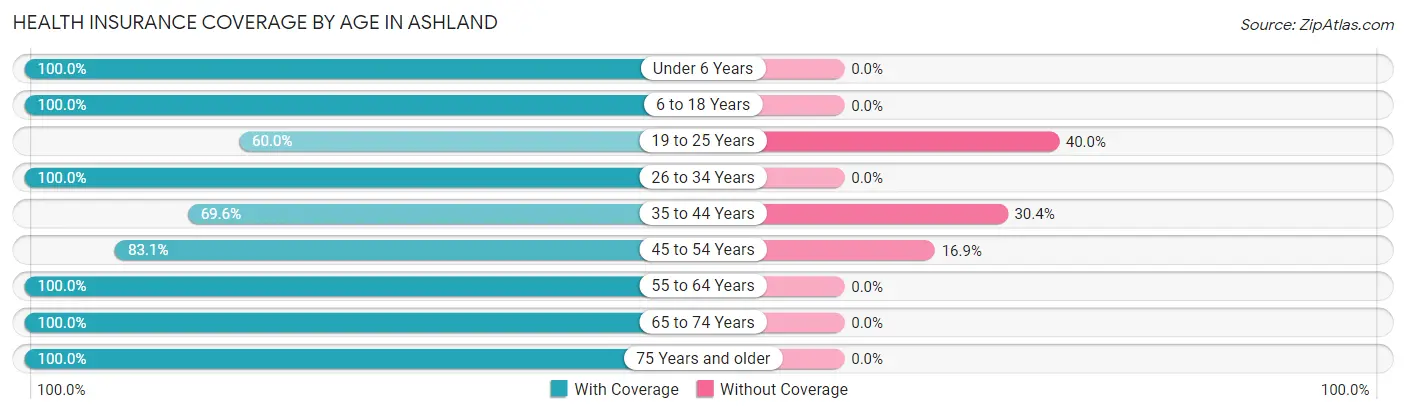
| Age Bracket | With Coverage | Without Coverage |
| Under 6 Years | 6 (100.0%) | 0 (0.0%) |
| 6 to 18 Years | 106 (100.0%) | 0 (0.0%) |
| 19 to 25 Years | 18 (60.0%) | 12 (40.0%) |
| 26 to 34 Years | 37 (100.0%) | 0 (0.0%) |
| 35 to 44 Years | 64 (69.6%) | 28 (30.4%) |
| 45 to 54 Years | 69 (83.1%) | 14 (16.9%) |
| 55 to 64 Years | 83 (100.0%) | 0 (0.0%) |
| 65 to 74 Years | 95 (100.0%) | 0 (0.0%) |
| 75 Years and older | 131 (100.0%) | 0 (0.0%) |
| Total | 609 (91.9%) | 54 (8.1%) |
Health Insurance Coverage by Citizenship Status in Ashland
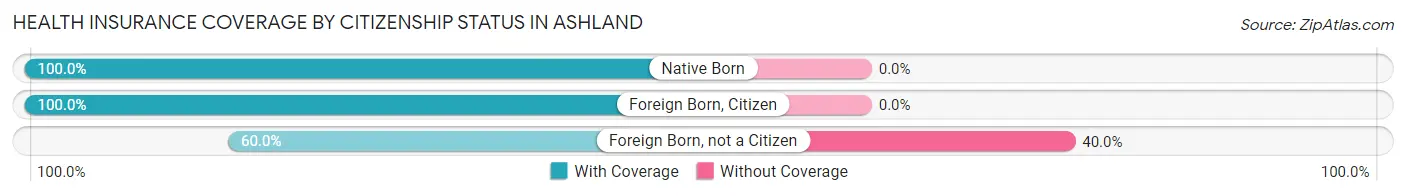
| Citizenship Status | With Coverage | Without Coverage |
| Native Born | 6 (100.0%) | 0 (0.0%) |
| Foreign Born, Citizen | 106 (100.0%) | 0 (0.0%) |
| Foreign Born, not a Citizen | 18 (60.0%) | 12 (40.0%) |
Health Insurance Coverage by Household Income in Ashland
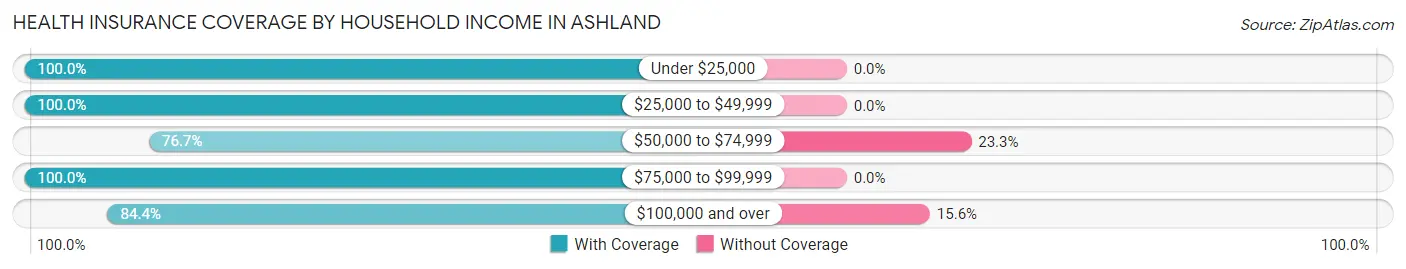
| Household Income | With Coverage | Without Coverage |
| Under $25,000 | 156 (100.0%) | 0 (0.0%) |
| $25,000 to $49,999 | 68 (100.0%) | 0 (0.0%) |
| $50,000 to $74,999 | 92 (76.7%) | 28 (23.3%) |
| $75,000 to $99,999 | 152 (100.0%) | 0 (0.0%) |
| $100,000 and over | 141 (84.4%) | 26 (15.6%) |
Public vs Private Health Insurance Coverage by Age in Ashland
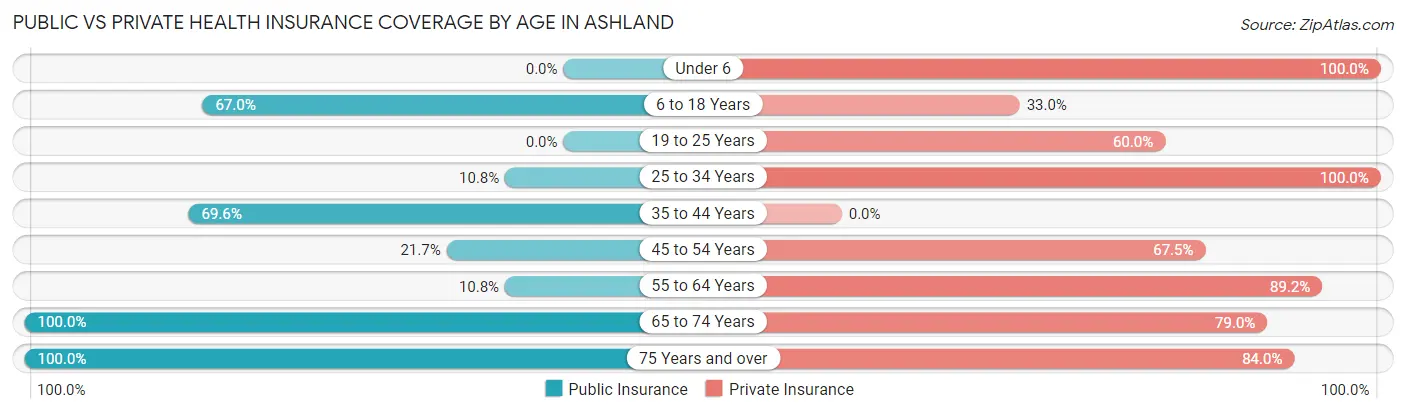
| Age Bracket | Public Insurance | Private Insurance |
| Under 6 | 0 (0.0%) | 6 (100.0%) |
| 6 to 18 Years | 71 (67.0%) | 35 (33.0%) |
| 19 to 25 Years | 0 (0.0%) | 18 (60.0%) |
| 25 to 34 Years | 4 (10.8%) | 37 (100.0%) |
| 35 to 44 Years | 64 (69.6%) | 0 (0.0%) |
| 45 to 54 Years | 18 (21.7%) | 56 (67.5%) |
| 55 to 64 Years | 9 (10.8%) | 74 (89.2%) |
| 65 to 74 Years | 95 (100.0%) | 75 (78.9%) |
| 75 Years and over | 131 (100.0%) | 110 (84.0%) |
| Total | 392 (59.1%) | 411 (62.0%) |
Disability Status by Sex by Age in Ashland
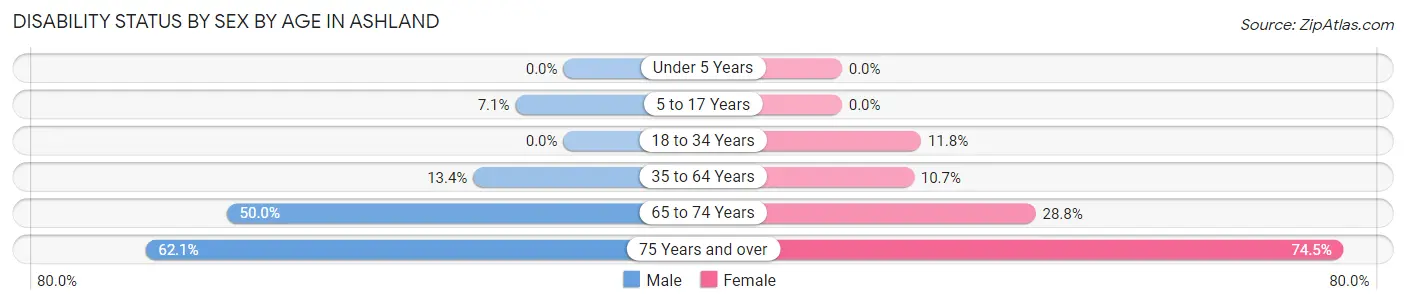
| Age Bracket | Male | Female |
| Under 5 Years | 0 (0.0%) | 0 (0.0%) |
| 5 to 17 Years | 5 (7.1%) | 0 (0.0%) |
| 18 to 34 Years | 0 (0.0%) | 4 (11.8%) |
| 35 to 64 Years | 17 (13.4%) | 14 (10.7%) |
| 65 to 74 Years | 11 (50.0%) | 21 (28.8%) |
| 75 Years and over | 18 (62.1%) | 76 (74.5%) |
Disability Class by Sex by Age in Ashland
Disability Class: Hearing Difficulty
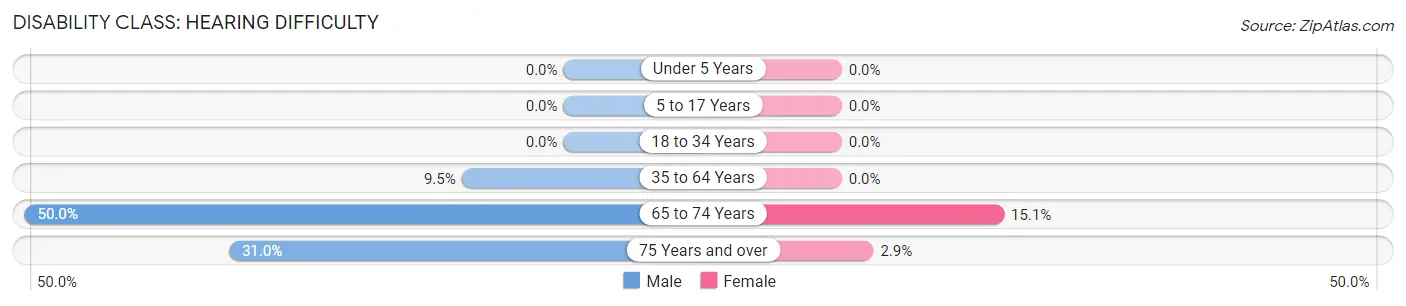
| Age Bracket | Male | Female |
| Under 5 Years | 0 (0.0%) | 0 (0.0%) |
| 5 to 17 Years | 0 (0.0%) | 0 (0.0%) |
| 18 to 34 Years | 0 (0.0%) | 0 (0.0%) |
| 35 to 64 Years | 12 (9.5%) | 0 (0.0%) |
| 65 to 74 Years | 11 (50.0%) | 11 (15.1%) |
| 75 Years and over | 9 (31.0%) | 3 (2.9%) |
Disability Class: Vision Difficulty
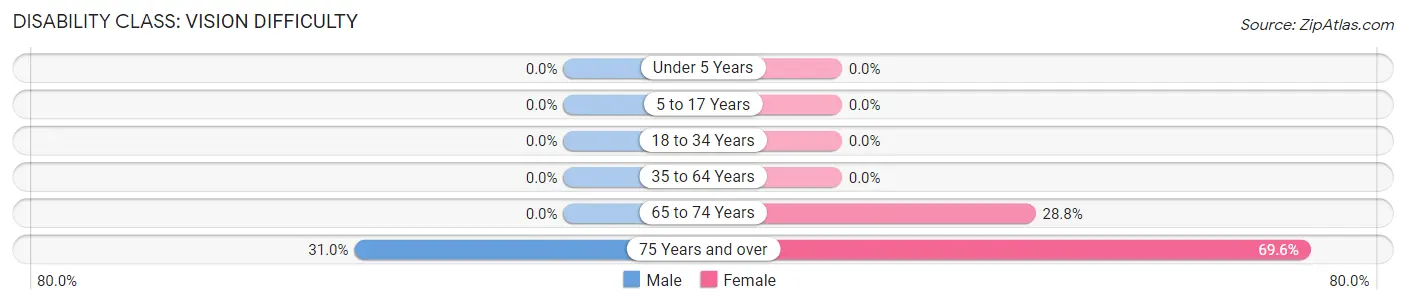
| Age Bracket | Male | Female |
| Under 5 Years | 0 (0.0%) | 0 (0.0%) |
| 5 to 17 Years | 0 (0.0%) | 0 (0.0%) |
| 18 to 34 Years | 0 (0.0%) | 0 (0.0%) |
| 35 to 64 Years | 0 (0.0%) | 0 (0.0%) |
| 65 to 74 Years | 0 (0.0%) | 21 (28.8%) |
| 75 Years and over | 9 (31.0%) | 71 (69.6%) |
Disability Class: Cognitive Difficulty
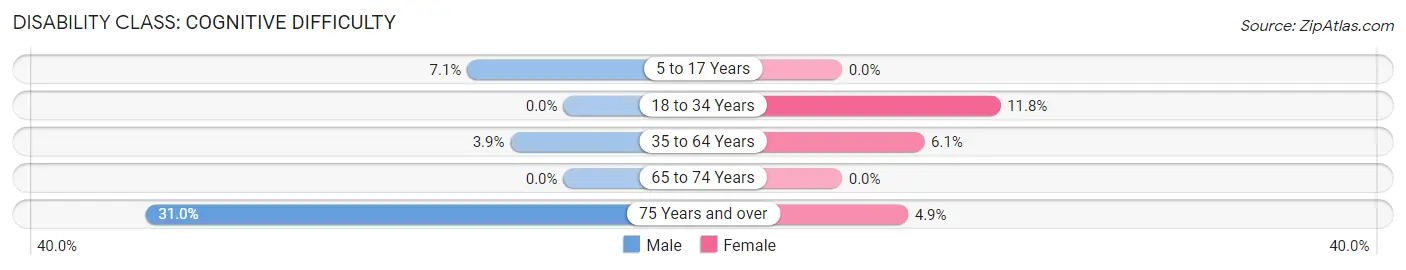
| Age Bracket | Male | Female |
| 5 to 17 Years | 5 (7.1%) | 0 (0.0%) |
| 18 to 34 Years | 0 (0.0%) | 4 (11.8%) |
| 35 to 64 Years | 5 (3.9%) | 8 (6.1%) |
| 65 to 74 Years | 0 (0.0%) | 0 (0.0%) |
| 75 Years and over | 9 (31.0%) | 5 (4.9%) |
Disability Class: Ambulatory Difficulty
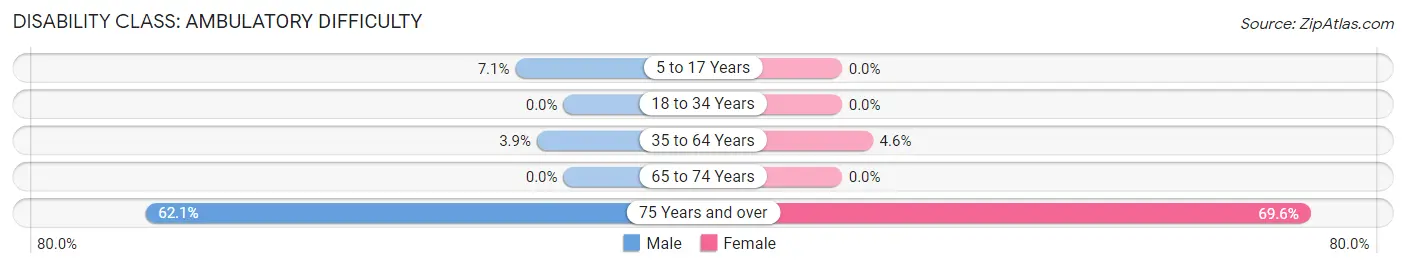
| Age Bracket | Male | Female |
| 5 to 17 Years | 5 (7.1%) | 0 (0.0%) |
| 18 to 34 Years | 0 (0.0%) | 0 (0.0%) |
| 35 to 64 Years | 5 (3.9%) | 6 (4.6%) |
| 65 to 74 Years | 0 (0.0%) | 0 (0.0%) |
| 75 Years and over | 18 (62.1%) | 71 (69.6%) |
Disability Class: Self-Care Difficulty
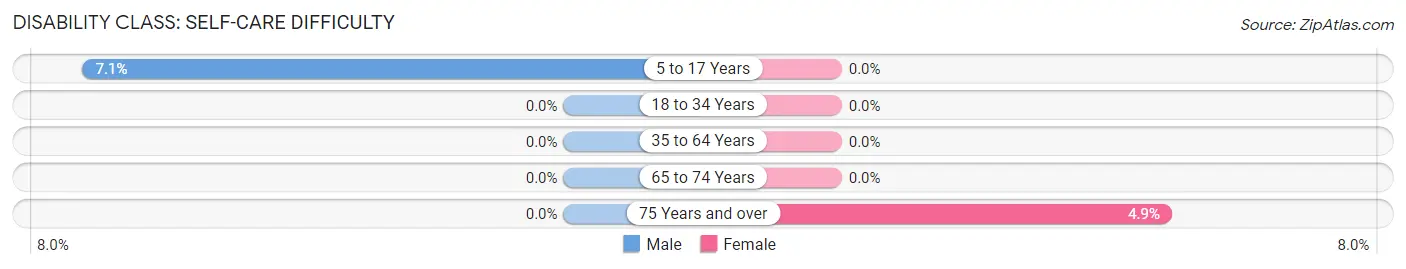
| Age Bracket | Male | Female |
| 5 to 17 Years | 5 (7.1%) | 0 (0.0%) |
| 18 to 34 Years | 0 (0.0%) | 0 (0.0%) |
| 35 to 64 Years | 0 (0.0%) | 0 (0.0%) |
| 65 to 74 Years | 0 (0.0%) | 0 (0.0%) |
| 75 Years and over | 0 (0.0%) | 5 (4.9%) |
Technology Access in Ashland
Computing Device Access in Ashland
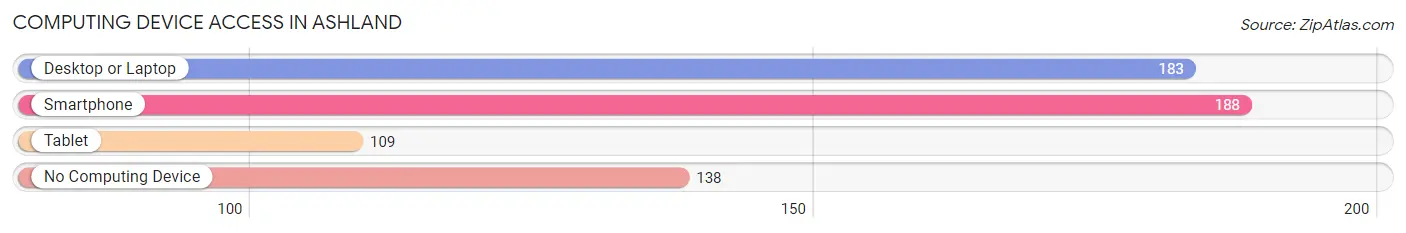
| Device Type | # Households | % Households |
| Desktop or Laptop | 183 | 52.1% |
| Smartphone | 188 | 53.6% |
| Tablet | 109 | 31.0% |
| No Computing Device | 138 | 39.3% |
| Total | 351 | 100.0% |
Internet Access in Ashland
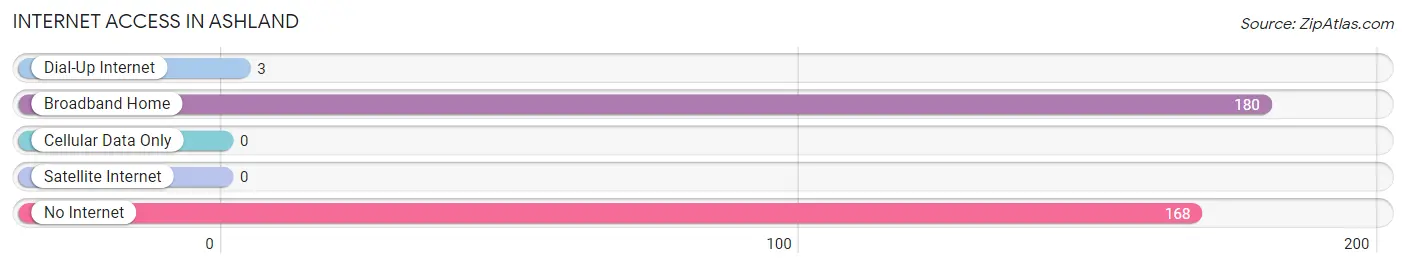
| Internet Type | # Households | % Households |
| Dial-Up Internet | 3 | 0.9% |
| Broadband Home | 180 | 51.3% |
| Cellular Data Only | 0 | 0.0% |
| Satellite Internet | 0 | 0.0% |
| No Internet | 168 | 47.9% |
| Total | 351 | 100.0% |
Ashland Summary
Ashland, Maine is a small town located in Aroostook County, in the northernmost part of the state. It is situated on the banks of the Aroostook River, and is bordered by the towns of Masardis, Portage Lake, and Oxbow. The town has a population of 1,717 people, according to the 2010 census.
History
The area that is now Ashland was first settled in the early 1800s by a group of French-Canadian immigrants. The town was originally known as “St. John’s”, and was later renamed “Ashland” in 1845. The name was chosen in honor of the Ashland Iron Works, which was located in the area. The iron works was established in 1837, and was the first industry in the area.
The town was incorporated in 1848, and the first town meeting was held in 1849. The town grew slowly, but steadily, and by the early 1900s, it had become a thriving community. The town was home to several businesses, including a sawmill, a gristmill, a blacksmith shop, and a general store.
Geography
Ashland is located in the northernmost part of Maine, in Aroostook County. It is situated on the banks of the Aroostook River, and is bordered by the towns of Masardis, Portage Lake, and Oxbow. The town covers an area of approximately 24 square miles, and is located at an elevation of approximately 1,000 feet.
The town is located in a rural area, and is surrounded by forests and lakes. The nearest major city is Bangor, which is located approximately 75 miles to the south.
Economy
The economy of Ashland is largely based on agriculture and forestry. The town is home to several farms, which produce a variety of crops, including potatoes, hay, and corn. The town is also home to several sawmills, which produce lumber for the local market.
The town is also home to several small businesses, including restaurants, retail stores, and service providers. The town is also home to a small airport, which serves the local area.
Demographics
According to the 2010 census, the population of Ashland was 1,717 people. The population is predominantly white, with approximately 95% of the population identifying as white. The median household income is approximately $37,000, and the median age is 44.
The town is home to a variety of religious denominations, including Catholic, Protestant, and non-denominational. The town is also home to a variety of ethnicities, including French-Canadian, Irish, and German.
Conclusion
Ashland, Maine is a small town located in Aroostook County, in the northernmost part of the state. It is situated on the banks of the Aroostook River, and is bordered by the towns of Masardis, Portage Lake, and Oxbow. The town has a population of 1,717 people, according to the 2010 census. The economy of Ashland is largely based on agriculture and forestry, and the town is home to several small businesses. The population is predominantly white, with approximately 95% of the population identifying as white. The town is home to a variety of religious denominations, and a variety of ethnicities.
Common Questions
What is Per Capita Income in Ashland?
Per Capita income in Ashland is $27,402.
What is the Median Family Income in Ashland?
Median Family Income in Ashland is $83,611.
What is Income or Wage Gap in Ashland?
Income or Wage Gap in Ashland is 60.0%.
Women in Ashland earn 40.0 cents for every dollar earned by a man.
What is Inequality or Gini Index in Ashland?
Inequality or Gini Index in Ashland is 0.50.
What is the Total Population of Ashland?
Total Population of Ashland is 663.
What is the Total Male Population of Ashland?
Total Male Population of Ashland is 294.
What is the Total Female Population of Ashland?
Total Female Population of Ashland is 369.
What is the Ratio of Males per 100 Females in Ashland?
There are 79.67 Males per 100 Females in Ashland.
What is the Ratio of Females per 100 Males in Ashland?
There are 125.51 Females per 100 Males in Ashland.
What is the Median Population Age in Ashland?
Median Population Age in Ashland is 50.1 Years.
What is the Average Family Size in Ashland
Average Family Size in Ashland is 2.6 People.
What is the Average Household Size in Ashland
Average Household Size in Ashland is 1.9 People.
How Large is the Labor Force in Ashland?
There are 275 People in the Labor Forcein in Ashland.
What is the Percentage of People in the Labor Force in Ashland?
46.9% of People are in the Labor Force in Ashland.