Munson, FL Map & Demographics
Munson Map
Munson Overview
$14,817
PER CAPITA INCOME
$33,750
AVG FAMILY INCOME
$39,018
AVG HOUSEHOLD INCOME
13.0%
WAGE / INCOME GAP [ % ]
87.0¢/ $1
WAGE / INCOME GAP [ $ ]
0.29
INEQUALITY / GINI INDEX
390
TOTAL POPULATION
205
MALE POPULATION
185
FEMALE POPULATION
110.81
MALES / 100 FEMALES
90.24
FEMALES / 100 MALES
22.2
MEDIAN AGE
3.5
AVG FAMILY SIZE
3.2
AVG HOUSEHOLD SIZE
218
LABOR FORCE [ PEOPLE ]
87.2%
PERCENT IN LABOR FORCE
16.1%
UNEMPLOYMENT RATE
Income in Munson
Income Overview in Munson
Per Capita Income in Munson is $14,817, while median incomes of families and households are $33,750 and $39,018 respectively.
| Characteristic | Number | Measure |
| Per Capita Income | 390 | $14,817 |
| Median Family Income | 104 | $33,750 |
| Mean Family Income | 104 | $44,179 |
| Median Household Income | 121 | $39,018 |
| Mean Household Income | 121 | $46,926 |
| Income Deficit | 104 | $0 |
| Wage / Income Gap (%) | 390 | 13.00% |
| Wage / Income Gap ($) | 390 | 87.00¢ per $1 |
| Gini / Inequality Index | 390 | 0.29 |
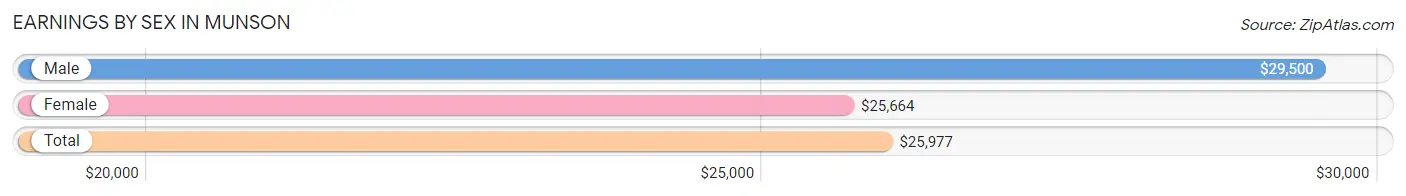
Earnings by Sex in Munson
Average Earnings in Munson are $25,977, $29,500 for men and $25,664 for women, a difference of 13.0%.
| Sex | Number | Average Earnings |
| Male | 72 (39.3%) | $29,500 |
| Female | 111 (60.7%) | $25,664 |
| Total | 183 (100.0%) | $25,977 |
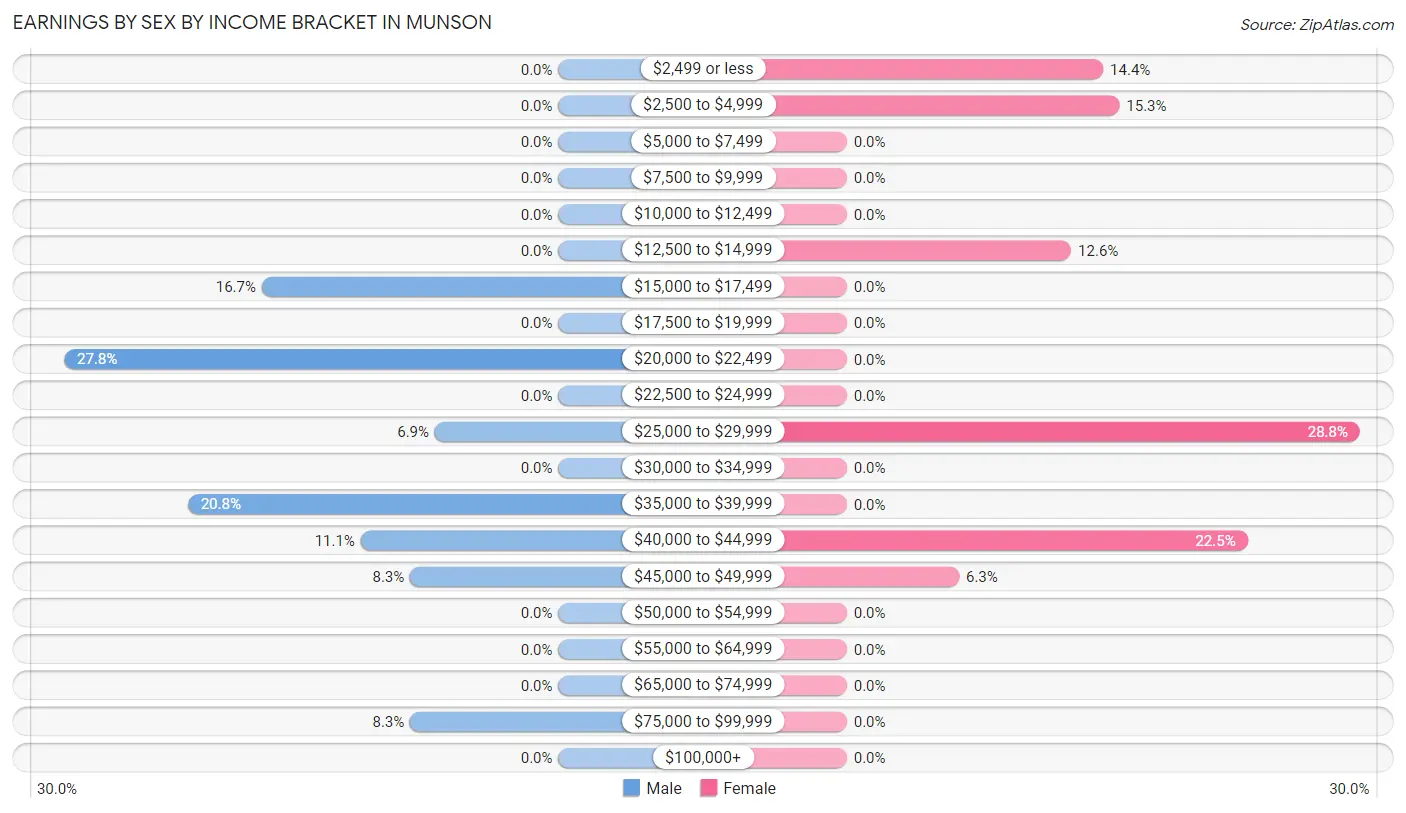
Earnings by Sex by Income Bracket in Munson
The most common earnings brackets in Munson are $20,000 to $22,499 for men (20 | 27.8%) and $25,000 to $29,999 for women (32 | 28.8%).
| Income | Male | Female |
| $2,499 or less | 0 (0.0%) | 16 (14.4%) |
| $2,500 to $4,999 | 0 (0.0%) | 17 (15.3%) |
| $5,000 to $7,499 | 0 (0.0%) | 0 (0.0%) |
| $7,500 to $9,999 | 0 (0.0%) | 0 (0.0%) |
| $10,000 to $12,499 | 0 (0.0%) | 0 (0.0%) |
| $12,500 to $14,999 | 0 (0.0%) | 14 (12.6%) |
| $15,000 to $17,499 | 12 (16.7%) | 0 (0.0%) |
| $17,500 to $19,999 | 0 (0.0%) | 0 (0.0%) |
| $20,000 to $22,499 | 20 (27.8%) | 0 (0.0%) |
| $22,500 to $24,999 | 0 (0.0%) | 0 (0.0%) |
| $25,000 to $29,999 | 5 (6.9%) | 32 (28.8%) |
| $30,000 to $34,999 | 0 (0.0%) | 0 (0.0%) |
| $35,000 to $39,999 | 15 (20.8%) | 0 (0.0%) |
| $40,000 to $44,999 | 8 (11.1%) | 25 (22.5%) |
| $45,000 to $49,999 | 6 (8.3%) | 7 (6.3%) |
| $50,000 to $54,999 | 0 (0.0%) | 0 (0.0%) |
| $55,000 to $64,999 | 0 (0.0%) | 0 (0.0%) |
| $65,000 to $74,999 | 0 (0.0%) | 0 (0.0%) |
| $75,000 to $99,999 | 6 (8.3%) | 0 (0.0%) |
| $100,000+ | 0 (0.0%) | 0 (0.0%) |
| Total | 72 (100.0%) | 111 (100.0%) |
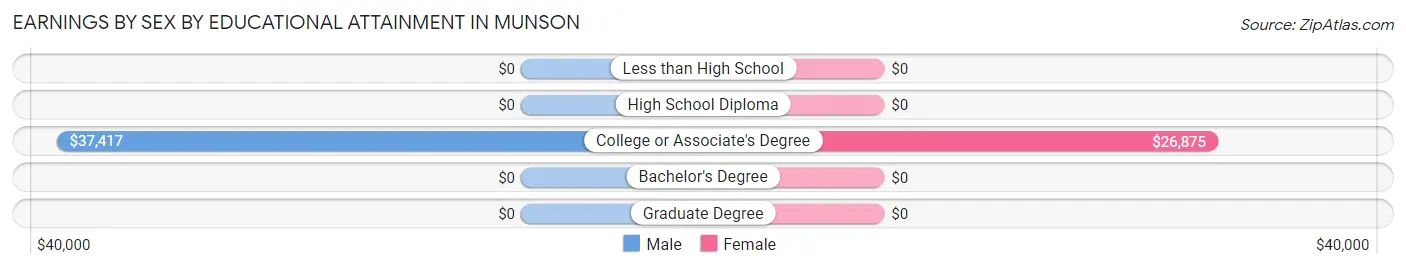
Earnings by Sex by Educational Attainment in Munson
Average earnings in Munson are $38,750 for men and $26,094 for women, a difference of 32.7%. Men with an educational attainment of college or associate's degree enjoy the highest average annual earnings of $37,417, while those with college or associate's degree education earn the least with $37,417. Women with an educational attainment of college or associate's degree earn the most with the average annual earnings of $26,875, while those with college or associate's degree education have the smallest earnings of $26,875.
| Educational Attainment | Male Income | Female Income |
| Less than High School | - | - |
| High School Diploma | - | - |
| College or Associate's Degree | $37,417 | $26,875 |
| Bachelor's Degree | - | - |
| Graduate Degree | - | - |
| Total | $38,750 | $26,094 |
Family Income in Munson
Family Income Brackets in Munson
According to the Munson family income data, there are 42 families falling into the $25,000 to $34,999 income range, which is the most common income bracket and makes up 40.4% of all families.
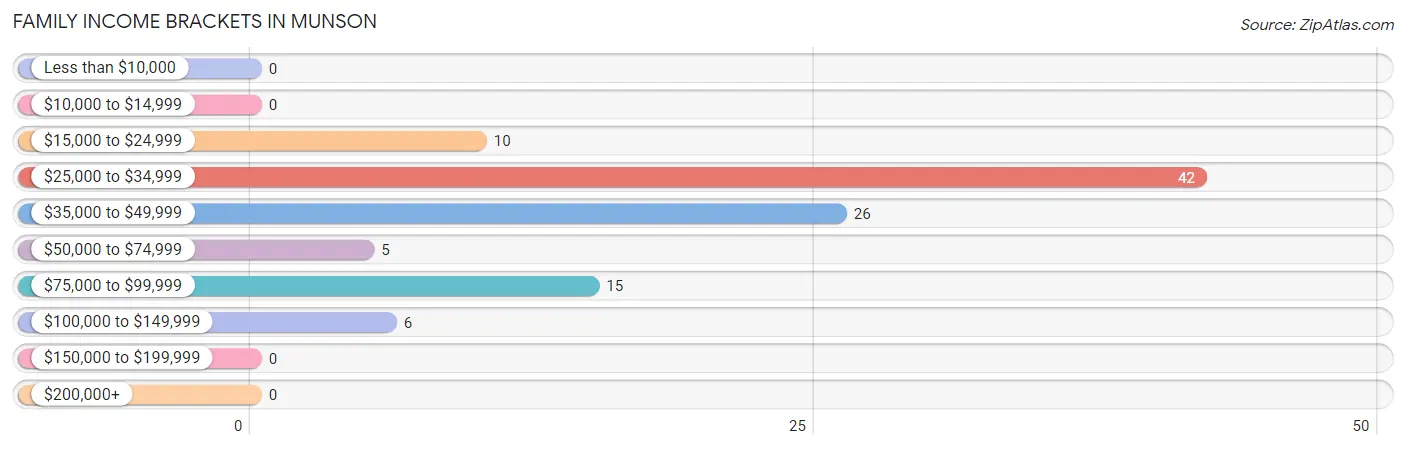
| Income Bracket | # Families | % Families |
| Less than $10,000 | 0 | 0.0% |
| $10,000 to $14,999 | 0 | 0.0% |
| $15,000 to $24,999 | 10 | 9.6% |
| $25,000 to $34,999 | 42 | 40.4% |
| $35,000 to $49,999 | 26 | 25.0% |
| $50,000 to $74,999 | 5 | 4.8% |
| $75,000 to $99,999 | 15 | 14.4% |
| $100,000 to $149,999 | 6 | 5.8% |
| $150,000 to $199,999 | 0 | 0.0% |
| $200,000+ | 0 | 0.0% |
Family Income by Famaliy Size in Munson
2-person families (34 | 32.7%) account for the highest median family income in Munson with $36,250 per family, while 2-person families (34 | 32.7%) have the highest median income of $18,125 per family member.
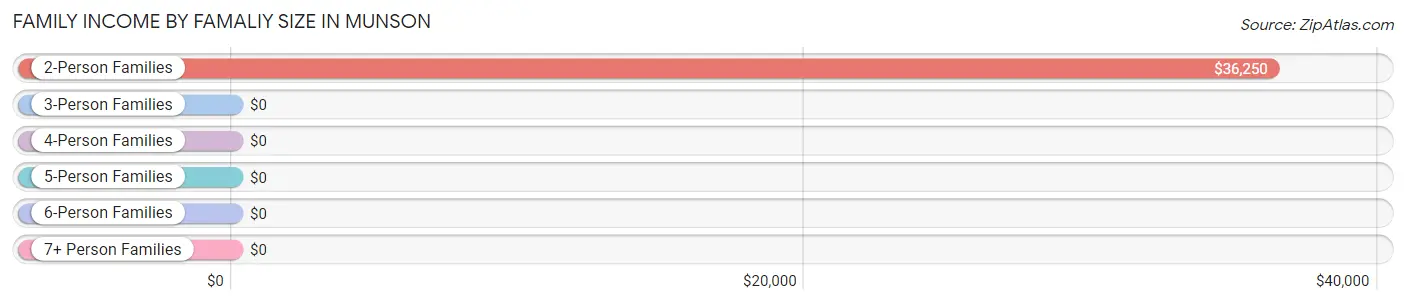
| Income Bracket | # Families | Median Income |
| 2-Person Families | 34 (32.7%) | $36,250 |
| 3-Person Families | 6 (5.8%) | $0 |
| 4-Person Families | 49 (47.1%) | $0 |
| 5-Person Families | 15 (14.4%) | $0 |
| 6-Person Families | 0 (0.0%) | $0 |
| 7+ Person Families | 0 (0.0%) | $0 |
| Total | 104 (100.0%) | $33,750 |
Family Income by Number of Earners in Munson
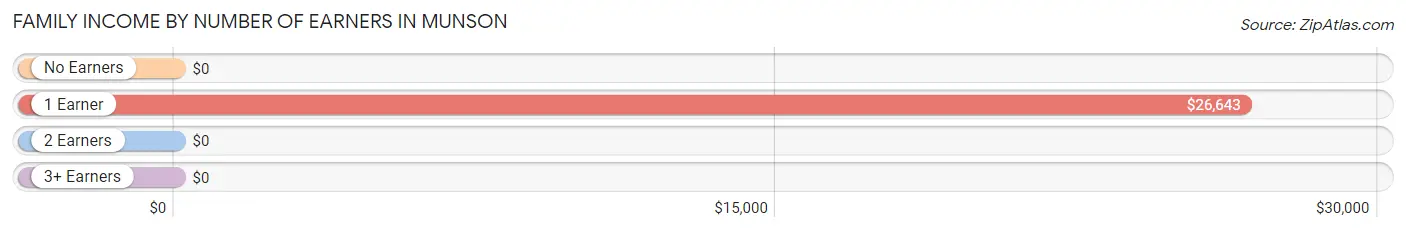
| Number of Earners | # Families | Median Income |
| No Earners | 13 (12.5%) | $0 |
| 1 Earner | 46 (44.2%) | $26,643 |
| 2 Earners | 31 (29.8%) | $0 |
| 3+ Earners | 14 (13.5%) | $0 |
| Total | 104 (100.0%) | $33,750 |
Household Income in Munson
Household Income Brackets in Munson
With 42 households falling in the category, the $25,000 to $34,999 income range is the most frequent in Munson, accounting for 34.7% of all households.
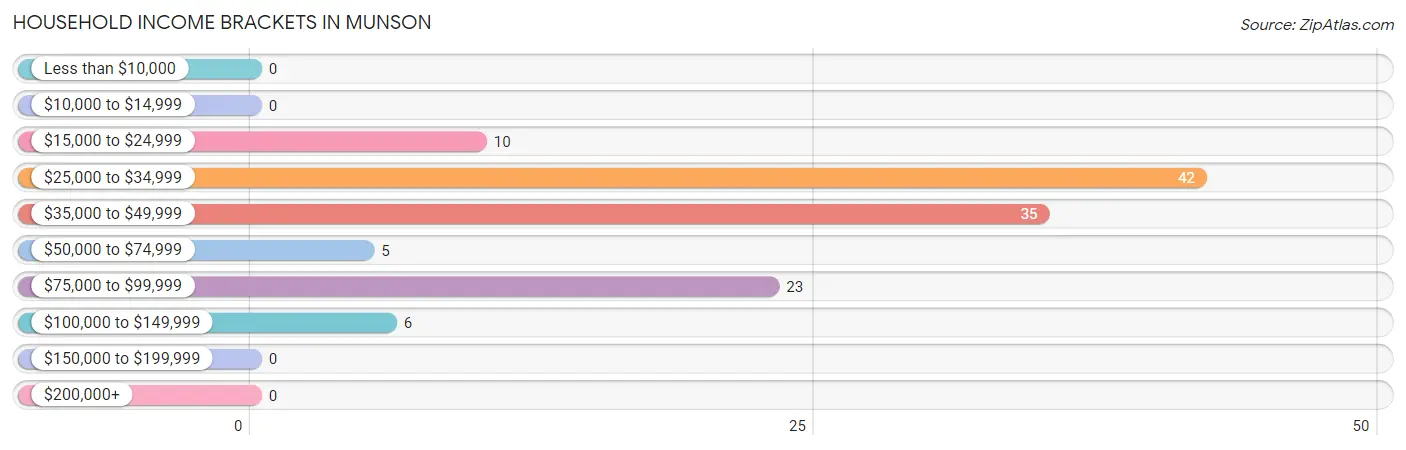
| Income Bracket | # Households | % Households |
| Less than $10,000 | 0 | 0.0% |
| $10,000 to $14,999 | 0 | 0.0% |
| $15,000 to $24,999 | 10 | 8.3% |
| $25,000 to $34,999 | 42 | 34.7% |
| $35,000 to $49,999 | 35 | 28.9% |
| $50,000 to $74,999 | 5 | 4.1% |
| $75,000 to $99,999 | 23 | 19.0% |
| $100,000 to $149,999 | 6 | 5.0% |
| $150,000 to $199,999 | 0 | 0.0% |
| $200,000+ | 0 | 0.0% |
Household Income by Householder Age in Munson
The median household income in Munson is $39,018, with the highest median household income of $43,333 found in the 65+ years age bracket for the primary householder. A total of 18 households (14.9%) fall into this category. Meanwhile, the 15 to 24 years age bracket for the primary householder has the lowest median household income of $0, with 10 households (8.3%) in this group.
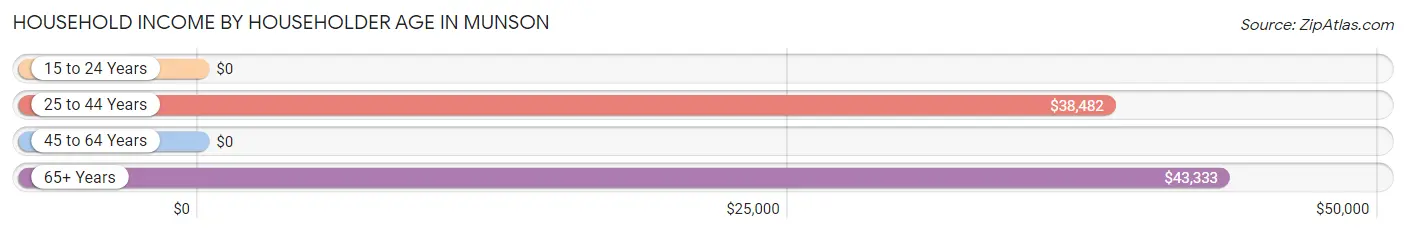
| Income Bracket | # Households | Median Income |
| 15 to 24 Years | 10 (8.3%) | $0 |
| 25 to 44 Years | 81 (66.9%) | $38,482 |
| 45 to 64 Years | 12 (9.9%) | $0 |
| 65+ Years | 18 (14.9%) | $43,333 |
| Total | 121 (100.0%) | $39,018 |
Poverty in Munson
Income Below Poverty by Sex and Age in Munson
With 53.2% poverty level for males and 17.3% for females among the residents of Munson, under 5 year old males and 35 to 44 year old females are the most vulnerable to poverty, with 74 males (91.4%) and 32 females (58.2%) in their respective age groups living below the poverty level.
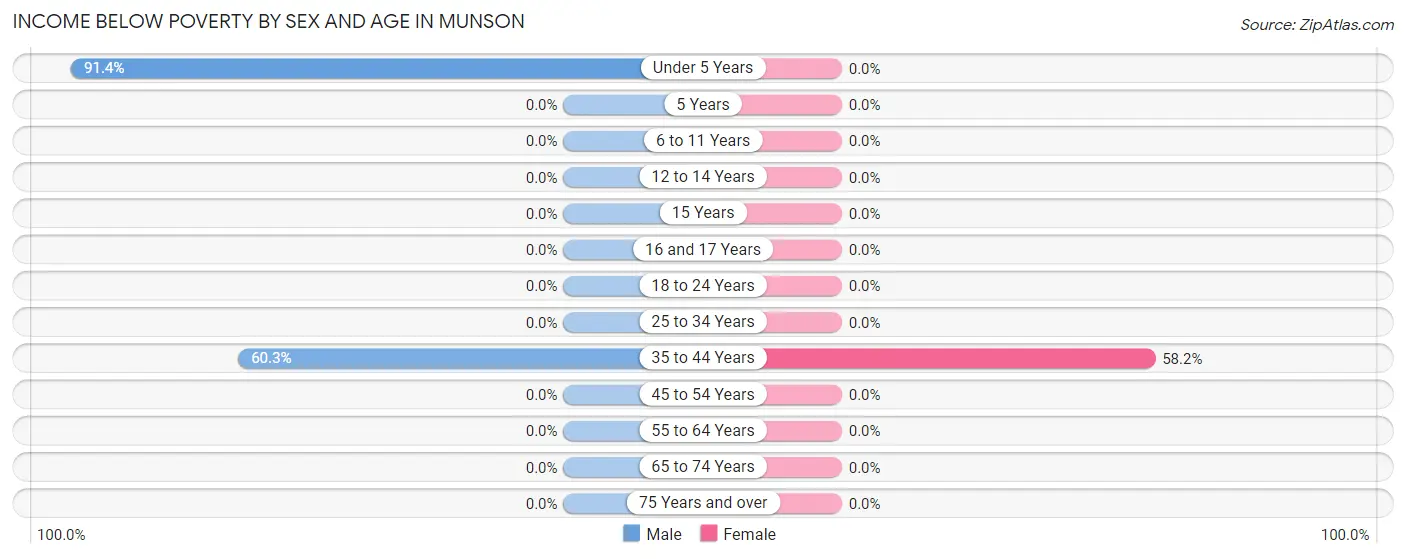
| Age Bracket | Male | Female |
| Under 5 Years | 74 (91.4%) | 0 (0.0%) |
| 5 Years | 0 (0.0%) | 0 (0.0%) |
| 6 to 11 Years | 0 (0.0%) | 0 (0.0%) |
| 12 to 14 Years | 0 (0.0%) | 0 (0.0%) |
| 15 Years | 0 (0.0%) | 0 (0.0%) |
| 16 and 17 Years | 0 (0.0%) | 0 (0.0%) |
| 18 to 24 Years | 0 (0.0%) | 0 (0.0%) |
| 25 to 34 Years | 0 (0.0%) | 0 (0.0%) |
| 35 to 44 Years | 35 (60.3%) | 32 (58.2%) |
| 45 to 54 Years | 0 (0.0%) | 0 (0.0%) |
| 55 to 64 Years | 0 (0.0%) | 0 (0.0%) |
| 65 to 74 Years | 0 (0.0%) | 0 (0.0%) |
| 75 Years and over | 0 (0.0%) | 0 (0.0%) |
| Total | 109 (53.2%) | 32 (17.3%) |
Income Above Poverty by Sex and Age in Munson
According to the poverty statistics in Munson, males aged 12 to 14 years and females aged under 5 years are the age groups that are most secure financially, with 100.0% of males and 100.0% of females in these age groups living above the poverty line.
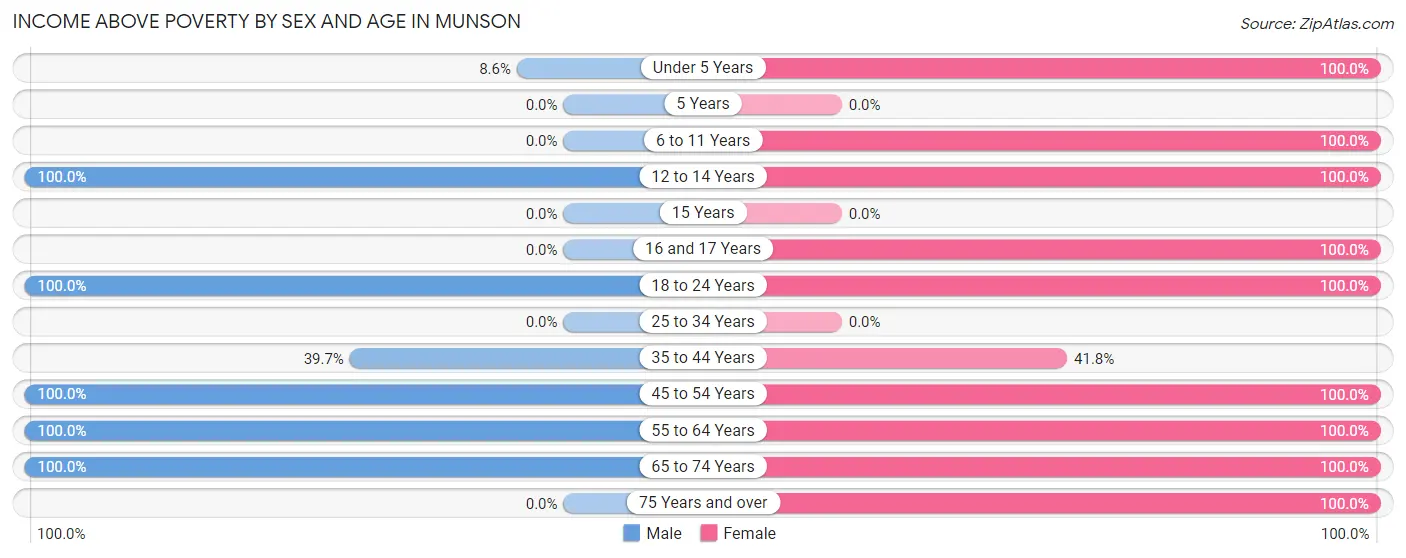
| Age Bracket | Male | Female |
| Under 5 Years | 7 (8.6%) | 12 (100.0%) |
| 5 Years | 0 (0.0%) | 0 (0.0%) |
| 6 to 11 Years | 0 (0.0%) | 26 (100.0%) |
| 12 to 14 Years | 7 (100.0%) | 14 (100.0%) |
| 15 Years | 0 (0.0%) | 0 (0.0%) |
| 16 and 17 Years | 0 (0.0%) | 33 (100.0%) |
| 18 to 24 Years | 32 (100.0%) | 10 (100.0%) |
| 25 to 34 Years | 0 (0.0%) | 0 (0.0%) |
| 35 to 44 Years | 23 (39.7%) | 23 (41.8%) |
| 45 to 54 Years | 10 (100.0%) | 13 (100.0%) |
| 55 to 64 Years | 12 (100.0%) | 9 (100.0%) |
| 65 to 74 Years | 5 (100.0%) | 6 (100.0%) |
| 75 Years and over | 0 (0.0%) | 7 (100.0%) |
| Total | 96 (46.8%) | 153 (82.7%) |
Income Below Poverty Among Married-Couple Families in Munson
The poverty statistics for married-couple families in Munson show that 56.5% or 35 of the total 62 families live below the poverty line. Families with 1 or 2 children have the highest poverty rate of 85.4%, comprising of 35 families. On the other hand, families with no children have the lowest poverty rate of 0.0%, which includes 0 families.
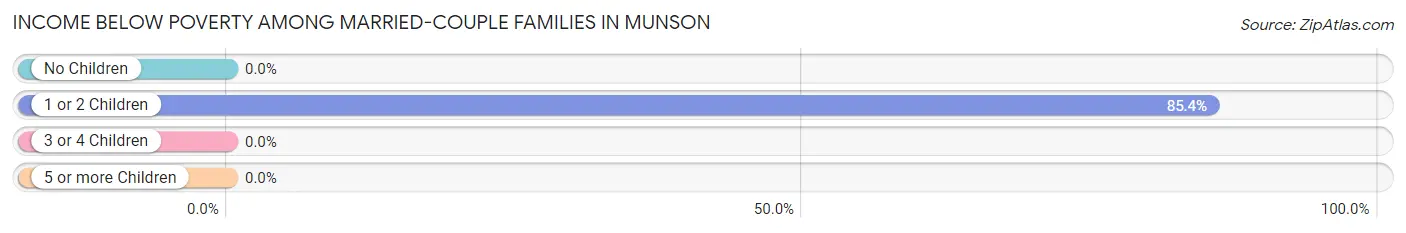
| Children | Above Poverty | Below Poverty |
| No Children | 21 (100.0%) | 0 (0.0%) |
| 1 or 2 Children | 6 (14.6%) | 35 (85.4%) |
| 3 or 4 Children | 0 (0.0%) | 0 (0.0%) |
| 5 or more Children | 0 (0.0%) | 0 (0.0%) |
| Total | 27 (43.5%) | 35 (56.5%) |
Income Below Poverty Among Single-Parent Households in Munson
| Children | Single Father | Single Mother |
| No Children | 0 (0.0%) | 0 (0.0%) |
| 1 or 2 Children | 0 (0.0%) | 0 (0.0%) |
| 3 or 4 Children | 0 (0.0%) | 0 (0.0%) |
| 5 or more Children | 0 (0.0%) | 0 (0.0%) |
| Total | 0 (0.0%) | 0 (0.0%) |
Income Below Poverty Among Married-Couple vs Single-Parent Households in Munson
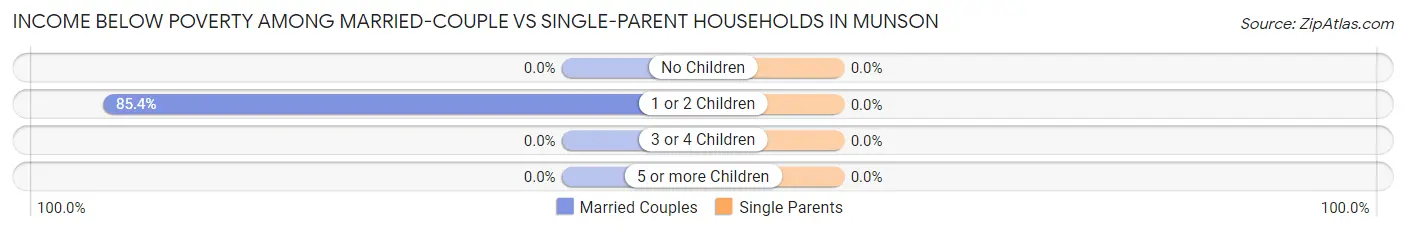
| Children | Married-Couple Families | Single-Parent Households |
| No Children | 0 (0.0%) | 0 (0.0%) |
| 1 or 2 Children | 35 (85.4%) | 0 (0.0%) |
| 3 or 4 Children | 0 (0.0%) | 0 (0.0%) |
| 5 or more Children | 0 (0.0%) | 0 (0.0%) |
| Total | 35 (56.5%) | 0 (0.0%) |
Race in Munson
The most populous races in Munson are White / Caucasian (370 | 94.9%), Hispanic or Latino (12 | 3.1%), and Some other Race (12 | 3.1%).
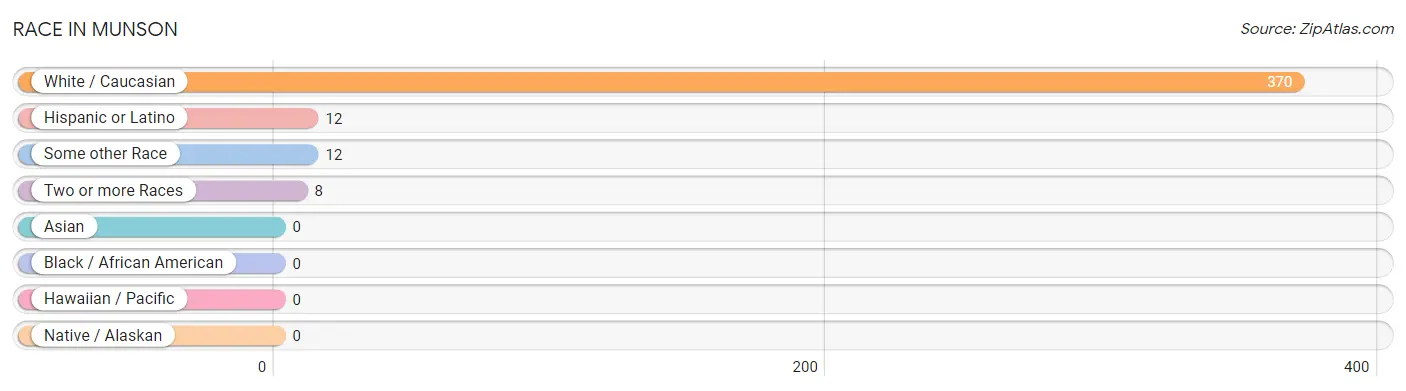
| Race | # Population | % Population |
| Asian | 0 | 0.0% |
| Black / African American | 0 | 0.0% |
| Hawaiian / Pacific | 0 | 0.0% |
| Hispanic or Latino | 12 | 3.1% |
| Native / Alaskan | 0 | 0.0% |
| White / Caucasian | 370 | 94.9% |
| Two or more Races | 8 | 2.1% |
| Some other Race | 12 | 3.1% |
| Total | 390 | 100.0% |
Ancestry in Munson
The most populous ancestries reported in Munson are English (99 | 25.4%), American (86 | 22.1%), Irish (19 | 4.9%), Peruvian (12 | 3.1%), and South American (12 | 3.1%), together accounting for 58.5% of all Munson residents.
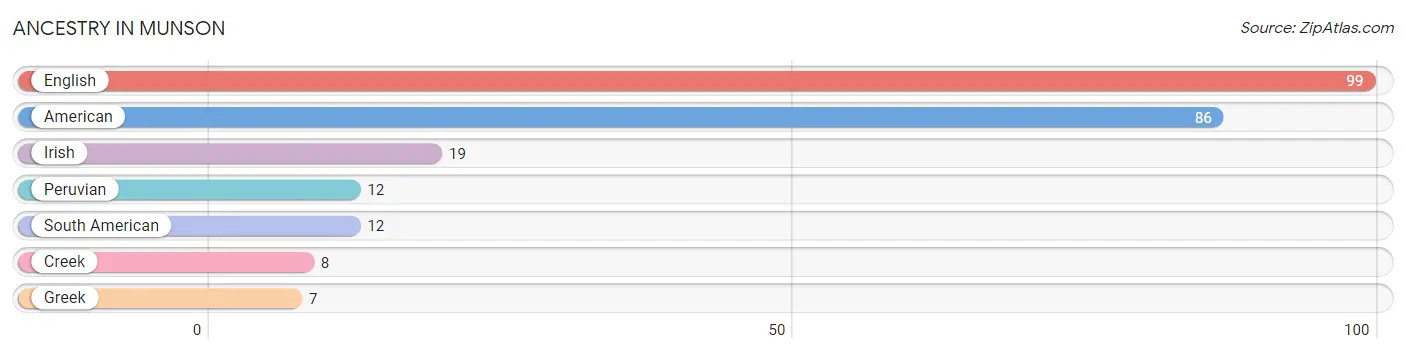
| Ancestry | # Population | % Population |
| American | 86 | 22.1% |
| Creek | 8 | 2.1% |
| English | 99 | 25.4% |
| Greek | 7 | 1.8% |
| Irish | 19 | 4.9% |
| Peruvian | 12 | 3.1% |
| South American | 12 | 3.1% | View All 7 Rows |
Immigrants in Munson

| Immigration Origin | # Population | % Population | View All 0 Rows |
Sex and Age in Munson
Sex and Age in Munson
The most populous age groups in Munson are Under 5 Years (81 | 39.5%) for men and 40 to 44 Years (46 | 24.9%) for women.
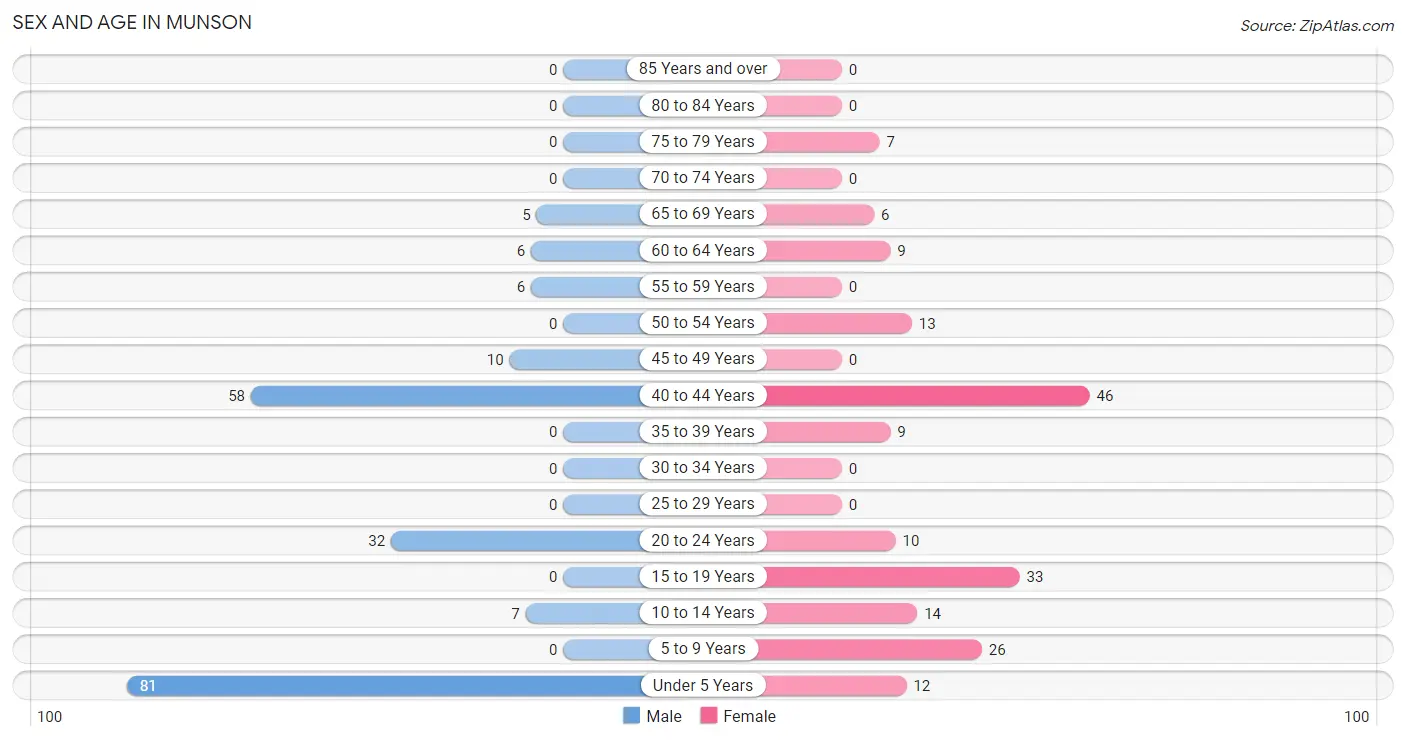
| Age Bracket | Male | Female |
| Under 5 Years | 81 (39.5%) | 12 (6.5%) |
| 5 to 9 Years | 0 (0.0%) | 26 (14.1%) |
| 10 to 14 Years | 7 (3.4%) | 14 (7.6%) |
| 15 to 19 Years | 0 (0.0%) | 33 (17.8%) |
| 20 to 24 Years | 32 (15.6%) | 10 (5.4%) |
| 25 to 29 Years | 0 (0.0%) | 0 (0.0%) |
| 30 to 34 Years | 0 (0.0%) | 0 (0.0%) |
| 35 to 39 Years | 0 (0.0%) | 9 (4.9%) |
| 40 to 44 Years | 58 (28.3%) | 46 (24.9%) |
| 45 to 49 Years | 10 (4.9%) | 0 (0.0%) |
| 50 to 54 Years | 0 (0.0%) | 13 (7.0%) |
| 55 to 59 Years | 6 (2.9%) | 0 (0.0%) |
| 60 to 64 Years | 6 (2.9%) | 9 (4.9%) |
| 65 to 69 Years | 5 (2.4%) | 6 (3.2%) |
| 70 to 74 Years | 0 (0.0%) | 0 (0.0%) |
| 75 to 79 Years | 0 (0.0%) | 7 (3.8%) |
| 80 to 84 Years | 0 (0.0%) | 0 (0.0%) |
| 85 Years and over | 0 (0.0%) | 0 (0.0%) |
| Total | 205 (100.0%) | 185 (100.0%) |
Families and Households in Munson
Median Family Size in Munson
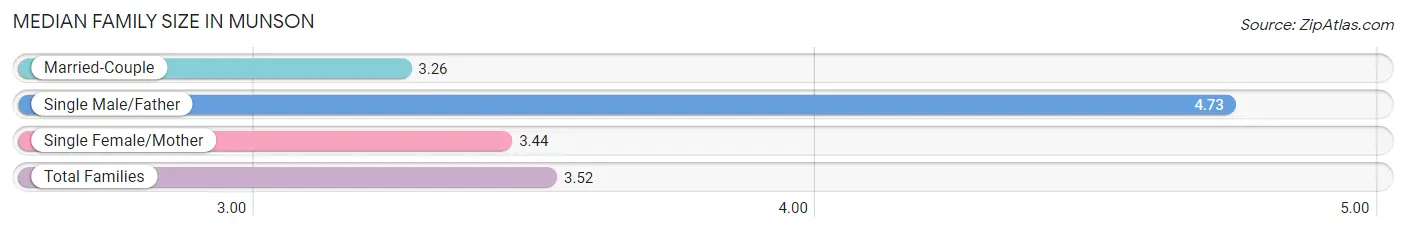
The median family size in Munson is 3.52 persons per family, with single male/father families (15 | 14.4%) accounting for the largest median family size of 4.73 persons per family. On the other hand, married-couple families (62 | 59.6%) represent the smallest median family size with 3.26 persons per family.
| Family Type | # Families | Family Size |
| Married-Couple | 62 (59.6%) | 3.26 |
| Single Male/Father | 15 (14.4%) | 4.73 |
| Single Female/Mother | 27 (26.0%) | 3.44 |
| Total Families | 104 (100.0%) | 3.52 |
Median Household Size in Munson
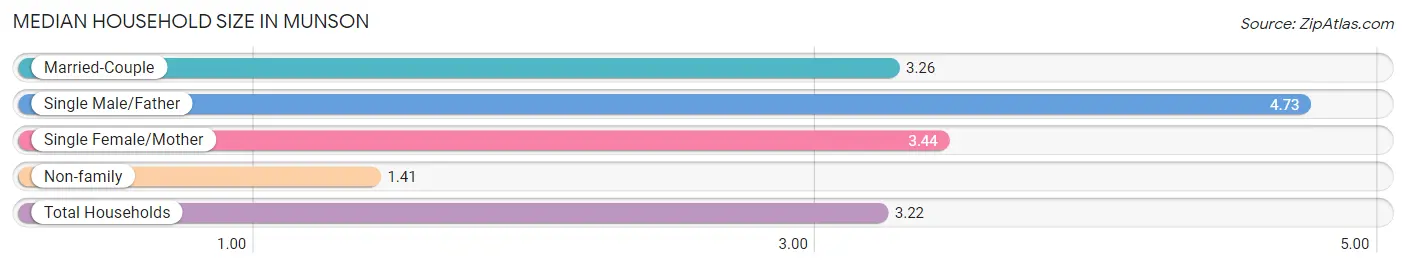
The median household size in Munson is 3.22 persons per household, with single male/father households (15 | 12.4%) accounting for the largest median household size of 4.73 persons per household. non-family households (17 | 14.1%) represent the smallest median household size with 1.41 persons per household.
| Household Type | # Households | Household Size |
| Married-Couple | 62 (51.2%) | 3.26 |
| Single Male/Father | 15 (12.4%) | 4.73 |
| Single Female/Mother | 27 (22.3%) | 3.44 |
| Non-family | 17 (14.1%) | 1.41 |
| Total Households | 121 (100.0%) | 3.22 |
Household Size by Marriage Status in Munson
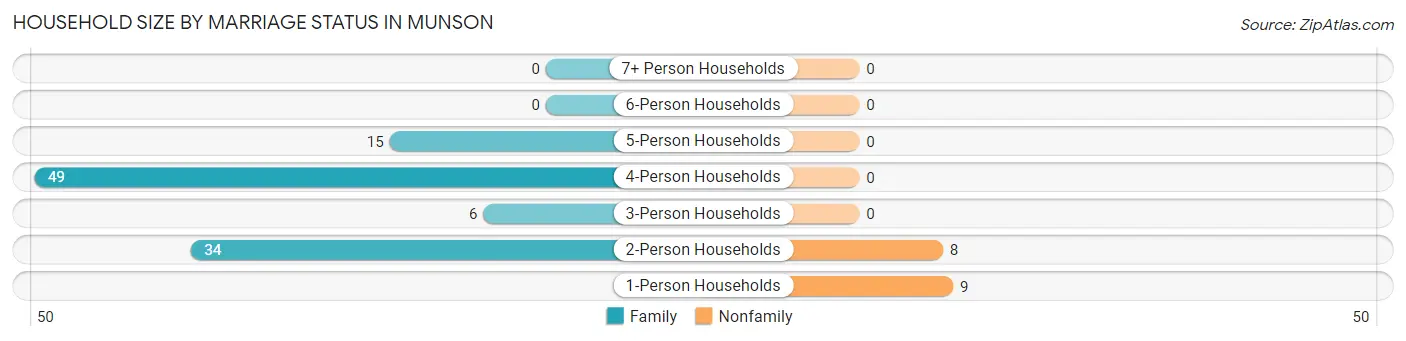
Out of a total of 121 households in Munson, 104 (86.0%) are family households, while 17 (14.1%) are nonfamily households. The most numerous type of family households are 4-person households, comprising 49, and the most common type of nonfamily households are 1-person households, comprising 9.
| Household Size | Family Households | Nonfamily Households |
| 1-Person Households | - | 9 (7.4%) |
| 2-Person Households | 34 (28.1%) | 8 (6.6%) |
| 3-Person Households | 6 (5.0%) | 0 (0.0%) |
| 4-Person Households | 49 (40.5%) | 0 (0.0%) |
| 5-Person Households | 15 (12.4%) | 0 (0.0%) |
| 6-Person Households | 0 (0.0%) | 0 (0.0%) |
| 7+ Person Households | 0 (0.0%) | 0 (0.0%) |
| Total | 104 (86.0%) | 17 (14.1%) |
Female Fertility in Munson
Fertility by Age in Munson
Average fertility rate in Munson is 143.0 births per 1,000 women. Women in the age bracket of 35 to 50 years have the highest fertility rate with 255.0 births per 1,000 women. Women in the age bracket of 35 to 50 years acount for 100.0% of all women with births.
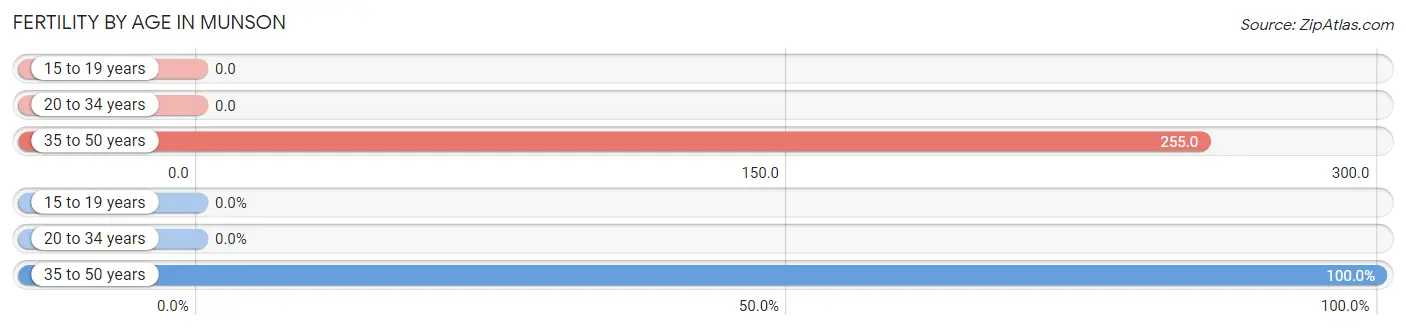
| Age Bracket | Women with Births | Births / 1,000 Women |
| 15 to 19 years | 0 (0.0%) | 0.0 |
| 20 to 34 years | 0 (0.0%) | 0.0 |
| 35 to 50 years | 14 (100.0%) | 255.0 |
| Total | 14 (100.0%) | 143.0 |
Fertility by Age by Marriage Status in Munson
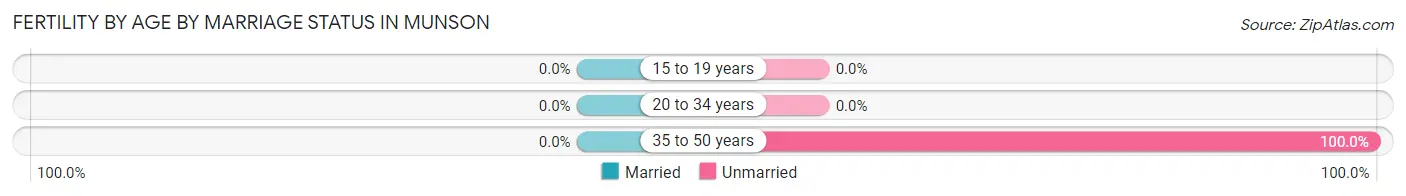
| Age Bracket | Married | Unmarried |
| 15 to 19 years | 0 (0.0%) | 0 (0.0%) |
| 20 to 34 years | 0 (0.0%) | 0 (0.0%) |
| 35 to 50 years | 0 (0.0%) | 14 (100.0%) |
| Total | 0 (0.0%) | 14 (100.0%) |
Fertility by Education in Munson
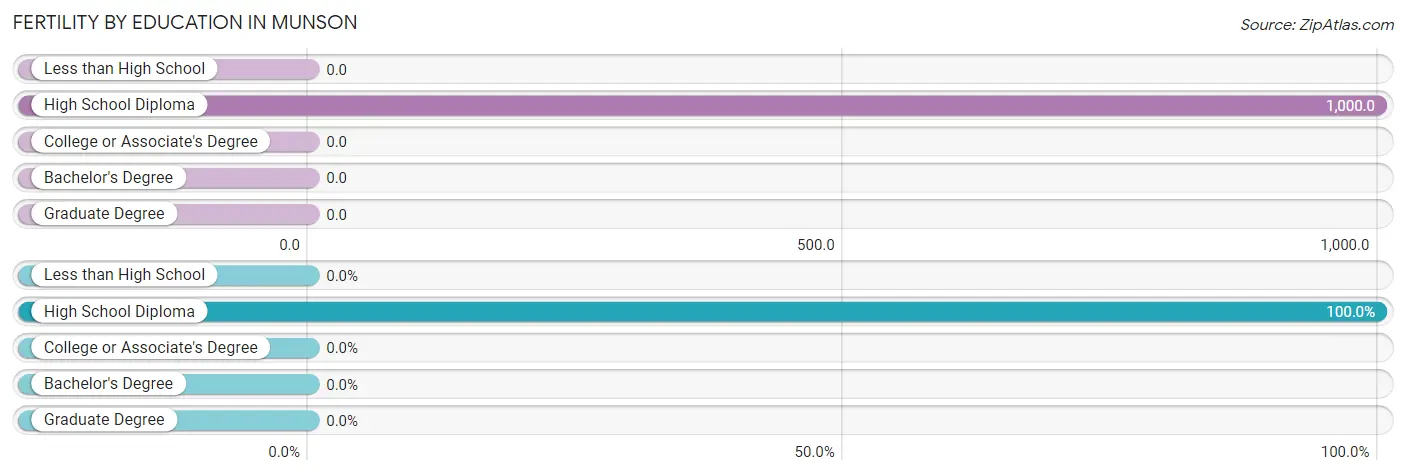
| Educational Attainment | Women with Births | Births / 1,000 Women |
| Less than High School | 0 (0.0%) | 0.0 |
| High School Diploma | 14 (100.0%) | 1,000.0 |
| College or Associate's Degree | 0 (0.0%) | 0.0 |
| Bachelor's Degree | 0 (0.0%) | 0.0 |
| Graduate Degree | 0 (0.0%) | 0.0 |
| Total | 14 (100.0%) | 143.0 |
Fertility by Education by Marriage Status in Munson
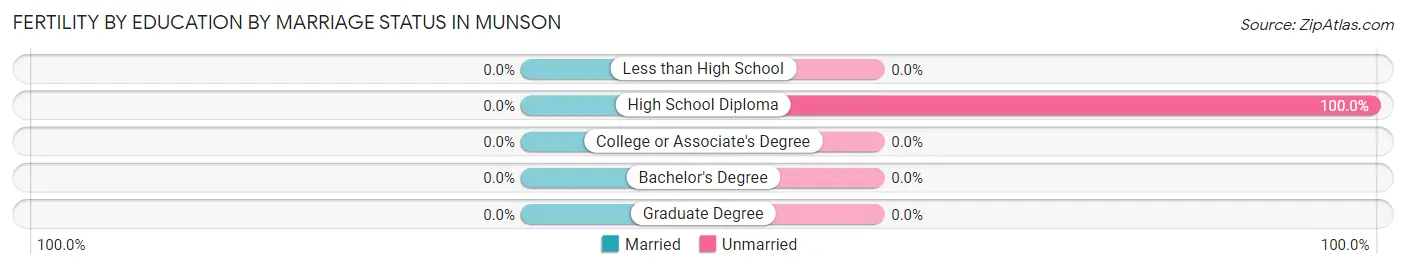
| Educational Attainment | Married | Unmarried |
| Less than High School | 0 (0.0%) | 0 (0.0%) |
| High School Diploma | 0 (0.0%) | 14 (100.0%) |
| College or Associate's Degree | 0 (0.0%) | 0 (0.0%) |
| Bachelor's Degree | 0 (0.0%) | 0 (0.0%) |
| Graduate Degree | 0 (0.0%) | 0 (0.0%) |
| Total | 0 (0.0%) | 14 (100.0%) |
Employment Characteristics in Munson
Employment by Class of Employer in Munson
Among the 171 employed individuals in Munson, private company employees (116 | 67.8%), state government employees (46 | 26.9%), and federal government employees (9 | 5.3%) make up the most common classes of employment.
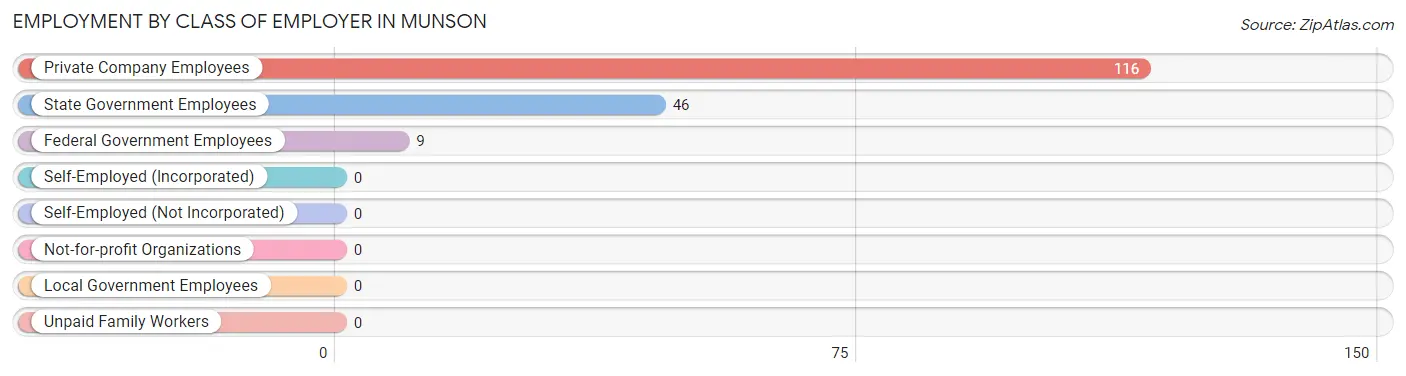
| Employer Class | # Employees | % Employees |
| Private Company Employees | 116 | 67.8% |
| Self-Employed (Incorporated) | 0 | 0.0% |
| Self-Employed (Not Incorporated) | 0 | 0.0% |
| Not-for-profit Organizations | 0 | 0.0% |
| Local Government Employees | 0 | 0.0% |
| State Government Employees | 46 | 26.9% |
| Federal Government Employees | 9 | 5.3% |
| Unpaid Family Workers | 0 | 0.0% |
| Total | 171 | 100.0% |
Employment Status by Age in Munson
According to the labor force statistics for Munson, out of the total population over 16 years of age (250), 87.2% or 218 individuals are in the labor force, with 16.1% or 35 of them unemployed. The age group with the highest labor force participation rate is 16 to 19 years, with 100.0% or 33 individuals in the labor force. Within the labor force, the 35 to 44 years age range has the highest percentage of unemployed individuals, with 31.0% or 35 of them being unemployed.
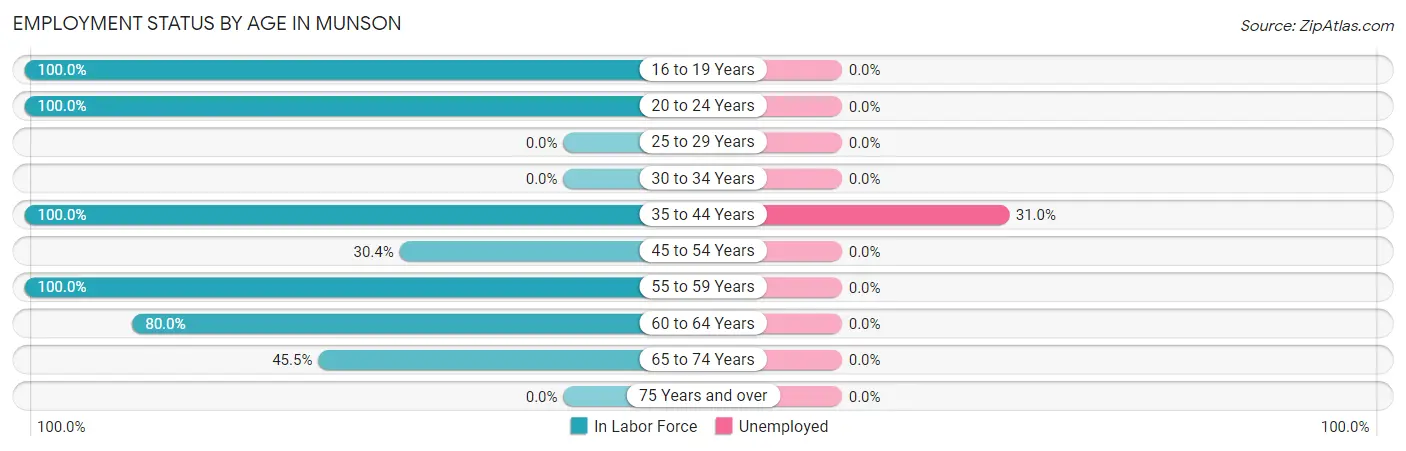
| Age Bracket | In Labor Force | Unemployed |
| 16 to 19 Years | 33 (100.0%) | 0 (0.0%) |
| 20 to 24 Years | 42 (100.0%) | 0 (0.0%) |
| 25 to 29 Years | 0 (0.0%) | 0 (0.0%) |
| 30 to 34 Years | 0 (0.0%) | 0 (0.0%) |
| 35 to 44 Years | 113 (100.0%) | 35 (31.0%) |
| 45 to 54 Years | 7 (30.4%) | 0 (0.0%) |
| 55 to 59 Years | 6 (100.0%) | 0 (0.0%) |
| 60 to 64 Years | 12 (80.0%) | 0 (0.0%) |
| 65 to 74 Years | 5 (45.5%) | 0 (0.0%) |
| 75 Years and over | 0 (0.0%) | 0 (0.0%) |
| Total | 218 (87.2%) | 35 (16.1%) |
Employment Status by Educational Attainment in Munson
According to labor force statistics for Munson, 87.9% of individuals (138) out of the total population between 25 and 64 years of age (157) are in the labor force, with 25.4% or 35 of them being unemployed. The group with the highest labor force participation rate are those with the educational attainment of college / associate degree, with 100.0% or 77 individuals in the labor force. Within the labor force, individuals with less than high school education have the highest percentage of unemployment, with 100.0% or 35 of them being unemployed.
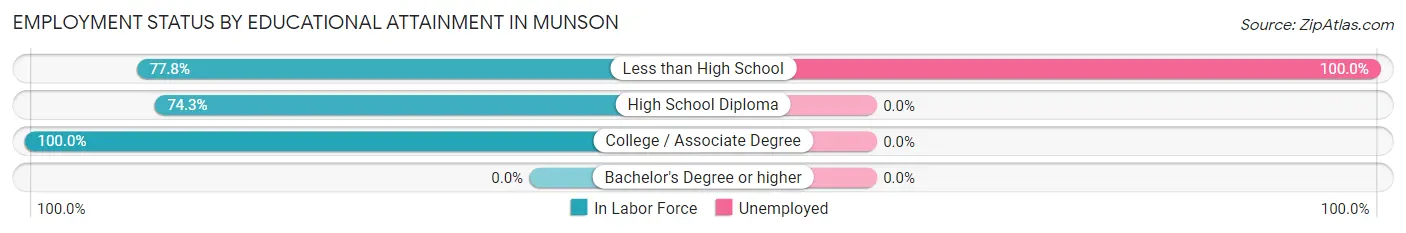
| Educational Attainment | In Labor Force | Unemployed |
| Less than High School | 35 (77.8%) | 45 (100.0%) |
| High School Diploma | 26 (74.3%) | 0 (0.0%) |
| College / Associate Degree | 77 (100.0%) | 0 (0.0%) |
| Bachelor's Degree or higher | 0 (0.0%) | 0 (0.0%) |
| Total | 138 (87.9%) | 40 (25.4%) |
Employment Occupations by Sex in Munson
Management, Business, Science and Arts Occupations
The most common Management, Business, Science and Arts occupations in Munson are , and Management (9 | 4.9%).
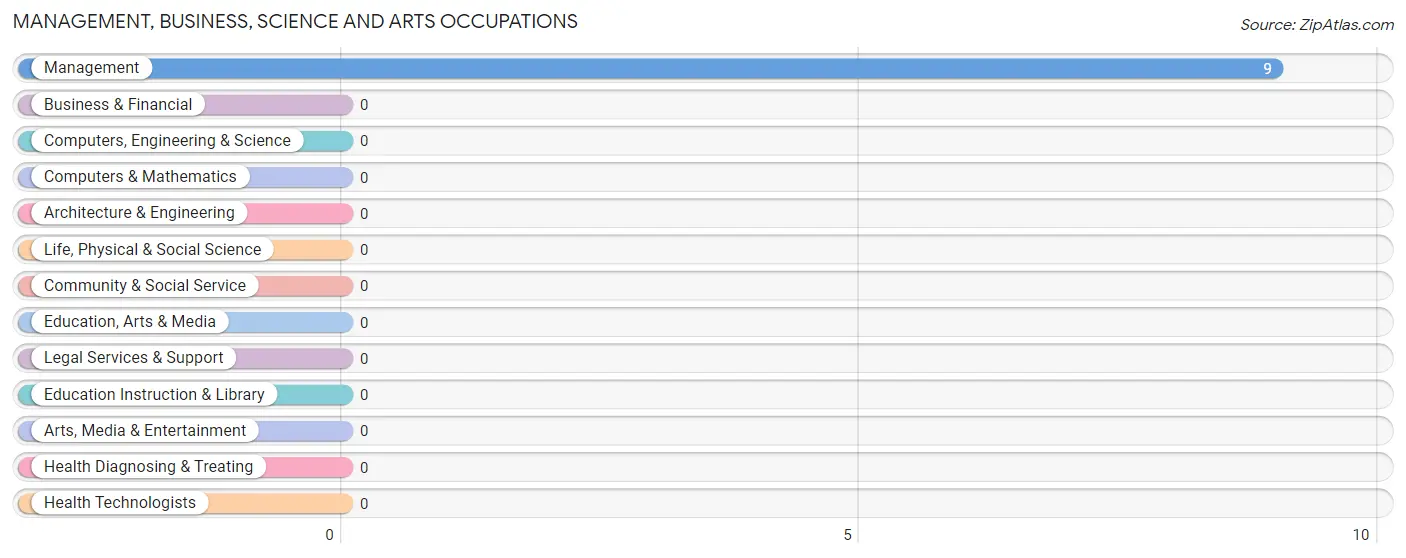
Management, Business, Science and Arts Occupations by Sex
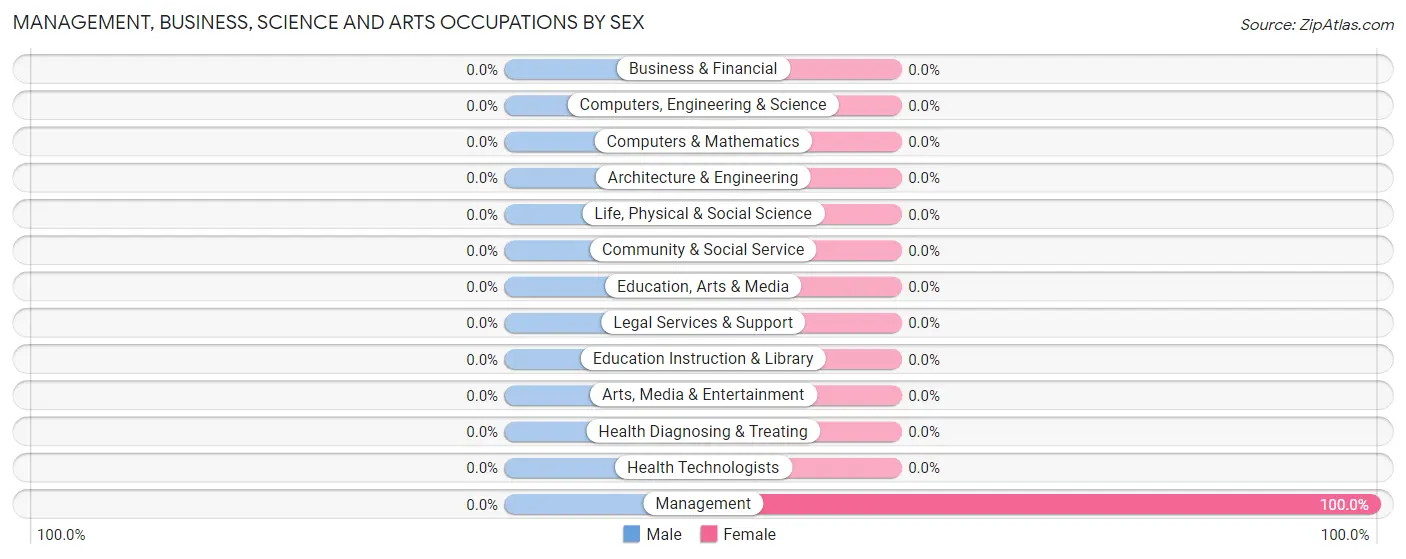
| Occupation | Male | Female |
| Management | 0 (0.0%) | 9 (100.0%) |
| Business & Financial | 0 (0.0%) | 0 (0.0%) |
| Computers, Engineering & Science | 0 (0.0%) | 0 (0.0%) |
| Computers & Mathematics | 0 (0.0%) | 0 (0.0%) |
| Architecture & Engineering | 0 (0.0%) | 0 (0.0%) |
| Life, Physical & Social Science | 0 (0.0%) | 0 (0.0%) |
| Community & Social Service | 0 (0.0%) | 0 (0.0%) |
| Education, Arts & Media | 0 (0.0%) | 0 (0.0%) |
| Legal Services & Support | 0 (0.0%) | 0 (0.0%) |
| Education Instruction & Library | 0 (0.0%) | 0 (0.0%) |
| Arts, Media & Entertainment | 0 (0.0%) | 0 (0.0%) |
| Health Diagnosing & Treating | 0 (0.0%) | 0 (0.0%) |
| Health Technologists | 0 (0.0%) | 0 (0.0%) |
| Total (Category) | 0 (0.0%) | 9 (100.0%) |
| Total (Overall) | 72 (39.3%) | 111 (60.7%) |
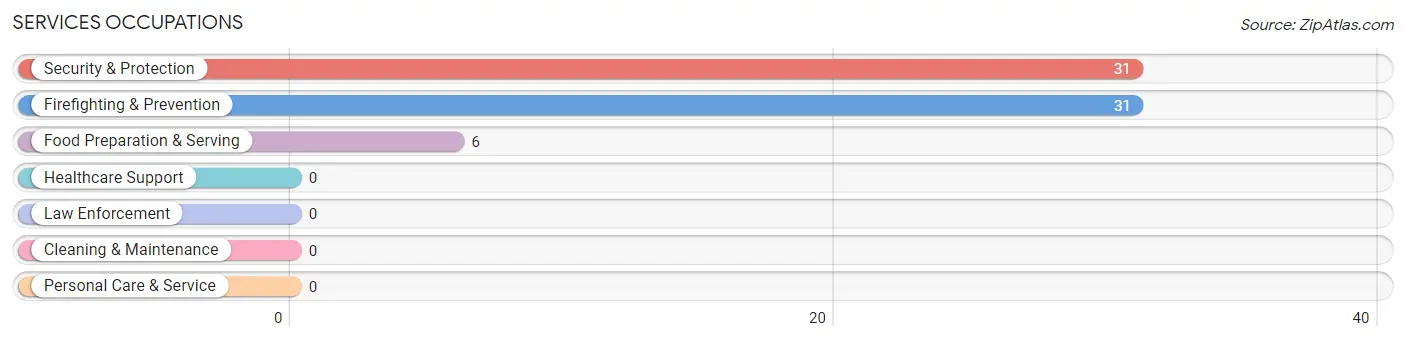
Services Occupations
The most common Services occupations in Munson are Security & Protection (31 | 16.9%), Firefighting & Prevention (31 | 16.9%), and Food Preparation & Serving (6 | 3.3%).
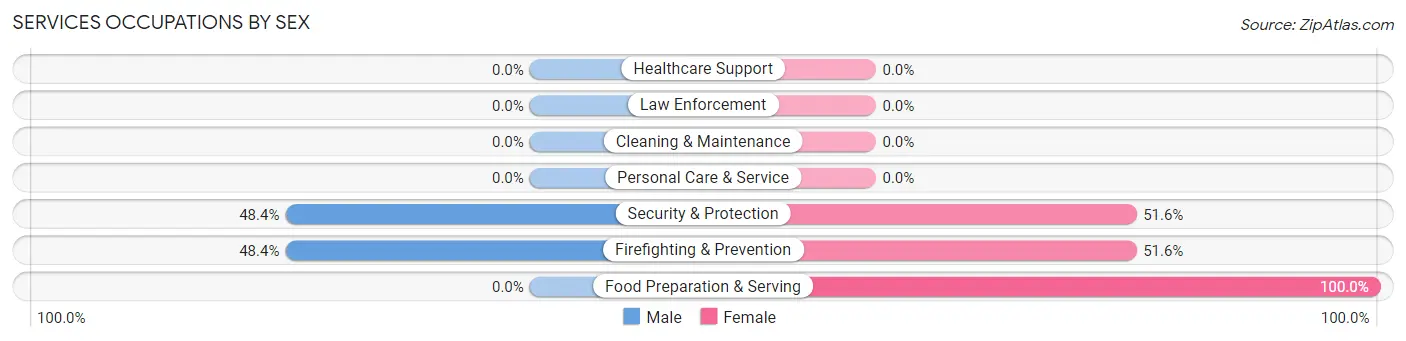
Services Occupations by Sex
Within the Services occupations in Munson, the most male-oriented occupations are Security & Protection (48.4%), and Firefighting & Prevention (48.4%), while the most female-oriented occupations are Food Preparation & Serving (100.0%), Security & Protection (51.6%), and Firefighting & Prevention (51.6%).
| Occupation | Male | Female |
| Healthcare Support | 0 (0.0%) | 0 (0.0%) |
| Security & Protection | 15 (48.4%) | 16 (51.6%) |
| Firefighting & Prevention | 15 (48.4%) | 16 (51.6%) |
| Law Enforcement | 0 (0.0%) | 0 (0.0%) |
| Food Preparation & Serving | 0 (0.0%) | 6 (100.0%) |
| Cleaning & Maintenance | 0 (0.0%) | 0 (0.0%) |
| Personal Care & Service | 0 (0.0%) | 0 (0.0%) |
| Total (Category) | 15 (40.5%) | 22 (59.5%) |
| Total (Overall) | 72 (39.3%) | 111 (60.7%) |
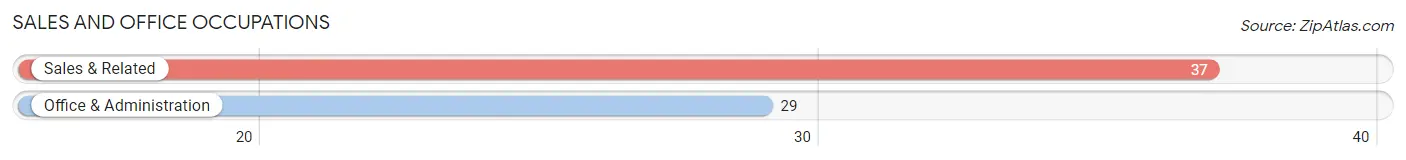
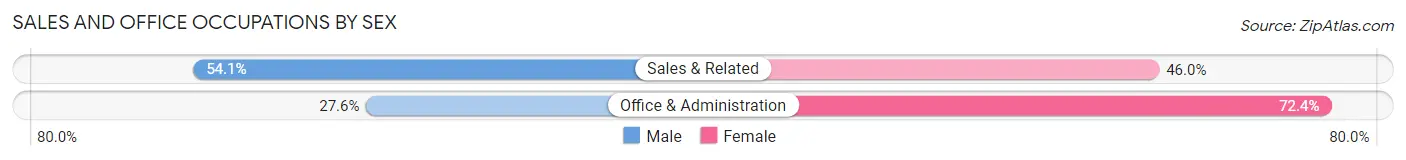
Sales and Office Occupations
The most common Sales and Office occupations in Munson are Sales & Related (37 | 20.2%), and Office & Administration (29 | 15.9%).
Sales and Office Occupations by Sex
| Occupation | Male | Female |
| Sales & Related | 20 (54.0%) | 17 (46.0%) |
| Office & Administration | 8 (27.6%) | 21 (72.4%) |
| Total (Category) | 28 (42.4%) | 38 (57.6%) |
| Total (Overall) | 72 (39.3%) | 111 (60.7%) |
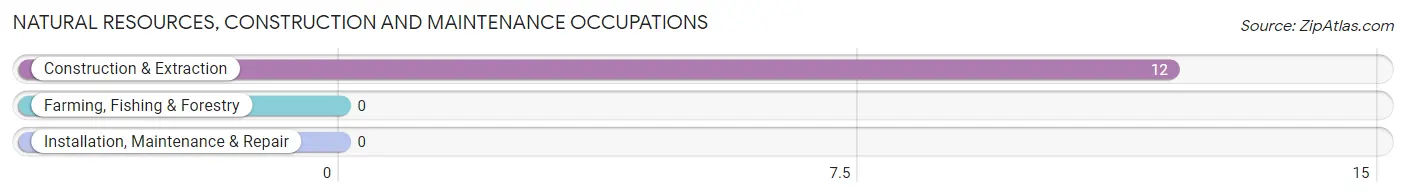
Natural Resources, Construction and Maintenance Occupations
The most common Natural Resources, Construction and Maintenance occupations in Munson are , and Construction & Extraction (12 | 6.6%).
Natural Resources, Construction and Maintenance Occupations by Sex
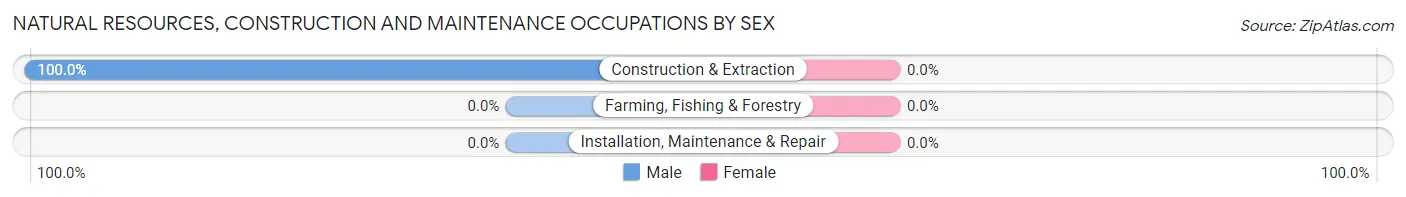
| Occupation | Male | Female |
| Farming, Fishing & Forestry | 0 (0.0%) | 0 (0.0%) |
| Construction & Extraction | 12 (100.0%) | 0 (0.0%) |
| Installation, Maintenance & Repair | 0 (0.0%) | 0 (0.0%) |
| Total (Category) | 12 (100.0%) | 0 (0.0%) |
| Total (Overall) | 72 (39.3%) | 111 (60.7%) |
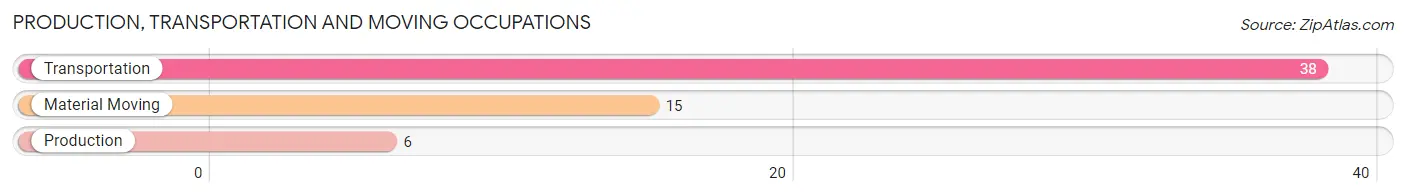
Production, Transportation and Moving Occupations
The most common Production, Transportation and Moving occupations in Munson are Transportation (38 | 20.8%), Material Moving (15 | 8.2%), and Production (6 | 3.3%).
Production, Transportation and Moving Occupations by Sex
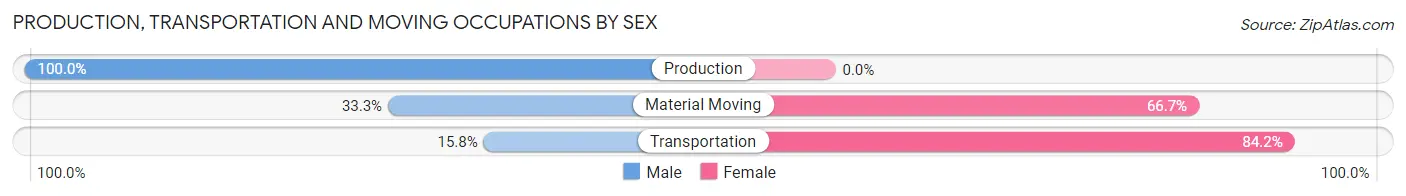
| Occupation | Male | Female |
| Production | 6 (100.0%) | 0 (0.0%) |
| Transportation | 6 (15.8%) | 32 (84.2%) |
| Material Moving | 5 (33.3%) | 10 (66.7%) |
| Total (Category) | 17 (28.8%) | 42 (71.2%) |
| Total (Overall) | 72 (39.3%) | 111 (60.7%) |
Employment Industries by Sex in Munson
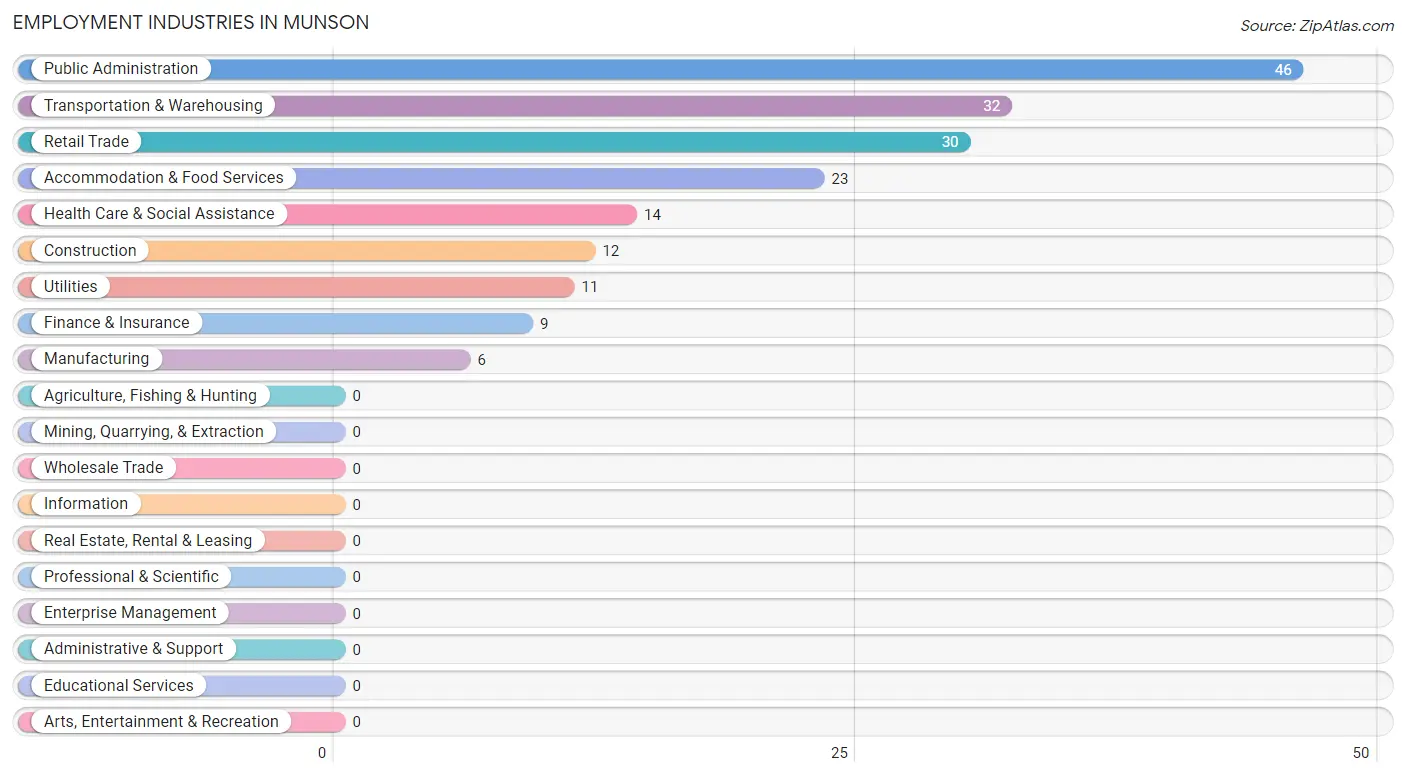
Employment Industries in Munson
The major employment industries in Munson include Public Administration (46 | 25.1%), Transportation & Warehousing (32 | 17.5%), Retail Trade (30 | 16.4%), Accommodation & Food Services (23 | 12.6%), and Health Care & Social Assistance (14 | 7.6%).
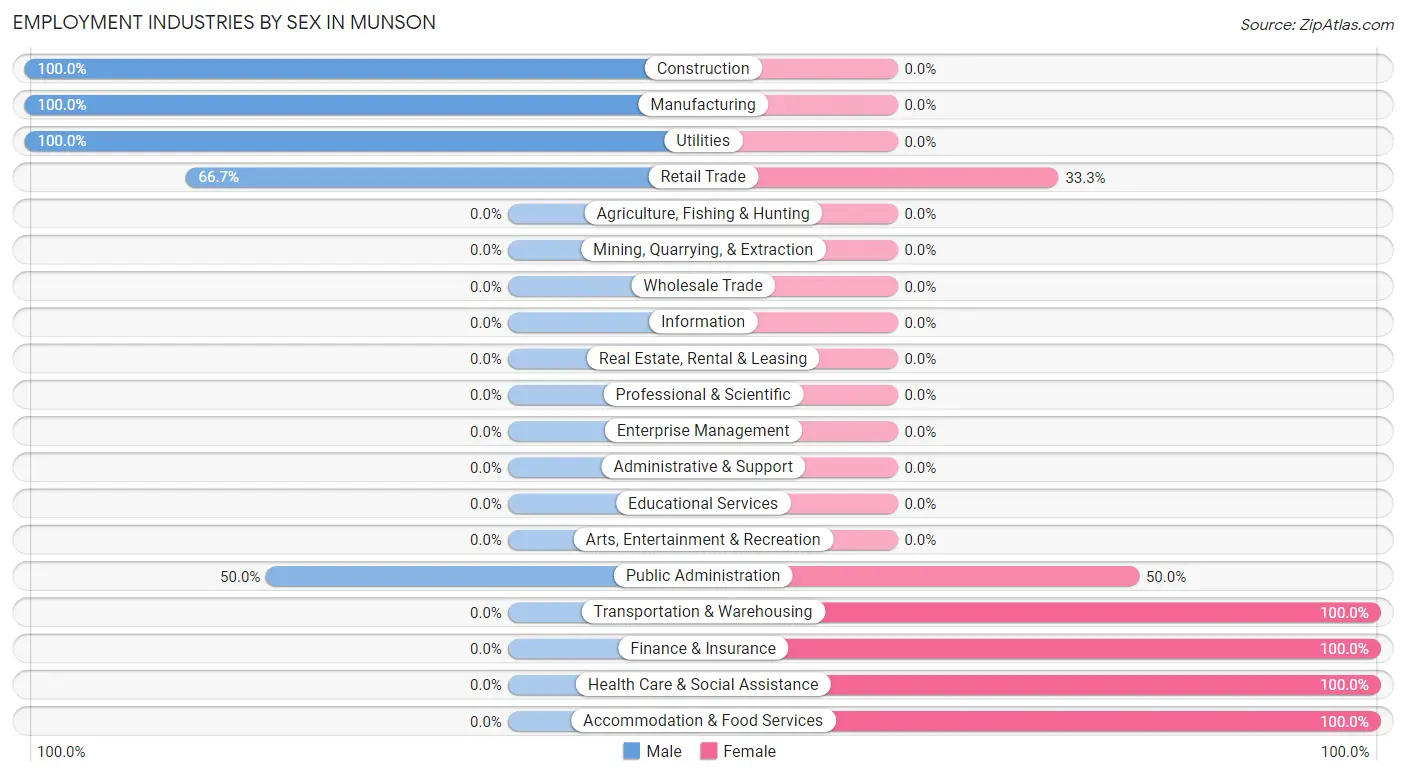
Employment Industries by Sex in Munson
The Munson industries that see more men than women are Construction (100.0%), Manufacturing (100.0%), and Utilities (100.0%), whereas the industries that tend to have a higher number of women are Transportation & Warehousing (100.0%), Finance & Insurance (100.0%), and Health Care & Social Assistance (100.0%).
| Industry | Male | Female |
| Agriculture, Fishing & Hunting | 0 (0.0%) | 0 (0.0%) |
| Mining, Quarrying, & Extraction | 0 (0.0%) | 0 (0.0%) |
| Construction | 12 (100.0%) | 0 (0.0%) |
| Manufacturing | 6 (100.0%) | 0 (0.0%) |
| Wholesale Trade | 0 (0.0%) | 0 (0.0%) |
| Retail Trade | 20 (66.7%) | 10 (33.3%) |
| Transportation & Warehousing | 0 (0.0%) | 32 (100.0%) |
| Utilities | 11 (100.0%) | 0 (0.0%) |
| Information | 0 (0.0%) | 0 (0.0%) |
| Finance & Insurance | 0 (0.0%) | 9 (100.0%) |
| Real Estate, Rental & Leasing | 0 (0.0%) | 0 (0.0%) |
| Professional & Scientific | 0 (0.0%) | 0 (0.0%) |
| Enterprise Management | 0 (0.0%) | 0 (0.0%) |
| Administrative & Support | 0 (0.0%) | 0 (0.0%) |
| Educational Services | 0 (0.0%) | 0 (0.0%) |
| Health Care & Social Assistance | 0 (0.0%) | 14 (100.0%) |
| Arts, Entertainment & Recreation | 0 (0.0%) | 0 (0.0%) |
| Accommodation & Food Services | 0 (0.0%) | 23 (100.0%) |
| Public Administration | 23 (50.0%) | 23 (50.0%) |
| Total | 72 (39.3%) | 111 (60.7%) |
Education in Munson
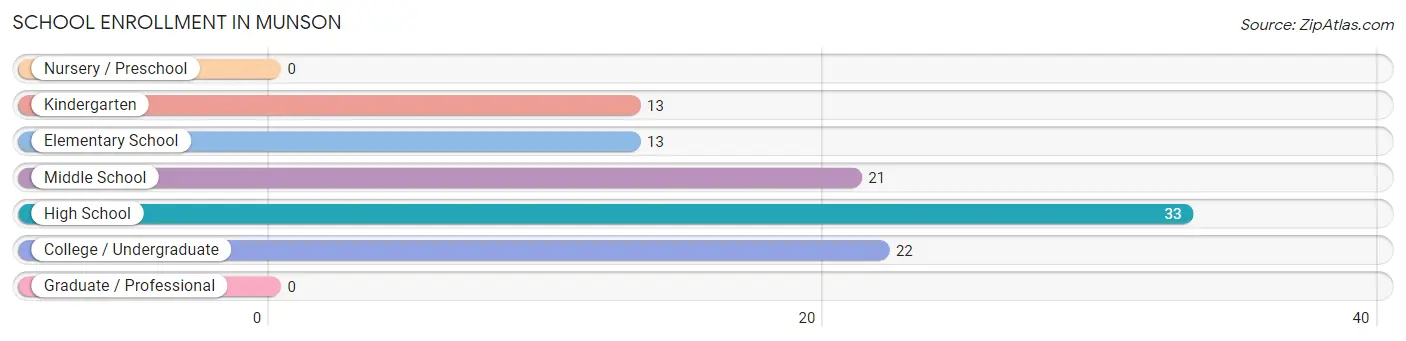
School Enrollment in Munson
The most common levels of schooling among the 102 students in Munson are high school (33 | 32.4%), college / undergraduate (22 | 21.6%), and middle school (21 | 20.6%).
| School Level | # Students | % Students |
| Nursery / Preschool | 0 | 0.0% |
| Kindergarten | 13 | 12.8% |
| Elementary School | 13 | 12.8% |
| Middle School | 21 | 20.6% |
| High School | 33 | 32.4% |
| College / Undergraduate | 22 | 21.6% |
| Graduate / Professional | 0 | 0.0% |
| Total | 102 | 100.0% |
School Enrollment by Age by Funding Source in Munson
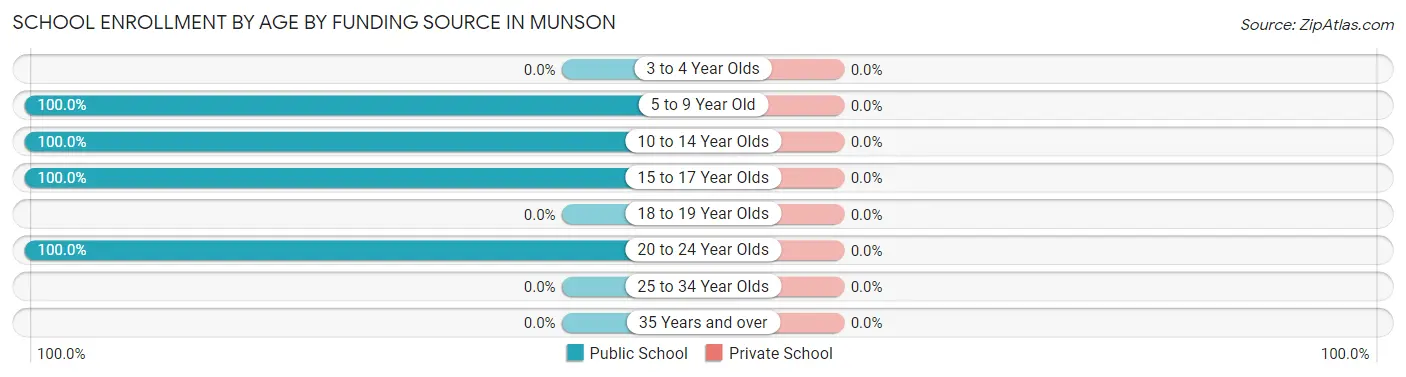
| Age Bracket | Public School | Private School |
| 3 to 4 Year Olds | 0 (0.0%) | 0 (0.0%) |
| 5 to 9 Year Old | 26 (100.0%) | 0 (0.0%) |
| 10 to 14 Year Olds | 21 (100.0%) | 0 (0.0%) |
| 15 to 17 Year Olds | 33 (100.0%) | 0 (0.0%) |
| 18 to 19 Year Olds | 0 (0.0%) | 0 (0.0%) |
| 20 to 24 Year Olds | 22 (100.0%) | 0 (0.0%) |
| 25 to 34 Year Olds | 0 (0.0%) | 0 (0.0%) |
| 35 Years and over | 0 (0.0%) | 0 (0.0%) |
| Total | 102 (100.0%) | 0 (0.0%) |
Educational Attainment by Field of Study in Munson
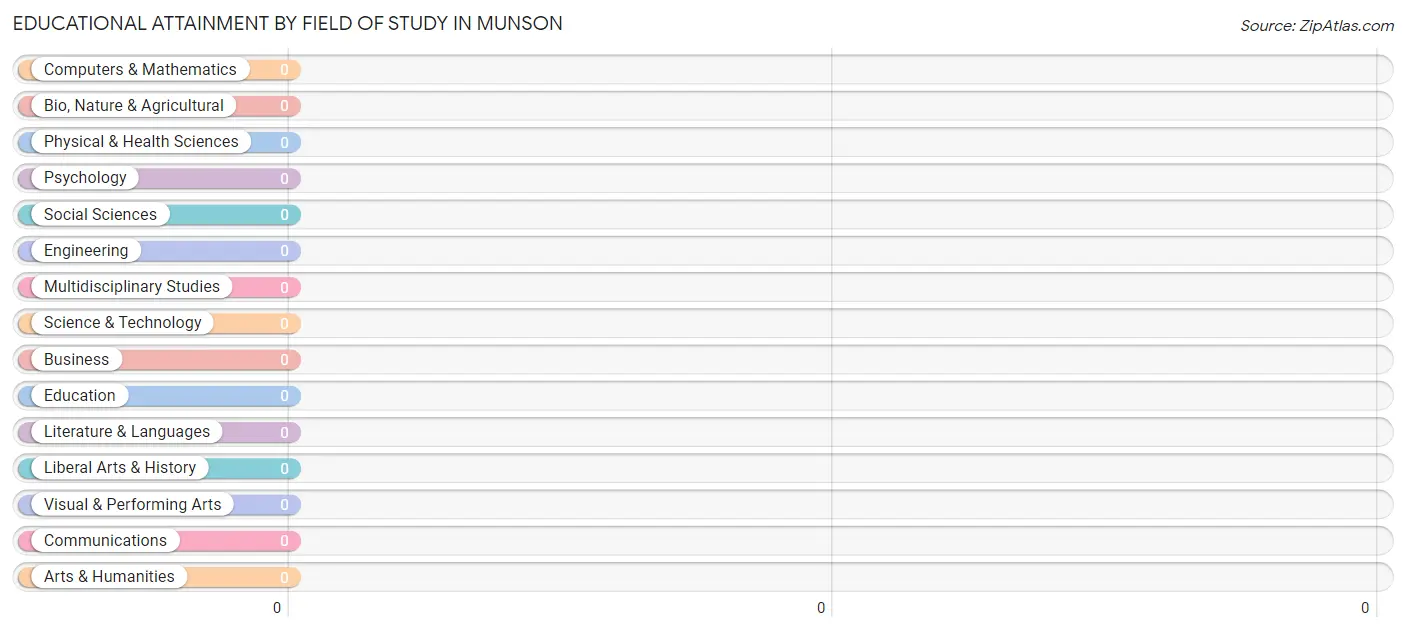
| Field of Study | # Graduates | % Graduates |
| Computers & Mathematics | 0 | 0.0% |
| Bio, Nature & Agricultural | 0 | 0.0% |
| Physical & Health Sciences | 0 | 0.0% |
| Psychology | 0 | 0.0% |
| Social Sciences | 0 | 0.0% |
| Engineering | 0 | 0.0% |
| Multidisciplinary Studies | 0 | 0.0% |
| Science & Technology | 0 | 0.0% |
| Business | 0 | 0.0% |
| Education | 0 | 0.0% |
| Literature & Languages | 0 | 0.0% |
| Liberal Arts & History | 0 | 0.0% |
| Visual & Performing Arts | 0 | 0.0% |
| Communications | 0 | 0.0% |
| Arts & Humanities | 0 | 0.0% |
| Total | 0 | 0.0% |
Transportation & Commute in Munson
Vehicle Availability by Sex in Munson
The most prevalent vehicle ownership categories in Munson are males with 2 vehicles (27, accounting for 45.0%) and females with 2 vehicles (64, making up 24.3%).
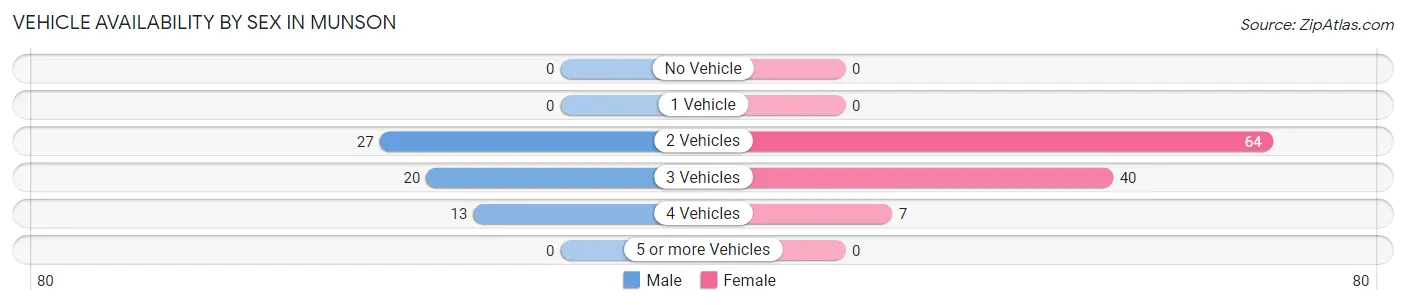
| Vehicles Available | Male | Female |
| No Vehicle | 0 (0.0%) | 0 (0.0%) |
| 1 Vehicle | 0 (0.0%) | 0 (0.0%) |
| 2 Vehicles | 27 (45.0%) | 64 (57.7%) |
| 3 Vehicles | 20 (33.3%) | 40 (36.0%) |
| 4 Vehicles | 13 (21.7%) | 7 (6.3%) |
| 5 or more Vehicles | 0 (0.0%) | 0 (0.0%) |
| Total | 60 (100.0%) | 111 (100.0%) |
Commute Time in Munson
The most frequently occuring commute durations in Munson are 35 to 39 minutes (32 commuters, 18.7%), 45 to 59 minutes (32 commuters, 18.7%), and 60 to 89 minutes (26 commuters, 15.2%).
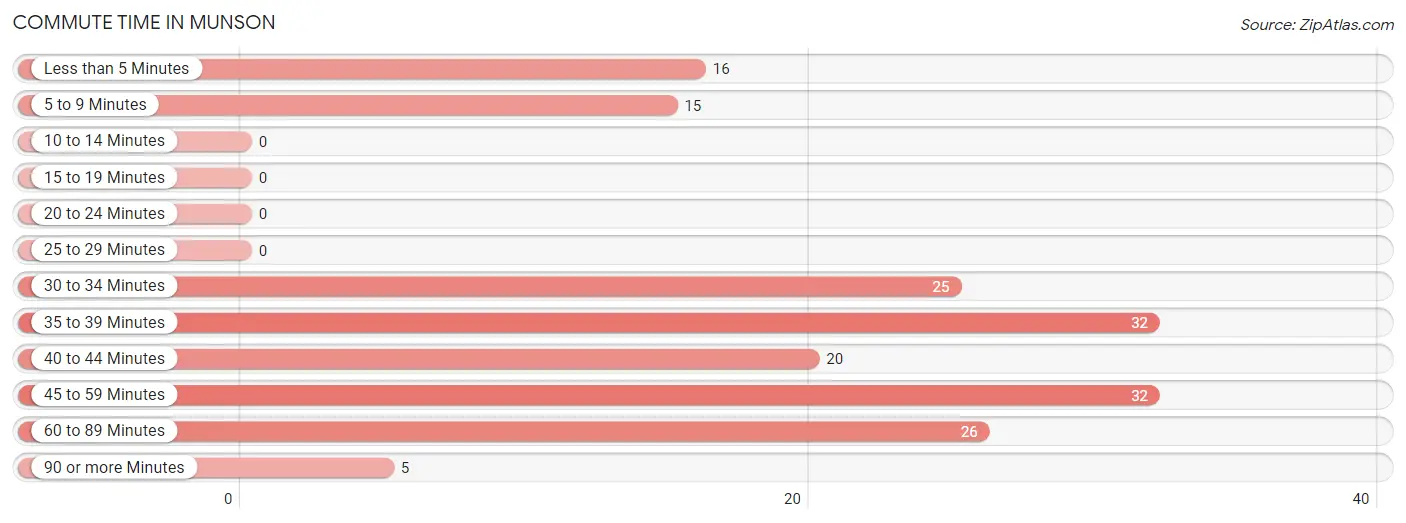
| Commute Time | # Commuters | % Commuters |
| Less than 5 Minutes | 16 | 9.4% |
| 5 to 9 Minutes | 15 | 8.8% |
| 10 to 14 Minutes | 0 | 0.0% |
| 15 to 19 Minutes | 0 | 0.0% |
| 20 to 24 Minutes | 0 | 0.0% |
| 25 to 29 Minutes | 0 | 0.0% |
| 30 to 34 Minutes | 25 | 14.6% |
| 35 to 39 Minutes | 32 | 18.7% |
| 40 to 44 Minutes | 20 | 11.7% |
| 45 to 59 Minutes | 32 | 18.7% |
| 60 to 89 Minutes | 26 | 15.2% |
| 90 or more Minutes | 5 | 2.9% |
Commute Time by Sex in Munson
The most common commute times in Munson are 60 to 89 minutes (26 commuters, 43.3%) for males and 45 to 59 minutes (32 commuters, 28.8%) for females.
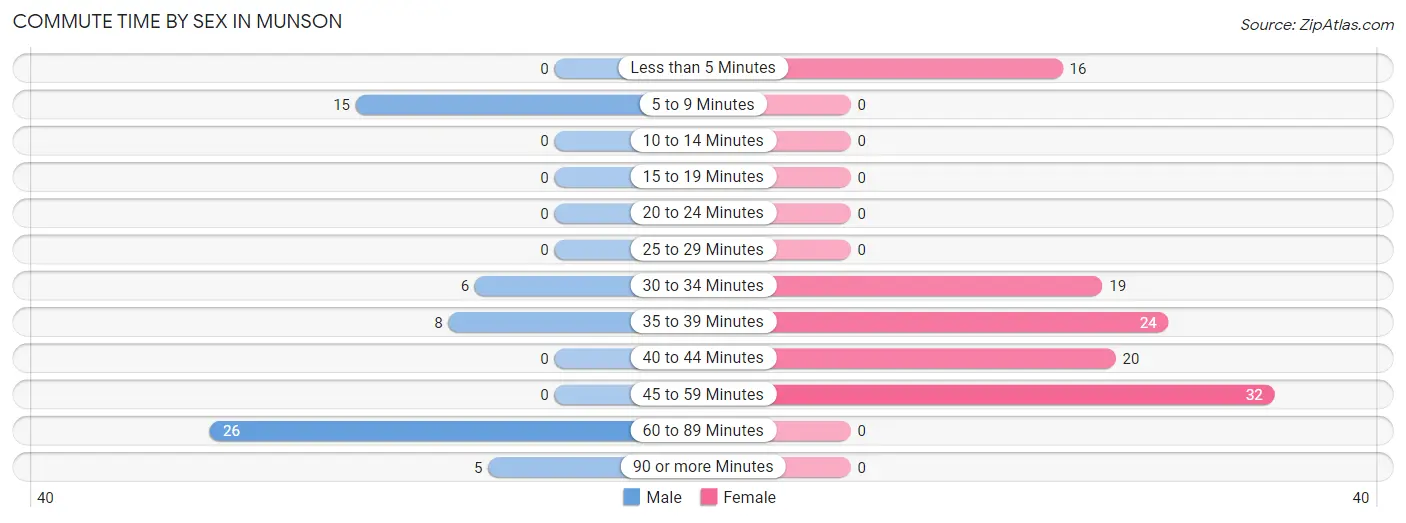
| Commute Time | Male | Female |
| Less than 5 Minutes | 0 (0.0%) | 16 (14.4%) |
| 5 to 9 Minutes | 15 (25.0%) | 0 (0.0%) |
| 10 to 14 Minutes | 0 (0.0%) | 0 (0.0%) |
| 15 to 19 Minutes | 0 (0.0%) | 0 (0.0%) |
| 20 to 24 Minutes | 0 (0.0%) | 0 (0.0%) |
| 25 to 29 Minutes | 0 (0.0%) | 0 (0.0%) |
| 30 to 34 Minutes | 6 (10.0%) | 19 (17.1%) |
| 35 to 39 Minutes | 8 (13.3%) | 24 (21.6%) |
| 40 to 44 Minutes | 0 (0.0%) | 20 (18.0%) |
| 45 to 59 Minutes | 0 (0.0%) | 32 (28.8%) |
| 60 to 89 Minutes | 26 (43.3%) | 0 (0.0%) |
| 90 or more Minutes | 5 (8.3%) | 0 (0.0%) |
Time of Departure to Work by Sex in Munson
The most frequent times of departure to work in Munson are 6:00 AM to 6:29 AM (20, 33.3%) for males and 5:00 AM to 5:29 AM (52, 46.9%) for females.
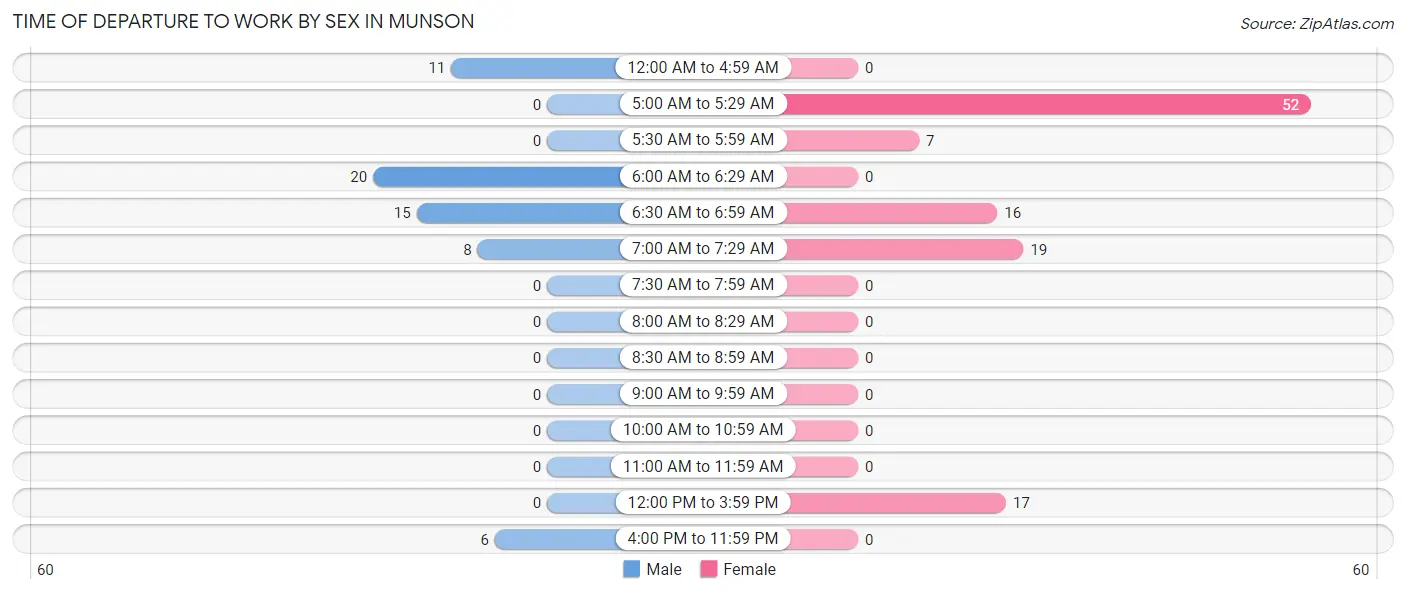
| Time of Departure | Male | Female |
| 12:00 AM to 4:59 AM | 11 (18.3%) | 0 (0.0%) |
| 5:00 AM to 5:29 AM | 0 (0.0%) | 52 (46.9%) |
| 5:30 AM to 5:59 AM | 0 (0.0%) | 7 (6.3%) |
| 6:00 AM to 6:29 AM | 20 (33.3%) | 0 (0.0%) |
| 6:30 AM to 6:59 AM | 15 (25.0%) | 16 (14.4%) |
| 7:00 AM to 7:29 AM | 8 (13.3%) | 19 (17.1%) |
| 7:30 AM to 7:59 AM | 0 (0.0%) | 0 (0.0%) |
| 8:00 AM to 8:29 AM | 0 (0.0%) | 0 (0.0%) |
| 8:30 AM to 8:59 AM | 0 (0.0%) | 0 (0.0%) |
| 9:00 AM to 9:59 AM | 0 (0.0%) | 0 (0.0%) |
| 10:00 AM to 10:59 AM | 0 (0.0%) | 0 (0.0%) |
| 11:00 AM to 11:59 AM | 0 (0.0%) | 0 (0.0%) |
| 12:00 PM to 3:59 PM | 0 (0.0%) | 17 (15.3%) |
| 4:00 PM to 11:59 PM | 6 (10.0%) | 0 (0.0%) |
| Total | 60 (100.0%) | 111 (100.0%) |
Housing Occupancy in Munson
Occupancy by Ownership in Munson
Of the total 121 dwellings in Munson, owner-occupied units account for 73 (60.3%), while renter-occupied units make up 48 (39.7%).
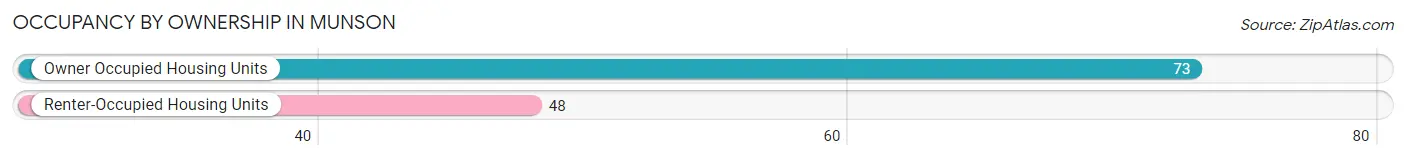
| Occupancy | # Housing Units | % Housing Units |
| Owner Occupied Housing Units | 73 | 60.3% |
| Renter-Occupied Housing Units | 48 | 39.7% |
| Total Occupied Housing Units | 121 | 100.0% |
Occupancy by Household Size in Munson
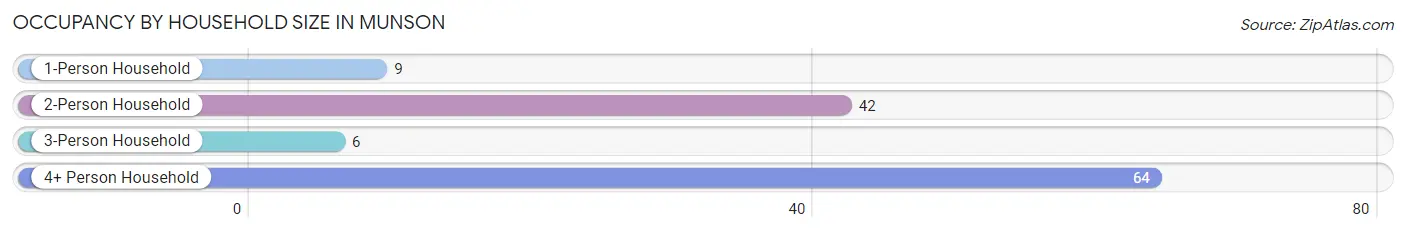
| Household Size | # Housing Units | % Housing Units |
| 1-Person Household | 9 | 7.4% |
| 2-Person Household | 42 | 34.7% |
| 3-Person Household | 6 | 5.0% |
| 4+ Person Household | 64 | 52.9% |
| Total Housing Units | 121 | 100.0% |
Occupancy by Ownership by Household Size in Munson
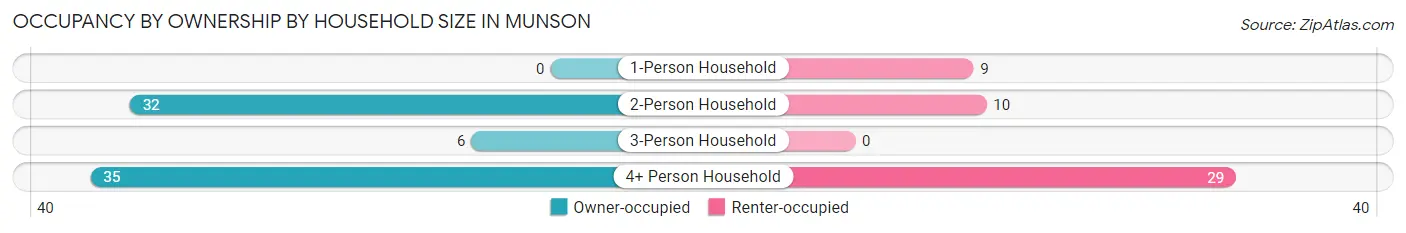
| Household Size | Owner-occupied | Renter-occupied |
| 1-Person Household | 0 (0.0%) | 9 (100.0%) |
| 2-Person Household | 32 (76.2%) | 10 (23.8%) |
| 3-Person Household | 6 (100.0%) | 0 (0.0%) |
| 4+ Person Household | 35 (54.7%) | 29 (45.3%) |
| Total Housing Units | 73 (60.3%) | 48 (39.7%) |
Occupancy by Educational Attainment in Munson
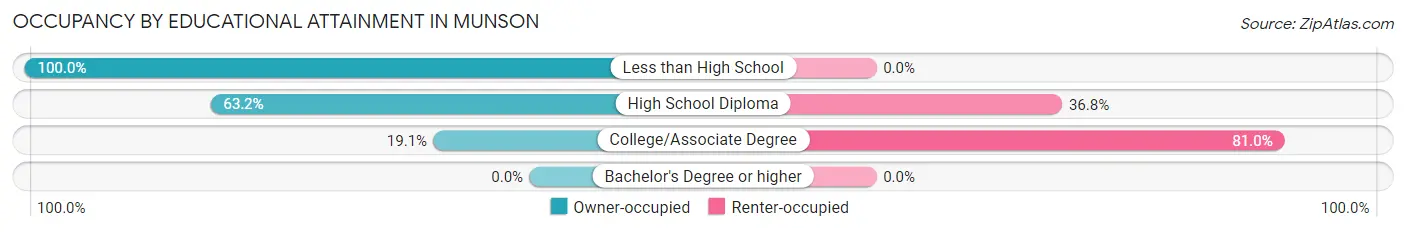
| Household Size | Owner-occupied | Renter-occupied |
| Less than High School | 41 (100.0%) | 0 (0.0%) |
| High School Diploma | 24 (63.2%) | 14 (36.8%) |
| College/Associate Degree | 8 (19.1%) | 34 (80.9%) |
| Bachelor's Degree or higher | 0 (0.0%) | 0 (0.0%) |
Occupancy by Age of Householder in Munson
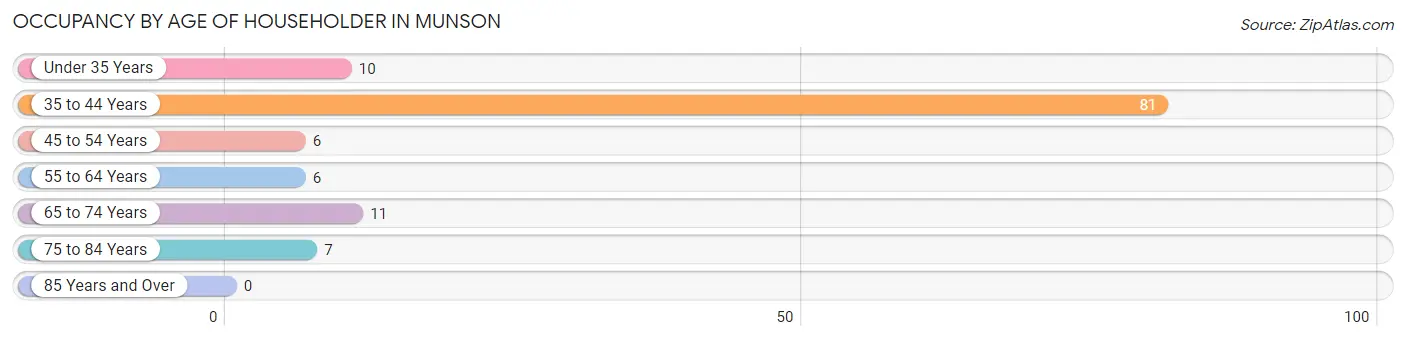
| Age Bracket | # Households | % Households |
| Under 35 Years | 10 | 8.3% |
| 35 to 44 Years | 81 | 66.9% |
| 45 to 54 Years | 6 | 5.0% |
| 55 to 64 Years | 6 | 5.0% |
| 65 to 74 Years | 11 | 9.1% |
| 75 to 84 Years | 7 | 5.8% |
| 85 Years and Over | 0 | 0.0% |
| Total | 121 | 100.0% |
Housing Finances in Munson
Median Income by Occupancy in Munson
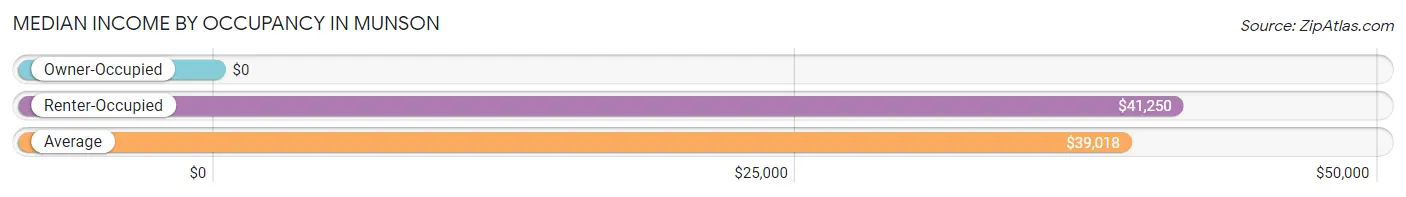
| Occupancy Type | # Households | Median Income |
| Owner-Occupied | 73 (60.3%) | $0 |
| Renter-Occupied | 48 (39.7%) | $41,250 |
| Average | 121 (100.0%) | $39,018 |
Occupancy by Householder Income Bracket in Munson
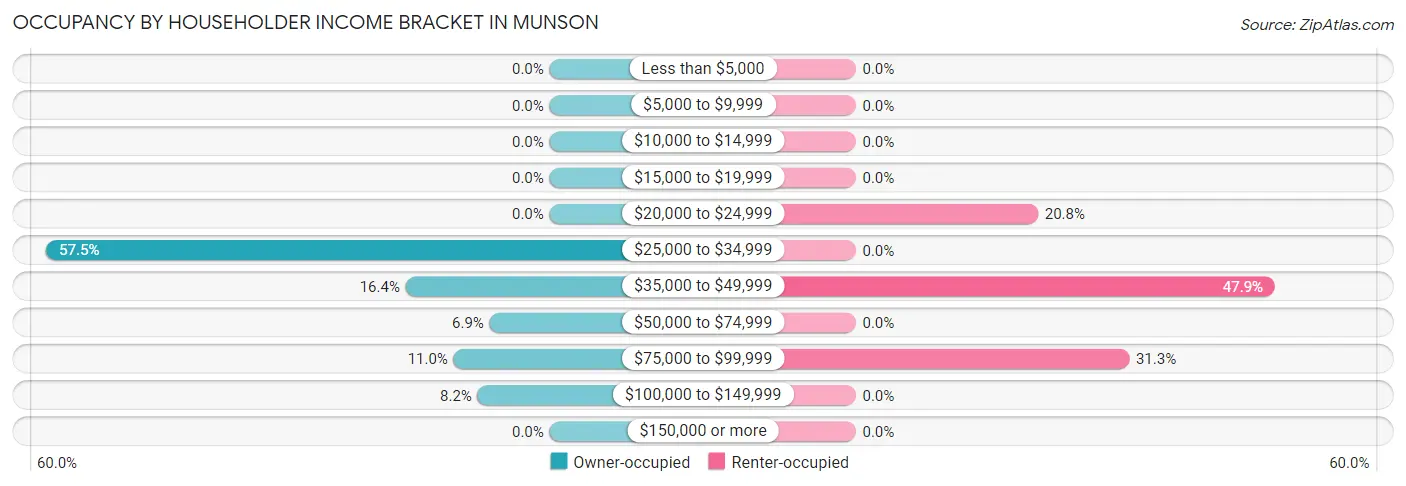
| Income Bracket | Owner-occupied | Renter-occupied |
| Less than $5,000 | 0 (0.0%) | 0 (0.0%) |
| $5,000 to $9,999 | 0 (0.0%) | 0 (0.0%) |
| $10,000 to $14,999 | 0 (0.0%) | 0 (0.0%) |
| $15,000 to $19,999 | 0 (0.0%) | 0 (0.0%) |
| $20,000 to $24,999 | 0 (0.0%) | 10 (20.8%) |
| $25,000 to $34,999 | 42 (57.5%) | 0 (0.0%) |
| $35,000 to $49,999 | 12 (16.4%) | 23 (47.9%) |
| $50,000 to $74,999 | 5 (6.9%) | 0 (0.0%) |
| $75,000 to $99,999 | 8 (11.0%) | 15 (31.2%) |
| $100,000 to $149,999 | 6 (8.2%) | 0 (0.0%) |
| $150,000 or more | 0 (0.0%) | 0 (0.0%) |
| Total | 73 (100.0%) | 48 (100.0%) |
Monthly Housing Cost Tiers in Munson
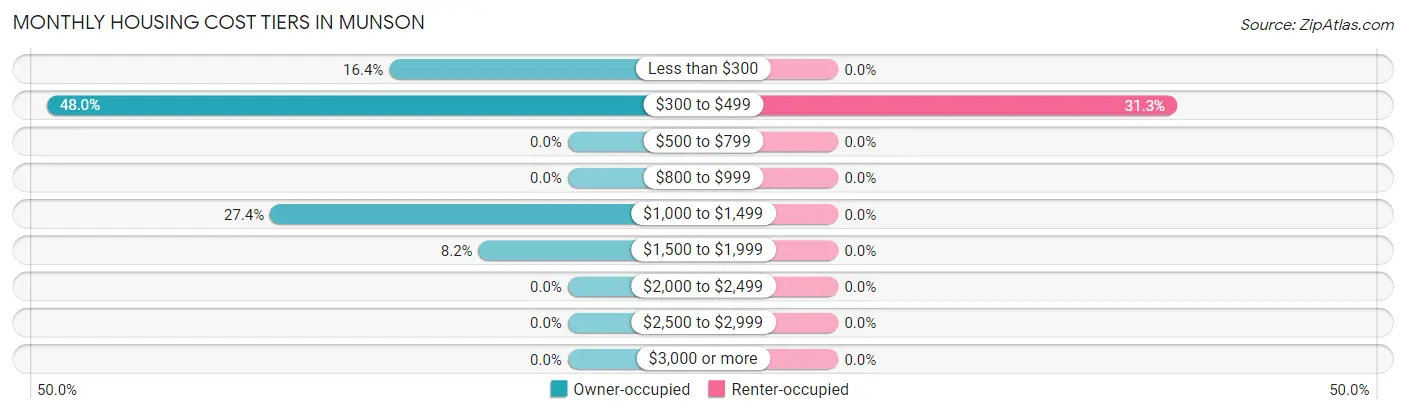
| Monthly Cost | Owner-occupied | Renter-occupied |
| Less than $300 | 12 (16.4%) | 0 (0.0%) |
| $300 to $499 | 35 (47.9%) | 15 (31.2%) |
| $500 to $799 | 0 (0.0%) | 0 (0.0%) |
| $800 to $999 | 0 (0.0%) | 0 (0.0%) |
| $1,000 to $1,499 | 20 (27.4%) | 0 (0.0%) |
| $1,500 to $1,999 | 6 (8.2%) | 0 (0.0%) |
| $2,000 to $2,499 | 0 (0.0%) | 0 (0.0%) |
| $2,500 to $2,999 | 0 (0.0%) | 0 (0.0%) |
| $3,000 or more | 0 (0.0%) | 0 (0.0%) |
| Total | 73 (100.0%) | 48 (100.0%) |
Physical Housing Characteristics in Munson
Housing Structures in Munson
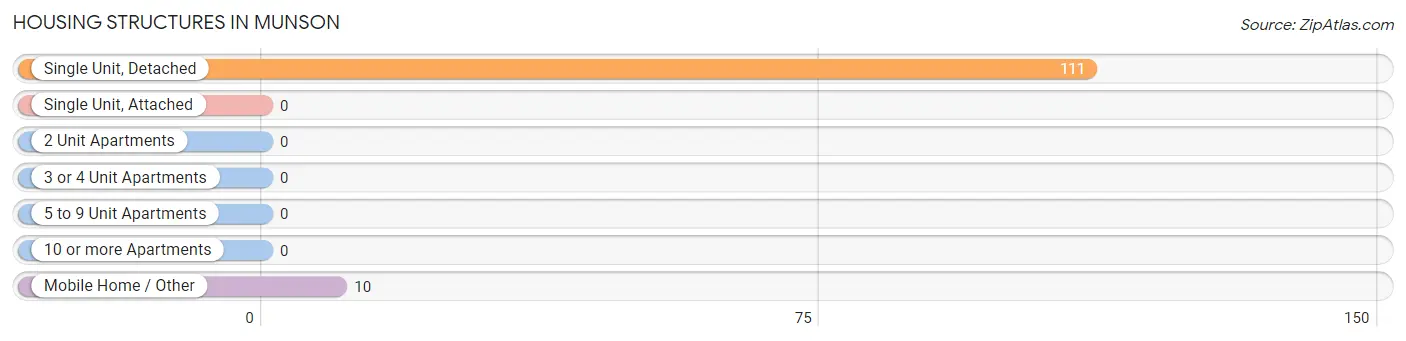
| Structure Type | # Housing Units | % Housing Units |
| Single Unit, Detached | 111 | 91.7% |
| Single Unit, Attached | 0 | 0.0% |
| 2 Unit Apartments | 0 | 0.0% |
| 3 or 4 Unit Apartments | 0 | 0.0% |
| 5 to 9 Unit Apartments | 0 | 0.0% |
| 10 or more Apartments | 0 | 0.0% |
| Mobile Home / Other | 10 | 8.3% |
| Total | 121 | 100.0% |
Housing Structures by Occupancy in Munson
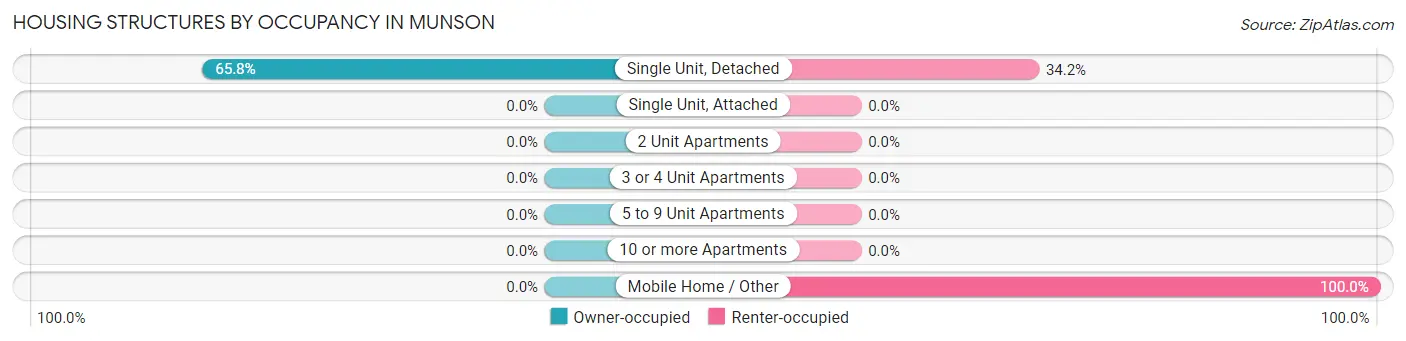
| Structure Type | Owner-occupied | Renter-occupied |
| Single Unit, Detached | 73 (65.8%) | 38 (34.2%) |
| Single Unit, Attached | 0 (0.0%) | 0 (0.0%) |
| 2 Unit Apartments | 0 (0.0%) | 0 (0.0%) |
| 3 or 4 Unit Apartments | 0 (0.0%) | 0 (0.0%) |
| 5 to 9 Unit Apartments | 0 (0.0%) | 0 (0.0%) |
| 10 or more Apartments | 0 (0.0%) | 0 (0.0%) |
| Mobile Home / Other | 0 (0.0%) | 10 (100.0%) |
| Total | 73 (60.3%) | 48 (39.7%) |
Housing Structures by Number of Rooms in Munson
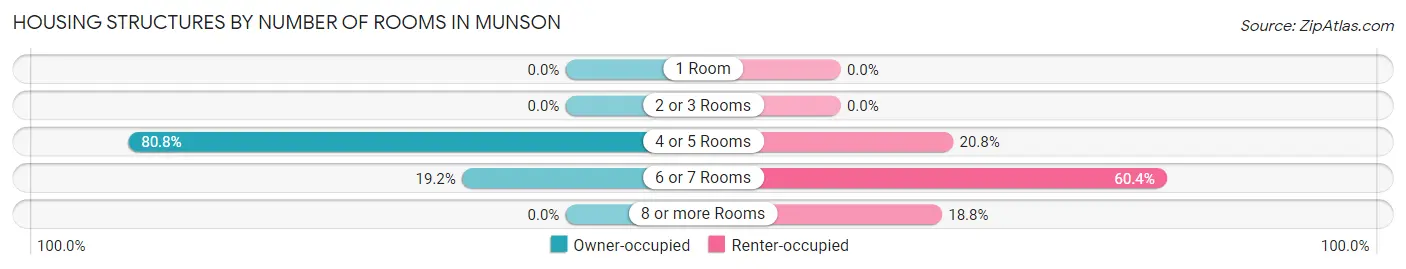
| Number of Rooms | Owner-occupied | Renter-occupied |
| 1 Room | 0 (0.0%) | 0 (0.0%) |
| 2 or 3 Rooms | 0 (0.0%) | 0 (0.0%) |
| 4 or 5 Rooms | 59 (80.8%) | 10 (20.8%) |
| 6 or 7 Rooms | 14 (19.2%) | 29 (60.4%) |
| 8 or more Rooms | 0 (0.0%) | 9 (18.8%) |
| Total | 73 (100.0%) | 48 (100.0%) |
Housing Structure by Heating Type in Munson
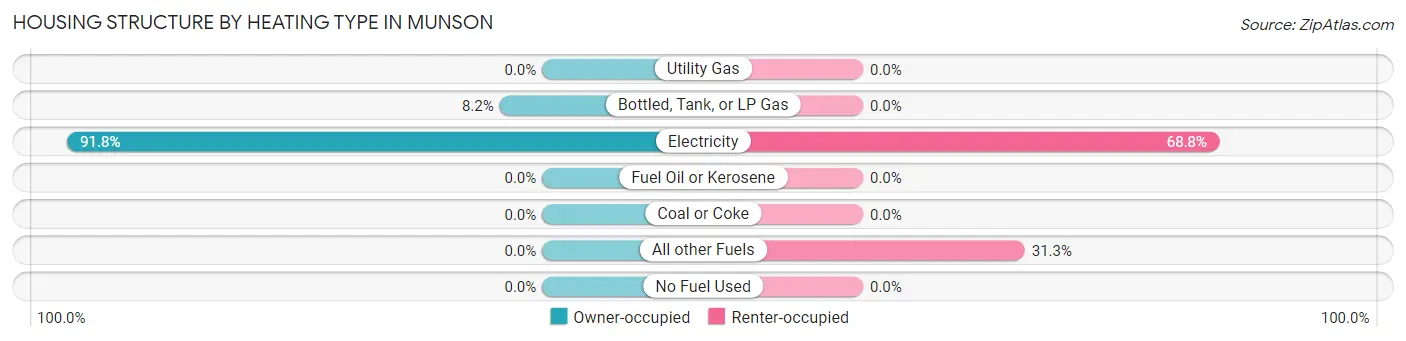
| Heating Type | Owner-occupied | Renter-occupied |
| Utility Gas | 0 (0.0%) | 0 (0.0%) |
| Bottled, Tank, or LP Gas | 6 (8.2%) | 0 (0.0%) |
| Electricity | 67 (91.8%) | 33 (68.8%) |
| Fuel Oil or Kerosene | 0 (0.0%) | 0 (0.0%) |
| Coal or Coke | 0 (0.0%) | 0 (0.0%) |
| All other Fuels | 0 (0.0%) | 15 (31.2%) |
| No Fuel Used | 0 (0.0%) | 0 (0.0%) |
| Total | 73 (100.0%) | 48 (100.0%) |
Household Vehicle Usage in Munson
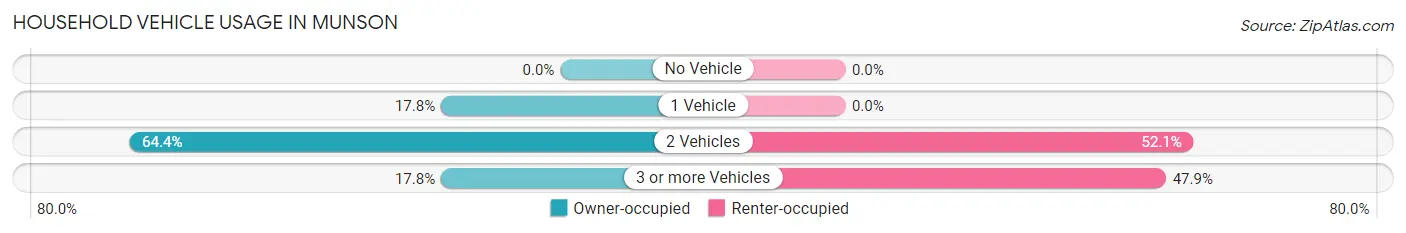
| Vehicles per Household | Owner-occupied | Renter-occupied |
| No Vehicle | 0 (0.0%) | 0 (0.0%) |
| 1 Vehicle | 13 (17.8%) | 0 (0.0%) |
| 2 Vehicles | 47 (64.4%) | 25 (52.1%) |
| 3 or more Vehicles | 13 (17.8%) | 23 (47.9%) |
| Total | 73 (100.0%) | 48 (100.0%) |
Real Estate & Mortgages in Munson
Real Estate and Mortgage Overview in Munson
| Characteristic | Without Mortgage | With Mortgage |
| Housing Units | 47 | 26 |
| Median Property Value | $216,400 | $203,600 |
| Median Household Income | $26,679 | $0 |
| Monthly Housing Costs | $366 | $0 |
| Real Estate Taxes | $512 | $0 |
Property Value by Mortgage Status in Munson
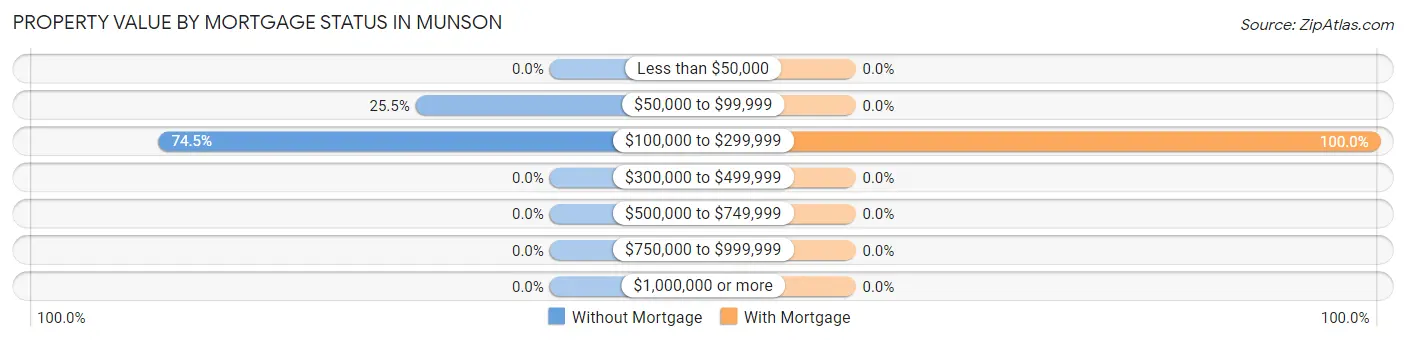
| Property Value | Without Mortgage | With Mortgage |
| Less than $50,000 | 0 (0.0%) | 0 (0.0%) |
| $50,000 to $99,999 | 12 (25.5%) | 0 (0.0%) |
| $100,000 to $299,999 | 35 (74.5%) | 26 (100.0%) |
| $300,000 to $499,999 | 0 (0.0%) | 0 (0.0%) |
| $500,000 to $749,999 | 0 (0.0%) | 0 (0.0%) |
| $750,000 to $999,999 | 0 (0.0%) | 0 (0.0%) |
| $1,000,000 or more | 0 (0.0%) | 0 (0.0%) |
| Total | 47 (100.0%) | 26 (100.0%) |
Household Income by Mortgage Status in Munson
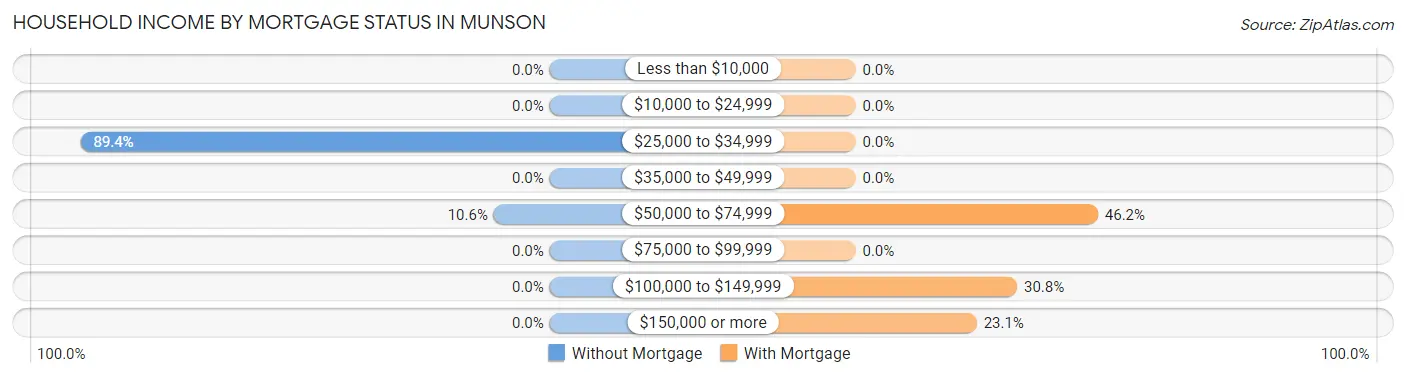
| Household Income | Without Mortgage | With Mortgage |
| Less than $10,000 | 0 (0.0%) | 0 (0.0%) |
| $10,000 to $24,999 | 0 (0.0%) | 0 (0.0%) |
| $25,000 to $34,999 | 42 (89.4%) | 0 (0.0%) |
| $35,000 to $49,999 | 0 (0.0%) | 0 (0.0%) |
| $50,000 to $74,999 | 5 (10.6%) | 12 (46.2%) |
| $75,000 to $99,999 | 0 (0.0%) | 0 (0.0%) |
| $100,000 to $149,999 | 0 (0.0%) | 8 (30.8%) |
| $150,000 or more | 0 (0.0%) | 6 (23.1%) |
| Total | 47 (100.0%) | 26 (100.0%) |
Property Value to Household Income Ratio in Munson
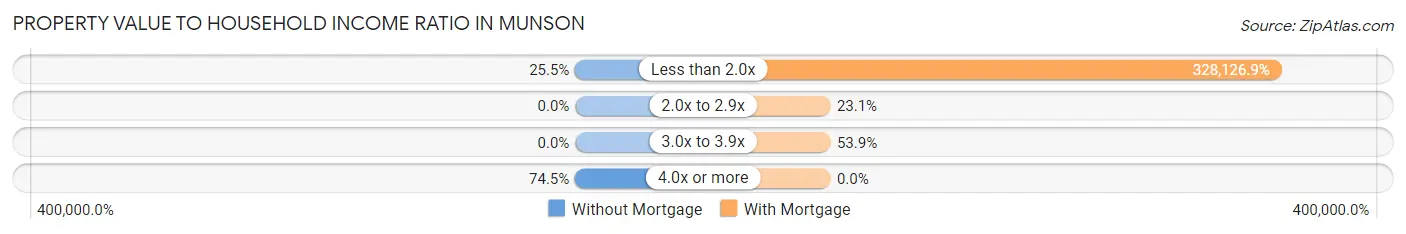
| Value-to-Income Ratio | Without Mortgage | With Mortgage |
| Less than 2.0x | 12 (25.5%) | 85,313 (328,126.9%) |
| 2.0x to 2.9x | 0 (0.0%) | 6 (23.1%) |
| 3.0x to 3.9x | 0 (0.0%) | 14 (53.8%) |
| 4.0x or more | 35 (74.5%) | 0 (0.0%) |
| Total | 47 (100.0%) | 26 (100.0%) |
Real Estate Taxes by Mortgage Status in Munson
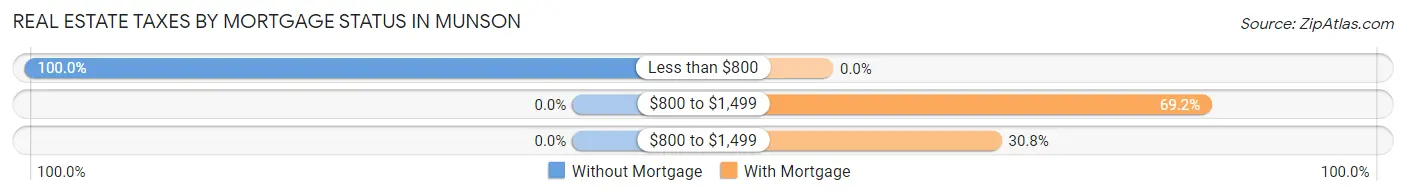
| Property Taxes | Without Mortgage | With Mortgage |
| Less than $800 | 47 (100.0%) | 0 (0.0%) |
| $800 to $1,499 | 0 (0.0%) | 18 (69.2%) |
| $800 to $1,499 | 0 (0.0%) | 8 (30.8%) |
| Total | 47 (100.0%) | 26 (100.0%) |
Health & Disability in Munson
Health Insurance Coverage by Age in Munson
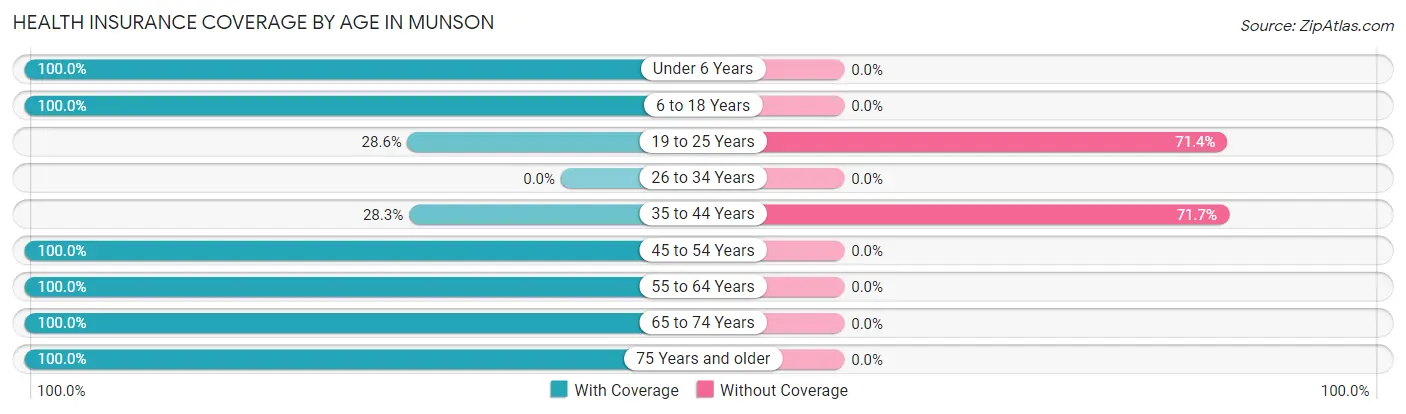
| Age Bracket | With Coverage | Without Coverage |
| Under 6 Years | 93 (100.0%) | 0 (0.0%) |
| 6 to 18 Years | 80 (100.0%) | 0 (0.0%) |
| 19 to 25 Years | 12 (28.6%) | 30 (71.4%) |
| 26 to 34 Years | 0 (0.0%) | 0 (0.0%) |
| 35 to 44 Years | 32 (28.3%) | 81 (71.7%) |
| 45 to 54 Years | 23 (100.0%) | 0 (0.0%) |
| 55 to 64 Years | 21 (100.0%) | 0 (0.0%) |
| 65 to 74 Years | 11 (100.0%) | 0 (0.0%) |
| 75 Years and older | 7 (100.0%) | 0 (0.0%) |
| Total | 279 (71.5%) | 111 (28.5%) |
Health Insurance Coverage by Citizenship Status in Munson
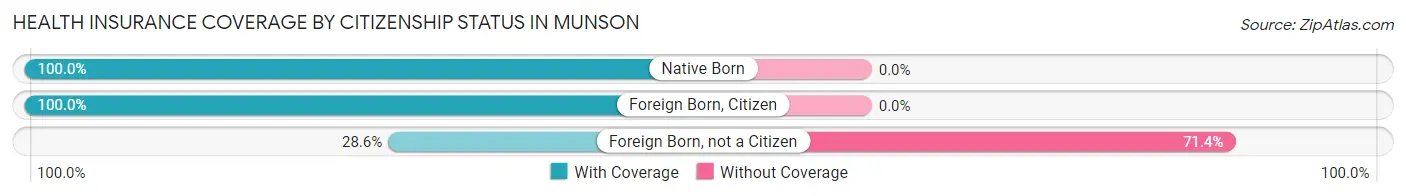
| Citizenship Status | With Coverage | Without Coverage |
| Native Born | 93 (100.0%) | 0 (0.0%) |
| Foreign Born, Citizen | 80 (100.0%) | 0 (0.0%) |
| Foreign Born, not a Citizen | 12 (28.6%) | 30 (71.4%) |
Health Insurance Coverage by Household Income in Munson
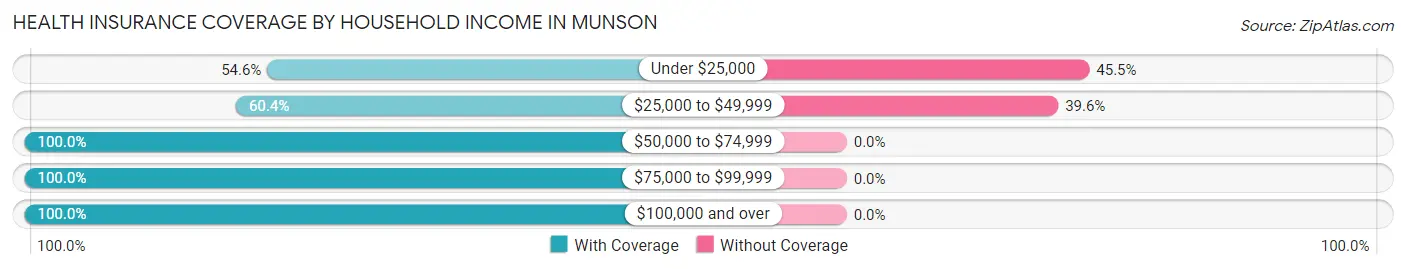
| Household Income | With Coverage | Without Coverage |
| Under $25,000 | 12 (54.5%) | 10 (45.5%) |
| $25,000 to $49,999 | 154 (60.4%) | 101 (39.6%) |
| $50,000 to $74,999 | 8 (100.0%) | 0 (0.0%) |
| $75,000 to $99,999 | 86 (100.0%) | 0 (0.0%) |
| $100,000 and over | 19 (100.0%) | 0 (0.0%) |
Public vs Private Health Insurance Coverage by Age in Munson
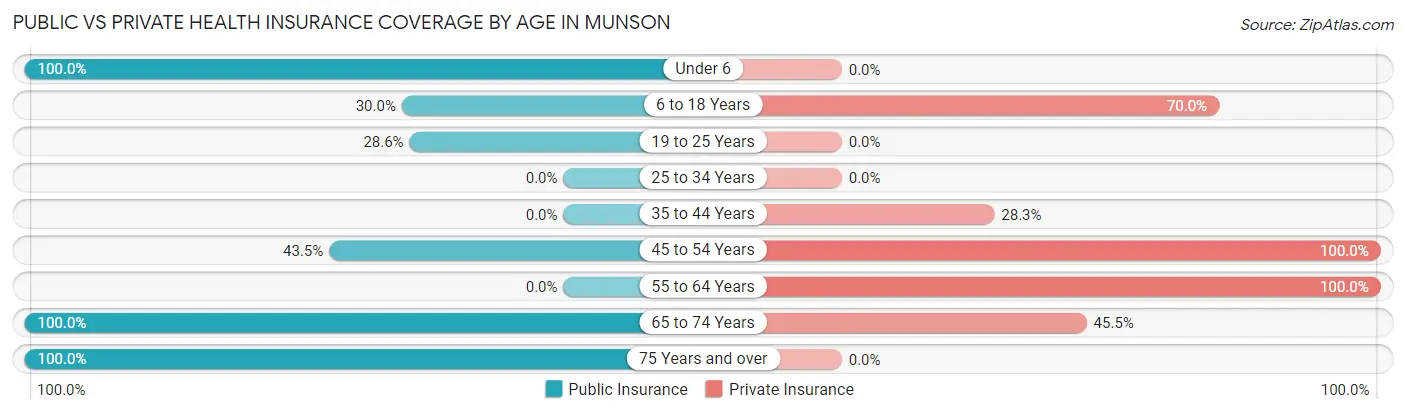
| Age Bracket | Public Insurance | Private Insurance |
| Under 6 | 93 (100.0%) | 0 (0.0%) |
| 6 to 18 Years | 24 (30.0%) | 56 (70.0%) |
| 19 to 25 Years | 12 (28.6%) | 0 (0.0%) |
| 25 to 34 Years | 0 (0.0%) | 0 (0.0%) |
| 35 to 44 Years | 0 (0.0%) | 32 (28.3%) |
| 45 to 54 Years | 10 (43.5%) | 23 (100.0%) |
| 55 to 64 Years | 0 (0.0%) | 21 (100.0%) |
| 65 to 74 Years | 11 (100.0%) | 5 (45.5%) |
| 75 Years and over | 7 (100.0%) | 0 (0.0%) |
| Total | 157 (40.3%) | 137 (35.1%) |
Disability Status by Sex by Age in Munson
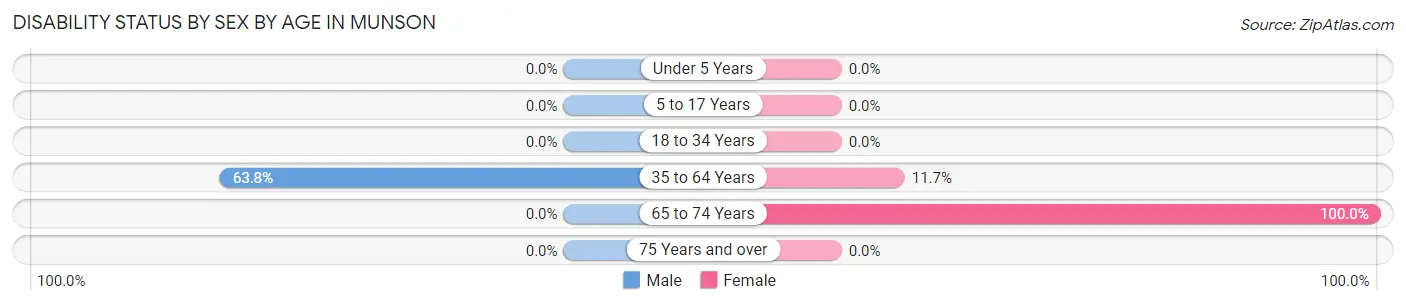
| Age Bracket | Male | Female |
| Under 5 Years | 0 (0.0%) | 0 (0.0%) |
| 5 to 17 Years | 0 (0.0%) | 0 (0.0%) |
| 18 to 34 Years | 0 (0.0%) | 0 (0.0%) |
| 35 to 64 Years | 51 (63.7%) | 9 (11.7%) |
| 65 to 74 Years | 0 (0.0%) | 6 (100.0%) |
| 75 Years and over | 0 (0.0%) | 0 (0.0%) |
Disability Class by Sex by Age in Munson
Disability Class: Hearing Difficulty
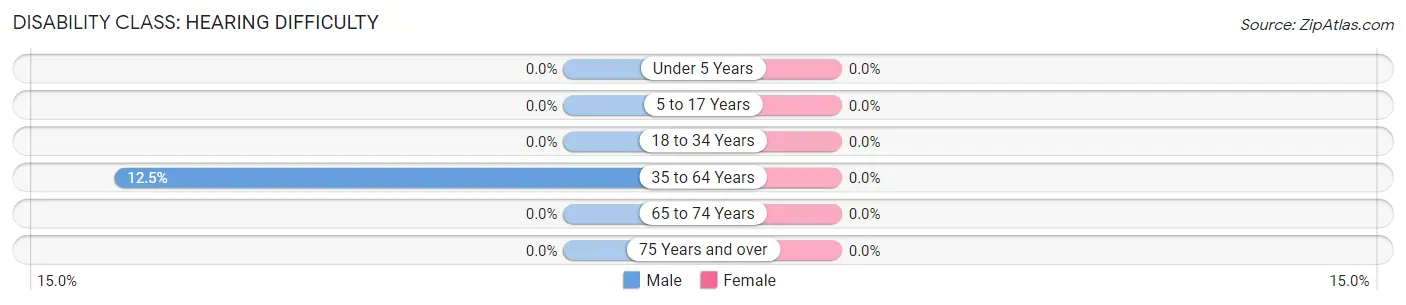
| Age Bracket | Male | Female |
| Under 5 Years | 0 (0.0%) | 0 (0.0%) |
| 5 to 17 Years | 0 (0.0%) | 0 (0.0%) |
| 18 to 34 Years | 0 (0.0%) | 0 (0.0%) |
| 35 to 64 Years | 10 (12.5%) | 0 (0.0%) |
| 65 to 74 Years | 0 (0.0%) | 0 (0.0%) |
| 75 Years and over | 0 (0.0%) | 0 (0.0%) |
Disability Class: Vision Difficulty
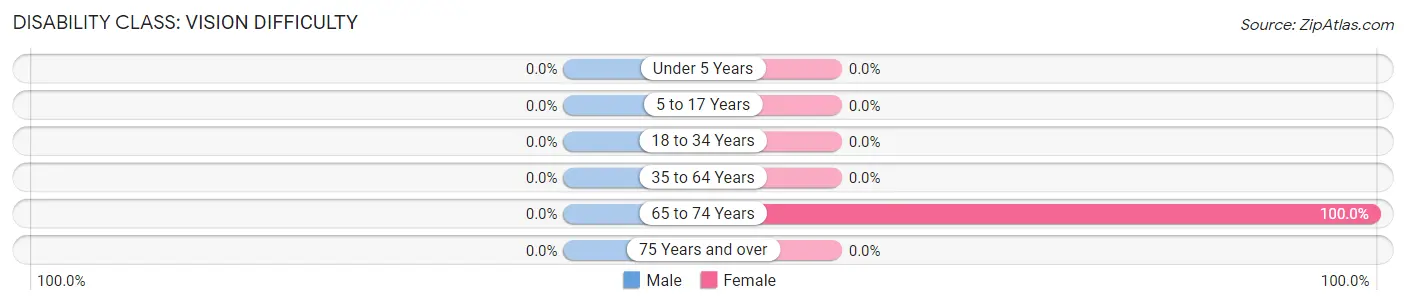
| Age Bracket | Male | Female |
| Under 5 Years | 0 (0.0%) | 0 (0.0%) |
| 5 to 17 Years | 0 (0.0%) | 0 (0.0%) |
| 18 to 34 Years | 0 (0.0%) | 0 (0.0%) |
| 35 to 64 Years | 0 (0.0%) | 0 (0.0%) |
| 65 to 74 Years | 0 (0.0%) | 6 (100.0%) |
| 75 Years and over | 0 (0.0%) | 0 (0.0%) |
Disability Class: Cognitive Difficulty
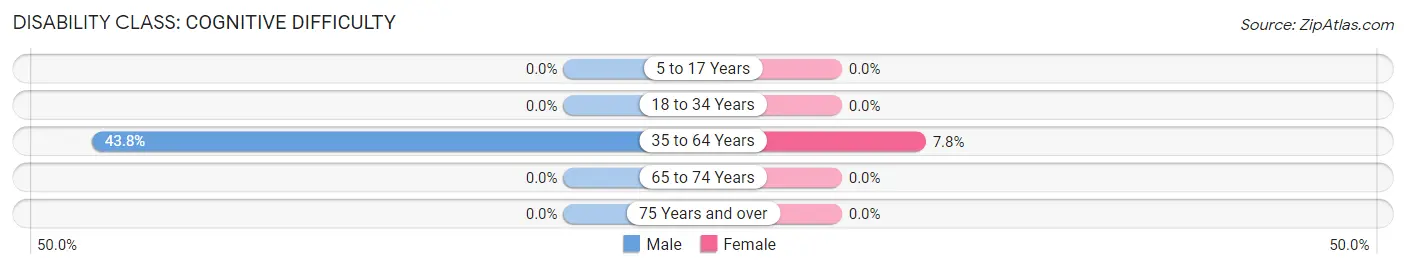
| Age Bracket | Male | Female |
| 5 to 17 Years | 0 (0.0%) | 0 (0.0%) |
| 18 to 34 Years | 0 (0.0%) | 0 (0.0%) |
| 35 to 64 Years | 35 (43.8%) | 6 (7.8%) |
| 65 to 74 Years | 0 (0.0%) | 0 (0.0%) |
| 75 Years and over | 0 (0.0%) | 0 (0.0%) |
Disability Class: Ambulatory Difficulty
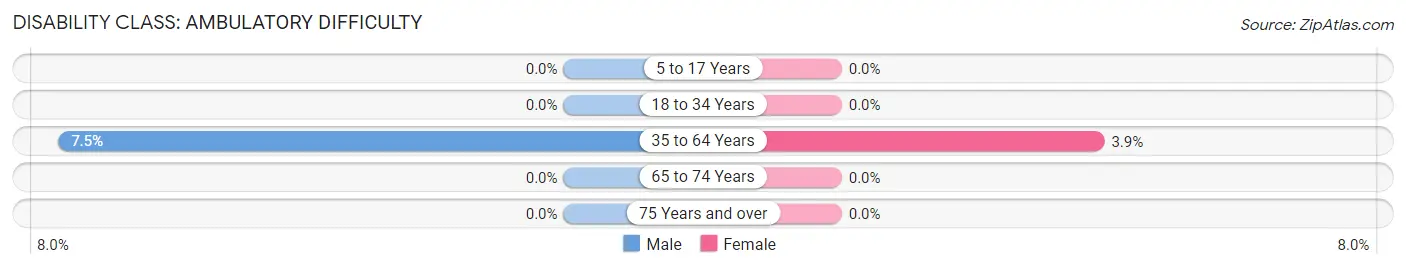
| Age Bracket | Male | Female |
| 5 to 17 Years | 0 (0.0%) | 0 (0.0%) |
| 18 to 34 Years | 0 (0.0%) | 0 (0.0%) |
| 35 to 64 Years | 6 (7.5%) | 3 (3.9%) |
| 65 to 74 Years | 0 (0.0%) | 0 (0.0%) |
| 75 Years and over | 0 (0.0%) | 0 (0.0%) |
Disability Class: Self-Care Difficulty
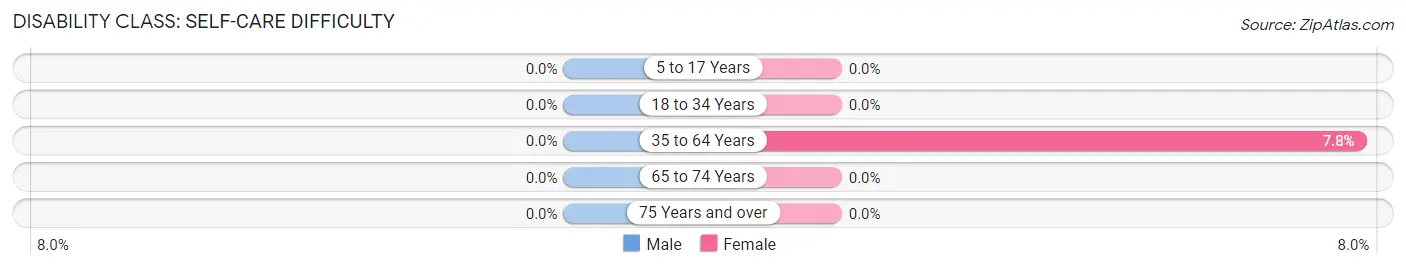
| Age Bracket | Male | Female |
| 5 to 17 Years | 0 (0.0%) | 0 (0.0%) |
| 18 to 34 Years | 0 (0.0%) | 0 (0.0%) |
| 35 to 64 Years | 0 (0.0%) | 6 (7.8%) |
| 65 to 74 Years | 0 (0.0%) | 0 (0.0%) |
| 75 Years and over | 0 (0.0%) | 0 (0.0%) |
Technology Access in Munson
Computing Device Access in Munson
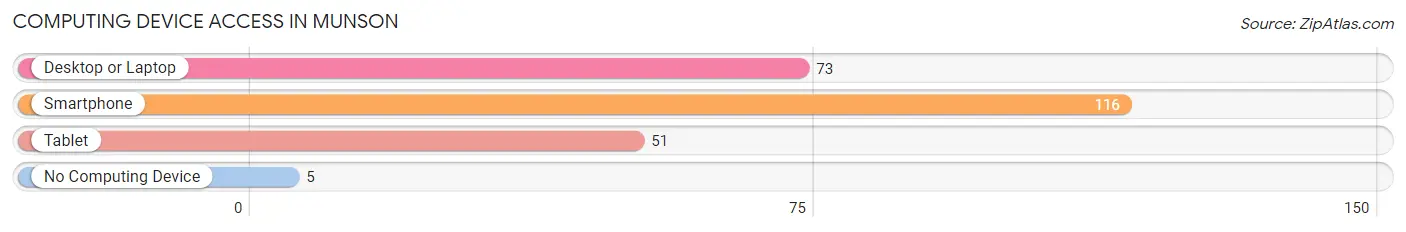
| Device Type | # Households | % Households |
| Desktop or Laptop | 73 | 60.3% |
| Smartphone | 116 | 95.9% |
| Tablet | 51 | 42.1% |
| No Computing Device | 5 | 4.1% |
| Total | 121 | 100.0% |
Internet Access in Munson
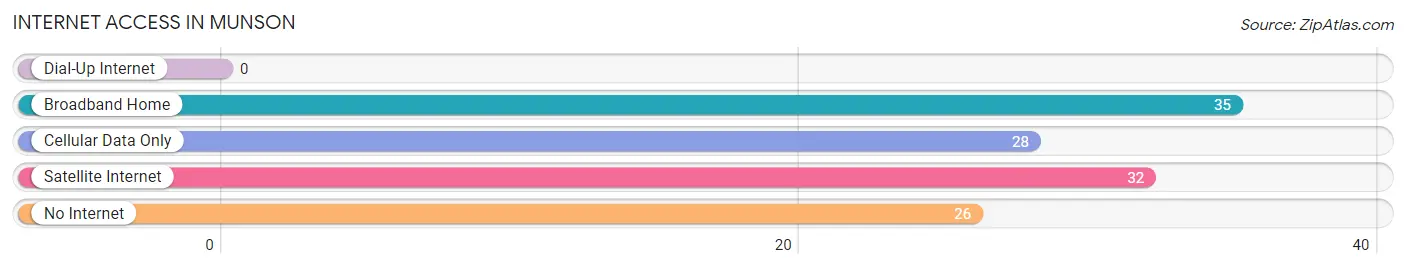
| Internet Type | # Households | % Households |
| Dial-Up Internet | 0 | 0.0% |
| Broadband Home | 35 | 28.9% |
| Cellular Data Only | 28 | 23.1% |
| Satellite Internet | 32 | 26.5% |
| No Internet | 26 | 21.5% |
| Total | 121 | 100.0% |
Munson Summary
Munson is a small unincorporated community located in Santa Rosa County, Florida. It is situated on the western edge of the county, just south of the city of Milton. The community is bordered by the Blackwater River to the east and the Escambia River to the west. The population of Munson was estimated to be 1,072 in 2019.
Geography
Munson is located in the western part of Santa Rosa County, Florida. It is situated on the western edge of the county, just south of the city of Milton. The community is bordered by the Blackwater River to the east and the Escambia River to the west. The terrain of the area is mostly flat, with some rolling hills. The climate is humid subtropical, with hot summers and mild winters.
Economy
Munson is primarily a rural community, with most of its residents employed in agriculture and related industries. The main crops grown in the area are cotton, corn, soybeans, and peanuts. Other industries in the area include timber, forestry, and fishing. The community also has a few small businesses, such as convenience stores, restaurants, and gas stations.
Demographics
The population of Munson was estimated to be 1,072 in 2019. The racial makeup of the community was 94.3% White, 2.2% African American, 0.7% Native American, 0.7% Asian, 0.3% from other races, and 1.9% from two or more races. Hispanic or Latino of any race were 2.2% of the population.
The median household income in Munson was $41,944 in 2019. The per capita income was $20,945. About 17.3% of the population was below the poverty line.
Education
Munson is served by the Santa Rosa County School District. The community is home to Munson Elementary School, which serves students in grades K-5. The nearest middle and high schools are located in Milton.
Conclusion
Munson is a small unincorporated community located in Santa Rosa County, Florida. It is situated on the western edge of the county, just south of the city of Milton. The population of Munson was estimated to be 1,072 in 2019. The economy of the community is primarily based on agriculture and related industries, with some small businesses. The racial makeup of the community was 94.3% White, 2.2% African American, 0.7% Native American, 0.7% Asian, 0.3% from other races, and 1.9% from two or more races. The median household income in Munson was $41,944 in 2019. The community is served by the Santa Rosa County School District, with Munson Elementary School serving students in grades K-5.
Common Questions
What is Per Capita Income in Munson?
Per Capita income in Munson is $14,817.
What is the Median Family Income in Munson?
Median Family Income in Munson is $33,750.
What is the Median Household income in Munson?
Median Household Income in Munson is $39,018.
What is Income or Wage Gap in Munson?
Income or Wage Gap in Munson is 13.0%.
Women in Munson earn 87.0 cents for every dollar earned by a man.
What is Inequality or Gini Index in Munson?
Inequality or Gini Index in Munson is 0.29.
What is the Total Population of Munson?
Total Population of Munson is 390.
What is the Total Male Population of Munson?
Total Male Population of Munson is 205.
What is the Total Female Population of Munson?
Total Female Population of Munson is 185.
What is the Ratio of Males per 100 Females in Munson?
There are 110.81 Males per 100 Females in Munson.
What is the Ratio of Females per 100 Males in Munson?
There are 90.24 Females per 100 Males in Munson.
What is the Median Population Age in Munson?
Median Population Age in Munson is 22.2 Years.
What is the Average Family Size in Munson
Average Family Size in Munson is 3.5 People.
What is the Average Household Size in Munson
Average Household Size in Munson is 3.2 People.
How Large is the Labor Force in Munson?
There are 218 People in the Labor Forcein in Munson.
What is the Percentage of People in the Labor Force in Munson?
87.2% of People are in the Labor Force in Munson.
What is the Unemployment Rate in Munson?
Unemployment Rate in Munson is 16.1%.