Fuller Heights, FL Map & Demographics
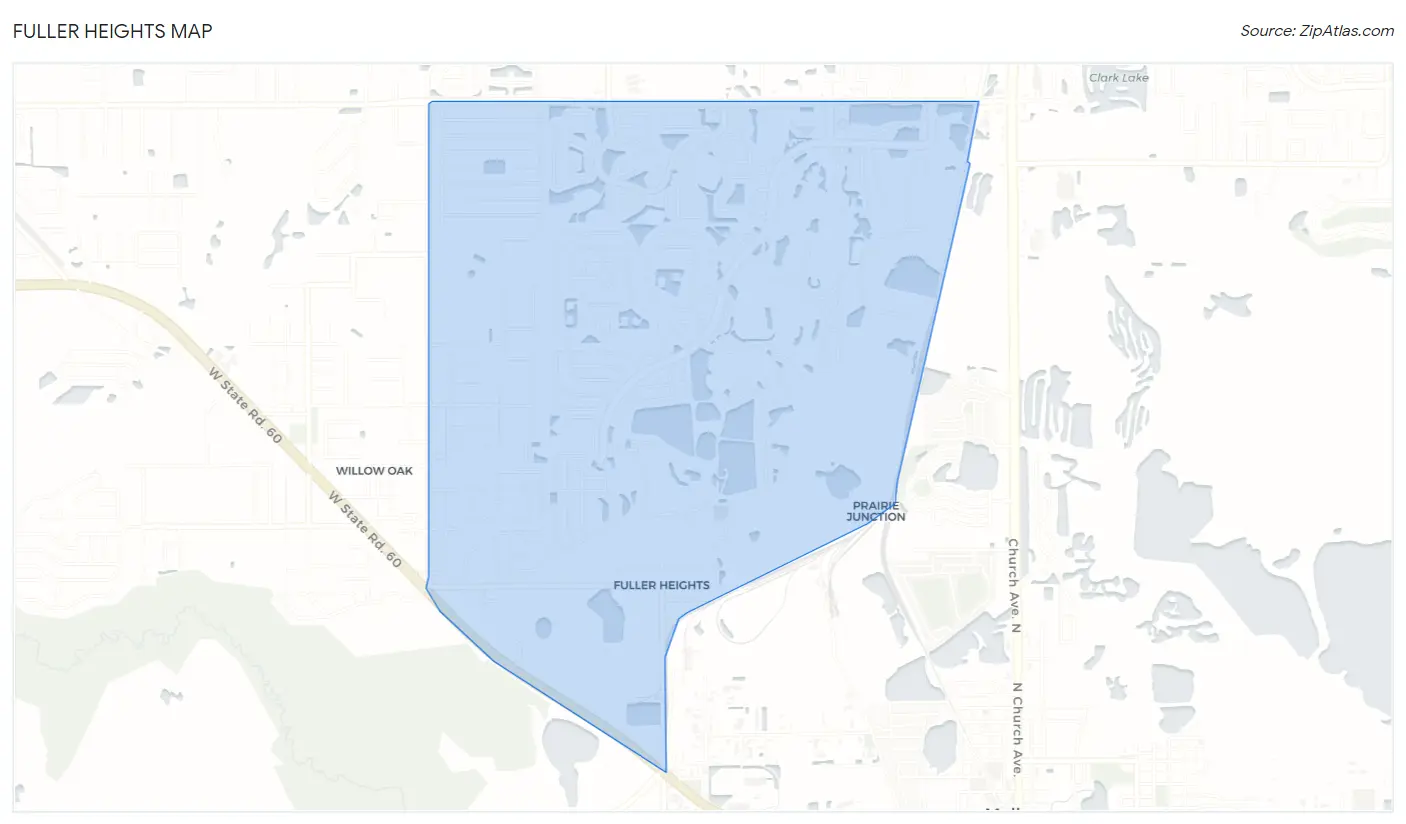
Fuller Heights Map
Fuller Heights Overview
$30,163
PER CAPITA INCOME
$78,825
AVG FAMILY INCOME
$77,787
AVG HOUSEHOLD INCOME
28.0%
WAGE / INCOME GAP [ % ]
72.0¢/ $1
WAGE / INCOME GAP [ $ ]
$6,318
FAMILY INCOME DEFICIT
0.36
INEQUALITY / GINI INDEX
11,462
TOTAL POPULATION
5,881
MALE POPULATION
5,581
FEMALE POPULATION
105.38
MALES / 100 FEMALES
94.90
FEMALES / 100 MALES
32.5
MEDIAN AGE
3.4
AVG FAMILY SIZE
3.0
AVG HOUSEHOLD SIZE
6,255
LABOR FORCE [ PEOPLE ]
69.9%
PERCENT IN LABOR FORCE
3.8%
UNEMPLOYMENT RATE
Income in Fuller Heights
Income Overview in Fuller Heights
Per Capita Income in Fuller Heights is $30,163, while median incomes of families and households are $78,825 and $77,787 respectively.
| Characteristic | Number | Measure |
| Per Capita Income | 11,462 | $30,163 |
| Median Family Income | 2,762 | $78,825 |
| Mean Family Income | 2,762 | $96,030 |
| Median Household Income | 3,782 | $77,787 |
| Mean Household Income | 3,782 | $87,839 |
| Income Deficit | 2,762 | $6,318 |
| Wage / Income Gap (%) | 11,462 | 28.01% |
| Wage / Income Gap ($) | 11,462 | 71.99¢ per $1 |
| Gini / Inequality Index | 11,462 | 0.36 |
Earnings by Sex in Fuller Heights
Average Earnings in Fuller Heights are $38,954, $45,141 for men and $32,496 for women, a difference of 28.0%.
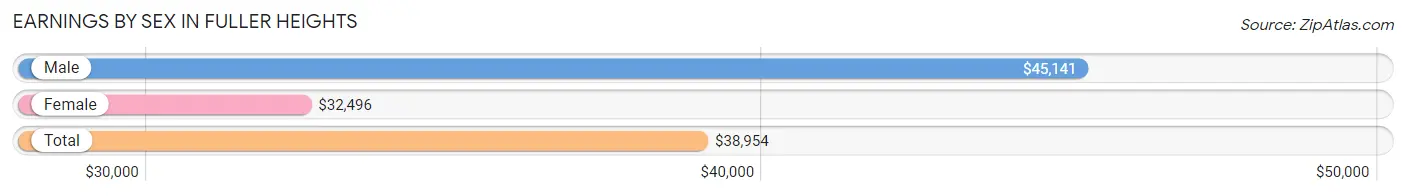
| Sex | Number | Average Earnings |
| Male | 3,610 (54.3%) | $45,141 |
| Female | 3,039 (45.7%) | $32,496 |
| Total | 6,649 (100.0%) | $38,954 |
Earnings by Sex by Income Bracket in Fuller Heights
The most common earnings brackets in Fuller Heights are $45,000 to $49,999 for men (522 | 14.5%) and $30,000 to $34,999 for women (331 | 10.9%).
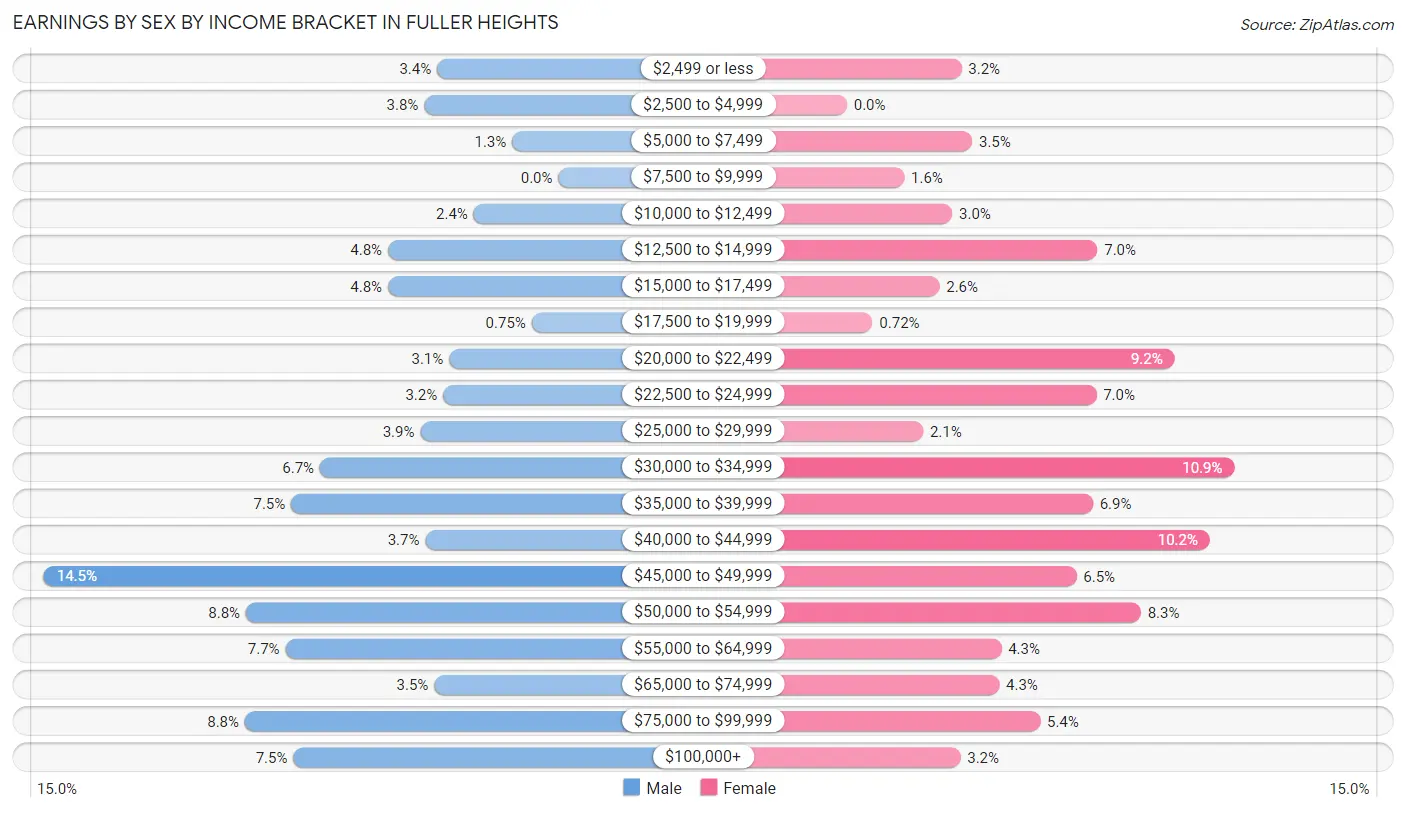
| Income | Male | Female |
| $2,499 or less | 123 (3.4%) | 98 (3.2%) |
| $2,500 to $4,999 | 136 (3.8%) | 0 (0.0%) |
| $5,000 to $7,499 | 47 (1.3%) | 107 (3.5%) |
| $7,500 to $9,999 | 0 (0.0%) | 49 (1.6%) |
| $10,000 to $12,499 | 86 (2.4%) | 90 (3.0%) |
| $12,500 to $14,999 | 173 (4.8%) | 214 (7.0%) |
| $15,000 to $17,499 | 173 (4.8%) | 79 (2.6%) |
| $17,500 to $19,999 | 27 (0.7%) | 22 (0.7%) |
| $20,000 to $22,499 | 111 (3.1%) | 280 (9.2%) |
| $22,500 to $24,999 | 117 (3.2%) | 213 (7.0%) |
| $25,000 to $29,999 | 140 (3.9%) | 65 (2.1%) |
| $30,000 to $34,999 | 242 (6.7%) | 331 (10.9%) |
| $35,000 to $39,999 | 271 (7.5%) | 210 (6.9%) |
| $40,000 to $44,999 | 135 (3.7%) | 310 (10.2%) |
| $45,000 to $49,999 | 522 (14.5%) | 196 (6.5%) |
| $50,000 to $54,999 | 317 (8.8%) | 251 (8.3%) |
| $55,000 to $64,999 | 277 (7.7%) | 132 (4.3%) |
| $65,000 to $74,999 | 126 (3.5%) | 130 (4.3%) |
| $75,000 to $99,999 | 318 (8.8%) | 165 (5.4%) |
| $100,000+ | 269 (7.4%) | 97 (3.2%) |
| Total | 3,610 (100.0%) | 3,039 (100.0%) |
Earnings by Sex by Educational Attainment in Fuller Heights
Average earnings in Fuller Heights are $47,113 for men and $39,111 for women, a difference of 17.0%. Men with an educational attainment of college or associate's degree enjoy the highest average annual earnings of $52,070, while those with less than high school education earn the least with $42,727. Women with an educational attainment of graduate degree earn the most with the average annual earnings of $76,012, while those with college or associate's degree education have the smallest earnings of $31,721.
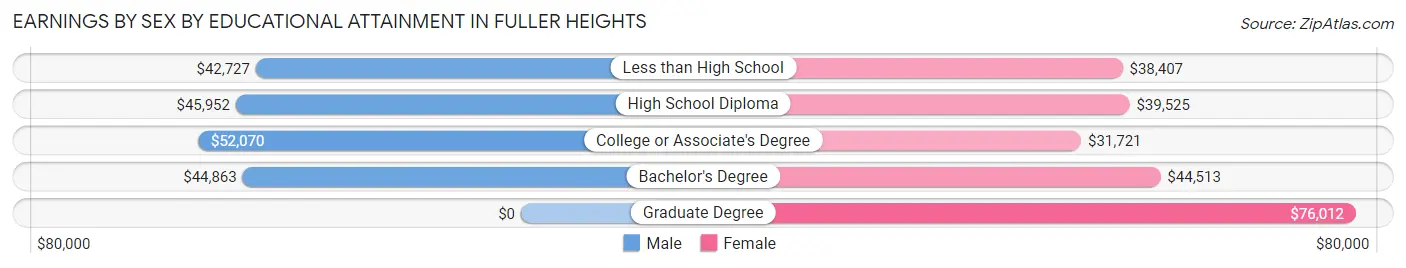
| Educational Attainment | Male Income | Female Income |
| Less than High School | $42,727 | $38,407 |
| High School Diploma | $45,952 | $39,525 |
| College or Associate's Degree | $52,070 | $31,721 |
| Bachelor's Degree | $44,863 | $44,513 |
| Graduate Degree | - | - |
| Total | $47,113 | $39,111 |
Family Income in Fuller Heights
Family Income Brackets in Fuller Heights
According to the Fuller Heights family income data, there are 668 families falling into the $75,000 to $99,999 income range, which is the most common income bracket and makes up 24.2% of all families.
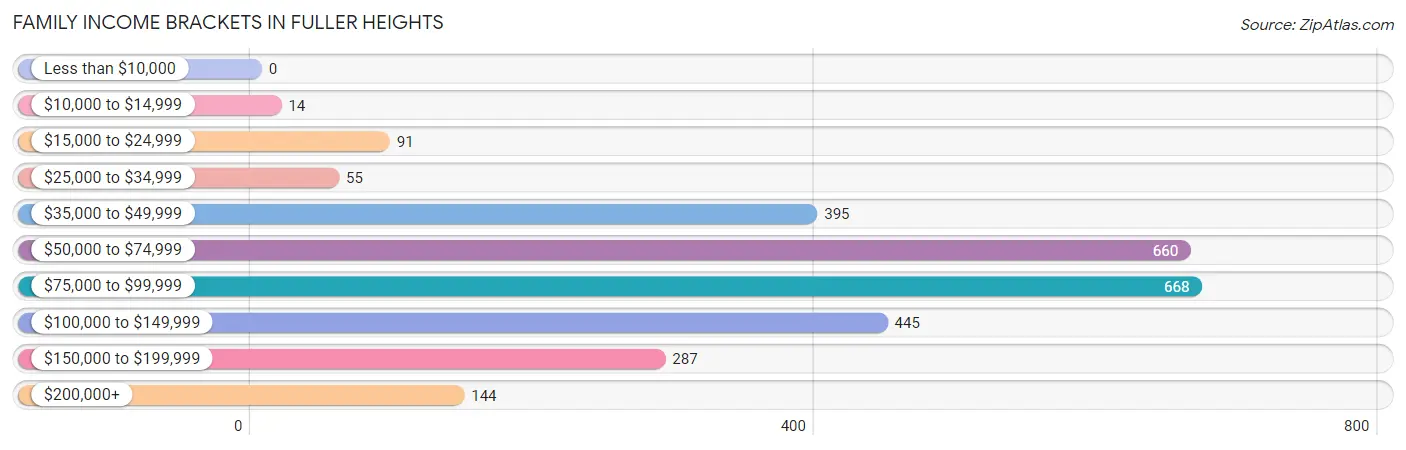
| Income Bracket | # Families | % Families |
| Less than $10,000 | 0 | 0.0% |
| $10,000 to $14,999 | 14 | 0.5% |
| $15,000 to $24,999 | 91 | 3.3% |
| $25,000 to $34,999 | 55 | 2.0% |
| $35,000 to $49,999 | 395 | 14.3% |
| $50,000 to $74,999 | 660 | 23.9% |
| $75,000 to $99,999 | 668 | 24.2% |
| $100,000 to $149,999 | 445 | 16.1% |
| $150,000 to $199,999 | 287 | 10.4% |
| $200,000+ | 144 | 5.2% |
Family Income by Famaliy Size in Fuller Heights
6-person families (111 | 4.0%) account for the highest median family income in Fuller Heights with $103,442 per family, while 2-person families (1,153 | 41.7%) have the highest median income of $39,050 per family member.
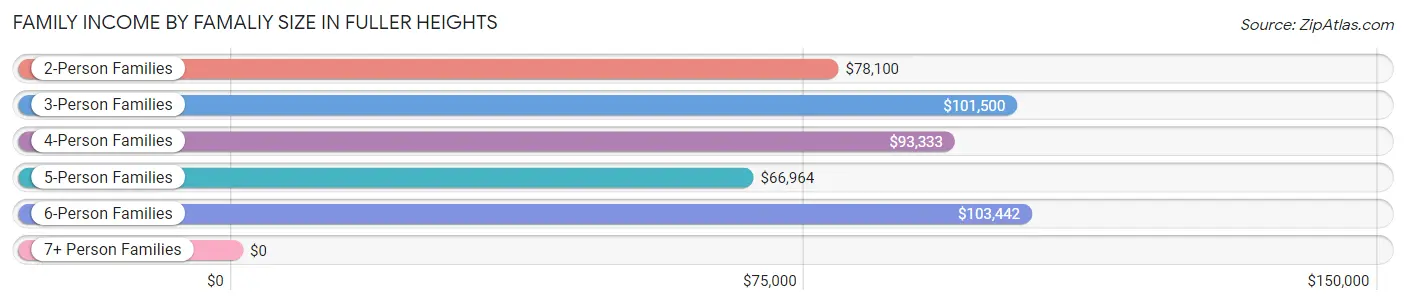
| Income Bracket | # Families | Median Income |
| 2-Person Families | 1,153 (41.7%) | $78,100 |
| 3-Person Families | 548 (19.8%) | $101,500 |
| 4-Person Families | 716 (25.9%) | $93,333 |
| 5-Person Families | 180 (6.5%) | $66,964 |
| 6-Person Families | 111 (4.0%) | $103,442 |
| 7+ Person Families | 54 (2.0%) | $0 |
| Total | 2,762 (100.0%) | $78,825 |
Family Income by Number of Earners in Fuller Heights
The median family income in Fuller Heights is $78,825, with families comprising 3+ earners (492) having the highest median family income of $134,318, while families with no earners (276) have the lowest median family income of $52,400, accounting for 17.8% and 10.0% of families, respectively.
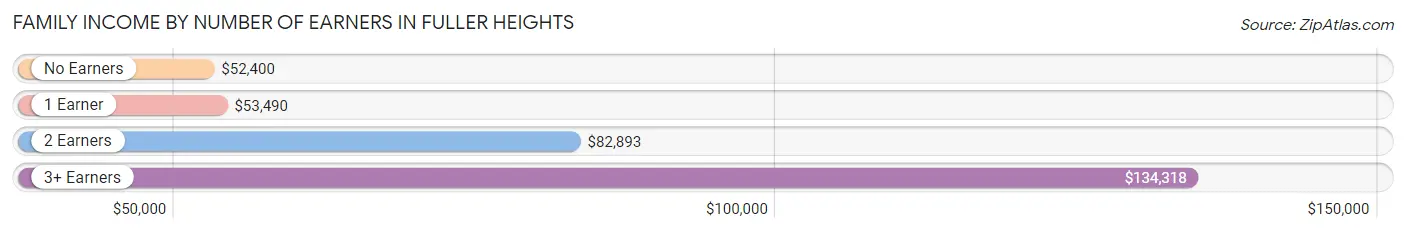
| Number of Earners | # Families | Median Income |
| No Earners | 276 (10.0%) | $52,400 |
| 1 Earner | 782 (28.3%) | $53,490 |
| 2 Earners | 1,212 (43.9%) | $82,893 |
| 3+ Earners | 492 (17.8%) | $134,318 |
| Total | 2,762 (100.0%) | $78,825 |
Household Income in Fuller Heights
Household Income Brackets in Fuller Heights
With 946 households falling in the category, the $75,000 to $99,999 income range is the most frequent in Fuller Heights, accounting for 25.0% of all households. In contrast, only 23 households (0.6%) fall into the $10,000 to $14,999 income bracket, making it the least populous group.
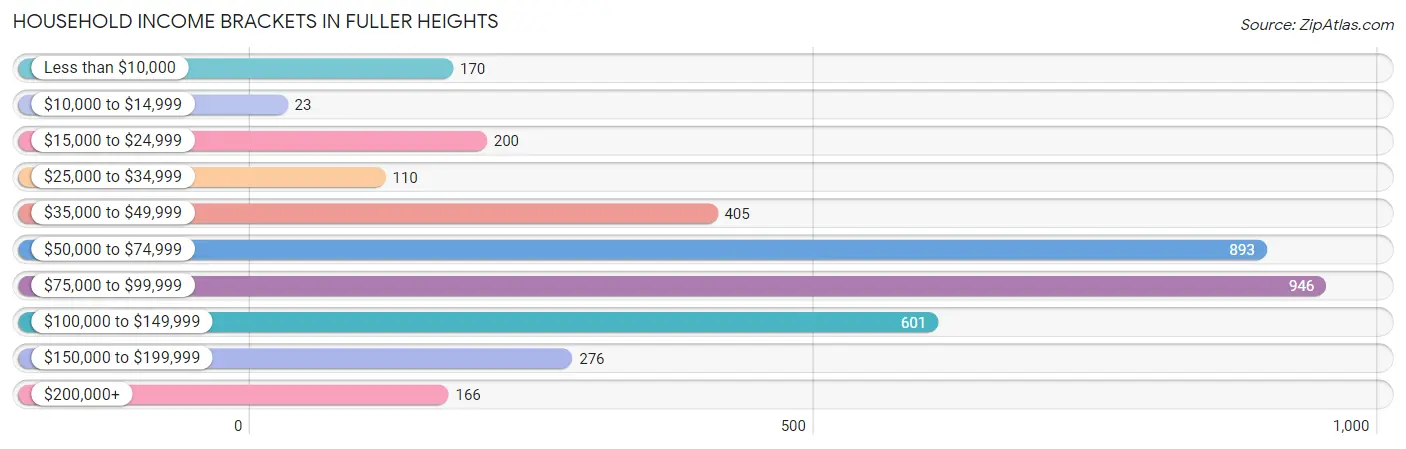
| Income Bracket | # Households | % Households |
| Less than $10,000 | 170 | 4.5% |
| $10,000 to $14,999 | 23 | 0.6% |
| $15,000 to $24,999 | 200 | 5.3% |
| $25,000 to $34,999 | 110 | 2.9% |
| $35,000 to $49,999 | 405 | 10.7% |
| $50,000 to $74,999 | 893 | 23.6% |
| $75,000 to $99,999 | 946 | 25.0% |
| $100,000 to $149,999 | 601 | 15.9% |
| $150,000 to $199,999 | 276 | 7.3% |
| $200,000+ | 166 | 4.4% |
Household Income by Householder Age in Fuller Heights
The median household income in Fuller Heights is $77,787, with the highest median household income of $97,800 found in the 45 to 64 years age bracket for the primary householder. A total of 1,078 households (28.5%) fall into this category. Meanwhile, the 15 to 24 years age bracket for the primary householder has the lowest median household income of $0, with 121 households (3.2%) in this group.
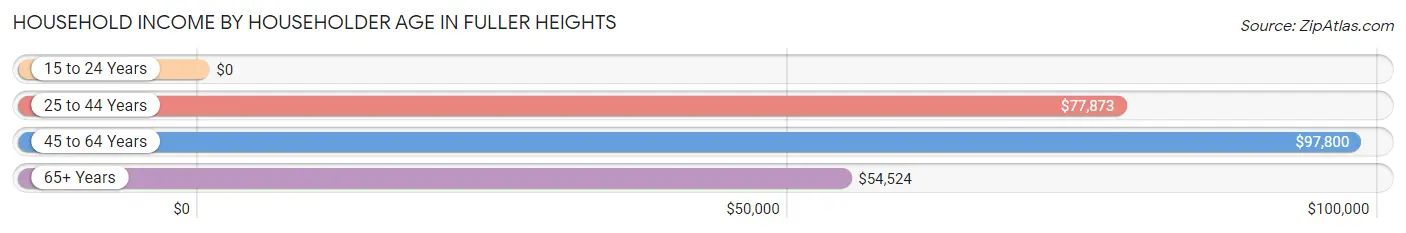
| Income Bracket | # Households | Median Income |
| 15 to 24 Years | 121 (3.2%) | $0 |
| 25 to 44 Years | 1,771 (46.8%) | $77,873 |
| 45 to 64 Years | 1,078 (28.5%) | $97,800 |
| 65+ Years | 812 (21.5%) | $54,524 |
| Total | 3,782 (100.0%) | $77,787 |
Poverty in Fuller Heights
Income Below Poverty by Sex and Age in Fuller Heights
With 8.5% poverty level for males and 5.7% for females among the residents of Fuller Heights, 15 year old males and 75 year old and over females are the most vulnerable to poverty, with 22 males (37.9%) and 23 females (13.8%) in their respective age groups living below the poverty level.
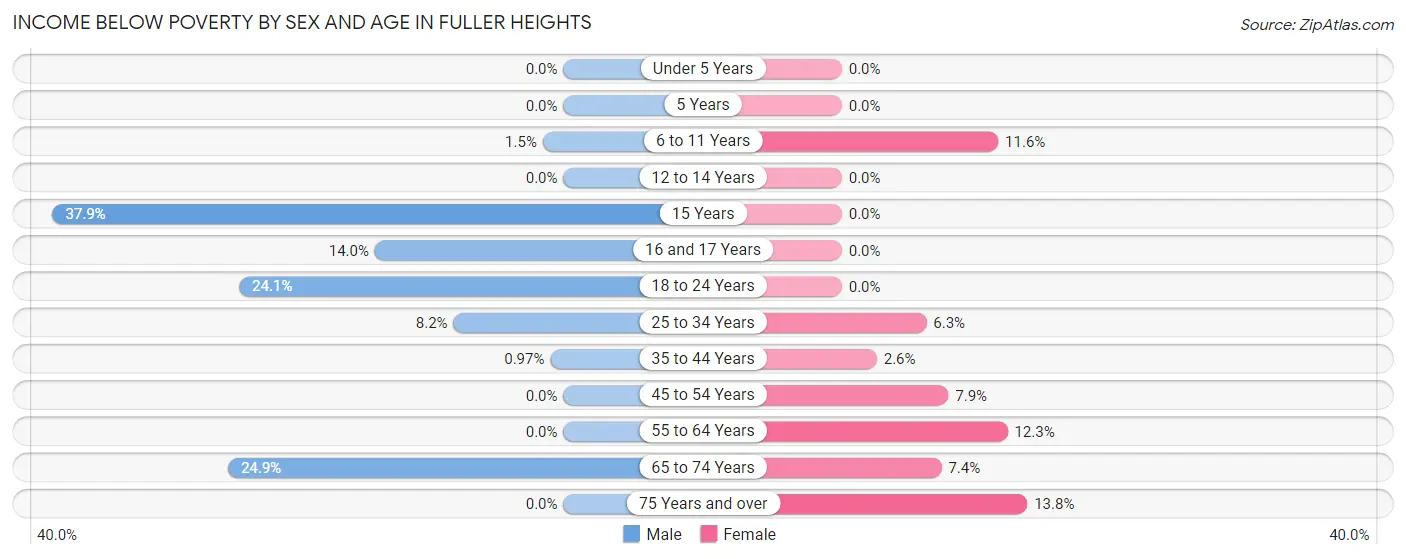
| Age Bracket | Male | Female |
| Under 5 Years | 0 (0.0%) | 0 (0.0%) |
| 5 Years | 0 (0.0%) | 0 (0.0%) |
| 6 to 11 Years | 9 (1.5%) | 49 (11.6%) |
| 12 to 14 Years | 0 (0.0%) | 0 (0.0%) |
| 15 Years | 22 (37.9%) | 0 (0.0%) |
| 16 and 17 Years | 21 (14.0%) | 0 (0.0%) |
| 18 to 24 Years | 208 (24.1%) | 0 (0.0%) |
| 25 to 34 Years | 106 (8.2%) | 83 (6.3%) |
| 35 to 44 Years | 7 (1.0%) | 13 (2.6%) |
| 45 to 54 Years | 0 (0.0%) | 58 (7.9%) |
| 55 to 64 Years | 0 (0.0%) | 46 (12.3%) |
| 65 to 74 Years | 126 (24.9%) | 48 (7.4%) |
| 75 Years and over | 0 (0.0%) | 23 (13.8%) |
| Total | 499 (8.5%) | 320 (5.7%) |
Income Above Poverty by Sex and Age in Fuller Heights
According to the poverty statistics in Fuller Heights, males aged under 5 years and females aged under 5 years are the age groups that are most secure financially, with 100.0% of males and 100.0% of females in these age groups living above the poverty line.
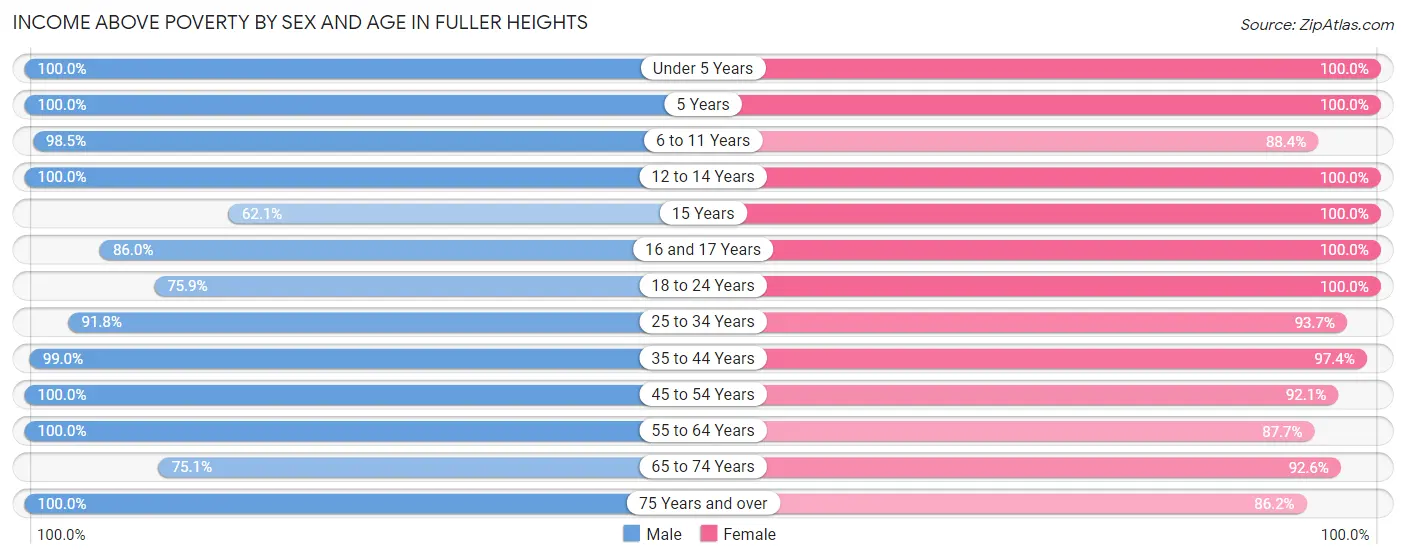
| Age Bracket | Male | Female |
| Under 5 Years | 297 (100.0%) | 517 (100.0%) |
| 5 Years | 92 (100.0%) | 26 (100.0%) |
| 6 to 11 Years | 580 (98.5%) | 373 (88.4%) |
| 12 to 14 Years | 253 (100.0%) | 196 (100.0%) |
| 15 Years | 36 (62.1%) | 56 (100.0%) |
| 16 and 17 Years | 129 (86.0%) | 277 (100.0%) |
| 18 to 24 Years | 656 (75.9%) | 334 (100.0%) |
| 25 to 34 Years | 1,193 (91.8%) | 1,239 (93.7%) |
| 35 to 44 Years | 716 (99.0%) | 487 (97.4%) |
| 45 to 54 Years | 478 (100.0%) | 675 (92.1%) |
| 55 to 64 Years | 388 (100.0%) | 328 (87.7%) |
| 65 to 74 Years | 380 (75.1%) | 601 (92.6%) |
| 75 Years and over | 184 (100.0%) | 144 (86.2%) |
| Total | 5,382 (91.5%) | 5,253 (94.3%) |
Income Below Poverty Among Married-Couple Families in Fuller Heights
The poverty statistics for married-couple families in Fuller Heights show that 2.2% or 49 of the total 2,196 families live below the poverty line. Families with 5 or more children have the highest poverty rate of 100.0%, comprising of 8 families. On the other hand, families with 3 or 4 children have the lowest poverty rate of 0.0%, which includes 0 families.
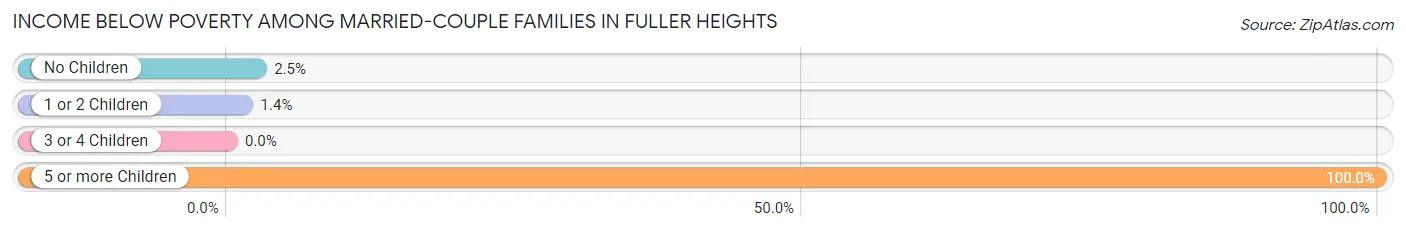
| Children | Above Poverty | Below Poverty |
| No Children | 1,112 (97.5%) | 29 (2.5%) |
| 1 or 2 Children | 868 (98.6%) | 12 (1.4%) |
| 3 or 4 Children | 167 (100.0%) | 0 (0.0%) |
| 5 or more Children | 0 (0.0%) | 8 (100.0%) |
| Total | 2,147 (97.8%) | 49 (2.2%) |
Income Below Poverty Among Single-Parent Households in Fuller Heights
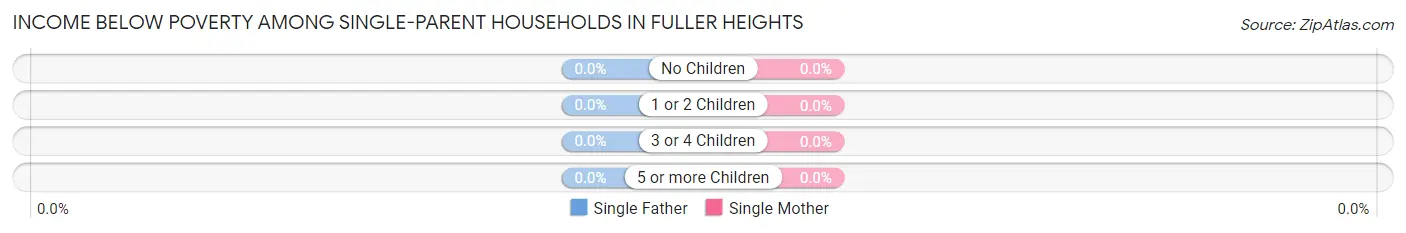
| Children | Single Father | Single Mother |
| No Children | 0 (0.0%) | 0 (0.0%) |
| 1 or 2 Children | 0 (0.0%) | 0 (0.0%) |
| 3 or 4 Children | 0 (0.0%) | 0 (0.0%) |
| 5 or more Children | 0 (0.0%) | 0 (0.0%) |
| Total | 0 (0.0%) | 0 (0.0%) |
Income Below Poverty Among Married-Couple vs Single-Parent Households in Fuller Heights
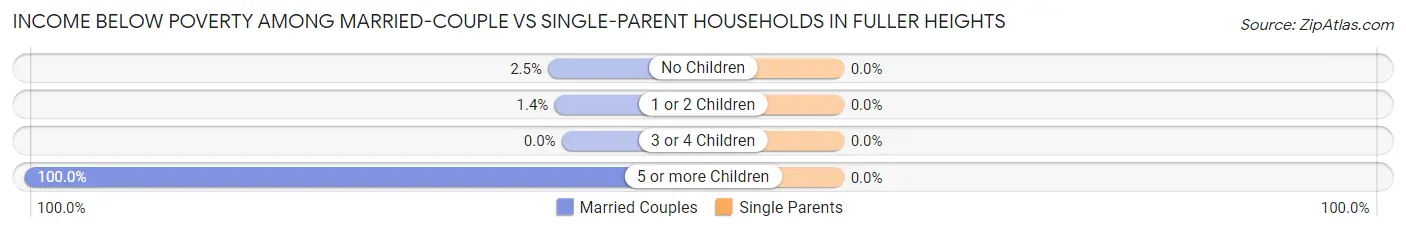
| Children | Married-Couple Families | Single-Parent Households |
| No Children | 29 (2.5%) | 0 (0.0%) |
| 1 or 2 Children | 12 (1.4%) | 0 (0.0%) |
| 3 or 4 Children | 0 (0.0%) | 0 (0.0%) |
| 5 or more Children | 8 (100.0%) | 0 (0.0%) |
| Total | 49 (2.2%) | 0 (0.0%) |
Race in Fuller Heights
The most populous races in Fuller Heights are White / Caucasian (7,059 | 61.6%), Hispanic or Latino (2,727 | 23.8%), and Black / African American (1,751 | 15.3%).
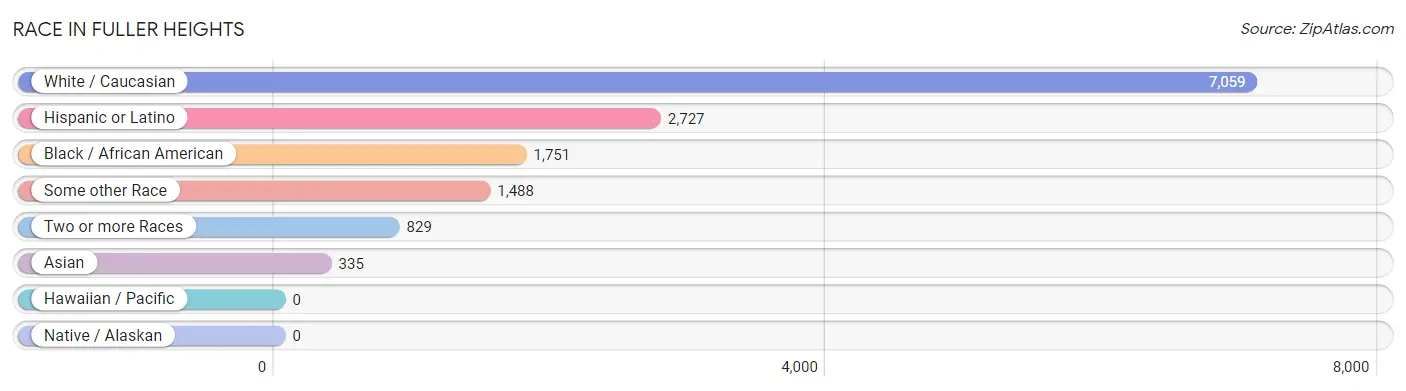
| Race | # Population | % Population |
| Asian | 335 | 2.9% |
| Black / African American | 1,751 | 15.3% |
| Hawaiian / Pacific | 0 | 0.0% |
| Hispanic or Latino | 2,727 | 23.8% |
| Native / Alaskan | 0 | 0.0% |
| White / Caucasian | 7,059 | 61.6% |
| Two or more Races | 829 | 7.2% |
| Some other Race | 1,488 | 13.0% |
| Total | 11,462 | 100.0% |
Ancestry in Fuller Heights
The most populous ancestries reported in Fuller Heights are German (1,260 | 11.0%), Irish (1,259 | 11.0%), American (1,218 | 10.6%), Italian (966 | 8.4%), and English (906 | 7.9%), together accounting for 48.9% of all Fuller Heights residents.
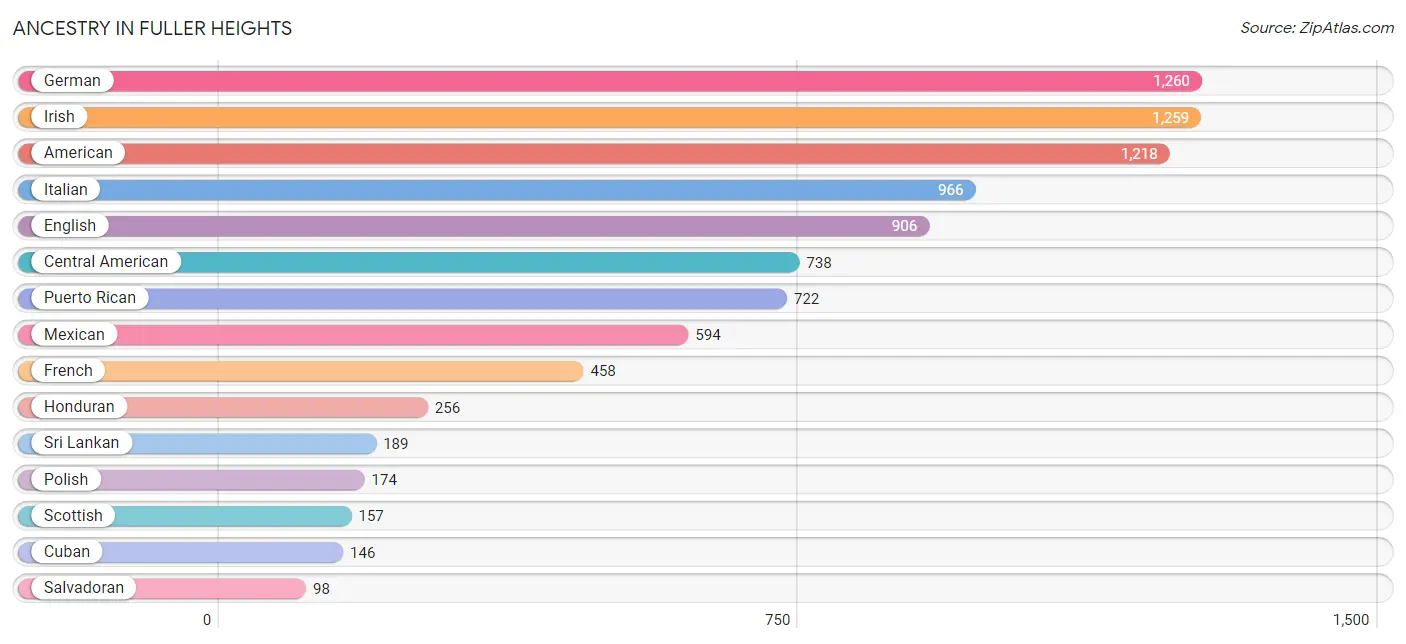
| Ancestry | # Population | % Population |
| African | 14 | 0.1% |
| American | 1,218 | 10.6% |
| Arab | 57 | 0.5% |
| Austrian | 11 | 0.1% |
| British | 15 | 0.1% |
| Burmese | 22 | 0.2% |
| Canadian | 39 | 0.3% |
| Central American | 738 | 6.4% |
| Cherokee | 13 | 0.1% |
| Choctaw | 11 | 0.1% |
| Cuban | 146 | 1.3% |
| Czech | 16 | 0.1% |
| Czechoslovakian | 28 | 0.2% |
| Dominican | 67 | 0.6% |
| Dutch | 24 | 0.2% |
| Eastern European | 20 | 0.2% |
| English | 906 | 7.9% |
| European | 47 | 0.4% |
| French | 458 | 4.0% |
| French Canadian | 16 | 0.1% |
| German | 1,260 | 11.0% |
| Guyanese | 73 | 0.6% |
| Honduran | 256 | 2.2% |
| Hungarian | 32 | 0.3% |
| Indian (Asian) | 39 | 0.3% |
| Irish | 1,259 | 11.0% |
| Italian | 966 | 8.4% |
| Jamaican | 12 | 0.1% |
| Korean | 74 | 0.6% |
| Latvian | 59 | 0.5% |
| Lebanese | 57 | 0.5% |
| Malaysian | 19 | 0.2% |
| Mexican | 594 | 5.2% |
| Native Hawaiian | 13 | 0.1% |
| Northern European | 12 | 0.1% |
| Norwegian | 32 | 0.3% |
| Polish | 174 | 1.5% |
| Portuguese | 11 | 0.1% |
| Puerto Rican | 722 | 6.3% |
| Romanian | 25 | 0.2% |
| Russian | 27 | 0.2% |
| Salvadoran | 98 | 0.9% |
| Scotch-Irish | 59 | 0.5% |
| Scottish | 157 | 1.4% |
| Spaniard | 53 | 0.5% |
| Spanish | 36 | 0.3% |
| Sri Lankan | 189 | 1.7% |
| Subsaharan African | 14 | 0.1% |
| Swedish | 23 | 0.2% |
| Welsh | 16 | 0.1% | View All 50 Rows |
Immigrants in Fuller Heights
The most numerous immigrant groups reported in Fuller Heights came from Latin America (834 | 7.3%), Central America (634 | 5.5%), Mexico (346 | 3.0%), Honduras (192 | 1.7%), and Asia (162 | 1.4%), together accounting for 18.9% of all Fuller Heights residents.
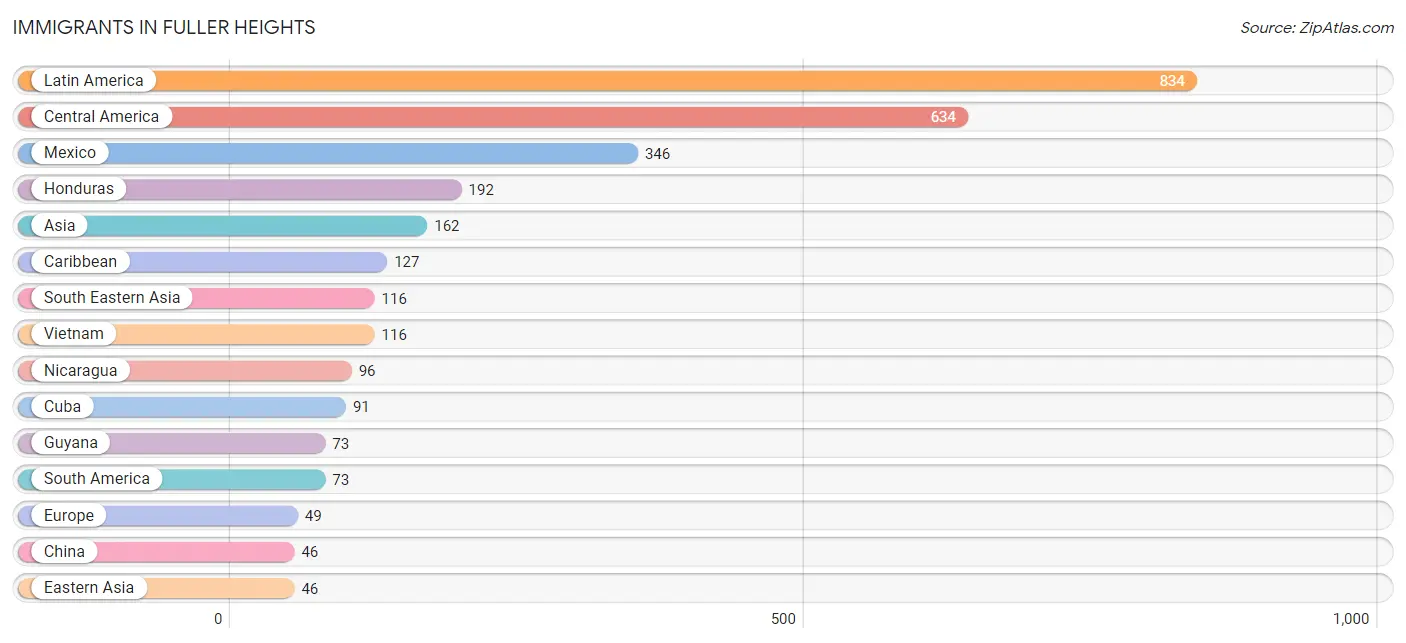
| Immigration Origin | # Population | % Population |
| Asia | 162 | 1.4% |
| Canada | 40 | 0.4% |
| Caribbean | 127 | 1.1% |
| Central America | 634 | 5.5% |
| China | 46 | 0.4% |
| Cuba | 91 | 0.8% |
| Dominican Republic | 24 | 0.2% |
| Eastern Asia | 46 | 0.4% |
| Eastern Europe | 41 | 0.4% |
| Europe | 49 | 0.4% |
| Guyana | 73 | 0.6% |
| Honduras | 192 | 1.7% |
| Italy | 8 | 0.1% |
| Jamaica | 12 | 0.1% |
| Latin America | 834 | 7.3% |
| Mexico | 346 | 3.0% |
| Nicaragua | 96 | 0.8% |
| Russia | 41 | 0.4% |
| South America | 73 | 0.6% |
| South Eastern Asia | 116 | 1.0% |
| Southern Europe | 8 | 0.1% |
| Vietnam | 116 | 1.0% | View All 22 Rows |
Sex and Age in Fuller Heights
Sex and Age in Fuller Heights
The most populous age groups in Fuller Heights are 30 to 34 Years (895 | 15.2%) for men and 30 to 34 Years (935 | 16.8%) for women.
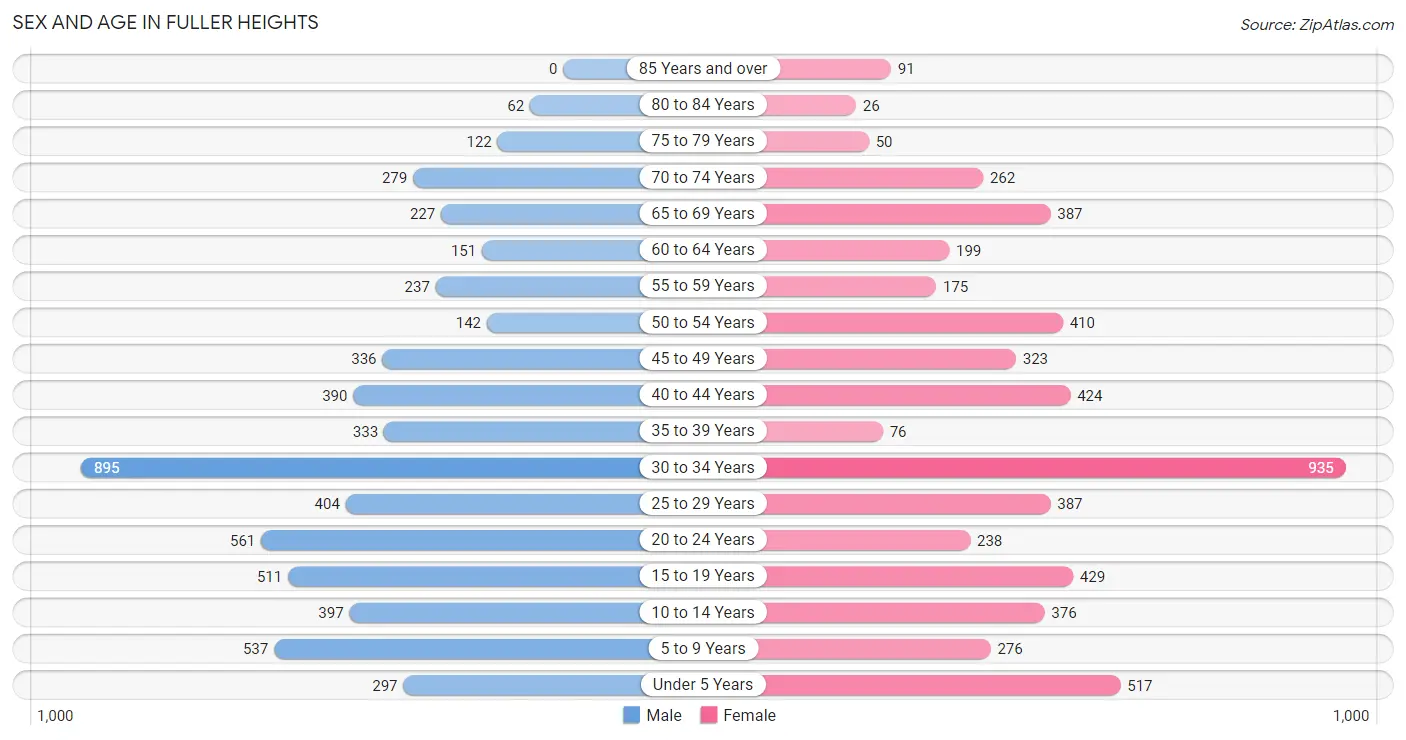
| Age Bracket | Male | Female |
| Under 5 Years | 297 (5.1%) | 517 (9.3%) |
| 5 to 9 Years | 537 (9.1%) | 276 (5.0%) |
| 10 to 14 Years | 397 (6.8%) | 376 (6.7%) |
| 15 to 19 Years | 511 (8.7%) | 429 (7.7%) |
| 20 to 24 Years | 561 (9.5%) | 238 (4.3%) |
| 25 to 29 Years | 404 (6.9%) | 387 (6.9%) |
| 30 to 34 Years | 895 (15.2%) | 935 (16.8%) |
| 35 to 39 Years | 333 (5.7%) | 76 (1.4%) |
| 40 to 44 Years | 390 (6.6%) | 424 (7.6%) |
| 45 to 49 Years | 336 (5.7%) | 323 (5.8%) |
| 50 to 54 Years | 142 (2.4%) | 410 (7.3%) |
| 55 to 59 Years | 237 (4.0%) | 175 (3.1%) |
| 60 to 64 Years | 151 (2.6%) | 199 (3.6%) |
| 65 to 69 Years | 227 (3.9%) | 387 (6.9%) |
| 70 to 74 Years | 279 (4.7%) | 262 (4.7%) |
| 75 to 79 Years | 122 (2.1%) | 50 (0.9%) |
| 80 to 84 Years | 62 (1.1%) | 26 (0.5%) |
| 85 Years and over | 0 (0.0%) | 91 (1.6%) |
| Total | 5,881 (100.0%) | 5,581 (100.0%) |
Families and Households in Fuller Heights
Median Family Size in Fuller Heights
The median family size in Fuller Heights is 3.39 persons per family, with single male/father families (188 | 6.8%) accounting for the largest median family size of 4.52 persons per family. On the other hand, single female/mother families (378 | 13.7%) represent the smallest median family size with 3.00 persons per family.
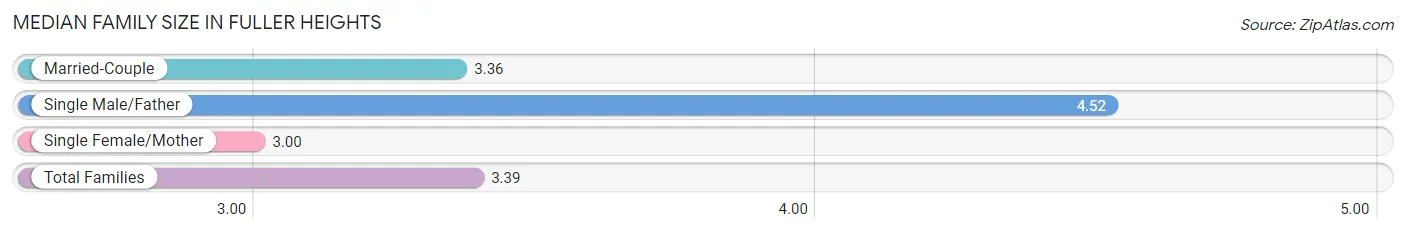
| Family Type | # Families | Family Size |
| Married-Couple | 2,196 (79.5%) | 3.36 |
| Single Male/Father | 188 (6.8%) | 4.52 |
| Single Female/Mother | 378 (13.7%) | 3.00 |
| Total Families | 2,762 (100.0%) | 3.39 |
Median Household Size in Fuller Heights
The median household size in Fuller Heights is 3.03 persons per household, with single male/father households (188 | 5.0%) accounting for the largest median household size of 5.82 persons per household. non-family households (1,020 | 27.0%) represent the smallest median household size with 1.37 persons per household.
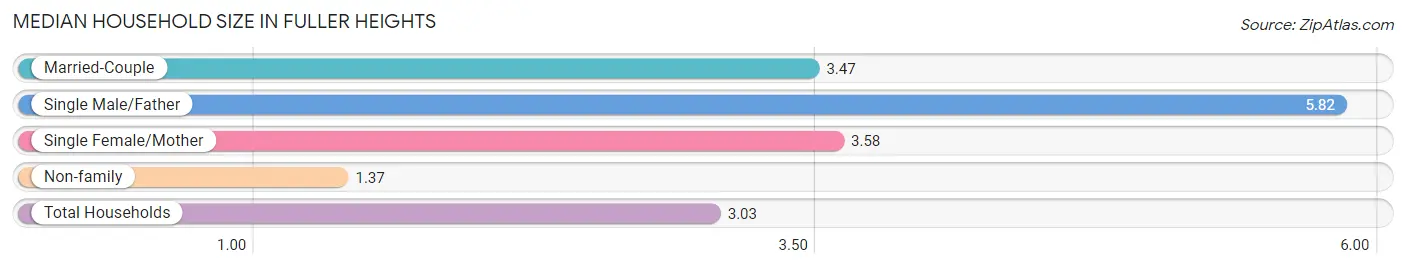
| Household Type | # Households | Household Size |
| Married-Couple | 2,196 (58.1%) | 3.47 |
| Single Male/Father | 188 (5.0%) | 5.82 |
| Single Female/Mother | 378 (10.0%) | 3.58 |
| Non-family | 1,020 (27.0%) | 1.37 |
| Total Households | 3,782 (100.0%) | 3.03 |
Household Size by Marriage Status in Fuller Heights
Out of a total of 3,782 households in Fuller Heights, 2,762 (73.0%) are family households, while 1,020 (27.0%) are nonfamily households. The most numerous type of family households are 2-person households, comprising 966, and the most common type of nonfamily households are 1-person households, comprising 713.
| Household Size | Family Households | Nonfamily Households |
| 1-Person Households | - | 713 (18.9%) |
| 2-Person Households | 966 (25.5%) | 300 (7.9%) |
| 3-Person Households | 477 (12.6%) | 0 (0.0%) |
| 4-Person Households | 931 (24.6%) | 7 (0.2%) |
| 5-Person Households | 216 (5.7%) | 0 (0.0%) |
| 6-Person Households | 47 (1.2%) | 0 (0.0%) |
| 7+ Person Households | 125 (3.3%) | 0 (0.0%) |
| Total | 2,762 (73.0%) | 1,020 (27.0%) |
Female Fertility in Fuller Heights
Fertility by Age in Fuller Heights
Average fertility rate in Fuller Heights is 59.0 births per 1,000 women. Women in the age bracket of 35 to 50 years have the highest fertility rate with 107.0 births per 1,000 women. Women in the age bracket of 35 to 50 years acount for 57.5% of all women with births.
| Age Bracket | Women with Births | Births / 1,000 Women |
| 15 to 19 years | 0 (0.0%) | 0.0 |
| 20 to 34 years | 74 (42.5%) | 47.0 |
| 35 to 50 years | 100 (57.5%) | 107.0 |
| Total | 174 (100.0%) | 59.0 |
Fertility by Age by Marriage Status in Fuller Heights
9.2% of women with births (174) in Fuller Heights are married. The highest percentage of unmarried women with births falls into 35 to 50 years age bracket with 100.0% of them unmarried at the time of birth, while the lowest percentage of unmarried women with births belong to 20 to 34 years age bracket with 78.4% of them unmarried.
| Age Bracket | Married | Unmarried |
| 15 to 19 years | 0 (0.0%) | 0 (0.0%) |
| 20 to 34 years | 16 (21.6%) | 58 (78.4%) |
| 35 to 50 years | 0 (0.0%) | 100 (100.0%) |
| Total | 16 (9.2%) | 158 (90.8%) |
Fertility by Education in Fuller Heights
| Educational Attainment | Women with Births | Births / 1,000 Women |
| Less than High School | 0 (0.0%) | 0.0 |
| High School Diploma | 16 (9.2%) | 40.0 |
| College or Associate's Degree | 58 (33.3%) | 41.0 |
| Bachelor's Degree | 100 (57.5%) | 239.0 |
| Graduate Degree | 0 (0.0%) | 0.0 |
| Total | 174 (100.0%) | 59.0 |
Fertility by Education by Marriage Status in Fuller Heights
90.8% of women with births in Fuller Heights are unmarried. Women with the educational attainment of high school diploma are most likely to be married with 100.0% of them married at childbirth, while women with the educational attainment of college or associate's degree are least likely to be married with 100.0% of them unmarried at childbirth.
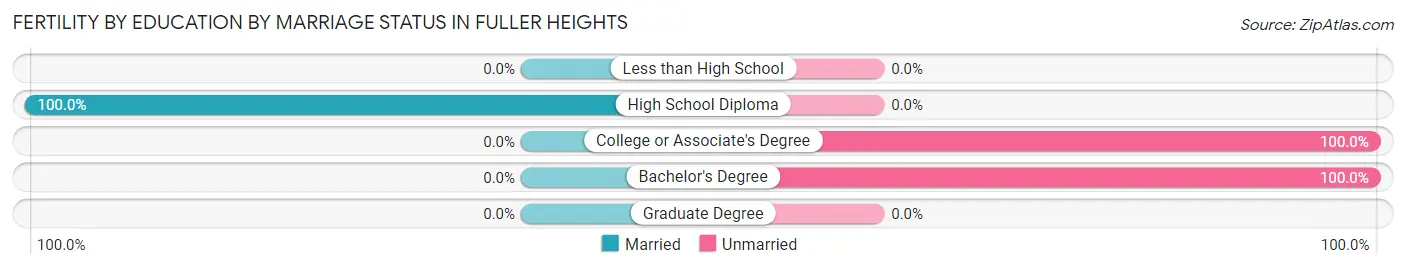
| Educational Attainment | Married | Unmarried |
| Less than High School | 0 (0.0%) | 0 (0.0%) |
| High School Diploma | 16 (100.0%) | 0 (0.0%) |
| College or Associate's Degree | 0 (0.0%) | 58 (100.0%) |
| Bachelor's Degree | 0 (0.0%) | 100 (100.0%) |
| Graduate Degree | 0 (0.0%) | 0 (0.0%) |
| Total | 16 (9.2%) | 158 (90.8%) |
Employment Characteristics in Fuller Heights
Employment by Class of Employer in Fuller Heights
Among the 5,987 employed individuals in Fuller Heights, private company employees (5,077 | 84.8%), local government employees (243 | 4.1%), and self-employed (not incorporated) (241 | 4.0%) make up the most common classes of employment.
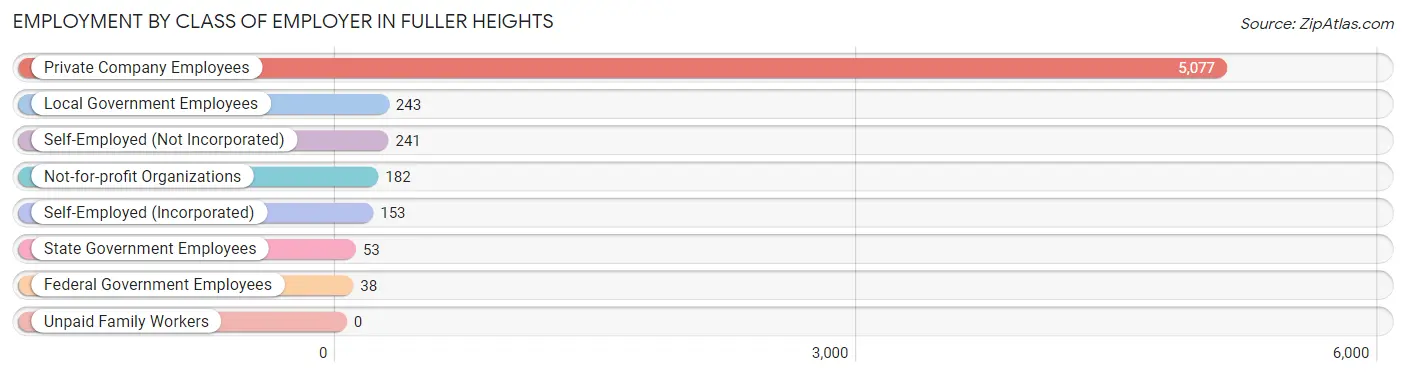
| Employer Class | # Employees | % Employees |
| Private Company Employees | 5,077 | 84.8% |
| Self-Employed (Incorporated) | 153 | 2.6% |
| Self-Employed (Not Incorporated) | 241 | 4.0% |
| Not-for-profit Organizations | 182 | 3.0% |
| Local Government Employees | 243 | 4.1% |
| State Government Employees | 53 | 0.9% |
| Federal Government Employees | 38 | 0.6% |
| Unpaid Family Workers | 0 | 0.0% |
| Total | 5,987 | 100.0% |
Employment Status by Age in Fuller Heights
According to the labor force statistics for Fuller Heights, out of the total population over 16 years of age (8,948), 69.9% or 6,255 individuals are in the labor force, with 3.8% or 238 of them unemployed. The age group with the highest labor force participation rate is 35 to 44 years, with 93.1% or 1,139 individuals in the labor force. Within the labor force, the 16 to 19 years age range has the highest percentage of unemployed individuals, with 13.9% or 62 of them being unemployed.
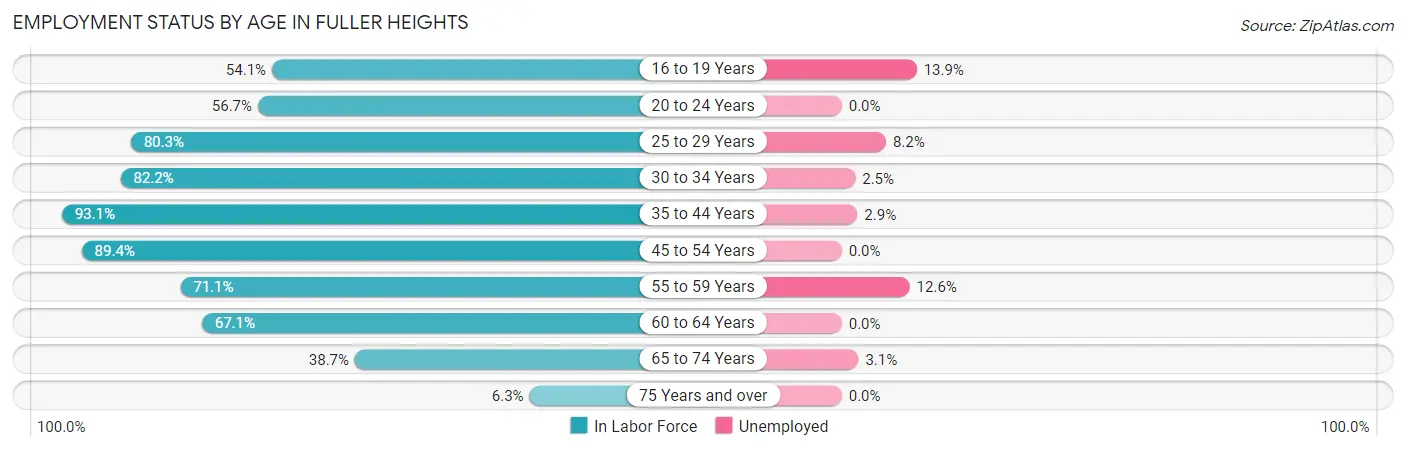
| Age Bracket | In Labor Force | Unemployed |
| 16 to 19 Years | 447 (54.1%) | 62 (13.9%) |
| 20 to 24 Years | 453 (56.7%) | 0 (0.0%) |
| 25 to 29 Years | 635 (80.3%) | 52 (8.2%) |
| 30 to 34 Years | 1,504 (82.2%) | 38 (2.5%) |
| 35 to 44 Years | 1,139 (93.1%) | 33 (2.9%) |
| 45 to 54 Years | 1,083 (89.4%) | 0 (0.0%) |
| 55 to 59 Years | 293 (71.1%) | 37 (12.6%) |
| 60 to 64 Years | 235 (67.1%) | 0 (0.0%) |
| 65 to 74 Years | 447 (38.7%) | 14 (3.1%) |
| 75 Years and over | 22 (6.3%) | 0 (0.0%) |
| Total | 6,255 (69.9%) | 238 (3.8%) |
Employment Status by Educational Attainment in Fuller Heights
According to labor force statistics for Fuller Heights, 84.1% of individuals (4,892) out of the total population between 25 and 64 years of age (5,817) are in the labor force, with 3.3% or 161 of them being unemployed. The group with the highest labor force participation rate are those with the educational attainment of bachelor's degree or higher, with 95.2% or 879 individuals in the labor force. Within the labor force, individuals with college / associate degree education have the highest percentage of unemployment, with 5.9% or 126 of them being unemployed.
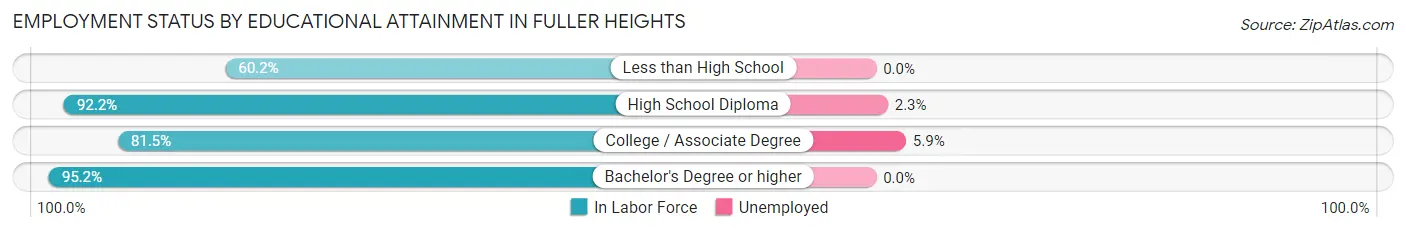
| Educational Attainment | In Labor Force | Unemployed |
| Less than High School | 416 (60.2%) | 0 (0.0%) |
| High School Diploma | 1,456 (92.2%) | 36 (2.3%) |
| College / Associate Degree | 2,139 (81.5%) | 155 (5.9%) |
| Bachelor's Degree or higher | 879 (95.2%) | 0 (0.0%) |
| Total | 4,892 (84.1%) | 192 (3.3%) |
Employment Occupations by Sex in Fuller Heights
Management, Business, Science and Arts Occupations
The most common Management, Business, Science and Arts occupations in Fuller Heights are Management (424 | 7.0%), Community & Social Service (314 | 5.2%), Health Diagnosing & Treating (174 | 2.9%), Business & Financial (156 | 2.6%), and Education Instruction & Library (145 | 2.4%).
Management, Business, Science and Arts Occupations by Sex
Within the Management, Business, Science and Arts occupations in Fuller Heights, the most male-oriented occupations are Computers & Mathematics (100.0%), Life, Physical & Social Science (100.0%), and Computers, Engineering & Science (73.7%), while the most female-oriented occupations are Education, Arts & Media (100.0%), Education Instruction & Library (90.3%), and Business & Financial (78.8%).
| Occupation | Male | Female |
| Management | 243 (57.3%) | 181 (42.7%) |
| Business & Financial | 33 (21.1%) | 123 (78.8%) |
| Computers, Engineering & Science | 101 (73.7%) | 36 (26.3%) |
| Computers & Mathematics | 56 (100.0%) | 0 (0.0%) |
| Architecture & Engineering | 18 (33.3%) | 36 (66.7%) |
| Life, Physical & Social Science | 27 (100.0%) | 0 (0.0%) |
| Community & Social Service | 70 (22.3%) | 244 (77.7%) |
| Education, Arts & Media | 0 (0.0%) | 74 (100.0%) |
| Legal Services & Support | 45 (71.4%) | 18 (28.6%) |
| Education Instruction & Library | 14 (9.7%) | 131 (90.3%) |
| Arts, Media & Entertainment | 11 (34.4%) | 21 (65.6%) |
| Health Diagnosing & Treating | 44 (25.3%) | 130 (74.7%) |
| Health Technologists | 36 (37.9%) | 59 (62.1%) |
| Total (Category) | 491 (40.7%) | 714 (59.3%) |
| Total (Overall) | 3,237 (53.7%) | 2,786 (46.3%) |
Services Occupations
The most common Services occupations in Fuller Heights are Personal Care & Service (353 | 5.9%), Food Preparation & Serving (216 | 3.6%), Healthcare Support (126 | 2.1%), Cleaning & Maintenance (114 | 1.9%), and Security & Protection (109 | 1.8%).
Services Occupations by Sex
Within the Services occupations in Fuller Heights, the most male-oriented occupations are Firefighting & Prevention (100.0%), Cleaning & Maintenance (93.0%), and Security & Protection (53.2%), while the most female-oriented occupations are Healthcare Support (100.0%), Law Enforcement (100.0%), and Personal Care & Service (93.5%).
| Occupation | Male | Female |
| Healthcare Support | 0 (0.0%) | 126 (100.0%) |
| Security & Protection | 58 (53.2%) | 51 (46.8%) |
| Firefighting & Prevention | 58 (100.0%) | 0 (0.0%) |
| Law Enforcement | 0 (0.0%) | 51 (100.0%) |
| Food Preparation & Serving | 59 (27.3%) | 157 (72.7%) |
| Cleaning & Maintenance | 106 (93.0%) | 8 (7.0%) |
| Personal Care & Service | 23 (6.5%) | 330 (93.5%) |
| Total (Category) | 246 (26.8%) | 672 (73.2%) |
| Total (Overall) | 3,237 (53.7%) | 2,786 (46.3%) |
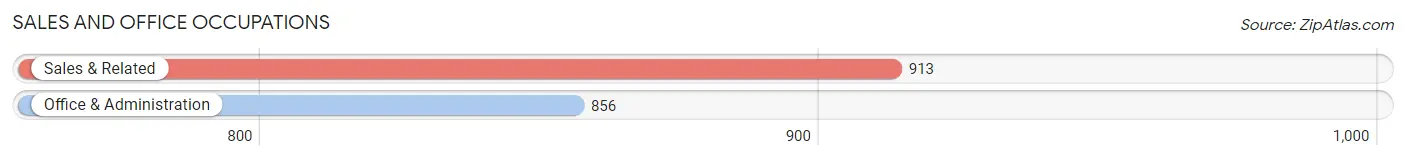
Sales and Office Occupations
The most common Sales and Office occupations in Fuller Heights are Sales & Related (913 | 15.2%), and Office & Administration (856 | 14.2%).
Sales and Office Occupations by Sex
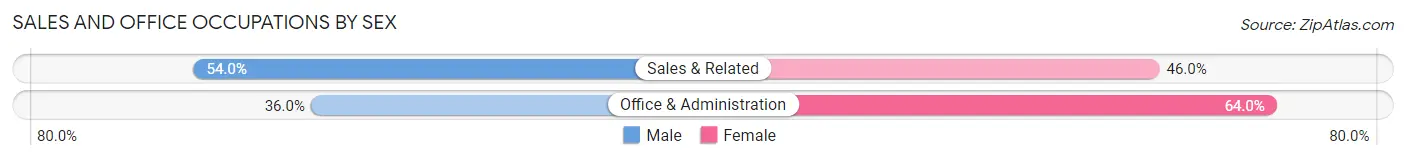
| Occupation | Male | Female |
| Sales & Related | 493 (54.0%) | 420 (46.0%) |
| Office & Administration | 308 (36.0%) | 548 (64.0%) |
| Total (Category) | 801 (45.3%) | 968 (54.7%) |
| Total (Overall) | 3,237 (53.7%) | 2,786 (46.3%) |
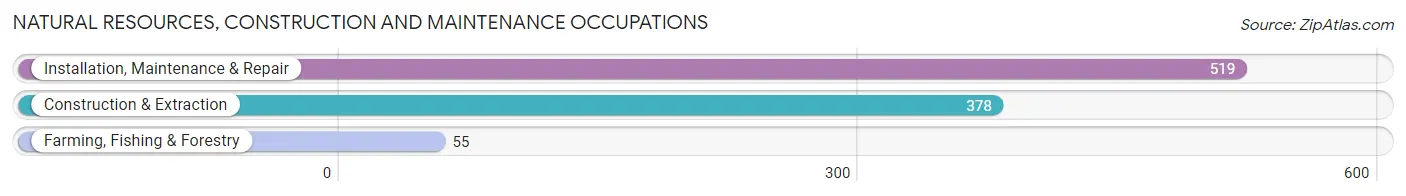
Natural Resources, Construction and Maintenance Occupations
The most common Natural Resources, Construction and Maintenance occupations in Fuller Heights are Installation, Maintenance & Repair (519 | 8.6%), Construction & Extraction (378 | 6.3%), and Farming, Fishing & Forestry (55 | 0.9%).
Natural Resources, Construction and Maintenance Occupations by Sex
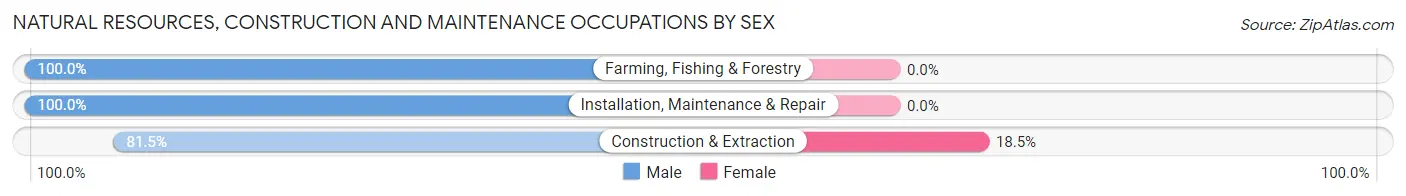
| Occupation | Male | Female |
| Farming, Fishing & Forestry | 55 (100.0%) | 0 (0.0%) |
| Construction & Extraction | 308 (81.5%) | 70 (18.5%) |
| Installation, Maintenance & Repair | 519 (100.0%) | 0 (0.0%) |
| Total (Category) | 882 (92.6%) | 70 (7.3%) |
| Total (Overall) | 3,237 (53.7%) | 2,786 (46.3%) |
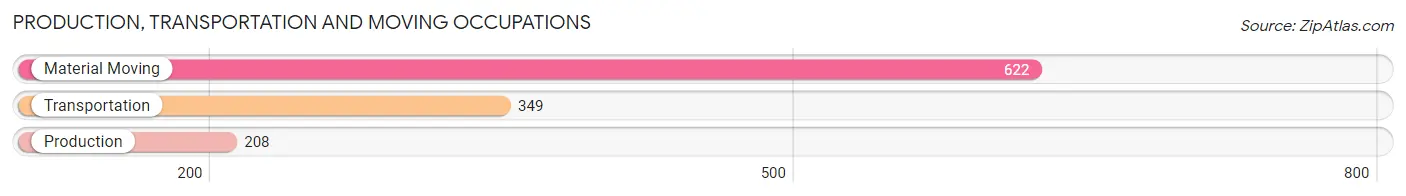
Production, Transportation and Moving Occupations
The most common Production, Transportation and Moving occupations in Fuller Heights are Material Moving (622 | 10.3%), Transportation (349 | 5.8%), and Production (208 | 3.5%).
Production, Transportation and Moving Occupations by Sex
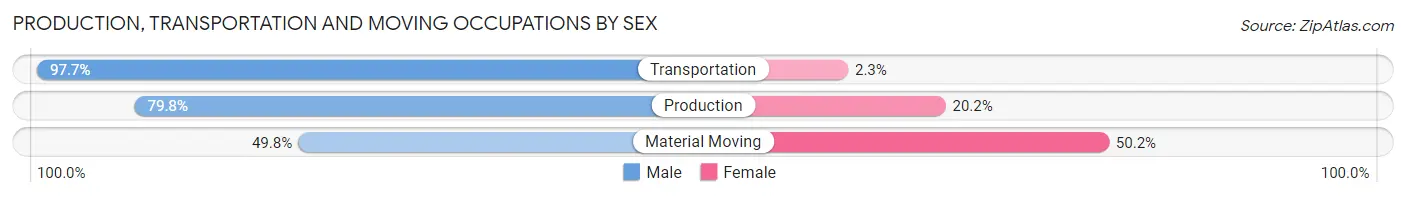
| Occupation | Male | Female |
| Production | 166 (79.8%) | 42 (20.2%) |
| Transportation | 341 (97.7%) | 8 (2.3%) |
| Material Moving | 310 (49.8%) | 312 (50.2%) |
| Total (Category) | 817 (69.3%) | 362 (30.7%) |
| Total (Overall) | 3,237 (53.7%) | 2,786 (46.3%) |
Employment Industries by Sex in Fuller Heights
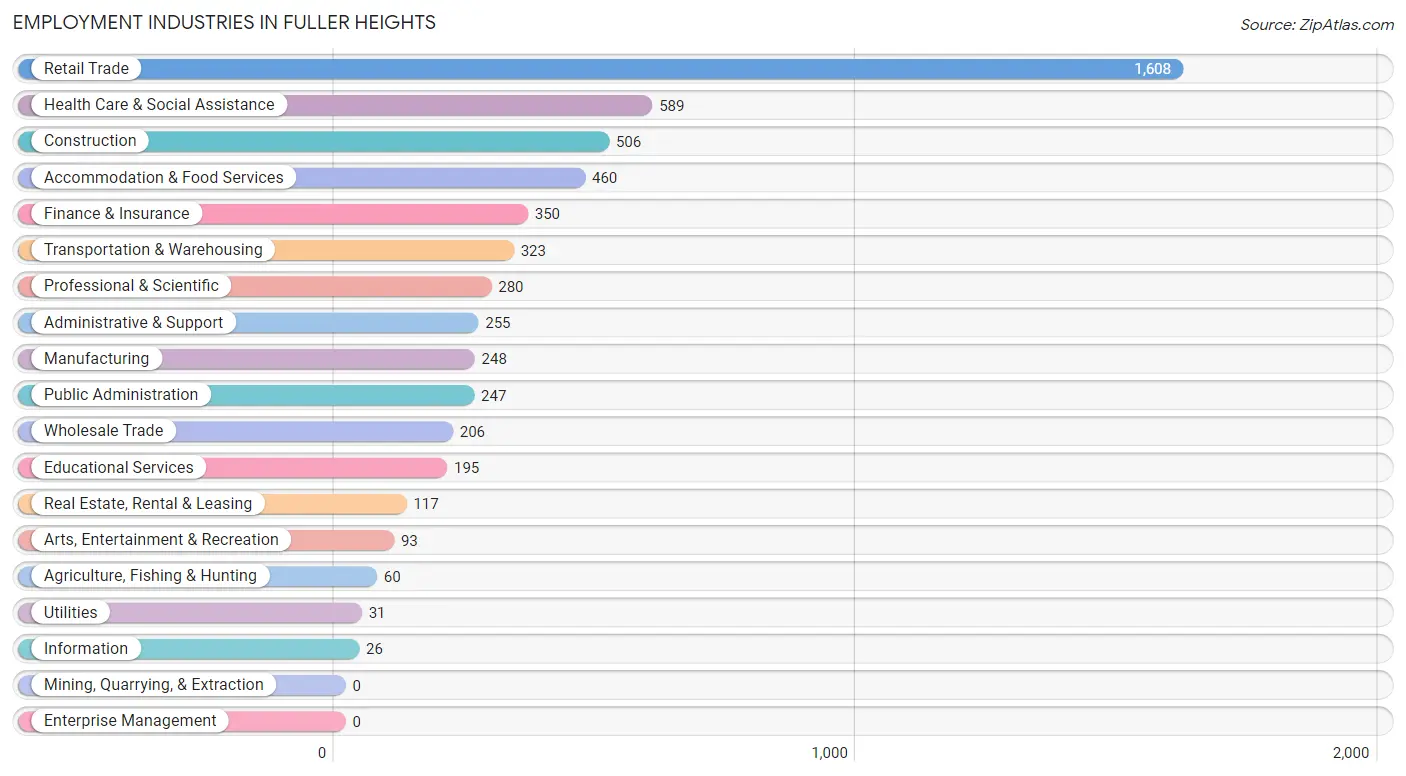
Employment Industries in Fuller Heights
The major employment industries in Fuller Heights include Retail Trade (1,608 | 26.7%), Health Care & Social Assistance (589 | 9.8%), Construction (506 | 8.4%), Accommodation & Food Services (460 | 7.6%), and Finance & Insurance (350 | 5.8%).
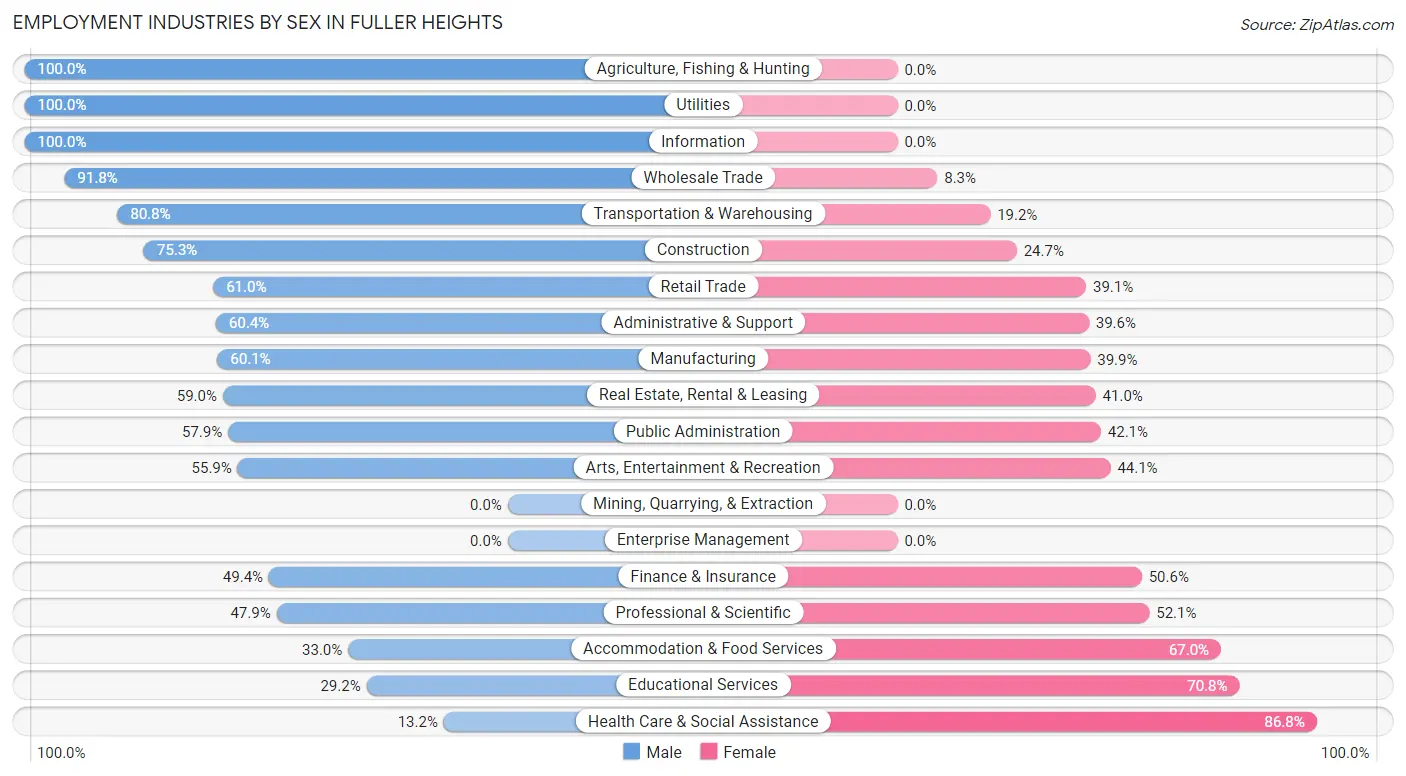
Employment Industries by Sex in Fuller Heights
The Fuller Heights industries that see more men than women are Agriculture, Fishing & Hunting (100.0%), Utilities (100.0%), and Information (100.0%), whereas the industries that tend to have a higher number of women are Health Care & Social Assistance (86.8%), Educational Services (70.8%), and Accommodation & Food Services (67.0%).
| Industry | Male | Female |
| Agriculture, Fishing & Hunting | 60 (100.0%) | 0 (0.0%) |
| Mining, Quarrying, & Extraction | 0 (0.0%) | 0 (0.0%) |
| Construction | 381 (75.3%) | 125 (24.7%) |
| Manufacturing | 149 (60.1%) | 99 (39.9%) |
| Wholesale Trade | 189 (91.7%) | 17 (8.3%) |
| Retail Trade | 980 (61.0%) | 628 (39.1%) |
| Transportation & Warehousing | 261 (80.8%) | 62 (19.2%) |
| Utilities | 31 (100.0%) | 0 (0.0%) |
| Information | 26 (100.0%) | 0 (0.0%) |
| Finance & Insurance | 173 (49.4%) | 177 (50.6%) |
| Real Estate, Rental & Leasing | 69 (59.0%) | 48 (41.0%) |
| Professional & Scientific | 134 (47.9%) | 146 (52.1%) |
| Enterprise Management | 0 (0.0%) | 0 (0.0%) |
| Administrative & Support | 154 (60.4%) | 101 (39.6%) |
| Educational Services | 57 (29.2%) | 138 (70.8%) |
| Health Care & Social Assistance | 78 (13.2%) | 511 (86.8%) |
| Arts, Entertainment & Recreation | 52 (55.9%) | 41 (44.1%) |
| Accommodation & Food Services | 152 (33.0%) | 308 (67.0%) |
| Public Administration | 143 (57.9%) | 104 (42.1%) |
| Total | 3,237 (53.7%) | 2,786 (46.3%) |
Education in Fuller Heights
School Enrollment in Fuller Heights
The most common levels of schooling among the 2,976 students in Fuller Heights are high school (767 | 25.8%), elementary school (621 | 20.9%), and college / undergraduate (583 | 19.6%).
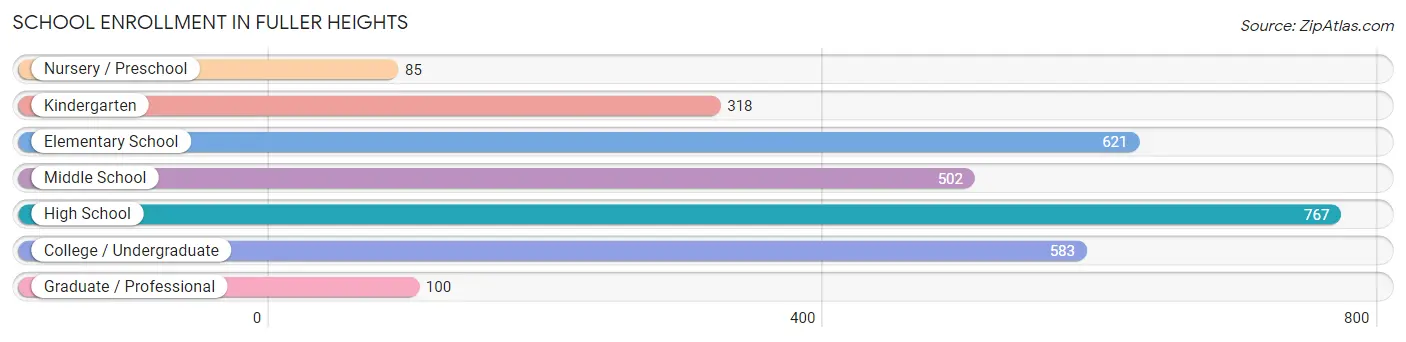
| School Level | # Students | % Students |
| Nursery / Preschool | 85 | 2.9% |
| Kindergarten | 318 | 10.7% |
| Elementary School | 621 | 20.9% |
| Middle School | 502 | 16.9% |
| High School | 767 | 25.8% |
| College / Undergraduate | 583 | 19.6% |
| Graduate / Professional | 100 | 3.4% |
| Total | 2,976 | 100.0% |
School Enrollment by Age by Funding Source in Fuller Heights
Out of a total of 2,976 students who are enrolled in schools in Fuller Heights, 705 (23.7%) attend a private institution, while the remaining 2,271 (76.3%) are enrolled in public schools. The age group of 35 years and over has the highest likelihood of being enrolled in private schools, with 64 (66.7% in the age bracket) enrolled. Conversely, the age group of 3 to 4 year olds has the lowest likelihood of being enrolled in a private school, with 106 (100.0% in the age bracket) attending a public institution.
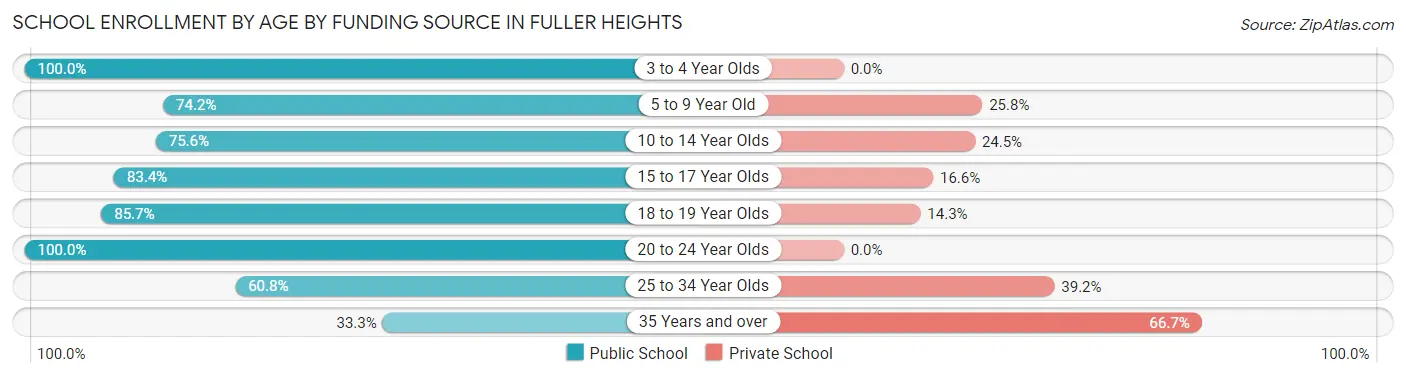
| Age Bracket | Public School | Private School |
| 3 to 4 Year Olds | 106 (100.0%) | 0 (0.0%) |
| 5 to 9 Year Old | 592 (74.2%) | 206 (25.8%) |
| 10 to 14 Year Olds | 584 (75.5%) | 189 (24.4%) |
| 15 to 17 Year Olds | 451 (83.4%) | 90 (16.6%) |
| 18 to 19 Year Olds | 126 (85.7%) | 21 (14.3%) |
| 20 to 24 Year Olds | 171 (100.0%) | 0 (0.0%) |
| 25 to 34 Year Olds | 209 (60.8%) | 135 (39.2%) |
| 35 Years and over | 32 (33.3%) | 64 (66.7%) |
| Total | 2,271 (76.3%) | 705 (23.7%) |
Educational Attainment by Field of Study in Fuller Heights
Business (450 | 37.2%), education (123 | 10.2%), engineering (119 | 9.8%), communications (115 | 9.5%), and computers & mathematics (99 | 8.2%) are the most common fields of study among 1,210 individuals in Fuller Heights who have obtained a bachelor's degree or higher.
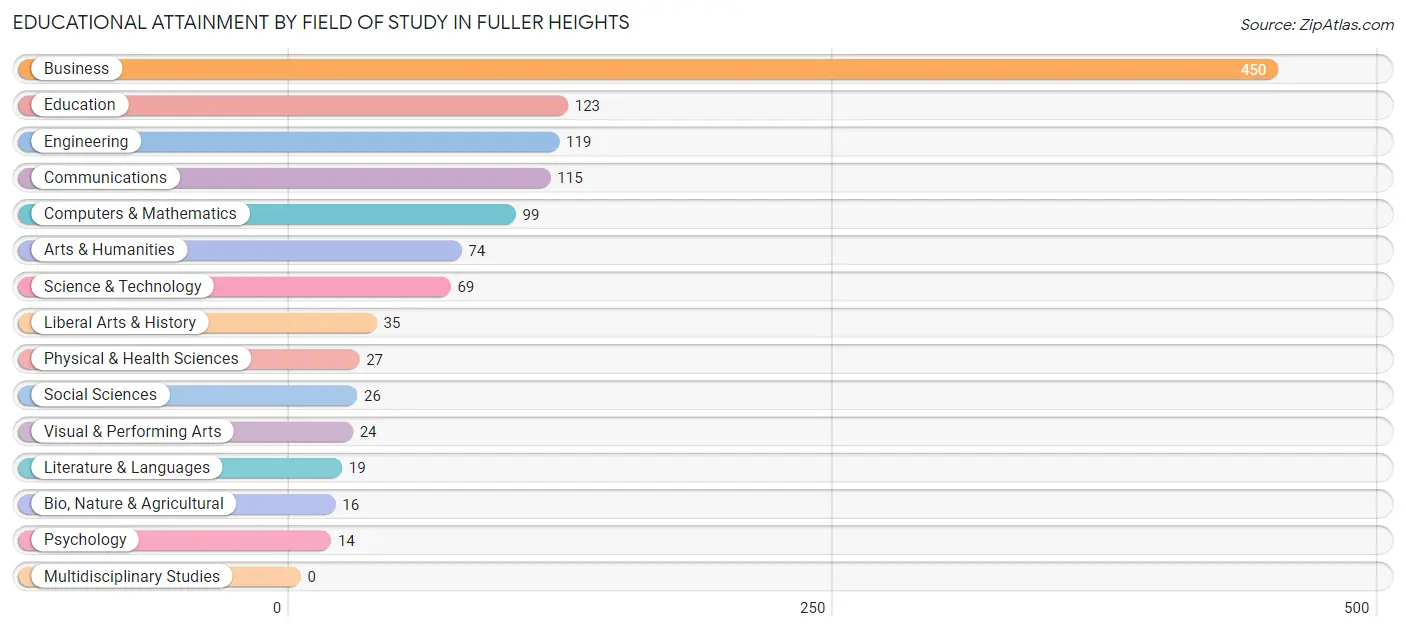
| Field of Study | # Graduates | % Graduates |
| Computers & Mathematics | 99 | 8.2% |
| Bio, Nature & Agricultural | 16 | 1.3% |
| Physical & Health Sciences | 27 | 2.2% |
| Psychology | 14 | 1.2% |
| Social Sciences | 26 | 2.1% |
| Engineering | 119 | 9.8% |
| Multidisciplinary Studies | 0 | 0.0% |
| Science & Technology | 69 | 5.7% |
| Business | 450 | 37.2% |
| Education | 123 | 10.2% |
| Literature & Languages | 19 | 1.6% |
| Liberal Arts & History | 35 | 2.9% |
| Visual & Performing Arts | 24 | 2.0% |
| Communications | 115 | 9.5% |
| Arts & Humanities | 74 | 6.1% |
| Total | 1,210 | 100.0% |
Transportation & Commute in Fuller Heights
Vehicle Availability by Sex in Fuller Heights
The most prevalent vehicle ownership categories in Fuller Heights are males with 2 vehicles (1,968, accounting for 61.1%) and females with 2 vehicles (1,742, making up 71.1%).
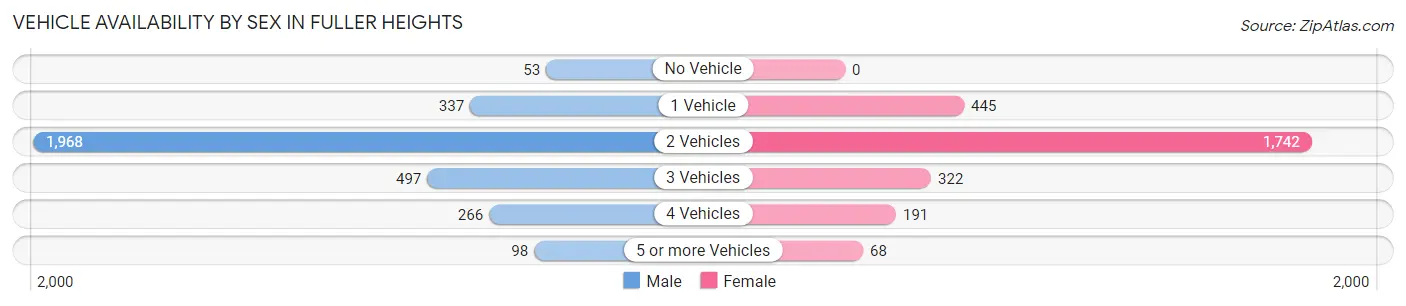
| Vehicles Available | Male | Female |
| No Vehicle | 53 (1.7%) | 0 (0.0%) |
| 1 Vehicle | 337 (10.5%) | 445 (16.1%) |
| 2 Vehicles | 1,968 (61.1%) | 1,742 (62.9%) |
| 3 Vehicles | 497 (15.4%) | 322 (11.6%) |
| 4 Vehicles | 266 (8.3%) | 191 (6.9%) |
| 5 or more Vehicles | 98 (3.0%) | 68 (2.5%) |
| Total | 3,219 (100.0%) | 2,768 (100.0%) |
Commute Time in Fuller Heights
The most frequently occuring commute durations in Fuller Heights are 30 to 34 minutes (1,181 commuters, 21.7%), 15 to 19 minutes (1,000 commuters, 18.4%), and 20 to 24 minutes (759 commuters, 14.0%).
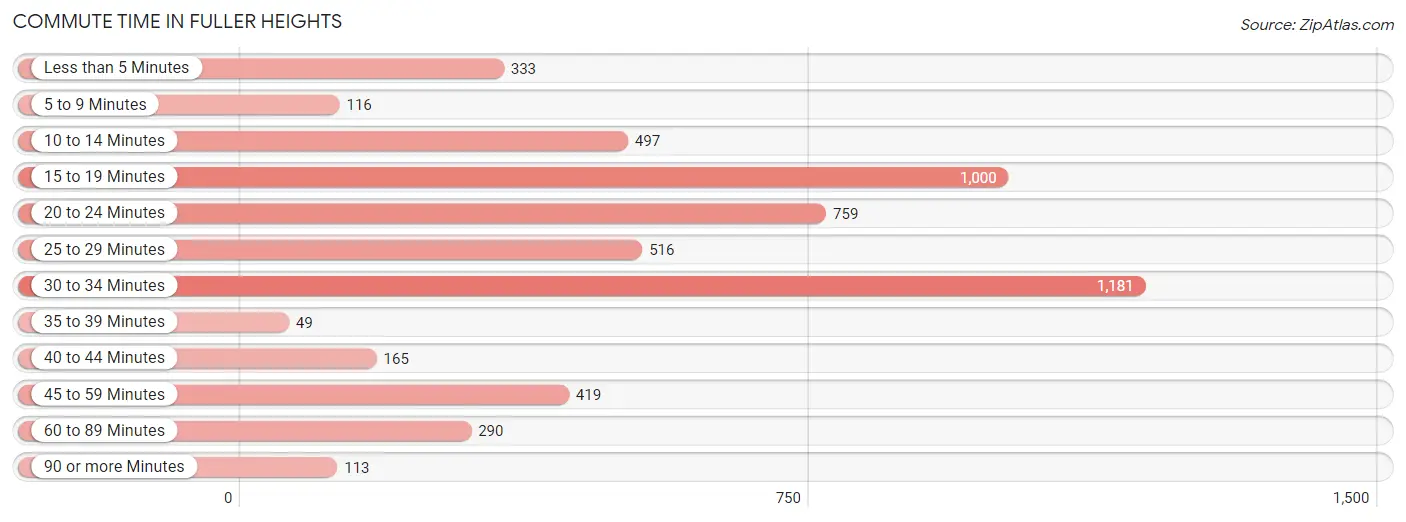
| Commute Time | # Commuters | % Commuters |
| Less than 5 Minutes | 333 | 6.1% |
| 5 to 9 Minutes | 116 | 2.1% |
| 10 to 14 Minutes | 497 | 9.1% |
| 15 to 19 Minutes | 1,000 | 18.4% |
| 20 to 24 Minutes | 759 | 14.0% |
| 25 to 29 Minutes | 516 | 9.5% |
| 30 to 34 Minutes | 1,181 | 21.7% |
| 35 to 39 Minutes | 49 | 0.9% |
| 40 to 44 Minutes | 165 | 3.0% |
| 45 to 59 Minutes | 419 | 7.7% |
| 60 to 89 Minutes | 290 | 5.3% |
| 90 or more Minutes | 113 | 2.1% |
Commute Time by Sex in Fuller Heights
The most common commute times in Fuller Heights are 15 to 19 minutes (646 commuters, 21.3%) for males and 30 to 34 minutes (546 commuters, 22.7%) for females.
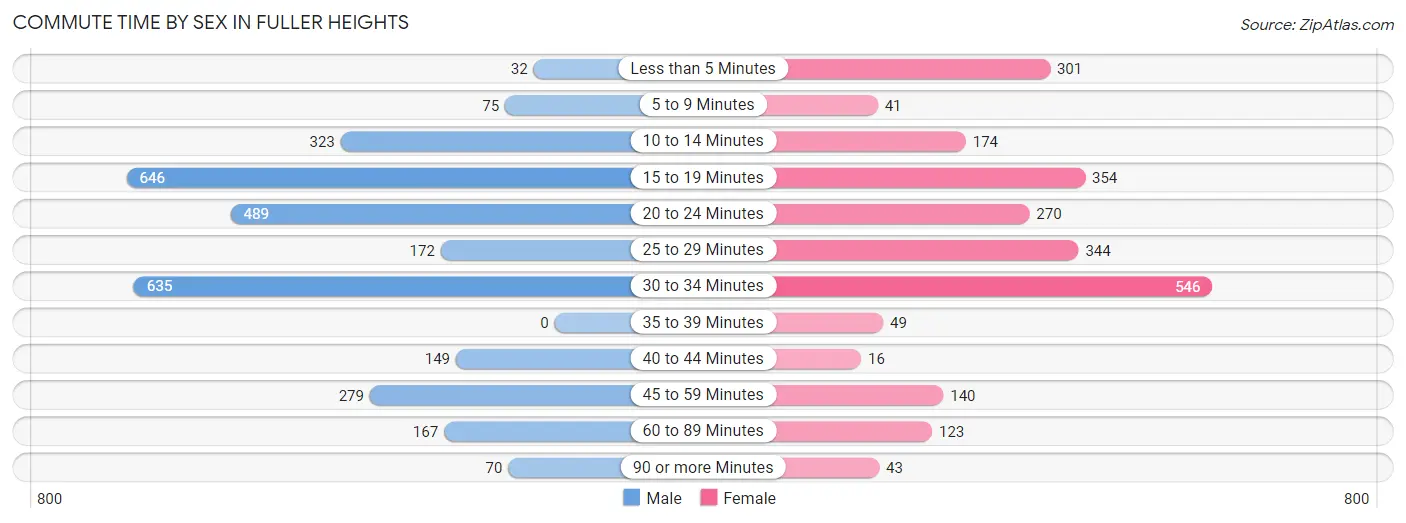
| Commute Time | Male | Female |
| Less than 5 Minutes | 32 (1.1%) | 301 (12.5%) |
| 5 to 9 Minutes | 75 (2.5%) | 41 (1.7%) |
| 10 to 14 Minutes | 323 (10.6%) | 174 (7.2%) |
| 15 to 19 Minutes | 646 (21.3%) | 354 (14.7%) |
| 20 to 24 Minutes | 489 (16.1%) | 270 (11.3%) |
| 25 to 29 Minutes | 172 (5.7%) | 344 (14.3%) |
| 30 to 34 Minutes | 635 (20.9%) | 546 (22.7%) |
| 35 to 39 Minutes | 0 (0.0%) | 49 (2.0%) |
| 40 to 44 Minutes | 149 (4.9%) | 16 (0.7%) |
| 45 to 59 Minutes | 279 (9.2%) | 140 (5.8%) |
| 60 to 89 Minutes | 167 (5.5%) | 123 (5.1%) |
| 90 or more Minutes | 70 (2.3%) | 43 (1.8%) |
Time of Departure to Work by Sex in Fuller Heights
The most frequent times of departure to work in Fuller Heights are 12:00 AM to 4:59 AM (458, 15.1%) for males and 9:00 AM to 9:59 AM (393, 16.4%) for females.
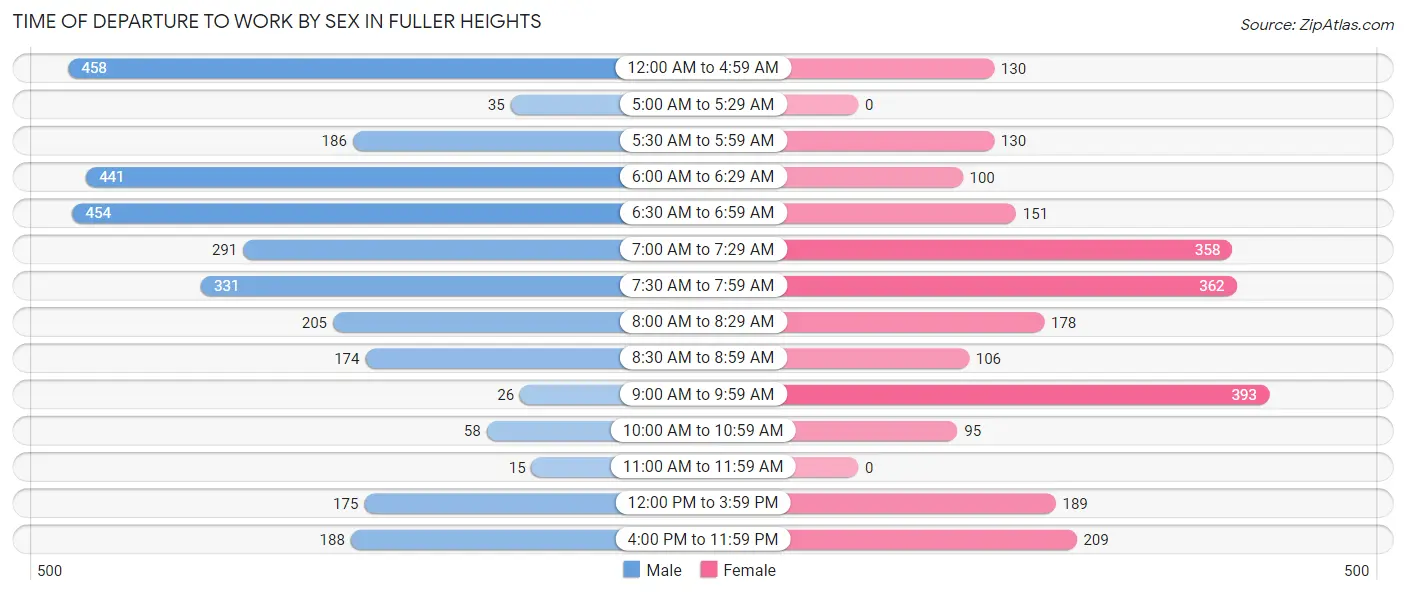
| Time of Departure | Male | Female |
| 12:00 AM to 4:59 AM | 458 (15.1%) | 130 (5.4%) |
| 5:00 AM to 5:29 AM | 35 (1.1%) | 0 (0.0%) |
| 5:30 AM to 5:59 AM | 186 (6.1%) | 130 (5.4%) |
| 6:00 AM to 6:29 AM | 441 (14.5%) | 100 (4.2%) |
| 6:30 AM to 6:59 AM | 454 (14.9%) | 151 (6.3%) |
| 7:00 AM to 7:29 AM | 291 (9.6%) | 358 (14.9%) |
| 7:30 AM to 7:59 AM | 331 (10.9%) | 362 (15.1%) |
| 8:00 AM to 8:29 AM | 205 (6.8%) | 178 (7.4%) |
| 8:30 AM to 8:59 AM | 174 (5.7%) | 106 (4.4%) |
| 9:00 AM to 9:59 AM | 26 (0.9%) | 393 (16.4%) |
| 10:00 AM to 10:59 AM | 58 (1.9%) | 95 (4.0%) |
| 11:00 AM to 11:59 AM | 15 (0.5%) | 0 (0.0%) |
| 12:00 PM to 3:59 PM | 175 (5.8%) | 189 (7.9%) |
| 4:00 PM to 11:59 PM | 188 (6.2%) | 209 (8.7%) |
| Total | 3,037 (100.0%) | 2,401 (100.0%) |
Housing Occupancy in Fuller Heights
Occupancy by Ownership in Fuller Heights
Of the total 3,782 dwellings in Fuller Heights, owner-occupied units account for 2,675 (70.7%), while renter-occupied units make up 1,107 (29.3%).
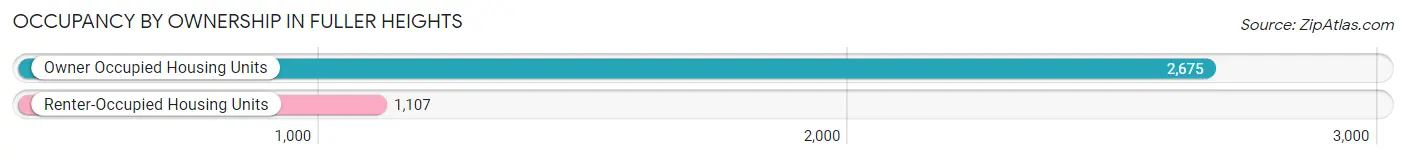
| Occupancy | # Housing Units | % Housing Units |
| Owner Occupied Housing Units | 2,675 | 70.7% |
| Renter-Occupied Housing Units | 1,107 | 29.3% |
| Total Occupied Housing Units | 3,782 | 100.0% |
Occupancy by Household Size in Fuller Heights
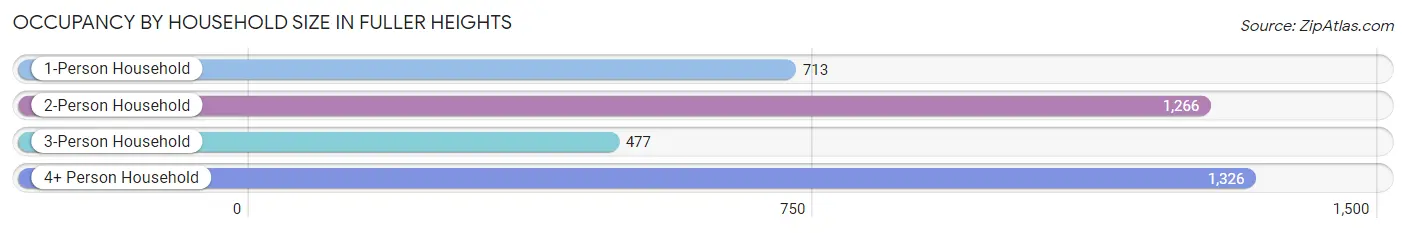
| Household Size | # Housing Units | % Housing Units |
| 1-Person Household | 713 | 18.9% |
| 2-Person Household | 1,266 | 33.5% |
| 3-Person Household | 477 | 12.6% |
| 4+ Person Household | 1,326 | 35.1% |
| Total Housing Units | 3,782 | 100.0% |
Occupancy by Ownership by Household Size in Fuller Heights
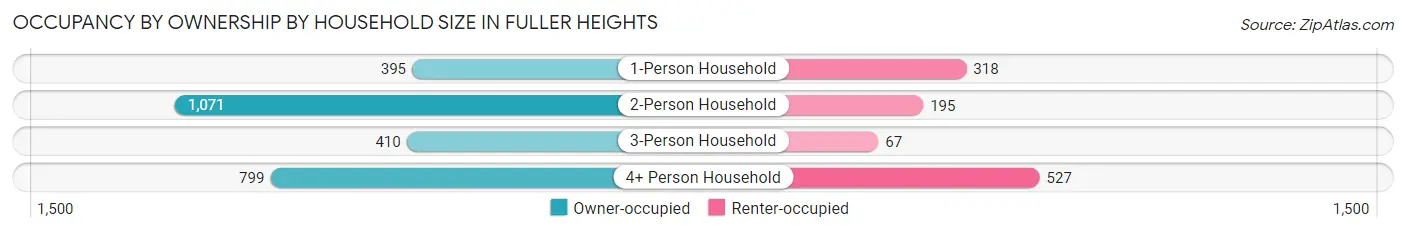
| Household Size | Owner-occupied | Renter-occupied |
| 1-Person Household | 395 (55.4%) | 318 (44.6%) |
| 2-Person Household | 1,071 (84.6%) | 195 (15.4%) |
| 3-Person Household | 410 (86.0%) | 67 (14.1%) |
| 4+ Person Household | 799 (60.3%) | 527 (39.7%) |
| Total Housing Units | 2,675 (70.7%) | 1,107 (29.3%) |
Occupancy by Educational Attainment in Fuller Heights
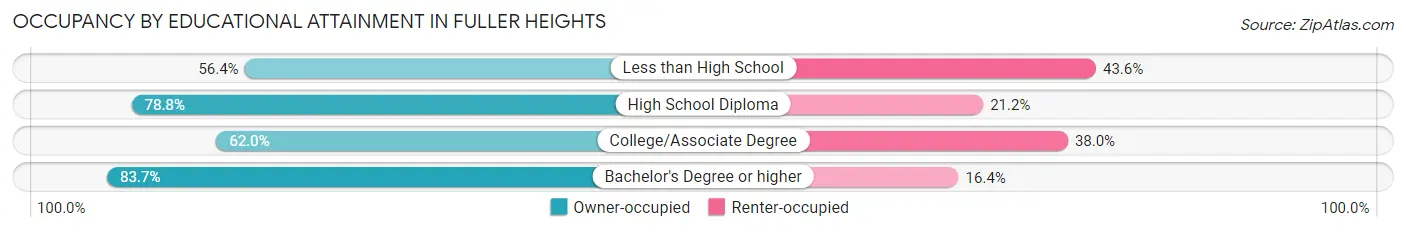
| Household Size | Owner-occupied | Renter-occupied |
| Less than High School | 198 (56.4%) | 153 (43.6%) |
| High School Diploma | 724 (78.8%) | 195 (21.2%) |
| College/Associate Degree | 996 (62.0%) | 611 (38.0%) |
| Bachelor's Degree or higher | 757 (83.7%) | 148 (16.4%) |
Occupancy by Age of Householder in Fuller Heights
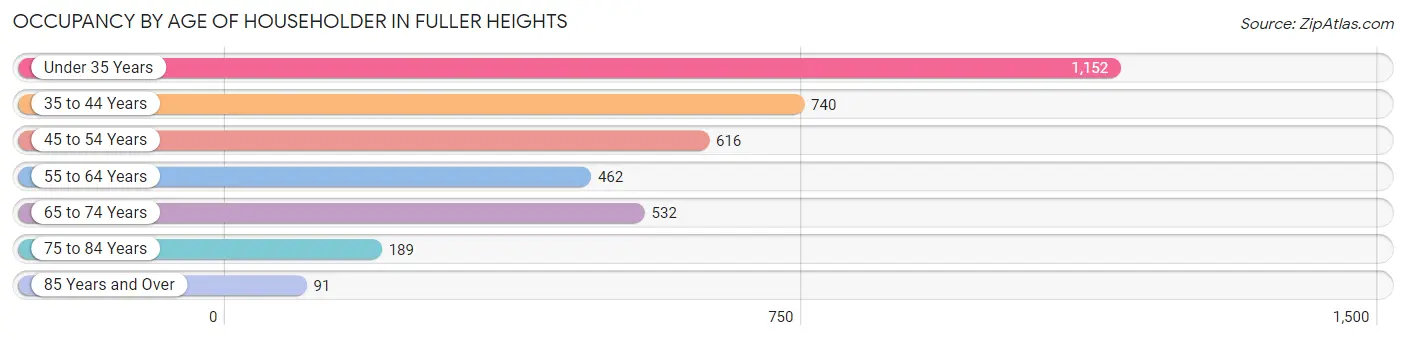
| Age Bracket | # Households | % Households |
| Under 35 Years | 1,152 | 30.5% |
| 35 to 44 Years | 740 | 19.6% |
| 45 to 54 Years | 616 | 16.3% |
| 55 to 64 Years | 462 | 12.2% |
| 65 to 74 Years | 532 | 14.1% |
| 75 to 84 Years | 189 | 5.0% |
| 85 Years and Over | 91 | 2.4% |
| Total | 3,782 | 100.0% |
Housing Finances in Fuller Heights
Median Income by Occupancy in Fuller Heights
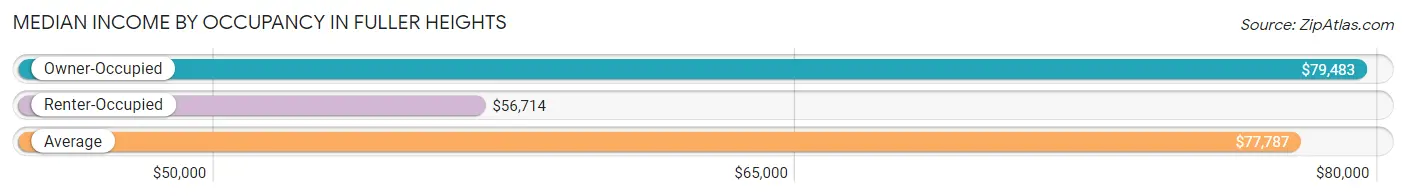
| Occupancy Type | # Households | Median Income |
| Owner-Occupied | 2,675 (70.7%) | $79,483 |
| Renter-Occupied | 1,107 (29.3%) | $56,714 |
| Average | 3,782 (100.0%) | $77,787 |
Occupancy by Householder Income Bracket in Fuller Heights
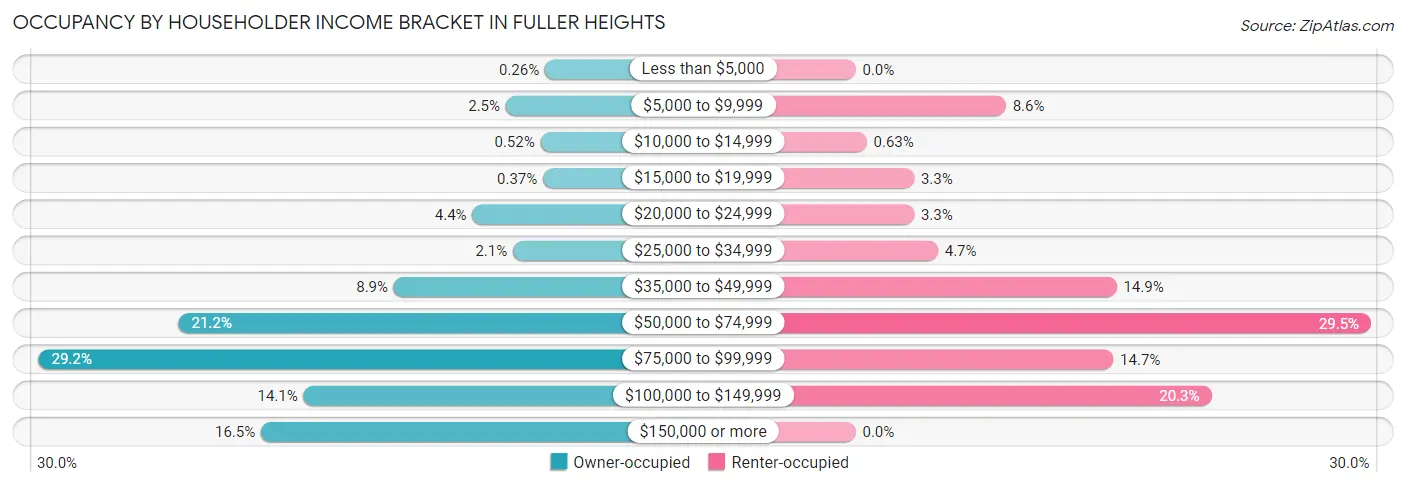
| Income Bracket | Owner-occupied | Renter-occupied |
| Less than $5,000 | 7 (0.3%) | 0 (0.0%) |
| $5,000 to $9,999 | 67 (2.5%) | 95 (8.6%) |
| $10,000 to $14,999 | 14 (0.5%) | 7 (0.6%) |
| $15,000 to $19,999 | 10 (0.4%) | 37 (3.3%) |
| $20,000 to $24,999 | 118 (4.4%) | 37 (3.3%) |
| $25,000 to $34,999 | 56 (2.1%) | 52 (4.7%) |
| $35,000 to $49,999 | 238 (8.9%) | 165 (14.9%) |
| $50,000 to $74,999 | 567 (21.2%) | 326 (29.4%) |
| $75,000 to $99,999 | 781 (29.2%) | 163 (14.7%) |
| $100,000 to $149,999 | 376 (14.1%) | 225 (20.3%) |
| $150,000 or more | 441 (16.5%) | 0 (0.0%) |
| Total | 2,675 (100.0%) | 1,107 (100.0%) |
Monthly Housing Cost Tiers in Fuller Heights
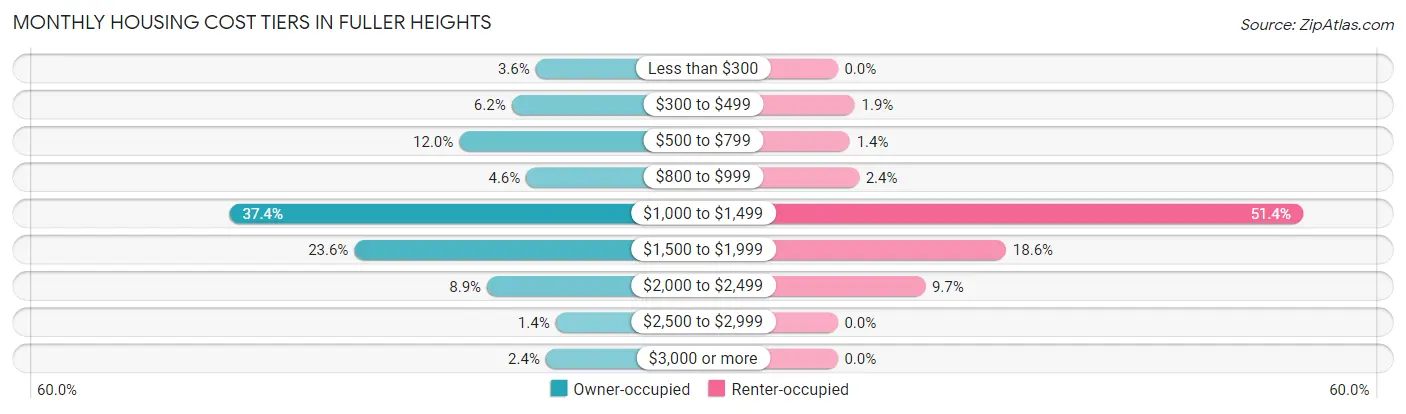
| Monthly Cost | Owner-occupied | Renter-occupied |
| Less than $300 | 95 (3.5%) | 0 (0.0%) |
| $300 to $499 | 166 (6.2%) | 21 (1.9%) |
| $500 to $799 | 321 (12.0%) | 15 (1.4%) |
| $800 to $999 | 123 (4.6%) | 26 (2.4%) |
| $1,000 to $1,499 | 999 (37.3%) | 569 (51.4%) |
| $1,500 to $1,999 | 631 (23.6%) | 206 (18.6%) |
| $2,000 to $2,499 | 239 (8.9%) | 107 (9.7%) |
| $2,500 to $2,999 | 36 (1.3%) | 0 (0.0%) |
| $3,000 or more | 65 (2.4%) | 0 (0.0%) |
| Total | 2,675 (100.0%) | 1,107 (100.0%) |
Physical Housing Characteristics in Fuller Heights
Housing Structures in Fuller Heights
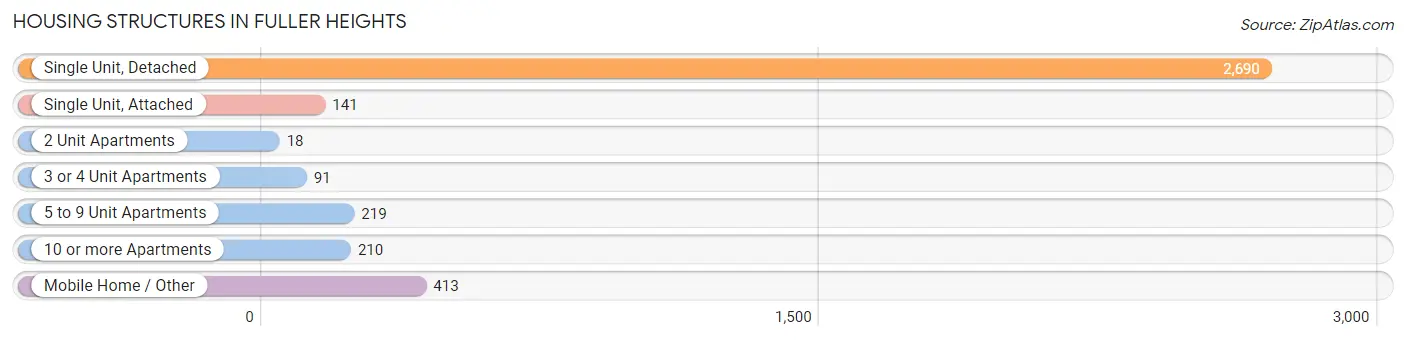
| Structure Type | # Housing Units | % Housing Units |
| Single Unit, Detached | 2,690 | 71.1% |
| Single Unit, Attached | 141 | 3.7% |
| 2 Unit Apartments | 18 | 0.5% |
| 3 or 4 Unit Apartments | 91 | 2.4% |
| 5 to 9 Unit Apartments | 219 | 5.8% |
| 10 or more Apartments | 210 | 5.6% |
| Mobile Home / Other | 413 | 10.9% |
| Total | 3,782 | 100.0% |
Housing Structures by Occupancy in Fuller Heights
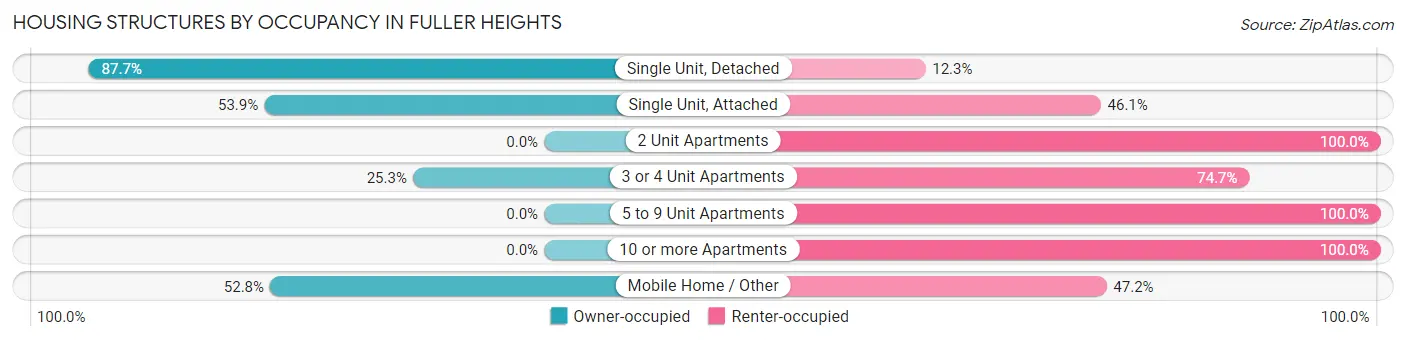
| Structure Type | Owner-occupied | Renter-occupied |
| Single Unit, Detached | 2,358 (87.7%) | 332 (12.3%) |
| Single Unit, Attached | 76 (53.9%) | 65 (46.1%) |
| 2 Unit Apartments | 0 (0.0%) | 18 (100.0%) |
| 3 or 4 Unit Apartments | 23 (25.3%) | 68 (74.7%) |
| 5 to 9 Unit Apartments | 0 (0.0%) | 219 (100.0%) |
| 10 or more Apartments | 0 (0.0%) | 210 (100.0%) |
| Mobile Home / Other | 218 (52.8%) | 195 (47.2%) |
| Total | 2,675 (70.7%) | 1,107 (29.3%) |
Housing Structures by Number of Rooms in Fuller Heights
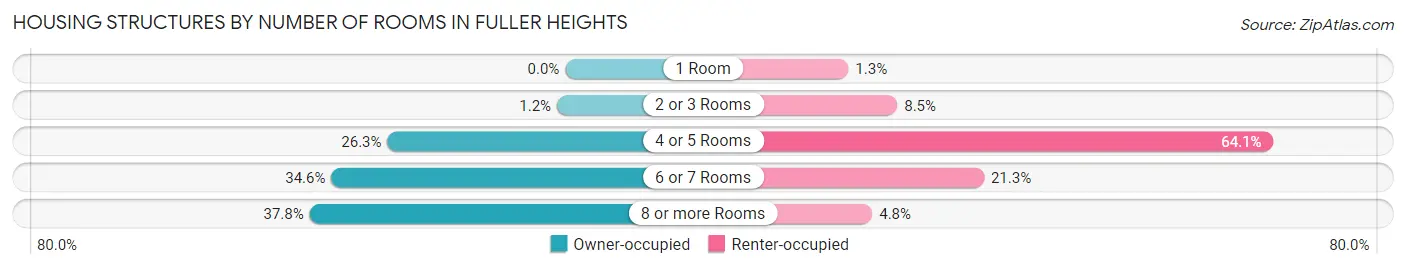
| Number of Rooms | Owner-occupied | Renter-occupied |
| 1 Room | 0 (0.0%) | 14 (1.3%) |
| 2 or 3 Rooms | 33 (1.2%) | 94 (8.5%) |
| 4 or 5 Rooms | 704 (26.3%) | 710 (64.1%) |
| 6 or 7 Rooms | 926 (34.6%) | 236 (21.3%) |
| 8 or more Rooms | 1,012 (37.8%) | 53 (4.8%) |
| Total | 2,675 (100.0%) | 1,107 (100.0%) |
Housing Structure by Heating Type in Fuller Heights
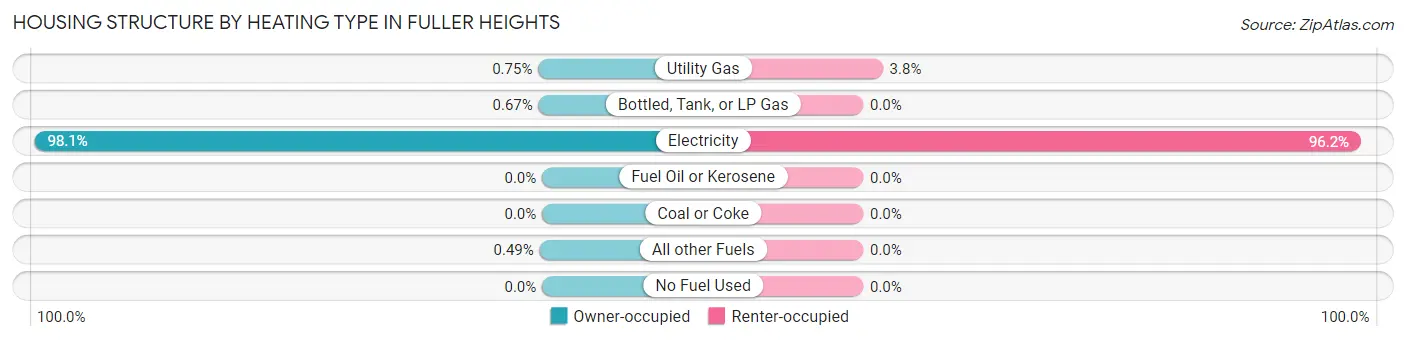
| Heating Type | Owner-occupied | Renter-occupied |
| Utility Gas | 20 (0.7%) | 42 (3.8%) |
| Bottled, Tank, or LP Gas | 18 (0.7%) | 0 (0.0%) |
| Electricity | 2,624 (98.1%) | 1,065 (96.2%) |
| Fuel Oil or Kerosene | 0 (0.0%) | 0 (0.0%) |
| Coal or Coke | 0 (0.0%) | 0 (0.0%) |
| All other Fuels | 13 (0.5%) | 0 (0.0%) |
| No Fuel Used | 0 (0.0%) | 0 (0.0%) |
| Total | 2,675 (100.0%) | 1,107 (100.0%) |
Household Vehicle Usage in Fuller Heights
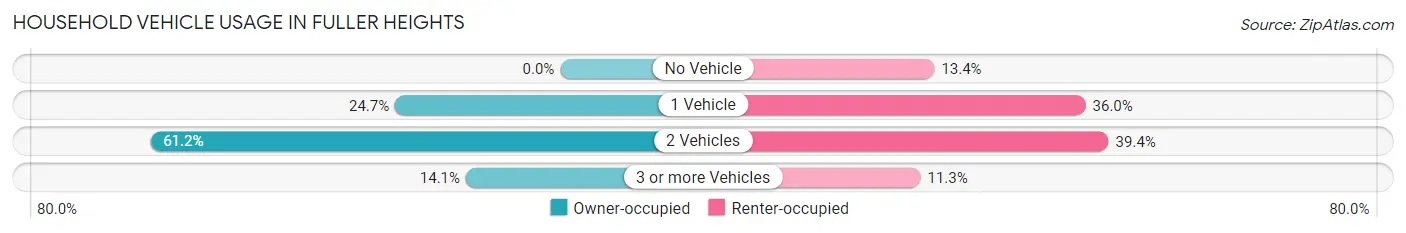
| Vehicles per Household | Owner-occupied | Renter-occupied |
| No Vehicle | 0 (0.0%) | 148 (13.4%) |
| 1 Vehicle | 660 (24.7%) | 398 (35.9%) |
| 2 Vehicles | 1,638 (61.2%) | 436 (39.4%) |
| 3 or more Vehicles | 377 (14.1%) | 125 (11.3%) |
| Total | 2,675 (100.0%) | 1,107 (100.0%) |
Real Estate & Mortgages in Fuller Heights
Real Estate and Mortgage Overview in Fuller Heights
| Characteristic | Without Mortgage | With Mortgage |
| Housing Units | 581 | 2,094 |
| Median Property Value | $213,800 | $230,600 |
| Median Household Income | $59,150 | $366 |
| Monthly Housing Costs | $524 | $65 |
| Real Estate Taxes | $1,332 | $84 |
Property Value by Mortgage Status in Fuller Heights
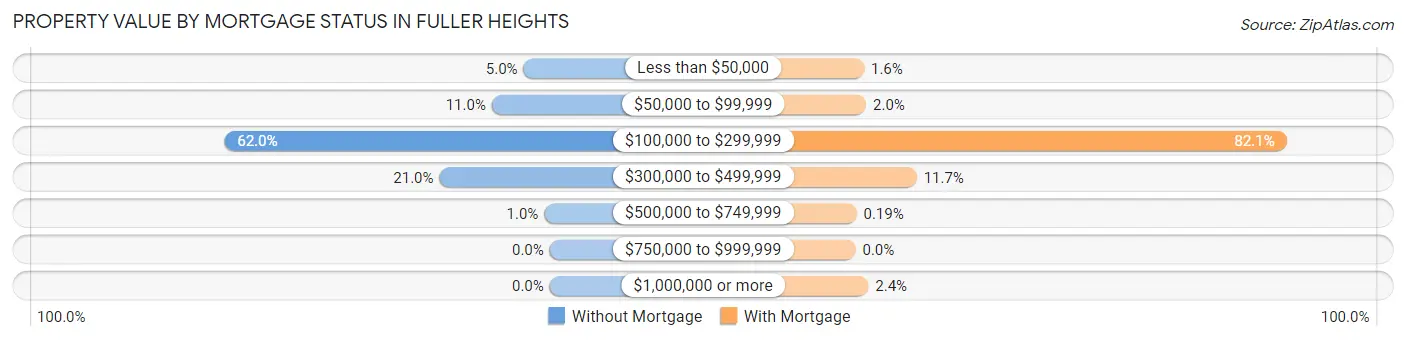
| Property Value | Without Mortgage | With Mortgage |
| Less than $50,000 | 29 (5.0%) | 34 (1.6%) |
| $50,000 to $99,999 | 64 (11.0%) | 42 (2.0%) |
| $100,000 to $299,999 | 360 (62.0%) | 1,719 (82.1%) |
| $300,000 to $499,999 | 122 (21.0%) | 244 (11.7%) |
| $500,000 to $749,999 | 6 (1.0%) | 4 (0.2%) |
| $750,000 to $999,999 | 0 (0.0%) | 0 (0.0%) |
| $1,000,000 or more | 0 (0.0%) | 51 (2.4%) |
| Total | 581 (100.0%) | 2,094 (100.0%) |
Household Income by Mortgage Status in Fuller Heights
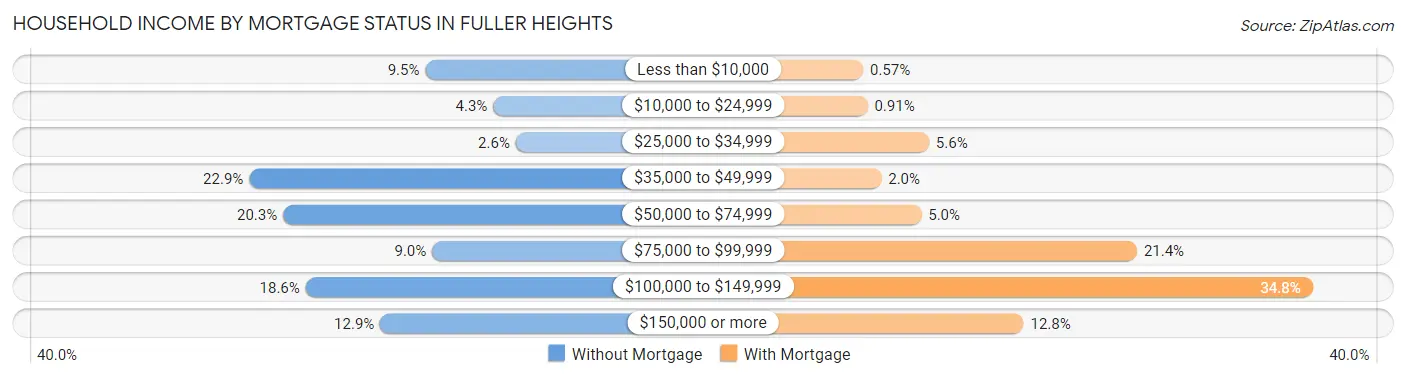
| Household Income | Without Mortgage | With Mortgage |
| Less than $10,000 | 55 (9.5%) | 12 (0.6%) |
| $10,000 to $24,999 | 25 (4.3%) | 19 (0.9%) |
| $25,000 to $34,999 | 15 (2.6%) | 117 (5.6%) |
| $35,000 to $49,999 | 133 (22.9%) | 41 (2.0%) |
| $50,000 to $74,999 | 118 (20.3%) | 105 (5.0%) |
| $75,000 to $99,999 | 52 (8.9%) | 449 (21.4%) |
| $100,000 to $149,999 | 108 (18.6%) | 729 (34.8%) |
| $150,000 or more | 75 (12.9%) | 268 (12.8%) |
| Total | 581 (100.0%) | 2,094 (100.0%) |
Property Value to Household Income Ratio in Fuller Heights
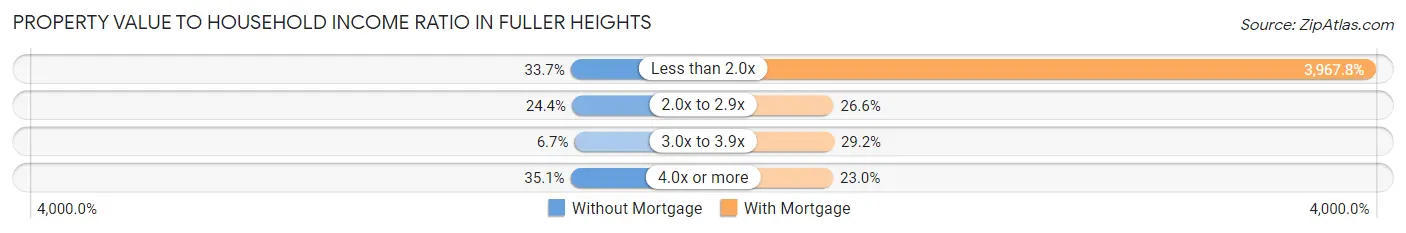
| Value-to-Income Ratio | Without Mortgage | With Mortgage |
| Less than 2.0x | 196 (33.7%) | 83,086 (3,967.8%) |
| 2.0x to 2.9x | 142 (24.4%) | 557 (26.6%) |
| 3.0x to 3.9x | 39 (6.7%) | 612 (29.2%) |
| 4.0x or more | 204 (35.1%) | 482 (23.0%) |
| Total | 581 (100.0%) | 2,094 (100.0%) |
Real Estate Taxes by Mortgage Status in Fuller Heights
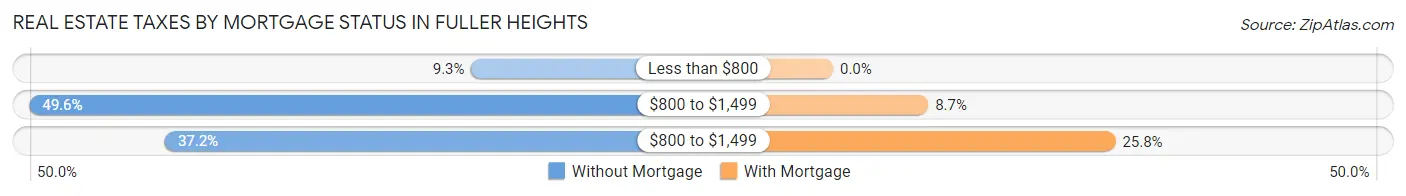
| Property Taxes | Without Mortgage | With Mortgage |
| Less than $800 | 54 (9.3%) | 0 (0.0%) |
| $800 to $1,499 | 288 (49.6%) | 182 (8.7%) |
| $800 to $1,499 | 216 (37.2%) | 540 (25.8%) |
| Total | 581 (100.0%) | 2,094 (100.0%) |
Health & Disability in Fuller Heights
Health Insurance Coverage by Age in Fuller Heights
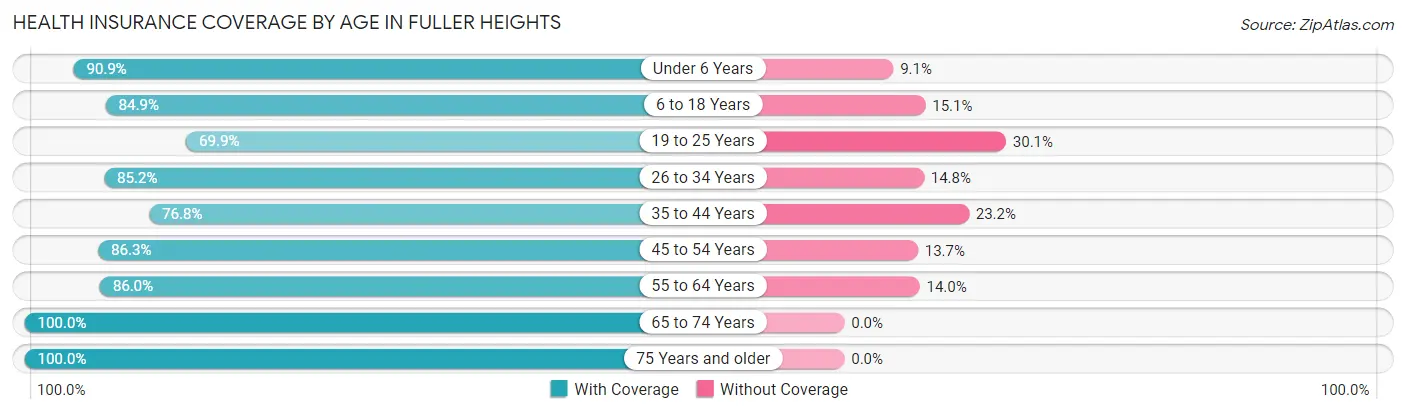
| Age Bracket | With Coverage | Without Coverage |
| Under 6 Years | 847 (90.9%) | 85 (9.1%) |
| 6 to 18 Years | 1,865 (84.9%) | 332 (15.1%) |
| 19 to 25 Years | 821 (69.9%) | 354 (30.1%) |
| 26 to 34 Years | 2,092 (85.2%) | 364 (14.8%) |
| 35 to 44 Years | 939 (76.8%) | 284 (23.2%) |
| 45 to 54 Years | 1,045 (86.3%) | 166 (13.7%) |
| 55 to 64 Years | 655 (86.0%) | 107 (14.0%) |
| 65 to 74 Years | 1,155 (100.0%) | 0 (0.0%) |
| 75 Years and older | 351 (100.0%) | 0 (0.0%) |
| Total | 9,770 (85.2%) | 1,692 (14.8%) |
Health Insurance Coverage by Citizenship Status in Fuller Heights
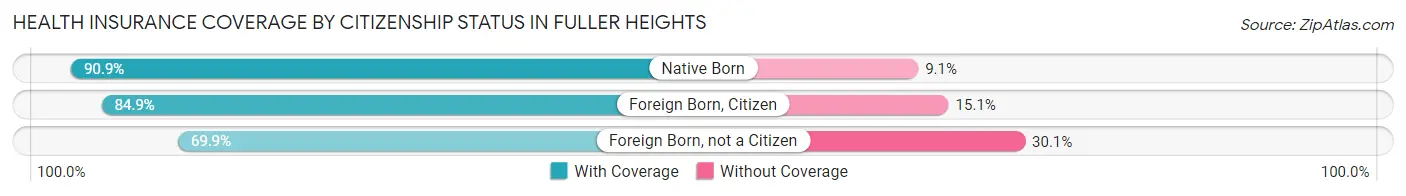
| Citizenship Status | With Coverage | Without Coverage |
| Native Born | 847 (90.9%) | 85 (9.1%) |
| Foreign Born, Citizen | 1,865 (84.9%) | 332 (15.1%) |
| Foreign Born, not a Citizen | 821 (69.9%) | 354 (30.1%) |
Health Insurance Coverage by Household Income in Fuller Heights
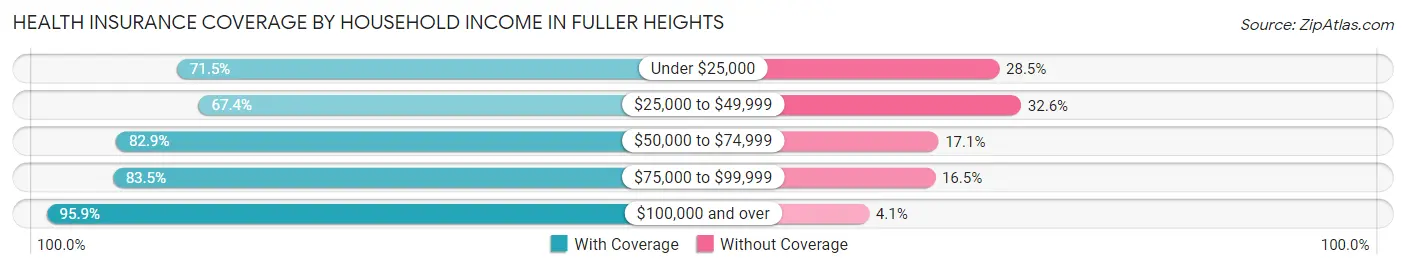
| Household Income | With Coverage | Without Coverage |
| Under $25,000 | 353 (71.5%) | 141 (28.5%) |
| $25,000 to $49,999 | 851 (67.4%) | 412 (32.6%) |
| $50,000 to $74,999 | 2,307 (82.9%) | 477 (17.1%) |
| $75,000 to $99,999 | 2,531 (83.5%) | 501 (16.5%) |
| $100,000 and over | 3,728 (95.9%) | 161 (4.1%) |
Public vs Private Health Insurance Coverage by Age in Fuller Heights
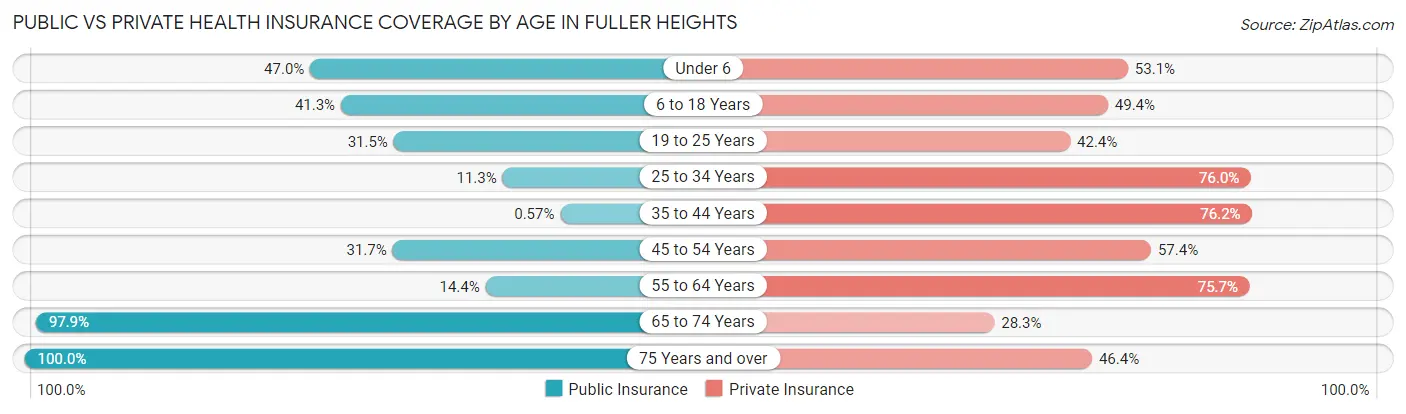
| Age Bracket | Public Insurance | Private Insurance |
| Under 6 | 438 (47.0%) | 495 (53.1%) |
| 6 to 18 Years | 907 (41.3%) | 1,085 (49.4%) |
| 19 to 25 Years | 370 (31.5%) | 498 (42.4%) |
| 25 to 34 Years | 277 (11.3%) | 1,866 (76.0%) |
| 35 to 44 Years | 7 (0.6%) | 932 (76.2%) |
| 45 to 54 Years | 384 (31.7%) | 695 (57.4%) |
| 55 to 64 Years | 110 (14.4%) | 577 (75.7%) |
| 65 to 74 Years | 1,131 (97.9%) | 327 (28.3%) |
| 75 Years and over | 351 (100.0%) | 163 (46.4%) |
| Total | 3,975 (34.7%) | 6,638 (57.9%) |
Disability Status by Sex by Age in Fuller Heights
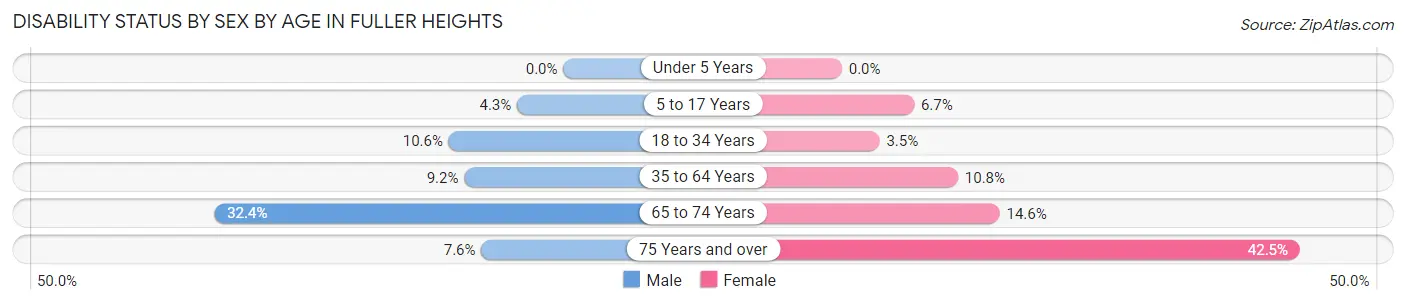
| Age Bracket | Male | Female |
| Under 5 Years | 0 (0.0%) | 0 (0.0%) |
| 5 to 17 Years | 49 (4.3%) | 66 (6.7%) |
| 18 to 34 Years | 230 (10.6%) | 58 (3.5%) |
| 35 to 64 Years | 146 (9.2%) | 173 (10.8%) |
| 65 to 74 Years | 164 (32.4%) | 95 (14.6%) |
| 75 Years and over | 14 (7.6%) | 71 (42.5%) |
Disability Class by Sex by Age in Fuller Heights
Disability Class: Hearing Difficulty
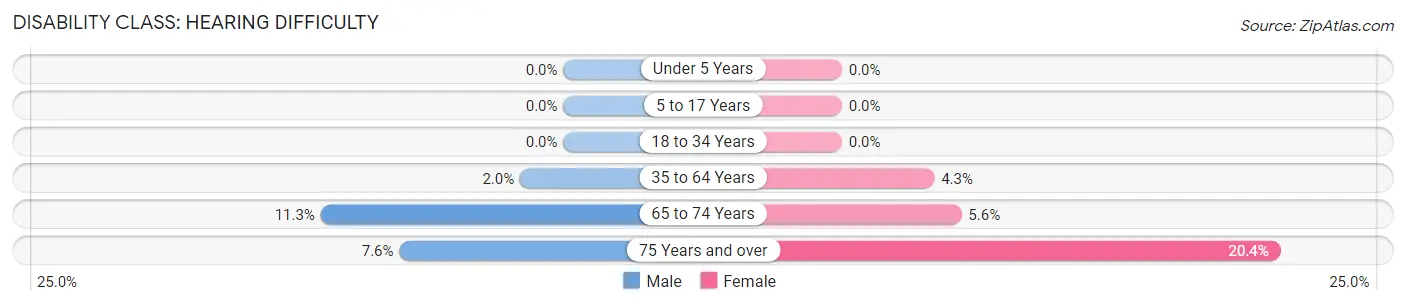
| Age Bracket | Male | Female |
| Under 5 Years | 0 (0.0%) | 0 (0.0%) |
| 5 to 17 Years | 0 (0.0%) | 0 (0.0%) |
| 18 to 34 Years | 0 (0.0%) | 0 (0.0%) |
| 35 to 64 Years | 32 (2.0%) | 69 (4.3%) |
| 65 to 74 Years | 57 (11.3%) | 36 (5.6%) |
| 75 Years and over | 14 (7.6%) | 34 (20.4%) |
Disability Class: Vision Difficulty
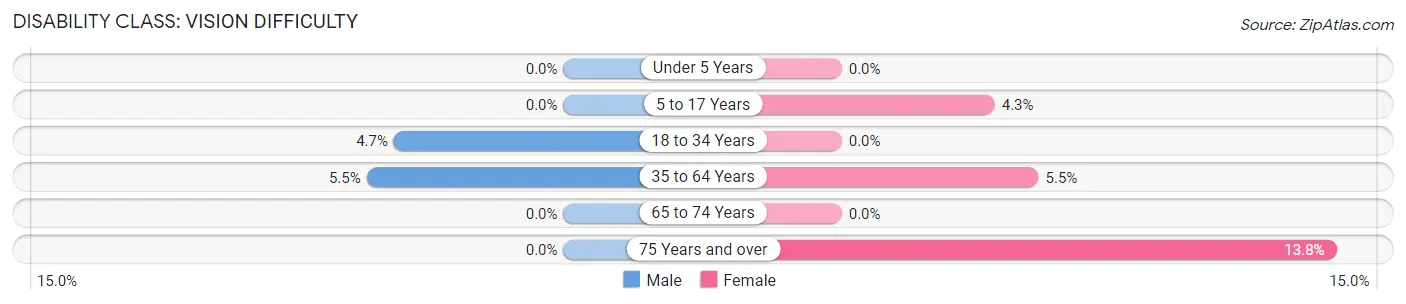
| Age Bracket | Male | Female |
| Under 5 Years | 0 (0.0%) | 0 (0.0%) |
| 5 to 17 Years | 0 (0.0%) | 42 (4.3%) |
| 18 to 34 Years | 102 (4.7%) | 0 (0.0%) |
| 35 to 64 Years | 87 (5.5%) | 88 (5.5%) |
| 65 to 74 Years | 0 (0.0%) | 0 (0.0%) |
| 75 Years and over | 0 (0.0%) | 23 (13.8%) |
Disability Class: Cognitive Difficulty
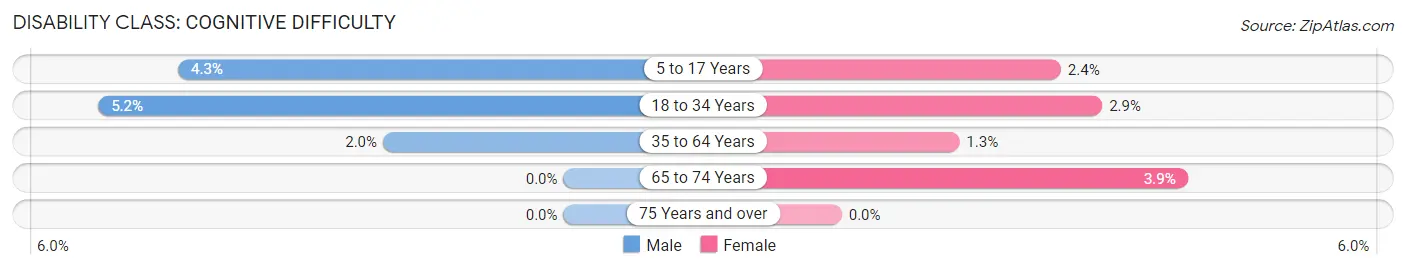
| Age Bracket | Male | Female |
| 5 to 17 Years | 49 (4.3%) | 24 (2.4%) |
| 18 to 34 Years | 112 (5.2%) | 48 (2.9%) |
| 35 to 64 Years | 32 (2.0%) | 21 (1.3%) |
| 65 to 74 Years | 0 (0.0%) | 25 (3.8%) |
| 75 Years and over | 0 (0.0%) | 0 (0.0%) |
Disability Class: Ambulatory Difficulty
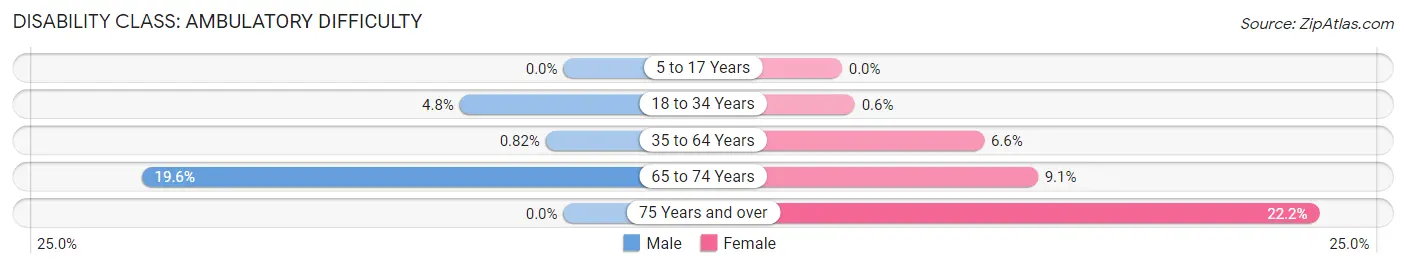
| Age Bracket | Male | Female |
| 5 to 17 Years | 0 (0.0%) | 0 (0.0%) |
| 18 to 34 Years | 104 (4.8%) | 10 (0.6%) |
| 35 to 64 Years | 13 (0.8%) | 106 (6.6%) |
| 65 to 74 Years | 99 (19.6%) | 59 (9.1%) |
| 75 Years and over | 0 (0.0%) | 37 (22.2%) |
Disability Class: Self-Care Difficulty
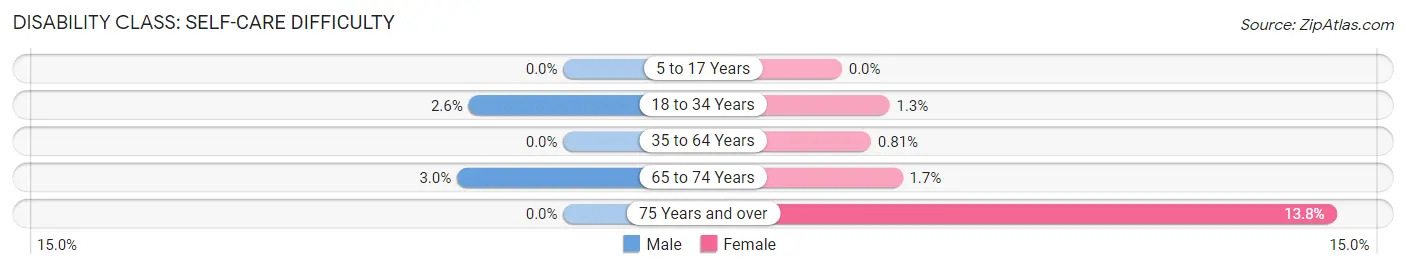
| Age Bracket | Male | Female |
| 5 to 17 Years | 0 (0.0%) | 0 (0.0%) |
| 18 to 34 Years | 57 (2.6%) | 22 (1.3%) |
| 35 to 64 Years | 0 (0.0%) | 13 (0.8%) |
| 65 to 74 Years | 15 (3.0%) | 11 (1.7%) |
| 75 Years and over | 0 (0.0%) | 23 (13.8%) |
Technology Access in Fuller Heights
Computing Device Access in Fuller Heights
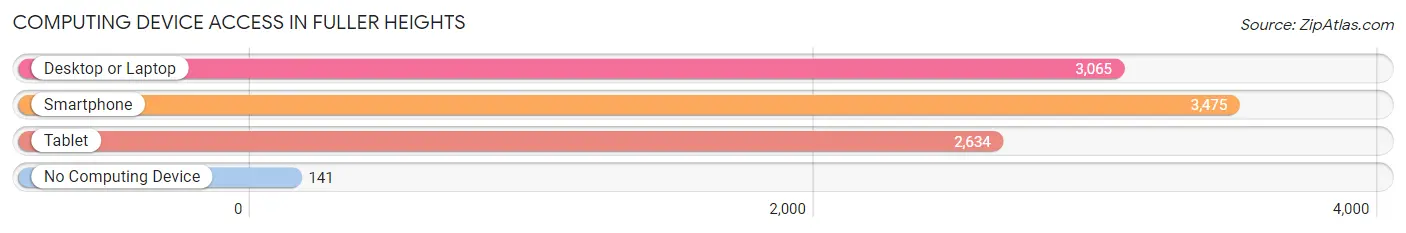
| Device Type | # Households | % Households |
| Desktop or Laptop | 3,065 | 81.0% |
| Smartphone | 3,475 | 91.9% |
| Tablet | 2,634 | 69.7% |
| No Computing Device | 141 | 3.7% |
| Total | 3,782 | 100.0% |
Internet Access in Fuller Heights
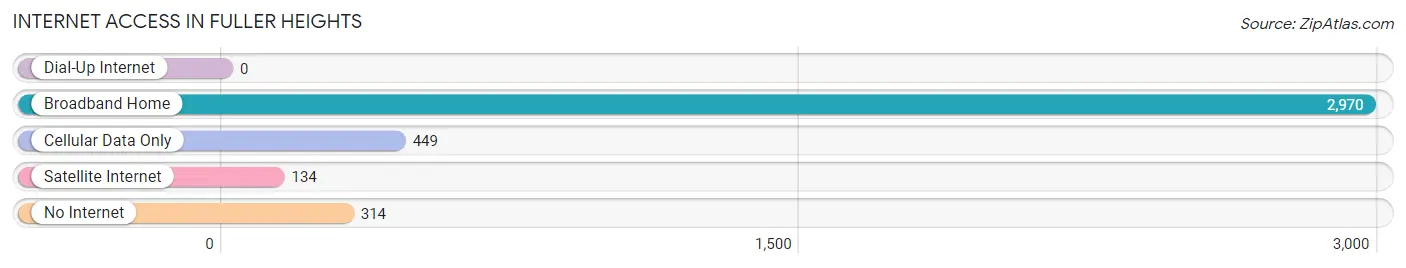
| Internet Type | # Households | % Households |
| Dial-Up Internet | 0 | 0.0% |
| Broadband Home | 2,970 | 78.5% |
| Cellular Data Only | 449 | 11.9% |
| Satellite Internet | 134 | 3.5% |
| No Internet | 314 | 8.3% |
| Total | 3,782 | 100.0% |
Fuller Heights Summary
Fuller Heights is a small town located in the state of Florida, in the United States. It is situated in the northern part of the state, in the county of Hillsborough. The town has a population of approximately 4,000 people, and is located about 20 miles north of Tampa.
History
Fuller Heights was founded in the late 1800s by a man named William Fuller. He was a former Confederate soldier who had moved to the area after the Civil War. He purchased a large tract of land and began to develop it into a small farming community. The town was named after him, and it quickly grew in size and population. By the early 1900s, the town had become a thriving agricultural center, with a variety of crops being grown in the area.
In the 1920s, the town began to experience a period of growth and prosperity. The population increased, and new businesses began to open up. The town also became a popular tourist destination, with many people coming to visit the area's natural beauty.
In the 1950s, the town began to experience a decline in population and economic activity. This was due to the fact that many of the town's residents had moved away to larger cities in search of better job opportunities. However, in the late 1970s, the town began to experience a resurgence in population and economic activity. This was due to the fact that the town had become a popular retirement destination for many people.
Geography
Fuller Heights is located in the northern part of the state of Florida, in the county of Hillsborough. The town is situated on the banks of the Hillsborough River, and is surrounded by a variety of natural features, including forests, wetlands, and lakes. The town is located about 20 miles north of Tampa, and is close to the Gulf of Mexico.
The town has a humid subtropical climate, with hot and humid summers and mild winters. The average temperature in the summer is around 90 degrees Fahrenheit, and the average temperature in the winter is around 60 degrees Fahrenheit.
Economy
The economy of Fuller Heights is largely based on tourism and agriculture. The town is a popular tourist destination, with many people coming to visit the area's natural beauty. The town also has a number of agricultural businesses, including farms, nurseries, and greenhouses.
The town also has a number of small businesses, including restaurants, shops, and other services. The town also has a number of manufacturing businesses, including a furniture factory and a printing company.
Demographics
As of the 2010 census, the population of Fuller Heights was 4,000 people. The town has a diverse population, with people from a variety of backgrounds and ethnicities. The town has a large Hispanic population, with approximately 40% of the population being of Hispanic or Latino origin. The town also has a large African American population, with approximately 20% of the population being of African American origin. The town also has a large white population, with approximately 40% of the population being of white origin. The town also has a small Asian population, with approximately 5% of the population being of Asian origin.
Common Questions
What is Per Capita Income in Fuller Heights?
Per Capita income in Fuller Heights is $30,163.
What is the Median Family Income in Fuller Heights?
Median Family Income in Fuller Heights is $78,825.
What is the Median Household income in Fuller Heights?
Median Household Income in Fuller Heights is $77,787.
What is Income or Wage Gap in Fuller Heights?
Income or Wage Gap in Fuller Heights is 28.0%.
Women in Fuller Heights earn 72.0 cents for every dollar earned by a man.
What is Family Income Deficit in Fuller Heights?
Family Income Deficit in Fuller Heights is $6,318.
Families that are below poverty line in Fuller Heights earn $6,318 less on average than the poverty threshold level.
What is Inequality or Gini Index in Fuller Heights?
Inequality or Gini Index in Fuller Heights is 0.36.
What is the Total Population of Fuller Heights?
Total Population of Fuller Heights is 11,462.
What is the Total Male Population of Fuller Heights?
Total Male Population of Fuller Heights is 5,881.
What is the Total Female Population of Fuller Heights?
Total Female Population of Fuller Heights is 5,581.
What is the Ratio of Males per 100 Females in Fuller Heights?
There are 105.38 Males per 100 Females in Fuller Heights.
What is the Ratio of Females per 100 Males in Fuller Heights?
There are 94.90 Females per 100 Males in Fuller Heights.
What is the Median Population Age in Fuller Heights?
Median Population Age in Fuller Heights is 32.5 Years.
What is the Average Family Size in Fuller Heights
Average Family Size in Fuller Heights is 3.4 People.
What is the Average Household Size in Fuller Heights
Average Household Size in Fuller Heights is 3.0 People.
How Large is the Labor Force in Fuller Heights?
There are 6,255 People in the Labor Forcein in Fuller Heights.
What is the Percentage of People in the Labor Force in Fuller Heights?
69.9% of People are in the Labor Force in Fuller Heights.
What is the Unemployment Rate in Fuller Heights?
Unemployment Rate in Fuller Heights is 3.8%.