Montura, FL Map & Demographics
Montura Map
Montura Overview
$30,032
PER CAPITA INCOME
$49,214
AVG FAMILY INCOME
$37,670
AVG HOUSEHOLD INCOME
45.8%
WAGE / INCOME GAP [ % ]
54.2¢/ $1
WAGE / INCOME GAP [ $ ]
0.52
INEQUALITY / GINI INDEX
3,400
TOTAL POPULATION
1,886
MALE POPULATION
1,514
FEMALE POPULATION
124.57
MALES / 100 FEMALES
80.28
FEMALES / 100 MALES
41.9
MEDIAN AGE
2.5
AVG FAMILY SIZE
2.3
AVG HOUSEHOLD SIZE
1,581
LABOR FORCE [ PEOPLE ]
55.4%
PERCENT IN LABOR FORCE
6.8%
UNEMPLOYMENT RATE
Income in Montura
Income Overview in Montura
Per Capita Income in Montura is $30,032, while median incomes of families and households are $49,214 and $37,670 respectively.
| Characteristic | Number | Measure |
| Per Capita Income | 3,400 | $30,032 |
| Median Family Income | 1,066 | $49,214 |
| Mean Family Income | 1,066 | $88,070 |
| Median Household Income | 1,463 | $37,670 |
| Mean Household Income | 1,463 | $75,872 |
| Income Deficit | 1,066 | $0 |
| Wage / Income Gap (%) | 3,400 | 45.79% |
| Wage / Income Gap ($) | 3,400 | 54.21¢ per $1 |
| Gini / Inequality Index | 3,400 | 0.52 |
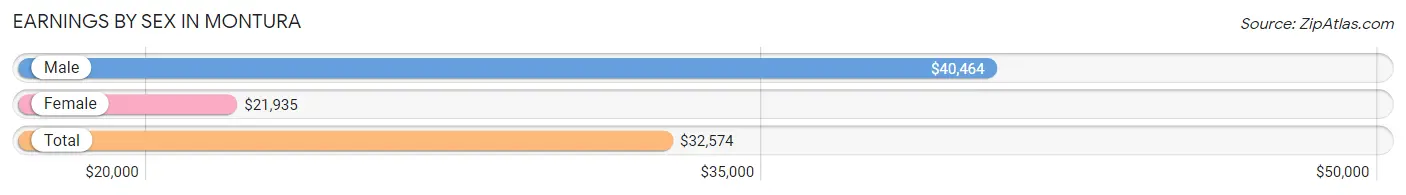
Earnings by Sex in Montura
Average Earnings in Montura are $32,574, $40,464 for men and $21,935 for women, a difference of 45.8%.
| Sex | Number | Average Earnings |
| Male | 956 (60.6%) | $40,464 |
| Female | 622 (39.4%) | $21,935 |
| Total | 1,578 (100.0%) | $32,574 |
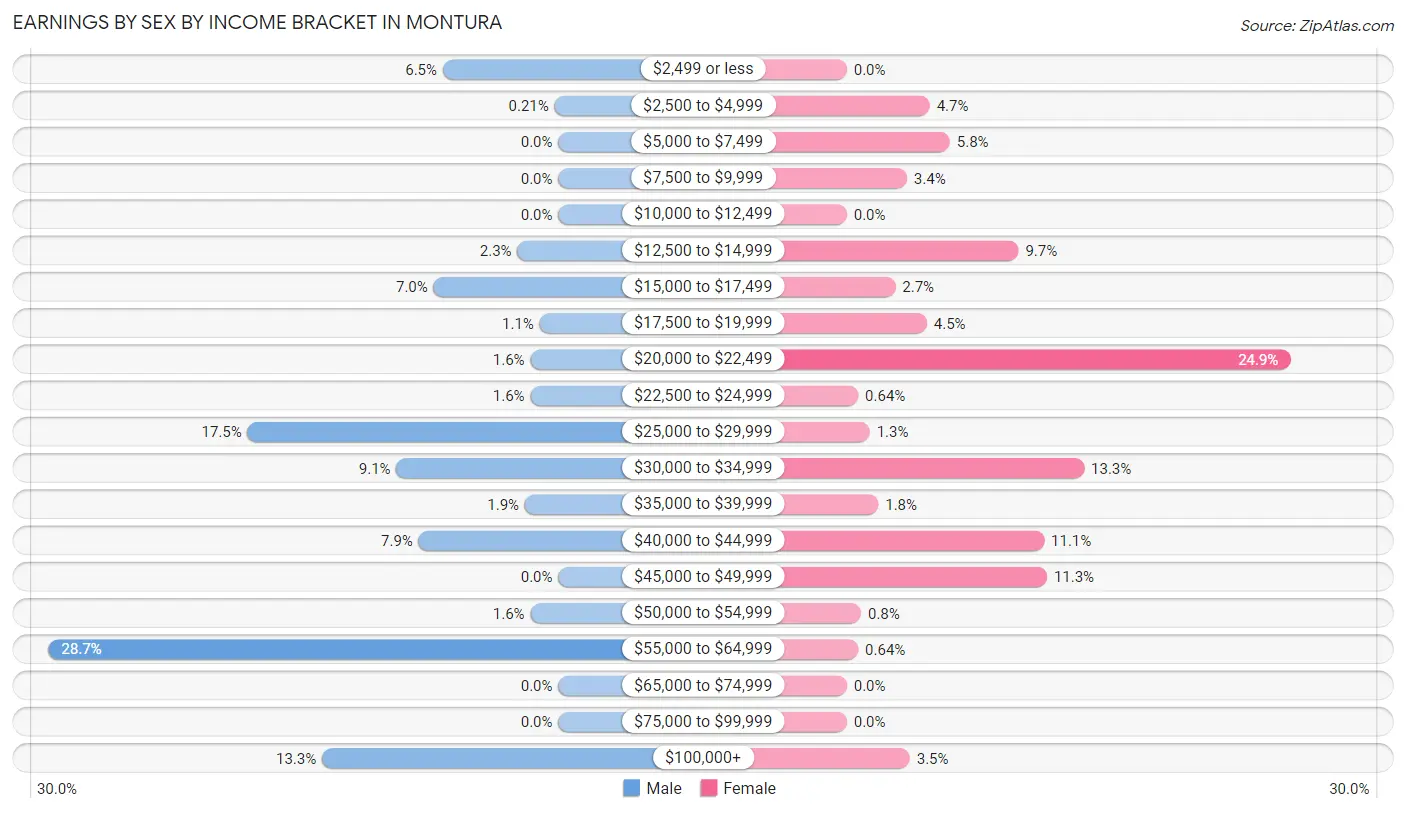
Earnings by Sex by Income Bracket in Montura
The most common earnings brackets in Montura are $55,000 to $64,999 for men (274 | 28.7%) and $20,000 to $22,499 for women (155 | 24.9%).
| Income | Male | Female |
| $2,499 or less | 62 (6.5%) | 0 (0.0%) |
| $2,500 to $4,999 | 2 (0.2%) | 29 (4.7%) |
| $5,000 to $7,499 | 0 (0.0%) | 36 (5.8%) |
| $7,500 to $9,999 | 0 (0.0%) | 21 (3.4%) |
| $10,000 to $12,499 | 0 (0.0%) | 0 (0.0%) |
| $12,500 to $14,999 | 22 (2.3%) | 60 (9.7%) |
| $15,000 to $17,499 | 67 (7.0%) | 17 (2.7%) |
| $17,500 to $19,999 | 10 (1.1%) | 28 (4.5%) |
| $20,000 to $22,499 | 15 (1.6%) | 155 (24.9%) |
| $22,500 to $24,999 | 15 (1.6%) | 4 (0.6%) |
| $25,000 to $29,999 | 167 (17.5%) | 8 (1.3%) |
| $30,000 to $34,999 | 87 (9.1%) | 83 (13.3%) |
| $35,000 to $39,999 | 18 (1.9%) | 11 (1.8%) |
| $40,000 to $44,999 | 75 (7.9%) | 69 (11.1%) |
| $45,000 to $49,999 | 0 (0.0%) | 70 (11.3%) |
| $50,000 to $54,999 | 15 (1.6%) | 5 (0.8%) |
| $55,000 to $64,999 | 274 (28.7%) | 4 (0.6%) |
| $65,000 to $74,999 | 0 (0.0%) | 0 (0.0%) |
| $75,000 to $99,999 | 0 (0.0%) | 0 (0.0%) |
| $100,000+ | 127 (13.3%) | 22 (3.5%) |
| Total | 956 (100.0%) | 622 (100.0%) |
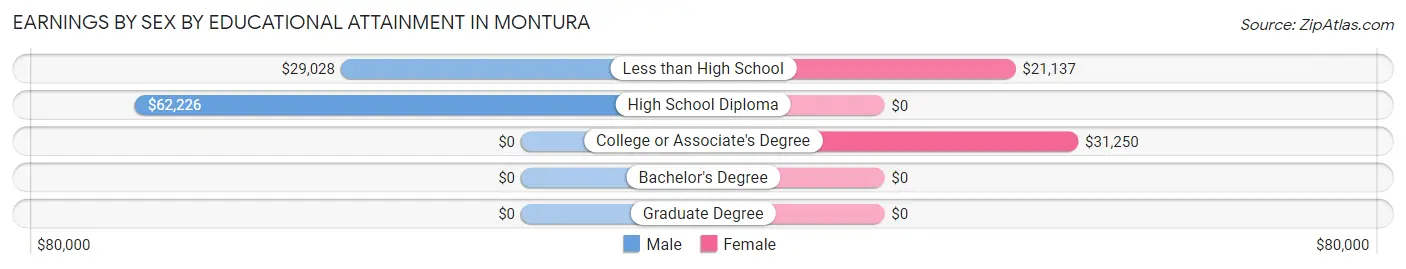
Earnings by Sex by Educational Attainment in Montura
Average earnings in Montura are $42,482 for men and $21,661 for women, a difference of 49.0%. Men with an educational attainment of high school diploma enjoy the highest average annual earnings of $62,226, while those with less than high school education earn the least with $29,028. Women with an educational attainment of college or associate's degree earn the most with the average annual earnings of $31,250, while those with less than high school education have the smallest earnings of $21,137.
| Educational Attainment | Male Income | Female Income |
| Less than High School | $29,028 | $21,137 |
| High School Diploma | $62,226 | $0 |
| College or Associate's Degree | - | - |
| Bachelor's Degree | - | - |
| Graduate Degree | - | - |
| Total | $42,482 | $21,661 |
Family Income in Montura
Family Income Brackets in Montura
According to the Montura family income data, there are 223 families falling into the $25,000 to $34,999 income range, which is the most common income bracket and makes up 20.9% of all families. Conversely, the $150,000 to $199,999 income bracket is the least frequent group with only 19 families (1.8%) belonging to this category.
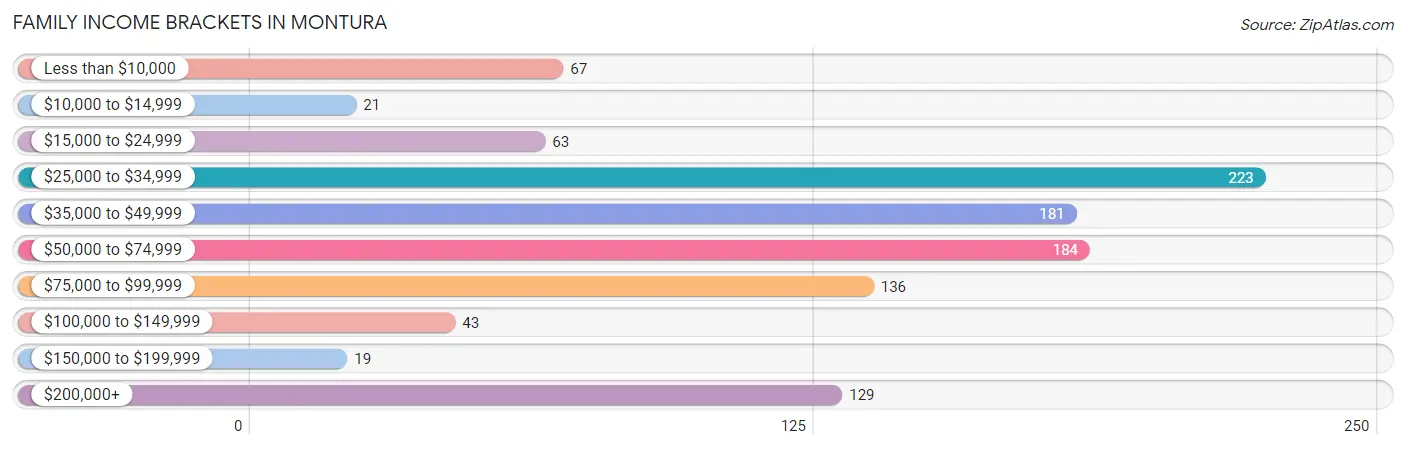
| Income Bracket | # Families | % Families |
| Less than $10,000 | 67 | 6.3% |
| $10,000 to $14,999 | 21 | 2.0% |
| $15,000 to $24,999 | 63 | 5.9% |
| $25,000 to $34,999 | 223 | 20.9% |
| $35,000 to $49,999 | 181 | 17.0% |
| $50,000 to $74,999 | 184 | 17.3% |
| $75,000 to $99,999 | 136 | 12.8% |
| $100,000 to $149,999 | 43 | 4.0% |
| $150,000 to $199,999 | 19 | 1.8% |
| $200,000+ | 129 | 12.1% |
Family Income by Famaliy Size in Montura
5-person families (36 | 3.4%) account for the highest median family income in Montura with $96,452 per family, while 2-person families (399 | 37.4%) have the highest median income of $21,614 per family member.
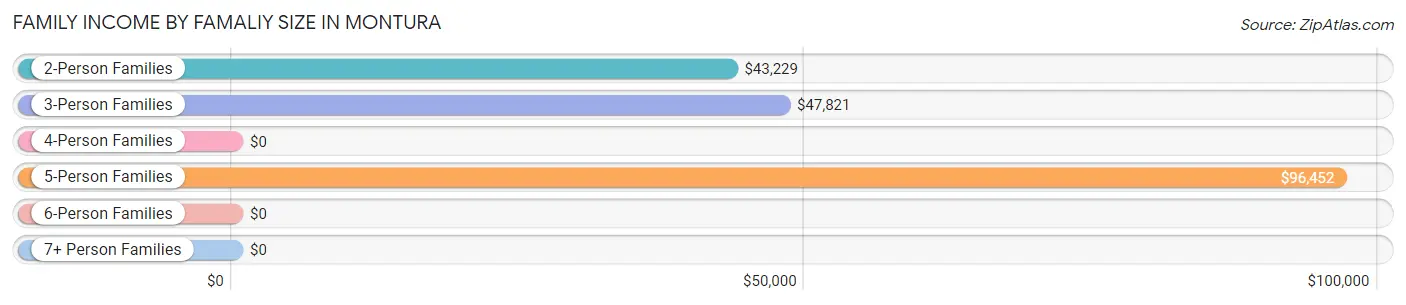
| Income Bracket | # Families | Median Income |
| 2-Person Families | 399 (37.4%) | $43,229 |
| 3-Person Families | 308 (28.9%) | $47,821 |
| 4-Person Families | 281 (26.4%) | $0 |
| 5-Person Families | 36 (3.4%) | $96,452 |
| 6-Person Families | 42 (3.9%) | $0 |
| 7+ Person Families | 0 (0.0%) | $0 |
| Total | 1,066 (100.0%) | $49,214 |
Family Income by Number of Earners in Montura
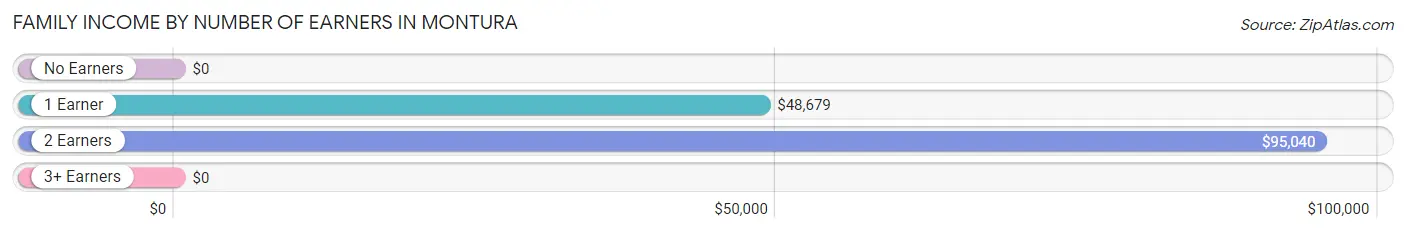
| Number of Earners | # Families | Median Income |
| No Earners | 104 (9.8%) | $0 |
| 1 Earner | 618 (58.0%) | $48,679 |
| 2 Earners | 250 (23.4%) | $95,040 |
| 3+ Earners | 94 (8.8%) | $0 |
| Total | 1,066 (100.0%) | $49,214 |
Household Income in Montura
Household Income Brackets in Montura
With 279 households falling in the category, the $15,000 to $24,999 income range is the most frequent in Montura, accounting for 19.1% of all households. In contrast, only 19 households (1.3%) fall into the $150,000 to $199,999 income bracket, making it the least populous group.
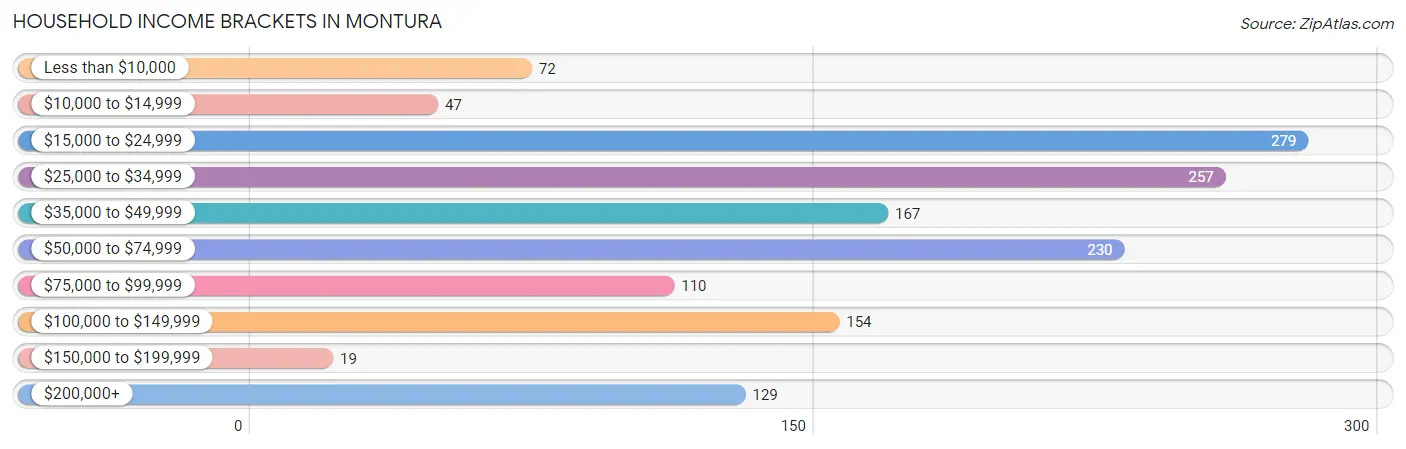
| Income Bracket | # Households | % Households |
| Less than $10,000 | 72 | 4.9% |
| $10,000 to $14,999 | 47 | 3.2% |
| $15,000 to $24,999 | 279 | 19.1% |
| $25,000 to $34,999 | 257 | 17.6% |
| $35,000 to $49,999 | 167 | 11.4% |
| $50,000 to $74,999 | 230 | 15.7% |
| $75,000 to $99,999 | 110 | 7.5% |
| $100,000 to $149,999 | 154 | 10.5% |
| $150,000 to $199,999 | 19 | 1.3% |
| $200,000+ | 129 | 8.8% |
Household Income by Householder Age in Montura
The median household income in Montura is $37,670, with the highest median household income of $64,383 found in the 25 to 44 years age bracket for the primary householder. A total of 538 households (36.8%) fall into this category. Meanwhile, the 15 to 24 years age bracket for the primary householder has the lowest median household income of $0, with 70 households (4.8%) in this group.
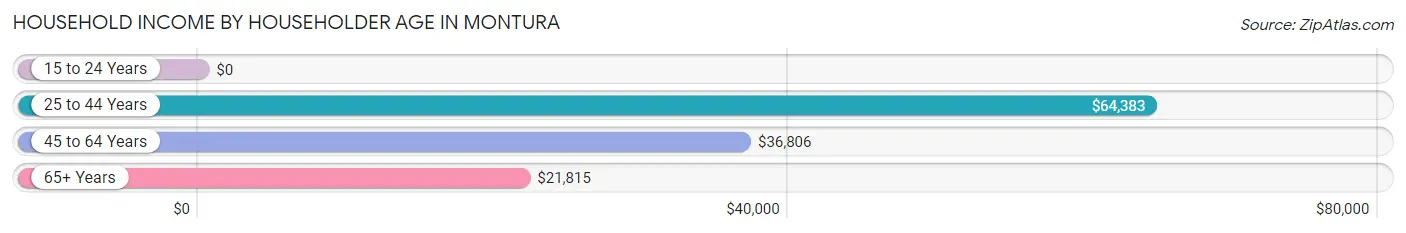
| Income Bracket | # Households | Median Income |
| 15 to 24 Years | 70 (4.8%) | $0 |
| 25 to 44 Years | 538 (36.8%) | $64,383 |
| 45 to 64 Years | 442 (30.2%) | $36,806 |
| 65+ Years | 413 (28.2%) | $21,815 |
| Total | 1,463 (100.0%) | $37,670 |
Poverty in Montura
Income Below Poverty by Sex and Age in Montura
With 21.6% poverty level for males and 27.7% for females among the residents of Montura, 6 to 11 year old males and 15 year old females are the most vulnerable to poverty, with 49 males (84.5%) and 56 females (96.6%) in their respective age groups living below the poverty level.
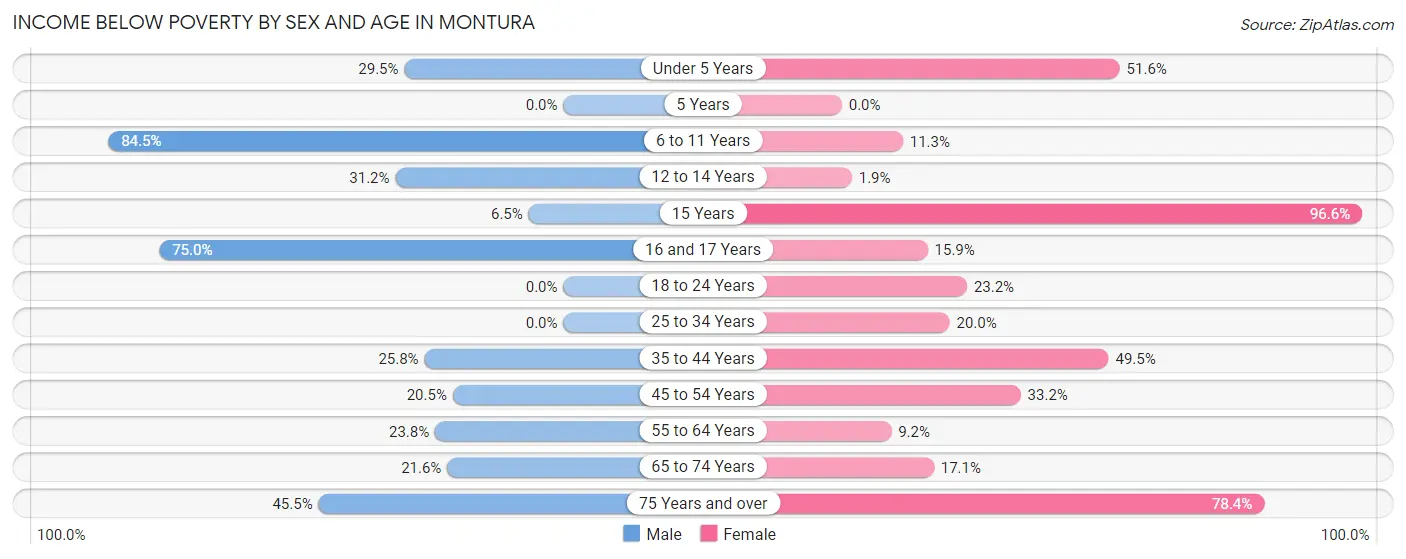
| Age Bracket | Male | Female |
| Under 5 Years | 18 (29.5%) | 49 (51.6%) |
| 5 Years | 0 (0.0%) | 0 (0.0%) |
| 6 to 11 Years | 49 (84.5%) | 6 (11.3%) |
| 12 to 14 Years | 29 (31.2%) | 1 (1.8%) |
| 15 Years | 2 (6.5%) | 56 (96.6%) |
| 16 and 17 Years | 6 (75.0%) | 18 (15.9%) |
| 18 to 24 Years | 0 (0.0%) | 36 (23.2%) |
| 25 to 34 Years | 0 (0.0%) | 24 (20.0%) |
| 35 to 44 Years | 115 (25.8%) | 52 (49.5%) |
| 45 to 54 Years | 31 (20.5%) | 82 (33.2%) |
| 55 to 64 Years | 55 (23.8%) | 20 (9.2%) |
| 65 to 74 Years | 47 (21.6%) | 41 (17.1%) |
| 75 Years and over | 55 (45.5%) | 29 (78.4%) |
| Total | 407 (21.6%) | 414 (27.7%) |
Income Above Poverty by Sex and Age in Montura
According to the poverty statistics in Montura, males aged 5 years and females aged 12 to 14 years are the age groups that are most secure financially, with 100.0% of males and 98.2% of females in these age groups living above the poverty line.
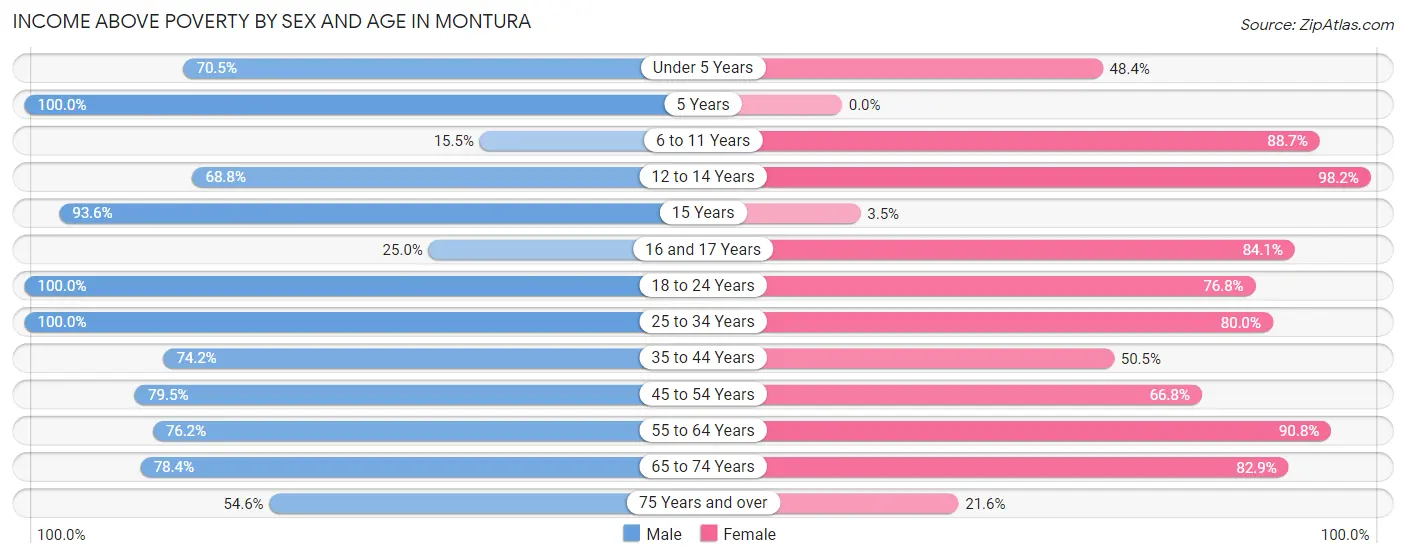
| Age Bracket | Male | Female |
| Under 5 Years | 43 (70.5%) | 46 (48.4%) |
| 5 Years | 24 (100.0%) | 0 (0.0%) |
| 6 to 11 Years | 9 (15.5%) | 47 (88.7%) |
| 12 to 14 Years | 64 (68.8%) | 53 (98.2%) |
| 15 Years | 29 (93.5%) | 2 (3.5%) |
| 16 and 17 Years | 2 (25.0%) | 95 (84.1%) |
| 18 to 24 Years | 156 (100.0%) | 119 (76.8%) |
| 25 to 34 Years | 288 (100.0%) | 96 (80.0%) |
| 35 to 44 Years | 331 (74.2%) | 53 (50.5%) |
| 45 to 54 Years | 120 (79.5%) | 165 (66.8%) |
| 55 to 64 Years | 176 (76.2%) | 198 (90.8%) |
| 65 to 74 Years | 171 (78.4%) | 199 (82.9%) |
| 75 Years and over | 66 (54.5%) | 8 (21.6%) |
| Total | 1,479 (78.4%) | 1,081 (72.3%) |
Income Below Poverty Among Married-Couple Families in Montura
The poverty statistics for married-couple families in Montura show that 9.2% or 66 of the total 719 families live below the poverty line. Families with 1 or 2 children have the highest poverty rate of 10.9%, comprising of 41 families. On the other hand, families with 3 or 4 children have the lowest poverty rate of 0.0%, which includes 0 families.
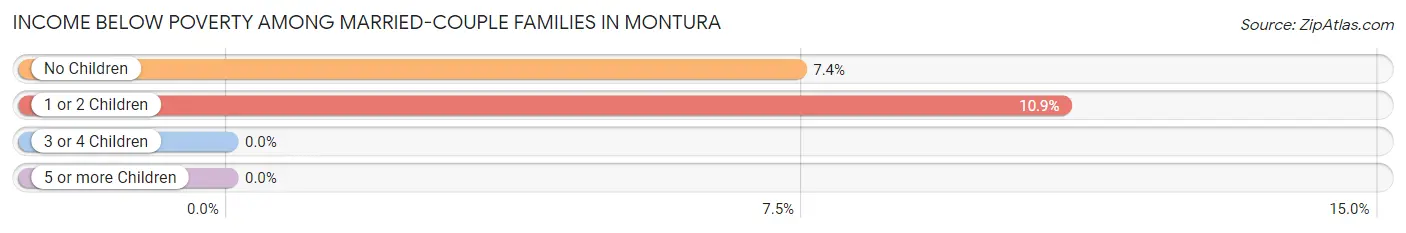
| Children | Above Poverty | Below Poverty |
| No Children | 312 (92.6%) | 25 (7.4%) |
| 1 or 2 Children | 336 (89.1%) | 41 (10.9%) |
| 3 or 4 Children | 5 (100.0%) | 0 (0.0%) |
| 5 or more Children | 0 (0.0%) | 0 (0.0%) |
| Total | 653 (90.8%) | 66 (9.2%) |
Income Below Poverty Among Single-Parent Households in Montura
According to the poverty data in Montura, 30.7% or 50 single-father households and 24.5% or 45 single-mother households are living below the poverty line. Among single-father households, those with 3 or 4 children have the highest poverty rate, with 42 households (100.0%) experiencing poverty. Likewise, among single-mother households, those with 3 or 4 children have the highest poverty rate, with 1 households (100.0%) falling below the poverty line.
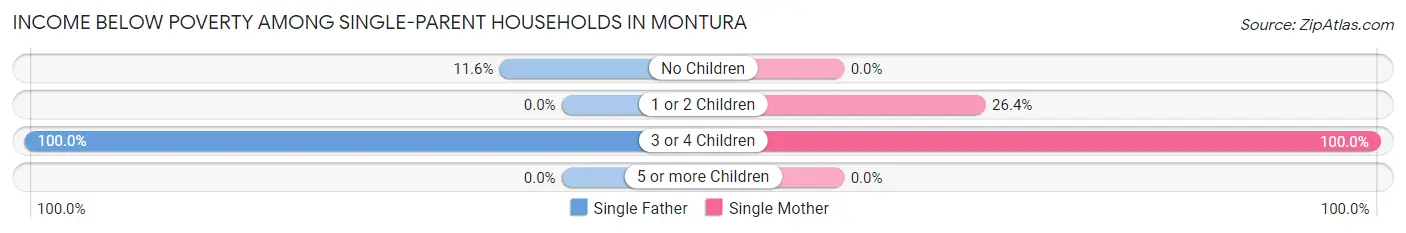
| Children | Single Father | Single Mother |
| No Children | 8 (11.6%) | 0 (0.0%) |
| 1 or 2 Children | 0 (0.0%) | 44 (26.4%) |
| 3 or 4 Children | 42 (100.0%) | 1 (100.0%) |
| 5 or more Children | 0 (0.0%) | 0 (0.0%) |
| Total | 50 (30.7%) | 45 (24.5%) |
Income Below Poverty Among Married-Couple vs Single-Parent Households in Montura
The poverty data for Montura shows that 66 of the married-couple family households (9.2%) and 95 of the single-parent households (27.4%) are living below the poverty level. Within the married-couple family households, those with 1 or 2 children have the highest poverty rate, with 41 households (10.9%) falling below the poverty line. Among the single-parent households, those with 3 or 4 children have the highest poverty rate, with 43 household (100.0%) living below poverty.
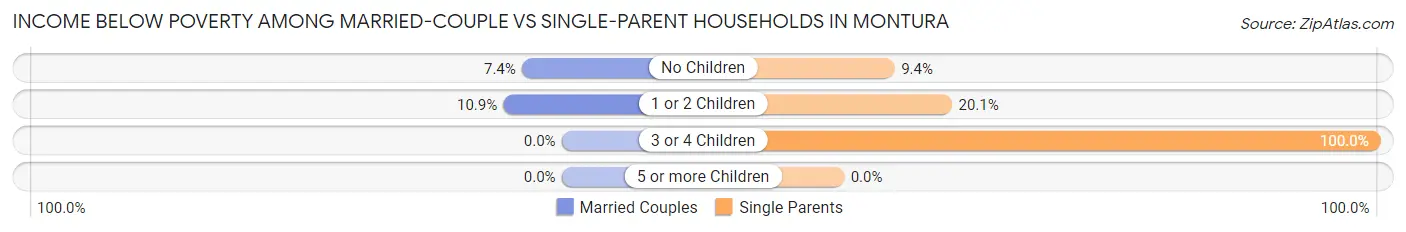
| Children | Married-Couple Families | Single-Parent Households |
| No Children | 25 (7.4%) | 8 (9.4%) |
| 1 or 2 Children | 41 (10.9%) | 44 (20.1%) |
| 3 or 4 Children | 0 (0.0%) | 43 (100.0%) |
| 5 or more Children | 0 (0.0%) | 0 (0.0%) |
| Total | 66 (9.2%) | 95 (27.4%) |
Race in Montura
The most populous races in Montura are Hispanic or Latino (3,109 | 91.4%), Two or more Races (1,679 | 49.4%), and White / Caucasian (1,547 | 45.5%).
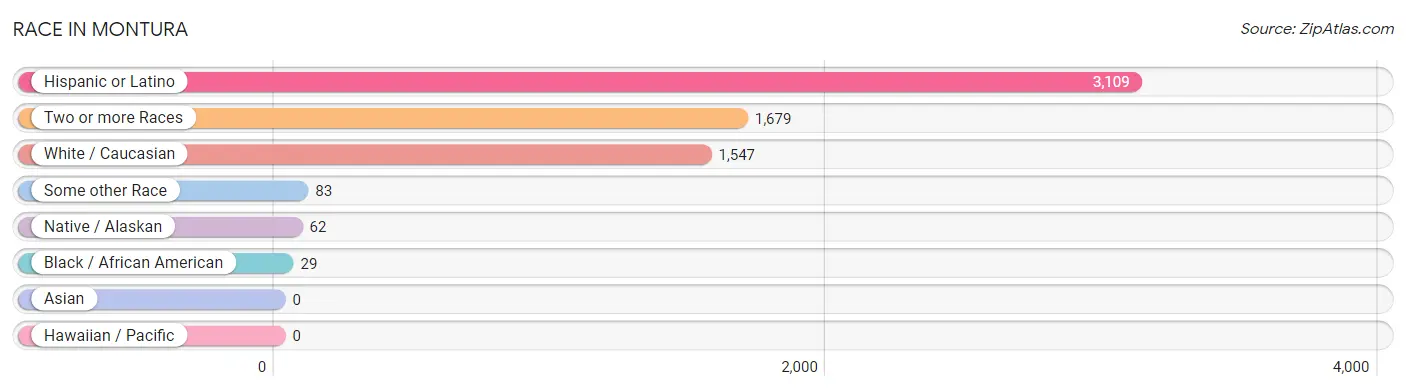
| Race | # Population | % Population |
| Asian | 0 | 0.0% |
| Black / African American | 29 | 0.9% |
| Hawaiian / Pacific | 0 | 0.0% |
| Hispanic or Latino | 3,109 | 91.4% |
| Native / Alaskan | 62 | 1.8% |
| White / Caucasian | 1,547 | 45.5% |
| Two or more Races | 1,679 | 49.4% |
| Some other Race | 83 | 2.4% |
| Total | 3,400 | 100.0% |
Ancestry in Montura
The most populous ancestries reported in Montura are Cuban (1,725 | 50.7%), Mexican (971 | 28.6%), Central American (199 | 5.9%), Puerto Rican (170 | 5.0%), and American (155 | 4.6%), together accounting for 94.7% of all Montura residents.
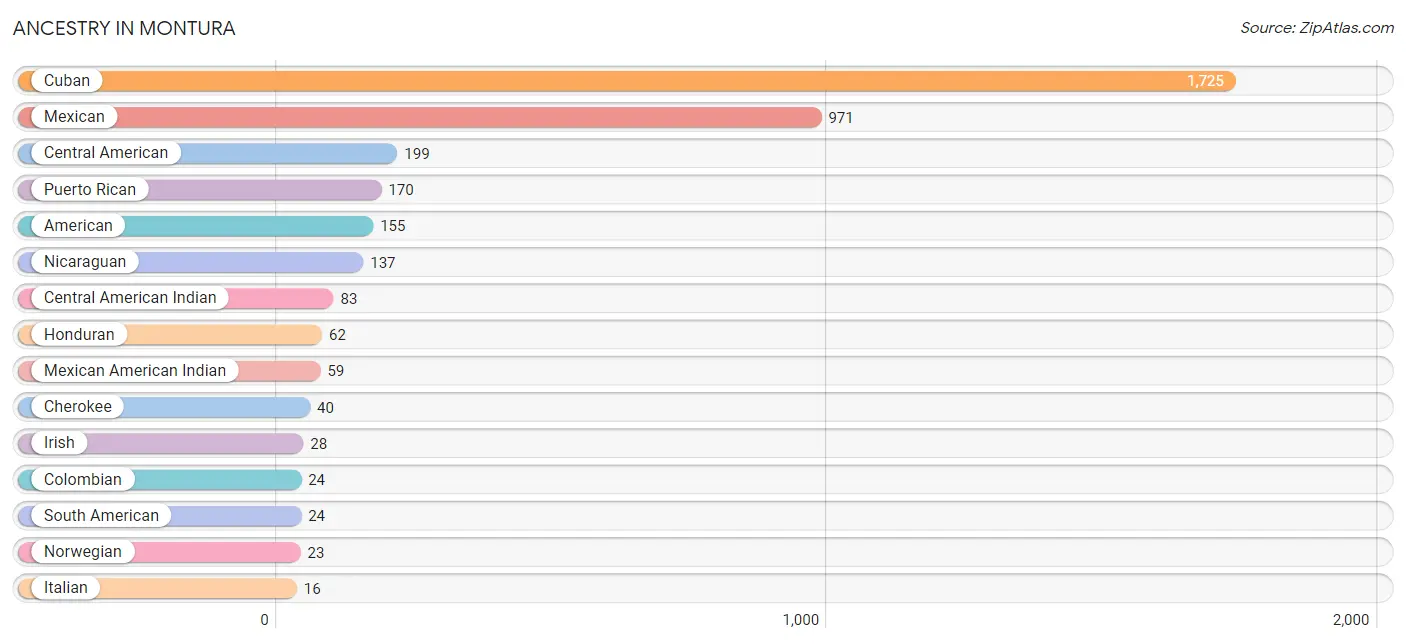
| Ancestry | # Population | % Population |
| American | 155 | 4.6% |
| Central American | 199 | 5.9% |
| Central American Indian | 83 | 2.4% |
| Cherokee | 40 | 1.2% |
| Colombian | 24 | 0.7% |
| Cuban | 1,725 | 50.7% |
| Dominican | 13 | 0.4% |
| French | 7 | 0.2% |
| German | 9 | 0.3% |
| Honduran | 62 | 1.8% |
| Irish | 28 | 0.8% |
| Italian | 16 | 0.5% |
| Mexican | 971 | 28.6% |
| Mexican American Indian | 59 | 1.7% |
| Nicaraguan | 137 | 4.0% |
| Norwegian | 23 | 0.7% |
| Puerto Rican | 170 | 5.0% |
| South American | 24 | 0.7% | View All 18 Rows |
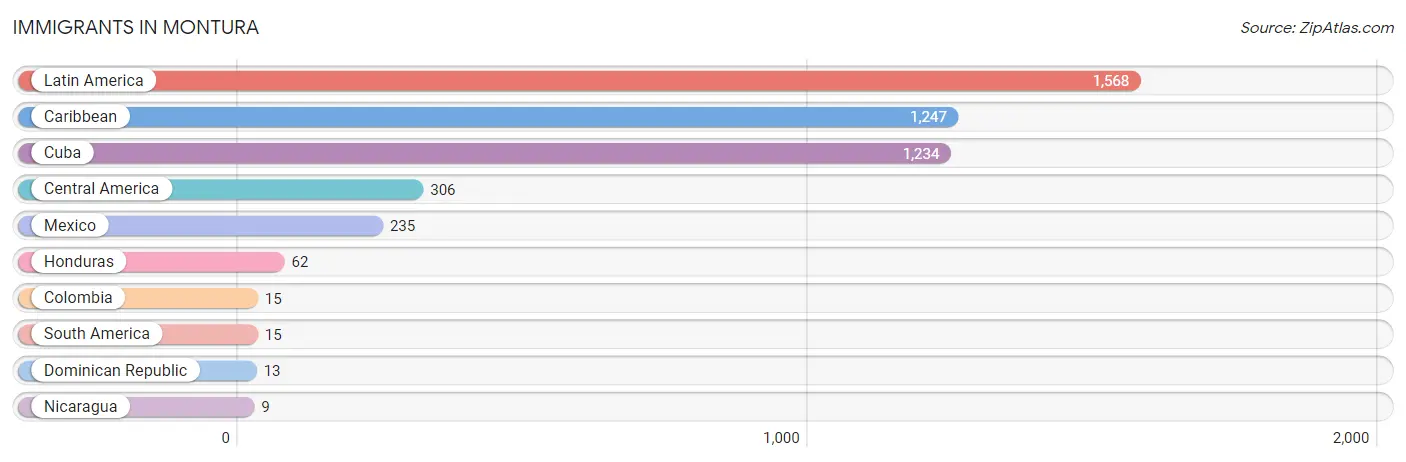
Immigrants in Montura
The most numerous immigrant groups reported in Montura came from Latin America (1,568 | 46.1%), Caribbean (1,247 | 36.7%), Cuba (1,234 | 36.3%), Central America (306 | 9.0%), and Mexico (235 | 6.9%), together accounting for 135.0% of all Montura residents.
| Immigration Origin | # Population | % Population |
| Caribbean | 1,247 | 36.7% |
| Central America | 306 | 9.0% |
| Colombia | 15 | 0.4% |
| Cuba | 1,234 | 36.3% |
| Dominican Republic | 13 | 0.4% |
| Honduras | 62 | 1.8% |
| Latin America | 1,568 | 46.1% |
| Mexico | 235 | 6.9% |
| Nicaragua | 9 | 0.3% |
| South America | 15 | 0.4% | View All 10 Rows |
Sex and Age in Montura
Sex and Age in Montura
The most populous age groups in Montura are 40 to 44 Years (368 | 19.5%) for men and 65 to 69 Years (230 | 15.2%) for women.
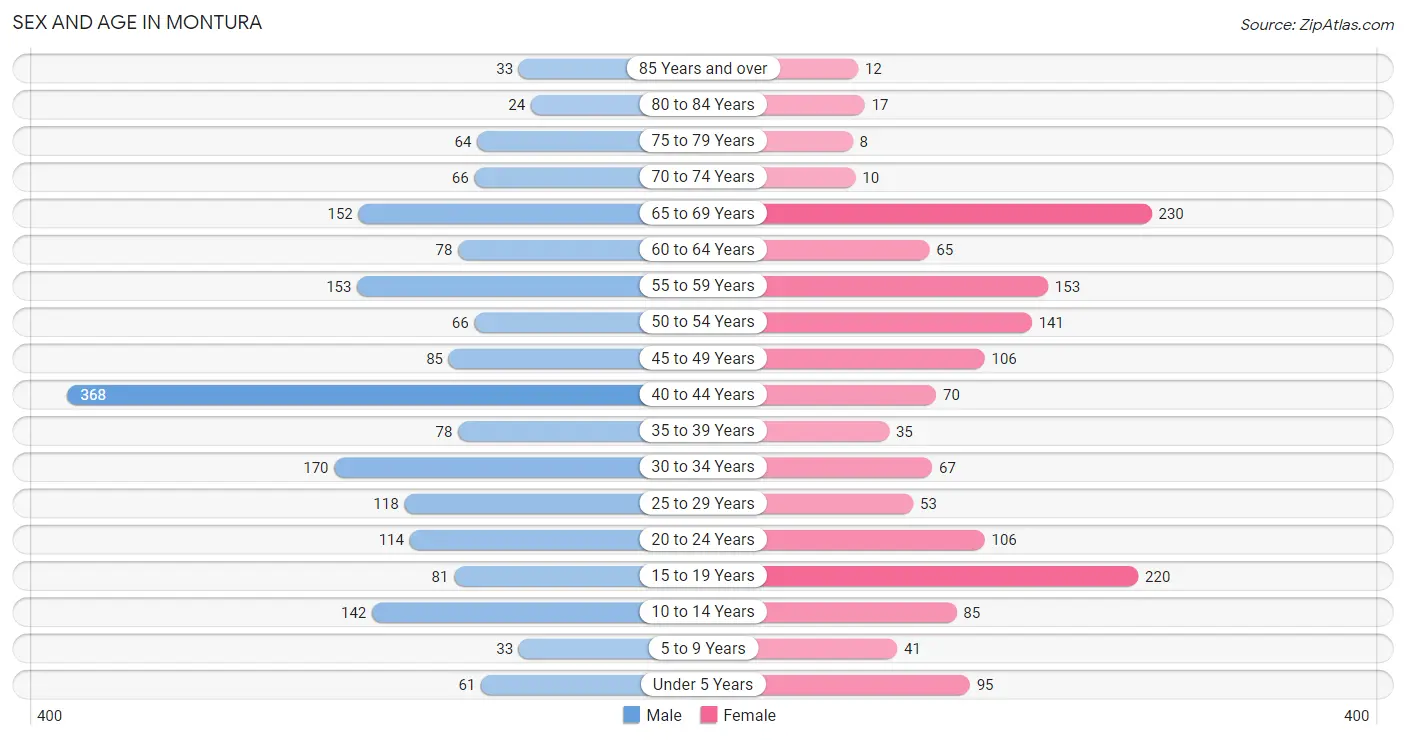
| Age Bracket | Male | Female |
| Under 5 Years | 61 (3.2%) | 95 (6.3%) |
| 5 to 9 Years | 33 (1.8%) | 41 (2.7%) |
| 10 to 14 Years | 142 (7.5%) | 85 (5.6%) |
| 15 to 19 Years | 81 (4.3%) | 220 (14.5%) |
| 20 to 24 Years | 114 (6.0%) | 106 (7.0%) |
| 25 to 29 Years | 118 (6.3%) | 53 (3.5%) |
| 30 to 34 Years | 170 (9.0%) | 67 (4.4%) |
| 35 to 39 Years | 78 (4.1%) | 35 (2.3%) |
| 40 to 44 Years | 368 (19.5%) | 70 (4.6%) |
| 45 to 49 Years | 85 (4.5%) | 106 (7.0%) |
| 50 to 54 Years | 66 (3.5%) | 141 (9.3%) |
| 55 to 59 Years | 153 (8.1%) | 153 (10.1%) |
| 60 to 64 Years | 78 (4.1%) | 65 (4.3%) |
| 65 to 69 Years | 152 (8.1%) | 230 (15.2%) |
| 70 to 74 Years | 66 (3.5%) | 10 (0.7%) |
| 75 to 79 Years | 64 (3.4%) | 8 (0.5%) |
| 80 to 84 Years | 24 (1.3%) | 17 (1.1%) |
| 85 Years and over | 33 (1.8%) | 12 (0.8%) |
| Total | 1,886 (100.0%) | 1,514 (100.0%) |
Families and Households in Montura
Median Family Size in Montura
The median family size in Montura is 2.52 persons per family, with single male/father families (163 | 15.3%) accounting for the largest median family size of 3.01 persons per family. On the other hand, single female/mother families (184 | 17.3%) represent the smallest median family size with 1.96 persons per family.
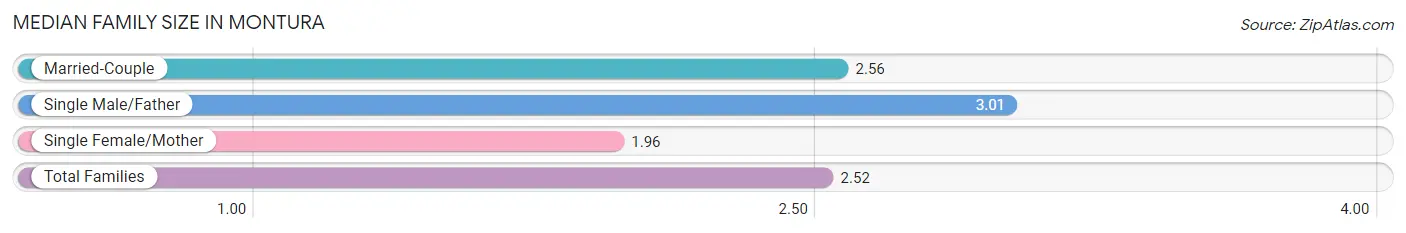
| Family Type | # Families | Family Size |
| Married-Couple | 719 (67.4%) | 2.56 |
| Single Male/Father | 163 (15.3%) | 3.01 |
| Single Female/Mother | 184 (17.3%) | 1.96 |
| Total Families | 1,066 (100.0%) | 2.52 |
Median Household Size in Montura
The median household size in Montura is 2.32 persons per household, with single male/father households (163 | 11.1%) accounting for the largest median household size of 3.72 persons per household. non-family households (397 | 27.1%) represent the smallest median household size with 1.22 persons per household.
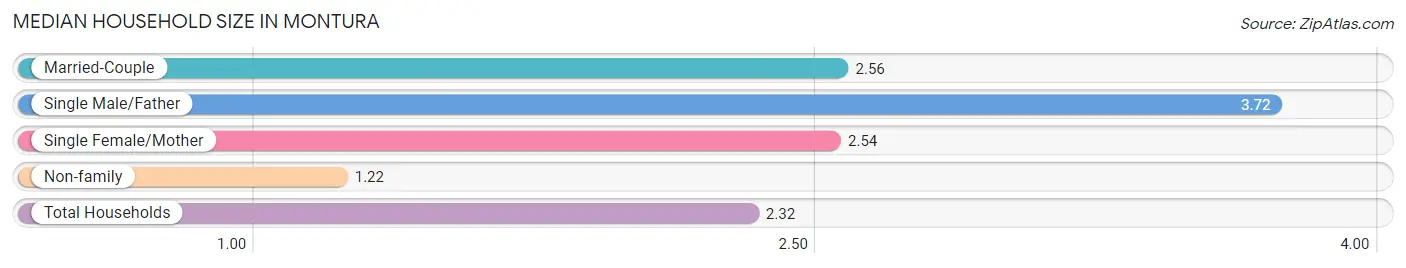
| Household Type | # Households | Household Size |
| Married-Couple | 719 (49.1%) | 2.56 |
| Single Male/Father | 163 (11.1%) | 3.72 |
| Single Female/Mother | 184 (12.6%) | 2.54 |
| Non-family | 397 (27.1%) | 1.22 |
| Total Households | 1,463 (100.0%) | 2.32 |
Household Size by Marriage Status in Montura
Out of a total of 1,463 households in Montura, 1,066 (72.9%) are family households, while 397 (27.1%) are nonfamily households. The most numerous type of family households are 4-person households, comprising 351, and the most common type of nonfamily households are 1-person households, comprising 323.
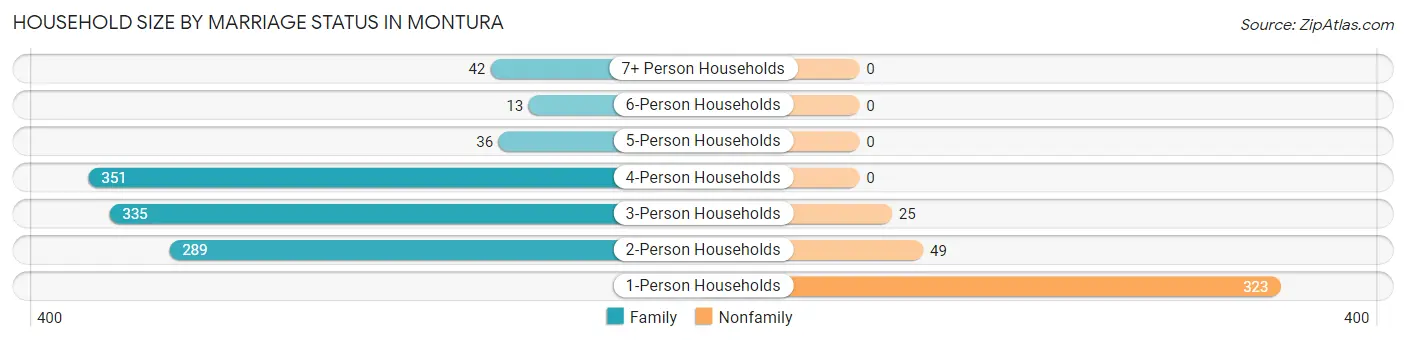
| Household Size | Family Households | Nonfamily Households |
| 1-Person Households | - | 323 (22.1%) |
| 2-Person Households | 289 (19.8%) | 49 (3.4%) |
| 3-Person Households | 335 (22.9%) | 25 (1.7%) |
| 4-Person Households | 351 (24.0%) | 0 (0.0%) |
| 5-Person Households | 36 (2.5%) | 0 (0.0%) |
| 6-Person Households | 13 (0.9%) | 0 (0.0%) |
| 7+ Person Households | 42 (2.9%) | 0 (0.0%) |
| Total | 1,066 (72.9%) | 397 (27.1%) |
Female Fertility in Montura
Fertility by Age in Montura
Average fertility rate in Montura is 7.0 births per 1,000 women. Women in the age bracket of 20 to 34 years have the highest fertility rate with 22.0 births per 1,000 women. Women in the age bracket of 20 to 34 years acount for 100.0% of all women with births.
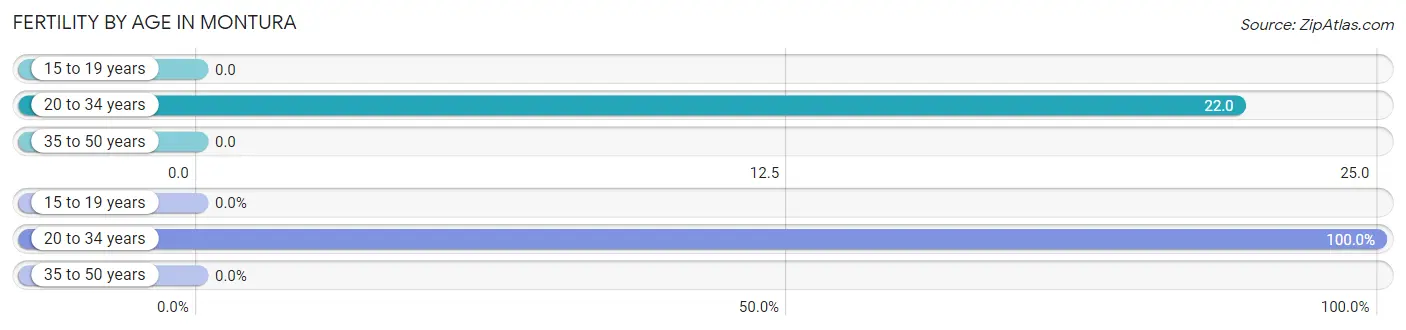
| Age Bracket | Women with Births | Births / 1,000 Women |
| 15 to 19 years | 0 (0.0%) | 0.0 |
| 20 to 34 years | 5 (100.0%) | 22.0 |
| 35 to 50 years | 0 (0.0%) | 0.0 |
| Total | 5 (100.0%) | 7.0 |
Fertility by Age by Marriage Status in Montura
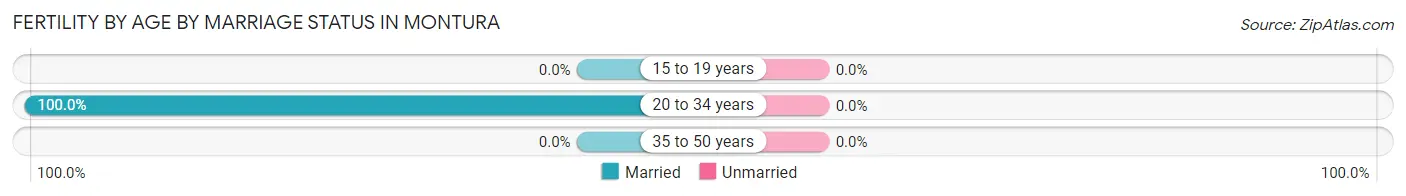
| Age Bracket | Married | Unmarried |
| 15 to 19 years | 0 (0.0%) | 0 (0.0%) |
| 20 to 34 years | 5 (100.0%) | 0 (0.0%) |
| 35 to 50 years | 0 (0.0%) | 0 (0.0%) |
| Total | 5 (100.0%) | 0 (0.0%) |
Fertility by Education in Montura
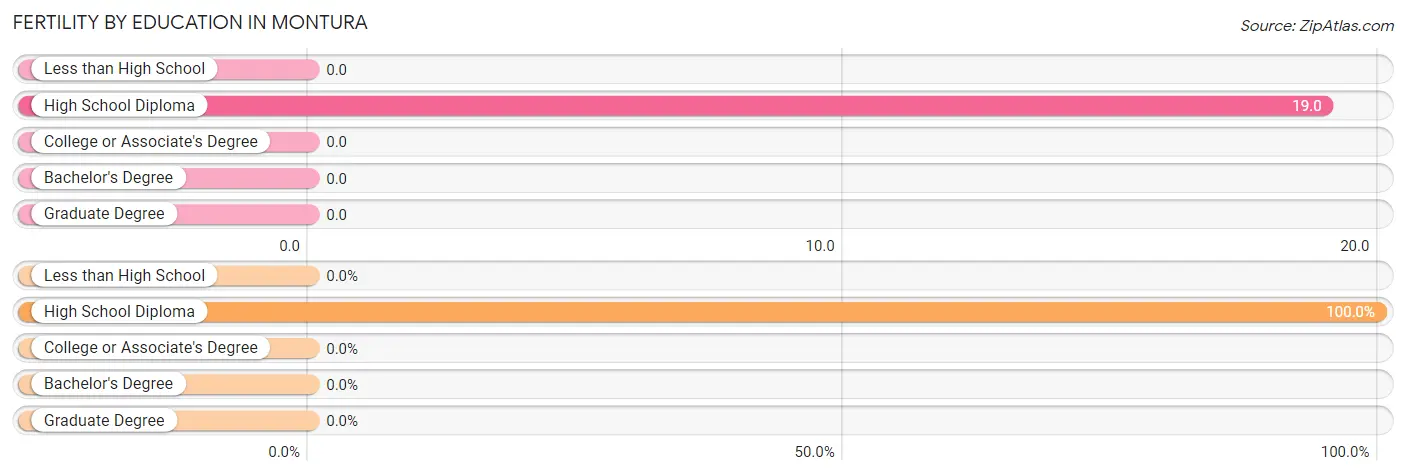
| Educational Attainment | Women with Births | Births / 1,000 Women |
| Less than High School | 0 (0.0%) | 0.0 |
| High School Diploma | 5 (100.0%) | 19.0 |
| College or Associate's Degree | 0 (0.0%) | 0.0 |
| Bachelor's Degree | 0 (0.0%) | 0.0 |
| Graduate Degree | 0 (0.0%) | 0.0 |
| Total | 5 (100.0%) | 7.0 |
Fertility by Education by Marriage Status in Montura
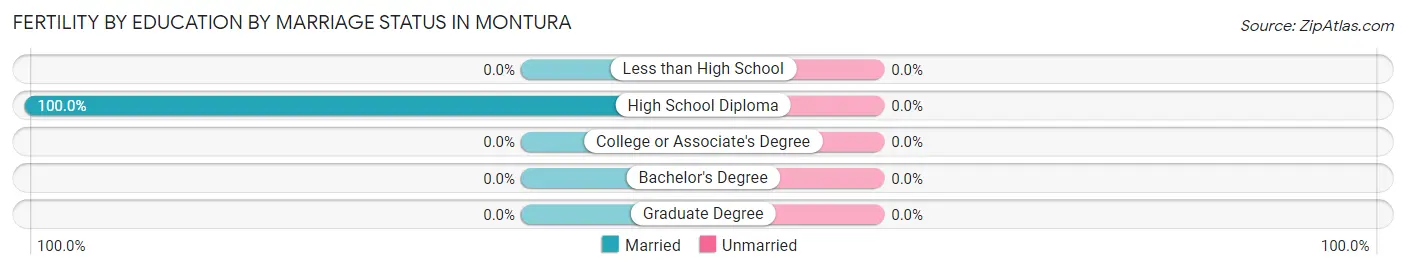
| Educational Attainment | Married | Unmarried |
| Less than High School | 0 (0.0%) | 0 (0.0%) |
| High School Diploma | 5 (100.0%) | 0 (0.0%) |
| College or Associate's Degree | 0 (0.0%) | 0 (0.0%) |
| Bachelor's Degree | 0 (0.0%) | 0 (0.0%) |
| Graduate Degree | 0 (0.0%) | 0 (0.0%) |
| Total | 5 (100.0%) | 0 (0.0%) |
Employment Characteristics in Montura
Employment by Class of Employer in Montura
Among the 1,417 employed individuals in Montura, private company employees (858 | 60.6%), state government employees (177 | 12.5%), and self-employed (incorporated) (156 | 11.0%) make up the most common classes of employment.
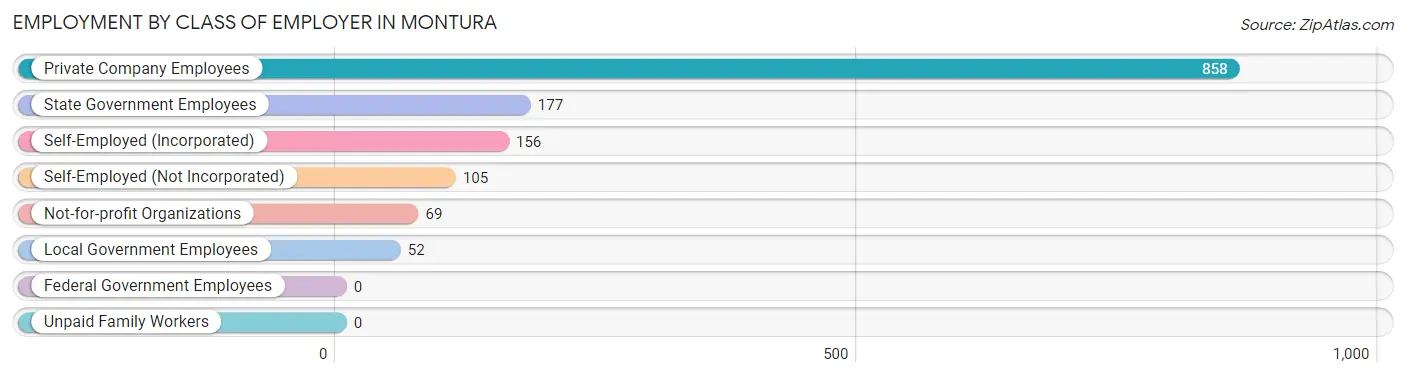
| Employer Class | # Employees | % Employees |
| Private Company Employees | 858 | 60.6% |
| Self-Employed (Incorporated) | 156 | 11.0% |
| Self-Employed (Not Incorporated) | 105 | 7.4% |
| Not-for-profit Organizations | 69 | 4.9% |
| Local Government Employees | 52 | 3.7% |
| State Government Employees | 177 | 12.5% |
| Federal Government Employees | 0 | 0.0% |
| Unpaid Family Workers | 0 | 0.0% |
| Total | 1,417 | 100.0% |
Employment Status by Age in Montura
According to the labor force statistics for Montura, out of the total population over 16 years of age (2,854), 55.4% or 1,581 individuals are in the labor force, with 6.8% or 108 of them unemployed. The age group with the highest labor force participation rate is 20 to 24 years, with 79.5% or 175 individuals in the labor force. Within the labor force, the 16 to 19 years age range has the highest percentage of unemployed individuals, with 95.5% or 42 of them being unemployed.
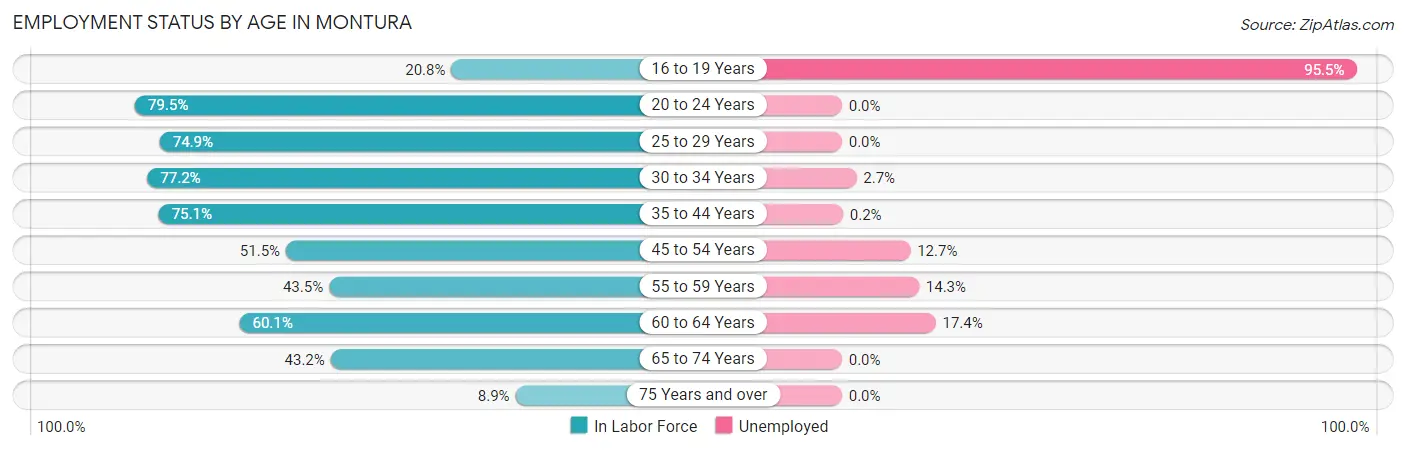
| Age Bracket | In Labor Force | Unemployed |
| 16 to 19 Years | 44 (20.8%) | 42 (95.5%) |
| 20 to 24 Years | 175 (79.5%) | 0 (0.0%) |
| 25 to 29 Years | 128 (74.9%) | 0 (0.0%) |
| 30 to 34 Years | 183 (77.2%) | 5 (2.7%) |
| 35 to 44 Years | 414 (75.1%) | 1 (0.2%) |
| 45 to 54 Years | 205 (51.5%) | 26 (12.7%) |
| 55 to 59 Years | 133 (43.5%) | 19 (14.3%) |
| 60 to 64 Years | 86 (60.1%) | 15 (17.4%) |
| 65 to 74 Years | 198 (43.2%) | 0 (0.0%) |
| 75 Years and over | 14 (8.9%) | 0 (0.0%) |
| Total | 1,581 (55.4%) | 108 (6.8%) |
Employment Status by Educational Attainment in Montura
According to labor force statistics for Montura, 63.6% of individuals (1,149) out of the total population between 25 and 64 years of age (1,806) are in the labor force, with 5.7% or 65 of them being unemployed. The group with the highest labor force participation rate are those with the educational attainment of bachelor's degree or higher, with 93.8% or 75 individuals in the labor force. Within the labor force, individuals with college / associate degree education have the highest percentage of unemployment, with 11.4% or 26 of them being unemployed.
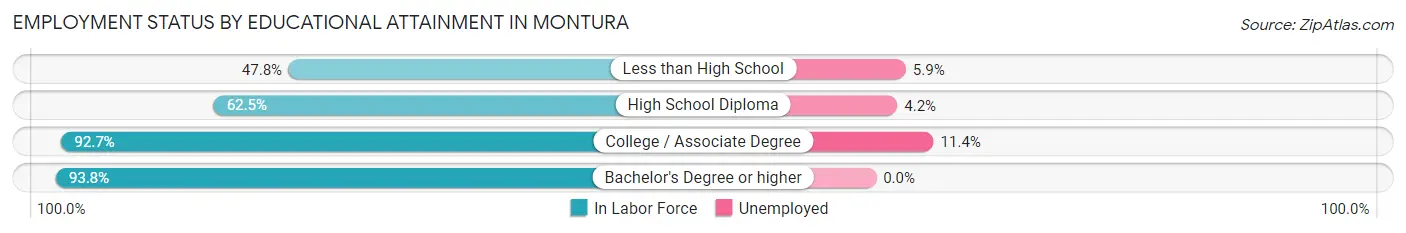
| Educational Attainment | In Labor Force | Unemployed |
| Less than High School | 256 (47.8%) | 32 (5.9%) |
| High School Diploma | 590 (62.5%) | 40 (4.2%) |
| College / Associate Degree | 228 (92.7%) | 28 (11.4%) |
| Bachelor's Degree or higher | 75 (93.8%) | 0 (0.0%) |
| Total | 1,149 (63.6%) | 103 (5.7%) |
Employment Occupations by Sex in Montura
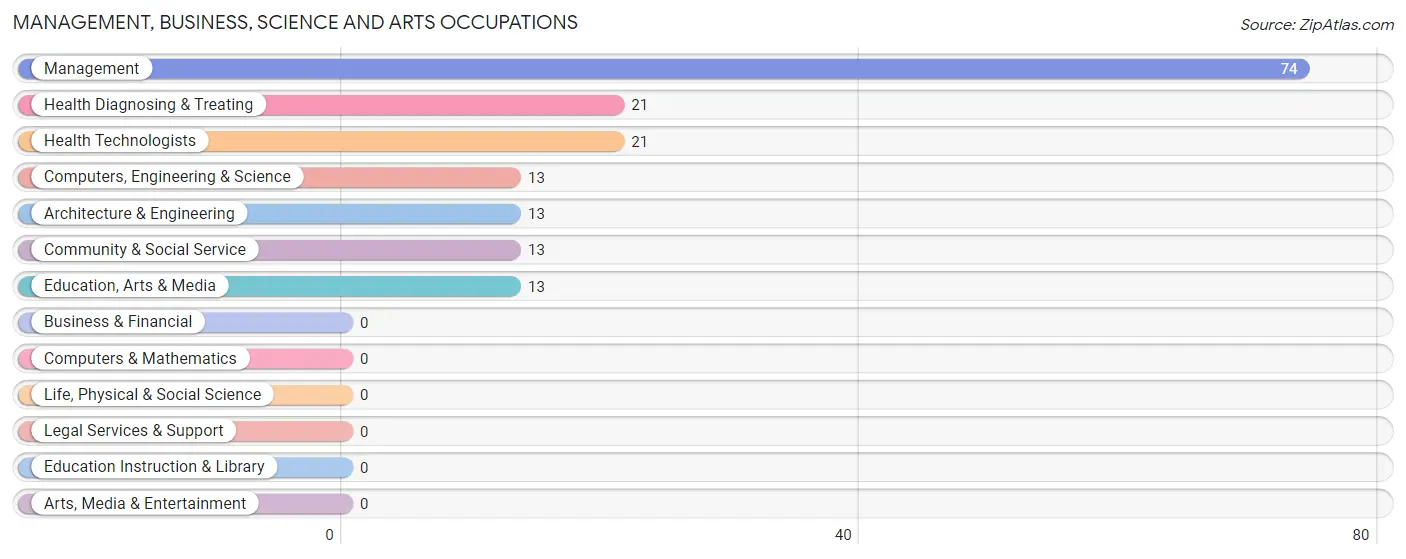
Management, Business, Science and Arts Occupations
The most common Management, Business, Science and Arts occupations in Montura are Management (74 | 5.0%), Health Diagnosing & Treating (21 | 1.4%), Health Technologists (21 | 1.4%), Computers, Engineering & Science (13 | 0.9%), and Architecture & Engineering (13 | 0.9%).
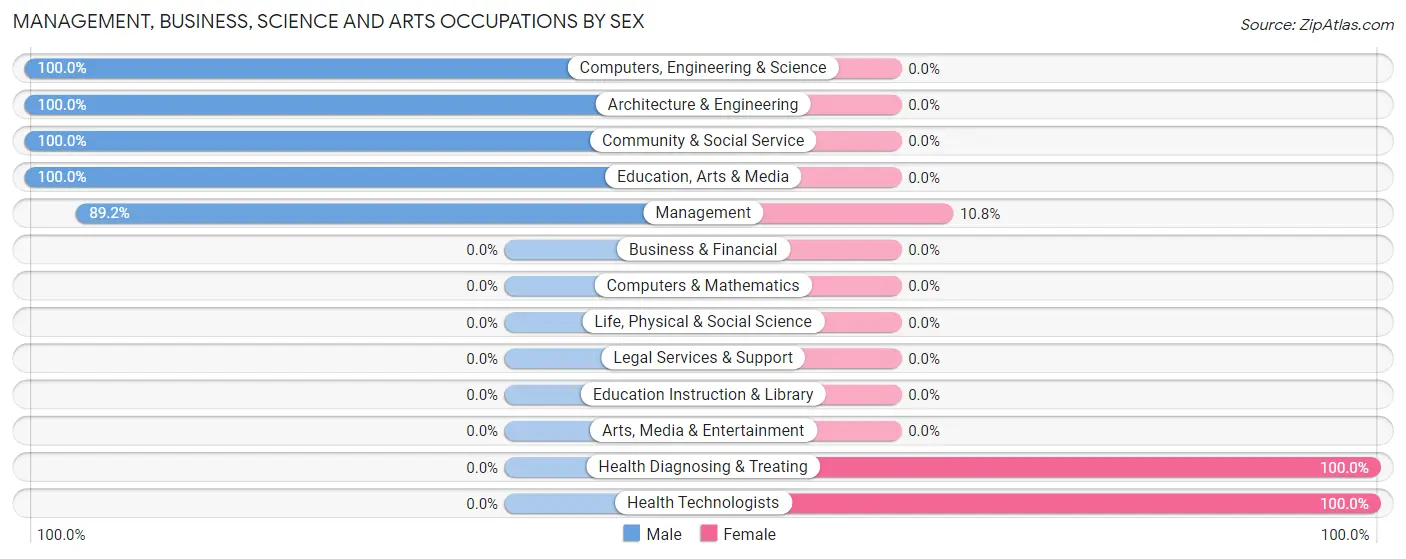
Management, Business, Science and Arts Occupations by Sex
Within the Management, Business, Science and Arts occupations in Montura, the most male-oriented occupations are Computers, Engineering & Science (100.0%), Architecture & Engineering (100.0%), and Community & Social Service (100.0%), while the most female-oriented occupations are Health Diagnosing & Treating (100.0%), Health Technologists (100.0%), and Management (10.8%).
| Occupation | Male | Female |
| Management | 66 (89.2%) | 8 (10.8%) |
| Business & Financial | 0 (0.0%) | 0 (0.0%) |
| Computers, Engineering & Science | 13 (100.0%) | 0 (0.0%) |
| Computers & Mathematics | 0 (0.0%) | 0 (0.0%) |
| Architecture & Engineering | 13 (100.0%) | 0 (0.0%) |
| Life, Physical & Social Science | 0 (0.0%) | 0 (0.0%) |
| Community & Social Service | 13 (100.0%) | 0 (0.0%) |
| Education, Arts & Media | 13 (100.0%) | 0 (0.0%) |
| Legal Services & Support | 0 (0.0%) | 0 (0.0%) |
| Education Instruction & Library | 0 (0.0%) | 0 (0.0%) |
| Arts, Media & Entertainment | 0 (0.0%) | 0 (0.0%) |
| Health Diagnosing & Treating | 0 (0.0%) | 21 (100.0%) |
| Health Technologists | 0 (0.0%) | 21 (100.0%) |
| Total (Category) | 92 (76.0%) | 29 (24.0%) |
| Total (Overall) | 884 (60.1%) | 588 (40.0%) |
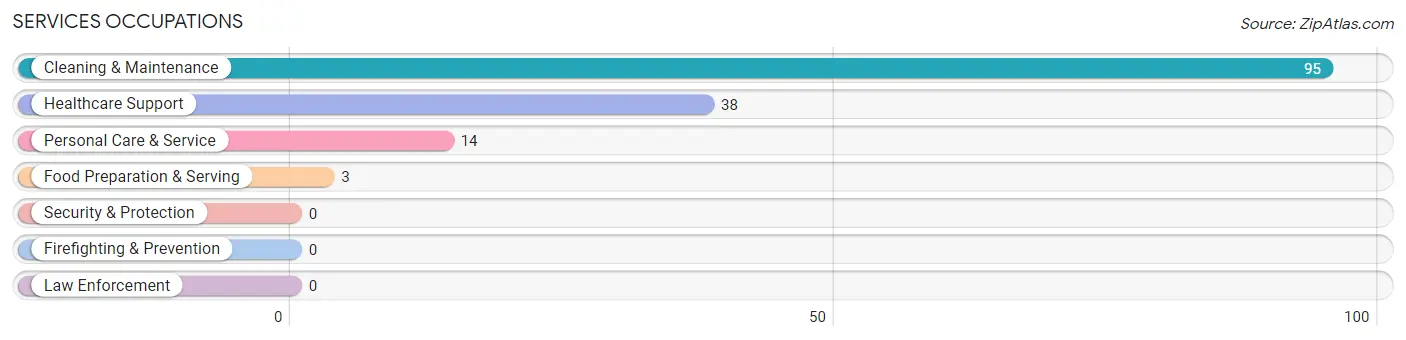
Services Occupations
The most common Services occupations in Montura are Cleaning & Maintenance (95 | 6.5%), Healthcare Support (38 | 2.6%), Personal Care & Service (14 | 0.9%), and Food Preparation & Serving (3 | 0.2%).
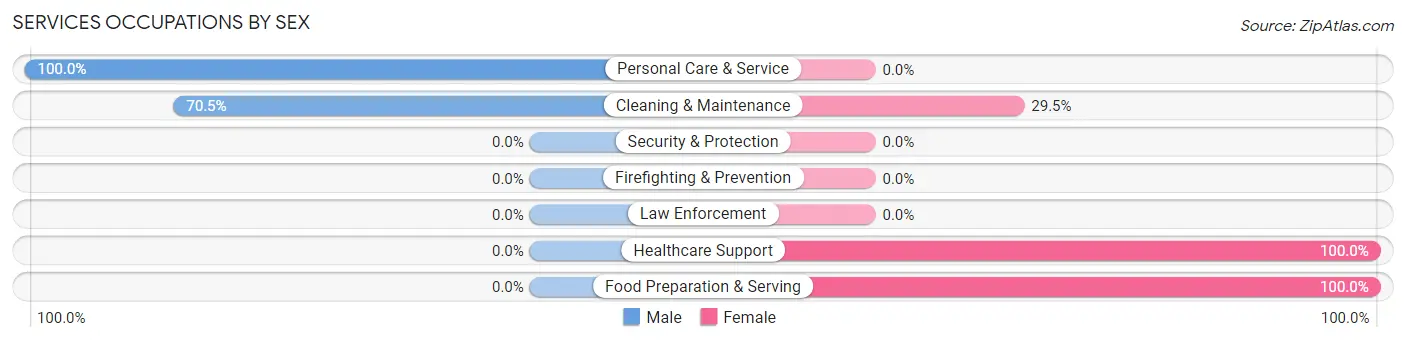
Services Occupations by Sex
Within the Services occupations in Montura, the most male-oriented occupations are Personal Care & Service (100.0%), and Cleaning & Maintenance (70.5%), while the most female-oriented occupations are Healthcare Support (100.0%), Food Preparation & Serving (100.0%), and Cleaning & Maintenance (29.5%).
| Occupation | Male | Female |
| Healthcare Support | 0 (0.0%) | 38 (100.0%) |
| Security & Protection | 0 (0.0%) | 0 (0.0%) |
| Firefighting & Prevention | 0 (0.0%) | 0 (0.0%) |
| Law Enforcement | 0 (0.0%) | 0 (0.0%) |
| Food Preparation & Serving | 0 (0.0%) | 3 (100.0%) |
| Cleaning & Maintenance | 67 (70.5%) | 28 (29.5%) |
| Personal Care & Service | 14 (100.0%) | 0 (0.0%) |
| Total (Category) | 81 (54.0%) | 69 (46.0%) |
| Total (Overall) | 884 (60.1%) | 588 (40.0%) |
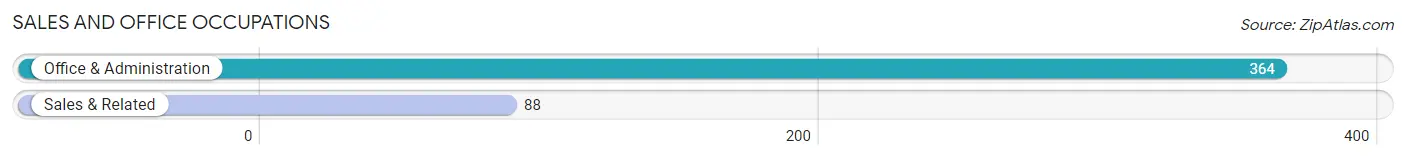
Sales and Office Occupations
The most common Sales and Office occupations in Montura are Office & Administration (364 | 24.7%), and Sales & Related (88 | 6.0%).
Sales and Office Occupations by Sex
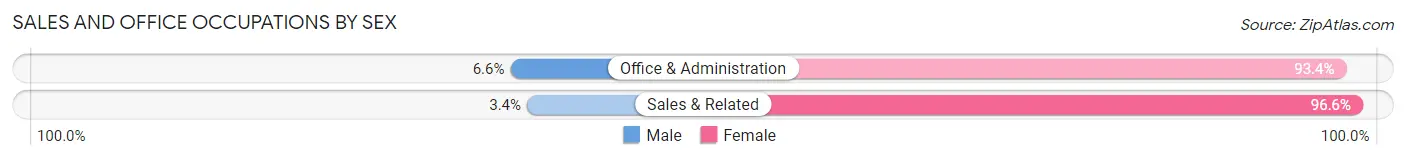
| Occupation | Male | Female |
| Sales & Related | 3 (3.4%) | 85 (96.6%) |
| Office & Administration | 24 (6.6%) | 340 (93.4%) |
| Total (Category) | 27 (6.0%) | 425 (94.0%) |
| Total (Overall) | 884 (60.1%) | 588 (40.0%) |
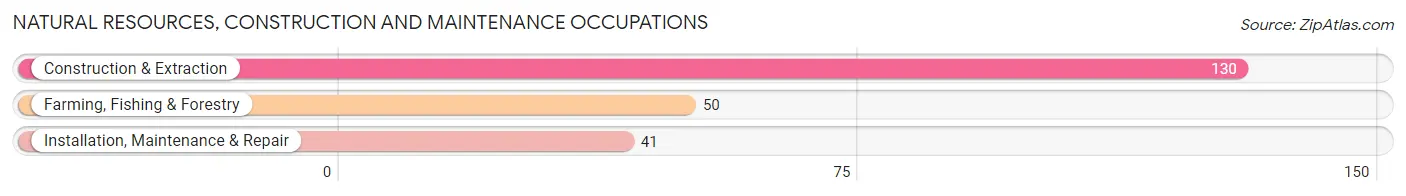
Natural Resources, Construction and Maintenance Occupations
The most common Natural Resources, Construction and Maintenance occupations in Montura are Construction & Extraction (130 | 8.8%), Farming, Fishing & Forestry (50 | 3.4%), and Installation, Maintenance & Repair (41 | 2.8%).
Natural Resources, Construction and Maintenance Occupations by Sex
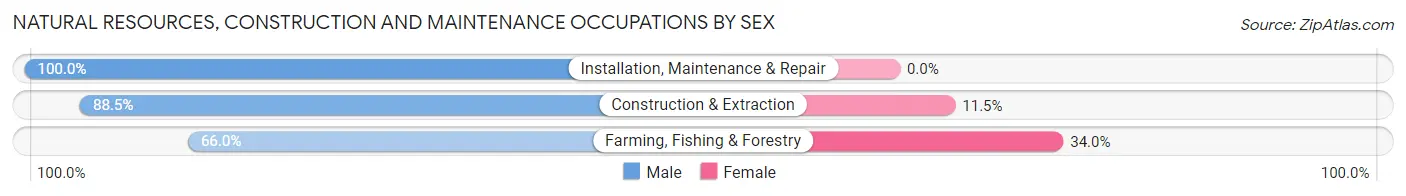
| Occupation | Male | Female |
| Farming, Fishing & Forestry | 33 (66.0%) | 17 (34.0%) |
| Construction & Extraction | 115 (88.5%) | 15 (11.5%) |
| Installation, Maintenance & Repair | 41 (100.0%) | 0 (0.0%) |
| Total (Category) | 189 (85.5%) | 32 (14.5%) |
| Total (Overall) | 884 (60.1%) | 588 (40.0%) |
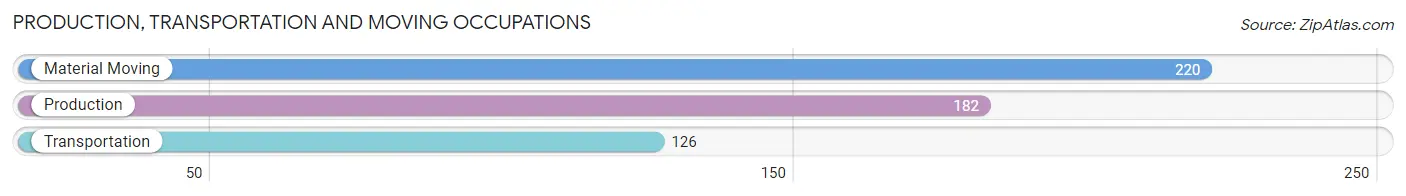
Production, Transportation and Moving Occupations
The most common Production, Transportation and Moving occupations in Montura are Material Moving (220 | 14.9%), Production (182 | 12.4%), and Transportation (126 | 8.6%).
Production, Transportation and Moving Occupations by Sex
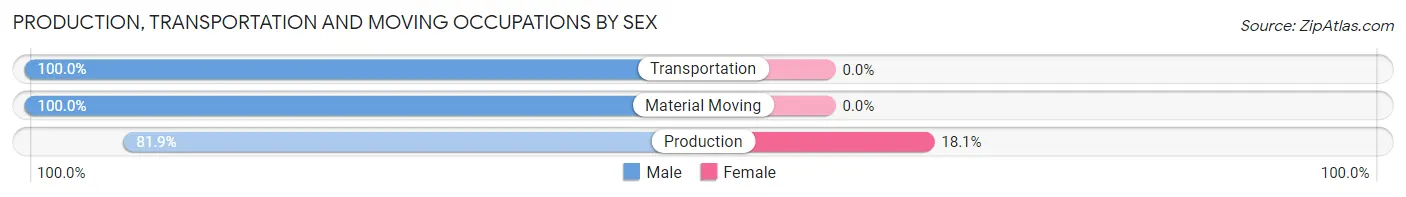
| Occupation | Male | Female |
| Production | 149 (81.9%) | 33 (18.1%) |
| Transportation | 126 (100.0%) | 0 (0.0%) |
| Material Moving | 220 (100.0%) | 0 (0.0%) |
| Total (Category) | 495 (93.8%) | 33 (6.2%) |
| Total (Overall) | 884 (60.1%) | 588 (40.0%) |
Employment Industries by Sex in Montura
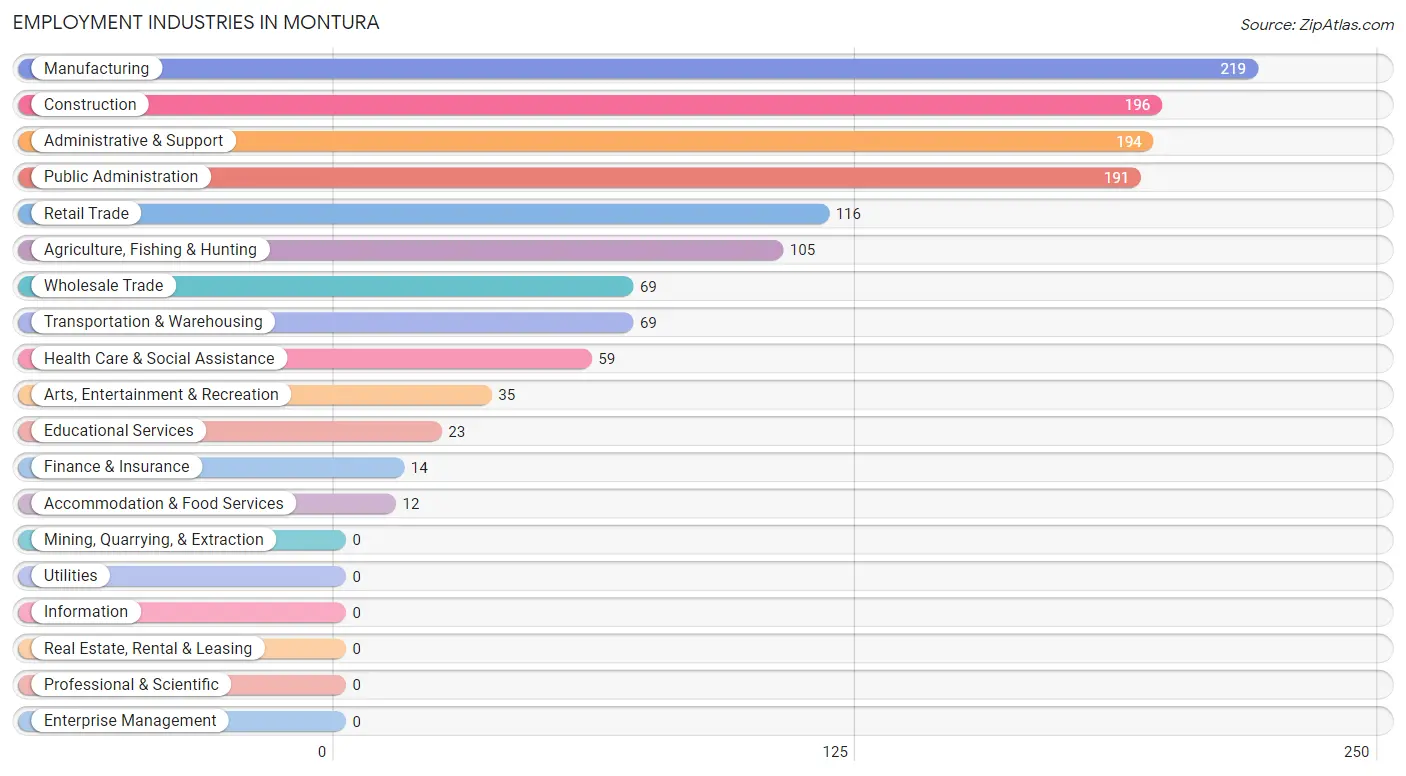
Employment Industries in Montura
The major employment industries in Montura include Manufacturing (219 | 14.9%), Construction (196 | 13.3%), Administrative & Support (194 | 13.2%), Public Administration (191 | 13.0%), and Retail Trade (116 | 7.9%).
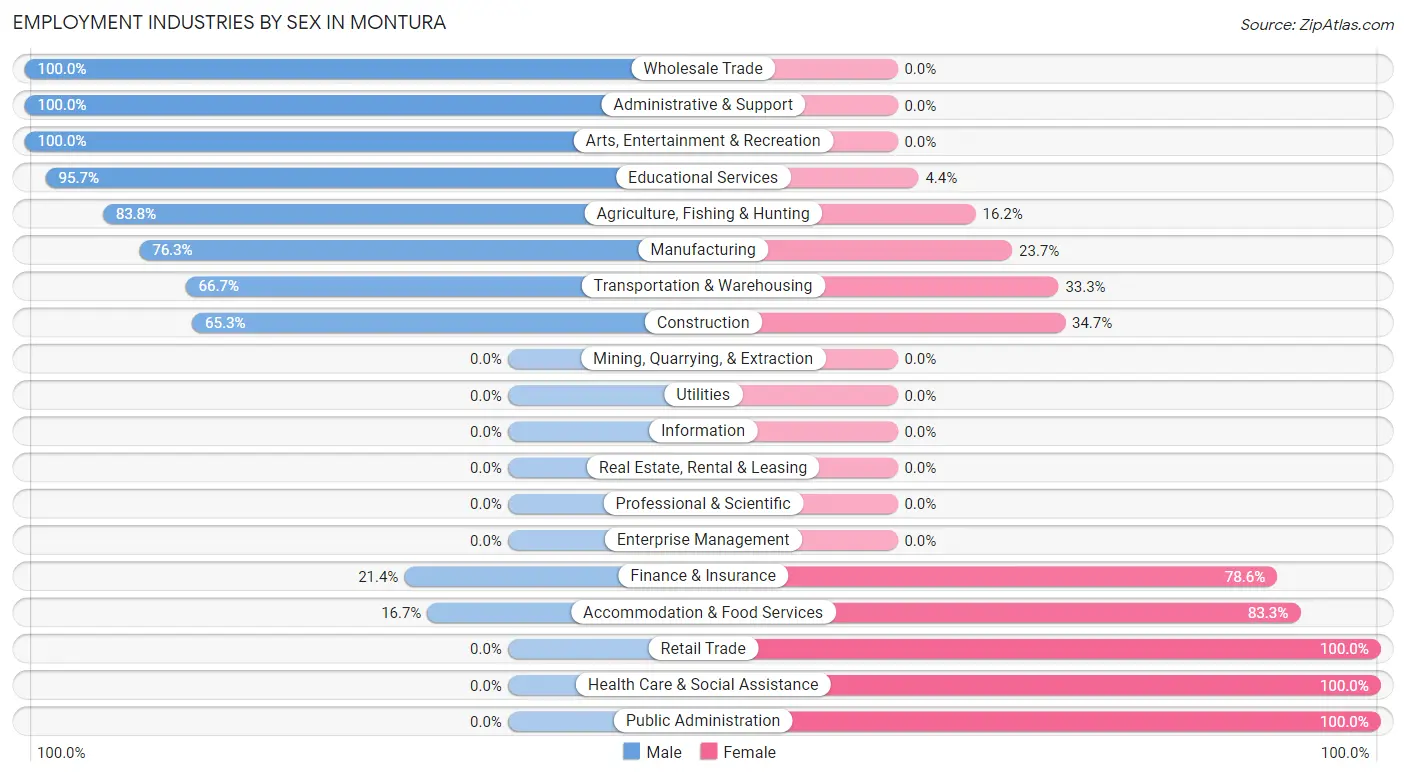
Employment Industries by Sex in Montura
The Montura industries that see more men than women are Wholesale Trade (100.0%), Administrative & Support (100.0%), and Arts, Entertainment & Recreation (100.0%), whereas the industries that tend to have a higher number of women are Retail Trade (100.0%), Health Care & Social Assistance (100.0%), and Public Administration (100.0%).
| Industry | Male | Female |
| Agriculture, Fishing & Hunting | 88 (83.8%) | 17 (16.2%) |
| Mining, Quarrying, & Extraction | 0 (0.0%) | 0 (0.0%) |
| Construction | 128 (65.3%) | 68 (34.7%) |
| Manufacturing | 167 (76.3%) | 52 (23.7%) |
| Wholesale Trade | 69 (100.0%) | 0 (0.0%) |
| Retail Trade | 0 (0.0%) | 116 (100.0%) |
| Transportation & Warehousing | 46 (66.7%) | 23 (33.3%) |
| Utilities | 0 (0.0%) | 0 (0.0%) |
| Information | 0 (0.0%) | 0 (0.0%) |
| Finance & Insurance | 3 (21.4%) | 11 (78.6%) |
| Real Estate, Rental & Leasing | 0 (0.0%) | 0 (0.0%) |
| Professional & Scientific | 0 (0.0%) | 0 (0.0%) |
| Enterprise Management | 0 (0.0%) | 0 (0.0%) |
| Administrative & Support | 194 (100.0%) | 0 (0.0%) |
| Educational Services | 22 (95.7%) | 1 (4.3%) |
| Health Care & Social Assistance | 0 (0.0%) | 59 (100.0%) |
| Arts, Entertainment & Recreation | 35 (100.0%) | 0 (0.0%) |
| Accommodation & Food Services | 2 (16.7%) | 10 (83.3%) |
| Public Administration | 0 (0.0%) | 191 (100.0%) |
| Total | 884 (60.1%) | 588 (40.0%) |
Education in Montura
School Enrollment in Montura
The most common levels of schooling among the 676 students in Montura are high school (302 | 44.7%), middle school (135 | 20.0%), and college / undergraduate (112 | 16.6%).
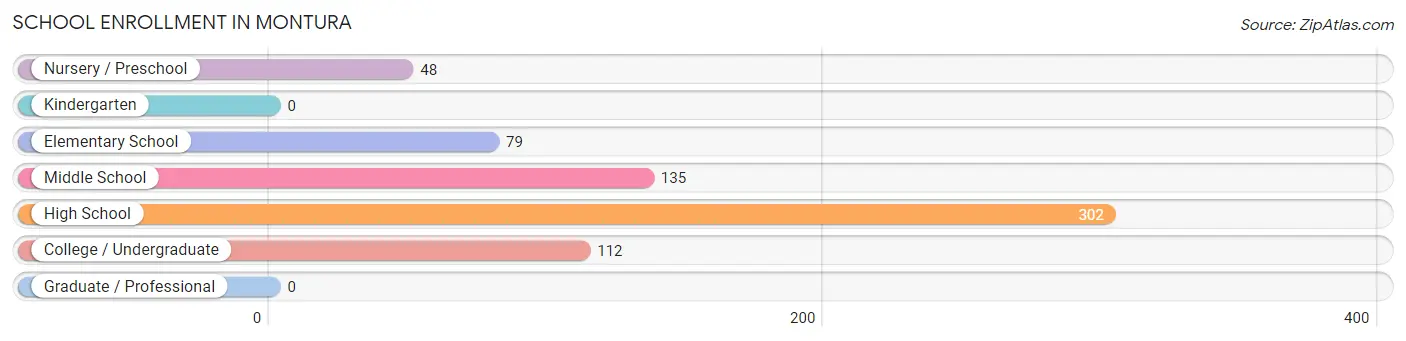
| School Level | # Students | % Students |
| Nursery / Preschool | 48 | 7.1% |
| Kindergarten | 0 | 0.0% |
| Elementary School | 79 | 11.7% |
| Middle School | 135 | 20.0% |
| High School | 302 | 44.7% |
| College / Undergraduate | 112 | 16.6% |
| Graduate / Professional | 0 | 0.0% |
| Total | 676 | 100.0% |
School Enrollment by Age by Funding Source in Montura
Out of a total of 676 students who are enrolled in schools in Montura, 44 (6.5%) attend a private institution, while the remaining 632 (93.5%) are enrolled in public schools. The age group of 35 years and over has the highest likelihood of being enrolled in private schools, with 8 (72.7% in the age bracket) enrolled. Conversely, the age group of 3 to 4 year olds has the lowest likelihood of being enrolled in a private school, with 24 (100.0% in the age bracket) attending a public institution.
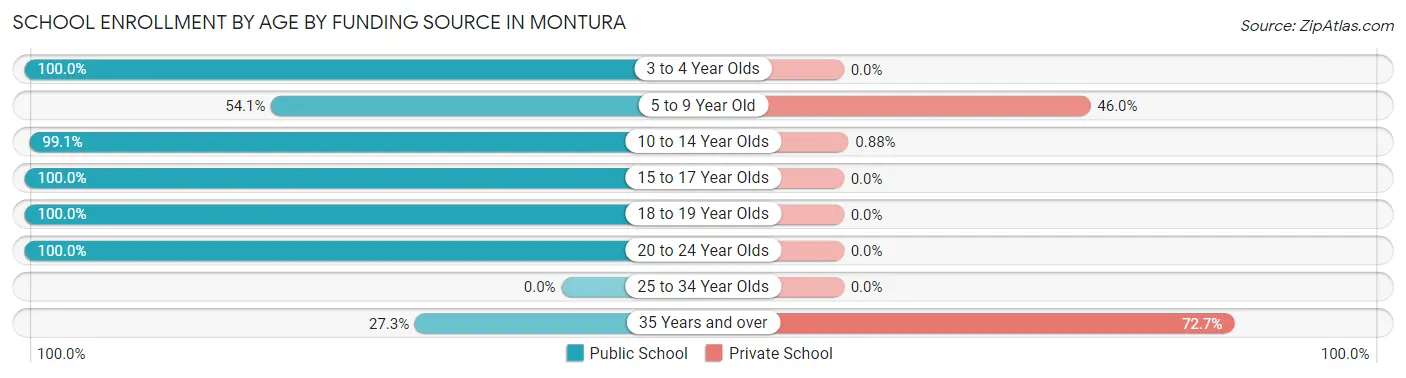
| Age Bracket | Public School | Private School |
| 3 to 4 Year Olds | 24 (100.0%) | 0 (0.0%) |
| 5 to 9 Year Old | 40 (54.0%) | 34 (46.0%) |
| 10 to 14 Year Olds | 225 (99.1%) | 2 (0.9%) |
| 15 to 17 Year Olds | 210 (100.0%) | 0 (0.0%) |
| 18 to 19 Year Olds | 49 (100.0%) | 0 (0.0%) |
| 20 to 24 Year Olds | 81 (100.0%) | 0 (0.0%) |
| 25 to 34 Year Olds | 0 (0.0%) | 0 (0.0%) |
| 35 Years and over | 3 (27.3%) | 8 (72.7%) |
| Total | 632 (93.5%) | 44 (6.5%) |
Educational Attainment by Field of Study in Montura
Communications (53 | 66.2%), business (22 | 27.5%), and education (5 | 6.2%) are the most common fields of study among 80 individuals in Montura who have obtained a bachelor's degree or higher.
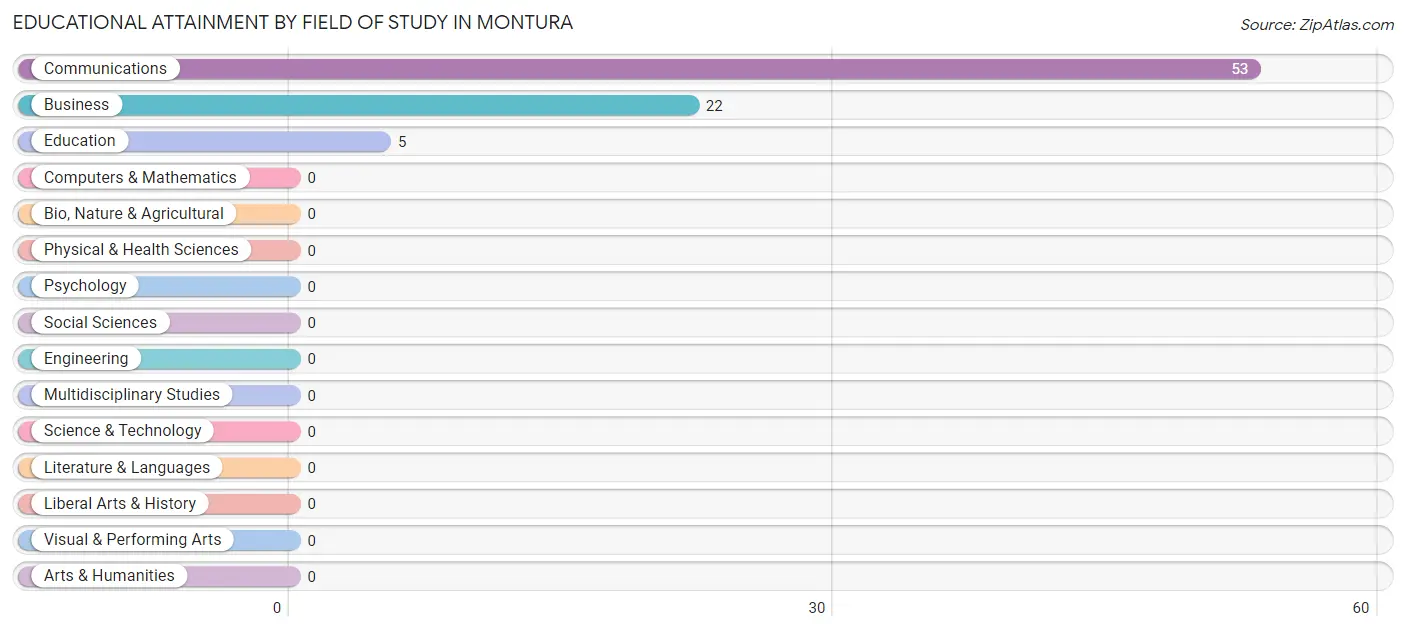
| Field of Study | # Graduates | % Graduates |
| Computers & Mathematics | 0 | 0.0% |
| Bio, Nature & Agricultural | 0 | 0.0% |
| Physical & Health Sciences | 0 | 0.0% |
| Psychology | 0 | 0.0% |
| Social Sciences | 0 | 0.0% |
| Engineering | 0 | 0.0% |
| Multidisciplinary Studies | 0 | 0.0% |
| Science & Technology | 0 | 0.0% |
| Business | 22 | 27.5% |
| Education | 5 | 6.2% |
| Literature & Languages | 0 | 0.0% |
| Liberal Arts & History | 0 | 0.0% |
| Visual & Performing Arts | 0 | 0.0% |
| Communications | 53 | 66.2% |
| Arts & Humanities | 0 | 0.0% |
| Total | 80 | 100.0% |
Transportation & Commute in Montura
Vehicle Availability by Sex in Montura
The most prevalent vehicle ownership categories in Montura are males with 3 vehicles (324, accounting for 37.7%) and females with 3 vehicles (93, making up 58.1%).
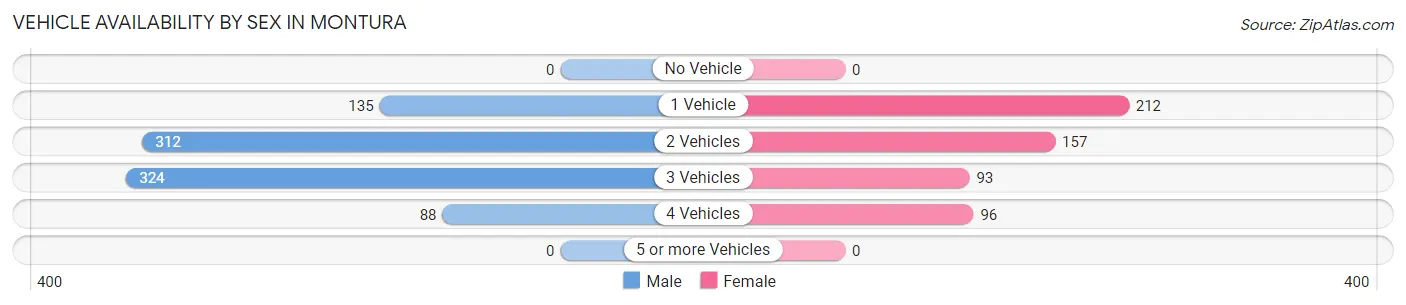
| Vehicles Available | Male | Female |
| No Vehicle | 0 (0.0%) | 0 (0.0%) |
| 1 Vehicle | 135 (15.7%) | 212 (38.0%) |
| 2 Vehicles | 312 (36.3%) | 157 (28.1%) |
| 3 Vehicles | 324 (37.7%) | 93 (16.7%) |
| 4 Vehicles | 88 (10.2%) | 96 (17.2%) |
| 5 or more Vehicles | 0 (0.0%) | 0 (0.0%) |
| Total | 859 (100.0%) | 558 (100.0%) |
Commute Time in Montura
The most frequently occuring commute durations in Montura are 20 to 24 minutes (251 commuters, 21.1%), 30 to 34 minutes (214 commuters, 18.0%), and 15 to 19 minutes (176 commuters, 14.8%).
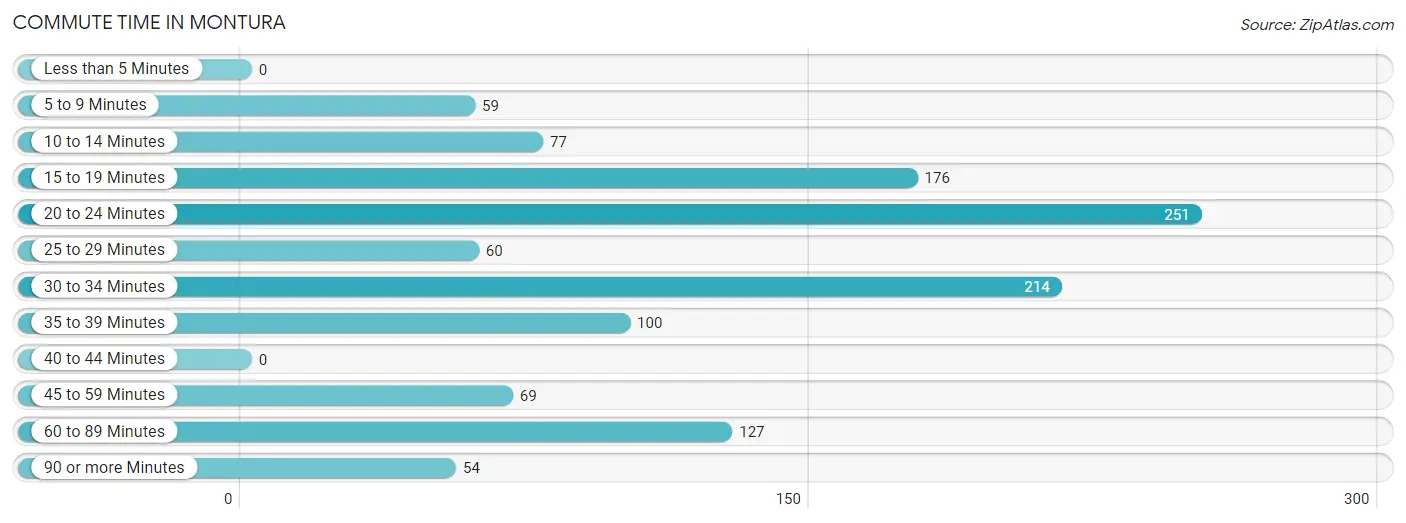
| Commute Time | # Commuters | % Commuters |
| Less than 5 Minutes | 0 | 0.0% |
| 5 to 9 Minutes | 59 | 5.0% |
| 10 to 14 Minutes | 77 | 6.5% |
| 15 to 19 Minutes | 176 | 14.8% |
| 20 to 24 Minutes | 251 | 21.1% |
| 25 to 29 Minutes | 60 | 5.1% |
| 30 to 34 Minutes | 214 | 18.0% |
| 35 to 39 Minutes | 100 | 8.4% |
| 40 to 44 Minutes | 0 | 0.0% |
| 45 to 59 Minutes | 69 | 5.8% |
| 60 to 89 Minutes | 127 | 10.7% |
| 90 or more Minutes | 54 | 4.5% |
Commute Time by Sex in Montura
The most common commute times in Montura are 30 to 34 minutes (188 commuters, 29.9%) for males and 20 to 24 minutes (201 commuters, 36.0%) for females.
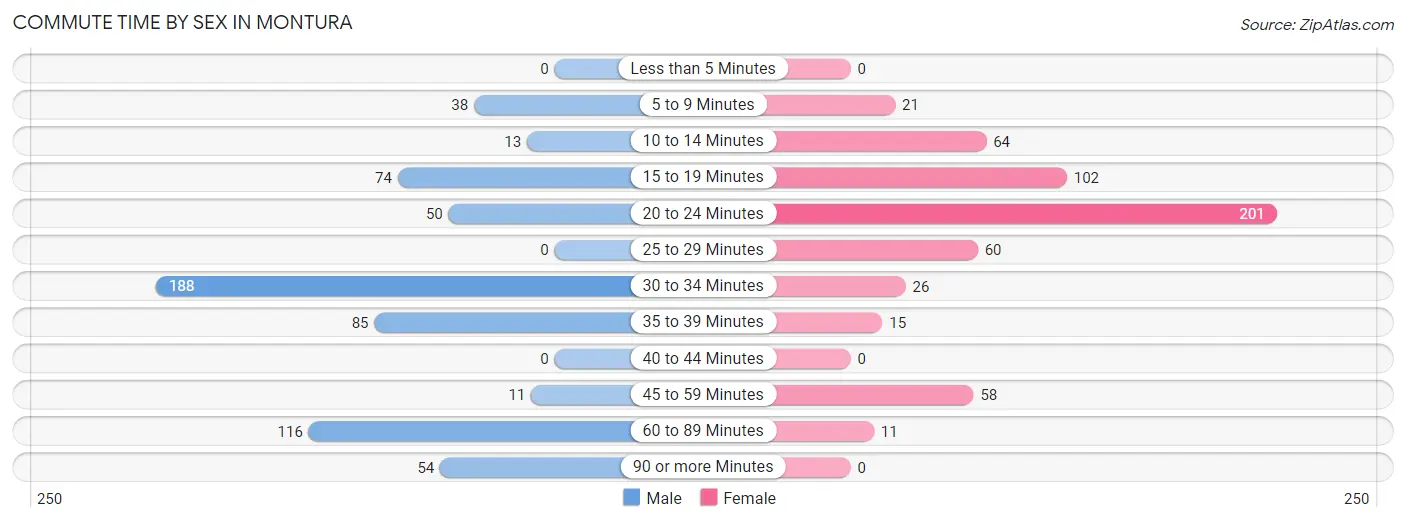
| Commute Time | Male | Female |
| Less than 5 Minutes | 0 (0.0%) | 0 (0.0%) |
| 5 to 9 Minutes | 38 (6.0%) | 21 (3.8%) |
| 10 to 14 Minutes | 13 (2.1%) | 64 (11.5%) |
| 15 to 19 Minutes | 74 (11.8%) | 102 (18.3%) |
| 20 to 24 Minutes | 50 (8.0%) | 201 (36.0%) |
| 25 to 29 Minutes | 0 (0.0%) | 60 (10.7%) |
| 30 to 34 Minutes | 188 (29.9%) | 26 (4.7%) |
| 35 to 39 Minutes | 85 (13.5%) | 15 (2.7%) |
| 40 to 44 Minutes | 0 (0.0%) | 0 (0.0%) |
| 45 to 59 Minutes | 11 (1.8%) | 58 (10.4%) |
| 60 to 89 Minutes | 116 (18.4%) | 11 (2.0%) |
| 90 or more Minutes | 54 (8.6%) | 0 (0.0%) |
Time of Departure to Work by Sex in Montura
The most frequent times of departure to work in Montura are 5:00 AM to 5:29 AM (151, 24.0%) for males and 6:30 AM to 6:59 AM (188, 33.7%) for females.
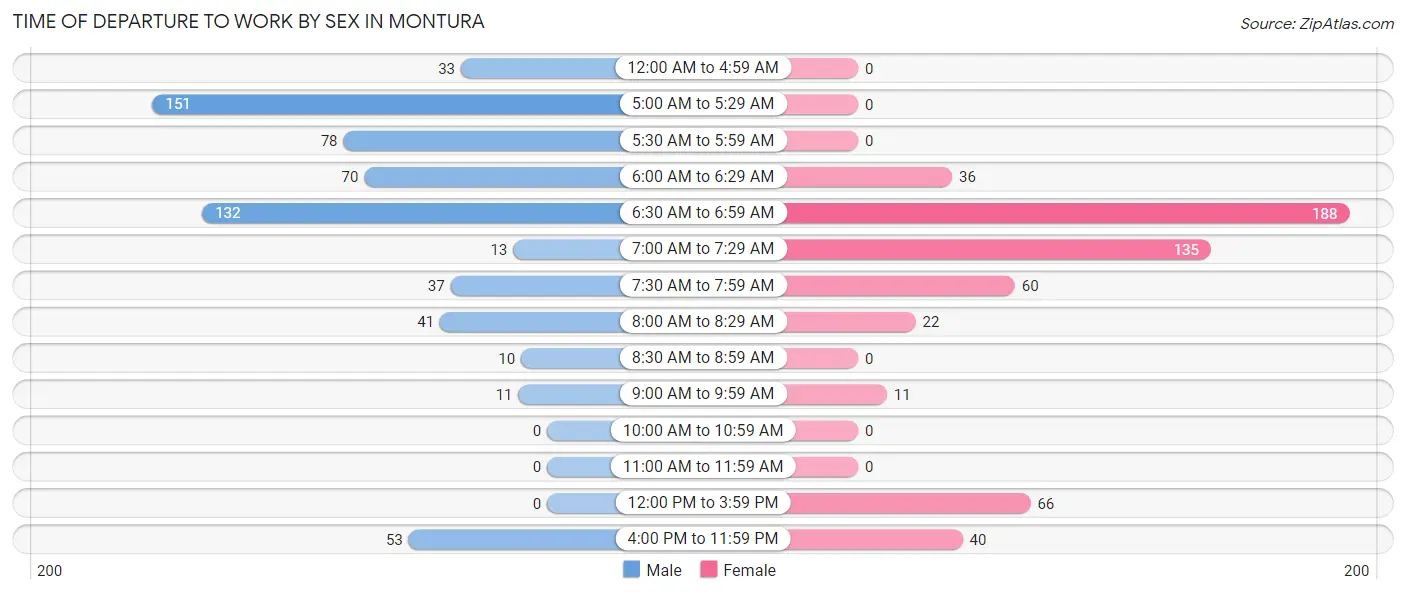
| Time of Departure | Male | Female |
| 12:00 AM to 4:59 AM | 33 (5.2%) | 0 (0.0%) |
| 5:00 AM to 5:29 AM | 151 (24.0%) | 0 (0.0%) |
| 5:30 AM to 5:59 AM | 78 (12.4%) | 0 (0.0%) |
| 6:00 AM to 6:29 AM | 70 (11.1%) | 36 (6.5%) |
| 6:30 AM to 6:59 AM | 132 (21.0%) | 188 (33.7%) |
| 7:00 AM to 7:29 AM | 13 (2.1%) | 135 (24.2%) |
| 7:30 AM to 7:59 AM | 37 (5.9%) | 60 (10.7%) |
| 8:00 AM to 8:29 AM | 41 (6.5%) | 22 (3.9%) |
| 8:30 AM to 8:59 AM | 10 (1.6%) | 0 (0.0%) |
| 9:00 AM to 9:59 AM | 11 (1.8%) | 11 (2.0%) |
| 10:00 AM to 10:59 AM | 0 (0.0%) | 0 (0.0%) |
| 11:00 AM to 11:59 AM | 0 (0.0%) | 0 (0.0%) |
| 12:00 PM to 3:59 PM | 0 (0.0%) | 66 (11.8%) |
| 4:00 PM to 11:59 PM | 53 (8.4%) | 40 (7.2%) |
| Total | 629 (100.0%) | 558 (100.0%) |
Housing Occupancy in Montura
Occupancy by Ownership in Montura
Of the total 1,463 dwellings in Montura, owner-occupied units account for 1,127 (77.0%), while renter-occupied units make up 336 (23.0%).
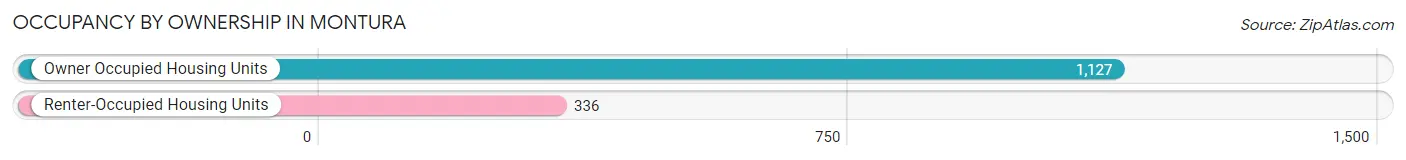
| Occupancy | # Housing Units | % Housing Units |
| Owner Occupied Housing Units | 1,127 | 77.0% |
| Renter-Occupied Housing Units | 336 | 23.0% |
| Total Occupied Housing Units | 1,463 | 100.0% |
Occupancy by Household Size in Montura
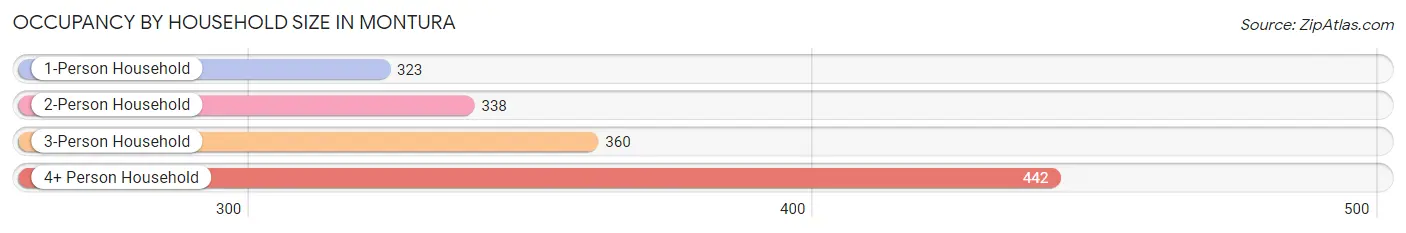
| Household Size | # Housing Units | % Housing Units |
| 1-Person Household | 323 | 22.1% |
| 2-Person Household | 338 | 23.1% |
| 3-Person Household | 360 | 24.6% |
| 4+ Person Household | 442 | 30.2% |
| Total Housing Units | 1,463 | 100.0% |
Occupancy by Ownership by Household Size in Montura
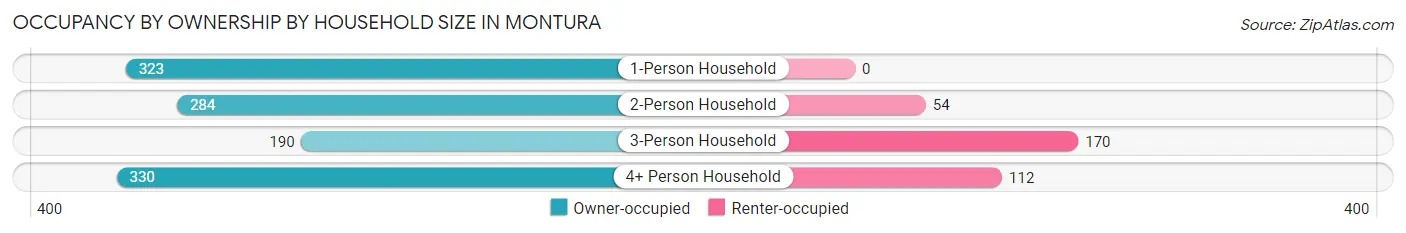
| Household Size | Owner-occupied | Renter-occupied |
| 1-Person Household | 323 (100.0%) | 0 (0.0%) |
| 2-Person Household | 284 (84.0%) | 54 (16.0%) |
| 3-Person Household | 190 (52.8%) | 170 (47.2%) |
| 4+ Person Household | 330 (74.7%) | 112 (25.3%) |
| Total Housing Units | 1,127 (77.0%) | 336 (23.0%) |
Occupancy by Educational Attainment in Montura
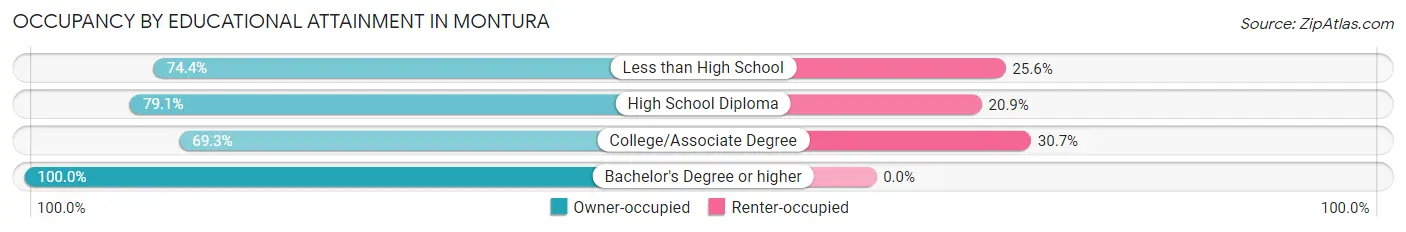
| Household Size | Owner-occupied | Renter-occupied |
| Less than High School | 377 (74.4%) | 130 (25.6%) |
| High School Diploma | 575 (79.1%) | 152 (20.9%) |
| College/Associate Degree | 122 (69.3%) | 54 (30.7%) |
| Bachelor's Degree or higher | 53 (100.0%) | 0 (0.0%) |
Occupancy by Age of Householder in Montura
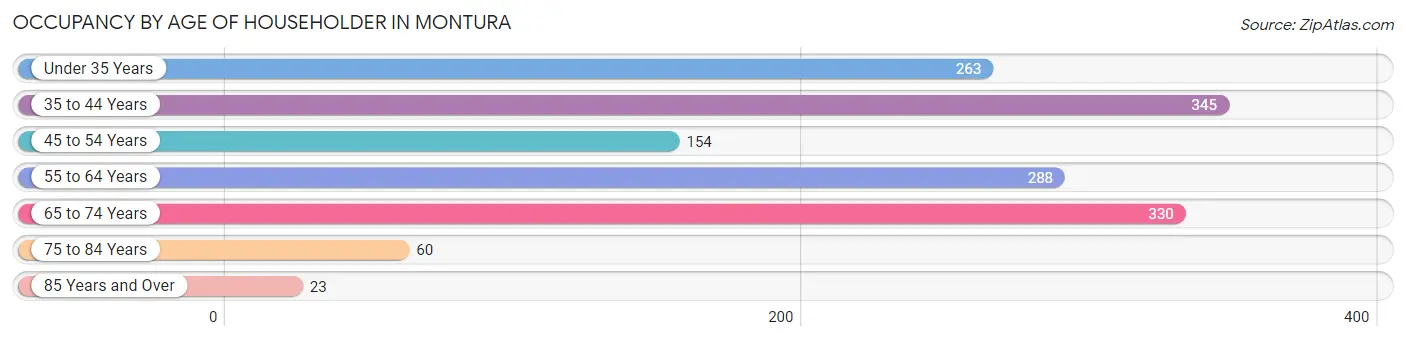
| Age Bracket | # Households | % Households |
| Under 35 Years | 263 | 18.0% |
| 35 to 44 Years | 345 | 23.6% |
| 45 to 54 Years | 154 | 10.5% |
| 55 to 64 Years | 288 | 19.7% |
| 65 to 74 Years | 330 | 22.6% |
| 75 to 84 Years | 60 | 4.1% |
| 85 Years and Over | 23 | 1.6% |
| Total | 1,463 | 100.0% |
Housing Finances in Montura
Median Income by Occupancy in Montura
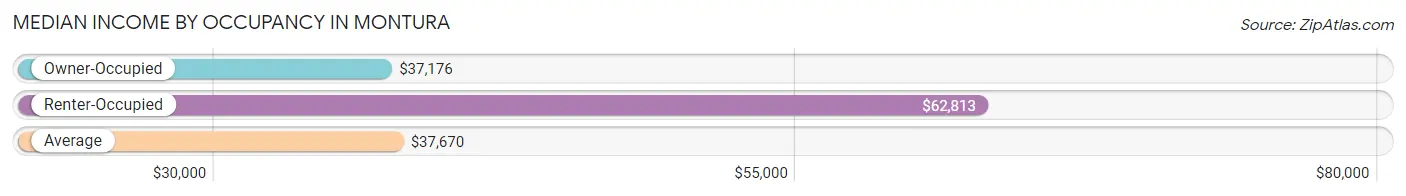
| Occupancy Type | # Households | Median Income |
| Owner-Occupied | 1,127 (77.0%) | $37,176 |
| Renter-Occupied | 336 (23.0%) | $62,813 |
| Average | 1,463 (100.0%) | $37,670 |
Occupancy by Householder Income Bracket in Montura
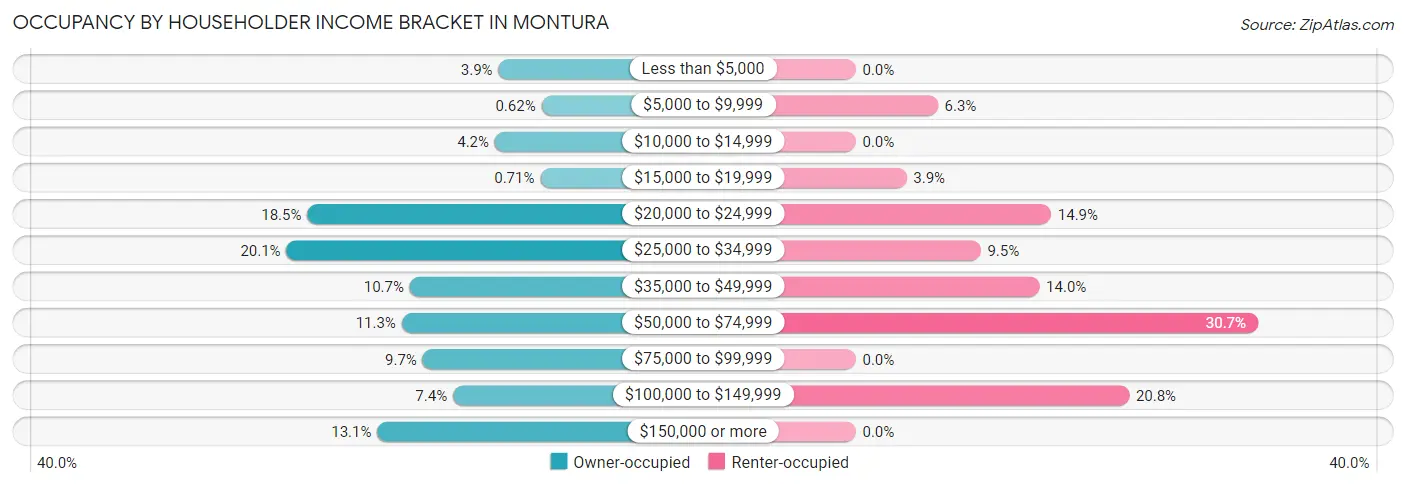
| Income Bracket | Owner-occupied | Renter-occupied |
| Less than $5,000 | 44 (3.9%) | 0 (0.0%) |
| $5,000 to $9,999 | 7 (0.6%) | 21 (6.2%) |
| $10,000 to $14,999 | 47 (4.2%) | 0 (0.0%) |
| $15,000 to $19,999 | 8 (0.7%) | 13 (3.9%) |
| $20,000 to $24,999 | 208 (18.5%) | 50 (14.9%) |
| $25,000 to $34,999 | 226 (20.1%) | 32 (9.5%) |
| $35,000 to $49,999 | 120 (10.6%) | 47 (14.0%) |
| $50,000 to $74,999 | 127 (11.3%) | 103 (30.6%) |
| $75,000 to $99,999 | 109 (9.7%) | 0 (0.0%) |
| $100,000 to $149,999 | 83 (7.4%) | 70 (20.8%) |
| $150,000 or more | 148 (13.1%) | 0 (0.0%) |
| Total | 1,127 (100.0%) | 336 (100.0%) |
Monthly Housing Cost Tiers in Montura
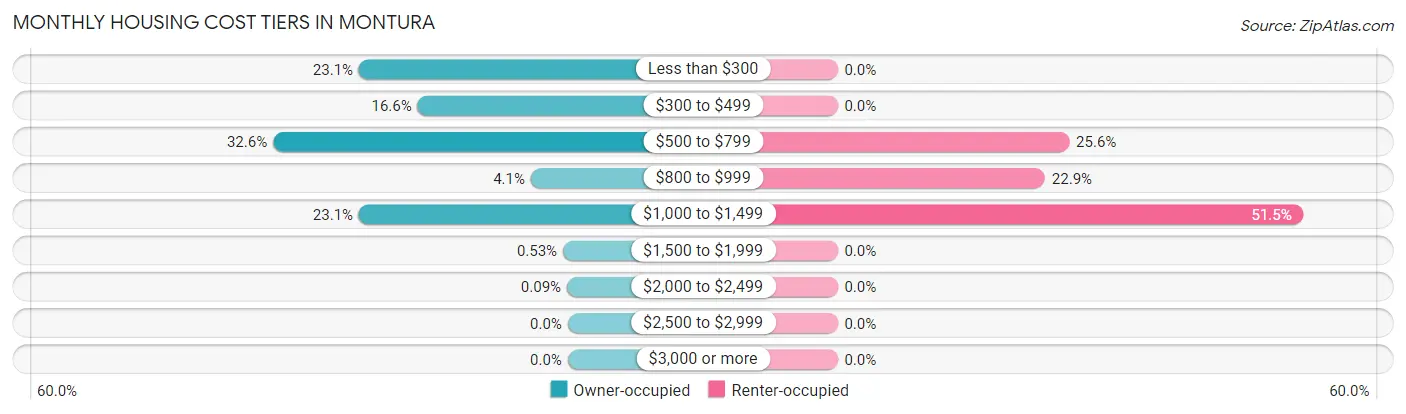
| Monthly Cost | Owner-occupied | Renter-occupied |
| Less than $300 | 260 (23.1%) | 0 (0.0%) |
| $300 to $499 | 187 (16.6%) | 0 (0.0%) |
| $500 to $799 | 367 (32.6%) | 86 (25.6%) |
| $800 to $999 | 46 (4.1%) | 77 (22.9%) |
| $1,000 to $1,499 | 260 (23.1%) | 173 (51.5%) |
| $1,500 to $1,999 | 6 (0.5%) | 0 (0.0%) |
| $2,000 to $2,499 | 1 (0.1%) | 0 (0.0%) |
| $2,500 to $2,999 | 0 (0.0%) | 0 (0.0%) |
| $3,000 or more | 0 (0.0%) | 0 (0.0%) |
| Total | 1,127 (100.0%) | 336 (100.0%) |
Physical Housing Characteristics in Montura
Housing Structures in Montura
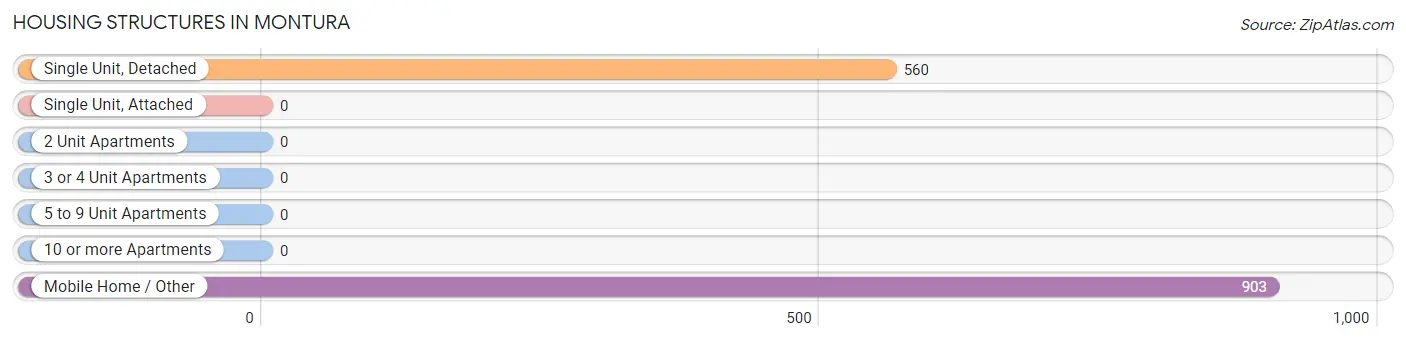
| Structure Type | # Housing Units | % Housing Units |
| Single Unit, Detached | 560 | 38.3% |
| Single Unit, Attached | 0 | 0.0% |
| 2 Unit Apartments | 0 | 0.0% |
| 3 or 4 Unit Apartments | 0 | 0.0% |
| 5 to 9 Unit Apartments | 0 | 0.0% |
| 10 or more Apartments | 0 | 0.0% |
| Mobile Home / Other | 903 | 61.7% |
| Total | 1,463 | 100.0% |
Housing Structures by Occupancy in Montura
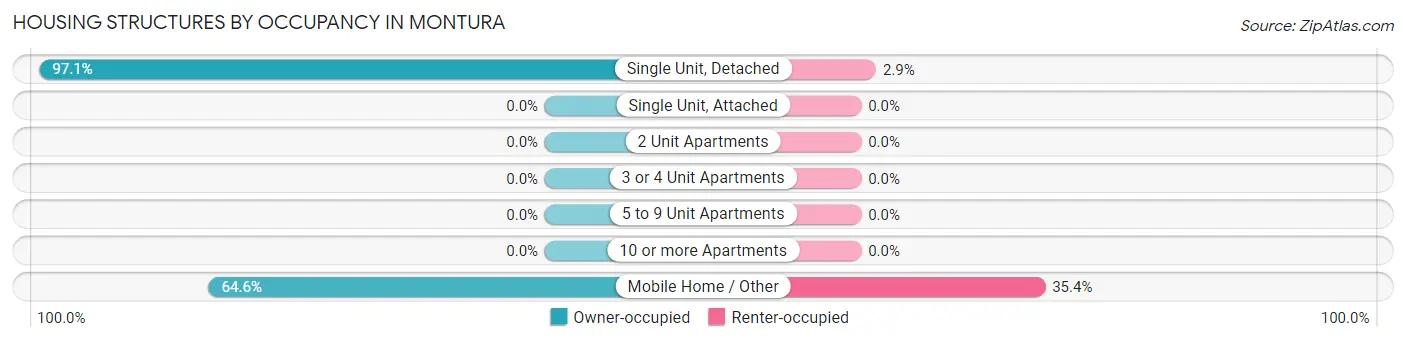
| Structure Type | Owner-occupied | Renter-occupied |
| Single Unit, Detached | 544 (97.1%) | 16 (2.9%) |
| Single Unit, Attached | 0 (0.0%) | 0 (0.0%) |
| 2 Unit Apartments | 0 (0.0%) | 0 (0.0%) |
| 3 or 4 Unit Apartments | 0 (0.0%) | 0 (0.0%) |
| 5 to 9 Unit Apartments | 0 (0.0%) | 0 (0.0%) |
| 10 or more Apartments | 0 (0.0%) | 0 (0.0%) |
| Mobile Home / Other | 583 (64.6%) | 320 (35.4%) |
| Total | 1,127 (77.0%) | 336 (23.0%) |
Housing Structures by Number of Rooms in Montura
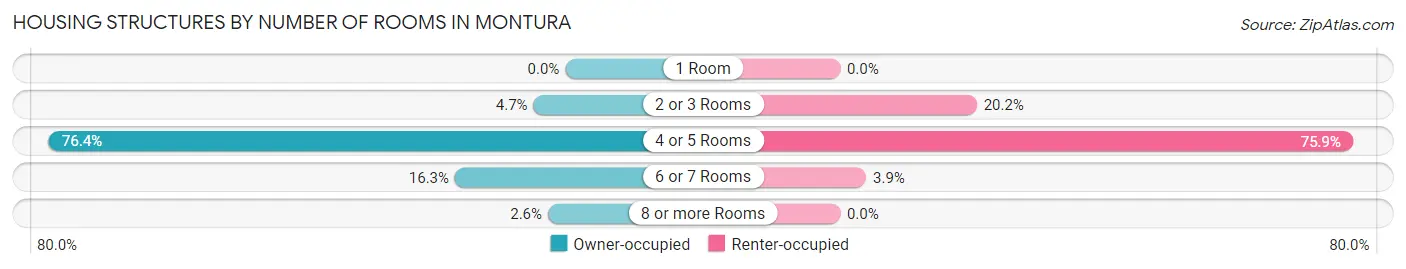
| Number of Rooms | Owner-occupied | Renter-occupied |
| 1 Room | 0 (0.0%) | 0 (0.0%) |
| 2 or 3 Rooms | 53 (4.7%) | 68 (20.2%) |
| 4 or 5 Rooms | 861 (76.4%) | 255 (75.9%) |
| 6 or 7 Rooms | 184 (16.3%) | 13 (3.9%) |
| 8 or more Rooms | 29 (2.6%) | 0 (0.0%) |
| Total | 1,127 (100.0%) | 336 (100.0%) |
Housing Structure by Heating Type in Montura
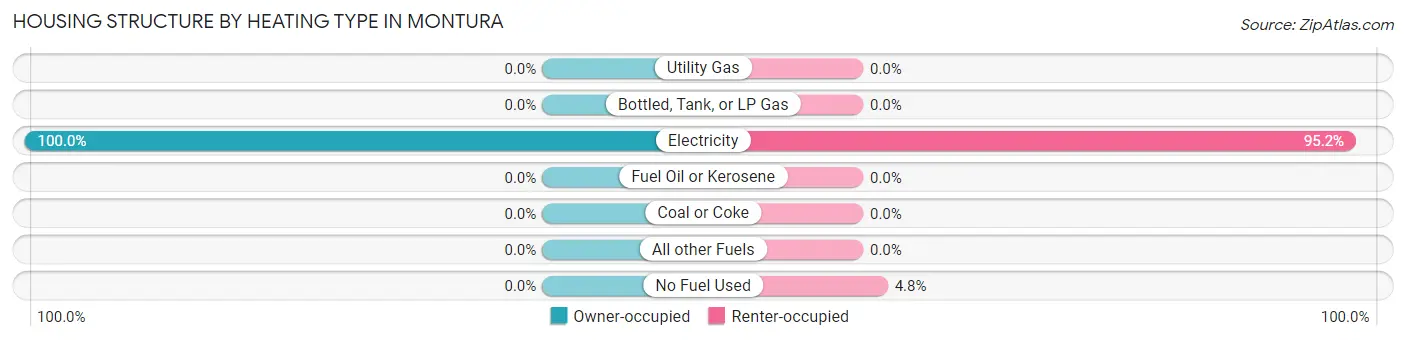
| Heating Type | Owner-occupied | Renter-occupied |
| Utility Gas | 0 (0.0%) | 0 (0.0%) |
| Bottled, Tank, or LP Gas | 0 (0.0%) | 0 (0.0%) |
| Electricity | 1,127 (100.0%) | 320 (95.2%) |
| Fuel Oil or Kerosene | 0 (0.0%) | 0 (0.0%) |
| Coal or Coke | 0 (0.0%) | 0 (0.0%) |
| All other Fuels | 0 (0.0%) | 0 (0.0%) |
| No Fuel Used | 0 (0.0%) | 16 (4.8%) |
| Total | 1,127 (100.0%) | 336 (100.0%) |
Household Vehicle Usage in Montura
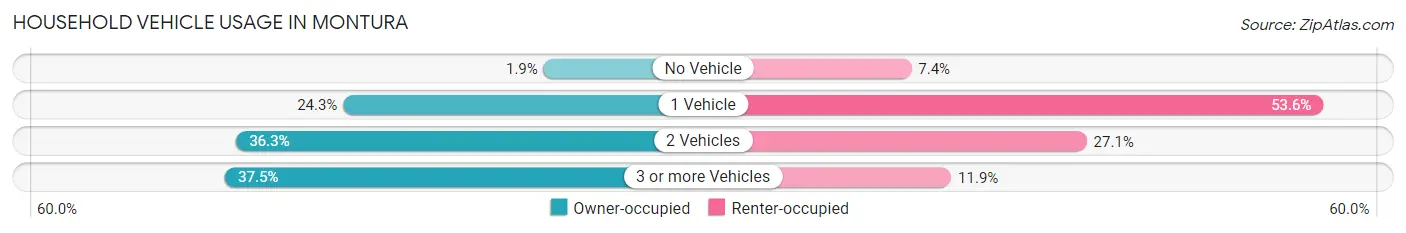
| Vehicles per Household | Owner-occupied | Renter-occupied |
| No Vehicle | 21 (1.9%) | 25 (7.4%) |
| 1 Vehicle | 274 (24.3%) | 180 (53.6%) |
| 2 Vehicles | 409 (36.3%) | 91 (27.1%) |
| 3 or more Vehicles | 423 (37.5%) | 40 (11.9%) |
| Total | 1,127 (100.0%) | 336 (100.0%) |
Real Estate & Mortgages in Montura
Real Estate and Mortgage Overview in Montura
| Characteristic | Without Mortgage | With Mortgage |
| Housing Units | 826 | 301 |
| Median Property Value | $137,800 | $63,900 |
| Median Household Income | - | - |
| Monthly Housing Costs | $463 | $0 |
| Real Estate Taxes | $1,303 | $28 |
Property Value by Mortgage Status in Montura
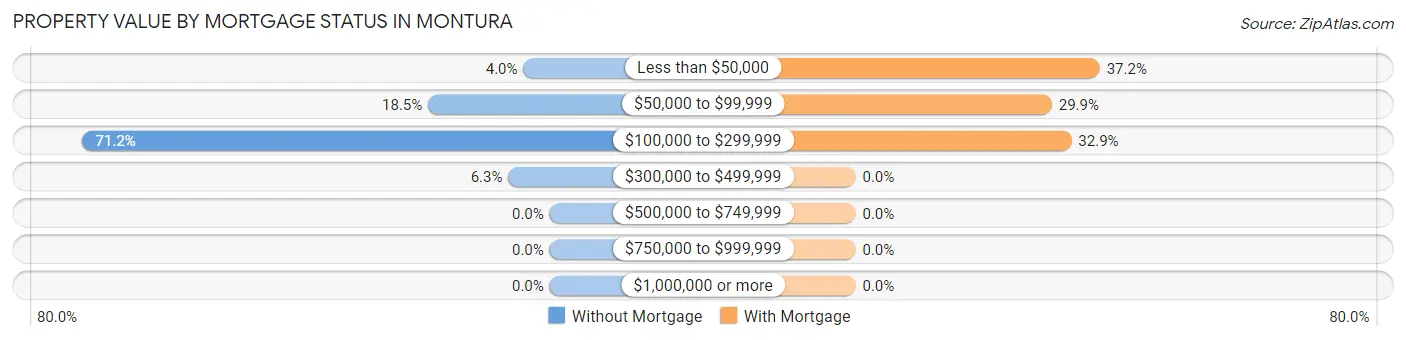
| Property Value | Without Mortgage | With Mortgage |
| Less than $50,000 | 33 (4.0%) | 112 (37.2%) |
| $50,000 to $99,999 | 153 (18.5%) | 90 (29.9%) |
| $100,000 to $299,999 | 588 (71.2%) | 99 (32.9%) |
| $300,000 to $499,999 | 52 (6.3%) | 0 (0.0%) |
| $500,000 to $749,999 | 0 (0.0%) | 0 (0.0%) |
| $750,000 to $999,999 | 0 (0.0%) | 0 (0.0%) |
| $1,000,000 or more | 0 (0.0%) | 0 (0.0%) |
| Total | 826 (100.0%) | 301 (100.0%) |
Household Income by Mortgage Status in Montura
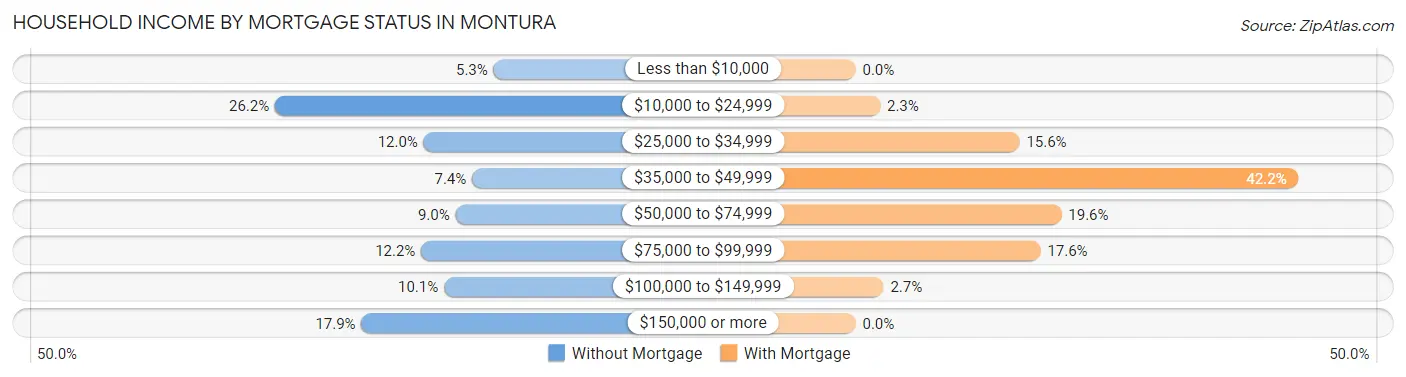
| Household Income | Without Mortgage | With Mortgage |
| Less than $10,000 | 44 (5.3%) | 0 (0.0%) |
| $10,000 to $24,999 | 216 (26.2%) | 7 (2.3%) |
| $25,000 to $34,999 | 99 (12.0%) | 47 (15.6%) |
| $35,000 to $49,999 | 61 (7.4%) | 127 (42.2%) |
| $50,000 to $74,999 | 74 (9.0%) | 59 (19.6%) |
| $75,000 to $99,999 | 101 (12.2%) | 53 (17.6%) |
| $100,000 to $149,999 | 83 (10.1%) | 8 (2.7%) |
| $150,000 or more | 148 (17.9%) | 0 (0.0%) |
| Total | 826 (100.0%) | 301 (100.0%) |
Property Value to Household Income Ratio in Montura
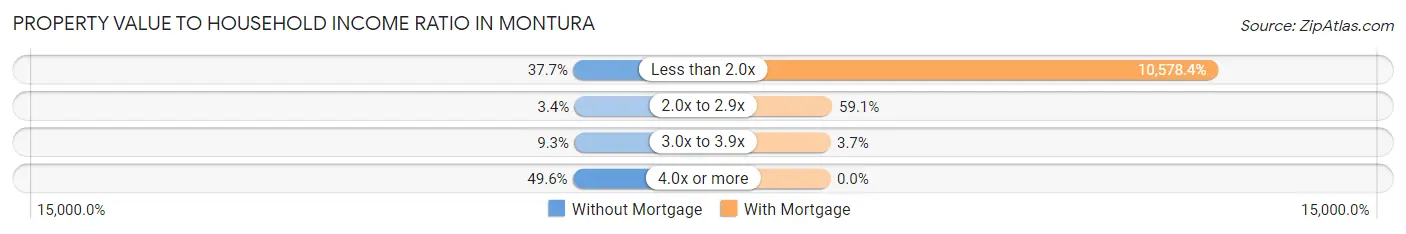
| Value-to-Income Ratio | Without Mortgage | With Mortgage |
| Less than 2.0x | 311 (37.7%) | 31,841 (10,578.4%) |
| 2.0x to 2.9x | 28 (3.4%) | 178 (59.1%) |
| 3.0x to 3.9x | 77 (9.3%) | 11 (3.6%) |
| 4.0x or more | 410 (49.6%) | 0 (0.0%) |
| Total | 826 (100.0%) | 301 (100.0%) |
Real Estate Taxes by Mortgage Status in Montura
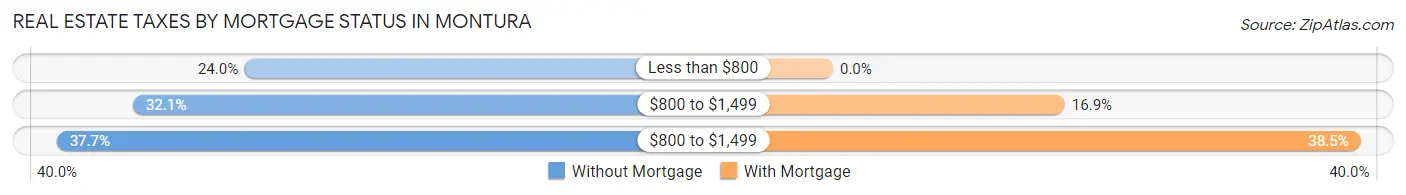
| Property Taxes | Without Mortgage | With Mortgage |
| Less than $800 | 198 (24.0%) | 0 (0.0%) |
| $800 to $1,499 | 265 (32.1%) | 51 (16.9%) |
| $800 to $1,499 | 311 (37.7%) | 116 (38.5%) |
| Total | 826 (100.0%) | 301 (100.0%) |
Health & Disability in Montura
Health Insurance Coverage by Age in Montura
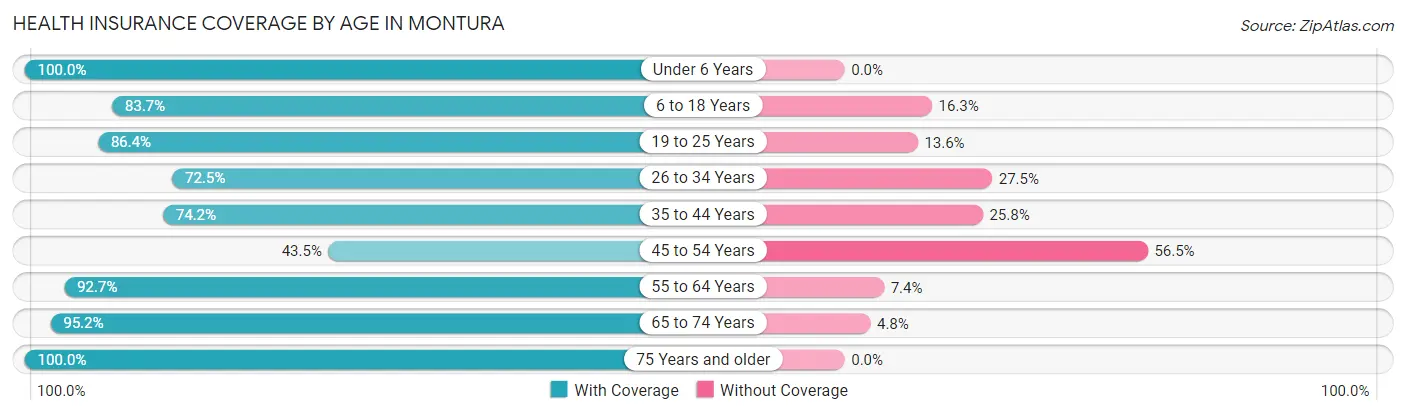
| Age Bracket | With Coverage | Without Coverage |
| Under 6 Years | 180 (100.0%) | 0 (0.0%) |
| 6 to 18 Years | 432 (83.7%) | 84 (16.3%) |
| 19 to 25 Years | 285 (86.4%) | 45 (13.6%) |
| 26 to 34 Years | 261 (72.5%) | 99 (27.5%) |
| 35 to 44 Years | 409 (74.2%) | 142 (25.8%) |
| 45 to 54 Years | 173 (43.5%) | 225 (56.5%) |
| 55 to 64 Years | 416 (92.6%) | 33 (7.3%) |
| 65 to 74 Years | 436 (95.2%) | 22 (4.8%) |
| 75 Years and older | 158 (100.0%) | 0 (0.0%) |
| Total | 2,750 (80.9%) | 650 (19.1%) |
Health Insurance Coverage by Citizenship Status in Montura
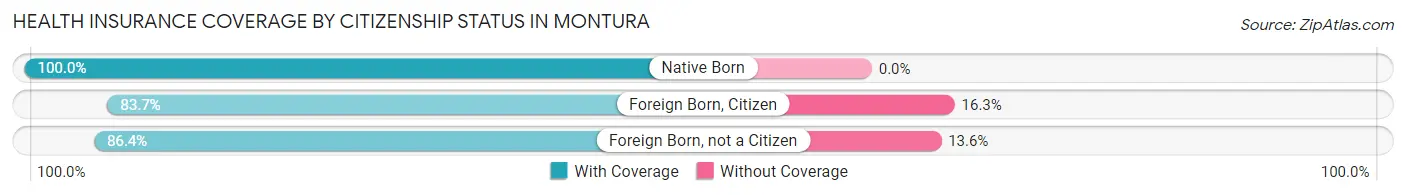
| Citizenship Status | With Coverage | Without Coverage |
| Native Born | 180 (100.0%) | 0 (0.0%) |
| Foreign Born, Citizen | 432 (83.7%) | 84 (16.3%) |
| Foreign Born, not a Citizen | 285 (86.4%) | 45 (13.6%) |
Health Insurance Coverage by Household Income in Montura
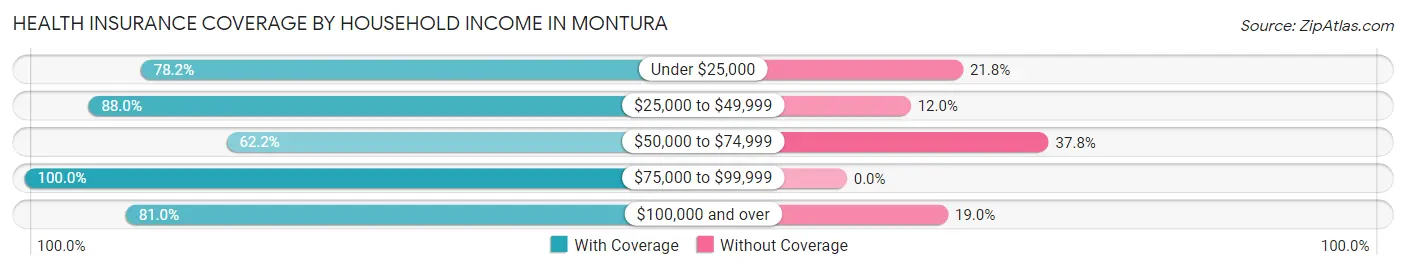
| Household Income | With Coverage | Without Coverage |
| Under $25,000 | 539 (78.2%) | 150 (21.8%) |
| $25,000 to $49,999 | 830 (88.0%) | 113 (12.0%) |
| $50,000 to $74,999 | 383 (62.2%) | 233 (37.8%) |
| $75,000 to $99,999 | 340 (100.0%) | 0 (0.0%) |
| $100,000 and over | 658 (81.0%) | 154 (19.0%) |
Public vs Private Health Insurance Coverage by Age in Montura
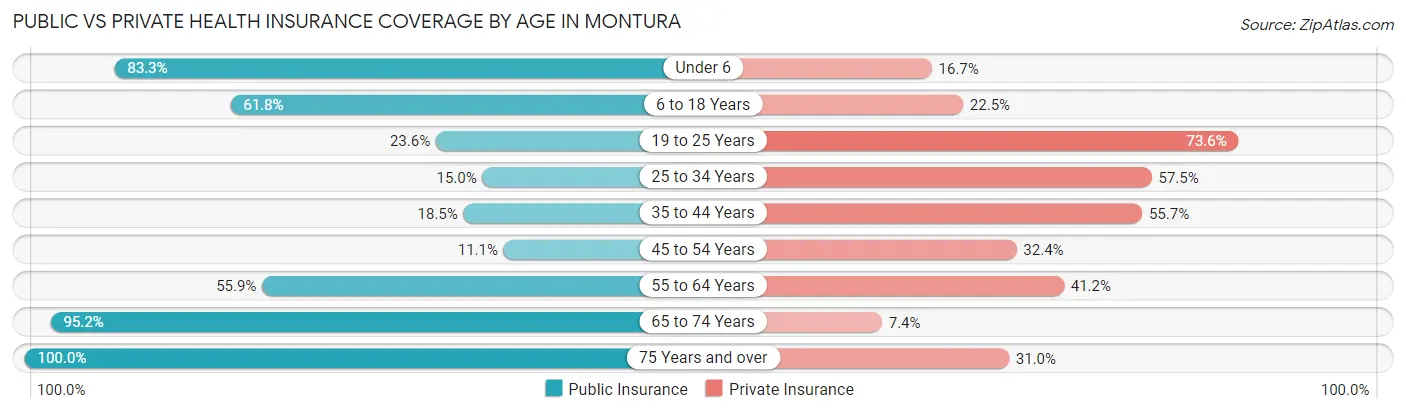
| Age Bracket | Public Insurance | Private Insurance |
| Under 6 | 150 (83.3%) | 30 (16.7%) |
| 6 to 18 Years | 319 (61.8%) | 116 (22.5%) |
| 19 to 25 Years | 78 (23.6%) | 243 (73.6%) |
| 25 to 34 Years | 54 (15.0%) | 207 (57.5%) |
| 35 to 44 Years | 102 (18.5%) | 307 (55.7%) |
| 45 to 54 Years | 44 (11.1%) | 129 (32.4%) |
| 55 to 64 Years | 251 (55.9%) | 185 (41.2%) |
| 65 to 74 Years | 436 (95.2%) | 34 (7.4%) |
| 75 Years and over | 158 (100.0%) | 49 (31.0%) |
| Total | 1,592 (46.8%) | 1,300 (38.2%) |
Disability Status by Sex by Age in Montura
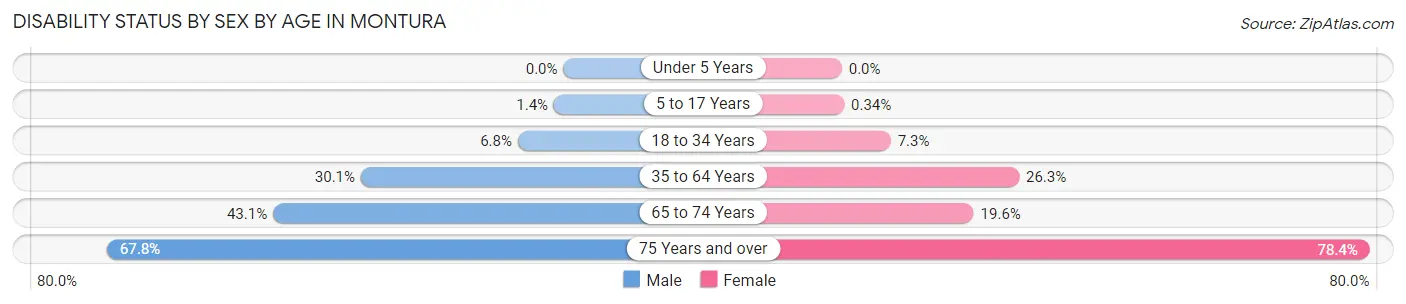
| Age Bracket | Male | Female |
| Under 5 Years | 0 (0.0%) | 0 (0.0%) |
| 5 to 17 Years | 3 (1.4%) | 1 (0.3%) |
| 18 to 34 Years | 30 (6.8%) | 20 (7.3%) |
| 35 to 64 Years | 249 (30.1%) | 150 (26.3%) |
| 65 to 74 Years | 94 (43.1%) | 47 (19.6%) |
| 75 Years and over | 82 (67.8%) | 29 (78.4%) |
Disability Class by Sex by Age in Montura
Disability Class: Hearing Difficulty
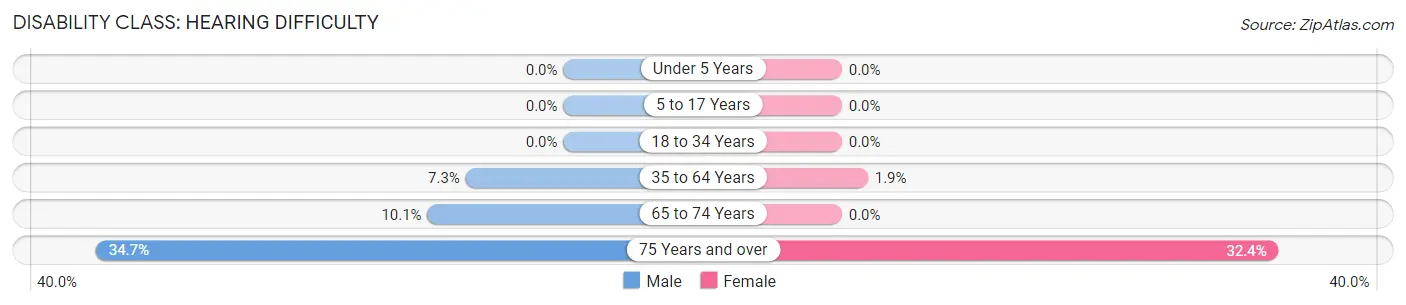
| Age Bracket | Male | Female |
| Under 5 Years | 0 (0.0%) | 0 (0.0%) |
| 5 to 17 Years | 0 (0.0%) | 0 (0.0%) |
| 18 to 34 Years | 0 (0.0%) | 0 (0.0%) |
| 35 to 64 Years | 60 (7.2%) | 11 (1.9%) |
| 65 to 74 Years | 22 (10.1%) | 0 (0.0%) |
| 75 Years and over | 42 (34.7%) | 12 (32.4%) |
Disability Class: Vision Difficulty
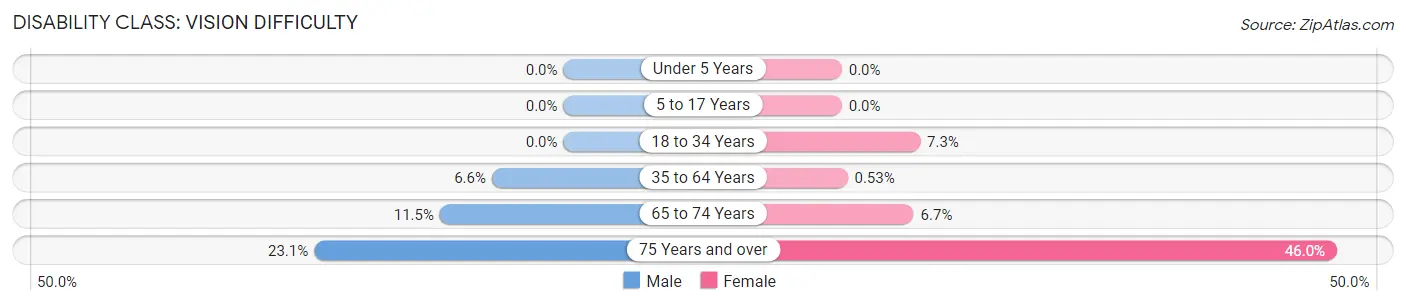
| Age Bracket | Male | Female |
| Under 5 Years | 0 (0.0%) | 0 (0.0%) |
| 5 to 17 Years | 0 (0.0%) | 0 (0.0%) |
| 18 to 34 Years | 0 (0.0%) | 20 (7.3%) |
| 35 to 64 Years | 55 (6.6%) | 3 (0.5%) |
| 65 to 74 Years | 25 (11.5%) | 16 (6.7%) |
| 75 Years and over | 28 (23.1%) | 17 (46.0%) |
Disability Class: Cognitive Difficulty
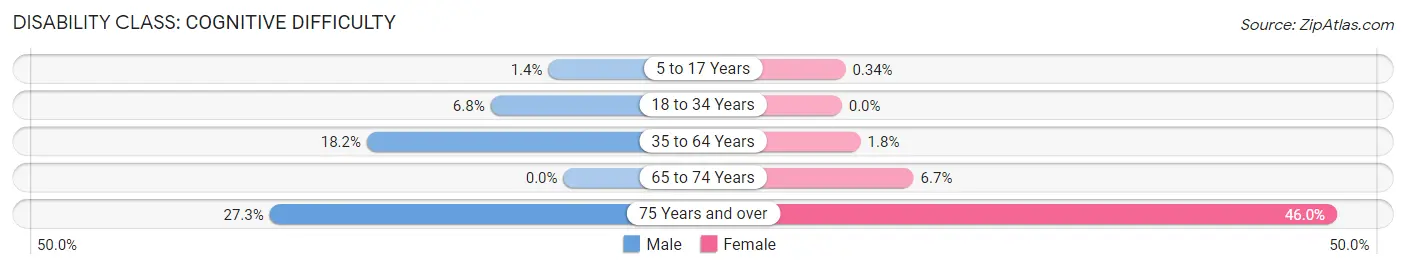
| Age Bracket | Male | Female |
| 5 to 17 Years | 3 (1.4%) | 1 (0.3%) |
| 18 to 34 Years | 30 (6.8%) | 0 (0.0%) |
| 35 to 64 Years | 151 (18.2%) | 10 (1.8%) |
| 65 to 74 Years | 0 (0.0%) | 16 (6.7%) |
| 75 Years and over | 33 (27.3%) | 17 (46.0%) |
Disability Class: Ambulatory Difficulty
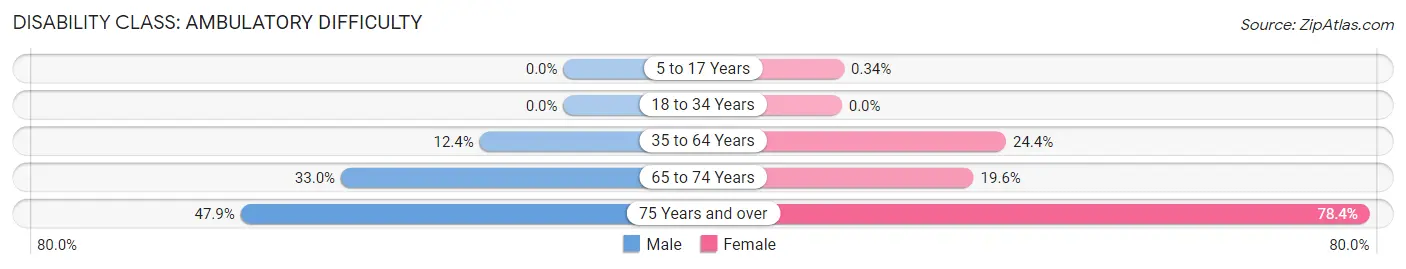
| Age Bracket | Male | Female |
| 5 to 17 Years | 0 (0.0%) | 1 (0.3%) |
| 18 to 34 Years | 0 (0.0%) | 0 (0.0%) |
| 35 to 64 Years | 103 (12.4%) | 139 (24.4%) |
| 65 to 74 Years | 72 (33.0%) | 47 (19.6%) |
| 75 Years and over | 58 (47.9%) | 29 (78.4%) |
Disability Class: Self-Care Difficulty
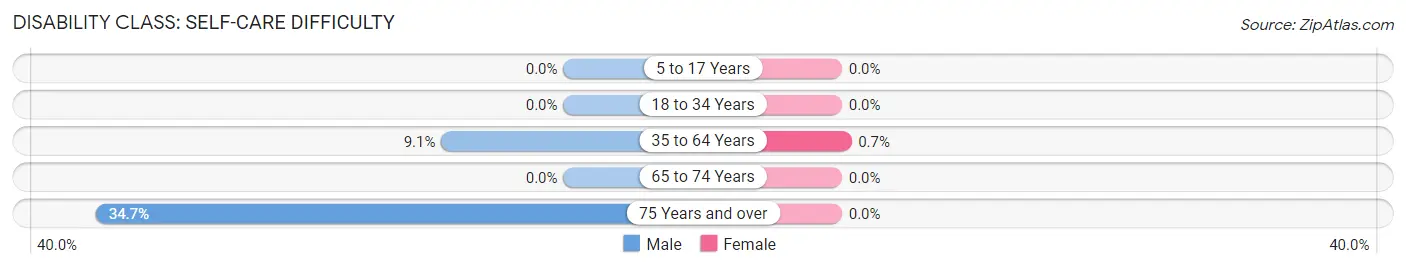
| Age Bracket | Male | Female |
| 5 to 17 Years | 0 (0.0%) | 0 (0.0%) |
| 18 to 34 Years | 0 (0.0%) | 0 (0.0%) |
| 35 to 64 Years | 75 (9.1%) | 4 (0.7%) |
| 65 to 74 Years | 0 (0.0%) | 0 (0.0%) |
| 75 Years and over | 42 (34.7%) | 0 (0.0%) |
Technology Access in Montura
Computing Device Access in Montura
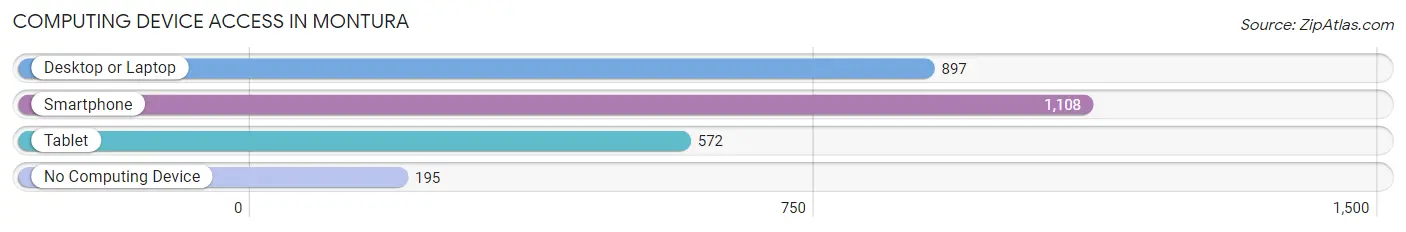
| Device Type | # Households | % Households |
| Desktop or Laptop | 897 | 61.3% |
| Smartphone | 1,108 | 75.7% |
| Tablet | 572 | 39.1% |
| No Computing Device | 195 | 13.3% |
| Total | 1,463 | 100.0% |
Internet Access in Montura
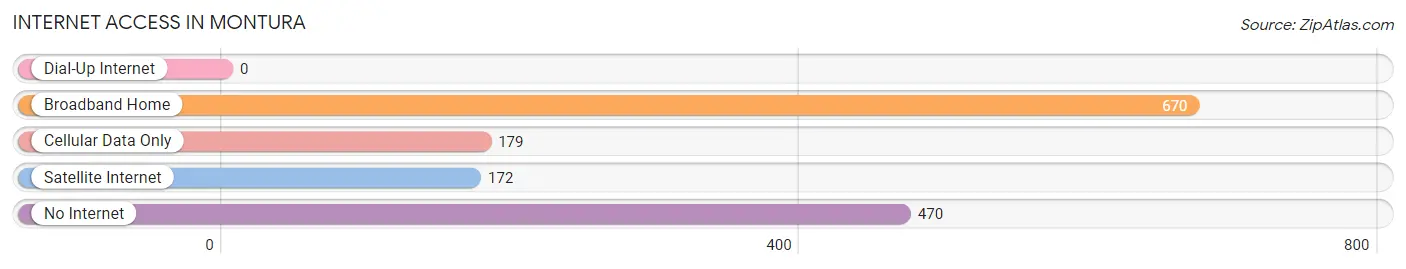
| Internet Type | # Households | % Households |
| Dial-Up Internet | 0 | 0.0% |
| Broadband Home | 670 | 45.8% |
| Cellular Data Only | 179 | 12.2% |
| Satellite Internet | 172 | 11.8% |
| No Internet | 470 | 32.1% |
| Total | 1,463 | 100.0% |
Montura Summary
Montura, Florida is a small unincorporated community located in Hendry County, Florida. It is situated approximately 25 miles east of Clewiston and 25 miles west of LaBelle. The population of Montura was estimated to be 1,845 in 2019.
Geography
Montura is located in the Big Cypress National Preserve, a 729,000-acre preserve located in the southern part of the Florida peninsula. The preserve is home to a variety of wildlife, including the Florida panther, black bear, and alligators. The terrain of the preserve is mostly flat, with some areas of rolling hills. The average elevation of Montura is approximately 20 feet above sea level.
The climate of Montura is classified as humid subtropical, with hot, humid summers and mild winters. The average temperature in the summer is around 90°F, while the average temperature in the winter is around 60°F. The average annual precipitation is around 54 inches.
Economy
The economy of Montura is largely based on agriculture. The main crops grown in the area are sugarcane, citrus, and vegetables. The area is also home to several cattle ranches.
In addition to agriculture, Montura is home to several businesses, including a gas station, a convenience store, a restaurant, and a bar. The community also has a post office and a library.
Demographics
As of 2019, the population of Montura was estimated to be 1,845. The racial makeup of the community was 94.3% White, 2.2% African American, 0.7% Native American, 0.3% Asian, 0.1% Pacific Islander, and 2.4% from other races. The median household income was $30,938, and the median age was 40.
Conclusion
Montura, Florida is a small unincorporated community located in Hendry County, Florida. It is situated in the Big Cypress National Preserve and has a humid subtropical climate. The economy of Montura is largely based on agriculture, with sugarcane, citrus, and vegetables being the main crops grown in the area. The population of Montura was estimated to be 1,845 in 2019, with the majority of the population being White.
Common Questions
What is Per Capita Income in Montura?
Per Capita income in Montura is $30,032.
What is the Median Family Income in Montura?
Median Family Income in Montura is $49,214.
What is the Median Household income in Montura?
Median Household Income in Montura is $37,670.
What is Income or Wage Gap in Montura?
Income or Wage Gap in Montura is 45.8%.
Women in Montura earn 54.2 cents for every dollar earned by a man.
What is Inequality or Gini Index in Montura?
Inequality or Gini Index in Montura is 0.52.
What is the Total Population of Montura?
Total Population of Montura is 3,400.
What is the Total Male Population of Montura?
Total Male Population of Montura is 1,886.
What is the Total Female Population of Montura?
Total Female Population of Montura is 1,514.
What is the Ratio of Males per 100 Females in Montura?
There are 124.57 Males per 100 Females in Montura.
What is the Ratio of Females per 100 Males in Montura?
There are 80.28 Females per 100 Males in Montura.
What is the Median Population Age in Montura?
Median Population Age in Montura is 41.9 Years.
What is the Average Family Size in Montura
Average Family Size in Montura is 2.5 People.
What is the Average Household Size in Montura
Average Household Size in Montura is 2.3 People.
How Large is the Labor Force in Montura?
There are 1,581 People in the Labor Forcein in Montura.
What is the Percentage of People in the Labor Force in Montura?
55.4% of People are in the Labor Force in Montura.
What is the Unemployment Rate in Montura?
Unemployment Rate in Montura is 6.8%.