Seville, FL Map & Demographics
Seville Map
Seville Overview
$35,737
PER CAPITA INCOME
$88,594
AVG HOUSEHOLD INCOME
77.1%
WAGE / INCOME GAP [ % ]
22.9¢/ $1
WAGE / INCOME GAP [ $ ]
0.49
INEQUALITY / GINI INDEX
1,310
TOTAL POPULATION
519
MALE POPULATION
791
FEMALE POPULATION
65.61
MALES / 100 FEMALES
152.41
FEMALES / 100 MALES
29.0
MEDIAN AGE
4.3
AVG FAMILY SIZE
3.9
AVG HOUSEHOLD SIZE
502
LABOR FORCE [ PEOPLE ]
54.9%
PERCENT IN LABOR FORCE
1.8%
UNEMPLOYMENT RATE
Seville Zip Codes
Seville Area Codes
Income in Seville
Income Overview in Seville
| Characteristic | Number | Measure |
| Per Capita Income | 1,310 | $35,737 |
| Median Family Income | 285 | $0 |
| Mean Family Income | 285 | $159,683 |
| Median Household Income | 336 | $88,594 |
| Mean Household Income | 336 | $142,897 |
| Income Deficit | 285 | $0 |
| Wage / Income Gap (%) | 1,310 | 77.10% |
| Wage / Income Gap ($) | 1,310 | 22.90¢ per $1 |
| Gini / Inequality Index | 1,310 | 0.49 |
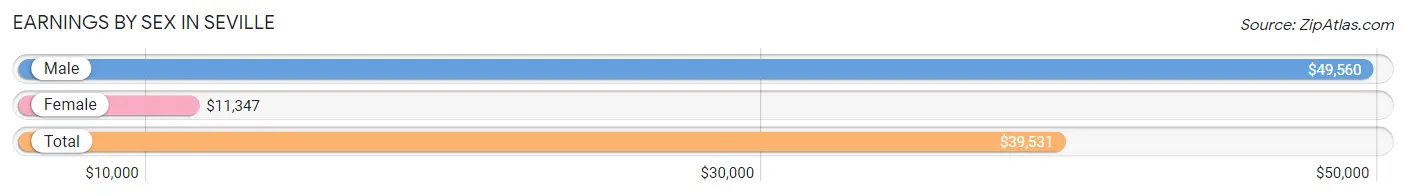
Earnings by Sex in Seville
Average Earnings in Seville are $39,531, $49,560 for men and $11,347 for women, a difference of 77.1%.
| Sex | Number | Average Earnings |
| Male | 275 (54.8%) | $49,560 |
| Female | 227 (45.2%) | $11,347 |
| Total | 502 (100.0%) | $39,531 |
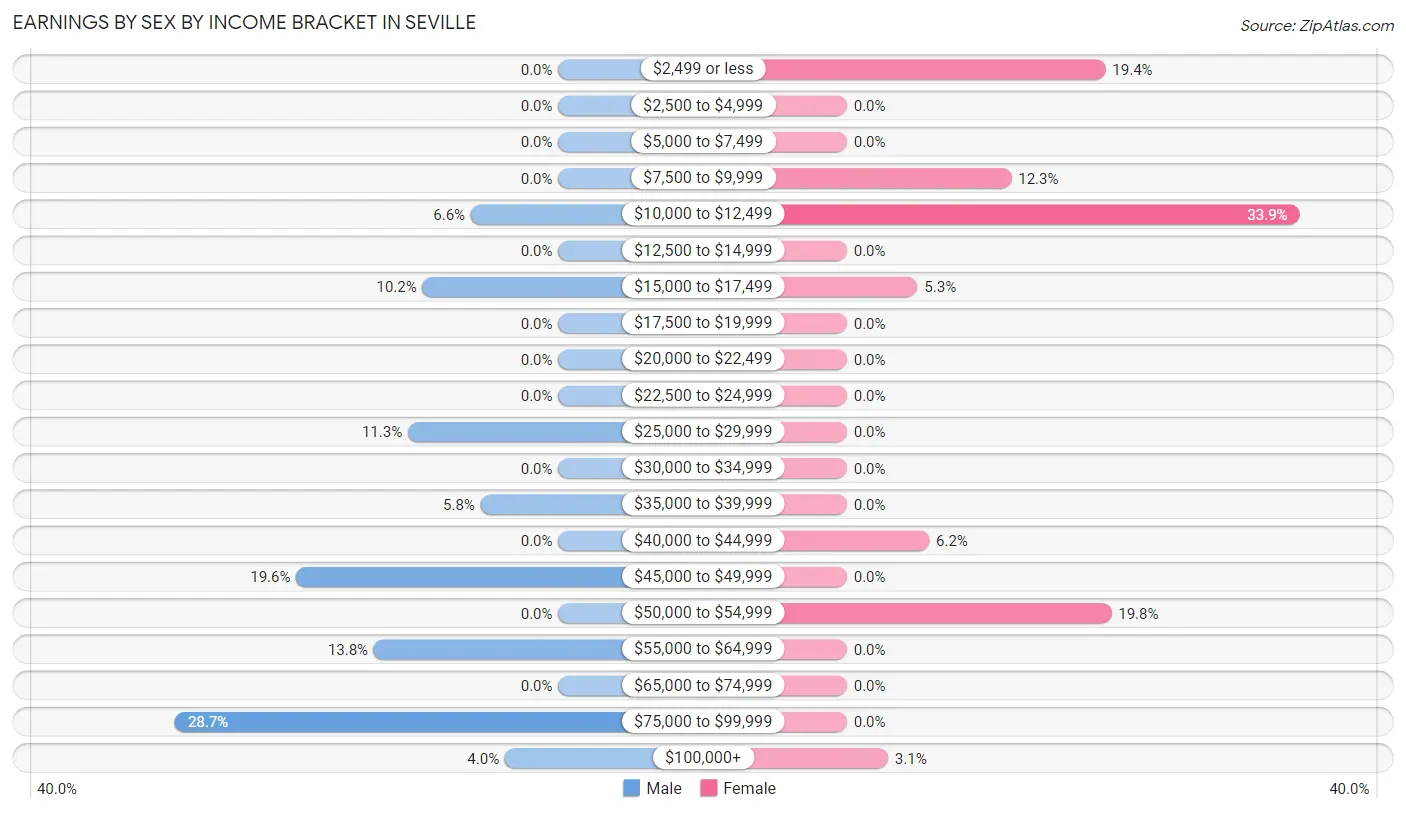
Earnings by Sex by Income Bracket in Seville
The most common earnings brackets in Seville are $75,000 to $99,999 for men (79 | 28.7%) and $10,000 to $12,499 for women (77 | 33.9%).
| Income | Male | Female |
| $2,499 or less | 0 (0.0%) | 44 (19.4%) |
| $2,500 to $4,999 | 0 (0.0%) | 0 (0.0%) |
| $5,000 to $7,499 | 0 (0.0%) | 0 (0.0%) |
| $7,500 to $9,999 | 0 (0.0%) | 28 (12.3%) |
| $10,000 to $12,499 | 18 (6.6%) | 77 (33.9%) |
| $12,500 to $14,999 | 0 (0.0%) | 0 (0.0%) |
| $15,000 to $17,499 | 28 (10.2%) | 12 (5.3%) |
| $17,500 to $19,999 | 0 (0.0%) | 0 (0.0%) |
| $20,000 to $22,499 | 0 (0.0%) | 0 (0.0%) |
| $22,500 to $24,999 | 0 (0.0%) | 0 (0.0%) |
| $25,000 to $29,999 | 31 (11.3%) | 0 (0.0%) |
| $30,000 to $34,999 | 0 (0.0%) | 0 (0.0%) |
| $35,000 to $39,999 | 16 (5.8%) | 0 (0.0%) |
| $40,000 to $44,999 | 0 (0.0%) | 14 (6.2%) |
| $45,000 to $49,999 | 54 (19.6%) | 0 (0.0%) |
| $50,000 to $54,999 | 0 (0.0%) | 45 (19.8%) |
| $55,000 to $64,999 | 38 (13.8%) | 0 (0.0%) |
| $65,000 to $74,999 | 0 (0.0%) | 0 (0.0%) |
| $75,000 to $99,999 | 79 (28.7%) | 0 (0.0%) |
| $100,000+ | 11 (4.0%) | 7 (3.1%) |
| Total | 275 (100.0%) | 227 (100.0%) |
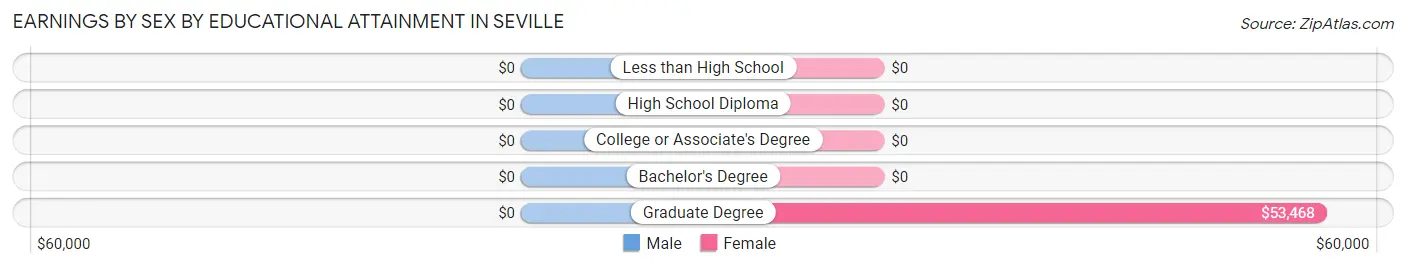
Earnings by Sex by Educational Attainment in Seville
| Educational Attainment | Male Income | Female Income |
| Less than High School | - | - |
| High School Diploma | - | - |
| College or Associate's Degree | - | - |
| Bachelor's Degree | - | - |
| Graduate Degree | - | - |
| Total | $58,388 | $0 |
Family Income in Seville
Family Income Brackets in Seville
According to the Seville family income data, there are 93 families falling into the $50,000 to $74,999 income range, which is the most common income bracket and makes up 32.6% of all families.
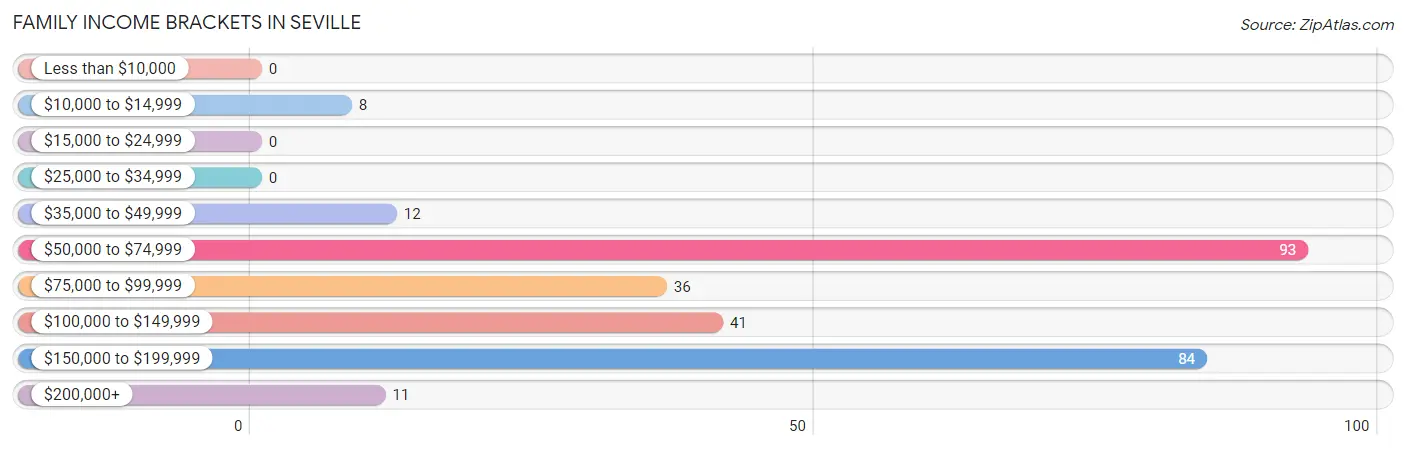
| Income Bracket | # Families | % Families |
| Less than $10,000 | 0 | 0.0% |
| $10,000 to $14,999 | 8 | 2.8% |
| $15,000 to $24,999 | 0 | 0.0% |
| $25,000 to $34,999 | 0 | 0.0% |
| $35,000 to $49,999 | 12 | 4.2% |
| $50,000 to $74,999 | 93 | 32.6% |
| $75,000 to $99,999 | 36 | 12.6% |
| $100,000 to $149,999 | 41 | 14.4% |
| $150,000 to $199,999 | 84 | 29.5% |
| $200,000+ | 11 | 3.9% |
Family Income by Famaliy Size in Seville
2-person families (52 | 18.2%) account for the highest median family income in Seville with $91,071 per family, while 2-person families (52 | 18.2%) have the highest median income of $45,536 per family member.
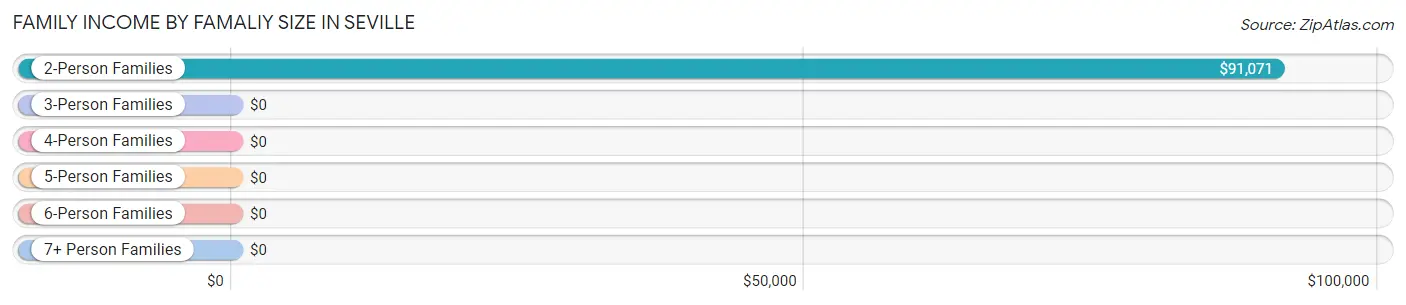
| Income Bracket | # Families | Median Income |
| 2-Person Families | 52 (18.2%) | $91,071 |
| 3-Person Families | 21 (7.4%) | $0 |
| 4-Person Families | 77 (27.0%) | $0 |
| 5-Person Families | 54 (19.0%) | $0 |
| 6-Person Families | 40 (14.0%) | $0 |
| 7+ Person Families | 41 (14.4%) | $0 |
| Total | 285 (100.0%) | $0 |
Family Income by Number of Earners in Seville
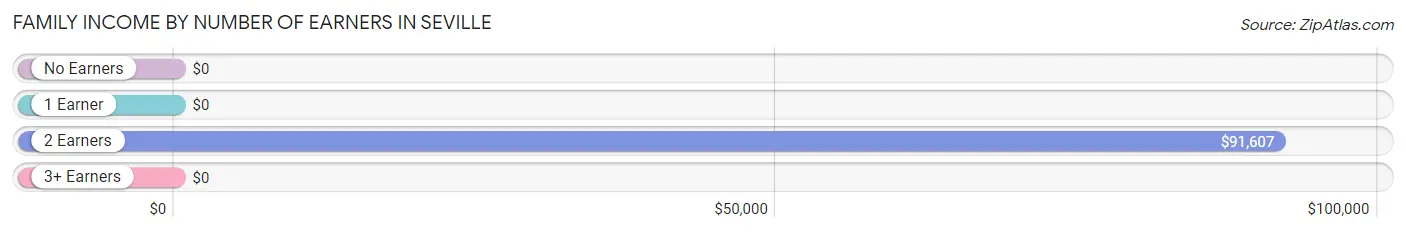
| Number of Earners | # Families | Median Income |
| No Earners | 16 (5.6%) | $0 |
| 1 Earner | 147 (51.6%) | $0 |
| 2 Earners | 50 (17.5%) | $91,607 |
| 3+ Earners | 72 (25.3%) | $0 |
| Total | 285 (100.0%) | $0 |
Household Income in Seville
Household Income Brackets in Seville
With 93 households falling in the category, the $50,000 to $74,999 income range is the most frequent in Seville, accounting for 27.7% of all households.
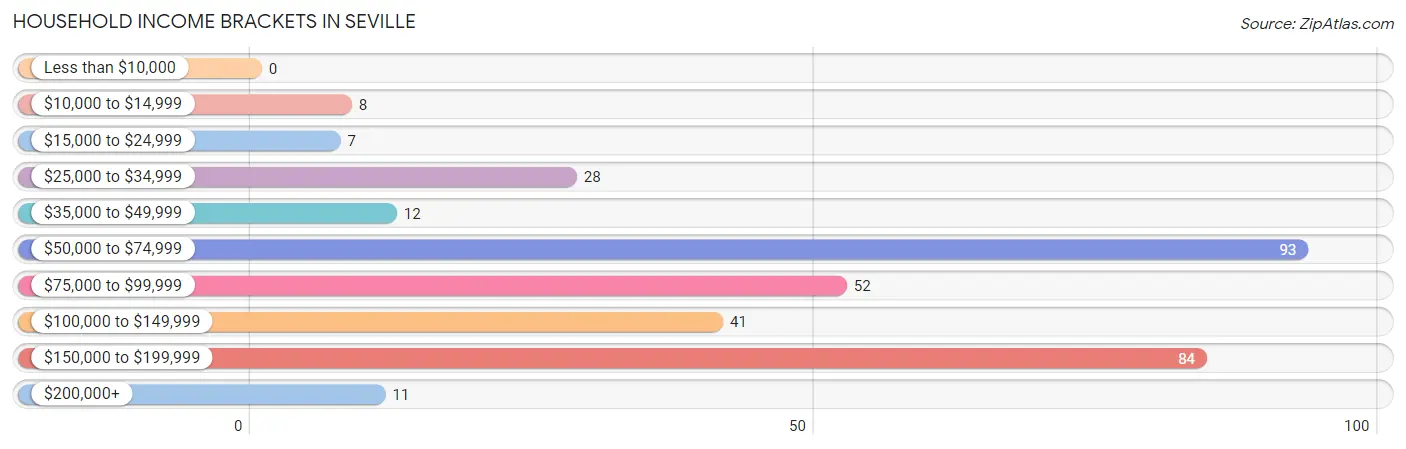
| Income Bracket | # Households | % Households |
| Less than $10,000 | 0 | 0.0% |
| $10,000 to $14,999 | 8 | 2.4% |
| $15,000 to $24,999 | 7 | 2.1% |
| $25,000 to $34,999 | 28 | 8.3% |
| $35,000 to $49,999 | 12 | 3.6% |
| $50,000 to $74,999 | 93 | 27.7% |
| $75,000 to $99,999 | 52 | 15.5% |
| $100,000 to $149,999 | 41 | 12.2% |
| $150,000 to $199,999 | 84 | 25.0% |
| $200,000+ | 11 | 3.3% |
Household Income by Householder Age in Seville
The median household income in Seville is $88,594, with the highest median household income of $136,829 found in the 45 to 64 years age bracket for the primary householder. A total of 212 households (63.1%) fall into this category.
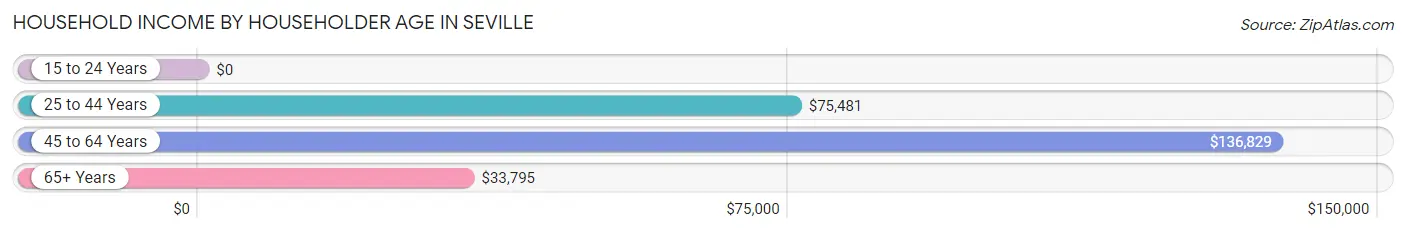
| Income Bracket | # Households | Median Income |
| 15 to 24 Years | 0 (0.0%) | $0 |
| 25 to 44 Years | 81 (24.1%) | $75,481 |
| 45 to 64 Years | 212 (63.1%) | $136,829 |
| 65+ Years | 43 (12.8%) | $33,795 |
| Total | 336 (100.0%) | $88,594 |
Poverty in Seville
Income Below Poverty by Sex and Age in Seville
With 3.5% poverty level for males and 3.2% for females among the residents of Seville, 6 to 11 year old males and 25 to 34 year old females are the most vulnerable to poverty, with 10 males (100.0%) and 14 females (21.5%) in their respective age groups living below the poverty level.
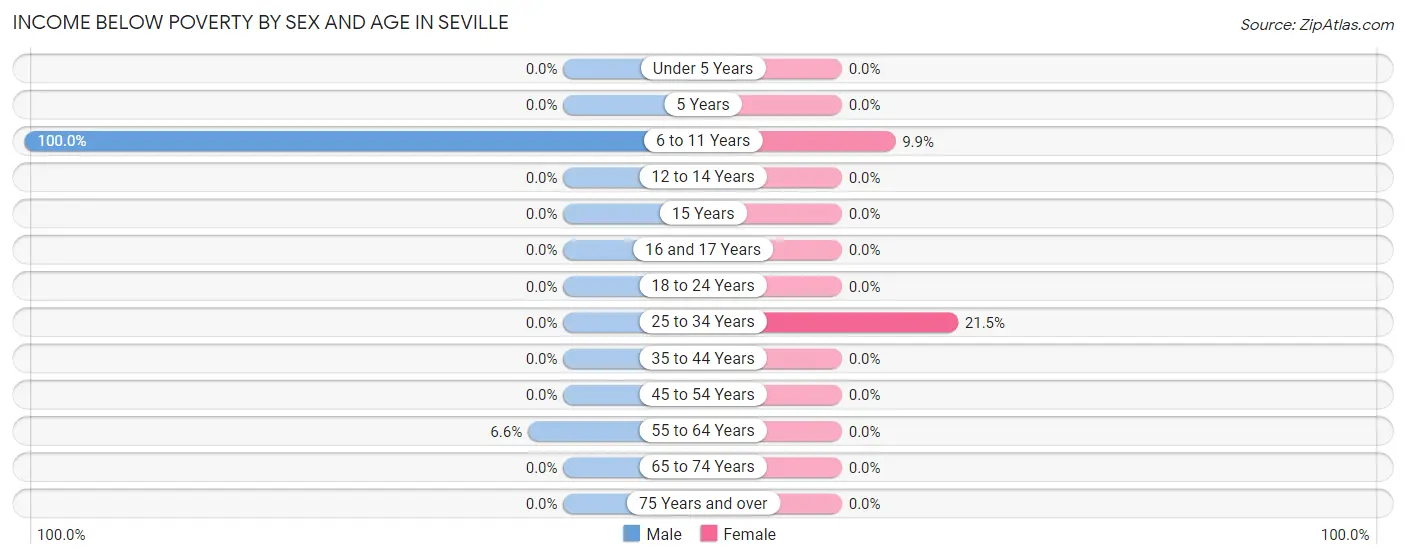
| Age Bracket | Male | Female |
| Under 5 Years | 0 (0.0%) | 0 (0.0%) |
| 5 Years | 0 (0.0%) | 0 (0.0%) |
| 6 to 11 Years | 10 (100.0%) | 11 (9.9%) |
| 12 to 14 Years | 0 (0.0%) | 0 (0.0%) |
| 15 Years | 0 (0.0%) | 0 (0.0%) |
| 16 and 17 Years | 0 (0.0%) | 0 (0.0%) |
| 18 to 24 Years | 0 (0.0%) | 0 (0.0%) |
| 25 to 34 Years | 0 (0.0%) | 14 (21.5%) |
| 35 to 44 Years | 0 (0.0%) | 0 (0.0%) |
| 45 to 54 Years | 0 (0.0%) | 0 (0.0%) |
| 55 to 64 Years | 8 (6.6%) | 0 (0.0%) |
| 65 to 74 Years | 0 (0.0%) | 0 (0.0%) |
| 75 Years and over | 0 (0.0%) | 0 (0.0%) |
| Total | 18 (3.5%) | 25 (3.2%) |
Income Above Poverty by Sex and Age in Seville
According to the poverty statistics in Seville, males aged under 5 years and females aged under 5 years are the age groups that are most secure financially, with 100.0% of males and 100.0% of females in these age groups living above the poverty line.
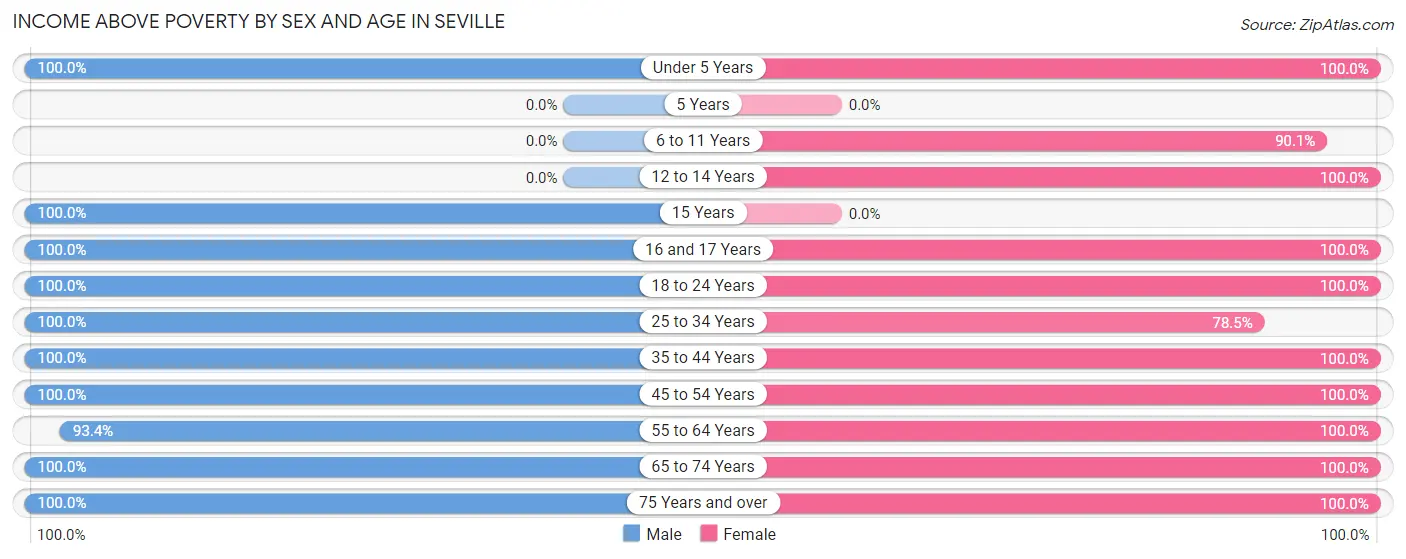
| Age Bracket | Male | Female |
| Under 5 Years | 51 (100.0%) | 98 (100.0%) |
| 5 Years | 0 (0.0%) | 0 (0.0%) |
| 6 to 11 Years | 0 (0.0%) | 100 (90.1%) |
| 12 to 14 Years | 0 (0.0%) | 92 (100.0%) |
| 15 Years | 15 (100.0%) | 0 (0.0%) |
| 16 and 17 Years | 51 (100.0%) | 34 (100.0%) |
| 18 to 24 Years | 46 (100.0%) | 61 (100.0%) |
| 25 to 34 Years | 67 (100.0%) | 51 (78.5%) |
| 35 to 44 Years | 54 (100.0%) | 54 (100.0%) |
| 45 to 54 Years | 88 (100.0%) | 40 (100.0%) |
| 55 to 64 Years | 114 (93.4%) | 77 (100.0%) |
| 65 to 74 Years | 7 (100.0%) | 9 (100.0%) |
| 75 Years and over | 8 (100.0%) | 132 (100.0%) |
| Total | 501 (96.5%) | 748 (96.8%) |
Income Below Poverty Among Married-Couple Families in Seville
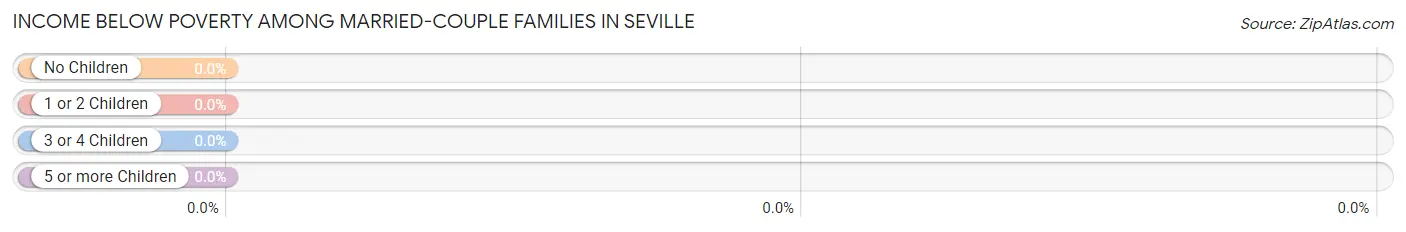
| Children | Above Poverty | Below Poverty |
| No Children | 115 (100.0%) | 0 (0.0%) |
| 1 or 2 Children | 60 (100.0%) | 0 (0.0%) |
| 3 or 4 Children | 9 (100.0%) | 0 (0.0%) |
| 5 or more Children | 41 (100.0%) | 0 (0.0%) |
| Total | 225 (100.0%) | 0 (0.0%) |
Income Below Poverty Among Single-Parent Households in Seville
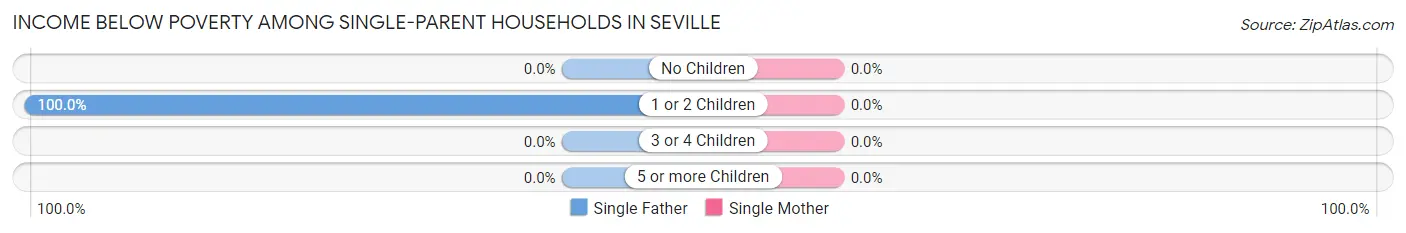
| Children | Single Father | Single Mother |
| No Children | 0 (0.0%) | 0 (0.0%) |
| 1 or 2 Children | 8 (100.0%) | 0 (0.0%) |
| 3 or 4 Children | 0 (0.0%) | 0 (0.0%) |
| 5 or more Children | 0 (0.0%) | 0 (0.0%) |
| Total | 8 (17.4%) | 0 (0.0%) |
Income Below Poverty Among Married-Couple vs Single-Parent Households in Seville
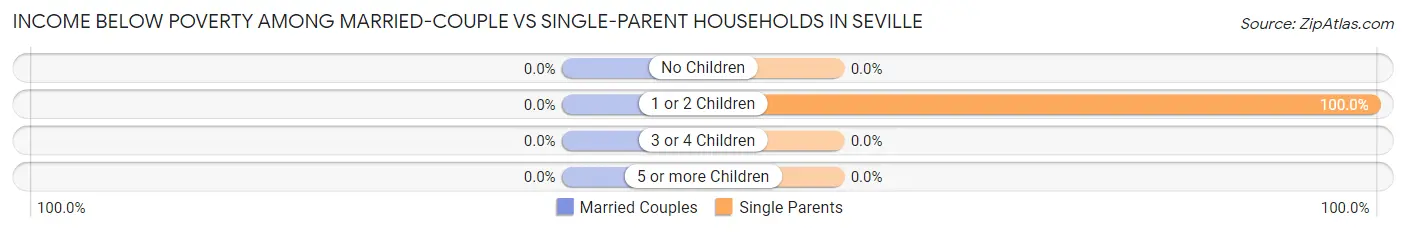
| Children | Married-Couple Families | Single-Parent Households |
| No Children | 0 (0.0%) | 0 (0.0%) |
| 1 or 2 Children | 0 (0.0%) | 8 (100.0%) |
| 3 or 4 Children | 0 (0.0%) | 0 (0.0%) |
| 5 or more Children | 0 (0.0%) | 0 (0.0%) |
| Total | 0 (0.0%) | 8 (13.3%) |
Race in Seville
The most populous races in Seville are Hispanic or Latino (753 | 57.5%), Some other Race (705 | 53.8%), and White / Caucasian (522 | 39.9%).
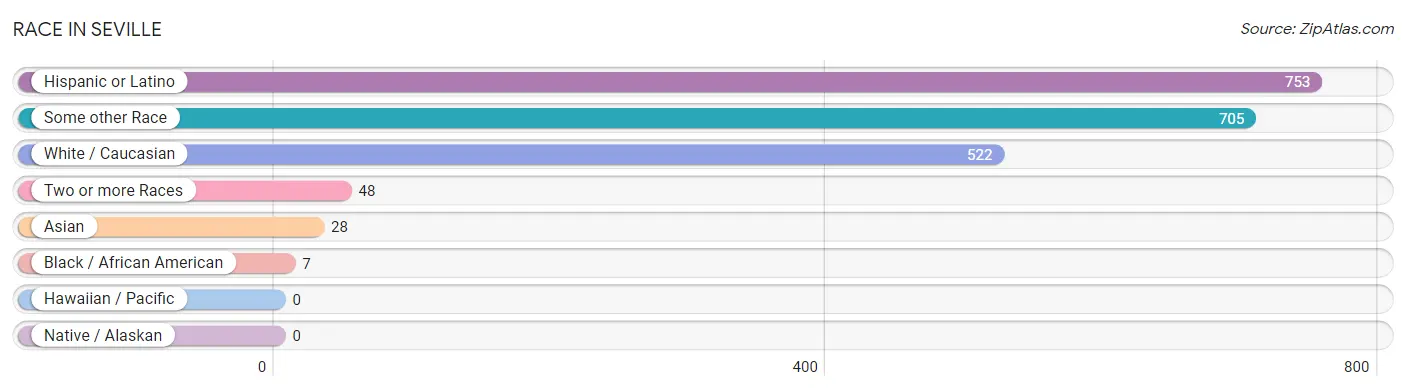
| Race | # Population | % Population |
| Asian | 28 | 2.1% |
| Black / African American | 7 | 0.5% |
| Hawaiian / Pacific | 0 | 0.0% |
| Hispanic or Latino | 753 | 57.5% |
| Native / Alaskan | 0 | 0.0% |
| White / Caucasian | 522 | 39.9% |
| Two or more Races | 48 | 3.7% |
| Some other Race | 705 | 53.8% |
| Total | 1,310 | 100.0% |
Ancestry in Seville
The most populous ancestries reported in Seville are Mexican (725 | 55.3%), European (80 | 6.1%), American (51 | 3.9%), Irish (42 | 3.2%), and English (41 | 3.1%), together accounting for 71.7% of all Seville residents.
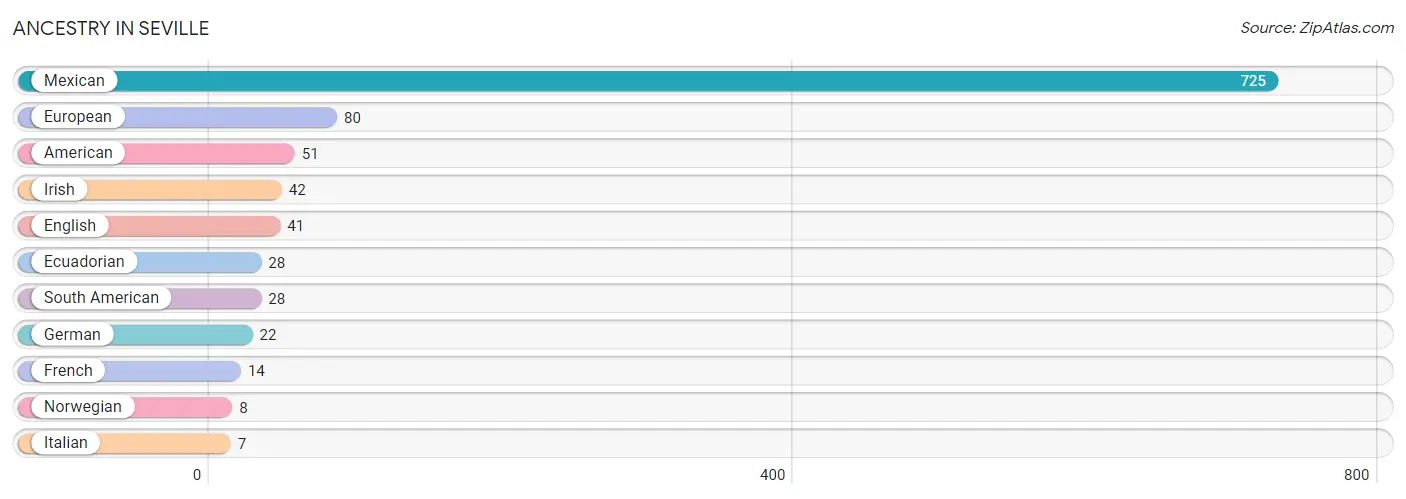
| Ancestry | # Population | % Population |
| American | 51 | 3.9% |
| Ecuadorian | 28 | 2.1% |
| English | 41 | 3.1% |
| European | 80 | 6.1% |
| French | 14 | 1.1% |
| German | 22 | 1.7% |
| Irish | 42 | 3.2% |
| Italian | 7 | 0.5% |
| Mexican | 725 | 55.3% |
| Norwegian | 8 | 0.6% |
| South American | 28 | 2.1% | View All 11 Rows |
Immigrants in Seville
The most numerous immigrant groups reported in Seville came from Latin America (143 | 10.9%), Central America (120 | 9.2%), Mexico (120 | 9.2%), Asia (28 | 2.1%), and Pakistan (28 | 2.1%), together accounting for 33.5% of all Seville residents.
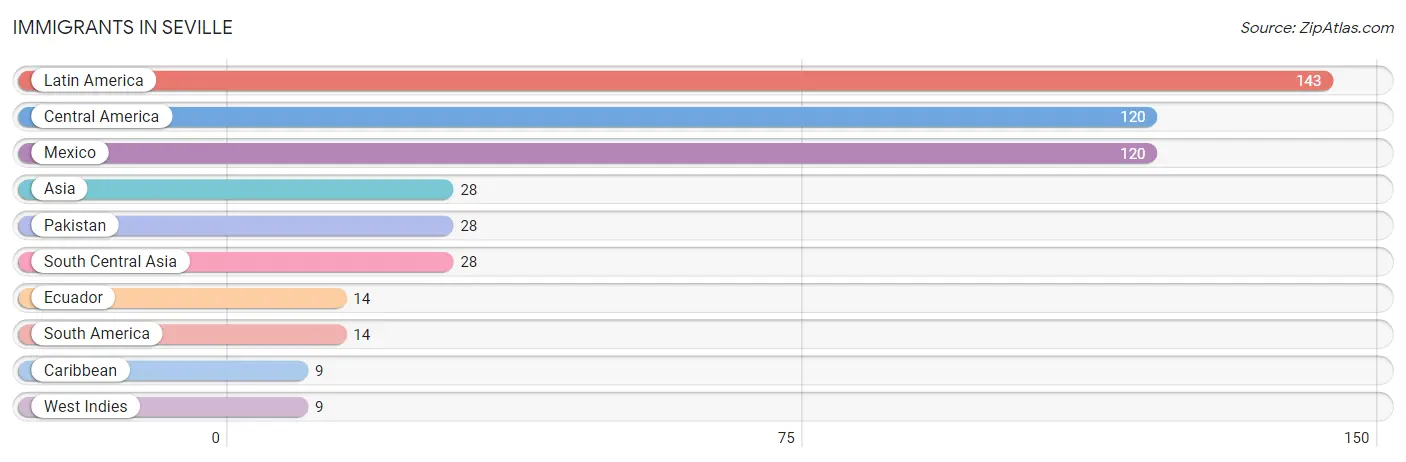
| Immigration Origin | # Population | % Population |
| Asia | 28 | 2.1% |
| Caribbean | 9 | 0.7% |
| Central America | 120 | 9.2% |
| Ecuador | 14 | 1.1% |
| Latin America | 143 | 10.9% |
| Mexico | 120 | 9.2% |
| Pakistan | 28 | 2.1% |
| South America | 14 | 1.1% |
| South Central Asia | 28 | 2.1% |
| West Indies | 9 | 0.7% | View All 10 Rows |
Sex and Age in Seville
Sex and Age in Seville
The most populous age groups in Seville are 60 to 64 Years (96 | 18.5%) for men and Under 5 Years (116 | 14.7%) for women.
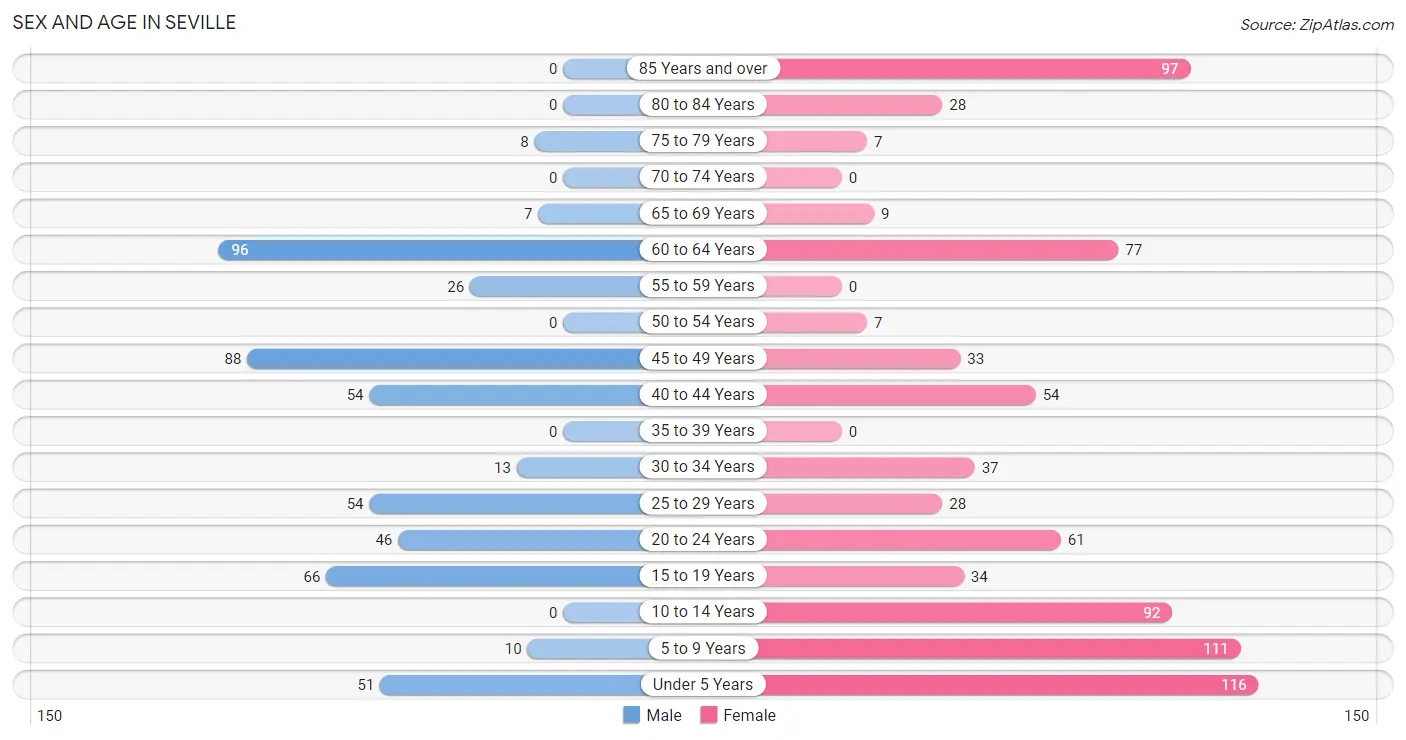
| Age Bracket | Male | Female |
| Under 5 Years | 51 (9.8%) | 116 (14.7%) |
| 5 to 9 Years | 10 (1.9%) | 111 (14.0%) |
| 10 to 14 Years | 0 (0.0%) | 92 (11.6%) |
| 15 to 19 Years | 66 (12.7%) | 34 (4.3%) |
| 20 to 24 Years | 46 (8.9%) | 61 (7.7%) |
| 25 to 29 Years | 54 (10.4%) | 28 (3.5%) |
| 30 to 34 Years | 13 (2.5%) | 37 (4.7%) |
| 35 to 39 Years | 0 (0.0%) | 0 (0.0%) |
| 40 to 44 Years | 54 (10.4%) | 54 (6.8%) |
| 45 to 49 Years | 88 (17.0%) | 33 (4.2%) |
| 50 to 54 Years | 0 (0.0%) | 7 (0.9%) |
| 55 to 59 Years | 26 (5.0%) | 0 (0.0%) |
| 60 to 64 Years | 96 (18.5%) | 77 (9.7%) |
| 65 to 69 Years | 7 (1.3%) | 9 (1.1%) |
| 70 to 74 Years | 0 (0.0%) | 0 (0.0%) |
| 75 to 79 Years | 8 (1.5%) | 7 (0.9%) |
| 80 to 84 Years | 0 (0.0%) | 28 (3.5%) |
| 85 Years and over | 0 (0.0%) | 97 (12.3%) |
| Total | 519 (100.0%) | 791 (100.0%) |
Families and Households in Seville
Median Family Size in Seville
The median family size in Seville is 4.31 persons per family, with single male/father families (46 | 16.1%) accounting for the largest median family size of 4.72 persons per family. On the other hand, single female/mother families (14 | 4.9%) represent the smallest median family size with 2.00 persons per family.
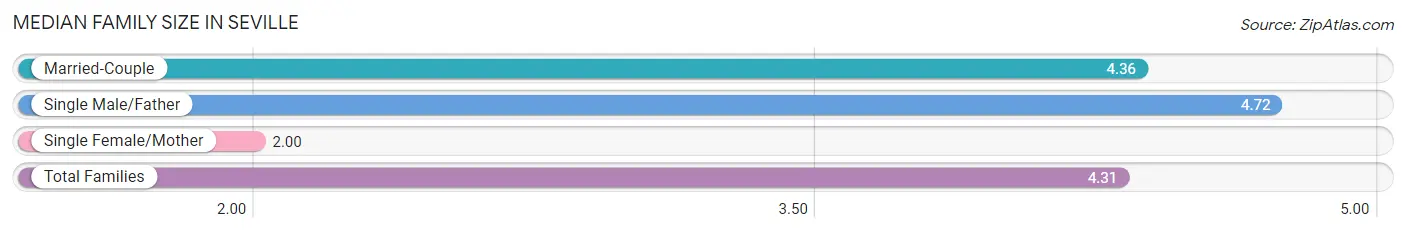
| Family Type | # Families | Family Size |
| Married-Couple | 225 (78.9%) | 4.36 |
| Single Male/Father | 46 (16.1%) | 4.72 |
| Single Female/Mother | 14 (4.9%) | 2.00 |
| Total Families | 285 (100.0%) | 4.31 |
Median Household Size in Seville
The median household size in Seville is 3.90 persons per household, with single male/father households (46 | 13.7%) accounting for the largest median household size of 4.72 persons per household. non-family households (51 | 15.2%) represent the smallest median household size with 1.63 persons per household.
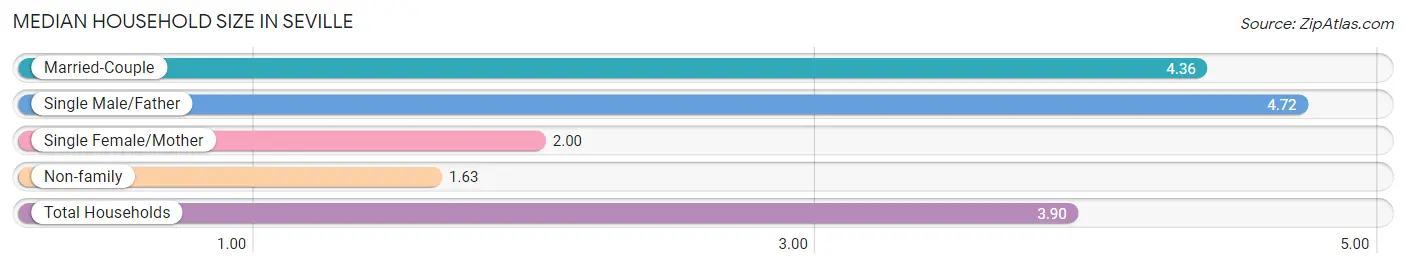
| Household Type | # Households | Household Size |
| Married-Couple | 225 (67.0%) | 4.36 |
| Single Male/Father | 46 (13.7%) | 4.72 |
| Single Female/Mother | 14 (4.2%) | 2.00 |
| Non-family | 51 (15.2%) | 1.63 |
| Total Households | 336 (100.0%) | 3.90 |
Household Size by Marriage Status in Seville
Out of a total of 336 households in Seville, 285 (84.8%) are family households, while 51 (15.2%) are nonfamily households. The most numerous type of family households are 4-person households, comprising 77, and the most common type of nonfamily households are 1-person households, comprising 35.
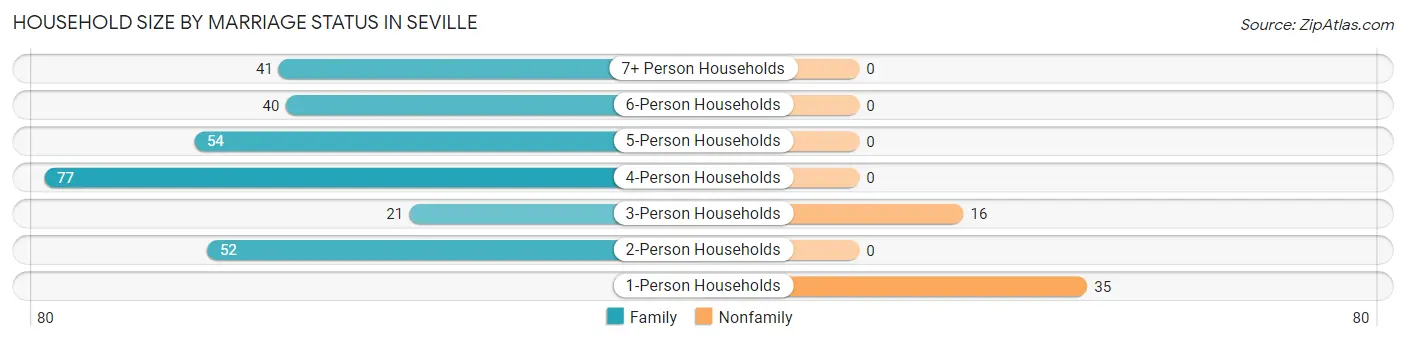
| Household Size | Family Households | Nonfamily Households |
| 1-Person Households | - | 35 (10.4%) |
| 2-Person Households | 52 (15.5%) | 0 (0.0%) |
| 3-Person Households | 21 (6.2%) | 16 (4.8%) |
| 4-Person Households | 77 (22.9%) | 0 (0.0%) |
| 5-Person Households | 54 (16.1%) | 0 (0.0%) |
| 6-Person Households | 40 (11.9%) | 0 (0.0%) |
| 7+ Person Households | 41 (12.2%) | 0 (0.0%) |
| Total | 285 (84.8%) | 51 (15.2%) |
Female Fertility in Seville
Fertility by Age in Seville
Average fertility rate in Seville is 57.0 births per 1,000 women. Women in the age bracket of 20 to 34 years have the highest fertility rate with 111.0 births per 1,000 women. Women in the age bracket of 20 to 34 years acount for 100.0% of all women with births.
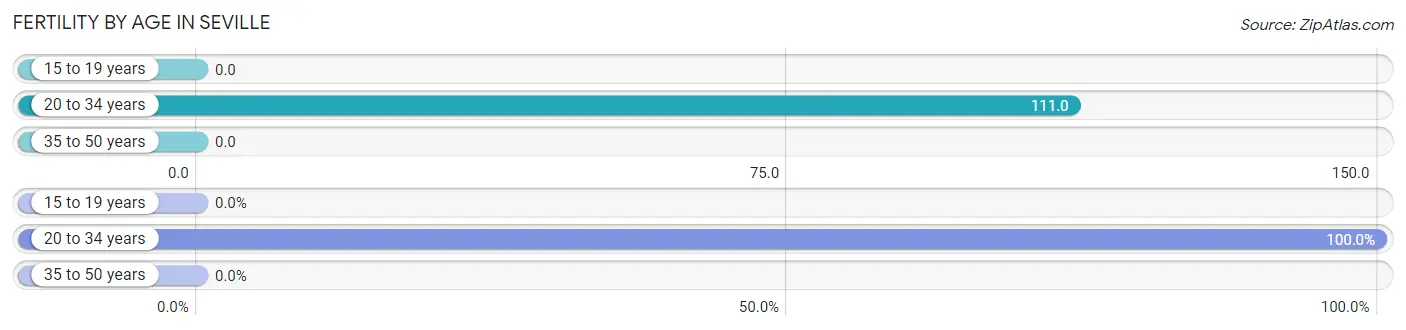
| Age Bracket | Women with Births | Births / 1,000 Women |
| 15 to 19 years | 0 (0.0%) | 0.0 |
| 20 to 34 years | 14 (100.0%) | 111.0 |
| 35 to 50 years | 0 (0.0%) | 0.0 |
| Total | 14 (100.0%) | 57.0 |
Fertility by Age by Marriage Status in Seville
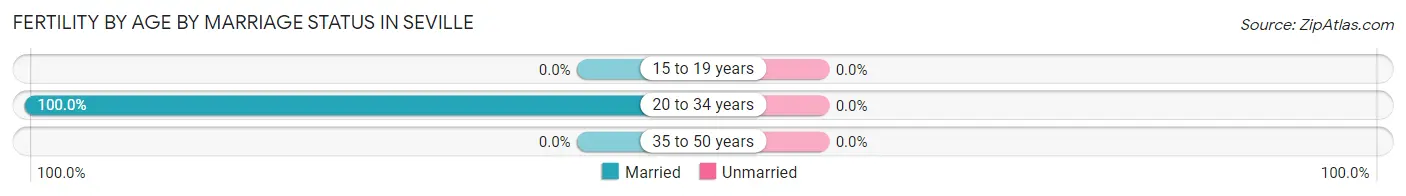
| Age Bracket | Married | Unmarried |
| 15 to 19 years | 0 (0.0%) | 0 (0.0%) |
| 20 to 34 years | 14 (100.0%) | 0 (0.0%) |
| 35 to 50 years | 0 (0.0%) | 0 (0.0%) |
| Total | 14 (100.0%) | 0 (0.0%) |
Fertility by Education in Seville
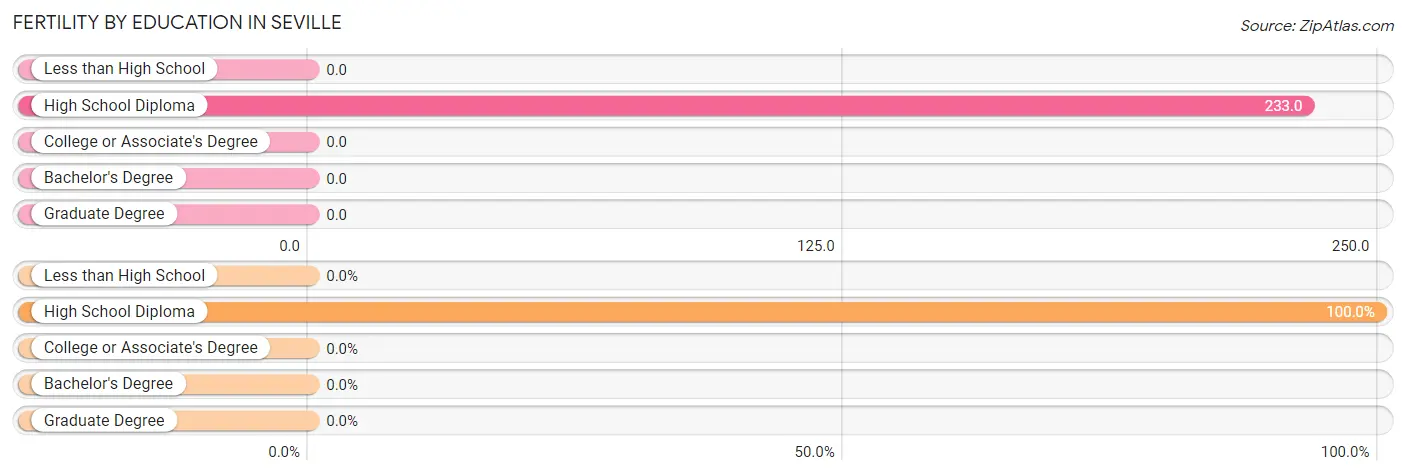
| Educational Attainment | Women with Births | Births / 1,000 Women |
| Less than High School | 0 (0.0%) | 0.0 |
| High School Diploma | 14 (100.0%) | 233.0 |
| College or Associate's Degree | 0 (0.0%) | 0.0 |
| Bachelor's Degree | 0 (0.0%) | 0.0 |
| Graduate Degree | 0 (0.0%) | 0.0 |
| Total | 14 (100.0%) | 57.0 |
Fertility by Education by Marriage Status in Seville
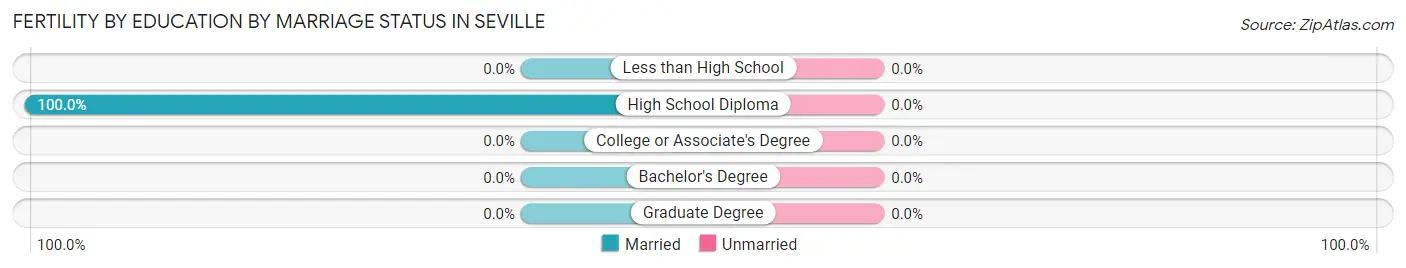
| Educational Attainment | Married | Unmarried |
| Less than High School | 0 (0.0%) | 0 (0.0%) |
| High School Diploma | 14 (100.0%) | 0 (0.0%) |
| College or Associate's Degree | 0 (0.0%) | 0 (0.0%) |
| Bachelor's Degree | 0 (0.0%) | 0 (0.0%) |
| Graduate Degree | 0 (0.0%) | 0 (0.0%) |
| Total | 14 (100.0%) | 0 (0.0%) |
Employment Characteristics in Seville
Employment by Class of Employer in Seville
Among the 493 employed individuals in Seville, private company employees (413 | 83.8%), local government employees (31 | 6.3%), and not-for-profit organizations (29 | 5.9%) make up the most common classes of employment.
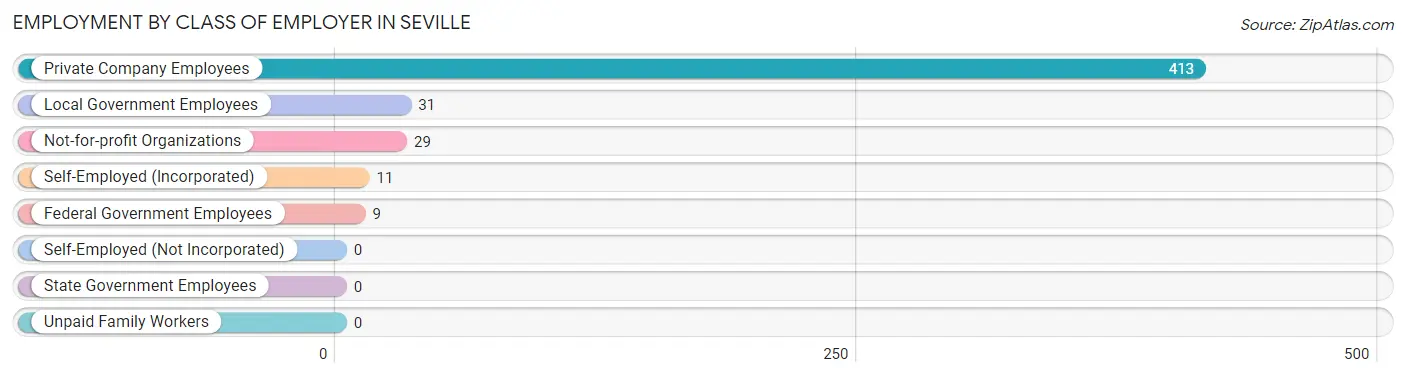
| Employer Class | # Employees | % Employees |
| Private Company Employees | 413 | 83.8% |
| Self-Employed (Incorporated) | 11 | 2.2% |
| Self-Employed (Not Incorporated) | 0 | 0.0% |
| Not-for-profit Organizations | 29 | 5.9% |
| Local Government Employees | 31 | 6.3% |
| State Government Employees | 0 | 0.0% |
| Federal Government Employees | 9 | 1.8% |
| Unpaid Family Workers | 0 | 0.0% |
| Total | 493 | 100.0% |
Employment Status by Age in Seville
According to the labor force statistics for Seville, out of the total population over 16 years of age (915), 54.9% or 502 individuals are in the labor force, with 1.8% or 9 of them unemployed. The age group with the highest labor force participation rate is 20 to 24 years, with 100.0% or 107 individuals in the labor force. Within the labor force, the 65 to 74 years age range has the highest percentage of unemployed individuals, with 100.0% or 9 of them being unemployed.
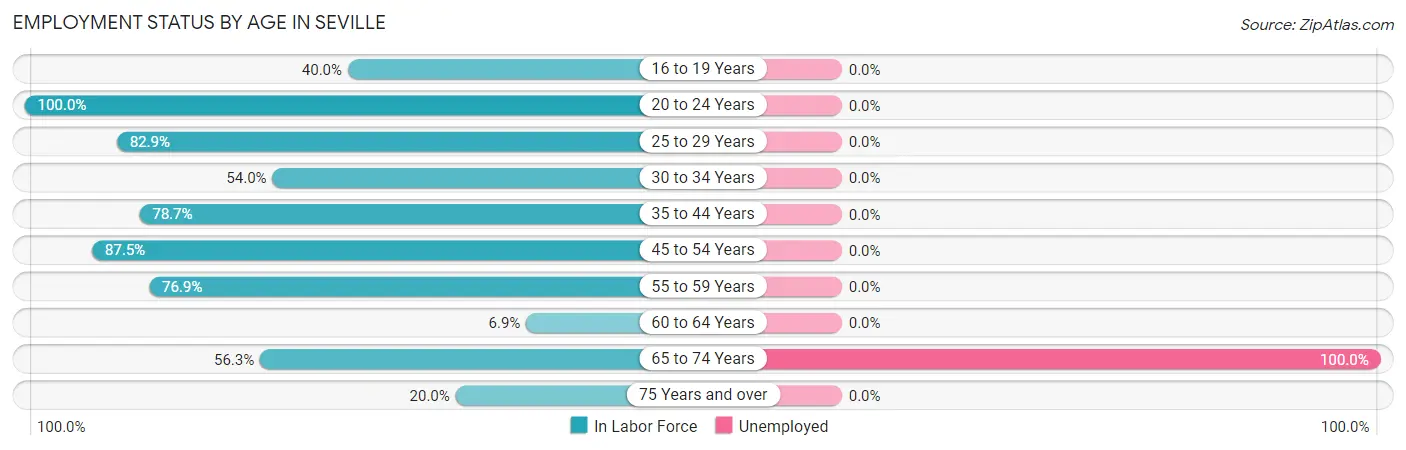
| Age Bracket | In Labor Force | Unemployed |
| 16 to 19 Years | 34 (40.0%) | 0 (0.0%) |
| 20 to 24 Years | 107 (100.0%) | 0 (0.0%) |
| 25 to 29 Years | 68 (82.9%) | 0 (0.0%) |
| 30 to 34 Years | 27 (54.0%) | 0 (0.0%) |
| 35 to 44 Years | 85 (78.7%) | 0 (0.0%) |
| 45 to 54 Years | 112 (87.5%) | 0 (0.0%) |
| 55 to 59 Years | 20 (76.9%) | 0 (0.0%) |
| 60 to 64 Years | 12 (6.9%) | 0 (0.0%) |
| 65 to 74 Years | 9 (56.3%) | 9 (100.0%) |
| 75 Years and over | 28 (20.0%) | 0 (0.0%) |
| Total | 502 (54.9%) | 9 (1.8%) |
Employment Status by Educational Attainment in Seville
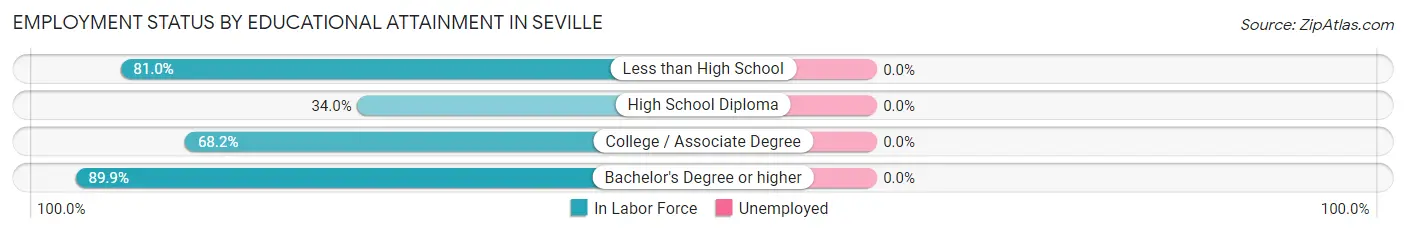
| Educational Attainment | In Labor Force | Unemployed |
| Less than High School | 47 (81.0%) | 0 (0.0%) |
| High School Diploma | 104 (34.0%) | 0 (0.0%) |
| College / Associate Degree | 30 (68.2%) | 0 (0.0%) |
| Bachelor's Degree or higher | 143 (89.9%) | 0 (0.0%) |
| Total | 324 (57.1%) | 0 (0.0%) |
Employment Occupations by Sex in Seville
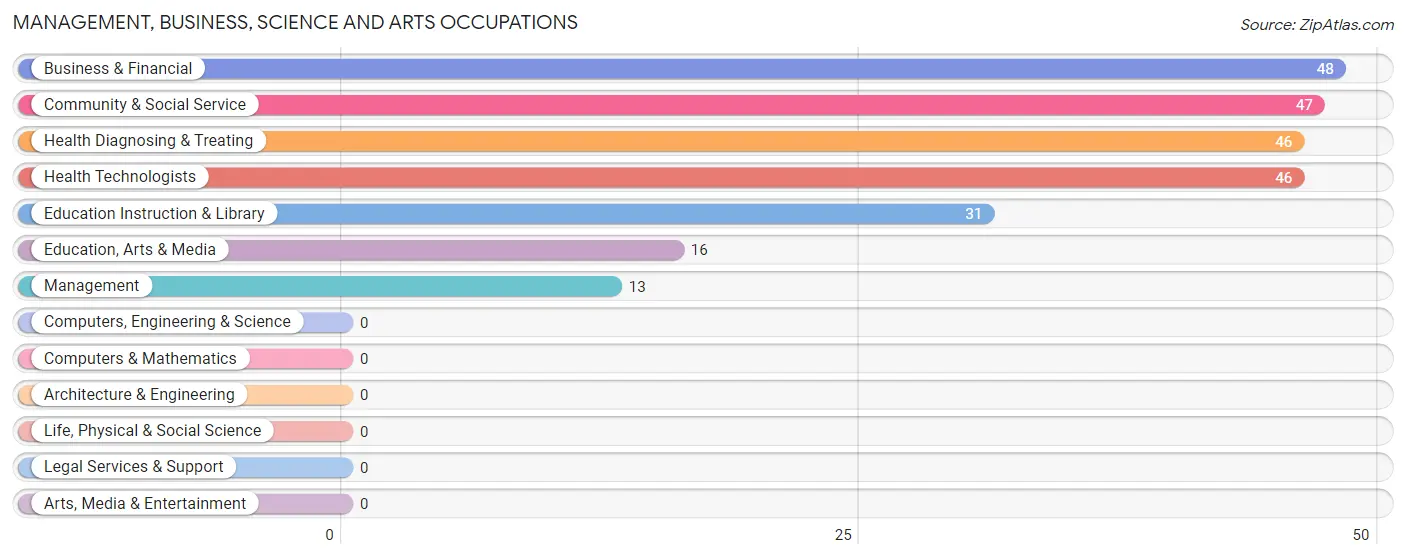
Management, Business, Science and Arts Occupations
The most common Management, Business, Science and Arts occupations in Seville are Business & Financial (48 | 9.7%), Community & Social Service (47 | 9.5%), Health Diagnosing & Treating (46 | 9.3%), Health Technologists (46 | 9.3%), and Education Instruction & Library (31 | 6.3%).
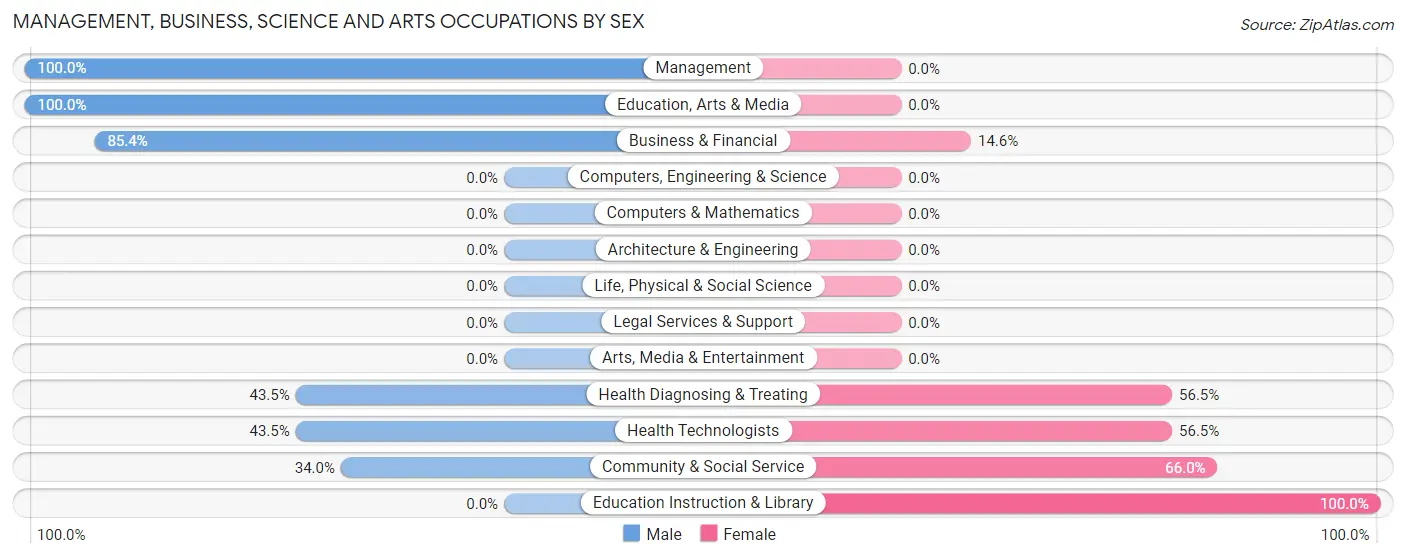
Management, Business, Science and Arts Occupations by Sex
Within the Management, Business, Science and Arts occupations in Seville, the most male-oriented occupations are Management (100.0%), Education, Arts & Media (100.0%), and Business & Financial (85.4%), while the most female-oriented occupations are Education Instruction & Library (100.0%), Community & Social Service (66.0%), and Health Diagnosing & Treating (56.5%).
| Occupation | Male | Female |
| Management | 13 (100.0%) | 0 (0.0%) |
| Business & Financial | 41 (85.4%) | 7 (14.6%) |
| Computers, Engineering & Science | 0 (0.0%) | 0 (0.0%) |
| Computers & Mathematics | 0 (0.0%) | 0 (0.0%) |
| Architecture & Engineering | 0 (0.0%) | 0 (0.0%) |
| Life, Physical & Social Science | 0 (0.0%) | 0 (0.0%) |
| Community & Social Service | 16 (34.0%) | 31 (66.0%) |
| Education, Arts & Media | 16 (100.0%) | 0 (0.0%) |
| Legal Services & Support | 0 (0.0%) | 0 (0.0%) |
| Education Instruction & Library | 0 (0.0%) | 31 (100.0%) |
| Arts, Media & Entertainment | 0 (0.0%) | 0 (0.0%) |
| Health Diagnosing & Treating | 20 (43.5%) | 26 (56.5%) |
| Health Technologists | 20 (43.5%) | 26 (56.5%) |
| Total (Category) | 90 (58.4%) | 64 (41.6%) |
| Total (Overall) | 275 (55.8%) | 218 (44.2%) |
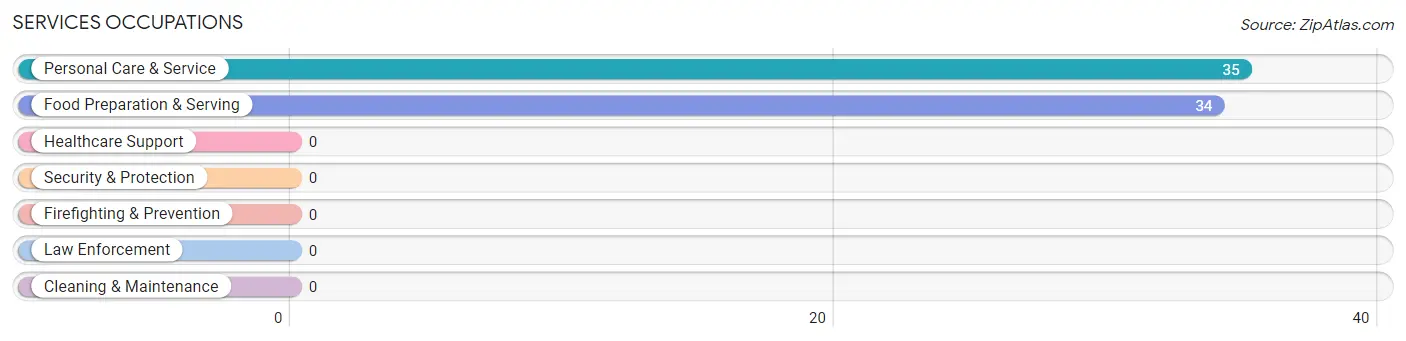
Services Occupations
The most common Services occupations in Seville are Personal Care & Service (35 | 7.1%), and Food Preparation & Serving (34 | 6.9%).
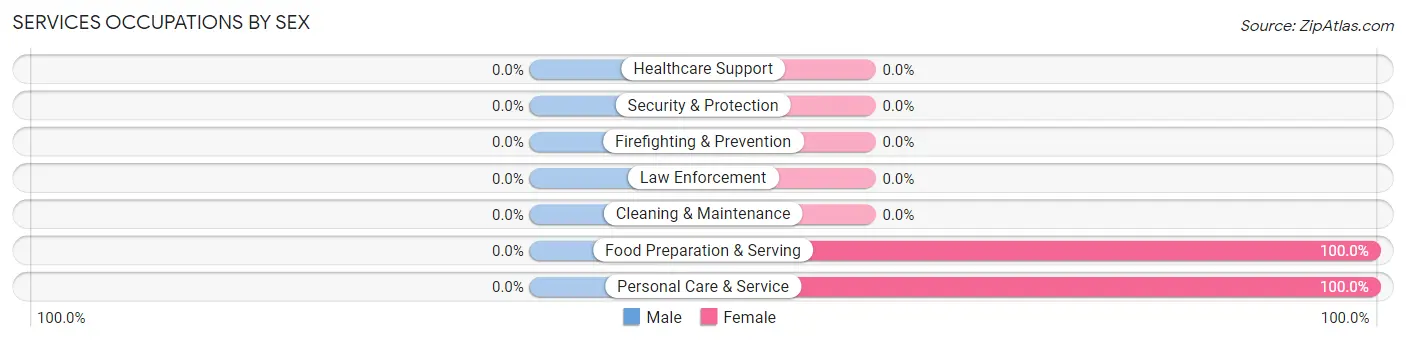
Services Occupations by Sex
| Occupation | Male | Female |
| Healthcare Support | 0 (0.0%) | 0 (0.0%) |
| Security & Protection | 0 (0.0%) | 0 (0.0%) |
| Firefighting & Prevention | 0 (0.0%) | 0 (0.0%) |
| Law Enforcement | 0 (0.0%) | 0 (0.0%) |
| Food Preparation & Serving | 0 (0.0%) | 34 (100.0%) |
| Cleaning & Maintenance | 0 (0.0%) | 0 (0.0%) |
| Personal Care & Service | 0 (0.0%) | 35 (100.0%) |
| Total (Category) | 0 (0.0%) | 69 (100.0%) |
| Total (Overall) | 275 (55.8%) | 218 (44.2%) |
Sales and Office Occupations
The most common Sales and Office occupations in Seville are Office & Administration (45 | 9.1%), and Sales & Related (18 | 3.6%).

Sales and Office Occupations by Sex

| Occupation | Male | Female |
| Sales & Related | 18 (100.0%) | 0 (0.0%) |
| Office & Administration | 0 (0.0%) | 45 (100.0%) |
| Total (Category) | 18 (28.6%) | 45 (71.4%) |
| Total (Overall) | 275 (55.8%) | 218 (44.2%) |
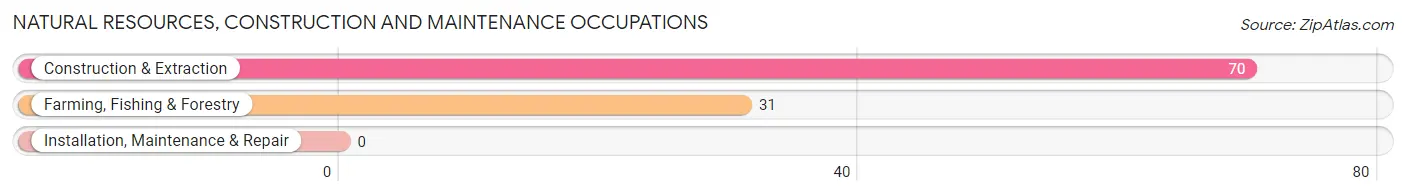
Natural Resources, Construction and Maintenance Occupations
The most common Natural Resources, Construction and Maintenance occupations in Seville are Construction & Extraction (70 | 14.2%), and Farming, Fishing & Forestry (31 | 6.3%).
Natural Resources, Construction and Maintenance Occupations by Sex
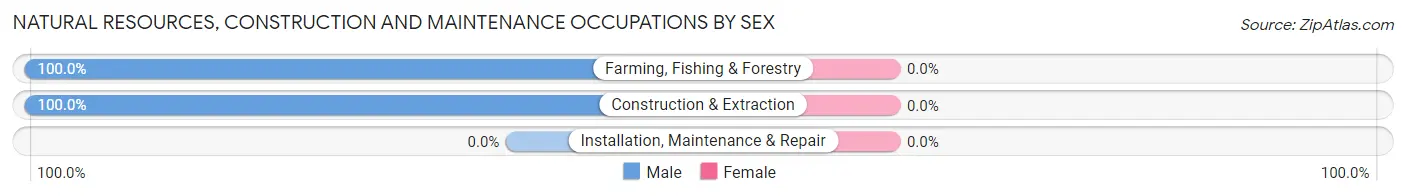
| Occupation | Male | Female |
| Farming, Fishing & Forestry | 31 (100.0%) | 0 (0.0%) |
| Construction & Extraction | 70 (100.0%) | 0 (0.0%) |
| Installation, Maintenance & Repair | 0 (0.0%) | 0 (0.0%) |
| Total (Category) | 101 (100.0%) | 0 (0.0%) |
| Total (Overall) | 275 (55.8%) | 218 (44.2%) |
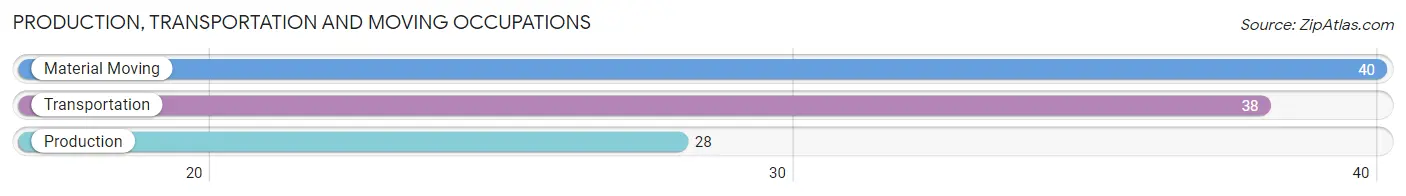
Production, Transportation and Moving Occupations
The most common Production, Transportation and Moving occupations in Seville are Material Moving (40 | 8.1%), Transportation (38 | 7.7%), and Production (28 | 5.7%).
Production, Transportation and Moving Occupations by Sex
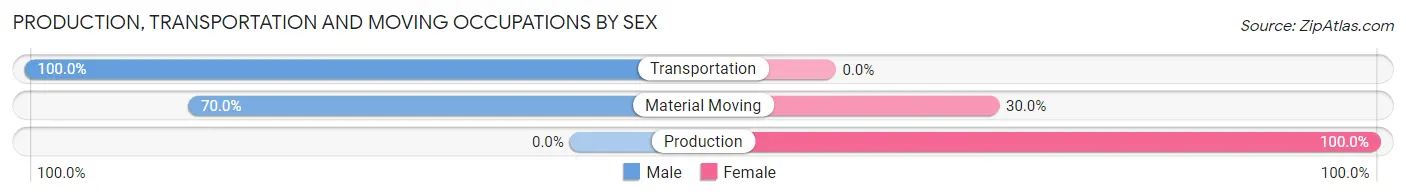
| Occupation | Male | Female |
| Production | 0 (0.0%) | 28 (100.0%) |
| Transportation | 38 (100.0%) | 0 (0.0%) |
| Material Moving | 28 (70.0%) | 12 (30.0%) |
| Total (Category) | 66 (62.3%) | 40 (37.7%) |
| Total (Overall) | 275 (55.8%) | 218 (44.2%) |
Employment Industries by Sex in Seville
Employment Industries in Seville
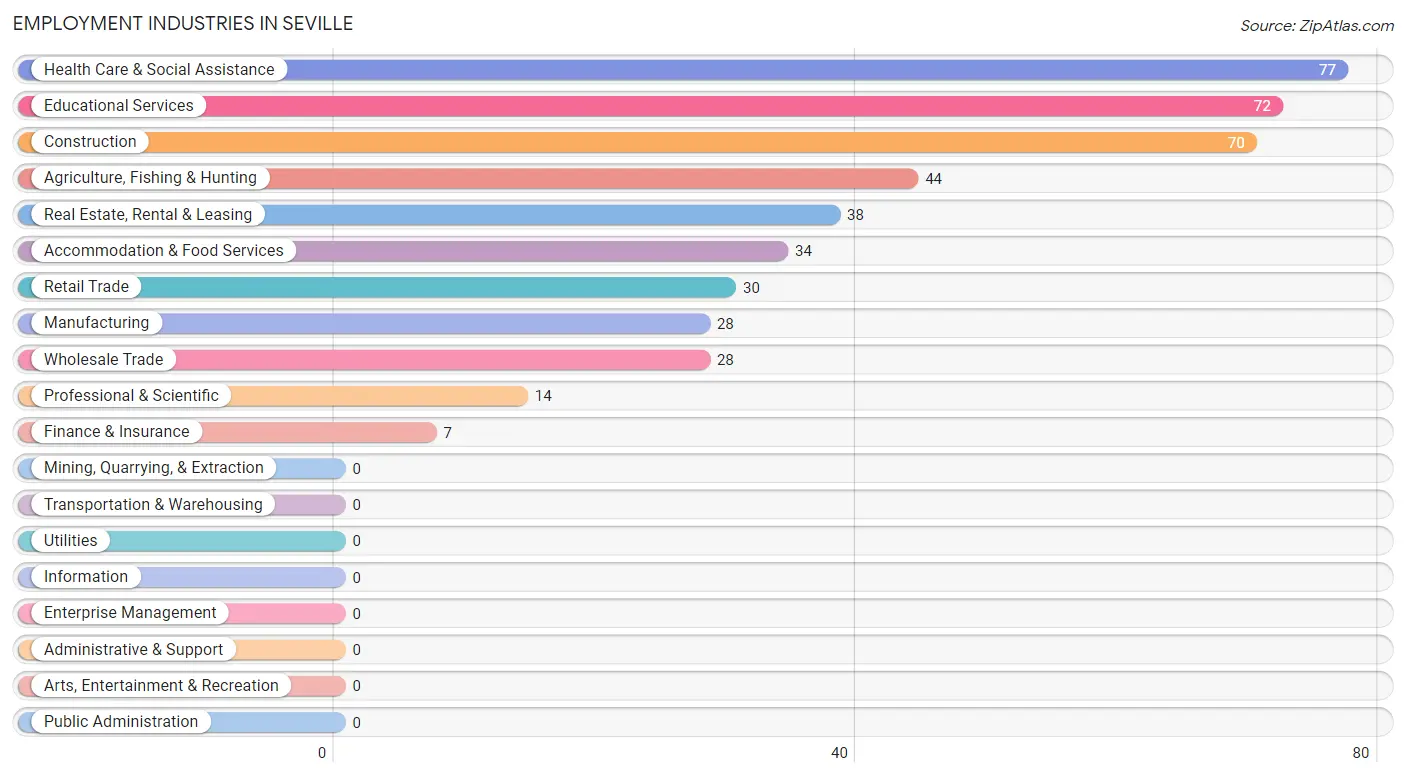
The major employment industries in Seville include Health Care & Social Assistance (77 | 15.6%), Educational Services (72 | 14.6%), Construction (70 | 14.2%), Agriculture, Fishing & Hunting (44 | 8.9%), and Real Estate, Rental & Leasing (38 | 7.7%).
Employment Industries by Sex in Seville
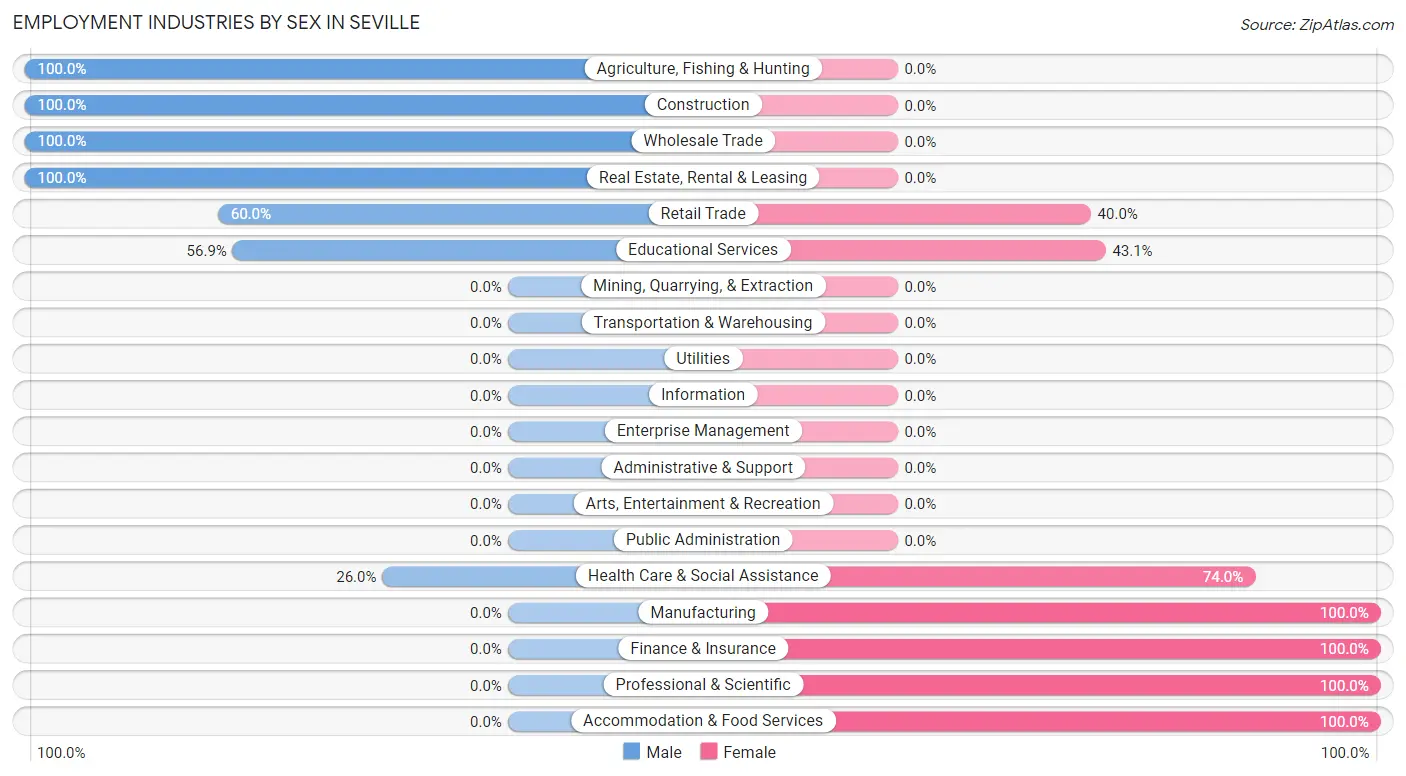
The Seville industries that see more men than women are Agriculture, Fishing & Hunting (100.0%), Construction (100.0%), and Wholesale Trade (100.0%), whereas the industries that tend to have a higher number of women are Manufacturing (100.0%), Finance & Insurance (100.0%), and Professional & Scientific (100.0%).
| Industry | Male | Female |
| Agriculture, Fishing & Hunting | 44 (100.0%) | 0 (0.0%) |
| Mining, Quarrying, & Extraction | 0 (0.0%) | 0 (0.0%) |
| Construction | 70 (100.0%) | 0 (0.0%) |
| Manufacturing | 0 (0.0%) | 28 (100.0%) |
| Wholesale Trade | 28 (100.0%) | 0 (0.0%) |
| Retail Trade | 18 (60.0%) | 12 (40.0%) |
| Transportation & Warehousing | 0 (0.0%) | 0 (0.0%) |
| Utilities | 0 (0.0%) | 0 (0.0%) |
| Information | 0 (0.0%) | 0 (0.0%) |
| Finance & Insurance | 0 (0.0%) | 7 (100.0%) |
| Real Estate, Rental & Leasing | 38 (100.0%) | 0 (0.0%) |
| Professional & Scientific | 0 (0.0%) | 14 (100.0%) |
| Enterprise Management | 0 (0.0%) | 0 (0.0%) |
| Administrative & Support | 0 (0.0%) | 0 (0.0%) |
| Educational Services | 41 (56.9%) | 31 (43.1%) |
| Health Care & Social Assistance | 20 (26.0%) | 57 (74.0%) |
| Arts, Entertainment & Recreation | 0 (0.0%) | 0 (0.0%) |
| Accommodation & Food Services | 0 (0.0%) | 34 (100.0%) |
| Public Administration | 0 (0.0%) | 0 (0.0%) |
| Total | 275 (55.8%) | 218 (44.2%) |
Education in Seville
School Enrollment in Seville
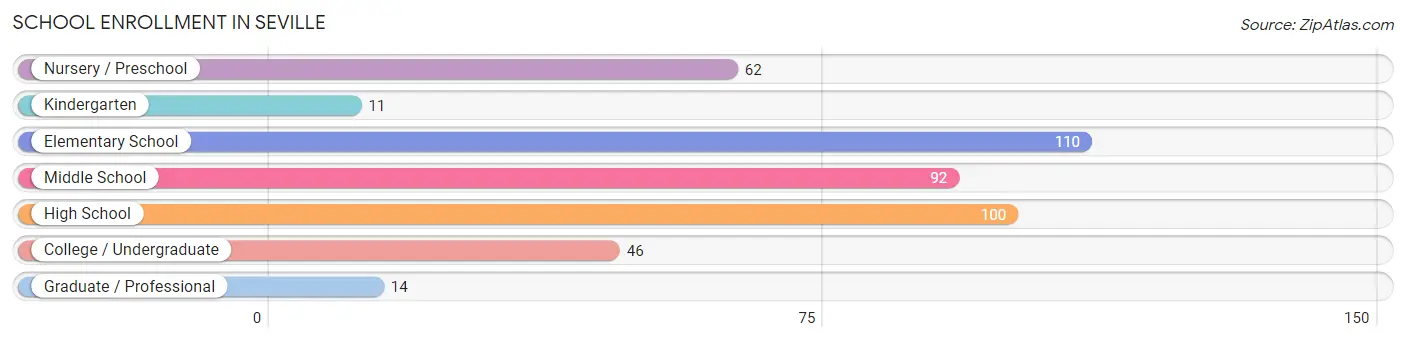
The most common levels of schooling among the 435 students in Seville are elementary school (110 | 25.3%), high school (100 | 23.0%), and middle school (92 | 21.1%).
| School Level | # Students | % Students |
| Nursery / Preschool | 62 | 14.2% |
| Kindergarten | 11 | 2.5% |
| Elementary School | 110 | 25.3% |
| Middle School | 92 | 21.1% |
| High School | 100 | 23.0% |
| College / Undergraduate | 46 | 10.6% |
| Graduate / Professional | 14 | 3.2% |
| Total | 435 | 100.0% |
School Enrollment by Age by Funding Source in Seville
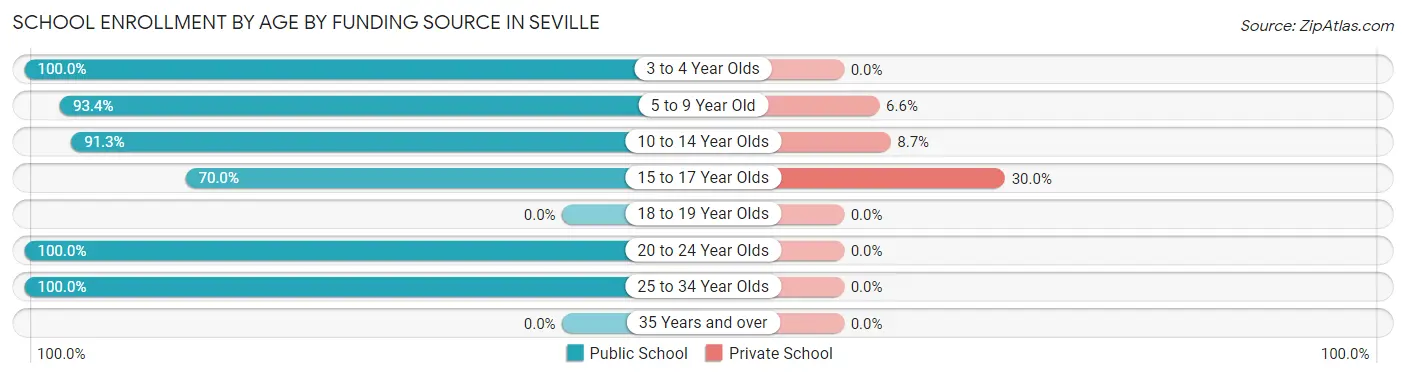
Out of a total of 435 students who are enrolled in schools in Seville, 46 (10.6%) attend a private institution, while the remaining 389 (89.4%) are enrolled in public schools. The age group of 15 to 17 year olds has the highest likelihood of being enrolled in private schools, with 30 (30.0% in the age bracket) enrolled. Conversely, the age group of 3 to 4 year olds has the lowest likelihood of being enrolled in a private school, with 62 (100.0% in the age bracket) attending a public institution.
| Age Bracket | Public School | Private School |
| 3 to 4 Year Olds | 62 (100.0%) | 0 (0.0%) |
| 5 to 9 Year Old | 113 (93.4%) | 8 (6.6%) |
| 10 to 14 Year Olds | 84 (91.3%) | 8 (8.7%) |
| 15 to 17 Year Olds | 70 (70.0%) | 30 (30.0%) |
| 18 to 19 Year Olds | 0 (0.0%) | 0 (0.0%) |
| 20 to 24 Year Olds | 46 (100.0%) | 0 (0.0%) |
| 25 to 34 Year Olds | 14 (100.0%) | 0 (0.0%) |
| 35 Years and over | 0 (0.0%) | 0 (0.0%) |
| Total | 389 (89.4%) | 46 (10.6%) |
Educational Attainment by Field of Study in Seville
Business (57 | 27.5%), psychology (47 | 22.7%), visual & performing arts (41 | 19.8%), physical & health sciences (25 | 12.1%), and education (23 | 11.1%) are the most common fields of study among 207 individuals in Seville who have obtained a bachelor's degree or higher.
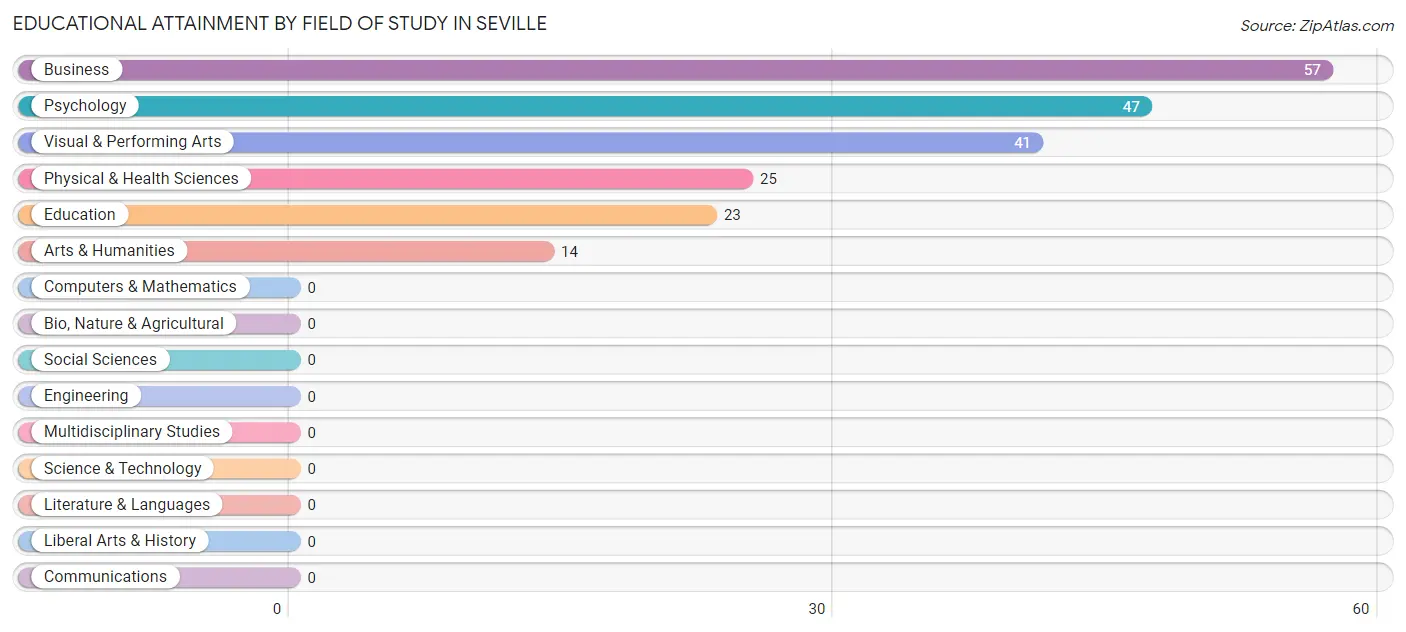
| Field of Study | # Graduates | % Graduates |
| Computers & Mathematics | 0 | 0.0% |
| Bio, Nature & Agricultural | 0 | 0.0% |
| Physical & Health Sciences | 25 | 12.1% |
| Psychology | 47 | 22.7% |
| Social Sciences | 0 | 0.0% |
| Engineering | 0 | 0.0% |
| Multidisciplinary Studies | 0 | 0.0% |
| Science & Technology | 0 | 0.0% |
| Business | 57 | 27.5% |
| Education | 23 | 11.1% |
| Literature & Languages | 0 | 0.0% |
| Liberal Arts & History | 0 | 0.0% |
| Visual & Performing Arts | 41 | 19.8% |
| Communications | 0 | 0.0% |
| Arts & Humanities | 14 | 6.8% |
| Total | 207 | 100.0% |
Transportation & Commute in Seville
Vehicle Availability by Sex in Seville
The most prevalent vehicle ownership categories in Seville are males with 3 vehicles (84, accounting for 30.5%) and females with 3 vehicles (94, making up 38.5%).
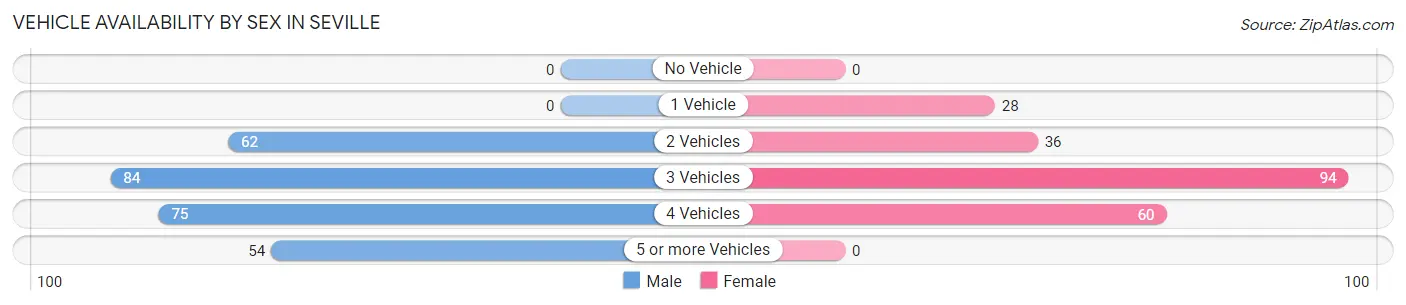
| Vehicles Available | Male | Female |
| No Vehicle | 0 (0.0%) | 0 (0.0%) |
| 1 Vehicle | 0 (0.0%) | 28 (12.8%) |
| 2 Vehicles | 62 (22.6%) | 36 (16.5%) |
| 3 Vehicles | 84 (30.5%) | 94 (43.1%) |
| 4 Vehicles | 75 (27.3%) | 60 (27.5%) |
| 5 or more Vehicles | 54 (19.6%) | 0 (0.0%) |
| Total | 275 (100.0%) | 218 (100.0%) |
Commute Time in Seville
The most frequently occuring commute durations in Seville are less than 5 minutes (110 commuters, 22.6%), 10 to 14 minutes (96 commuters, 19.8%), and 60 to 89 minutes (92 commuters, 18.9%).
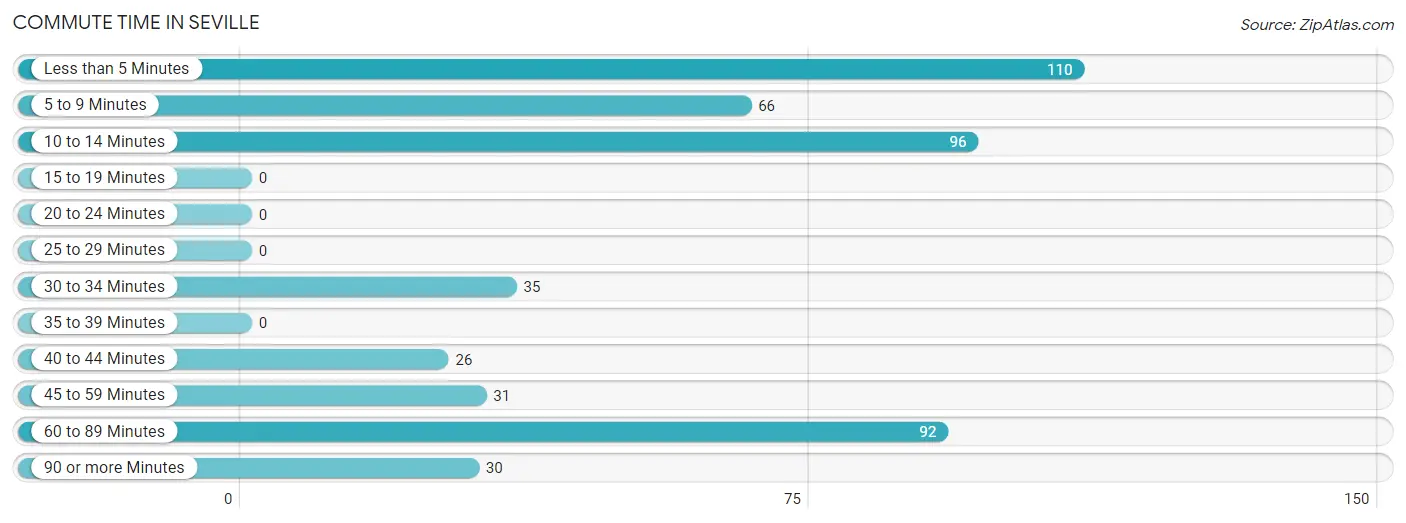
| Commute Time | # Commuters | % Commuters |
| Less than 5 Minutes | 110 | 22.6% |
| 5 to 9 Minutes | 66 | 13.6% |
| 10 to 14 Minutes | 96 | 19.8% |
| 15 to 19 Minutes | 0 | 0.0% |
| 20 to 24 Minutes | 0 | 0.0% |
| 25 to 29 Minutes | 0 | 0.0% |
| 30 to 34 Minutes | 35 | 7.2% |
| 35 to 39 Minutes | 0 | 0.0% |
| 40 to 44 Minutes | 26 | 5.3% |
| 45 to 59 Minutes | 31 | 6.4% |
| 60 to 89 Minutes | 92 | 18.9% |
| 90 or more Minutes | 30 | 6.2% |
Commute Time by Sex in Seville
The most common commute times in Seville are less than 5 minutes (70 commuters, 25.5%) for males and less than 5 minutes (40 commuters, 19.0%) for females.
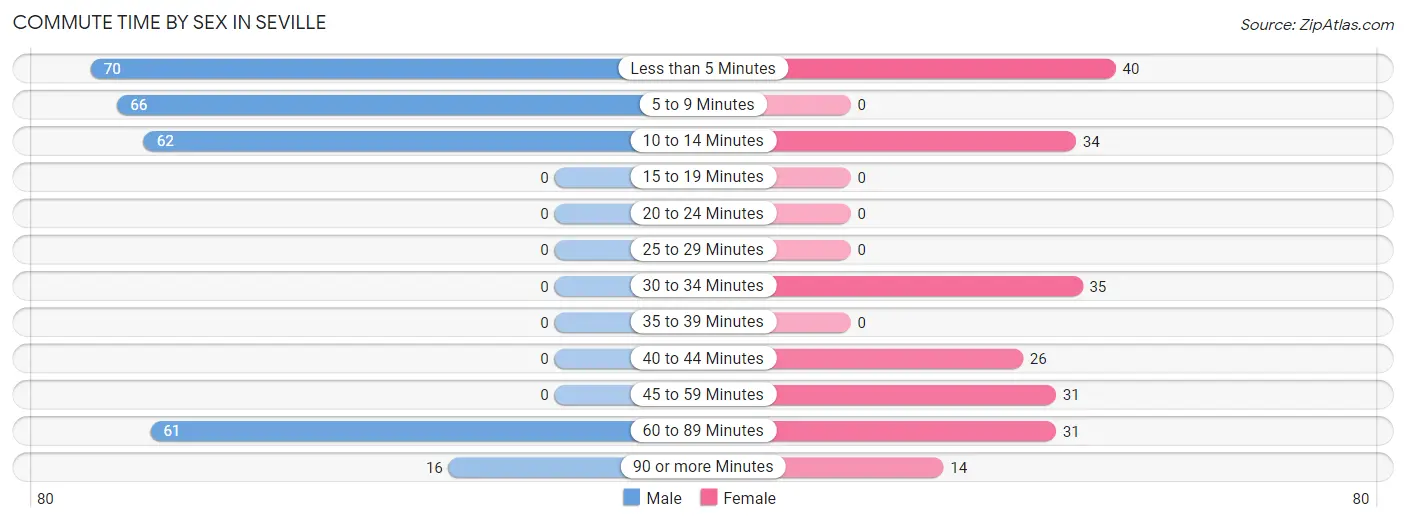
| Commute Time | Male | Female |
| Less than 5 Minutes | 70 (25.5%) | 40 (19.0%) |
| 5 to 9 Minutes | 66 (24.0%) | 0 (0.0%) |
| 10 to 14 Minutes | 62 (22.6%) | 34 (16.1%) |
| 15 to 19 Minutes | 0 (0.0%) | 0 (0.0%) |
| 20 to 24 Minutes | 0 (0.0%) | 0 (0.0%) |
| 25 to 29 Minutes | 0 (0.0%) | 0 (0.0%) |
| 30 to 34 Minutes | 0 (0.0%) | 35 (16.6%) |
| 35 to 39 Minutes | 0 (0.0%) | 0 (0.0%) |
| 40 to 44 Minutes | 0 (0.0%) | 26 (12.3%) |
| 45 to 59 Minutes | 0 (0.0%) | 31 (14.7%) |
| 60 to 89 Minutes | 61 (22.2%) | 31 (14.7%) |
| 90 or more Minutes | 16 (5.8%) | 14 (6.6%) |
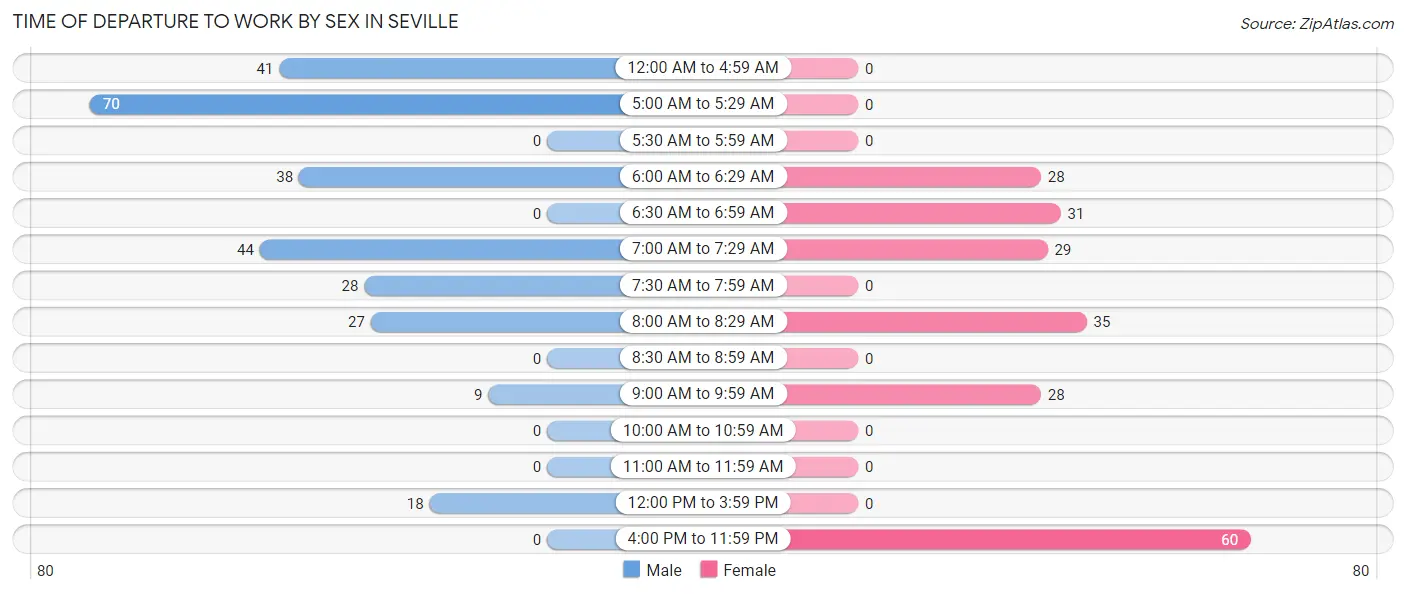
Time of Departure to Work by Sex in Seville
The most frequent times of departure to work in Seville are 5:00 AM to 5:29 AM (70, 25.5%) for males and 4:00 PM to 11:59 PM (60, 28.4%) for females.
| Time of Departure | Male | Female |
| 12:00 AM to 4:59 AM | 41 (14.9%) | 0 (0.0%) |
| 5:00 AM to 5:29 AM | 70 (25.5%) | 0 (0.0%) |
| 5:30 AM to 5:59 AM | 0 (0.0%) | 0 (0.0%) |
| 6:00 AM to 6:29 AM | 38 (13.8%) | 28 (13.3%) |
| 6:30 AM to 6:59 AM | 0 (0.0%) | 31 (14.7%) |
| 7:00 AM to 7:29 AM | 44 (16.0%) | 29 (13.7%) |
| 7:30 AM to 7:59 AM | 28 (10.2%) | 0 (0.0%) |
| 8:00 AM to 8:29 AM | 27 (9.8%) | 35 (16.6%) |
| 8:30 AM to 8:59 AM | 0 (0.0%) | 0 (0.0%) |
| 9:00 AM to 9:59 AM | 9 (3.3%) | 28 (13.3%) |
| 10:00 AM to 10:59 AM | 0 (0.0%) | 0 (0.0%) |
| 11:00 AM to 11:59 AM | 0 (0.0%) | 0 (0.0%) |
| 12:00 PM to 3:59 PM | 18 (6.6%) | 0 (0.0%) |
| 4:00 PM to 11:59 PM | 0 (0.0%) | 60 (28.4%) |
| Total | 275 (100.0%) | 211 (100.0%) |
Housing Occupancy in Seville
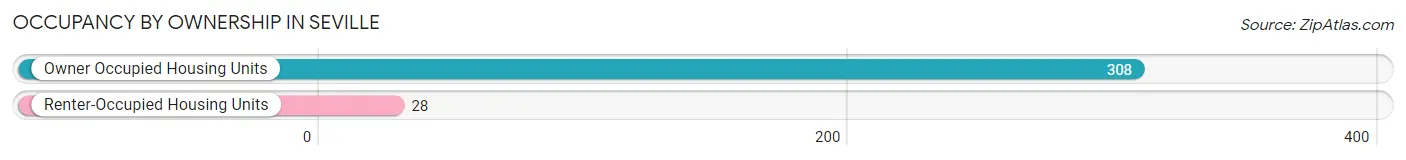
Occupancy by Ownership in Seville
Of the total 336 dwellings in Seville, owner-occupied units account for 308 (91.7%), while renter-occupied units make up 28 (8.3%).
| Occupancy | # Housing Units | % Housing Units |
| Owner Occupied Housing Units | 308 | 91.7% |
| Renter-Occupied Housing Units | 28 | 8.3% |
| Total Occupied Housing Units | 336 | 100.0% |
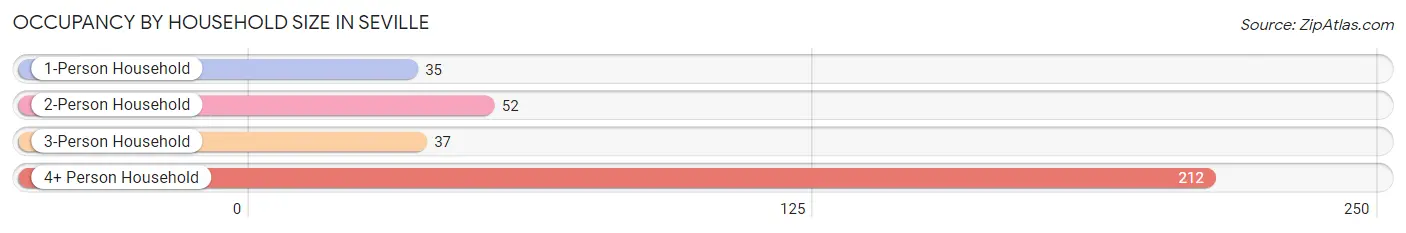
Occupancy by Household Size in Seville
| Household Size | # Housing Units | % Housing Units |
| 1-Person Household | 35 | 10.4% |
| 2-Person Household | 52 | 15.5% |
| 3-Person Household | 37 | 11.0% |
| 4+ Person Household | 212 | 63.1% |
| Total Housing Units | 336 | 100.0% |
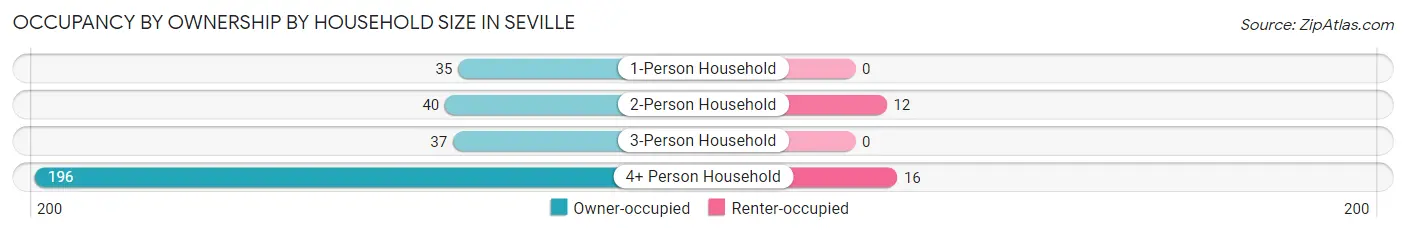
Occupancy by Ownership by Household Size in Seville
| Household Size | Owner-occupied | Renter-occupied |
| 1-Person Household | 35 (100.0%) | 0 (0.0%) |
| 2-Person Household | 40 (76.9%) | 12 (23.1%) |
| 3-Person Household | 37 (100.0%) | 0 (0.0%) |
| 4+ Person Household | 196 (92.4%) | 16 (7.5%) |
| Total Housing Units | 308 (91.7%) | 28 (8.3%) |
Occupancy by Educational Attainment in Seville
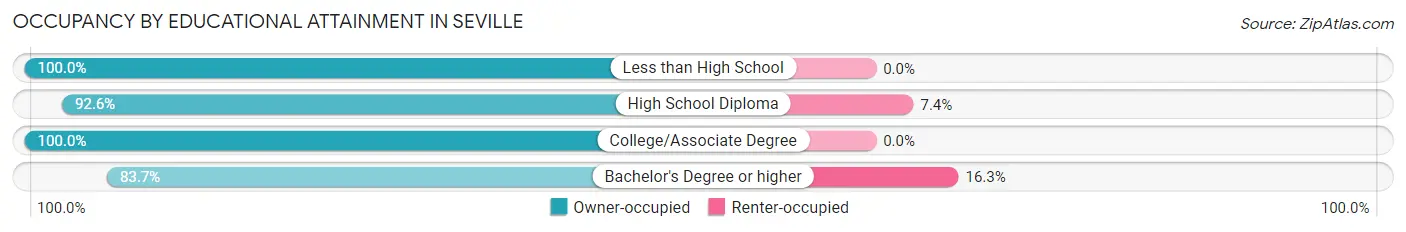
| Household Size | Owner-occupied | Renter-occupied |
| Less than High School | 47 (100.0%) | 0 (0.0%) |
| High School Diploma | 150 (92.6%) | 12 (7.4%) |
| College/Associate Degree | 29 (100.0%) | 0 (0.0%) |
| Bachelor's Degree or higher | 82 (83.7%) | 16 (16.3%) |
Occupancy by Age of Householder in Seville
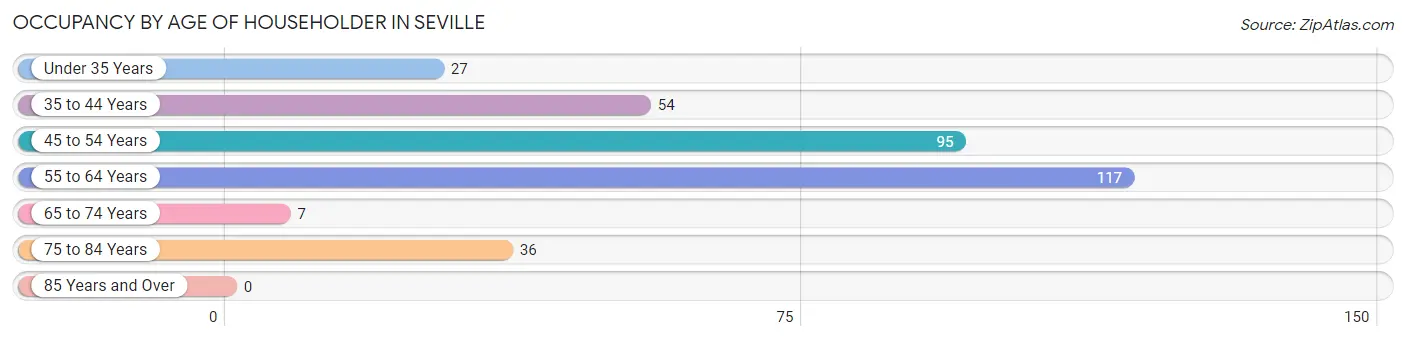
| Age Bracket | # Households | % Households |
| Under 35 Years | 27 | 8.0% |
| 35 to 44 Years | 54 | 16.1% |
| 45 to 54 Years | 95 | 28.3% |
| 55 to 64 Years | 117 | 34.8% |
| 65 to 74 Years | 7 | 2.1% |
| 75 to 84 Years | 36 | 10.7% |
| 85 Years and Over | 0 | 0.0% |
| Total | 336 | 100.0% |
Housing Finances in Seville
Median Income by Occupancy in Seville
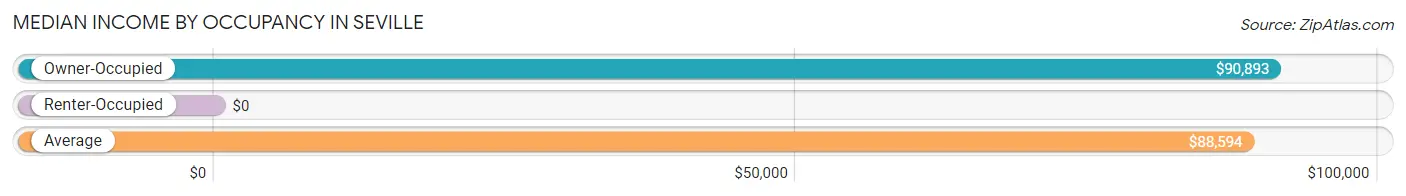
| Occupancy Type | # Households | Median Income |
| Owner-Occupied | 308 (91.7%) | $90,893 |
| Renter-Occupied | 28 (8.3%) | $0 |
| Average | 336 (100.0%) | $88,594 |
Occupancy by Householder Income Bracket in Seville
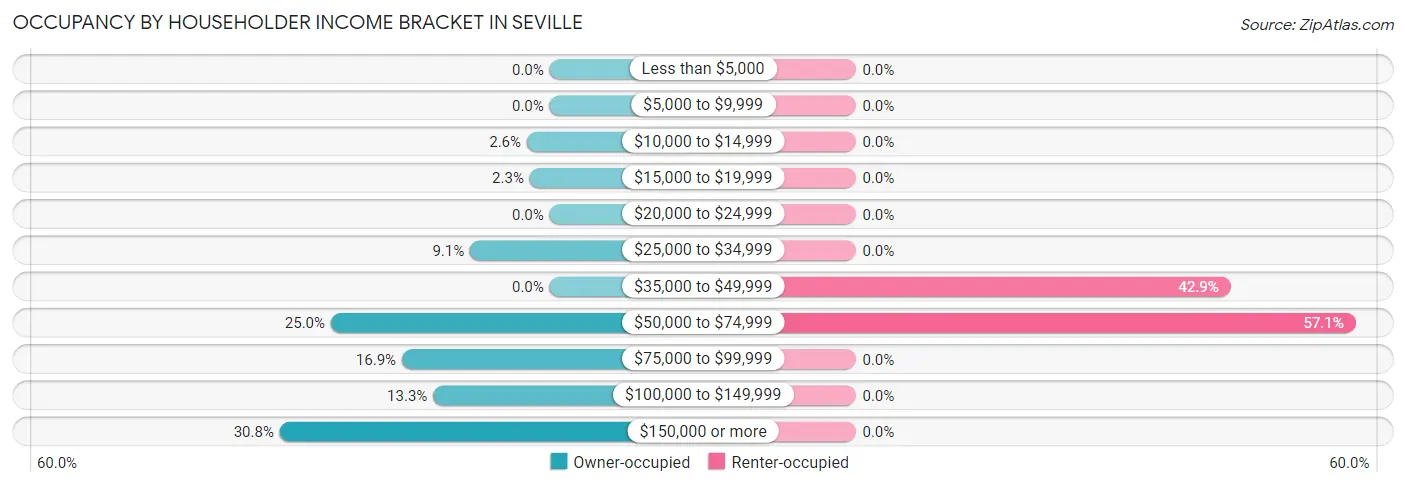
| Income Bracket | Owner-occupied | Renter-occupied |
| Less than $5,000 | 0 (0.0%) | 0 (0.0%) |
| $5,000 to $9,999 | 0 (0.0%) | 0 (0.0%) |
| $10,000 to $14,999 | 8 (2.6%) | 0 (0.0%) |
| $15,000 to $19,999 | 7 (2.3%) | 0 (0.0%) |
| $20,000 to $24,999 | 0 (0.0%) | 0 (0.0%) |
| $25,000 to $34,999 | 28 (9.1%) | 0 (0.0%) |
| $35,000 to $49,999 | 0 (0.0%) | 12 (42.9%) |
| $50,000 to $74,999 | 77 (25.0%) | 16 (57.1%) |
| $75,000 to $99,999 | 52 (16.9%) | 0 (0.0%) |
| $100,000 to $149,999 | 41 (13.3%) | 0 (0.0%) |
| $150,000 or more | 95 (30.8%) | 0 (0.0%) |
| Total | 308 (100.0%) | 28 (100.0%) |
Monthly Housing Cost Tiers in Seville
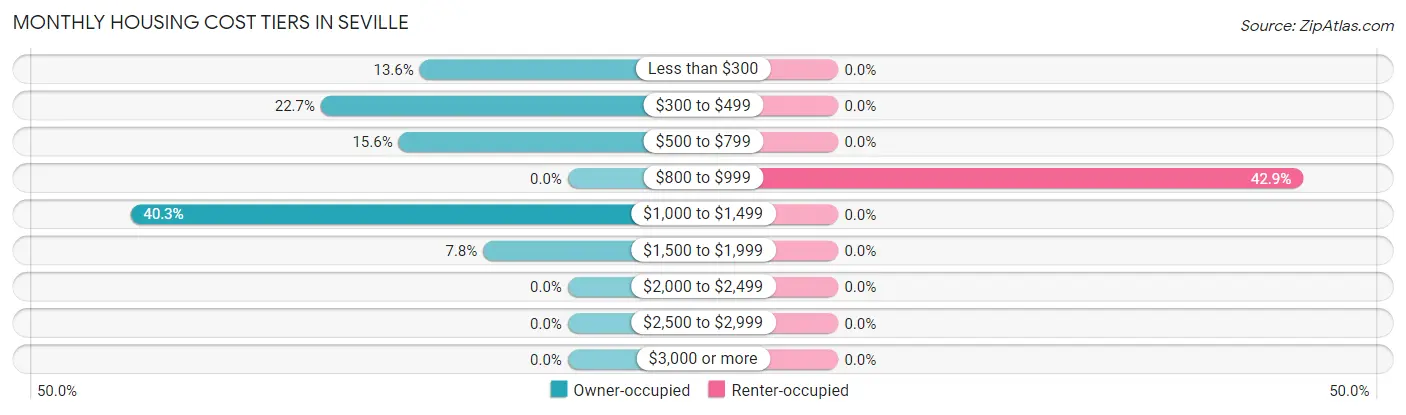
| Monthly Cost | Owner-occupied | Renter-occupied |
| Less than $300 | 42 (13.6%) | 0 (0.0%) |
| $300 to $499 | 70 (22.7%) | 0 (0.0%) |
| $500 to $799 | 48 (15.6%) | 0 (0.0%) |
| $800 to $999 | 0 (0.0%) | 12 (42.9%) |
| $1,000 to $1,499 | 124 (40.3%) | 0 (0.0%) |
| $1,500 to $1,999 | 24 (7.8%) | 0 (0.0%) |
| $2,000 to $2,499 | 0 (0.0%) | 0 (0.0%) |
| $2,500 to $2,999 | 0 (0.0%) | 0 (0.0%) |
| $3,000 or more | 0 (0.0%) | 0 (0.0%) |
| Total | 308 (100.0%) | 28 (100.0%) |
Physical Housing Characteristics in Seville
Housing Structures in Seville
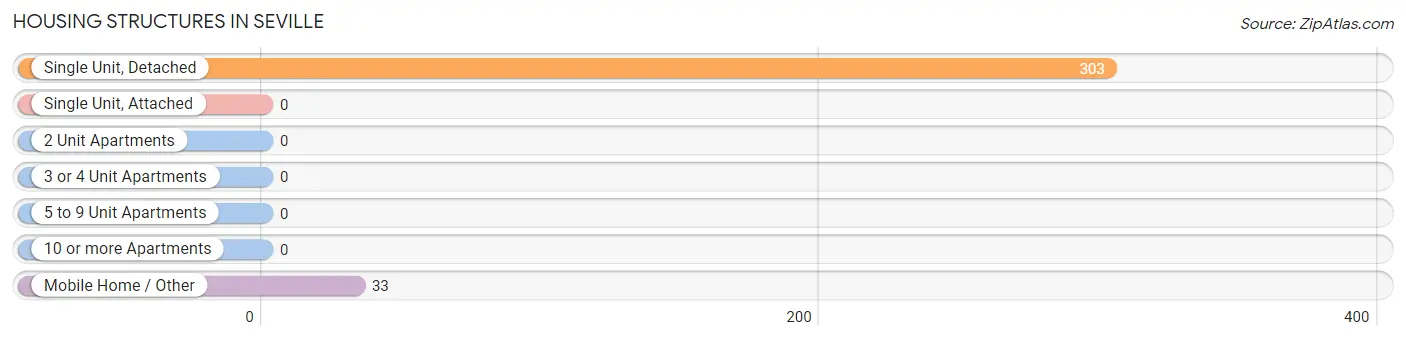
| Structure Type | # Housing Units | % Housing Units |
| Single Unit, Detached | 303 | 90.2% |
| Single Unit, Attached | 0 | 0.0% |
| 2 Unit Apartments | 0 | 0.0% |
| 3 or 4 Unit Apartments | 0 | 0.0% |
| 5 to 9 Unit Apartments | 0 | 0.0% |
| 10 or more Apartments | 0 | 0.0% |
| Mobile Home / Other | 33 | 9.8% |
| Total | 336 | 100.0% |
Housing Structures by Occupancy in Seville
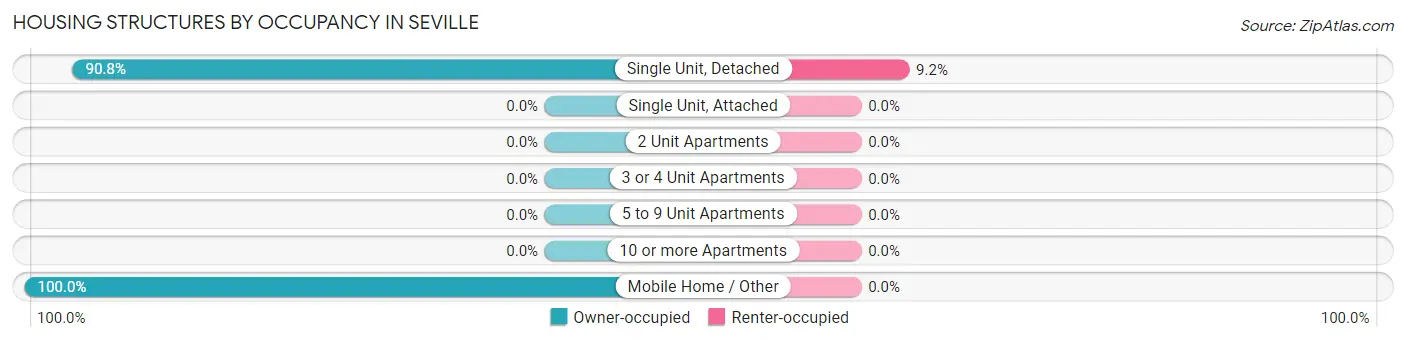
| Structure Type | Owner-occupied | Renter-occupied |
| Single Unit, Detached | 275 (90.8%) | 28 (9.2%) |
| Single Unit, Attached | 0 (0.0%) | 0 (0.0%) |
| 2 Unit Apartments | 0 (0.0%) | 0 (0.0%) |
| 3 or 4 Unit Apartments | 0 (0.0%) | 0 (0.0%) |
| 5 to 9 Unit Apartments | 0 (0.0%) | 0 (0.0%) |
| 10 or more Apartments | 0 (0.0%) | 0 (0.0%) |
| Mobile Home / Other | 33 (100.0%) | 0 (0.0%) |
| Total | 308 (91.7%) | 28 (8.3%) |
Housing Structures by Number of Rooms in Seville
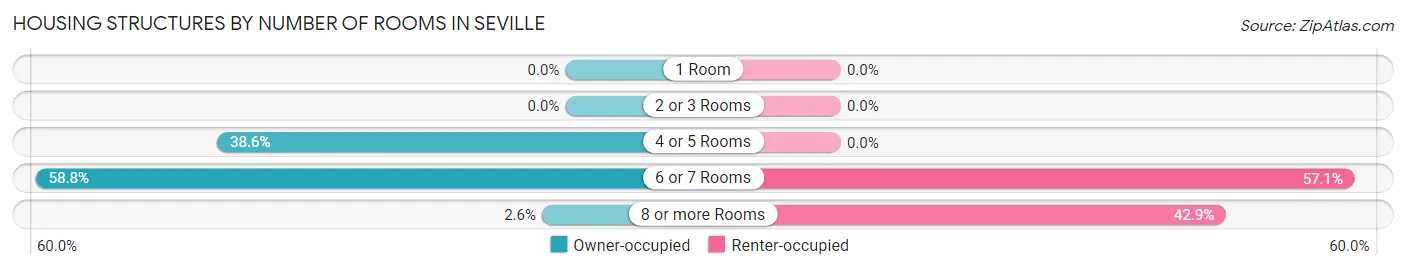
| Number of Rooms | Owner-occupied | Renter-occupied |
| 1 Room | 0 (0.0%) | 0 (0.0%) |
| 2 or 3 Rooms | 0 (0.0%) | 0 (0.0%) |
| 4 or 5 Rooms | 119 (38.6%) | 0 (0.0%) |
| 6 or 7 Rooms | 181 (58.8%) | 16 (57.1%) |
| 8 or more Rooms | 8 (2.6%) | 12 (42.9%) |
| Total | 308 (100.0%) | 28 (100.0%) |
Housing Structure by Heating Type in Seville
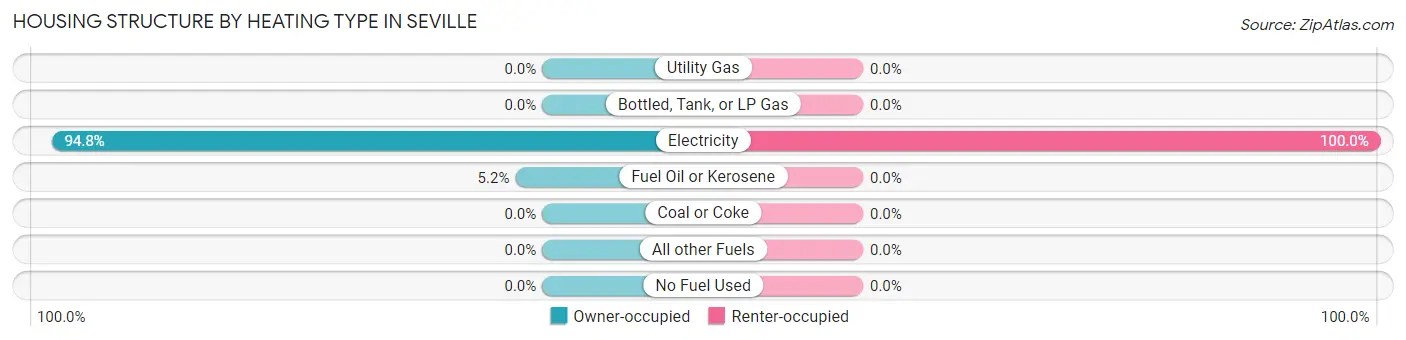
| Heating Type | Owner-occupied | Renter-occupied |
| Utility Gas | 0 (0.0%) | 0 (0.0%) |
| Bottled, Tank, or LP Gas | 0 (0.0%) | 0 (0.0%) |
| Electricity | 292 (94.8%) | 28 (100.0%) |
| Fuel Oil or Kerosene | 16 (5.2%) | 0 (0.0%) |
| Coal or Coke | 0 (0.0%) | 0 (0.0%) |
| All other Fuels | 0 (0.0%) | 0 (0.0%) |
| No Fuel Used | 0 (0.0%) | 0 (0.0%) |
| Total | 308 (100.0%) | 28 (100.0%) |
Household Vehicle Usage in Seville
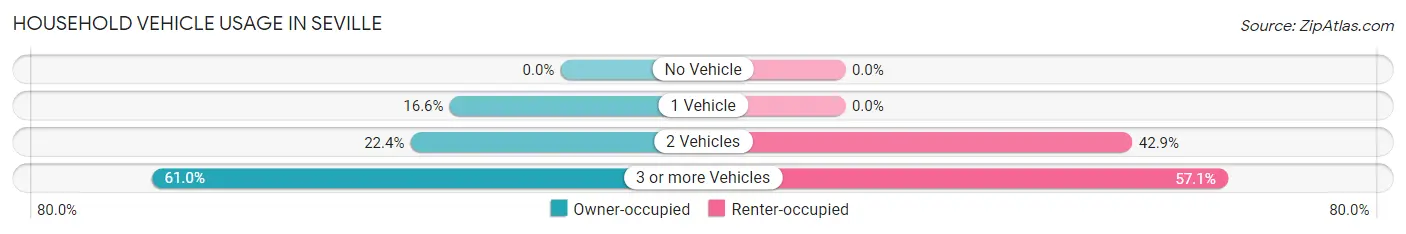
| Vehicles per Household | Owner-occupied | Renter-occupied |
| No Vehicle | 0 (0.0%) | 0 (0.0%) |
| 1 Vehicle | 51 (16.6%) | 0 (0.0%) |
| 2 Vehicles | 69 (22.4%) | 12 (42.9%) |
| 3 or more Vehicles | 188 (61.0%) | 16 (57.1%) |
| Total | 308 (100.0%) | 28 (100.0%) |
Real Estate & Mortgages in Seville
Real Estate and Mortgage Overview in Seville
| Characteristic | Without Mortgage | With Mortgage |
| Housing Units | 178 | 130 |
| Median Property Value | - | - |
| Median Household Income | $80,000 | $77 |
| Monthly Housing Costs | $450 | $0 |
| Real Estate Taxes | $1,684 | $0 |
Property Value by Mortgage Status in Seville
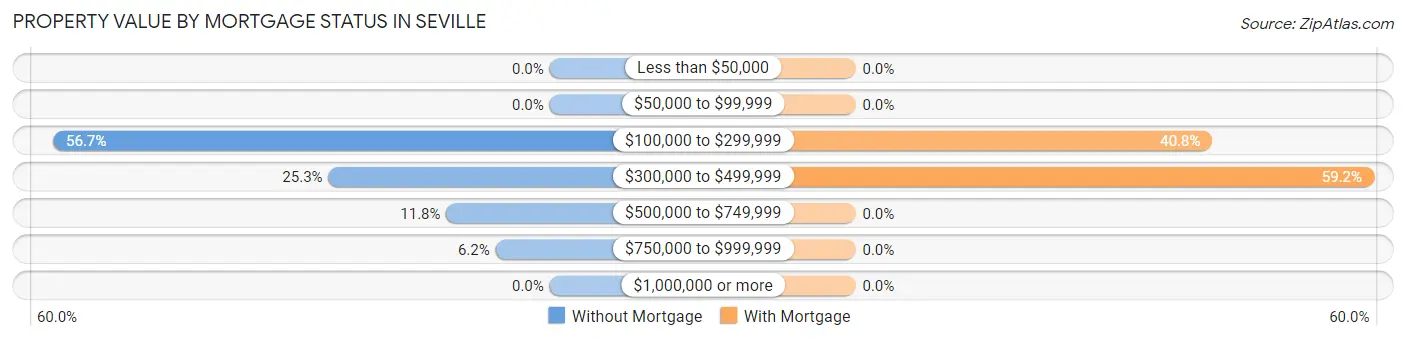
| Property Value | Without Mortgage | With Mortgage |
| Less than $50,000 | 0 (0.0%) | 0 (0.0%) |
| $50,000 to $99,999 | 0 (0.0%) | 0 (0.0%) |
| $100,000 to $299,999 | 101 (56.7%) | 53 (40.8%) |
| $300,000 to $499,999 | 45 (25.3%) | 77 (59.2%) |
| $500,000 to $749,999 | 21 (11.8%) | 0 (0.0%) |
| $750,000 to $999,999 | 11 (6.2%) | 0 (0.0%) |
| $1,000,000 or more | 0 (0.0%) | 0 (0.0%) |
| Total | 178 (100.0%) | 130 (100.0%) |
Household Income by Mortgage Status in Seville
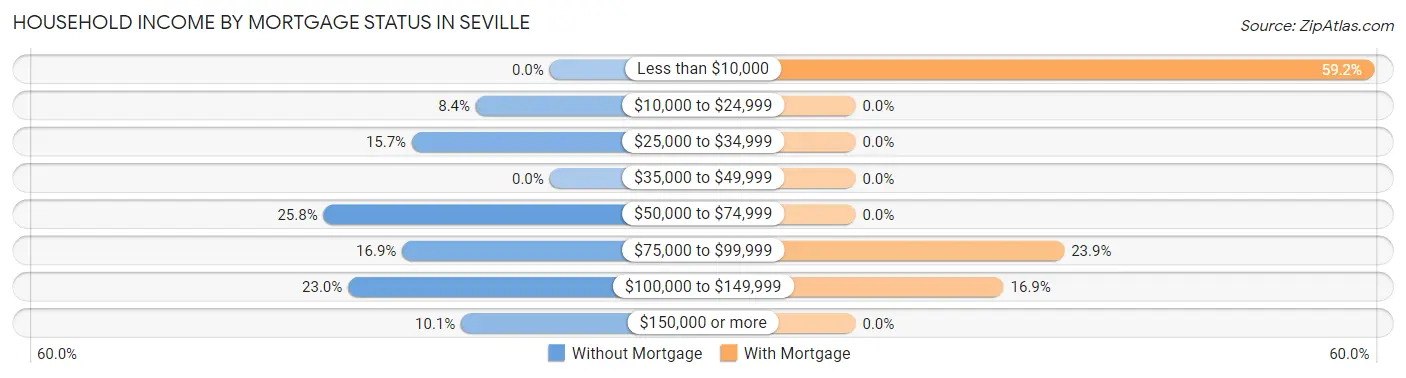
| Household Income | Without Mortgage | With Mortgage |
| Less than $10,000 | 0 (0.0%) | 77 (59.2%) |
| $10,000 to $24,999 | 15 (8.4%) | 0 (0.0%) |
| $25,000 to $34,999 | 28 (15.7%) | 0 (0.0%) |
| $35,000 to $49,999 | 0 (0.0%) | 0 (0.0%) |
| $50,000 to $74,999 | 46 (25.8%) | 0 (0.0%) |
| $75,000 to $99,999 | 30 (16.9%) | 31 (23.8%) |
| $100,000 to $149,999 | 41 (23.0%) | 22 (16.9%) |
| $150,000 or more | 18 (10.1%) | 0 (0.0%) |
| Total | 178 (100.0%) | 130 (100.0%) |
Property Value to Household Income Ratio in Seville
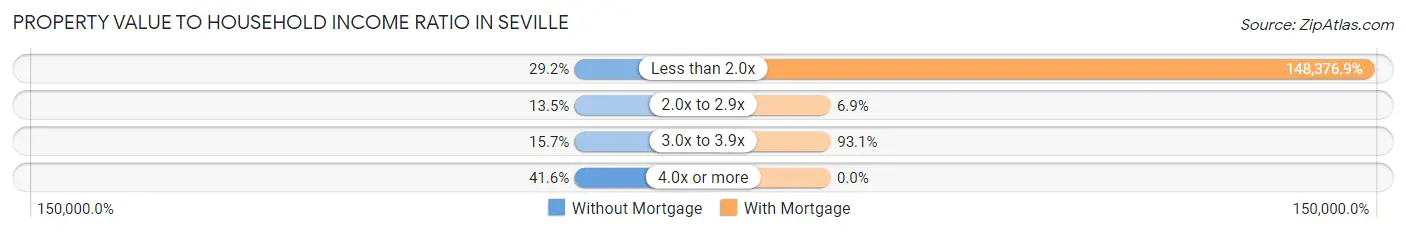
| Value-to-Income Ratio | Without Mortgage | With Mortgage |
| Less than 2.0x | 52 (29.2%) | 192,890 (148,376.9%) |
| 2.0x to 2.9x | 24 (13.5%) | 9 (6.9%) |
| 3.0x to 3.9x | 28 (15.7%) | 121 (93.1%) |
| 4.0x or more | 74 (41.6%) | 0 (0.0%) |
| Total | 178 (100.0%) | 130 (100.0%) |
Real Estate Taxes by Mortgage Status in Seville
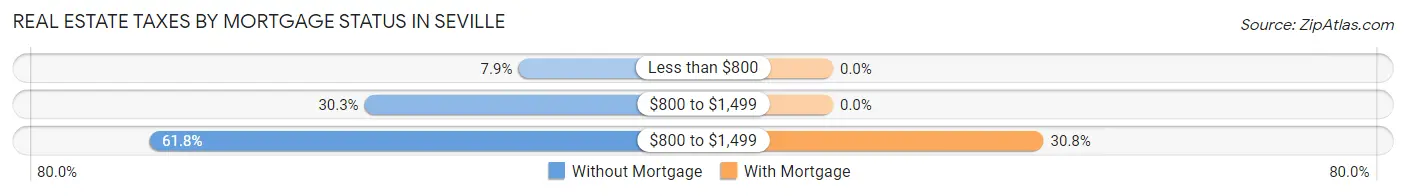
| Property Taxes | Without Mortgage | With Mortgage |
| Less than $800 | 14 (7.9%) | 0 (0.0%) |
| $800 to $1,499 | 54 (30.3%) | 0 (0.0%) |
| $800 to $1,499 | 110 (61.8%) | 40 (30.8%) |
| Total | 178 (100.0%) | 130 (100.0%) |
Health & Disability in Seville
Health Insurance Coverage by Age in Seville
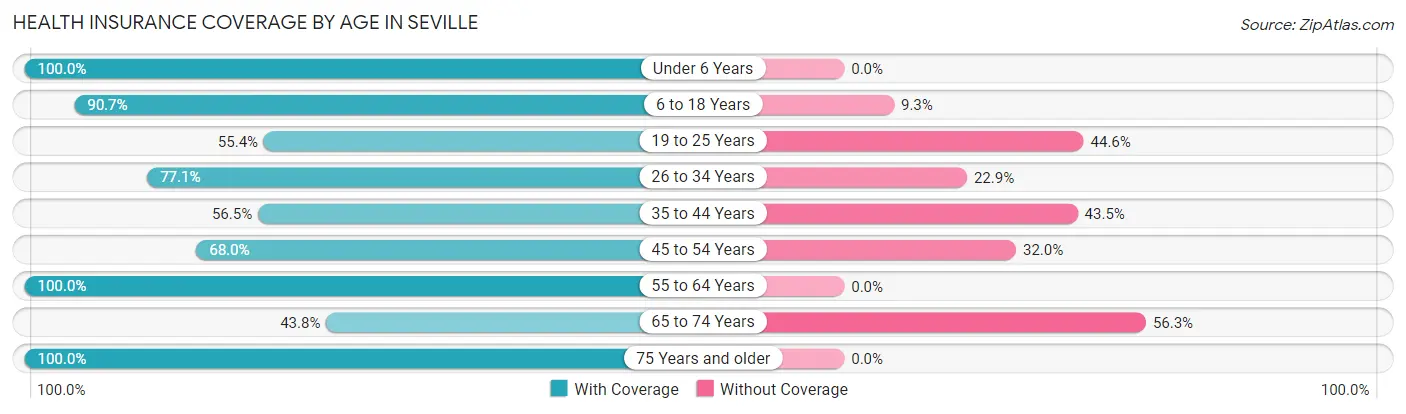
| Age Bracket | With Coverage | Without Coverage |
| Under 6 Years | 167 (100.0%) | 0 (0.0%) |
| 6 to 18 Years | 284 (90.7%) | 29 (9.3%) |
| 19 to 25 Years | 67 (55.4%) | 54 (44.6%) |
| 26 to 34 Years | 91 (77.1%) | 27 (22.9%) |
| 35 to 44 Years | 61 (56.5%) | 47 (43.5%) |
| 45 to 54 Years | 87 (68.0%) | 41 (32.0%) |
| 55 to 64 Years | 199 (100.0%) | 0 (0.0%) |
| 65 to 74 Years | 7 (43.8%) | 9 (56.2%) |
| 75 Years and older | 140 (100.0%) | 0 (0.0%) |
| Total | 1,103 (84.2%) | 207 (15.8%) |
Health Insurance Coverage by Citizenship Status in Seville
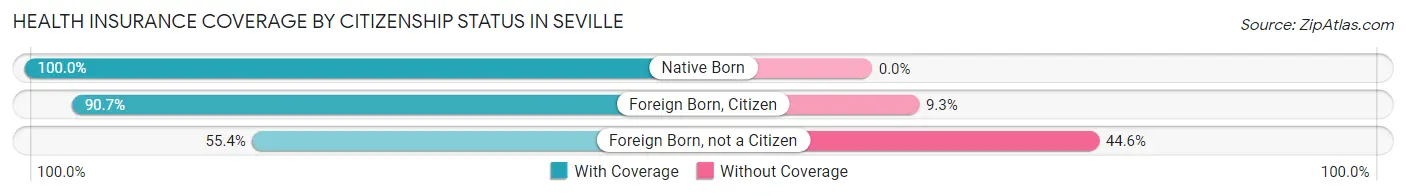
| Citizenship Status | With Coverage | Without Coverage |
| Native Born | 167 (100.0%) | 0 (0.0%) |
| Foreign Born, Citizen | 284 (90.7%) | 29 (9.3%) |
| Foreign Born, not a Citizen | 67 (55.4%) | 54 (44.6%) |
Health Insurance Coverage by Household Income in Seville
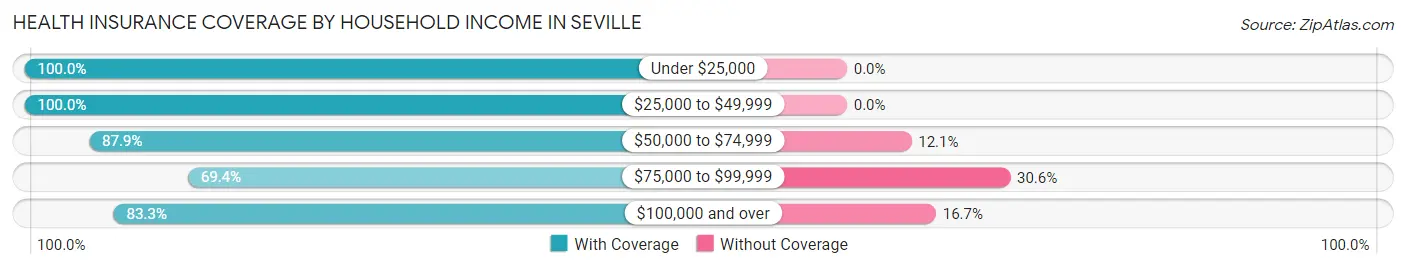
| Household Income | With Coverage | Without Coverage |
| Under $25,000 | 36 (100.0%) | 0 (0.0%) |
| $25,000 to $49,999 | 51 (100.0%) | 0 (0.0%) |
| $50,000 to $74,999 | 393 (87.9%) | 54 (12.1%) |
| $75,000 to $99,999 | 118 (69.4%) | 52 (30.6%) |
| $100,000 and over | 505 (83.3%) | 101 (16.7%) |
Public vs Private Health Insurance Coverage by Age in Seville
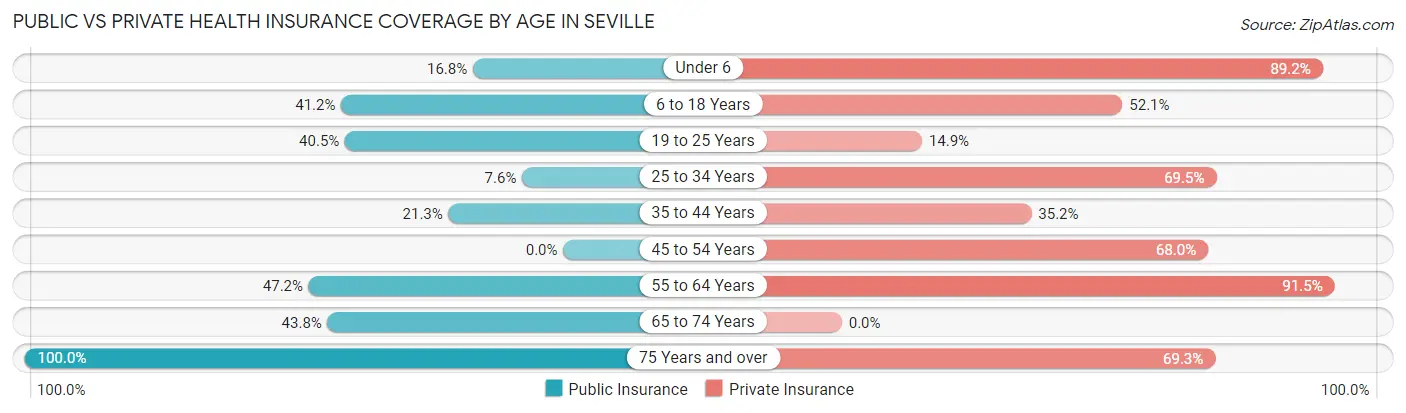
| Age Bracket | Public Insurance | Private Insurance |
| Under 6 | 28 (16.8%) | 149 (89.2%) |
| 6 to 18 Years | 129 (41.2%) | 163 (52.1%) |
| 19 to 25 Years | 49 (40.5%) | 18 (14.9%) |
| 25 to 34 Years | 9 (7.6%) | 82 (69.5%) |
| 35 to 44 Years | 23 (21.3%) | 38 (35.2%) |
| 45 to 54 Years | 0 (0.0%) | 87 (68.0%) |
| 55 to 64 Years | 94 (47.2%) | 182 (91.5%) |
| 65 to 74 Years | 7 (43.8%) | 0 (0.0%) |
| 75 Years and over | 140 (100.0%) | 97 (69.3%) |
| Total | 479 (36.6%) | 816 (62.3%) |
Disability Status by Sex by Age in Seville
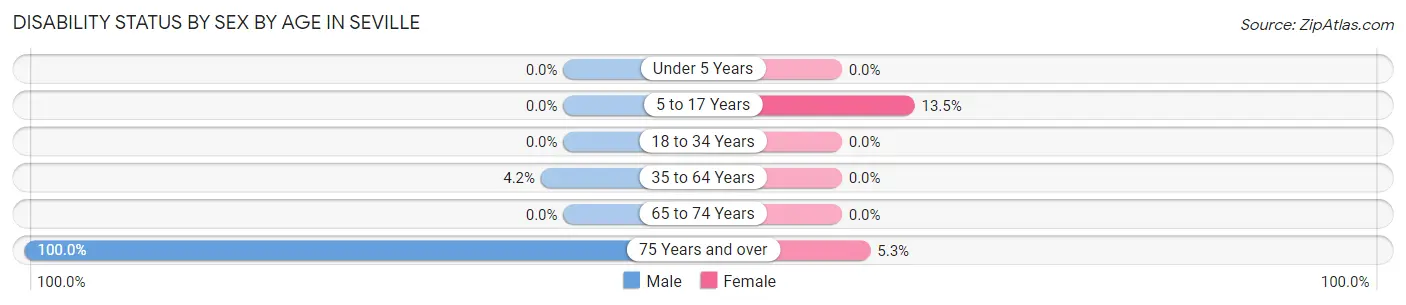
| Age Bracket | Male | Female |
| Under 5 Years | 0 (0.0%) | 0 (0.0%) |
| 5 to 17 Years | 0 (0.0%) | 32 (13.5%) |
| 18 to 34 Years | 0 (0.0%) | 0 (0.0%) |
| 35 to 64 Years | 11 (4.2%) | 0 (0.0%) |
| 65 to 74 Years | 0 (0.0%) | 0 (0.0%) |
| 75 Years and over | 8 (100.0%) | 7 (5.3%) |
Disability Class by Sex by Age in Seville
Disability Class: Hearing Difficulty
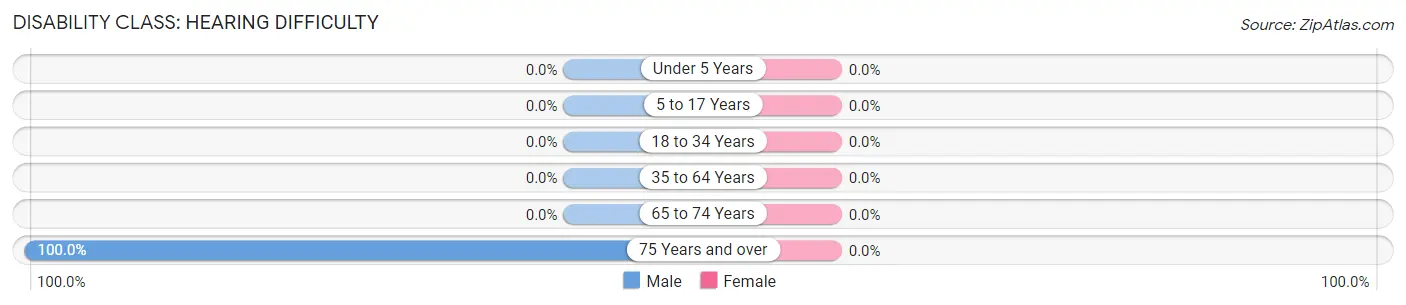
| Age Bracket | Male | Female |
| Under 5 Years | 0 (0.0%) | 0 (0.0%) |
| 5 to 17 Years | 0 (0.0%) | 0 (0.0%) |
| 18 to 34 Years | 0 (0.0%) | 0 (0.0%) |
| 35 to 64 Years | 0 (0.0%) | 0 (0.0%) |
| 65 to 74 Years | 0 (0.0%) | 0 (0.0%) |
| 75 Years and over | 8 (100.0%) | 0 (0.0%) |
Disability Class: Vision Difficulty
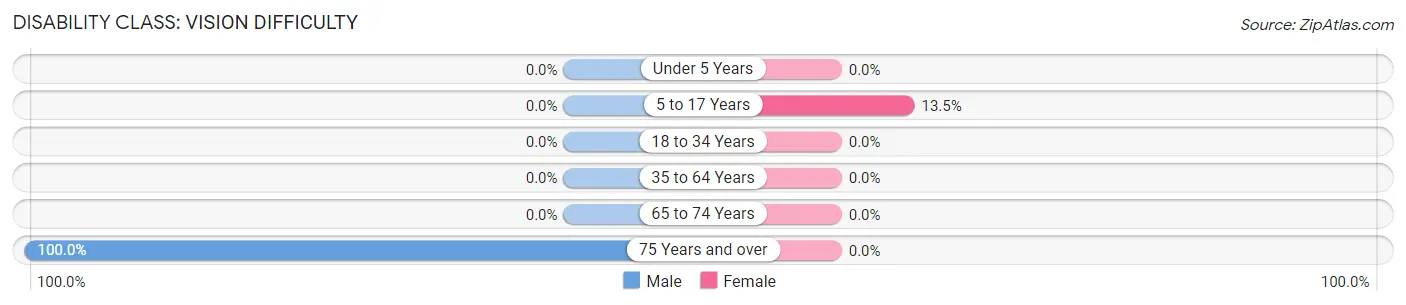
| Age Bracket | Male | Female |
| Under 5 Years | 0 (0.0%) | 0 (0.0%) |
| 5 to 17 Years | 0 (0.0%) | 32 (13.5%) |
| 18 to 34 Years | 0 (0.0%) | 0 (0.0%) |
| 35 to 64 Years | 0 (0.0%) | 0 (0.0%) |
| 65 to 74 Years | 0 (0.0%) | 0 (0.0%) |
| 75 Years and over | 8 (100.0%) | 0 (0.0%) |
Disability Class: Cognitive Difficulty
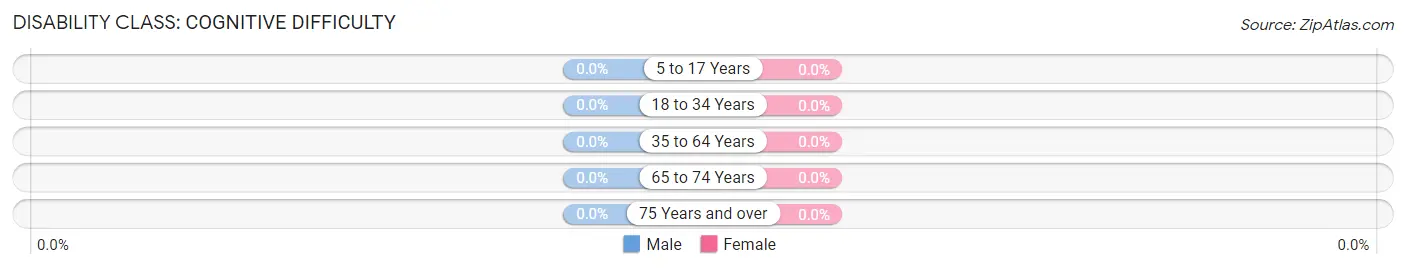
| Age Bracket | Male | Female |
| 5 to 17 Years | 0 (0.0%) | 0 (0.0%) |
| 18 to 34 Years | 0 (0.0%) | 0 (0.0%) |
| 35 to 64 Years | 0 (0.0%) | 0 (0.0%) |
| 65 to 74 Years | 0 (0.0%) | 0 (0.0%) |
| 75 Years and over | 0 (0.0%) | 0 (0.0%) |
Disability Class: Ambulatory Difficulty
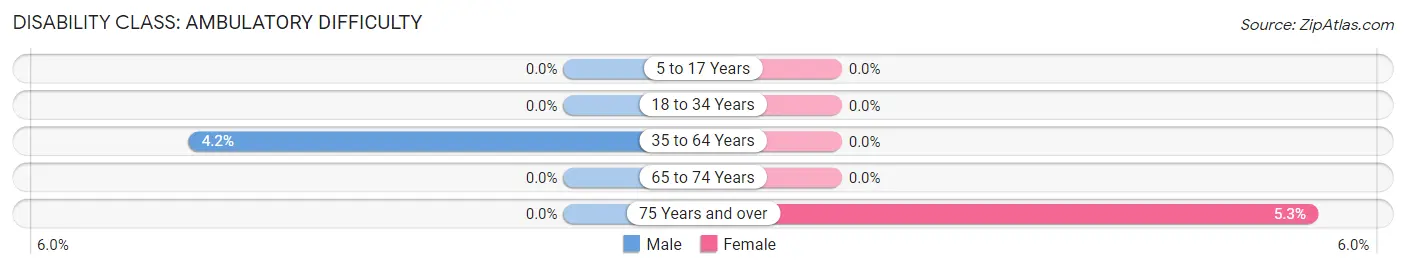
| Age Bracket | Male | Female |
| 5 to 17 Years | 0 (0.0%) | 0 (0.0%) |
| 18 to 34 Years | 0 (0.0%) | 0 (0.0%) |
| 35 to 64 Years | 11 (4.2%) | 0 (0.0%) |
| 65 to 74 Years | 0 (0.0%) | 0 (0.0%) |
| 75 Years and over | 0 (0.0%) | 7 (5.3%) |
Disability Class: Self-Care Difficulty
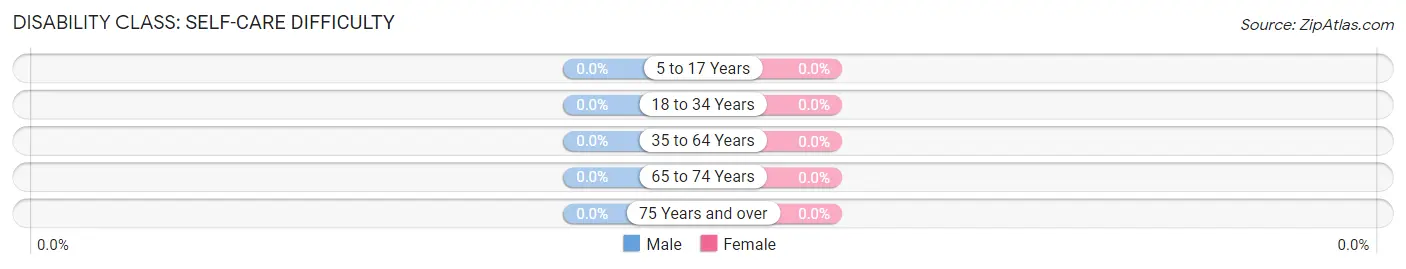
| Age Bracket | Male | Female |
| 5 to 17 Years | 0 (0.0%) | 0 (0.0%) |
| 18 to 34 Years | 0 (0.0%) | 0 (0.0%) |
| 35 to 64 Years | 0 (0.0%) | 0 (0.0%) |
| 65 to 74 Years | 0 (0.0%) | 0 (0.0%) |
| 75 Years and over | 0 (0.0%) | 0 (0.0%) |
Technology Access in Seville
Computing Device Access in Seville
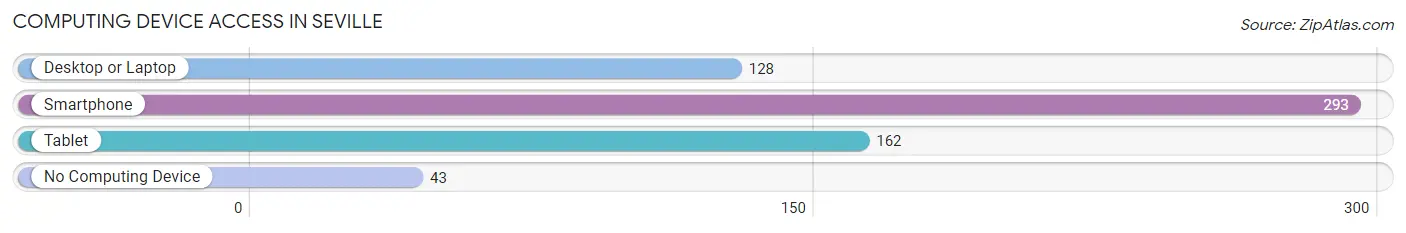
| Device Type | # Households | % Households |
| Desktop or Laptop | 128 | 38.1% |
| Smartphone | 293 | 87.2% |
| Tablet | 162 | 48.2% |
| No Computing Device | 43 | 12.8% |
| Total | 336 | 100.0% |
Internet Access in Seville
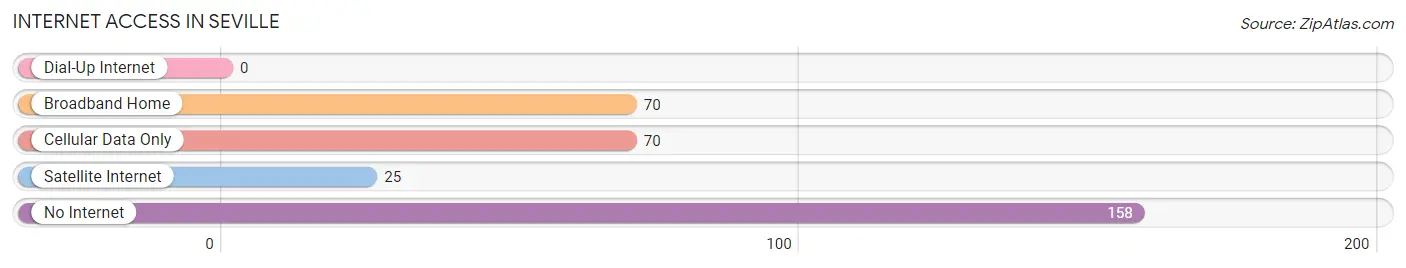
| Internet Type | # Households | % Households |
| Dial-Up Internet | 0 | 0.0% |
| Broadband Home | 70 | 20.8% |
| Cellular Data Only | 70 | 20.8% |
| Satellite Internet | 25 | 7.4% |
| No Internet | 158 | 47.0% |
| Total | 336 | 100.0% |
Seville Summary
Seville, Florida is a small town located in Volusia County, Florida. It is situated on the banks of the St. Johns River, about 25 miles south of Daytona Beach. The town has a population of approximately 1,000 people and is known for its rural charm and small-town atmosphere.
History
Seville was first settled in the late 1800s by a group of settlers from the nearby town of DeLand. The town was originally known as “Seville Station” and was a stop on the Florida East Coast Railway. The town was officially incorporated in 1887 and was named after the city of Seville, Spain.
In the early 1900s, Seville was a thriving agricultural community. The town was known for its citrus groves and vegetable farms. The town also had a thriving lumber industry, with several sawmills located in the area.
In the 1950s, Seville began to experience a decline in population as many of its residents moved away to larger cities. The town was also affected by the construction of Interstate 4, which bypassed the town.
Geography
Seville is located in Volusia County, Florida. It is situated on the banks of the St. Johns River, about 25 miles south of Daytona Beach. The town is located in a rural area and is surrounded by citrus groves and vegetable farms. The town is also located near the Ocala National Forest, which provides a variety of outdoor activities.
The climate in Seville is subtropical, with hot, humid summers and mild winters. The average temperature in the summer is around 90 degrees Fahrenheit, while the average temperature in the winter is around 60 degrees Fahrenheit.
Economy
Seville’s economy is largely based on agriculture. The town is known for its citrus groves and vegetable farms. The town also has a thriving lumber industry, with several sawmills located in the area.
In addition to agriculture, Seville also has a small tourism industry. The town is home to several bed and breakfasts, as well as a few restaurants and shops.
Demographics
As of the 2010 census, Seville had a population of 1,000 people. The racial makeup of the town was 94.2% White, 2.2% African American, 0.2% Native American, 0.2% Asian, 0.2% from other races, and 2.9% from two or more races. Hispanic or Latino of any race were 2.2% of the population.
The median income for a household in Seville was $37,500, and the median income for a family was $41,250. The per capita income for the town was $17,857. About 11.2% of families and 13.2% of the population were below the poverty line, including 16.7% of those under age 18 and 8.3% of those age 65 or over.
Seville is a small town with a rural charm and a small-town atmosphere. The town is known for its citrus groves and vegetable farms, as well as its lumber industry. The town also has a small tourism industry, with several bed and breakfasts, restaurants, and shops. The town has a population of approximately 1,000 people and is located in Volusia County, Florida.
Common Questions
What is Per Capita Income in Seville?
Per Capita income in Seville is $35,737.
What is the Median Household income in Seville?
Median Household Income in Seville is $88,594.
What is Income or Wage Gap in Seville?
Income or Wage Gap in Seville is 77.1%.
Women in Seville earn 22.9 cents for every dollar earned by a man.
What is Inequality or Gini Index in Seville?
Inequality or Gini Index in Seville is 0.49.
What is the Total Population of Seville?
Total Population of Seville is 1,310.
What is the Total Male Population of Seville?
Total Male Population of Seville is 519.
What is the Total Female Population of Seville?
Total Female Population of Seville is 791.
What is the Ratio of Males per 100 Females in Seville?
There are 65.61 Males per 100 Females in Seville.
What is the Ratio of Females per 100 Males in Seville?
There are 152.41 Females per 100 Males in Seville.
What is the Median Population Age in Seville?
Median Population Age in Seville is 29.0 Years.
What is the Average Family Size in Seville
Average Family Size in Seville is 4.3 People.
What is the Average Household Size in Seville
Average Household Size in Seville is 3.9 People.
How Large is the Labor Force in Seville?
There are 502 People in the Labor Forcein in Seville.
What is the Percentage of People in the Labor Force in Seville?
54.9% of People are in the Labor Force in Seville.
What is the Unemployment Rate in Seville?
Unemployment Rate in Seville is 1.8%.