Acacia Villas, FL Map & Demographics
Acacia Villas Map
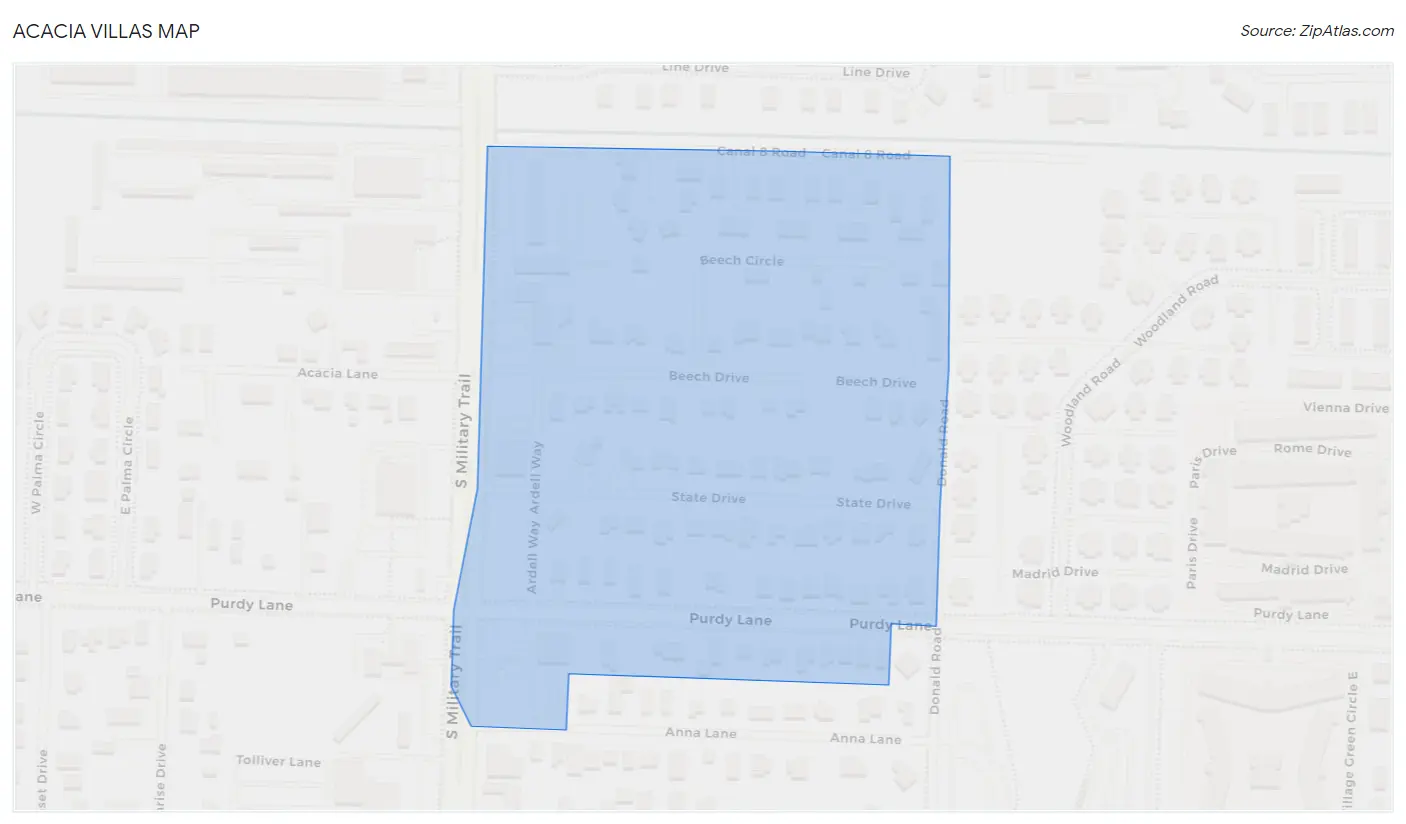
Acacia Villas Overview
$17,030
PER CAPITA INCOME
0.24
INEQUALITY / GINI INDEX
363
TOTAL POPULATION
248
MALE POPULATION
115
FEMALE POPULATION
215.65
MALES / 100 FEMALES
46.37
FEMALES / 100 MALES
18.8
MEDIAN AGE
8.7
AVG FAMILY SIZE
4.2
AVG HOUSEHOLD SIZE
215
LABOR FORCE [ PEOPLE ]
85.0%
PERCENT IN LABOR FORCE
Income in Acacia Villas
Income Overview in Acacia Villas
| Characteristic | Number | Measure |
| Per Capita Income | 363 | $17,030 |
| Median Family Income | 36 | $0 |
| Mean Family Income | 36 | $0 |
| Median Household Income | 85 | $0 |
| Mean Household Income | 85 | $64,636 |
| Income Deficit | 36 | $0 |
| Wage / Income Gap (%) | 363 | 0.00% |
| Wage / Income Gap ($) | 363 | 100.00¢ per $1 |
| Gini / Inequality Index | 363 | 0.24 |
Earnings by Sex in Acacia Villas
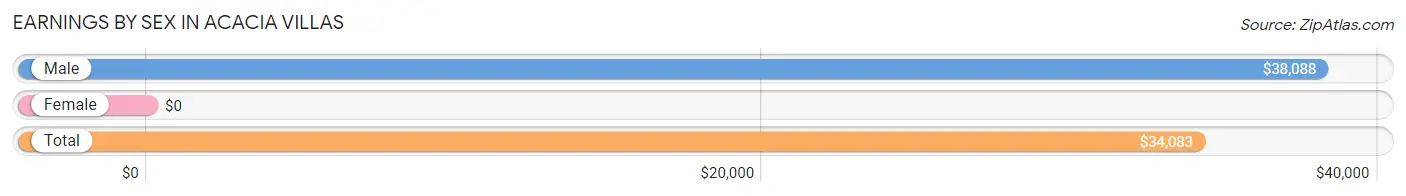
| Sex | Number | Average Earnings |
| Male | 136 (63.3%) | $38,088 |
| Female | 79 (36.7%) | $0 |
| Total | 215 (100.0%) | $34,083 |
Earnings by Sex by Income Bracket in Acacia Villas
The most common earnings brackets in Acacia Villas are $35,000 to $39,999 for men (49 | 36.0%) and $2,499 or less for women (43 | 54.4%).
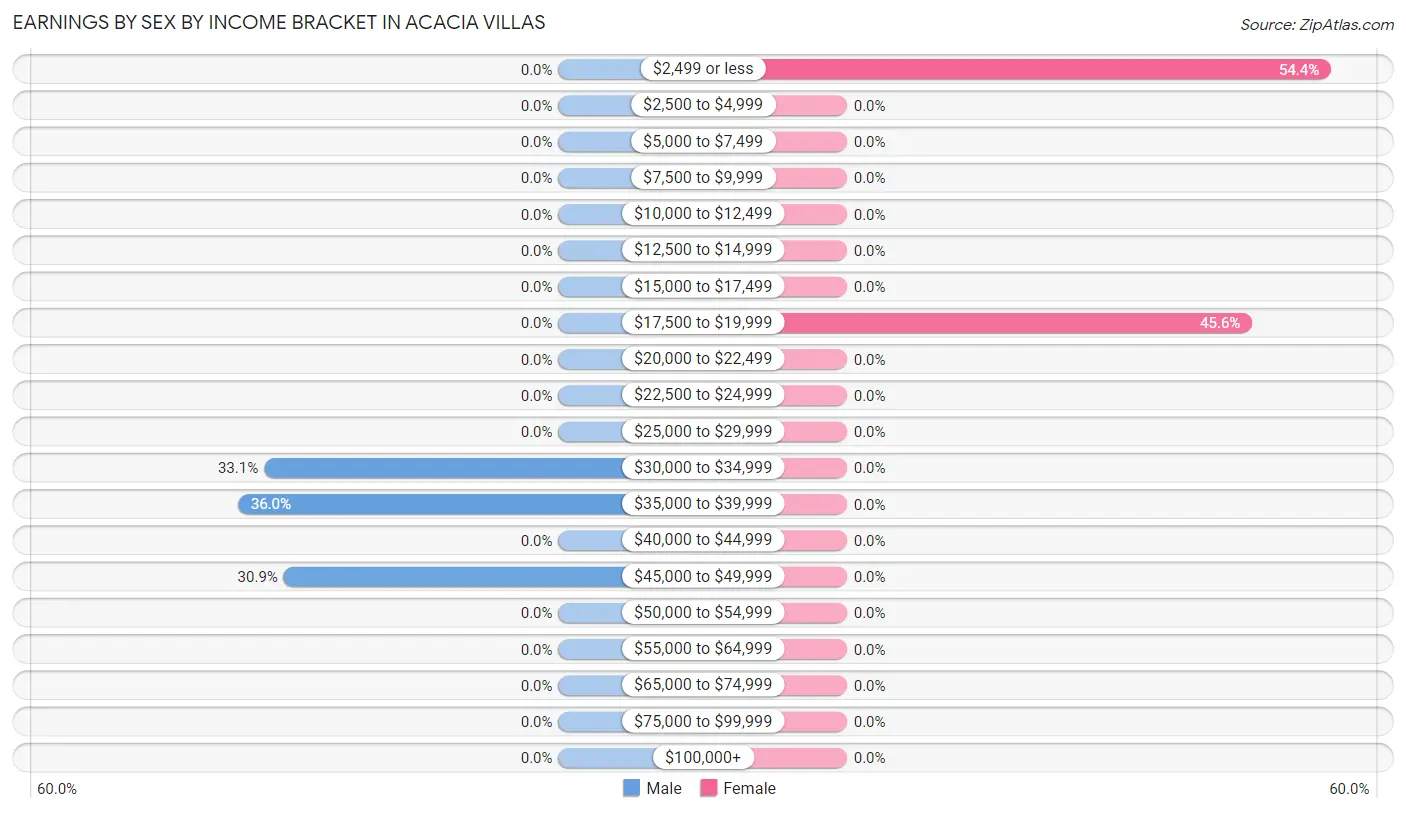
| Income | Male | Female |
| $2,499 or less | 0 (0.0%) | 43 (54.4%) |
| $2,500 to $4,999 | 0 (0.0%) | 0 (0.0%) |
| $5,000 to $7,499 | 0 (0.0%) | 0 (0.0%) |
| $7,500 to $9,999 | 0 (0.0%) | 0 (0.0%) |
| $10,000 to $12,499 | 0 (0.0%) | 0 (0.0%) |
| $12,500 to $14,999 | 0 (0.0%) | 0 (0.0%) |
| $15,000 to $17,499 | 0 (0.0%) | 0 (0.0%) |
| $17,500 to $19,999 | 0 (0.0%) | 36 (45.6%) |
| $20,000 to $22,499 | 0 (0.0%) | 0 (0.0%) |
| $22,500 to $24,999 | 0 (0.0%) | 0 (0.0%) |
| $25,000 to $29,999 | 0 (0.0%) | 0 (0.0%) |
| $30,000 to $34,999 | 45 (33.1%) | 0 (0.0%) |
| $35,000 to $39,999 | 49 (36.0%) | 0 (0.0%) |
| $40,000 to $44,999 | 0 (0.0%) | 0 (0.0%) |
| $45,000 to $49,999 | 42 (30.9%) | 0 (0.0%) |
| $50,000 to $54,999 | 0 (0.0%) | 0 (0.0%) |
| $55,000 to $64,999 | 0 (0.0%) | 0 (0.0%) |
| $65,000 to $74,999 | 0 (0.0%) | 0 (0.0%) |
| $75,000 to $99,999 | 0 (0.0%) | 0 (0.0%) |
| $100,000+ | 0 (0.0%) | 0 (0.0%) |
| Total | 136 (100.0%) | 79 (100.0%) |
Earnings by Sex by Educational Attainment in Acacia Villas
| Educational Attainment | Male Income | Female Income |
| Less than High School | - | - |
| High School Diploma | - | - |
| College or Associate's Degree | - | - |
| Bachelor's Degree | - | - |
| Graduate Degree | - | - |
| Total | $39,743 | $0 |
Family Income in Acacia Villas
Family Income Brackets in Acacia Villas
According to the Acacia Villas family income data, there are 36 families falling into the $100,000 to $149,999 income range, which is the most common income bracket and makes up 100.0% of all families.
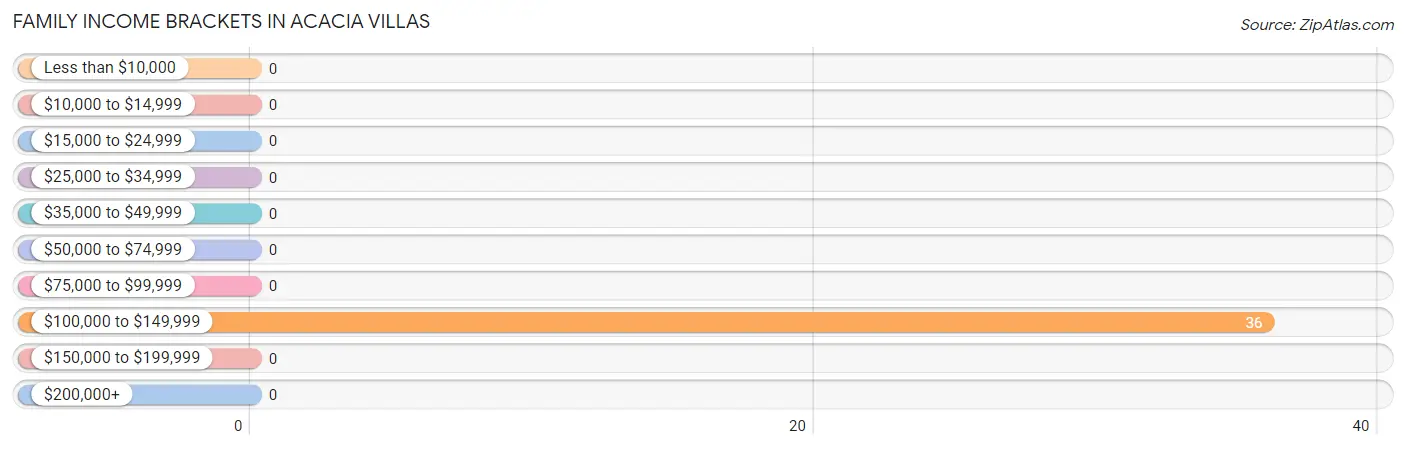
| Income Bracket | # Families | % Families |
| Less than $10,000 | 0 | 0.0% |
| $10,000 to $14,999 | 0 | 0.0% |
| $15,000 to $24,999 | 0 | 0.0% |
| $25,000 to $34,999 | 0 | 0.0% |
| $35,000 to $49,999 | 0 | 0.0% |
| $50,000 to $74,999 | 0 | 0.0% |
| $75,000 to $99,999 | 0 | 0.0% |
| $100,000 to $149,999 | 36 | 100.0% |
| $150,000 to $199,999 | 0 | 0.0% |
| $200,000+ | 0 | 0.0% |
Family Income by Famaliy Size in Acacia Villas
| Income Bracket | # Families | Median Income |
| 2-Person Families | 0 (0.0%) | $0 |
| 3-Person Families | 0 (0.0%) | $0 |
| 4-Person Families | 0 (0.0%) | $0 |
| 5-Person Families | 0 (0.0%) | $0 |
| 6-Person Families | 0 (0.0%) | $0 |
| 7+ Person Families | 36 (100.0%) | $0 |
| Total | 36 (100.0%) | $0 |
Family Income by Number of Earners in Acacia Villas
| Number of Earners | # Families | Median Income |
| No Earners | 0 (0.0%) | $0 |
| 1 Earner | 0 (0.0%) | $0 |
| 2 Earners | 0 (0.0%) | $0 |
| 3+ Earners | 36 (100.0%) | $0 |
| Total | 36 (100.0%) | $0 |
Household Income in Acacia Villas
Household Income Brackets in Acacia Villas
With 49 households falling in the category, the $35,000 to $49,999 income range is the most frequent in Acacia Villas, accounting for 57.7% of all households.
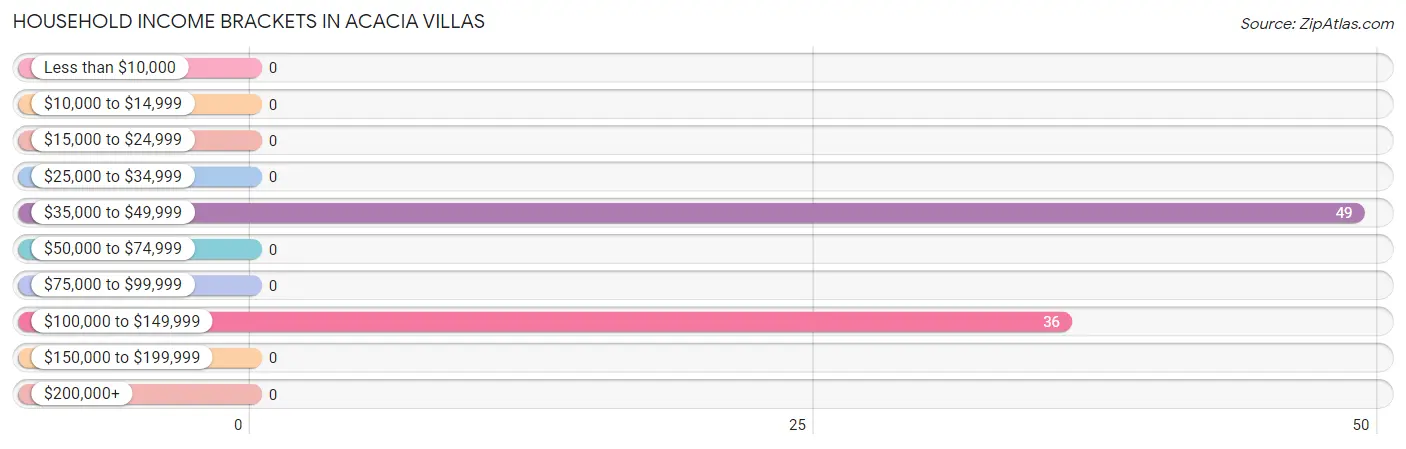
| Income Bracket | # Households | % Households |
| Less than $10,000 | 0 | 0.0% |
| $10,000 to $14,999 | 0 | 0.0% |
| $15,000 to $24,999 | 0 | 0.0% |
| $25,000 to $34,999 | 0 | 0.0% |
| $35,000 to $49,999 | 49 | 57.6% |
| $50,000 to $74,999 | 0 | 0.0% |
| $75,000 to $99,999 | 0 | 0.0% |
| $100,000 to $149,999 | 36 | 42.4% |
| $150,000 to $199,999 | 0 | 0.0% |
| $200,000+ | 0 | 0.0% |
Household Income by Householder Age in Acacia Villas
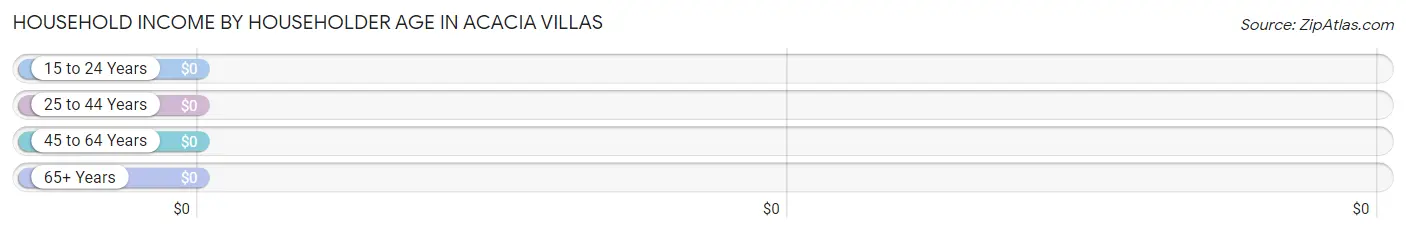
| Income Bracket | # Households | Median Income |
| 15 to 24 Years | 0 (0.0%) | $0 |
| 25 to 44 Years | 36 (42.3%) | $0 |
| 45 to 64 Years | 49 (57.7%) | $0 |
| 65+ Years | 0 (0.0%) | $0 |
| Total | 85 (100.0%) | $0 |
Poverty in Acacia Villas
Income Below Poverty by Sex and Age in Acacia Villas
| Age Bracket | Male | Female |
| Under 5 Years | 0 (0.0%) | 0 (0.0%) |
| 5 Years | 0 (0.0%) | 0 (0.0%) |
| 6 to 11 Years | 0 (0.0%) | 0 (0.0%) |
| 12 to 14 Years | 0 (0.0%) | 0 (0.0%) |
| 15 Years | 0 (0.0%) | 0 (0.0%) |
| 16 and 17 Years | 0 (0.0%) | 0 (0.0%) |
| 18 to 24 Years | 0 (0.0%) | 0 (0.0%) |
| 25 to 34 Years | 0 (0.0%) | 0 (0.0%) |
| 35 to 44 Years | 0 (0.0%) | 0 (0.0%) |
| 45 to 54 Years | 0 (0.0%) | 0 (0.0%) |
| 55 to 64 Years | 0 (0.0%) | 0 (0.0%) |
| 65 to 74 Years | 0 (0.0%) | 0 (0.0%) |
| 75 Years and over | 0 (0.0%) | 0 (0.0%) |
| Total | 0 (0.0%) | 0 (0.0%) |
Income Above Poverty by Sex and Age in Acacia Villas
According to the poverty statistics in Acacia Villas, males aged 6 to 11 years and females aged 12 to 14 years are the age groups that are most secure financially, with 100.0% of males and 100.0% of females in these age groups living above the poverty line.
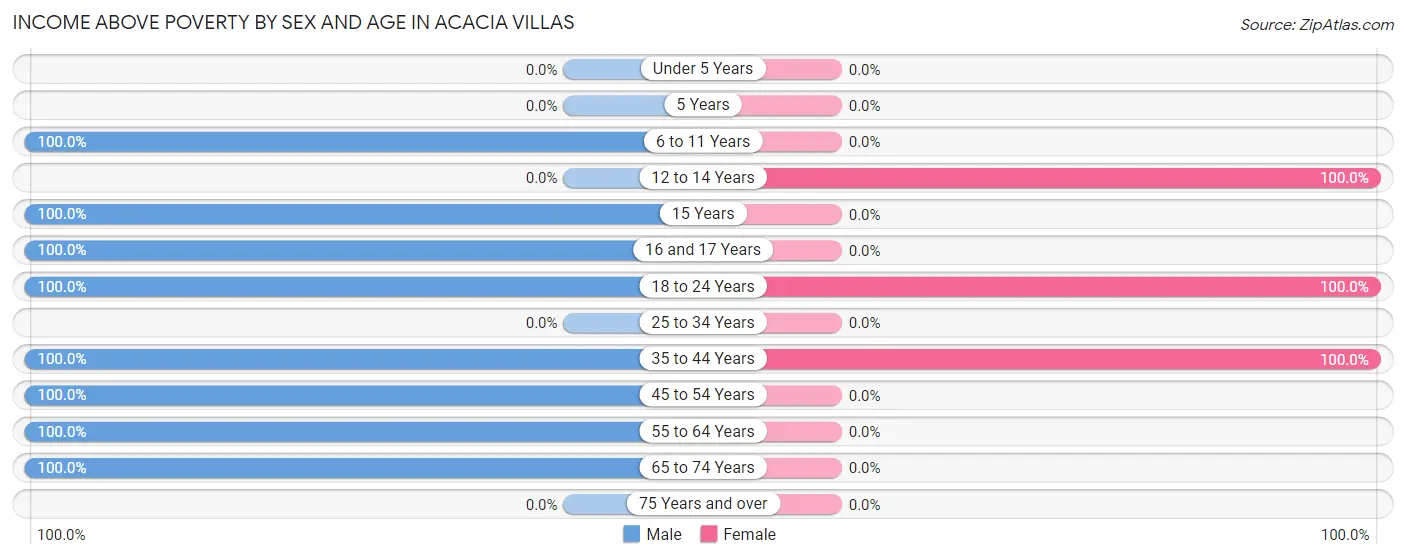
| Age Bracket | Male | Female |
| Under 5 Years | 0 (0.0%) | 0 (0.0%) |
| 5 Years | 0 (0.0%) | 0 (0.0%) |
| 6 to 11 Years | 37 (100.0%) | 0 (0.0%) |
| 12 to 14 Years | 0 (0.0%) | 36 (100.0%) |
| 15 Years | 37 (100.0%) | 0 (0.0%) |
| 16 and 17 Years | 36 (100.0%) | 0 (0.0%) |
| 18 to 24 Years | 45 (100.0%) | 43 (100.0%) |
| 25 to 34 Years | 0 (0.0%) | 0 (0.0%) |
| 35 to 44 Years | 42 (100.0%) | 36 (100.0%) |
| 45 to 54 Years | 15 (100.0%) | 0 (0.0%) |
| 55 to 64 Years | 34 (100.0%) | 0 (0.0%) |
| 65 to 74 Years | 2 (100.0%) | 0 (0.0%) |
| 75 Years and over | 0 (0.0%) | 0 (0.0%) |
| Total | 248 (100.0%) | 115 (100.0%) |
Income Below Poverty Among Married-Couple Families in Acacia Villas
| Children | Above Poverty | Below Poverty |
| No Children | 0 (0.0%) | 0 (0.0%) |
| 1 or 2 Children | 0 (0.0%) | 0 (0.0%) |
| 3 or 4 Children | 36 (100.0%) | 0 (0.0%) |
| 5 or more Children | 0 (0.0%) | 0 (0.0%) |
| Total | 36 (100.0%) | 0 (0.0%) |
Income Below Poverty Among Single-Parent Households in Acacia Villas
| Children | Single Father | Single Mother |
| No Children | 0 (0.0%) | 0 (0.0%) |
| 1 or 2 Children | 0 (0.0%) | 0 (0.0%) |
| 3 or 4 Children | 0 (0.0%) | 0 (0.0%) |
| 5 or more Children | 0 (0.0%) | 0 (0.0%) |
| Total | 0 (0.0%) | 0 (0.0%) |
Income Below Poverty Among Married-Couple vs Single-Parent Households in Acacia Villas
| Children | Married-Couple Families | Single-Parent Households |
| No Children | 0 (0.0%) | 0 (0.0%) |
| 1 or 2 Children | 0 (0.0%) | 0 (0.0%) |
| 3 or 4 Children | 0 (0.0%) | 0 (0.0%) |
| 5 or more Children | 0 (0.0%) | 0 (0.0%) |
| Total | 0 (0.0%) | 0 (0.0%) |
Race in Acacia Villas
The most populous races in Acacia Villas are White / Caucasian (363 | 100.0%), and Hispanic or Latino (312 | 86.0%).
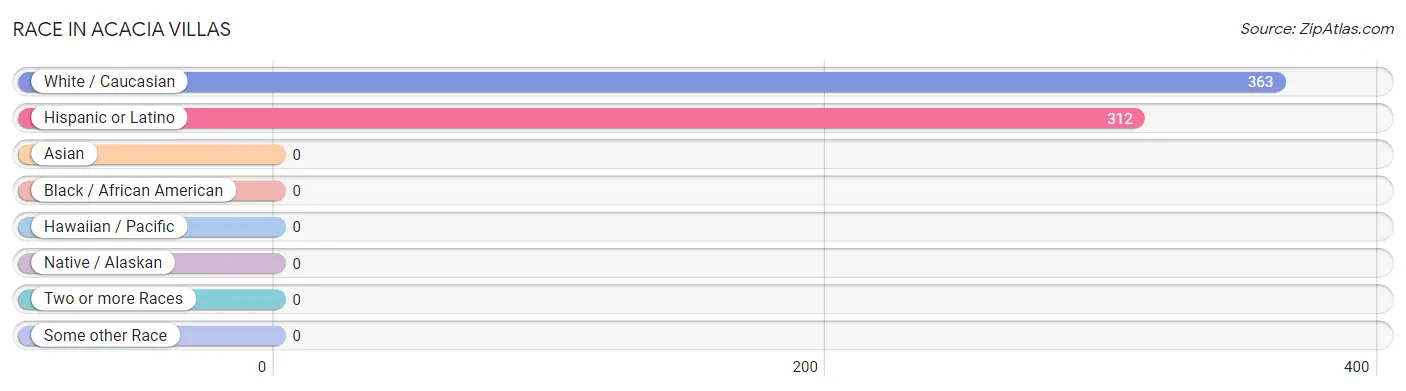
| Race | # Population | % Population |
| Asian | 0 | 0.0% |
| Black / African American | 0 | 0.0% |
| Hawaiian / Pacific | 0 | 0.0% |
| Hispanic or Latino | 312 | 86.0% |
| Native / Alaskan | 0 | 0.0% |
| White / Caucasian | 363 | 100.0% |
| Two or more Races | 0 | 0.0% |
| Some other Race | 0 | 0.0% |
| Total | 363 | 100.0% |
Ancestry in Acacia Villas
The most populous ancestries reported in Acacia Villas are , and Mexican (312 | 86.0%), together accounting for 86.0% of all Acacia Villas residents.

| Ancestry | # Population | % Population |
| Mexican | 312 | 86.0% | View All 1 Rows |
Immigrants in Acacia Villas
The most numerous immigrant groups reported in Acacia Villas came from Central America (42 | 11.6%), Latin America (42 | 11.6%), and Mexico (42 | 11.6%), together accounting for 34.7% of all Acacia Villas residents.
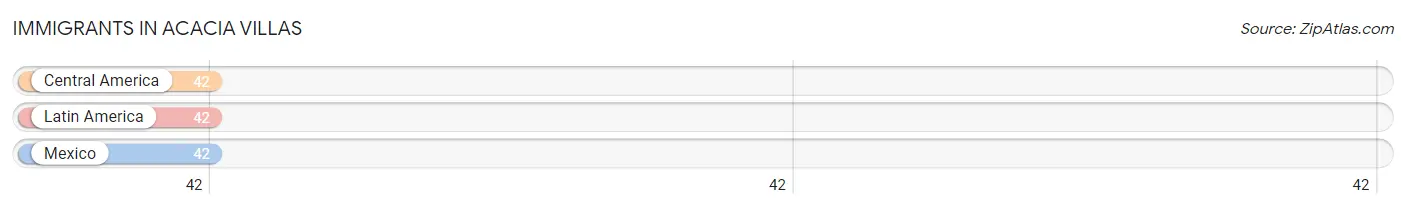
| Immigration Origin | # Population | % Population |
| Central America | 42 | 11.6% |
| Latin America | 42 | 11.6% |
| Mexico | 42 | 11.6% | View All 3 Rows |
Sex and Age in Acacia Villas
Sex and Age in Acacia Villas
The most populous age groups in Acacia Villas are 15 to 19 Years (73 | 29.4%) for men and 15 to 19 Years (43 | 37.4%) for women.
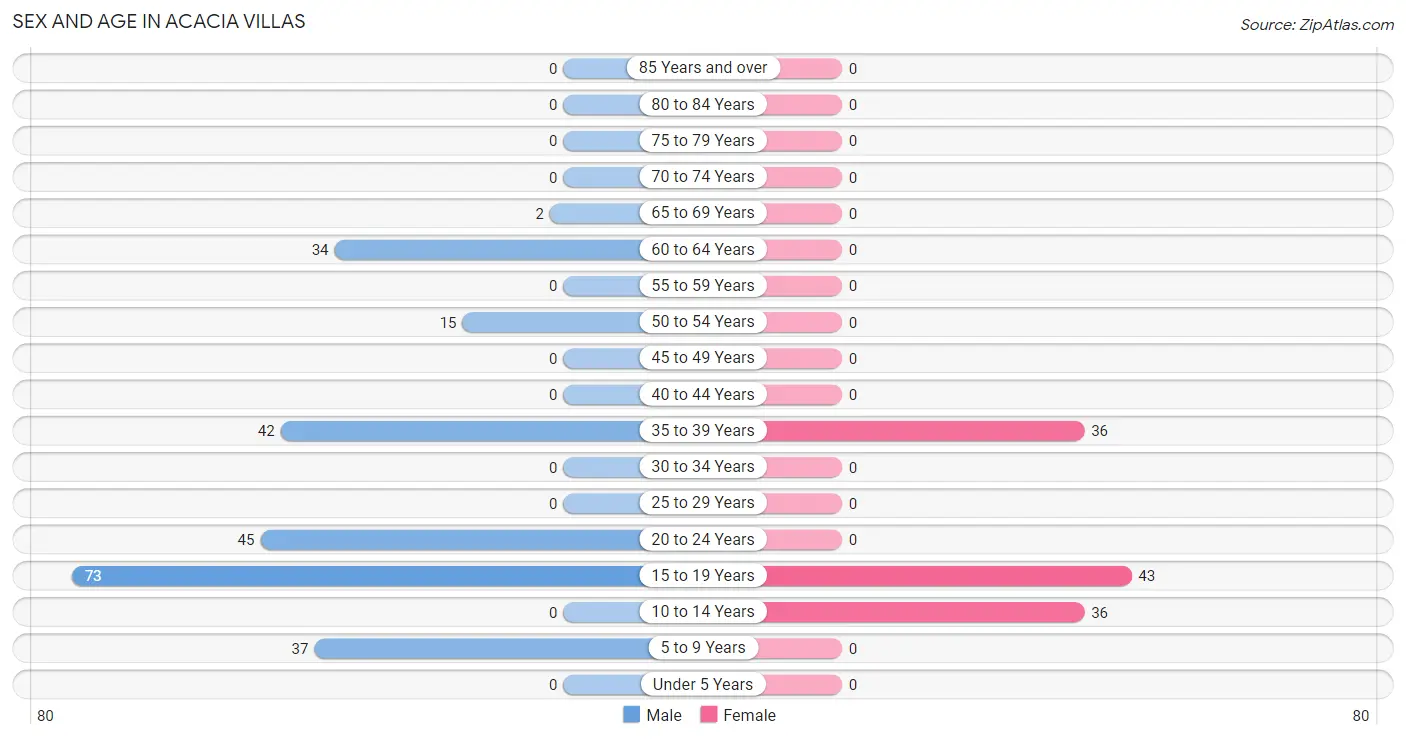
| Age Bracket | Male | Female |
| Under 5 Years | 0 (0.0%) | 0 (0.0%) |
| 5 to 9 Years | 37 (14.9%) | 0 (0.0%) |
| 10 to 14 Years | 0 (0.0%) | 36 (31.3%) |
| 15 to 19 Years | 73 (29.4%) | 43 (37.4%) |
| 20 to 24 Years | 45 (18.1%) | 0 (0.0%) |
| 25 to 29 Years | 0 (0.0%) | 0 (0.0%) |
| 30 to 34 Years | 0 (0.0%) | 0 (0.0%) |
| 35 to 39 Years | 42 (16.9%) | 36 (31.3%) |
| 40 to 44 Years | 0 (0.0%) | 0 (0.0%) |
| 45 to 49 Years | 0 (0.0%) | 0 (0.0%) |
| 50 to 54 Years | 15 (6.0%) | 0 (0.0%) |
| 55 to 59 Years | 0 (0.0%) | 0 (0.0%) |
| 60 to 64 Years | 34 (13.7%) | 0 (0.0%) |
| 65 to 69 Years | 2 (0.8%) | 0 (0.0%) |
| 70 to 74 Years | 0 (0.0%) | 0 (0.0%) |
| 75 to 79 Years | 0 (0.0%) | 0 (0.0%) |
| 80 to 84 Years | 0 (0.0%) | 0 (0.0%) |
| 85 Years and over | 0 (0.0%) | 0 (0.0%) |
| Total | 248 (100.0%) | 115 (100.0%) |
Families and Households in Acacia Villas
Median Family Size in Acacia Villas
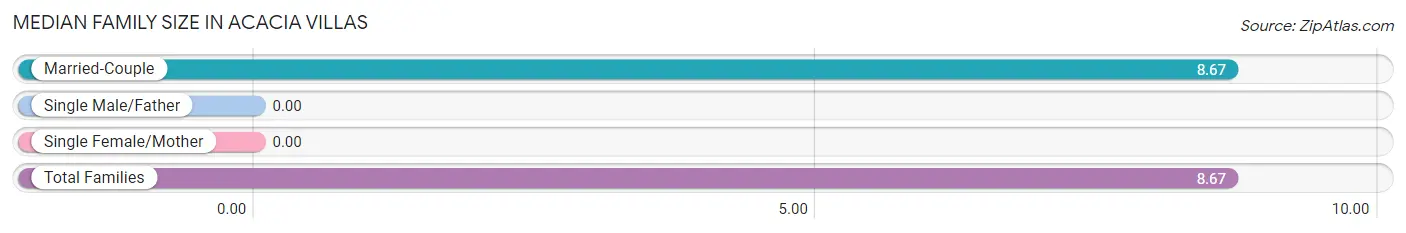
| Family Type | # Families | Family Size |
| Married-Couple | 36 (100.0%) | 8.67 |
| Single Male/Father | 0 (0.0%) | - |
| Single Female/Mother | 0 (0.0%) | - |
| Total Families | 36 (100.0%) | 8.67 |
Median Household Size in Acacia Villas
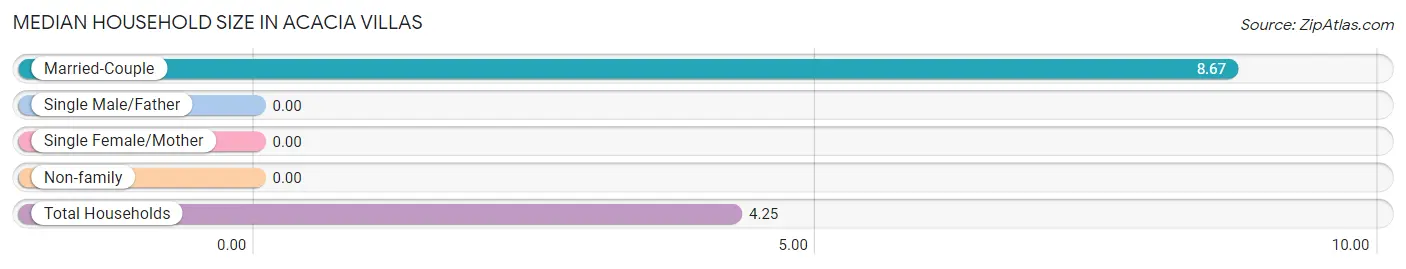
| Household Type | # Households | Household Size |
| Married-Couple | 36 (42.3%) | 8.67 |
| Single Male/Father | 0 (0.0%) | - |
| Single Female/Mother | 0 (0.0%) | - |
| Non-family | 49 (57.7%) | - |
| Total Households | 85 (100.0%) | 4.25 |
Household Size by Marriage Status in Acacia Villas
Out of a total of 85 households in Acacia Villas, 36 (42.3%) are family households, while 49 (57.7%) are nonfamily households. The most numerous type of family households are 7+ person households, comprising 36, and the most common type of nonfamily households are 1-person households, comprising 49.
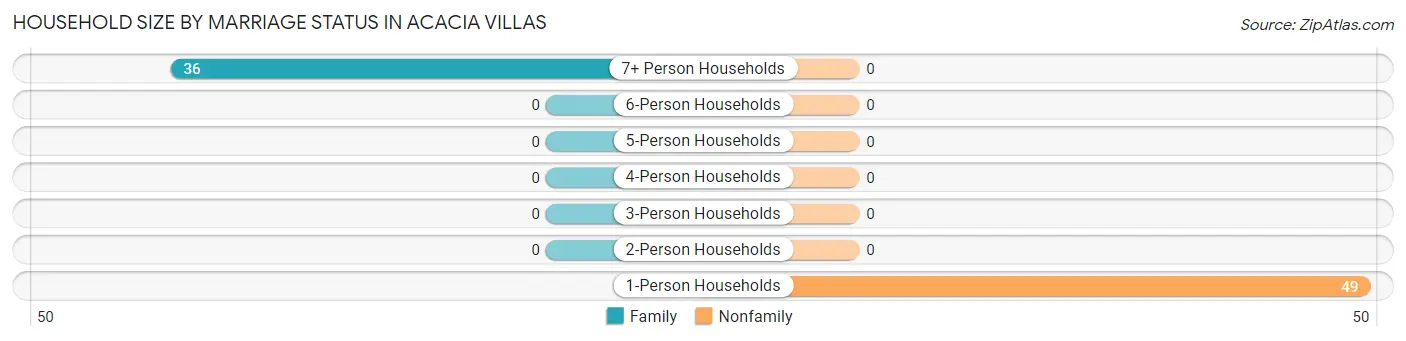
| Household Size | Family Households | Nonfamily Households |
| 1-Person Households | - | 49 (57.7%) |
| 2-Person Households | 0 (0.0%) | 0 (0.0%) |
| 3-Person Households | 0 (0.0%) | 0 (0.0%) |
| 4-Person Households | 0 (0.0%) | 0 (0.0%) |
| 5-Person Households | 0 (0.0%) | 0 (0.0%) |
| 6-Person Households | 0 (0.0%) | 0 (0.0%) |
| 7+ Person Households | 36 (42.3%) | 0 (0.0%) |
| Total | 36 (42.3%) | 49 (57.7%) |
Female Fertility in Acacia Villas
Fertility by Age in Acacia Villas
| Age Bracket | Women with Births | Births / 1,000 Women |
| 15 to 19 years | 0 (0.0%) | 0.0 |
| 20 to 34 years | 0 (0.0%) | 0.0 |
| 35 to 50 years | 0 (0.0%) | 0.0 |
| Total | 0 (0.0%) | 0.0 |
Fertility by Age by Marriage Status in Acacia Villas
| Age Bracket | Married | Unmarried |
| 15 to 19 years | 0 (0.0%) | 0 (0.0%) |
| 20 to 34 years | 0 (0.0%) | 0 (0.0%) |
| 35 to 50 years | 0 (0.0%) | 0 (0.0%) |
| Total | 0 (0.0%) | 0 (0.0%) |
Fertility by Education in Acacia Villas
| Educational Attainment | Women with Births | Births / 1,000 Women |
| Less than High School | 0 (0.0%) | 0.0 |
| High School Diploma | 0 (0.0%) | 0.0 |
| College or Associate's Degree | 0 (0.0%) | 0.0 |
| Bachelor's Degree | 0 (0.0%) | 0.0 |
| Graduate Degree | 0 (0.0%) | 0.0 |
| Total | 0 (0.0%) | 0.0 |
Fertility by Education by Marriage Status in Acacia Villas
| Educational Attainment | Married | Unmarried |
| Less than High School | 0 (0.0%) | 0 (0.0%) |
| High School Diploma | 0 (0.0%) | 0 (0.0%) |
| College or Associate's Degree | 0 (0.0%) | 0 (0.0%) |
| Bachelor's Degree | 0 (0.0%) | 0 (0.0%) |
| Graduate Degree | 0 (0.0%) | 0 (0.0%) |
| Total | 0 (0.0%) | 0 (0.0%) |
Employment Characteristics in Acacia Villas
Employment by Class of Employer in Acacia Villas
Among the 215 employed individuals in Acacia Villas, private company employees (200 | 93.0%), and local government employees (15 | 7.0%) make up the most common classes of employment.
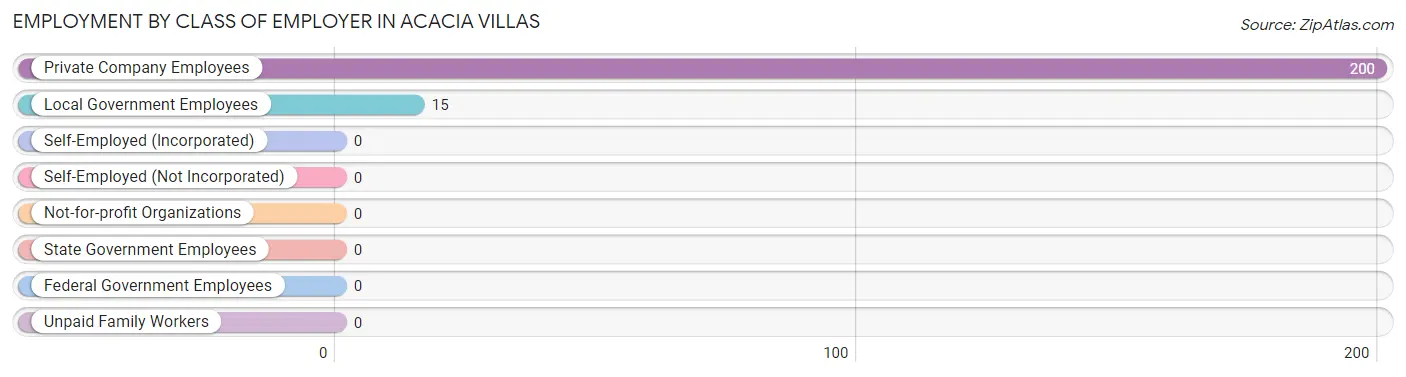
| Employer Class | # Employees | % Employees |
| Private Company Employees | 200 | 93.0% |
| Self-Employed (Incorporated) | 0 | 0.0% |
| Self-Employed (Not Incorporated) | 0 | 0.0% |
| Not-for-profit Organizations | 0 | 0.0% |
| Local Government Employees | 15 | 7.0% |
| State Government Employees | 0 | 0.0% |
| Federal Government Employees | 0 | 0.0% |
| Unpaid Family Workers | 0 | 0.0% |
| Total | 215 | 100.0% |
Employment Status by Age in Acacia Villas
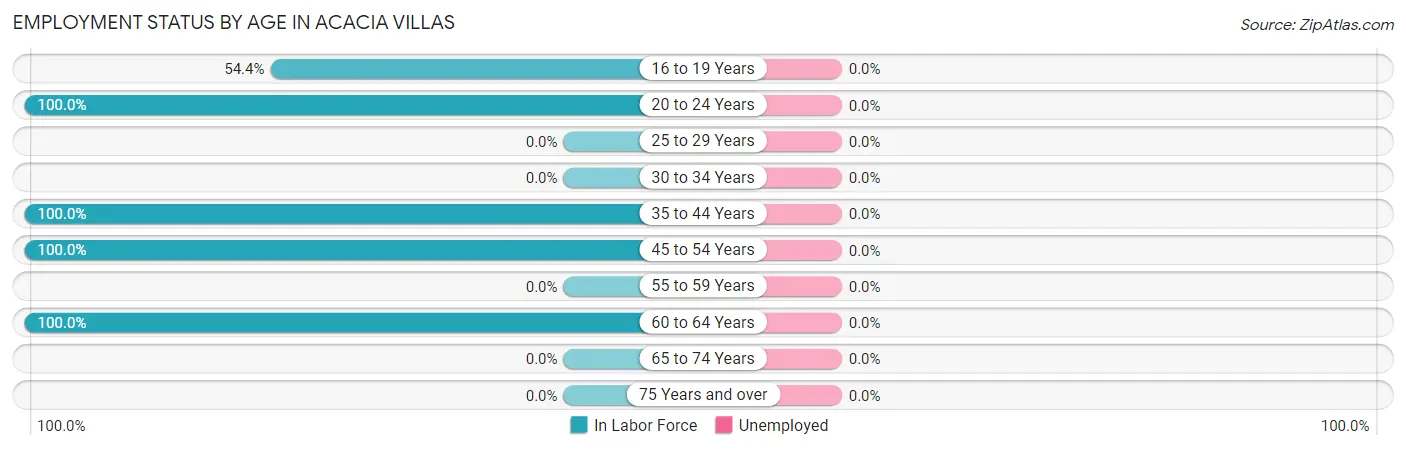
| Age Bracket | In Labor Force | Unemployed |
| 16 to 19 Years | 43 (54.4%) | 0 (0.0%) |
| 20 to 24 Years | 45 (100.0%) | 0 (0.0%) |
| 25 to 29 Years | 0 (0.0%) | 0 (0.0%) |
| 30 to 34 Years | 0 (0.0%) | 0 (0.0%) |
| 35 to 44 Years | 78 (100.0%) | 0 (0.0%) |
| 45 to 54 Years | 15 (100.0%) | 0 (0.0%) |
| 55 to 59 Years | 0 (0.0%) | 0 (0.0%) |
| 60 to 64 Years | 34 (100.0%) | 0 (0.0%) |
| 65 to 74 Years | 0 (0.0%) | 0 (0.0%) |
| 75 Years and over | 0 (0.0%) | 0 (0.0%) |
| Total | 215 (85.0%) | 0 (0.0%) |
Employment Status by Educational Attainment in Acacia Villas
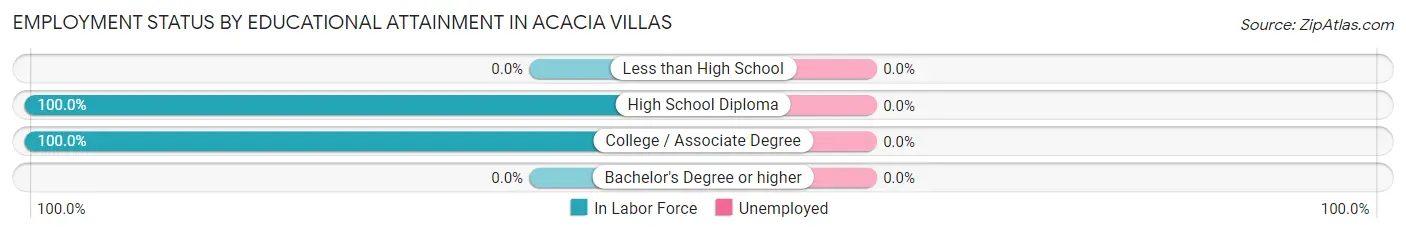
| Educational Attainment | In Labor Force | Unemployed |
| Less than High School | 0 (0.0%) | 0 (0.0%) |
| High School Diploma | 93 (100.0%) | 0 (0.0%) |
| College / Associate Degree | 34 (100.0%) | 0 (0.0%) |
| Bachelor's Degree or higher | 0 (0.0%) | 0 (0.0%) |
| Total | 127 (100.0%) | 0 (0.0%) |
Employment Occupations by Sex in Acacia Villas
Management, Business, Science and Arts Occupations
The most common Management, Business, Science and Arts occupations in Acacia Villas are , and Management (42 | 19.5%).
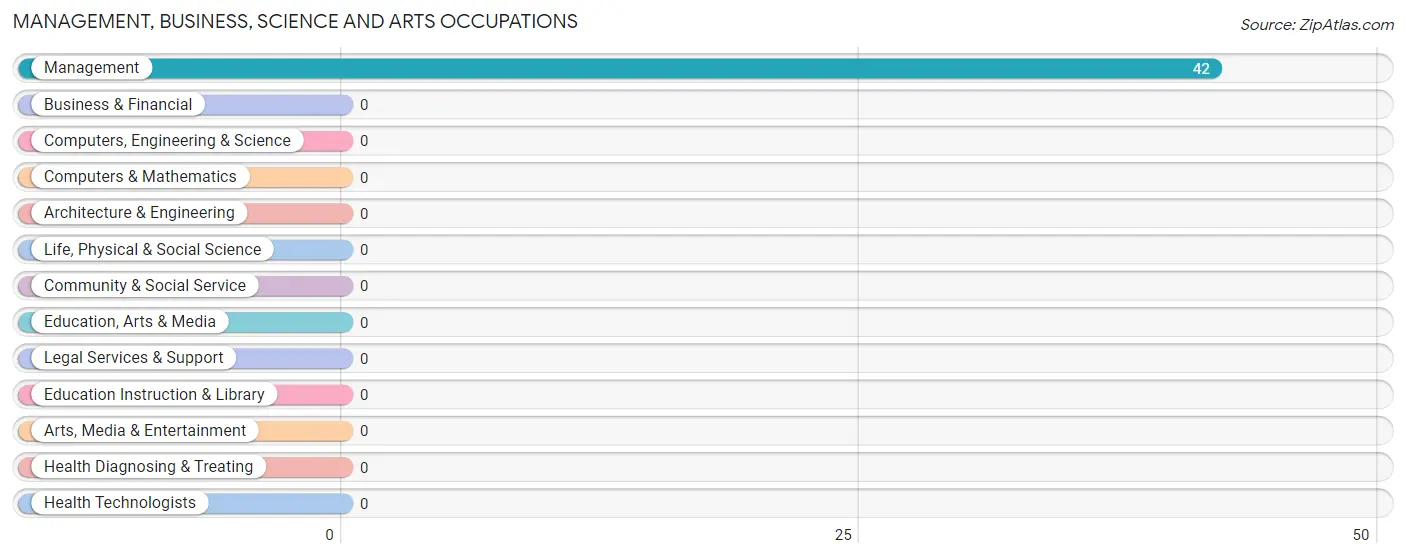
Management, Business, Science and Arts Occupations by Sex
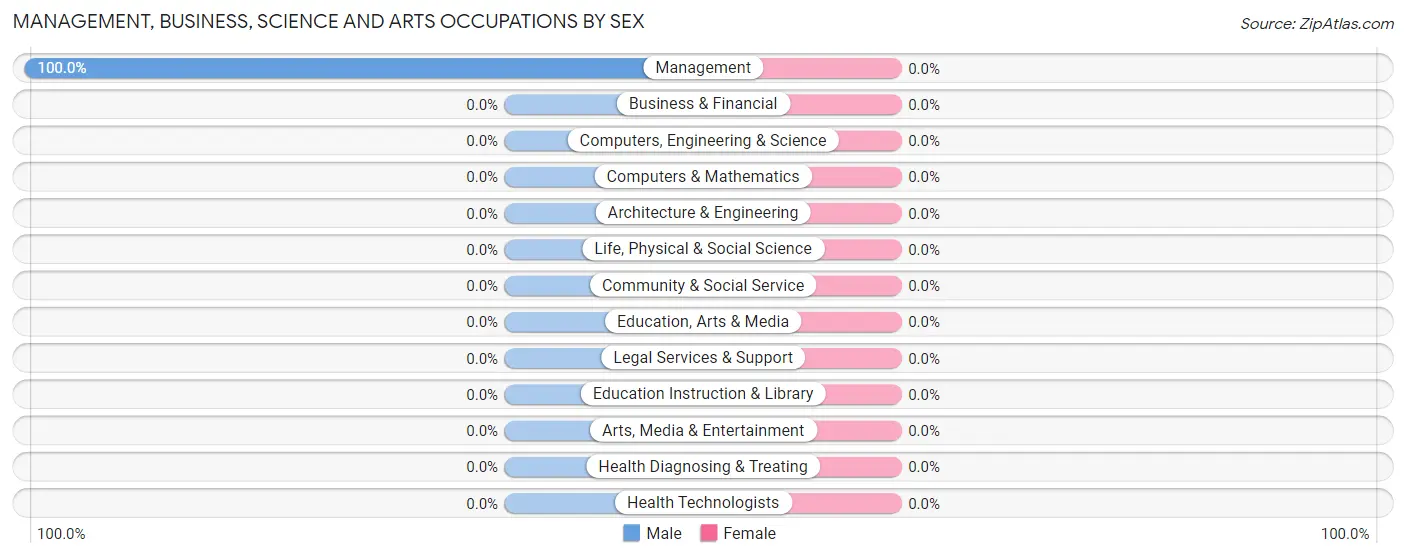
| Occupation | Male | Female |
| Management | 42 (100.0%) | 0 (0.0%) |
| Business & Financial | 0 (0.0%) | 0 (0.0%) |
| Computers, Engineering & Science | 0 (0.0%) | 0 (0.0%) |
| Computers & Mathematics | 0 (0.0%) | 0 (0.0%) |
| Architecture & Engineering | 0 (0.0%) | 0 (0.0%) |
| Life, Physical & Social Science | 0 (0.0%) | 0 (0.0%) |
| Community & Social Service | 0 (0.0%) | 0 (0.0%) |
| Education, Arts & Media | 0 (0.0%) | 0 (0.0%) |
| Legal Services & Support | 0 (0.0%) | 0 (0.0%) |
| Education Instruction & Library | 0 (0.0%) | 0 (0.0%) |
| Arts, Media & Entertainment | 0 (0.0%) | 0 (0.0%) |
| Health Diagnosing & Treating | 0 (0.0%) | 0 (0.0%) |
| Health Technologists | 0 (0.0%) | 0 (0.0%) |
| Total (Category) | 42 (100.0%) | 0 (0.0%) |
| Total (Overall) | 136 (63.3%) | 79 (36.7%) |
Services Occupations
The most common Services occupations in Acacia Villas are , and Cleaning & Maintenance (51 | 23.7%).
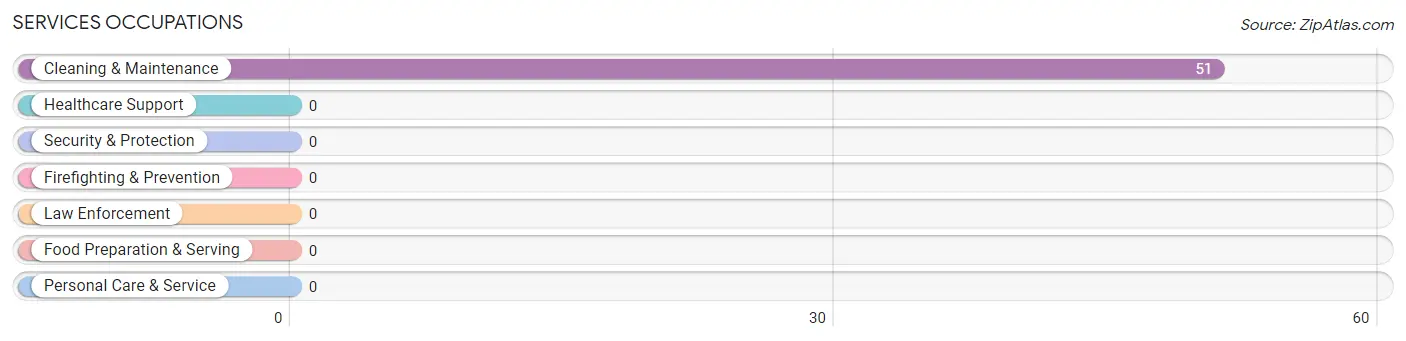
Services Occupations by Sex
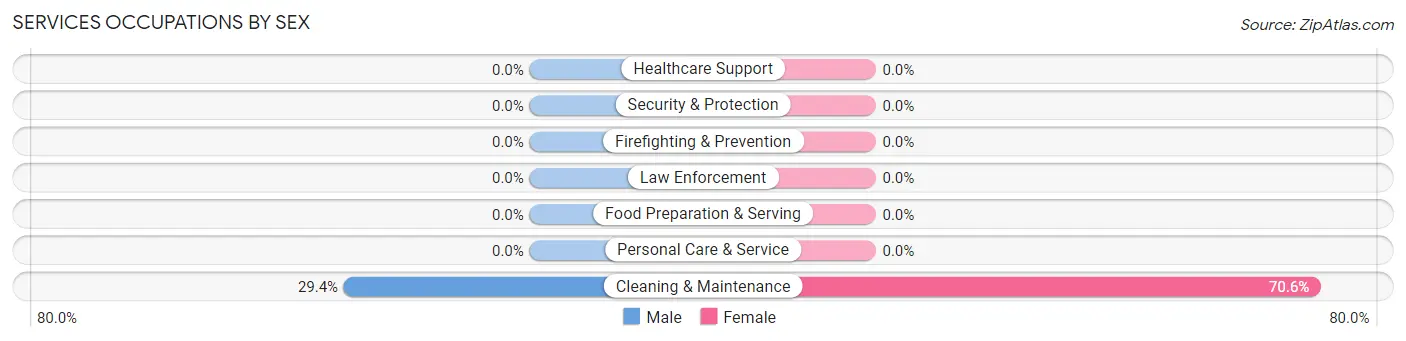
| Occupation | Male | Female |
| Healthcare Support | 0 (0.0%) | 0 (0.0%) |
| Security & Protection | 0 (0.0%) | 0 (0.0%) |
| Firefighting & Prevention | 0 (0.0%) | 0 (0.0%) |
| Law Enforcement | 0 (0.0%) | 0 (0.0%) |
| Food Preparation & Serving | 0 (0.0%) | 0 (0.0%) |
| Cleaning & Maintenance | 15 (29.4%) | 36 (70.6%) |
| Personal Care & Service | 0 (0.0%) | 0 (0.0%) |
| Total (Category) | 15 (29.4%) | 36 (70.6%) |
| Total (Overall) | 136 (63.3%) | 79 (36.7%) |
Sales and Office Occupations
The most common Sales and Office occupations in Acacia Villas are , and Sales & Related (43 | 20.0%).
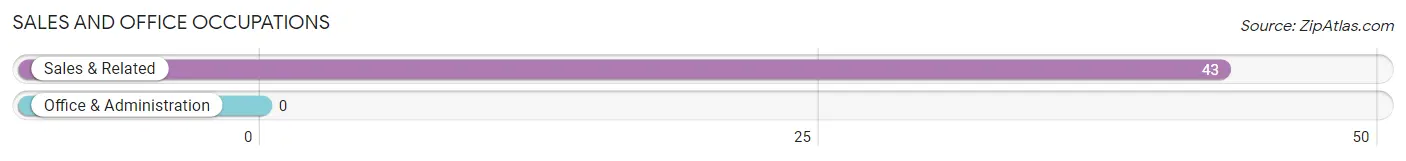
Sales and Office Occupations by Sex
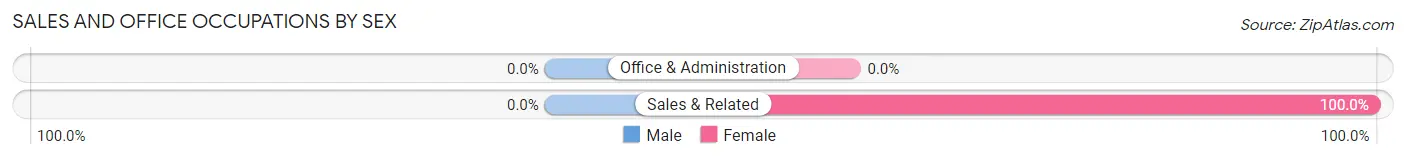
| Occupation | Male | Female |
| Sales & Related | 0 (0.0%) | 43 (100.0%) |
| Office & Administration | 0 (0.0%) | 0 (0.0%) |
| Total (Category) | 0 (0.0%) | 43 (100.0%) |
| Total (Overall) | 136 (63.3%) | 79 (36.7%) |
Natural Resources, Construction and Maintenance Occupations
The most common Natural Resources, Construction and Maintenance occupations in Acacia Villas are , and Installation, Maintenance & Repair (45 | 20.9%).
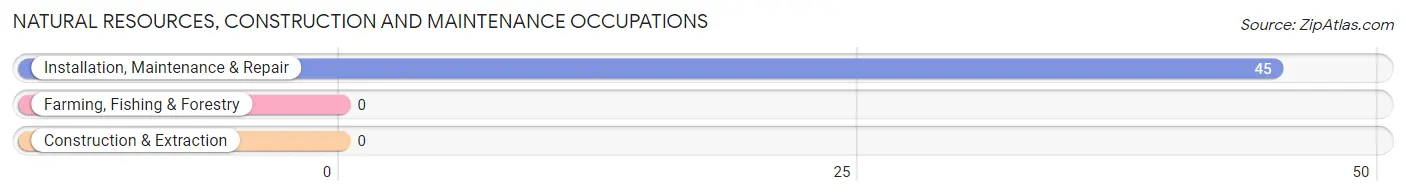
Natural Resources, Construction and Maintenance Occupations by Sex
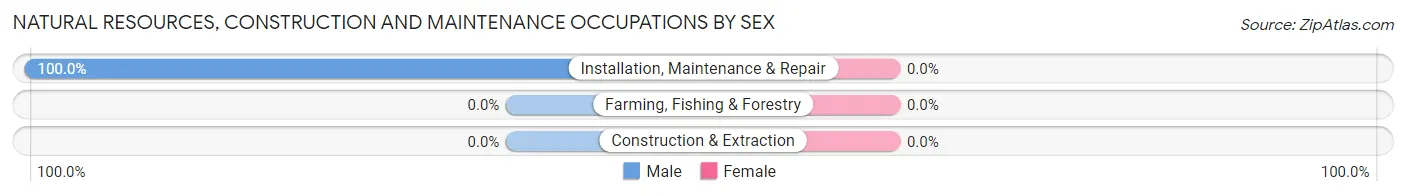
| Occupation | Male | Female |
| Farming, Fishing & Forestry | 0 (0.0%) | 0 (0.0%) |
| Construction & Extraction | 0 (0.0%) | 0 (0.0%) |
| Installation, Maintenance & Repair | 45 (100.0%) | 0 (0.0%) |
| Total (Category) | 45 (100.0%) | 0 (0.0%) |
| Total (Overall) | 136 (63.3%) | 79 (36.7%) |
Production, Transportation and Moving Occupations
The most common Production, Transportation and Moving occupations in Acacia Villas are , and Material Moving (34 | 15.8%).
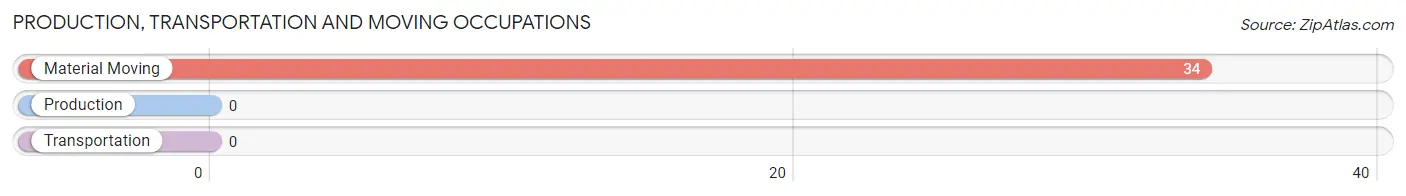
Production, Transportation and Moving Occupations by Sex
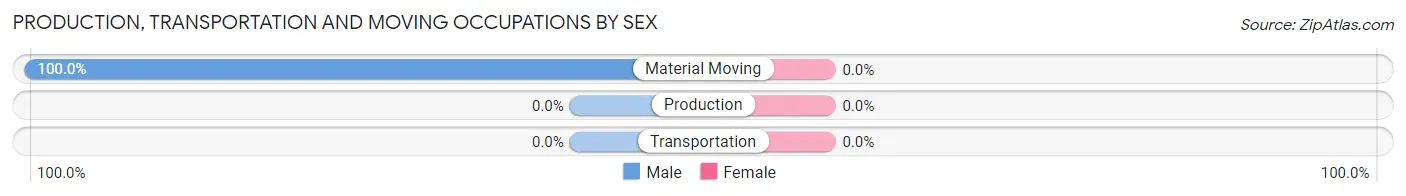
| Occupation | Male | Female |
| Production | 0 (0.0%) | 0 (0.0%) |
| Transportation | 0 (0.0%) | 0 (0.0%) |
| Material Moving | 34 (100.0%) | 0 (0.0%) |
| Total (Category) | 34 (100.0%) | 0 (0.0%) |
| Total (Overall) | 136 (63.3%) | 79 (36.7%) |
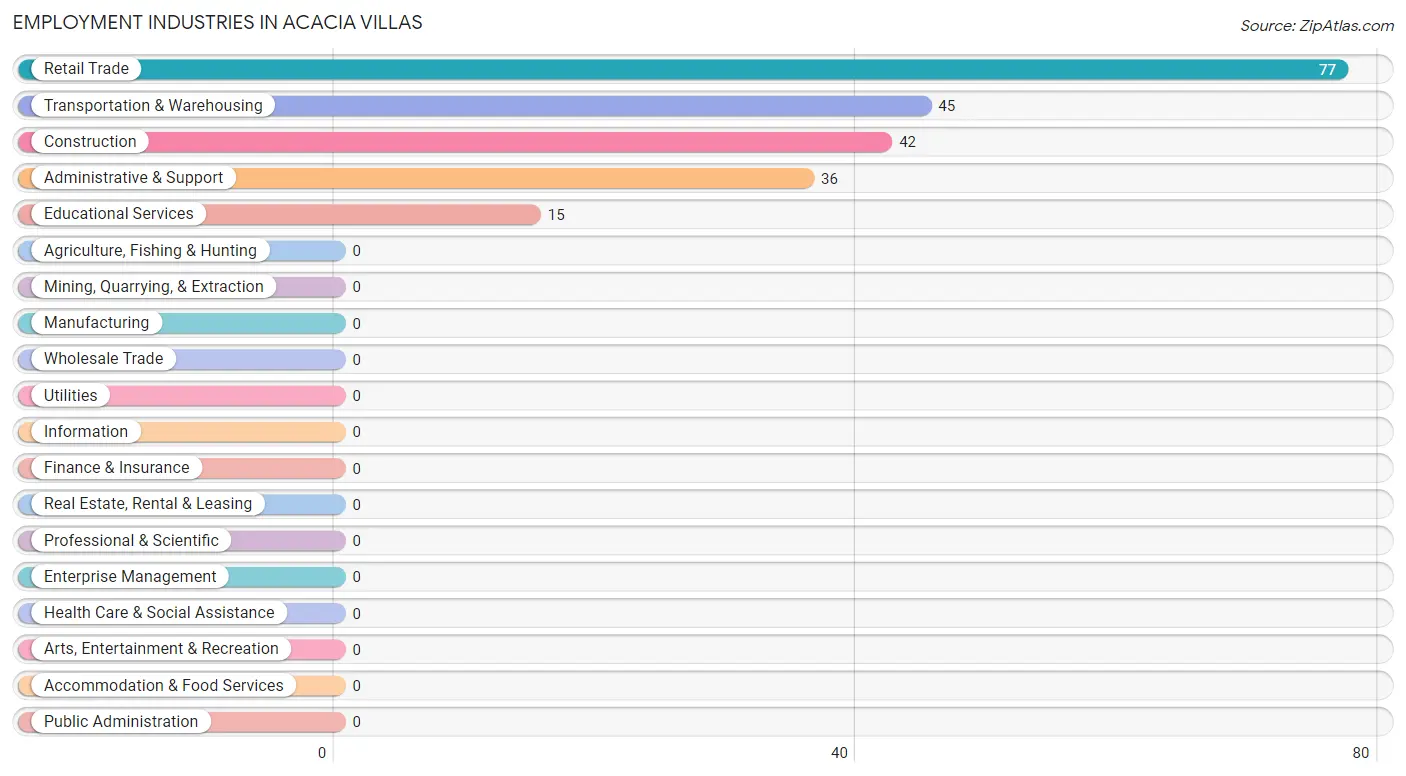
Employment Industries by Sex in Acacia Villas
Employment Industries in Acacia Villas
The major employment industries in Acacia Villas include Retail Trade (77 | 35.8%), Transportation & Warehousing (45 | 20.9%), Construction (42 | 19.5%), Administrative & Support (36 | 16.7%), and Educational Services (15 | 7.0%).
Employment Industries by Sex in Acacia Villas
The Acacia Villas industries that see more men than women are Construction (100.0%), Transportation & Warehousing (100.0%), and Educational Services (100.0%), whereas the industries that tend to have a higher number of women are Administrative & Support (100.0%), and Retail Trade (55.8%).
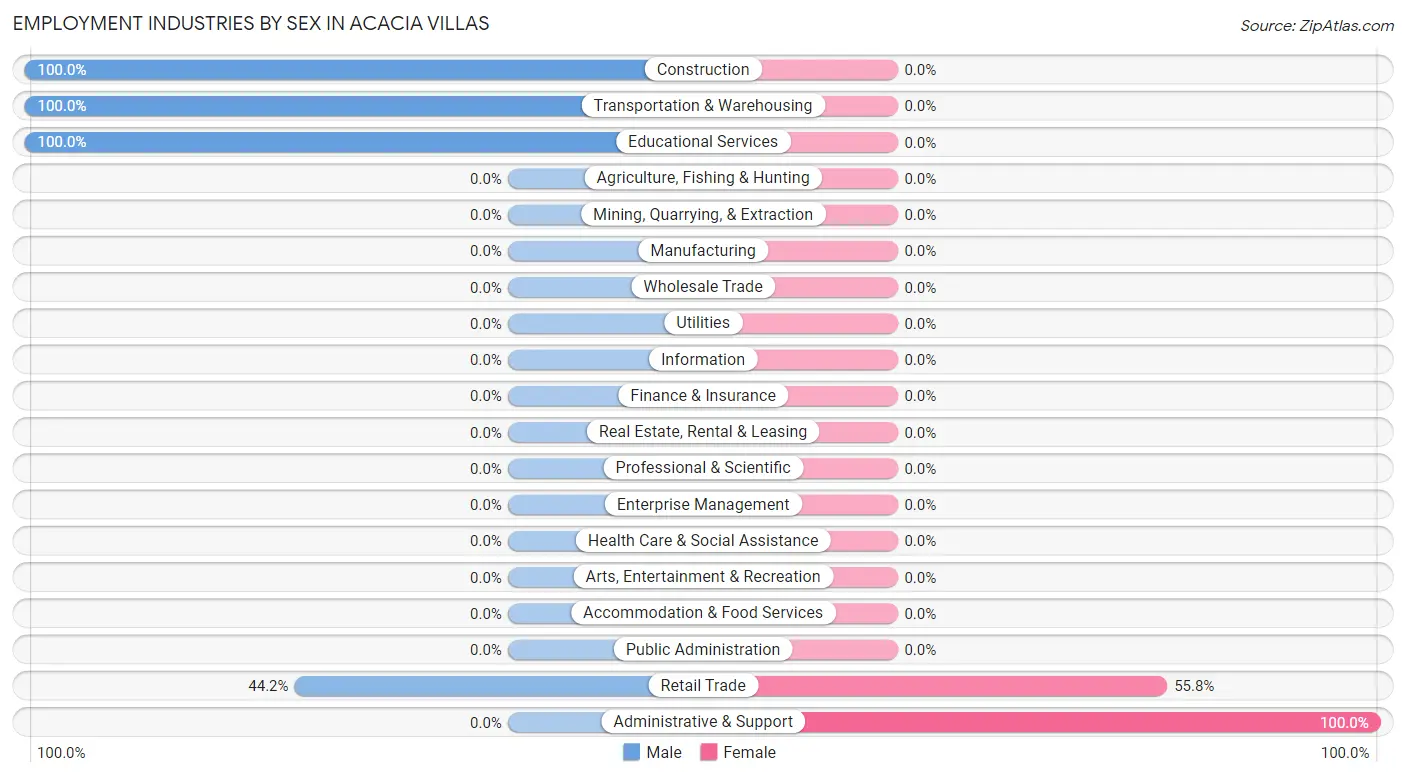
| Industry | Male | Female |
| Agriculture, Fishing & Hunting | 0 (0.0%) | 0 (0.0%) |
| Mining, Quarrying, & Extraction | 0 (0.0%) | 0 (0.0%) |
| Construction | 42 (100.0%) | 0 (0.0%) |
| Manufacturing | 0 (0.0%) | 0 (0.0%) |
| Wholesale Trade | 0 (0.0%) | 0 (0.0%) |
| Retail Trade | 34 (44.2%) | 43 (55.8%) |
| Transportation & Warehousing | 45 (100.0%) | 0 (0.0%) |
| Utilities | 0 (0.0%) | 0 (0.0%) |
| Information | 0 (0.0%) | 0 (0.0%) |
| Finance & Insurance | 0 (0.0%) | 0 (0.0%) |
| Real Estate, Rental & Leasing | 0 (0.0%) | 0 (0.0%) |
| Professional & Scientific | 0 (0.0%) | 0 (0.0%) |
| Enterprise Management | 0 (0.0%) | 0 (0.0%) |
| Administrative & Support | 0 (0.0%) | 36 (100.0%) |
| Educational Services | 15 (100.0%) | 0 (0.0%) |
| Health Care & Social Assistance | 0 (0.0%) | 0 (0.0%) |
| Arts, Entertainment & Recreation | 0 (0.0%) | 0 (0.0%) |
| Accommodation & Food Services | 0 (0.0%) | 0 (0.0%) |
| Public Administration | 0 (0.0%) | 0 (0.0%) |
| Total | 136 (63.3%) | 79 (36.7%) |
Education in Acacia Villas
School Enrollment in Acacia Villas
The most common levels of schooling among the 191 students in Acacia Villas are high school (73 | 38.2%), college / undergraduate (45 | 23.6%), and elementary school (37 | 19.4%).
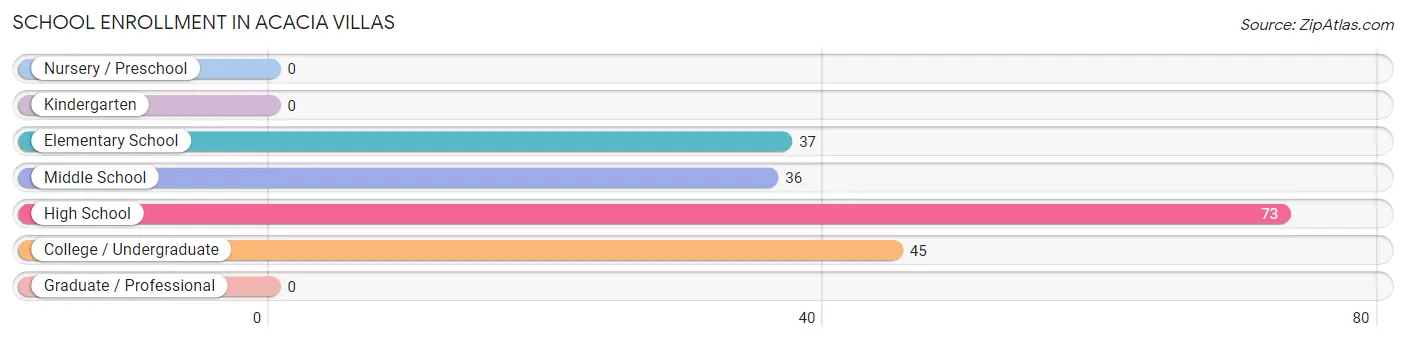
| School Level | # Students | % Students |
| Nursery / Preschool | 0 | 0.0% |
| Kindergarten | 0 | 0.0% |
| Elementary School | 37 | 19.4% |
| Middle School | 36 | 18.9% |
| High School | 73 | 38.2% |
| College / Undergraduate | 45 | 23.6% |
| Graduate / Professional | 0 | 0.0% |
| Total | 191 | 100.0% |
School Enrollment by Age by Funding Source in Acacia Villas
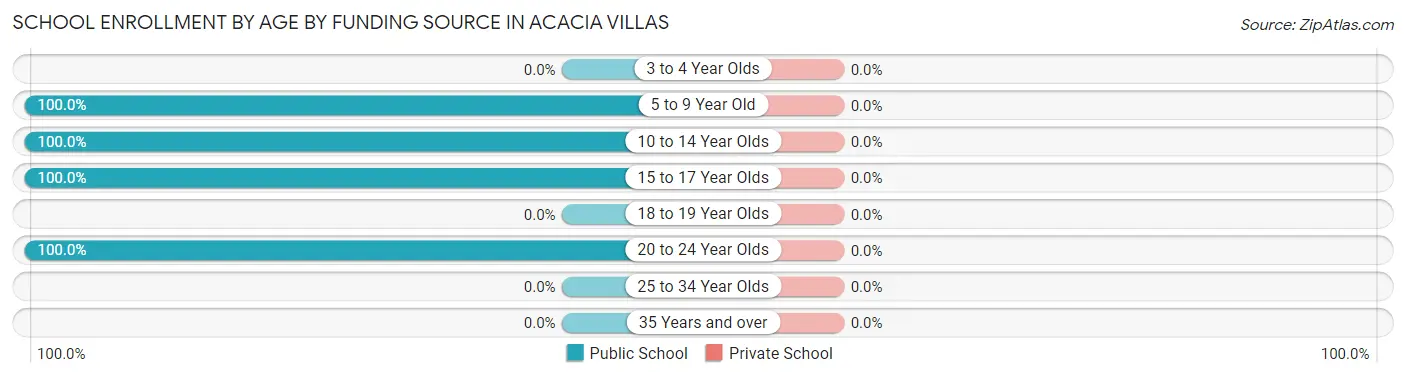
| Age Bracket | Public School | Private School |
| 3 to 4 Year Olds | 0 (0.0%) | 0 (0.0%) |
| 5 to 9 Year Old | 37 (100.0%) | 0 (0.0%) |
| 10 to 14 Year Olds | 36 (100.0%) | 0 (0.0%) |
| 15 to 17 Year Olds | 73 (100.0%) | 0 (0.0%) |
| 18 to 19 Year Olds | 0 (0.0%) | 0 (0.0%) |
| 20 to 24 Year Olds | 45 (100.0%) | 0 (0.0%) |
| 25 to 34 Year Olds | 0 (0.0%) | 0 (0.0%) |
| 35 Years and over | 0 (0.0%) | 0 (0.0%) |
| Total | 191 (100.0%) | 0 (0.0%) |
Educational Attainment by Field of Study in Acacia Villas
| Field of Study | # Graduates | % Graduates |
| Computers & Mathematics | 0 | 0.0% |
| Bio, Nature & Agricultural | 0 | 0.0% |
| Physical & Health Sciences | 0 | 0.0% |
| Psychology | 0 | 0.0% |
| Social Sciences | 0 | 0.0% |
| Engineering | 0 | 0.0% |
| Multidisciplinary Studies | 0 | 0.0% |
| Science & Technology | 0 | 0.0% |
| Business | 0 | 0.0% |
| Education | 0 | 0.0% |
| Literature & Languages | 0 | 0.0% |
| Liberal Arts & History | 0 | 0.0% |
| Visual & Performing Arts | 0 | 0.0% |
| Communications | 0 | 0.0% |
| Arts & Humanities | 0 | 0.0% |
| Total | 0 | 0.0% |
Transportation & Commute in Acacia Villas
Vehicle Availability by Sex in Acacia Villas
The most prevalent vehicle ownership categories in Acacia Villas are males with 4 vehicles (87, accounting for 64.0%) and females with 4 vehicles (79, making up 110.1%).
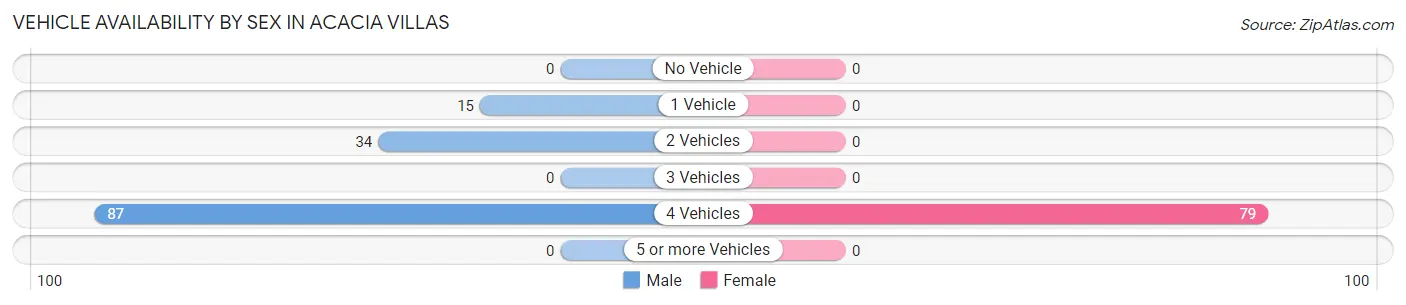
| Vehicles Available | Male | Female |
| No Vehicle | 0 (0.0%) | 0 (0.0%) |
| 1 Vehicle | 15 (11.0%) | 0 (0.0%) |
| 2 Vehicles | 34 (25.0%) | 0 (0.0%) |
| 3 Vehicles | 0 (0.0%) | 0 (0.0%) |
| 4 Vehicles | 87 (64.0%) | 79 (100.0%) |
| 5 or more Vehicles | 0 (0.0%) | 0 (0.0%) |
| Total | 136 (100.0%) | 79 (100.0%) |
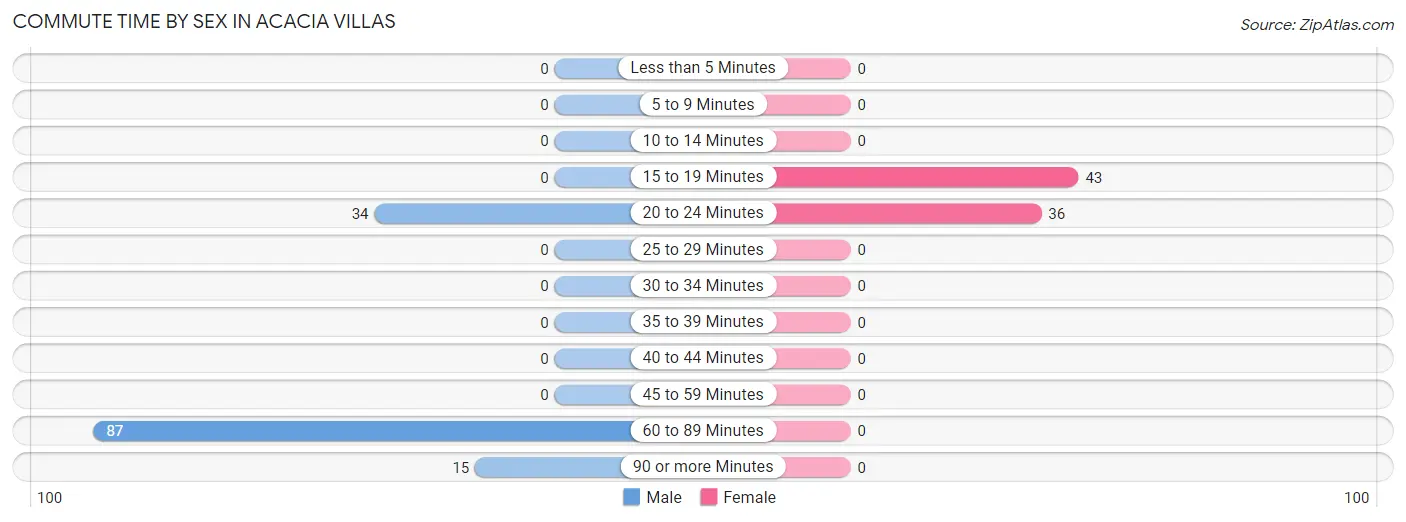
Commute Time in Acacia Villas
The most frequently occuring commute durations in Acacia Villas are 60 to 89 minutes (87 commuters, 40.5%), 20 to 24 minutes (70 commuters, 32.6%), and 15 to 19 minutes (43 commuters, 20.0%).
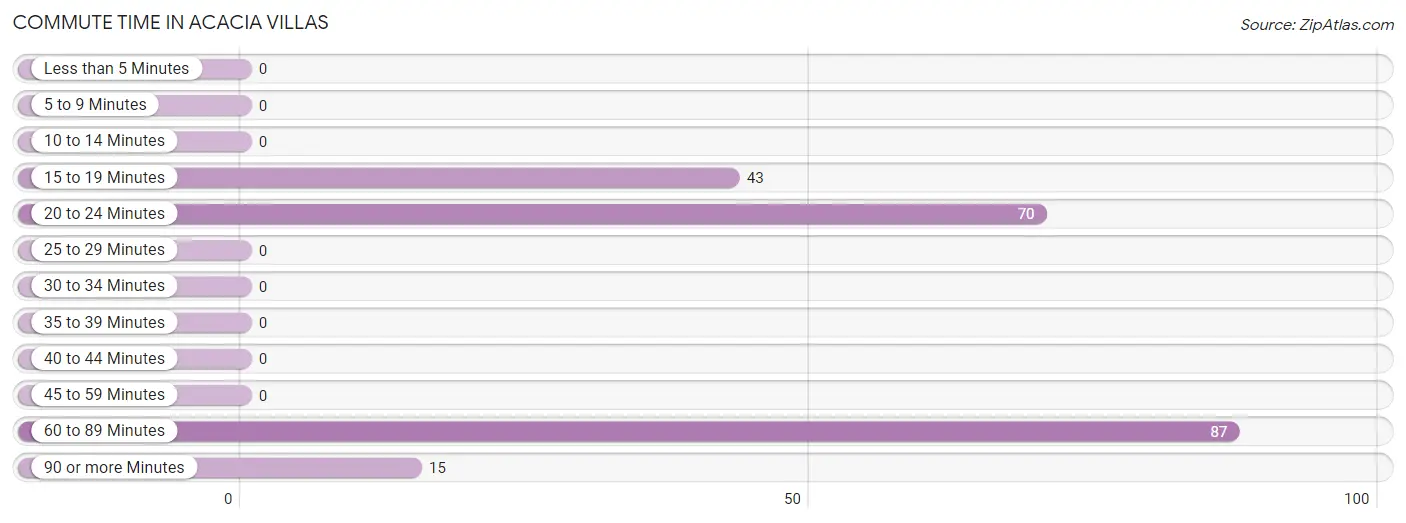
| Commute Time | # Commuters | % Commuters |
| Less than 5 Minutes | 0 | 0.0% |
| 5 to 9 Minutes | 0 | 0.0% |
| 10 to 14 Minutes | 0 | 0.0% |
| 15 to 19 Minutes | 43 | 20.0% |
| 20 to 24 Minutes | 70 | 32.6% |
| 25 to 29 Minutes | 0 | 0.0% |
| 30 to 34 Minutes | 0 | 0.0% |
| 35 to 39 Minutes | 0 | 0.0% |
| 40 to 44 Minutes | 0 | 0.0% |
| 45 to 59 Minutes | 0 | 0.0% |
| 60 to 89 Minutes | 87 | 40.5% |
| 90 or more Minutes | 15 | 7.0% |
Commute Time by Sex in Acacia Villas
The most common commute times in Acacia Villas are 60 to 89 minutes (87 commuters, 64.0%) for males and 15 to 19 minutes (43 commuters, 54.4%) for females.
| Commute Time | Male | Female |
| Less than 5 Minutes | 0 (0.0%) | 0 (0.0%) |
| 5 to 9 Minutes | 0 (0.0%) | 0 (0.0%) |
| 10 to 14 Minutes | 0 (0.0%) | 0 (0.0%) |
| 15 to 19 Minutes | 0 (0.0%) | 43 (54.4%) |
| 20 to 24 Minutes | 34 (25.0%) | 36 (45.6%) |
| 25 to 29 Minutes | 0 (0.0%) | 0 (0.0%) |
| 30 to 34 Minutes | 0 (0.0%) | 0 (0.0%) |
| 35 to 39 Minutes | 0 (0.0%) | 0 (0.0%) |
| 40 to 44 Minutes | 0 (0.0%) | 0 (0.0%) |
| 45 to 59 Minutes | 0 (0.0%) | 0 (0.0%) |
| 60 to 89 Minutes | 87 (64.0%) | 0 (0.0%) |
| 90 or more Minutes | 15 (11.0%) | 0 (0.0%) |
Time of Departure to Work by Sex in Acacia Villas
The most frequent times of departure to work in Acacia Villas are 7:00 AM to 7:29 AM (87, 64.0%) for males and 12:00 PM to 3:59 PM (43, 54.4%) for females.
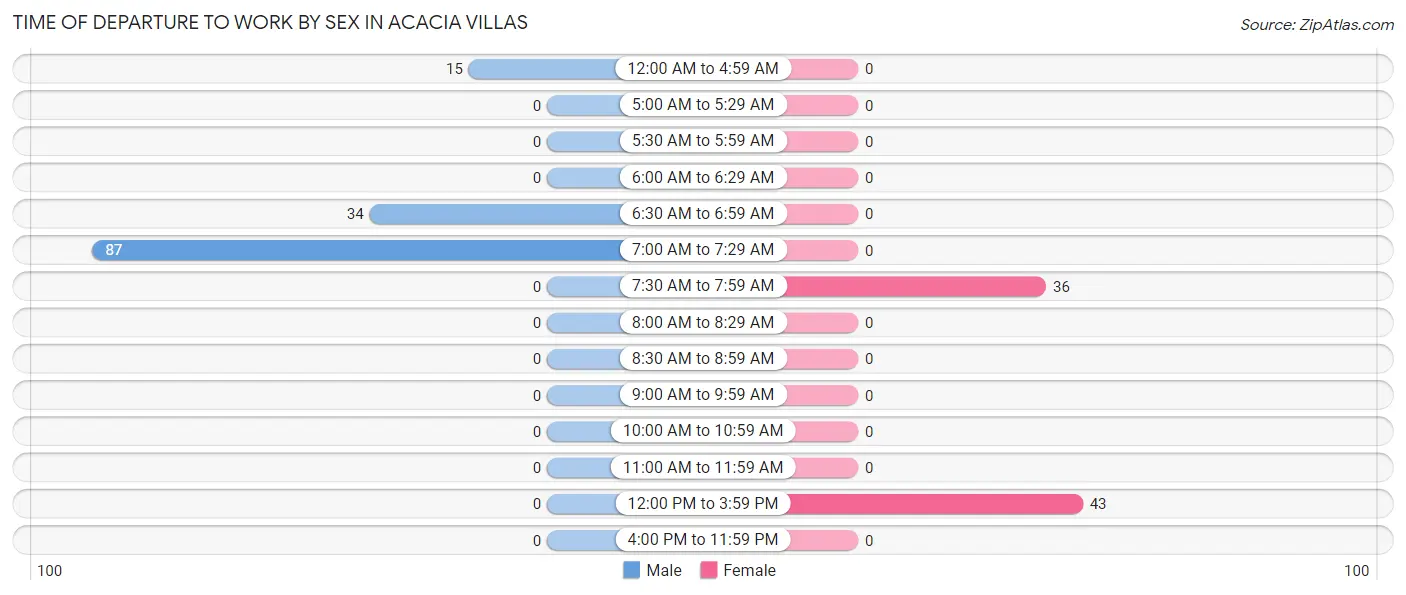
| Time of Departure | Male | Female |
| 12:00 AM to 4:59 AM | 15 (11.0%) | 0 (0.0%) |
| 5:00 AM to 5:29 AM | 0 (0.0%) | 0 (0.0%) |
| 5:30 AM to 5:59 AM | 0 (0.0%) | 0 (0.0%) |
| 6:00 AM to 6:29 AM | 0 (0.0%) | 0 (0.0%) |
| 6:30 AM to 6:59 AM | 34 (25.0%) | 0 (0.0%) |
| 7:00 AM to 7:29 AM | 87 (64.0%) | 0 (0.0%) |
| 7:30 AM to 7:59 AM | 0 (0.0%) | 36 (45.6%) |
| 8:00 AM to 8:29 AM | 0 (0.0%) | 0 (0.0%) |
| 8:30 AM to 8:59 AM | 0 (0.0%) | 0 (0.0%) |
| 9:00 AM to 9:59 AM | 0 (0.0%) | 0 (0.0%) |
| 10:00 AM to 10:59 AM | 0 (0.0%) | 0 (0.0%) |
| 11:00 AM to 11:59 AM | 0 (0.0%) | 0 (0.0%) |
| 12:00 PM to 3:59 PM | 0 (0.0%) | 43 (54.4%) |
| 4:00 PM to 11:59 PM | 0 (0.0%) | 0 (0.0%) |
| Total | 136 (100.0%) | 79 (100.0%) |
Housing Occupancy in Acacia Villas
Occupancy by Ownership in Acacia Villas
Of the total 85 dwellings in Acacia Villas, owner-occupied units account for 49 (57.7%), while renter-occupied units make up 36 (42.3%).
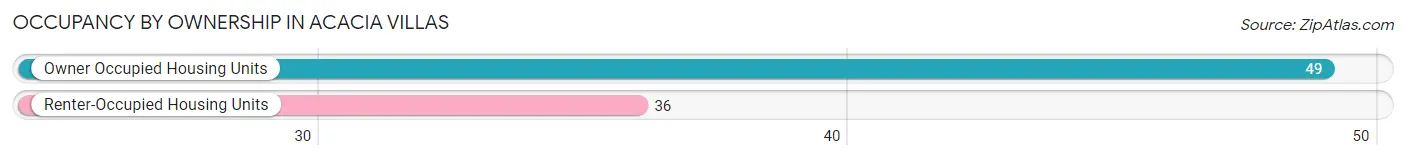
| Occupancy | # Housing Units | % Housing Units |
| Owner Occupied Housing Units | 49 | 57.7% |
| Renter-Occupied Housing Units | 36 | 42.3% |
| Total Occupied Housing Units | 85 | 100.0% |
Occupancy by Household Size in Acacia Villas
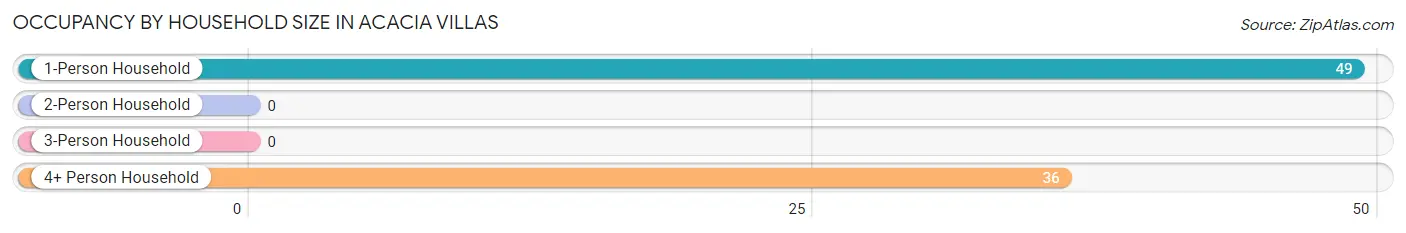
| Household Size | # Housing Units | % Housing Units |
| 1-Person Household | 49 | 57.7% |
| 2-Person Household | 0 | 0.0% |
| 3-Person Household | 0 | 0.0% |
| 4+ Person Household | 36 | 42.3% |
| Total Housing Units | 85 | 100.0% |
Occupancy by Ownership by Household Size in Acacia Villas
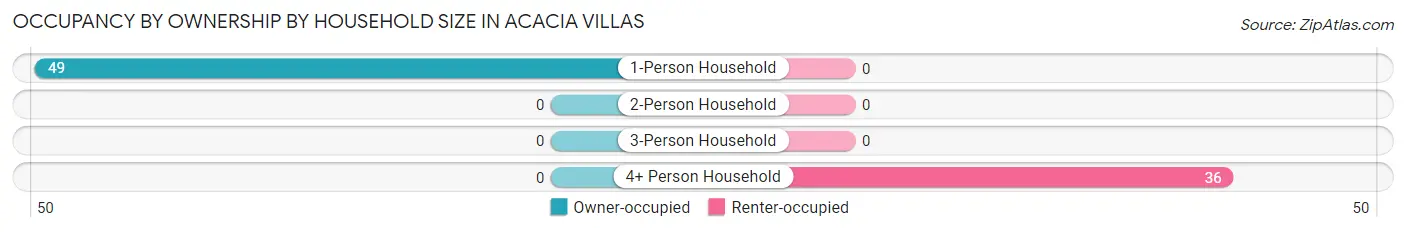
| Household Size | Owner-occupied | Renter-occupied |
| 1-Person Household | 49 (100.0%) | 0 (0.0%) |
| 2-Person Household | 0 (0.0%) | 0 (0.0%) |
| 3-Person Household | 0 (0.0%) | 0 (0.0%) |
| 4+ Person Household | 0 (0.0%) | 36 (100.0%) |
| Total Housing Units | 49 (57.7%) | 36 (42.3%) |
Occupancy by Educational Attainment in Acacia Villas
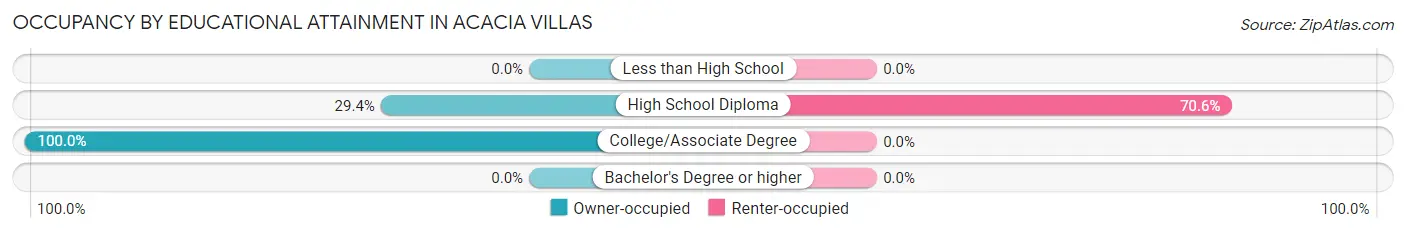
| Household Size | Owner-occupied | Renter-occupied |
| Less than High School | 0 (0.0%) | 0 (0.0%) |
| High School Diploma | 15 (29.4%) | 36 (70.6%) |
| College/Associate Degree | 34 (100.0%) | 0 (0.0%) |
| Bachelor's Degree or higher | 0 (0.0%) | 0 (0.0%) |
Occupancy by Age of Householder in Acacia Villas
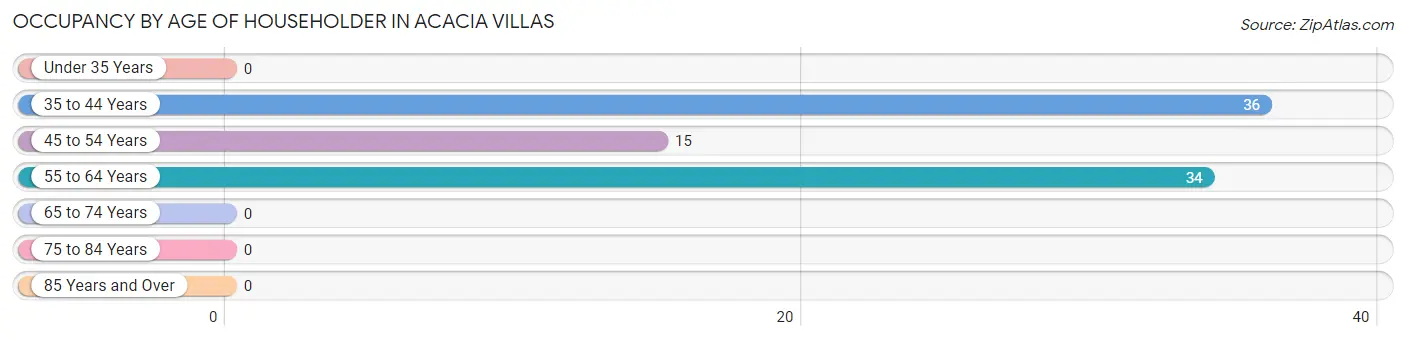
| Age Bracket | # Households | % Households |
| Under 35 Years | 0 | 0.0% |
| 35 to 44 Years | 36 | 42.3% |
| 45 to 54 Years | 15 | 17.6% |
| 55 to 64 Years | 34 | 40.0% |
| 65 to 74 Years | 0 | 0.0% |
| 75 to 84 Years | 0 | 0.0% |
| 85 Years and Over | 0 | 0.0% |
| Total | 85 | 100.0% |
Housing Finances in Acacia Villas
Median Income by Occupancy in Acacia Villas
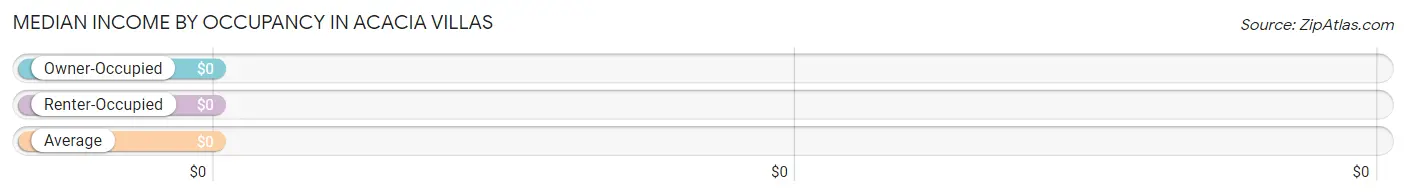
| Occupancy Type | # Households | Median Income |
| Owner-Occupied | 49 (57.7%) | $0 |
| Renter-Occupied | 36 (42.3%) | $0 |
| Average | 85 (100.0%) | $0 |
Occupancy by Householder Income Bracket in Acacia Villas
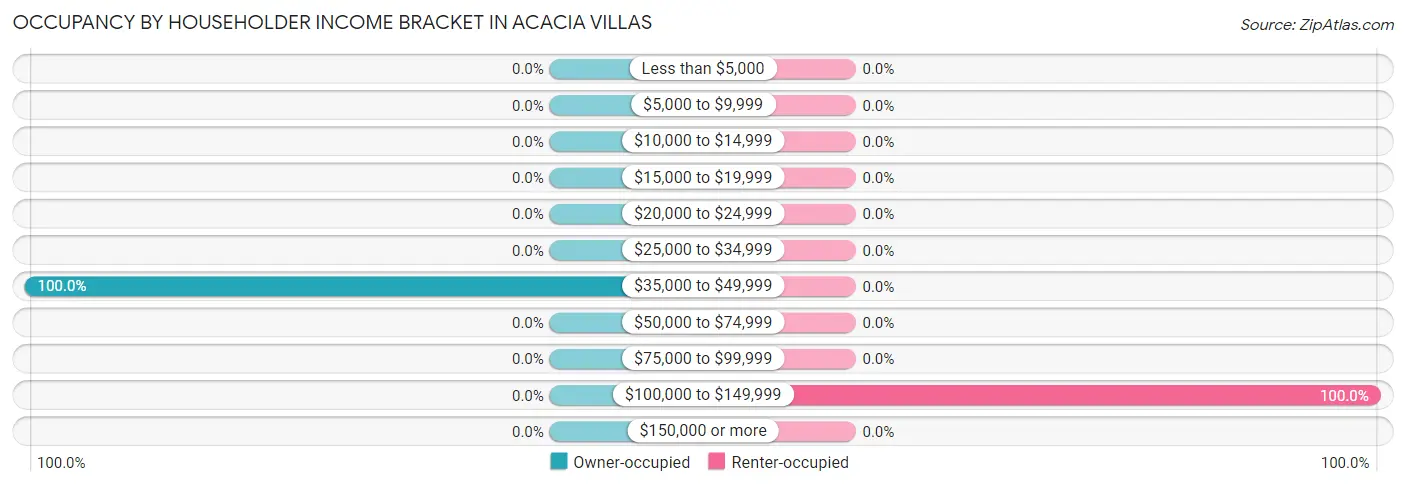
| Income Bracket | Owner-occupied | Renter-occupied |
| Less than $5,000 | 0 (0.0%) | 0 (0.0%) |
| $5,000 to $9,999 | 0 (0.0%) | 0 (0.0%) |
| $10,000 to $14,999 | 0 (0.0%) | 0 (0.0%) |
| $15,000 to $19,999 | 0 (0.0%) | 0 (0.0%) |
| $20,000 to $24,999 | 0 (0.0%) | 0 (0.0%) |
| $25,000 to $34,999 | 0 (0.0%) | 0 (0.0%) |
| $35,000 to $49,999 | 49 (100.0%) | 0 (0.0%) |
| $50,000 to $74,999 | 0 (0.0%) | 0 (0.0%) |
| $75,000 to $99,999 | 0 (0.0%) | 0 (0.0%) |
| $100,000 to $149,999 | 0 (0.0%) | 36 (100.0%) |
| $150,000 or more | 0 (0.0%) | 0 (0.0%) |
| Total | 49 (100.0%) | 36 (100.0%) |
Monthly Housing Cost Tiers in Acacia Villas
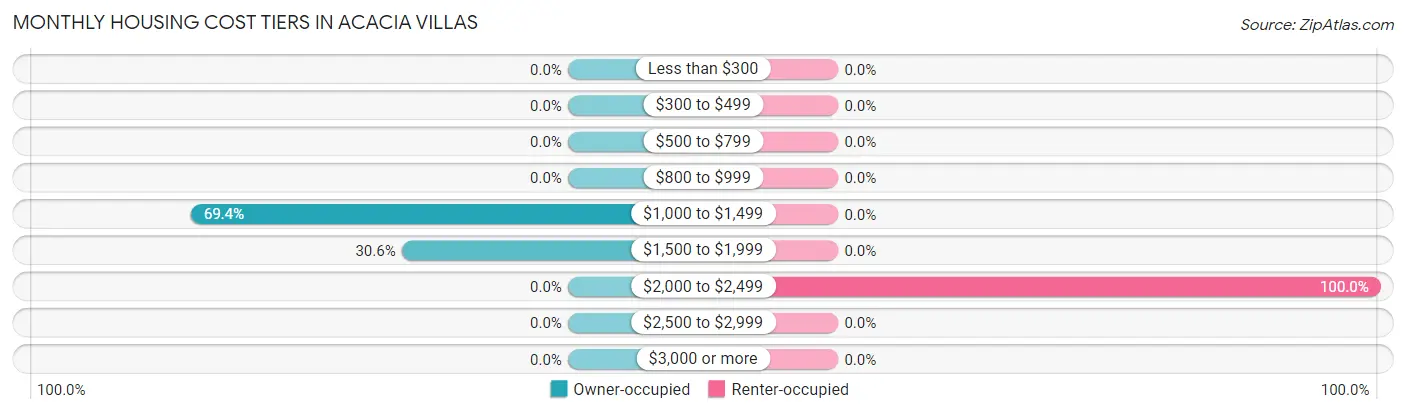
| Monthly Cost | Owner-occupied | Renter-occupied |
| Less than $300 | 0 (0.0%) | 0 (0.0%) |
| $300 to $499 | 0 (0.0%) | 0 (0.0%) |
| $500 to $799 | 0 (0.0%) | 0 (0.0%) |
| $800 to $999 | 0 (0.0%) | 0 (0.0%) |
| $1,000 to $1,499 | 34 (69.4%) | 0 (0.0%) |
| $1,500 to $1,999 | 15 (30.6%) | 0 (0.0%) |
| $2,000 to $2,499 | 0 (0.0%) | 36 (100.0%) |
| $2,500 to $2,999 | 0 (0.0%) | 0 (0.0%) |
| $3,000 or more | 0 (0.0%) | 0 (0.0%) |
| Total | 49 (100.0%) | 36 (100.0%) |
Physical Housing Characteristics in Acacia Villas
Housing Structures in Acacia Villas
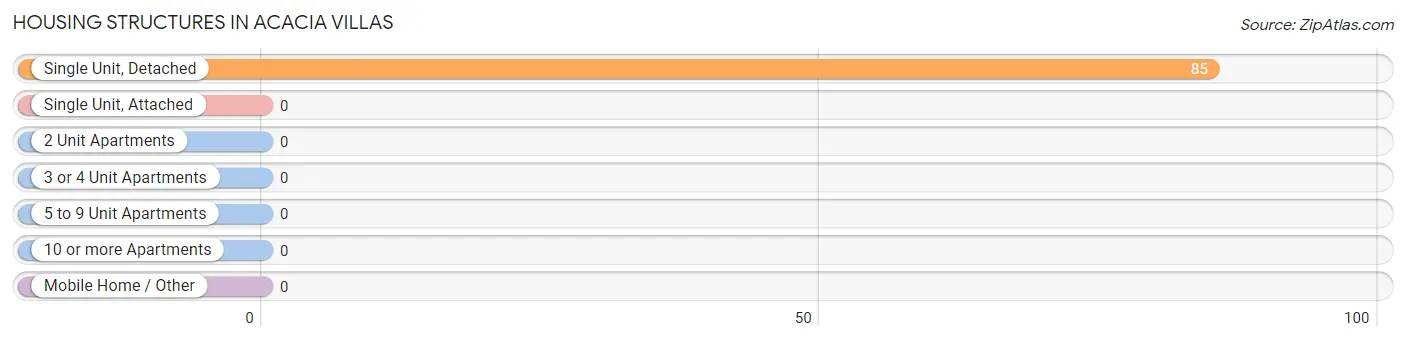
| Structure Type | # Housing Units | % Housing Units |
| Single Unit, Detached | 85 | 100.0% |
| Single Unit, Attached | 0 | 0.0% |
| 2 Unit Apartments | 0 | 0.0% |
| 3 or 4 Unit Apartments | 0 | 0.0% |
| 5 to 9 Unit Apartments | 0 | 0.0% |
| 10 or more Apartments | 0 | 0.0% |
| Mobile Home / Other | 0 | 0.0% |
| Total | 85 | 100.0% |
Housing Structures by Occupancy in Acacia Villas
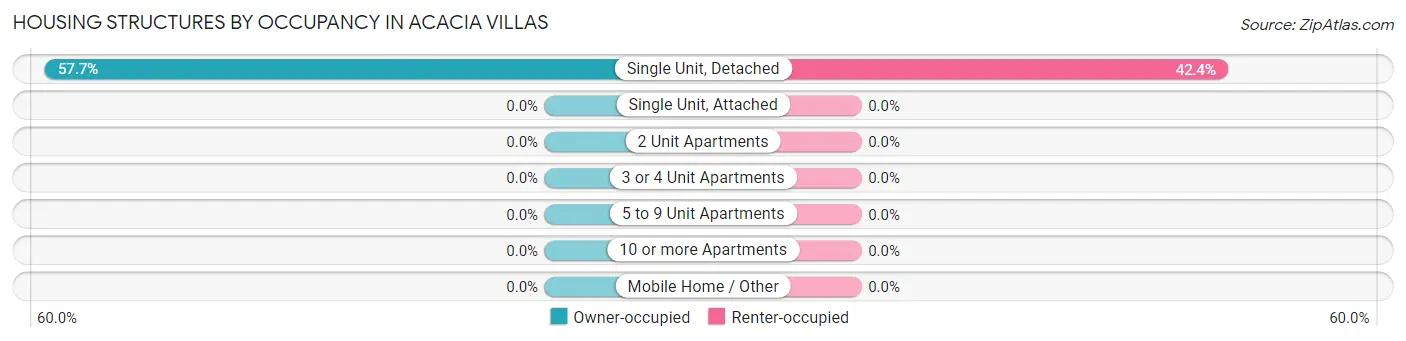
| Structure Type | Owner-occupied | Renter-occupied |
| Single Unit, Detached | 49 (57.7%) | 36 (42.3%) |
| Single Unit, Attached | 0 (0.0%) | 0 (0.0%) |
| 2 Unit Apartments | 0 (0.0%) | 0 (0.0%) |
| 3 or 4 Unit Apartments | 0 (0.0%) | 0 (0.0%) |
| 5 to 9 Unit Apartments | 0 (0.0%) | 0 (0.0%) |
| 10 or more Apartments | 0 (0.0%) | 0 (0.0%) |
| Mobile Home / Other | 0 (0.0%) | 0 (0.0%) |
| Total | 49 (57.7%) | 36 (42.3%) |
Housing Structures by Number of Rooms in Acacia Villas
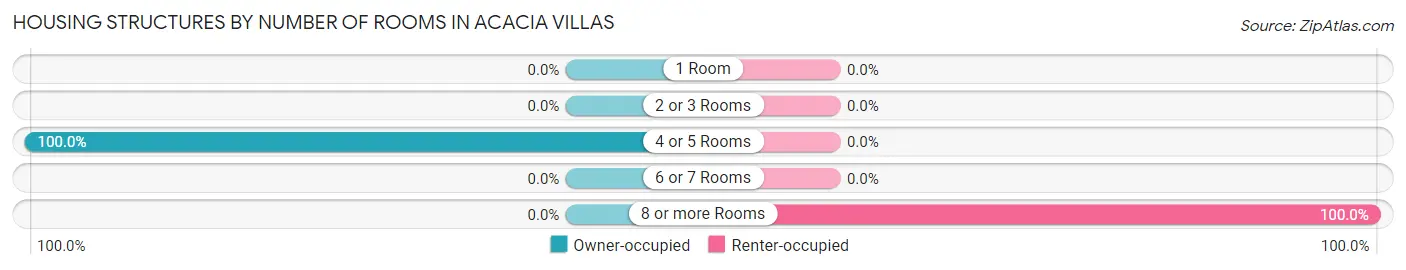
| Number of Rooms | Owner-occupied | Renter-occupied |
| 1 Room | 0 (0.0%) | 0 (0.0%) |
| 2 or 3 Rooms | 0 (0.0%) | 0 (0.0%) |
| 4 or 5 Rooms | 49 (100.0%) | 0 (0.0%) |
| 6 or 7 Rooms | 0 (0.0%) | 0 (0.0%) |
| 8 or more Rooms | 0 (0.0%) | 36 (100.0%) |
| Total | 49 (100.0%) | 36 (100.0%) |
Housing Structure by Heating Type in Acacia Villas
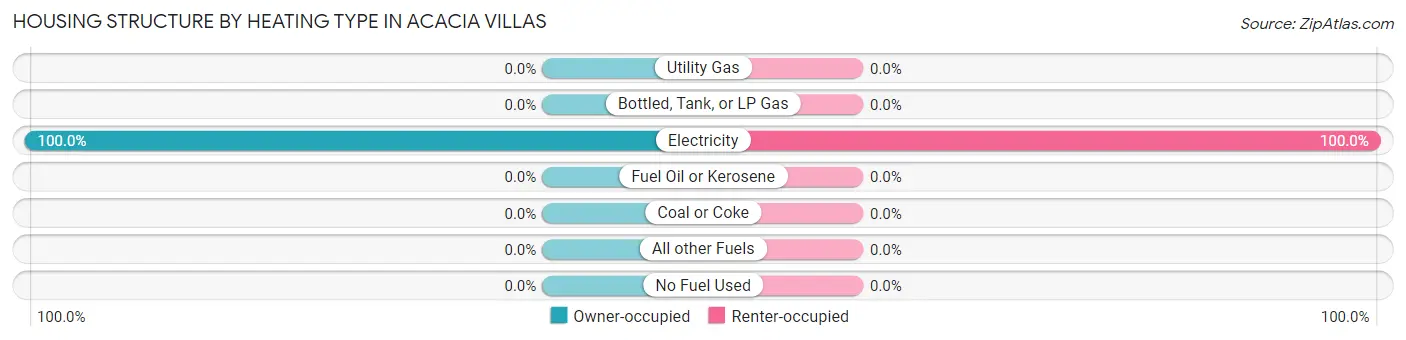
| Heating Type | Owner-occupied | Renter-occupied |
| Utility Gas | 0 (0.0%) | 0 (0.0%) |
| Bottled, Tank, or LP Gas | 0 (0.0%) | 0 (0.0%) |
| Electricity | 49 (100.0%) | 36 (100.0%) |
| Fuel Oil or Kerosene | 0 (0.0%) | 0 (0.0%) |
| Coal or Coke | 0 (0.0%) | 0 (0.0%) |
| All other Fuels | 0 (0.0%) | 0 (0.0%) |
| No Fuel Used | 0 (0.0%) | 0 (0.0%) |
| Total | 49 (100.0%) | 36 (100.0%) |
Household Vehicle Usage in Acacia Villas
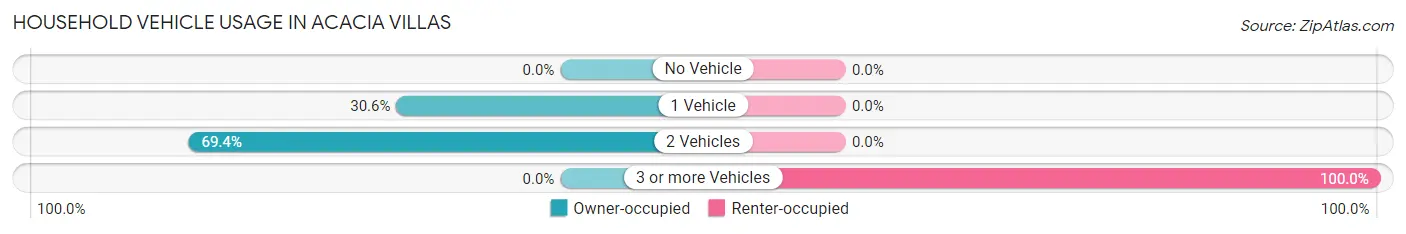
| Vehicles per Household | Owner-occupied | Renter-occupied |
| No Vehicle | 0 (0.0%) | 0 (0.0%) |
| 1 Vehicle | 15 (30.6%) | 0 (0.0%) |
| 2 Vehicles | 34 (69.4%) | 0 (0.0%) |
| 3 or more Vehicles | 0 (0.0%) | 36 (100.0%) |
| Total | 49 (100.0%) | 36 (100.0%) |
Real Estate & Mortgages in Acacia Villas
Real Estate and Mortgage Overview in Acacia Villas
| Characteristic | Without Mortgage | With Mortgage |
| Housing Units | 0 | 49 |
| Median Property Value | - | - |
| Median Household Income | - | - |
| Monthly Housing Costs | - | - |
| Real Estate Taxes | - | - |
Property Value by Mortgage Status in Acacia Villas
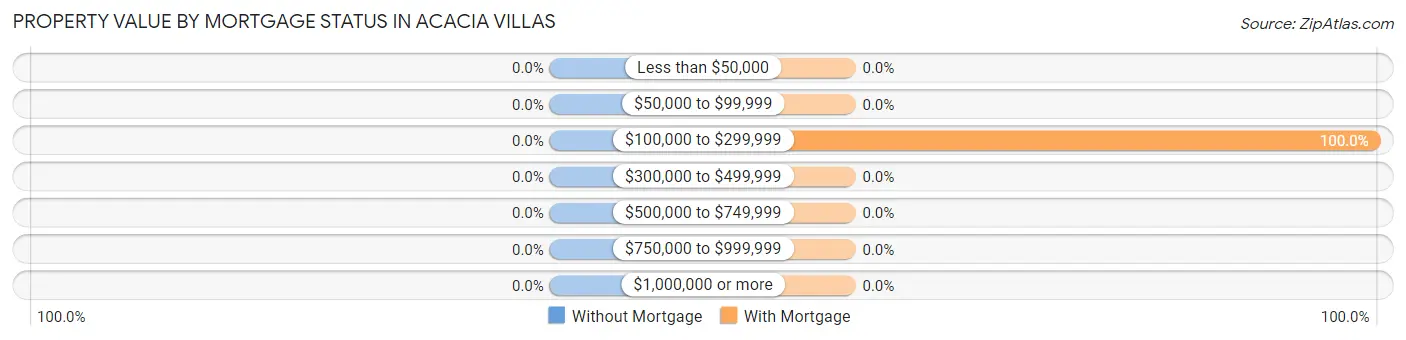
| Property Value | Without Mortgage | With Mortgage |
| Less than $50,000 | 0 (0.0%) | 0 (0.0%) |
| $50,000 to $99,999 | 0 (0.0%) | 0 (0.0%) |
| $100,000 to $299,999 | 0 (0.0%) | 49 (100.0%) |
| $300,000 to $499,999 | 0 (0.0%) | 0 (0.0%) |
| $500,000 to $749,999 | 0 (0.0%) | 0 (0.0%) |
| $750,000 to $999,999 | 0 (0.0%) | 0 (0.0%) |
| $1,000,000 or more | 0 (0.0%) | 0 (0.0%) |
| Total | 0 (0.0%) | 49 (100.0%) |
Household Income by Mortgage Status in Acacia Villas
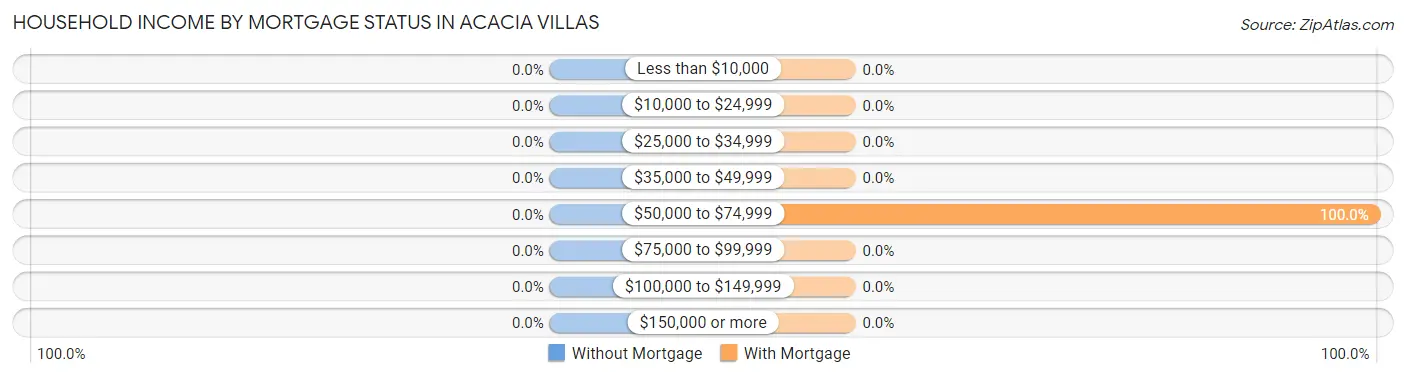
| Household Income | Without Mortgage | With Mortgage |
| Less than $10,000 | 0 (0.0%) | 0 (0.0%) |
| $10,000 to $24,999 | 0 (0.0%) | 0 (0.0%) |
| $25,000 to $34,999 | 0 (0.0%) | 0 (0.0%) |
| $35,000 to $49,999 | 0 (0.0%) | 0 (0.0%) |
| $50,000 to $74,999 | 0 (0.0%) | 49 (100.0%) |
| $75,000 to $99,999 | 0 (0.0%) | 0 (0.0%) |
| $100,000 to $149,999 | 0 (0.0%) | 0 (0.0%) |
| $150,000 or more | 0 (0.0%) | 0 (0.0%) |
| Total | 0 (0.0%) | 49 (100.0%) |
Property Value to Household Income Ratio in Acacia Villas
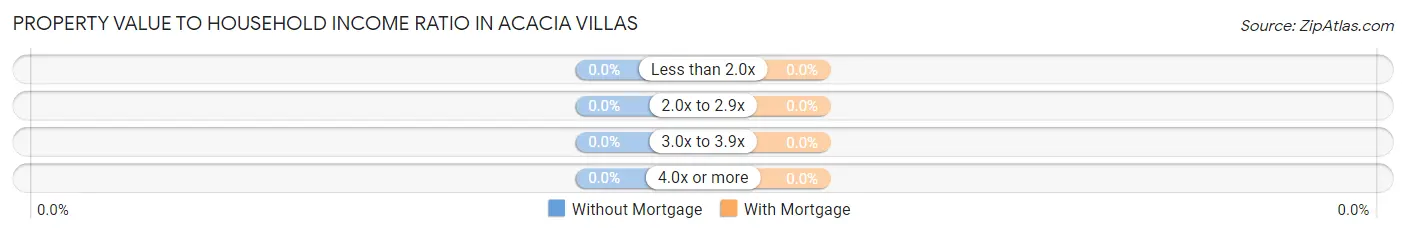
| Value-to-Income Ratio | Without Mortgage | With Mortgage |
| Less than 2.0x | 0 (0.0%) | 0 (0.0%) |
| 2.0x to 2.9x | 0 (0.0%) | 0 (0.0%) |
| 3.0x to 3.9x | 0 (0.0%) | 0 (0.0%) |
| 4.0x or more | 0 (0.0%) | 0 (0.0%) |
| Total | 0 (0.0%) | 49 (100.0%) |
Real Estate Taxes by Mortgage Status in Acacia Villas
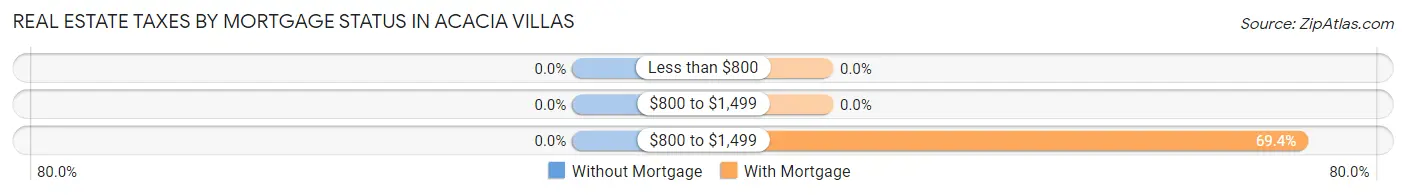
| Property Taxes | Without Mortgage | With Mortgage |
| Less than $800 | 0 (0.0%) | 0 (0.0%) |
| $800 to $1,499 | 0 (0.0%) | 0 (0.0%) |
| $800 to $1,499 | 0 (0.0%) | 34 (69.4%) |
| Total | 0 (0.0%) | 49 (100.0%) |
Health & Disability in Acacia Villas
Health Insurance Coverage by Age in Acacia Villas
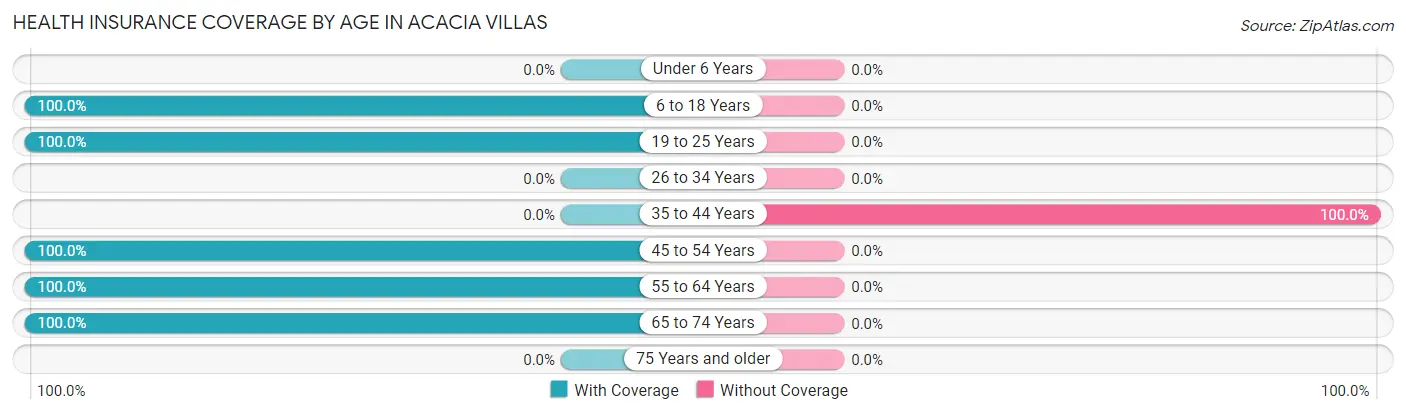
| Age Bracket | With Coverage | Without Coverage |
| Under 6 Years | 0 (0.0%) | 0 (0.0%) |
| 6 to 18 Years | 189 (100.0%) | 0 (0.0%) |
| 19 to 25 Years | 45 (100.0%) | 0 (0.0%) |
| 26 to 34 Years | 0 (0.0%) | 0 (0.0%) |
| 35 to 44 Years | 0 (0.0%) | 78 (100.0%) |
| 45 to 54 Years | 15 (100.0%) | 0 (0.0%) |
| 55 to 64 Years | 34 (100.0%) | 0 (0.0%) |
| 65 to 74 Years | 2 (100.0%) | 0 (0.0%) |
| 75 Years and older | 0 (0.0%) | 0 (0.0%) |
| Total | 285 (78.5%) | 78 (21.5%) |
Health Insurance Coverage by Citizenship Status in Acacia Villas
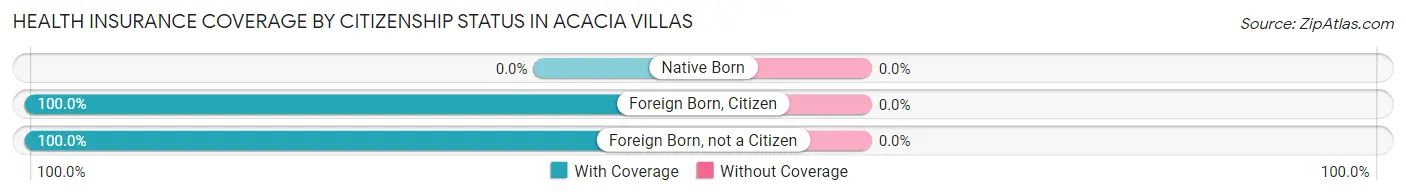
| Citizenship Status | With Coverage | Without Coverage |
| Native Born | 0 (0.0%) | 0 (0.0%) |
| Foreign Born, Citizen | 189 (100.0%) | 0 (0.0%) |
| Foreign Born, not a Citizen | 45 (100.0%) | 0 (0.0%) |
Health Insurance Coverage by Household Income in Acacia Villas
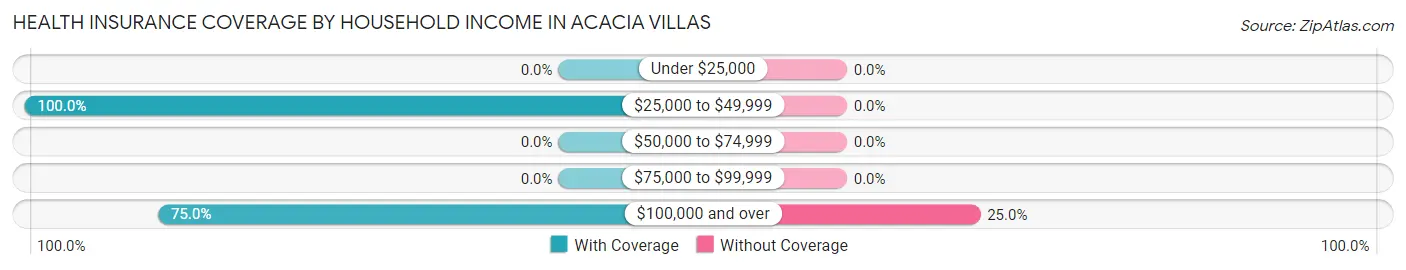
| Household Income | With Coverage | Without Coverage |
| Under $25,000 | 0 (0.0%) | 0 (0.0%) |
| $25,000 to $49,999 | 49 (100.0%) | 0 (0.0%) |
| $50,000 to $74,999 | 0 (0.0%) | 0 (0.0%) |
| $75,000 to $99,999 | 0 (0.0%) | 0 (0.0%) |
| $100,000 and over | 234 (75.0%) | 78 (25.0%) |
Public vs Private Health Insurance Coverage by Age in Acacia Villas
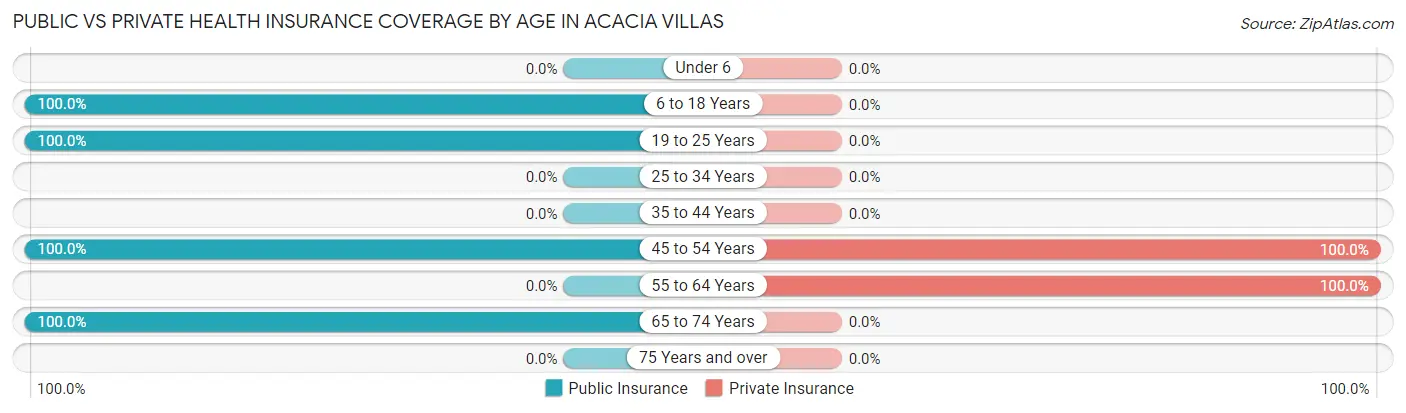
| Age Bracket | Public Insurance | Private Insurance |
| Under 6 | 0 (0.0%) | 0 (0.0%) |
| 6 to 18 Years | 189 (100.0%) | 0 (0.0%) |
| 19 to 25 Years | 45 (100.0%) | 0 (0.0%) |
| 25 to 34 Years | 0 (0.0%) | 0 (0.0%) |
| 35 to 44 Years | 0 (0.0%) | 0 (0.0%) |
| 45 to 54 Years | 15 (100.0%) | 15 (100.0%) |
| 55 to 64 Years | 0 (0.0%) | 34 (100.0%) |
| 65 to 74 Years | 2 (100.0%) | 0 (0.0%) |
| 75 Years and over | 0 (0.0%) | 0 (0.0%) |
| Total | 251 (69.2%) | 49 (13.5%) |
Disability Status by Sex by Age in Acacia Villas
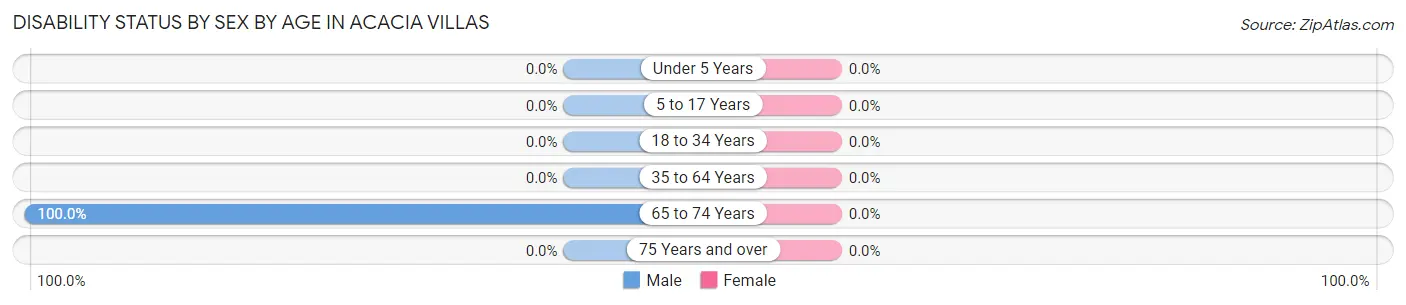
| Age Bracket | Male | Female |
| Under 5 Years | 0 (0.0%) | 0 (0.0%) |
| 5 to 17 Years | 0 (0.0%) | 0 (0.0%) |
| 18 to 34 Years | 0 (0.0%) | 0 (0.0%) |
| 35 to 64 Years | 0 (0.0%) | 0 (0.0%) |
| 65 to 74 Years | 2 (100.0%) | 0 (0.0%) |
| 75 Years and over | 0 (0.0%) | 0 (0.0%) |
Disability Class by Sex by Age in Acacia Villas
Disability Class: Hearing Difficulty
| Age Bracket | Male | Female |
| Under 5 Years | 0 (0.0%) | 0 (0.0%) |
| 5 to 17 Years | 0 (0.0%) | 0 (0.0%) |
| 18 to 34 Years | 0 (0.0%) | 0 (0.0%) |
| 35 to 64 Years | 0 (0.0%) | 0 (0.0%) |
| 65 to 74 Years | 0 (0.0%) | 0 (0.0%) |
| 75 Years and over | 0 (0.0%) | 0 (0.0%) |
Disability Class: Vision Difficulty
| Age Bracket | Male | Female |
| Under 5 Years | 0 (0.0%) | 0 (0.0%) |
| 5 to 17 Years | 0 (0.0%) | 0 (0.0%) |
| 18 to 34 Years | 0 (0.0%) | 0 (0.0%) |
| 35 to 64 Years | 0 (0.0%) | 0 (0.0%) |
| 65 to 74 Years | 2 (100.0%) | 0 (0.0%) |
| 75 Years and over | 0 (0.0%) | 0 (0.0%) |
Disability Class: Cognitive Difficulty
| Age Bracket | Male | Female |
| 5 to 17 Years | 0 (0.0%) | 0 (0.0%) |
| 18 to 34 Years | 0 (0.0%) | 0 (0.0%) |
| 35 to 64 Years | 0 (0.0%) | 0 (0.0%) |
| 65 to 74 Years | 0 (0.0%) | 0 (0.0%) |
| 75 Years and over | 0 (0.0%) | 0 (0.0%) |
Disability Class: Ambulatory Difficulty
| Age Bracket | Male | Female |
| 5 to 17 Years | 0 (0.0%) | 0 (0.0%) |
| 18 to 34 Years | 0 (0.0%) | 0 (0.0%) |
| 35 to 64 Years | 0 (0.0%) | 0 (0.0%) |
| 65 to 74 Years | 2 (100.0%) | 0 (0.0%) |
| 75 Years and over | 0 (0.0%) | 0 (0.0%) |
Disability Class: Self-Care Difficulty
| Age Bracket | Male | Female |
| 5 to 17 Years | 0 (0.0%) | 0 (0.0%) |
| 18 to 34 Years | 0 (0.0%) | 0 (0.0%) |
| 35 to 64 Years | 0 (0.0%) | 0 (0.0%) |
| 65 to 74 Years | 0 (0.0%) | 0 (0.0%) |
| 75 Years and over | 0 (0.0%) | 0 (0.0%) |
Technology Access in Acacia Villas
Computing Device Access in Acacia Villas
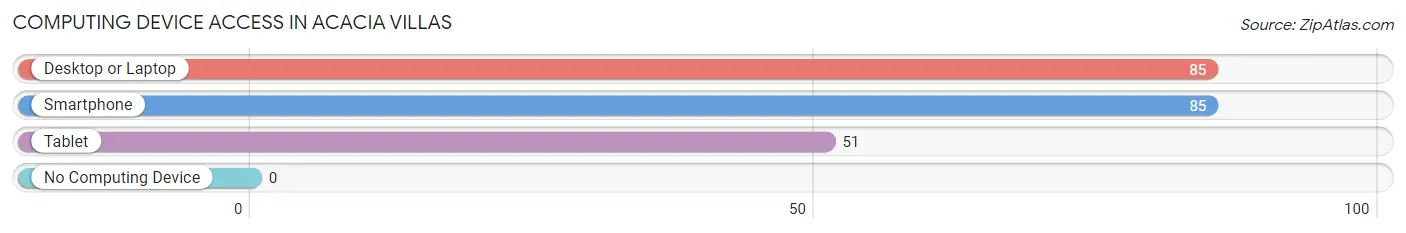
| Device Type | # Households | % Households |
| Desktop or Laptop | 85 | 100.0% |
| Smartphone | 85 | 100.0% |
| Tablet | 51 | 60.0% |
| No Computing Device | 0 | 0.0% |
| Total | 85 | 100.0% |
Internet Access in Acacia Villas
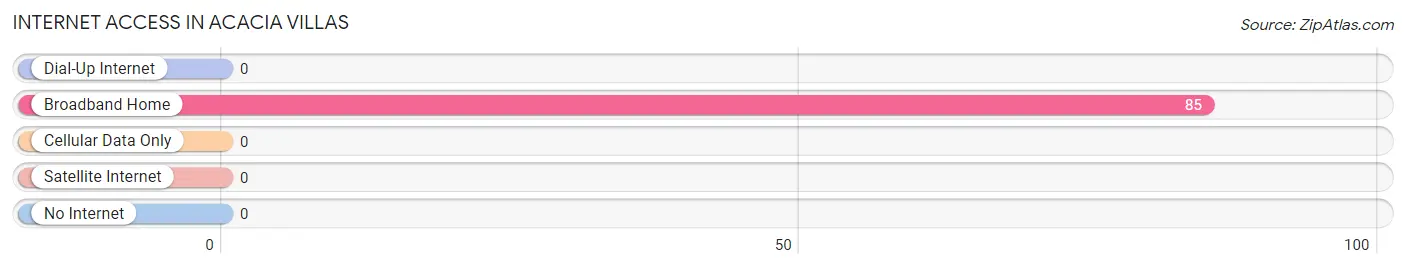
| Internet Type | # Households | % Households |
| Dial-Up Internet | 0 | 0.0% |
| Broadband Home | 85 | 100.0% |
| Cellular Data Only | 0 | 0.0% |
| Satellite Internet | 0 | 0.0% |
| No Internet | 0 | 0.0% |
| Total | 85 | 100.0% |
Acacia Villas Summary
Acacia Villas is a small, unincorporated community located in Miami-Dade County, Florida. It is situated in the southern part of the county, just north of the city of Miami. The community is bordered by the cities of Miami Gardens and Miami Lakes to the north, and by the cities of Hialeah and Miami Springs to the south. The population of Acacia Villas was estimated to be around 1,000 in 2020.
History
Acacia Villas was founded in the early 1950s by a group of Cuban immigrants who had fled their homeland during the Cuban Revolution. The community was originally known as “Villa Acacia” and was located in an area that was then part of unincorporated Dade County. The community was named after the Acacia tree, which is native to Cuba.
In the late 1950s, the area was annexed by the City of Miami and became part of the city’s Little Havana neighborhood. The area was then re-named Acacia Villas and became a predominantly Cuban-American community.
In the 1970s, the area began to experience a population shift as many of the original Cuban immigrants moved out of the area and were replaced by a growing number of Hispanic immigrants from other Latin American countries. This shift in population has continued to the present day, with the area now being home to a diverse mix of Hispanic and non-Hispanic residents.
Geography
Acacia Villas is located in the southern part of Miami-Dade County, just north of the city of Miami. The community is bordered by the cities of Miami Gardens and Miami Lakes to the north, and by the cities of Hialeah and Miami Springs to the south.
The area is characterized by flat terrain and is located at an elevation of approximately 10 feet above sea level. The climate in Acacia Villas is classified as tropical savanna, with hot and humid summers and mild winters.
Economy
The economy of Acacia Villas is largely based on the service industry, with many residents employed in the hospitality, retail, and healthcare sectors. The area is also home to a number of small businesses, including restaurants, grocery stores, and auto repair shops.
Demographics
As of 2020, the population of Acacia Villas was estimated to be around 1,000. The racial makeup of the community is predominantly Hispanic, with the majority of residents being of Cuban, Mexican, and Puerto Rican descent. The median household income in Acacia Villas is approximately $30,000, which is lower than the median income for Miami-Dade County as a whole. The area also has a higher than average poverty rate, with approximately 25% of residents living below the poverty line.
Common Questions
What is Per Capita Income in Acacia Villas?
Per Capita income in Acacia Villas is $17,030.
What is Inequality or Gini Index in Acacia Villas?
Inequality or Gini Index in Acacia Villas is 0.24.
What is the Total Population of Acacia Villas?
Total Population of Acacia Villas is 363.
What is the Total Male Population of Acacia Villas?
Total Male Population of Acacia Villas is 248.
What is the Total Female Population of Acacia Villas?
Total Female Population of Acacia Villas is 115.
What is the Ratio of Males per 100 Females in Acacia Villas?
There are 215.65 Males per 100 Females in Acacia Villas.
What is the Ratio of Females per 100 Males in Acacia Villas?
There are 46.37 Females per 100 Males in Acacia Villas.
What is the Median Population Age in Acacia Villas?
Median Population Age in Acacia Villas is 18.8 Years.
What is the Average Family Size in Acacia Villas
Average Family Size in Acacia Villas is 8.7 People.
What is the Average Household Size in Acacia Villas
Average Household Size in Acacia Villas is 4.2 People.
How Large is the Labor Force in Acacia Villas?
There are 215 People in the Labor Forcein in Acacia Villas.
What is the Percentage of People in the Labor Force in Acacia Villas?
85.0% of People are in the Labor Force in Acacia Villas.