Lake City, FL Map & Demographics
Lake City Map
Lake City Overview
$26,949
PER CAPITA INCOME
$63,399
AVG FAMILY INCOME
$46,172
AVG HOUSEHOLD INCOME
20.6%
WAGE / INCOME GAP [ % ]
79.4¢/ $1
WAGE / INCOME GAP [ $ ]
$9,026
FAMILY INCOME DEFICIT
0.53
INEQUALITY / GINI INDEX
12,307
TOTAL POPULATION
5,883
MALE POPULATION
6,424
FEMALE POPULATION
91.58
MALES / 100 FEMALES
109.20
FEMALES / 100 MALES
37.9
MEDIAN AGE
3.2
AVG FAMILY SIZE
2.4
AVG HOUSEHOLD SIZE
5,295
LABOR FORCE [ PEOPLE ]
56.1%
PERCENT IN LABOR FORCE
5.4%
UNEMPLOYMENT RATE
Lake City Area Codes
Income in Lake City
Income Overview in Lake City
Per Capita Income in Lake City is $26,949, while median incomes of families and households are $63,399 and $46,172 respectively.
| Characteristic | Number | Measure |
| Per Capita Income | 12,307 | $26,949 |
| Median Family Income | 2,630 | $63,399 |
| Mean Family Income | 2,630 | $83,620 |
| Median Household Income | 4,869 | $46,172 |
| Mean Household Income | 4,869 | $68,799 |
| Income Deficit | 2,630 | $9,026 |
| Wage / Income Gap (%) | 12,307 | 20.64% |
| Wage / Income Gap ($) | 12,307 | 79.36¢ per $1 |
| Gini / Inequality Index | 12,307 | 0.53 |
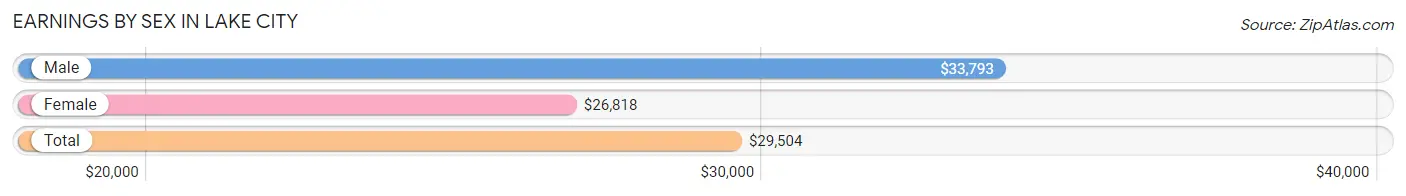
Earnings by Sex in Lake City
Average Earnings in Lake City are $29,504, $33,793 for men and $26,818 for women, a difference of 20.6%.
| Sex | Number | Average Earnings |
| Male | 2,344 (42.7%) | $33,793 |
| Female | 3,150 (57.3%) | $26,818 |
| Total | 5,494 (100.0%) | $29,504 |
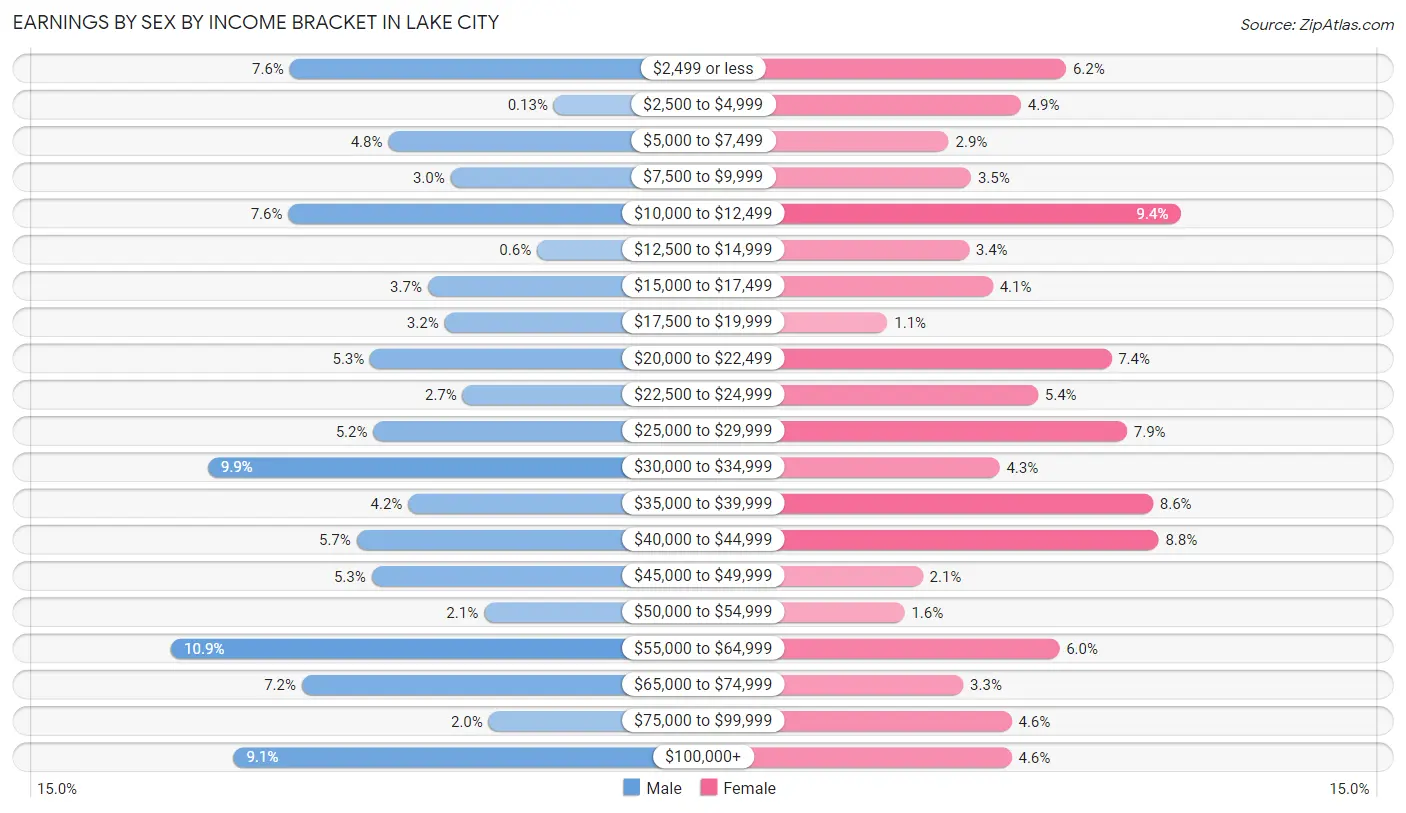
Earnings by Sex by Income Bracket in Lake City
The most common earnings brackets in Lake City are $55,000 to $64,999 for men (255 | 10.9%) and $10,000 to $12,499 for women (295 | 9.4%).
| Income | Male | Female |
| $2,499 or less | 177 (7.5%) | 194 (6.2%) |
| $2,500 to $4,999 | 3 (0.1%) | 154 (4.9%) |
| $5,000 to $7,499 | 112 (4.8%) | 90 (2.9%) |
| $7,500 to $9,999 | 71 (3.0%) | 110 (3.5%) |
| $10,000 to $12,499 | 178 (7.6%) | 295 (9.4%) |
| $12,500 to $14,999 | 14 (0.6%) | 108 (3.4%) |
| $15,000 to $17,499 | 86 (3.7%) | 129 (4.1%) |
| $17,500 to $19,999 | 75 (3.2%) | 36 (1.1%) |
| $20,000 to $22,499 | 124 (5.3%) | 234 (7.4%) |
| $22,500 to $24,999 | 63 (2.7%) | 169 (5.4%) |
| $25,000 to $29,999 | 122 (5.2%) | 248 (7.9%) |
| $30,000 to $34,999 | 231 (9.9%) | 135 (4.3%) |
| $35,000 to $39,999 | 99 (4.2%) | 271 (8.6%) |
| $40,000 to $44,999 | 133 (5.7%) | 276 (8.8%) |
| $45,000 to $49,999 | 123 (5.2%) | 67 (2.1%) |
| $50,000 to $54,999 | 49 (2.1%) | 51 (1.6%) |
| $55,000 to $64,999 | 255 (10.9%) | 188 (6.0%) |
| $65,000 to $74,999 | 169 (7.2%) | 103 (3.3%) |
| $75,000 to $99,999 | 46 (2.0%) | 146 (4.6%) |
| $100,000+ | 214 (9.1%) | 146 (4.6%) |
| Total | 2,344 (100.0%) | 3,150 (100.0%) |
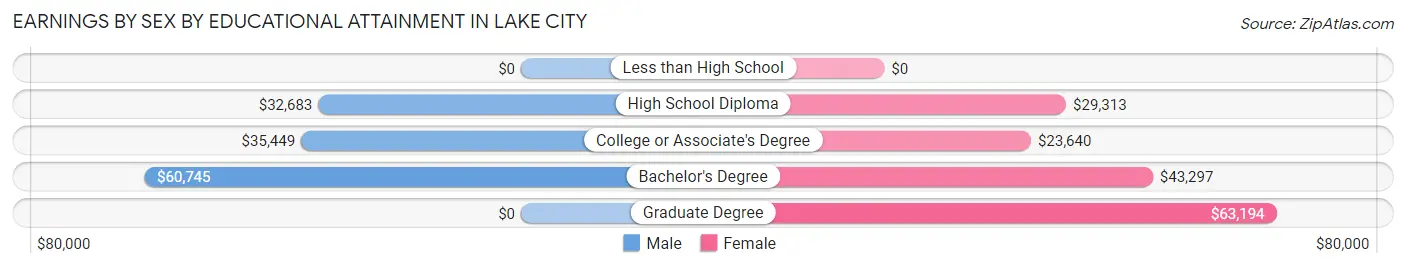
Earnings by Sex by Educational Attainment in Lake City
Average earnings in Lake City are $35,785 for men and $31,282 for women, a difference of 12.6%. Men with an educational attainment of bachelor's degree enjoy the highest average annual earnings of $60,745, while those with high school diploma education earn the least with $32,683. Women with an educational attainment of graduate degree earn the most with the average annual earnings of $63,194, while those with college or associate's degree education have the smallest earnings of $23,640.
| Educational Attainment | Male Income | Female Income |
| Less than High School | - | - |
| High School Diploma | $32,683 | $29,313 |
| College or Associate's Degree | $35,449 | $23,640 |
| Bachelor's Degree | $60,745 | $43,297 |
| Graduate Degree | - | - |
| Total | $35,785 | $31,282 |
Family Income in Lake City
Family Income Brackets in Lake City
According to the Lake City family income data, there are 610 families falling into the $50,000 to $74,999 income range, which is the most common income bracket and makes up 23.2% of all families. Conversely, the less than $10,000 income bracket is the least frequent group with only 58 families (2.2%) belonging to this category.
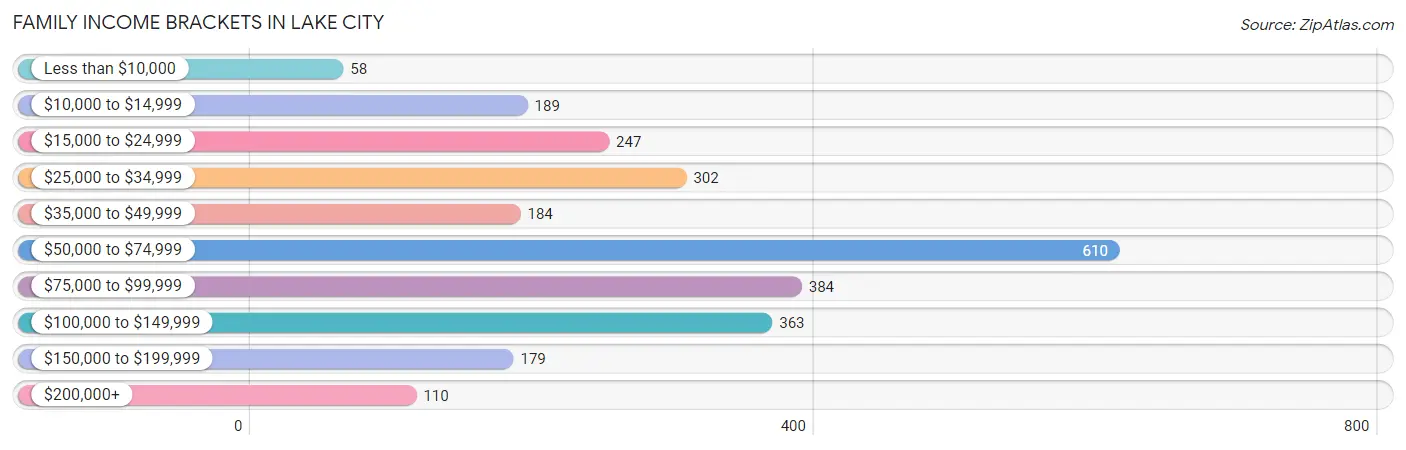
| Income Bracket | # Families | % Families |
| Less than $10,000 | 58 | 2.2% |
| $10,000 to $14,999 | 189 | 7.2% |
| $15,000 to $24,999 | 247 | 9.4% |
| $25,000 to $34,999 | 302 | 11.5% |
| $35,000 to $49,999 | 184 | 7.0% |
| $50,000 to $74,999 | 610 | 23.2% |
| $75,000 to $99,999 | 384 | 14.6% |
| $100,000 to $149,999 | 363 | 13.8% |
| $150,000 to $199,999 | 179 | 6.8% |
| $200,000+ | 110 | 4.2% |
Family Income by Famaliy Size in Lake City
4-person families (522 | 19.9%) account for the highest median family income in Lake City with $74,595 per family, while 2-person families (1,283 | 48.8%) have the highest median income of $31,543 per family member.
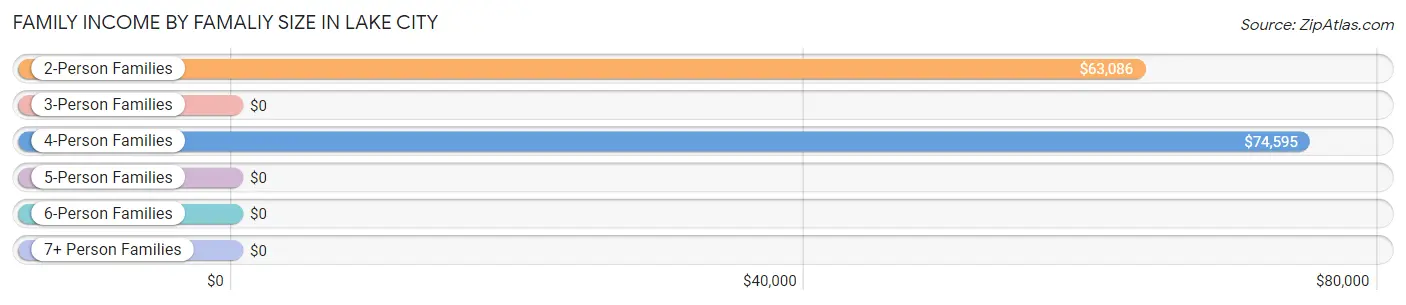
| Income Bracket | # Families | Median Income |
| 2-Person Families | 1,283 (48.8%) | $63,086 |
| 3-Person Families | 447 (17.0%) | $0 |
| 4-Person Families | 522 (19.9%) | $74,595 |
| 5-Person Families | 259 (9.9%) | $0 |
| 6-Person Families | 60 (2.3%) | $0 |
| 7+ Person Families | 59 (2.2%) | $0 |
| Total | 2,630 (100.0%) | $63,399 |
Family Income by Number of Earners in Lake City
The median family income in Lake City is $63,399, with families comprising 3+ earners (276) having the highest median family income of $97,188, while families with no earners (359) have the lowest median family income of $33,293, accounting for 10.5% and 13.7% of families, respectively.
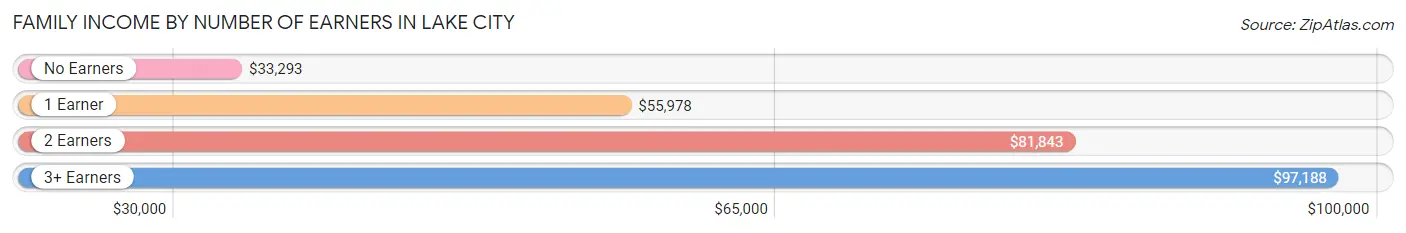
| Number of Earners | # Families | Median Income |
| No Earners | 359 (13.7%) | $33,293 |
| 1 Earner | 1,134 (43.1%) | $55,978 |
| 2 Earners | 861 (32.7%) | $81,843 |
| 3+ Earners | 276 (10.5%) | $97,188 |
| Total | 2,630 (100.0%) | $63,399 |
Household Income in Lake City
Household Income Brackets in Lake City
With 911 households falling in the category, the $50,000 to $74,999 income range is the most frequent in Lake City, accounting for 18.7% of all households. In contrast, only 161 households (3.3%) fall into the $200,000+ income bracket, making it the least populous group.
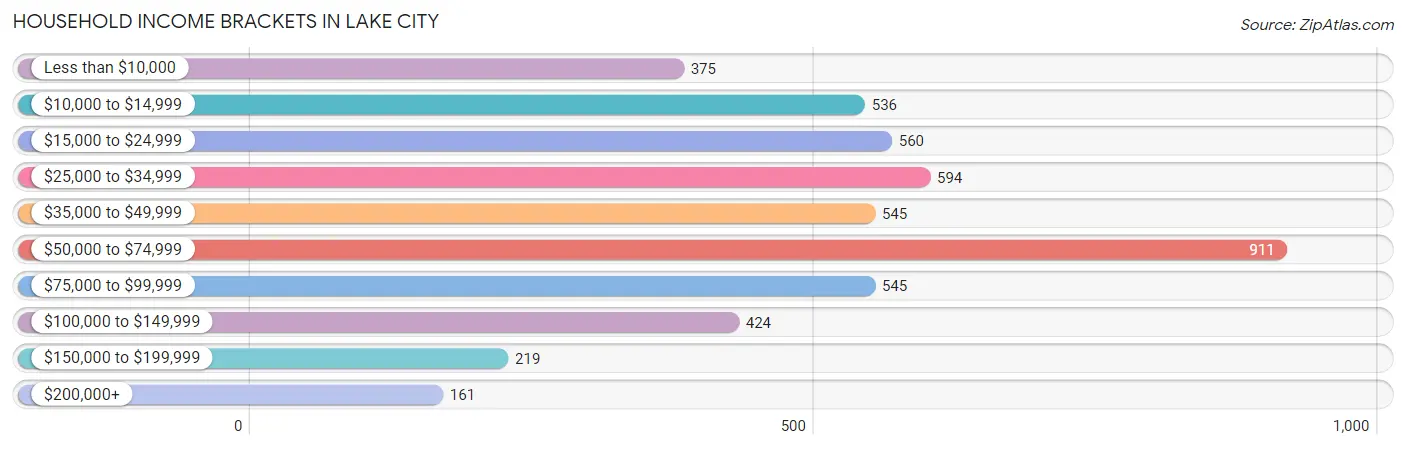
| Income Bracket | # Households | % Households |
| Less than $10,000 | 375 | 7.7% |
| $10,000 to $14,999 | 536 | 11.0% |
| $15,000 to $24,999 | 560 | 11.5% |
| $25,000 to $34,999 | 594 | 12.2% |
| $35,000 to $49,999 | 545 | 11.2% |
| $50,000 to $74,999 | 911 | 18.7% |
| $75,000 to $99,999 | 545 | 11.2% |
| $100,000 to $149,999 | 424 | 8.7% |
| $150,000 to $199,999 | 219 | 4.5% |
| $200,000+ | 161 | 3.3% |
Household Income by Householder Age in Lake City
The median household income in Lake City is $46,172, with the highest median household income of $50,938 found in the 45 to 64 years age bracket for the primary householder. A total of 1,582 households (32.5%) fall into this category. Meanwhile, the 15 to 24 years age bracket for the primary householder has the lowest median household income of $0, with 236 households (4.9%) in this group.
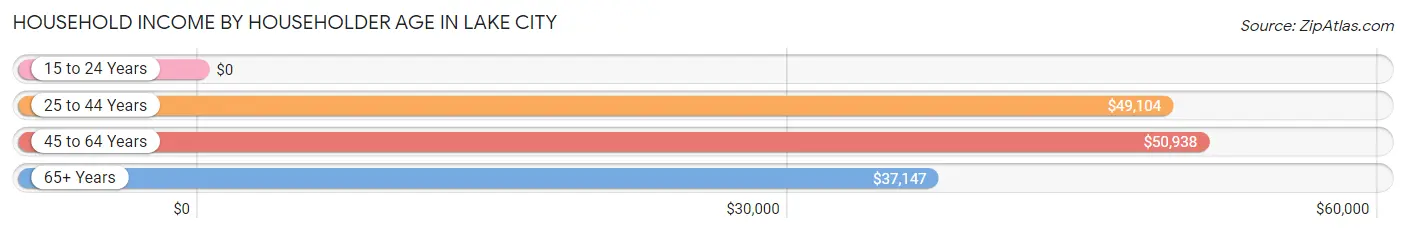
| Income Bracket | # Households | Median Income |
| 15 to 24 Years | 236 (4.9%) | $0 |
| 25 to 44 Years | 1,763 (36.2%) | $49,104 |
| 45 to 64 Years | 1,582 (32.5%) | $50,938 |
| 65+ Years | 1,288 (26.5%) | $37,147 |
| Total | 4,869 (100.0%) | $46,172 |
Poverty in Lake City
Income Below Poverty by Sex and Age in Lake City
With 30.0% poverty level for males and 16.9% for females among the residents of Lake City, 5 year old males and 35 to 44 year old females are the most vulnerable to poverty, with 82 males (100.0%) and 267 females (36.6%) in their respective age groups living below the poverty level.
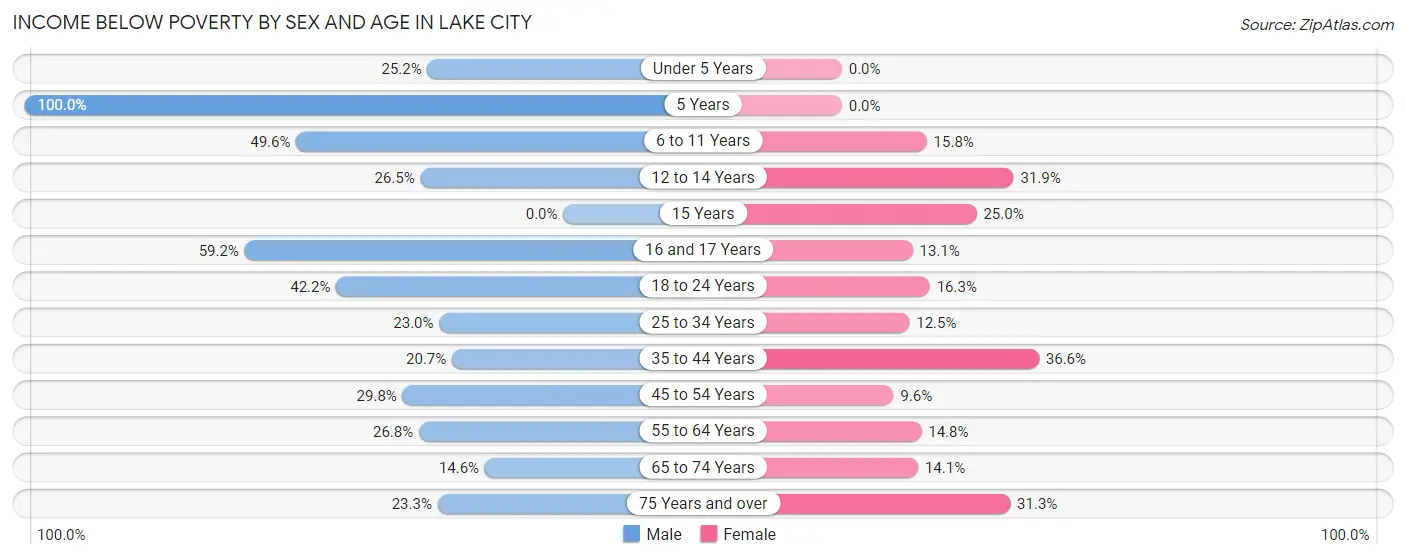
| Age Bracket | Male | Female |
| Under 5 Years | 120 (25.2%) | 0 (0.0%) |
| 5 Years | 82 (100.0%) | 0 (0.0%) |
| 6 to 11 Years | 286 (49.6%) | 89 (15.8%) |
| 12 to 14 Years | 57 (26.5%) | 51 (31.9%) |
| 15 Years | 0 (0.0%) | 19 (25.0%) |
| 16 and 17 Years | 126 (59.2%) | 18 (13.1%) |
| 18 to 24 Years | 161 (42.1%) | 109 (16.3%) |
| 25 to 34 Years | 127 (23.0%) | 91 (12.5%) |
| 35 to 44 Years | 187 (20.7%) | 267 (36.6%) |
| 45 to 54 Years | 105 (29.8%) | 71 (9.6%) |
| 55 to 64 Years | 177 (26.8%) | 109 (14.7%) |
| 65 to 74 Years | 71 (14.5%) | 82 (14.1%) |
| 75 Years and over | 80 (23.3%) | 135 (31.2%) |
| Total | 1,579 (30.0%) | 1,041 (16.9%) |
Income Above Poverty by Sex and Age in Lake City
According to the poverty statistics in Lake City, males aged 15 years and females aged under 5 years are the age groups that are most secure financially, with 100.0% of males and 100.0% of females in these age groups living above the poverty line.
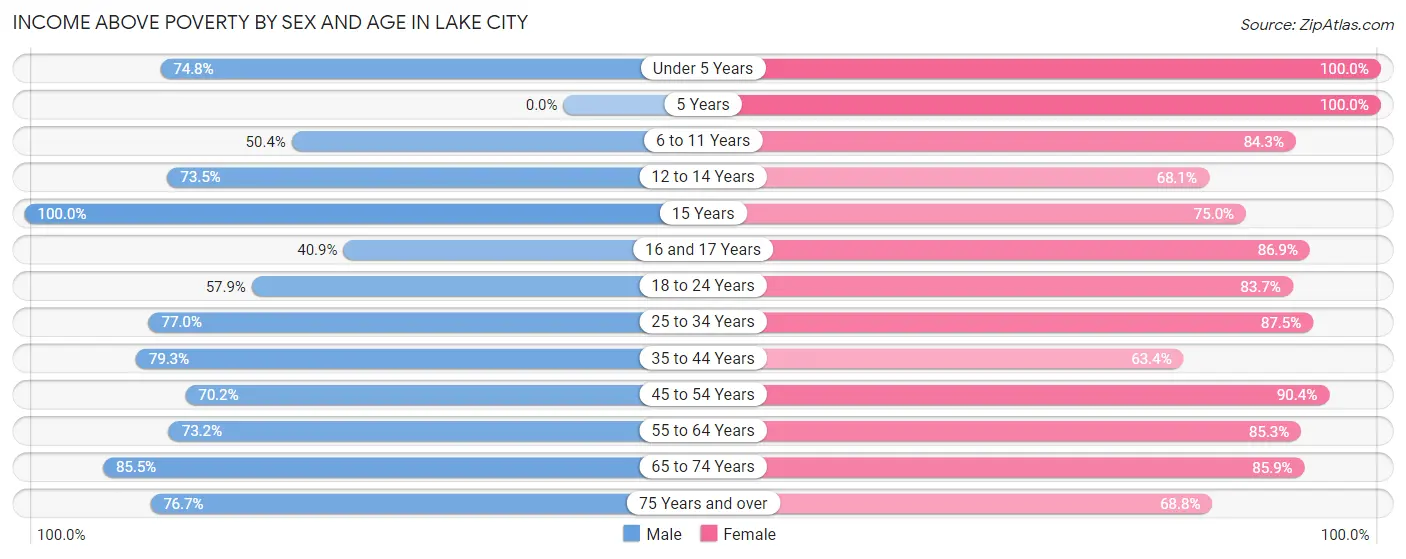
| Age Bracket | Male | Female |
| Under 5 Years | 356 (74.8%) | 488 (100.0%) |
| 5 Years | 0 (0.0%) | 115 (100.0%) |
| 6 to 11 Years | 291 (50.4%) | 476 (84.3%) |
| 12 to 14 Years | 158 (73.5%) | 109 (68.1%) |
| 15 Years | 23 (100.0%) | 57 (75.0%) |
| 16 and 17 Years | 87 (40.8%) | 119 (86.9%) |
| 18 to 24 Years | 221 (57.9%) | 559 (83.7%) |
| 25 to 34 Years | 425 (77.0%) | 635 (87.5%) |
| 35 to 44 Years | 718 (79.3%) | 463 (63.4%) |
| 45 to 54 Years | 247 (70.2%) | 670 (90.4%) |
| 55 to 64 Years | 484 (73.2%) | 630 (85.3%) |
| 65 to 74 Years | 417 (85.5%) | 498 (85.9%) |
| 75 Years and over | 263 (76.7%) | 297 (68.8%) |
| Total | 3,690 (70.0%) | 5,116 (83.1%) |
Income Below Poverty Among Married-Couple Families in Lake City
The poverty statistics for married-couple families in Lake City show that 5.5% or 78 of the total 1,413 families live below the poverty line. Families with 1 or 2 children have the highest poverty rate of 6.6%, comprising of 39 families. On the other hand, families with 3 or 4 children have the lowest poverty rate of 0.0%, which includes 0 families.
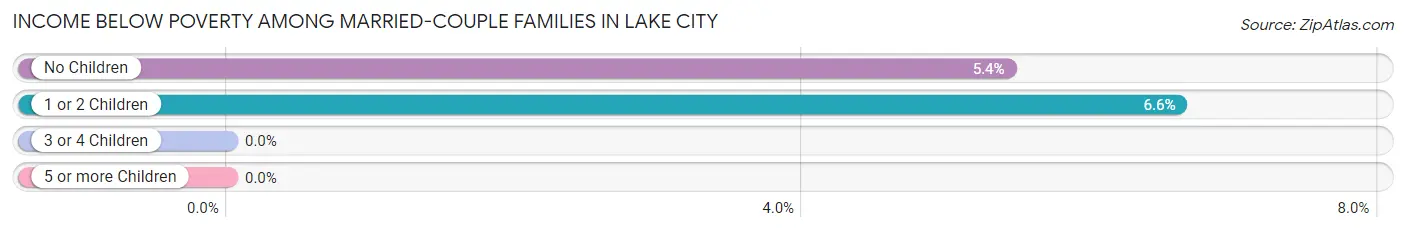
| Children | Above Poverty | Below Poverty |
| No Children | 680 (94.6%) | 39 (5.4%) |
| 1 or 2 Children | 551 (93.4%) | 39 (6.6%) |
| 3 or 4 Children | 45 (100.0%) | 0 (0.0%) |
| 5 or more Children | 59 (100.0%) | 0 (0.0%) |
| Total | 1,335 (94.5%) | 78 (5.5%) |
Income Below Poverty Among Single-Parent Households in Lake City
According to the poverty data in Lake City, 33.3% or 80 single-father households and 30.8% or 301 single-mother households are living below the poverty line. Among single-father households, those with no children have the highest poverty rate, with 48 households (38.7%) experiencing poverty. Likewise, among single-mother households, those with 3 or 4 children have the highest poverty rate, with 139 households (75.1%) falling below the poverty line.
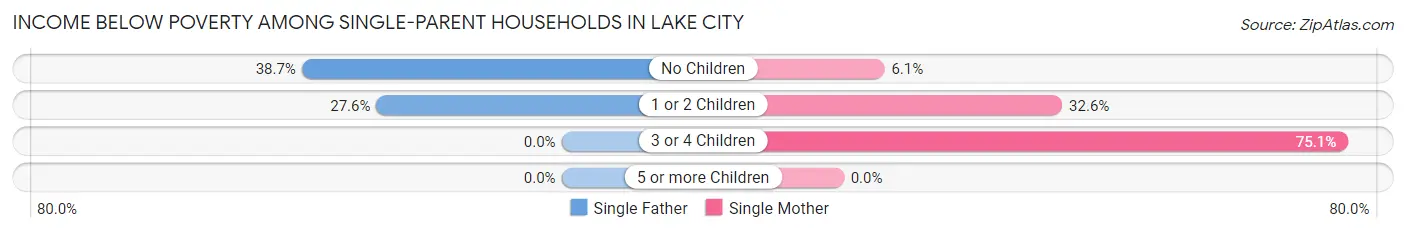
| Children | Single Father | Single Mother |
| No Children | 48 (38.7%) | 22 (6.1%) |
| 1 or 2 Children | 32 (27.6%) | 140 (32.6%) |
| 3 or 4 Children | 0 (0.0%) | 139 (75.1%) |
| 5 or more Children | 0 (0.0%) | 0 (0.0%) |
| Total | 80 (33.3%) | 301 (30.8%) |
Income Below Poverty Among Married-Couple vs Single-Parent Households in Lake City
The poverty data for Lake City shows that 78 of the married-couple family households (5.5%) and 381 of the single-parent households (31.3%) are living below the poverty level. Within the married-couple family households, those with 1 or 2 children have the highest poverty rate, with 39 households (6.6%) falling below the poverty line. Among the single-parent households, those with 3 or 4 children have the highest poverty rate, with 139 household (75.1%) living below poverty.
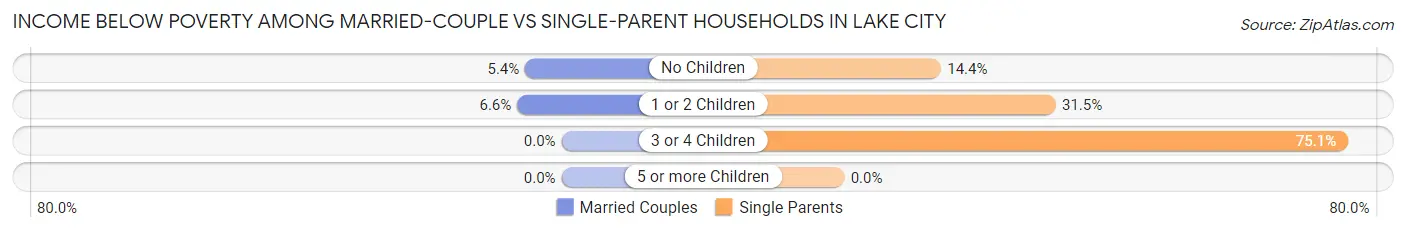
| Children | Married-Couple Families | Single-Parent Households |
| No Children | 39 (5.4%) | 70 (14.4%) |
| 1 or 2 Children | 39 (6.6%) | 172 (31.5%) |
| 3 or 4 Children | 0 (0.0%) | 139 (75.1%) |
| 5 or more Children | 0 (0.0%) | 0 (0.0%) |
| Total | 78 (5.5%) | 381 (31.3%) |
Race in Lake City
The most populous races in Lake City are White / Caucasian (6,619 | 53.8%), Black / African American (4,429 | 36.0%), and Two or more Races (851 | 6.9%).
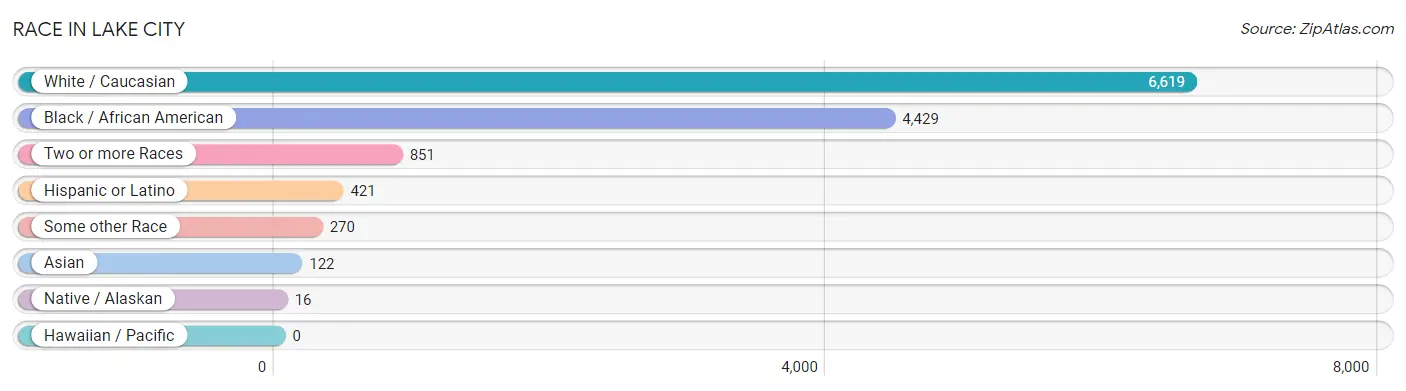
| Race | # Population | % Population |
| Asian | 122 | 1.0% |
| Black / African American | 4,429 | 36.0% |
| Hawaiian / Pacific | 0 | 0.0% |
| Hispanic or Latino | 421 | 3.4% |
| Native / Alaskan | 16 | 0.1% |
| White / Caucasian | 6,619 | 53.8% |
| Two or more Races | 851 | 6.9% |
| Some other Race | 270 | 2.2% |
| Total | 12,307 | 100.0% |
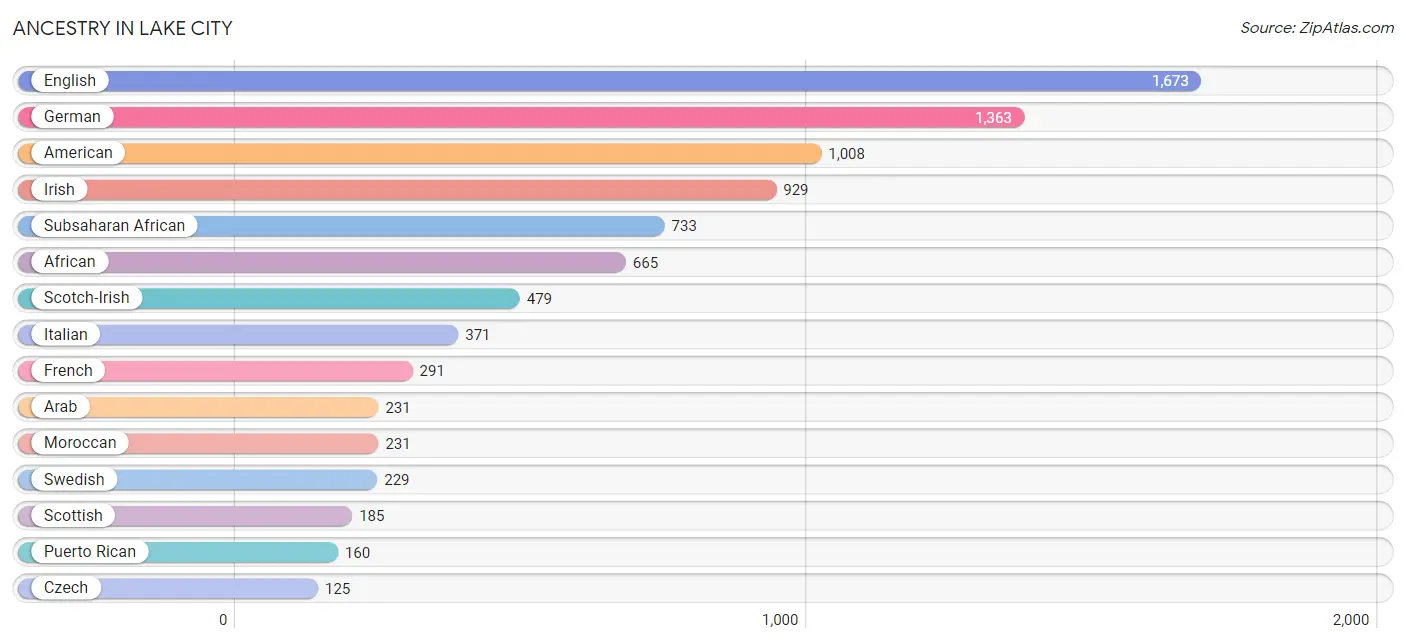
Ancestry in Lake City
The most populous ancestries reported in Lake City are English (1,673 | 13.6%), German (1,363 | 11.1%), American (1,008 | 8.2%), Irish (929 | 7.5%), and Subsaharan African (733 | 6.0%), together accounting for 46.4% of all Lake City residents.
| Ancestry | # Population | % Population |
| African | 665 | 5.4% |
| American | 1,008 | 8.2% |
| Arab | 231 | 1.9% |
| Australian | 16 | 0.1% |
| Barbadian | 48 | 0.4% |
| Brazilian | 35 | 0.3% |
| British | 95 | 0.8% |
| Canadian | 21 | 0.2% |
| Celtic | 10 | 0.1% |
| Cherokee | 28 | 0.2% |
| Chilean | 3 | 0.0% |
| Chippewa | 1 | 0.0% |
| Choctaw | 9 | 0.1% |
| Colombian | 1 | 0.0% |
| Creek | 4 | 0.0% |
| Cuban | 16 | 0.1% |
| Czech | 125 | 1.0% |
| Danish | 10 | 0.1% |
| Dominican | 4 | 0.0% |
| Dutch | 119 | 1.0% |
| Eastern European | 47 | 0.4% |
| English | 1,673 | 13.6% |
| European | 90 | 0.7% |
| French | 291 | 2.4% |
| French American Indian | 10 | 0.1% |
| French Canadian | 40 | 0.3% |
| German | 1,363 | 11.1% |
| Greek | 53 | 0.4% |
| Haitian | 25 | 0.2% |
| Hungarian | 28 | 0.2% |
| Irish | 929 | 7.5% |
| Italian | 371 | 3.0% |
| Jamaican | 113 | 0.9% |
| Korean | 89 | 0.7% |
| Lithuanian | 44 | 0.4% |
| Mexican | 95 | 0.8% |
| Moroccan | 231 | 1.9% |
| Nigerian | 68 | 0.5% |
| Northern European | 40 | 0.3% |
| Peruvian | 75 | 0.6% |
| Polish | 74 | 0.6% |
| Puerto Rican | 160 | 1.3% |
| Romanian | 8 | 0.1% |
| Russian | 30 | 0.2% |
| Scandinavian | 2 | 0.0% |
| Scotch-Irish | 479 | 3.9% |
| Scottish | 185 | 1.5% |
| Sioux | 3 | 0.0% |
| Slovak | 24 | 0.2% |
| South American | 79 | 0.6% |
| Spaniard | 67 | 0.5% |
| Sri Lankan | 19 | 0.2% |
| Subsaharan African | 733 | 6.0% |
| Swedish | 229 | 1.9% |
| Swiss | 21 | 0.2% |
| Thai | 14 | 0.1% |
| Trinidadian and Tobagonian | 3 | 0.0% |
| Ukrainian | 7 | 0.1% |
| Welsh | 41 | 0.3% | View All 59 Rows |
Immigrants in Lake City
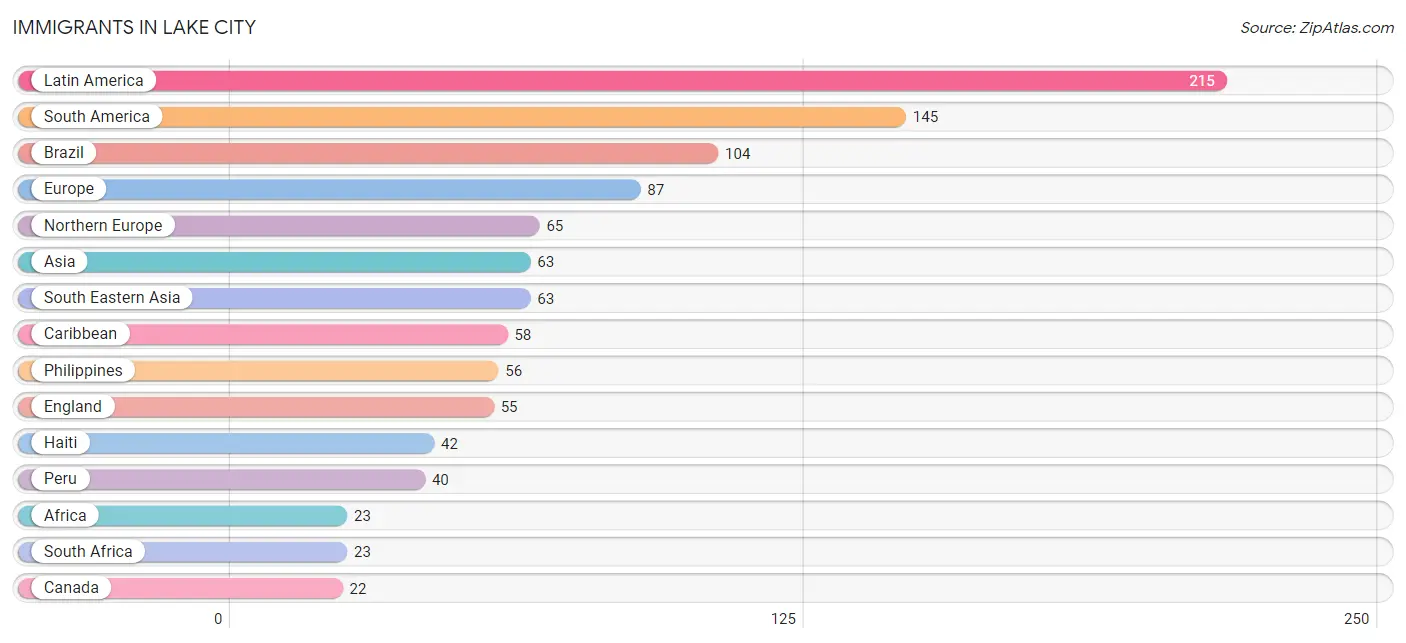
The most numerous immigrant groups reported in Lake City came from Latin America (215 | 1.8%), South America (145 | 1.2%), Brazil (104 | 0.9%), Europe (87 | 0.7%), and Northern Europe (65 | 0.5%), together accounting for 5.0% of all Lake City residents.
| Immigration Origin | # Population | % Population |
| Africa | 23 | 0.2% |
| Asia | 63 | 0.5% |
| Australia | 16 | 0.1% |
| Brazil | 104 | 0.9% |
| Canada | 22 | 0.2% |
| Caribbean | 58 | 0.5% |
| Central America | 12 | 0.1% |
| Colombia | 1 | 0.0% |
| Cuba | 12 | 0.1% |
| Dominican Republic | 4 | 0.0% |
| England | 55 | 0.4% |
| Europe | 87 | 0.7% |
| Haiti | 42 | 0.3% |
| Ireland | 10 | 0.1% |
| Latin America | 215 | 1.8% |
| Mexico | 2 | 0.0% |
| Nicaragua | 10 | 0.1% |
| Northern Europe | 65 | 0.5% |
| Oceania | 16 | 0.1% |
| Peru | 40 | 0.3% |
| Philippines | 56 | 0.5% |
| South Africa | 23 | 0.2% |
| South America | 145 | 1.2% |
| South Eastern Asia | 63 | 0.5% |
| Southern Europe | 18 | 0.2% |
| Spain | 18 | 0.2% |
| Western Europe | 4 | 0.0% | View All 27 Rows |
Sex and Age in Lake City
Sex and Age in Lake City
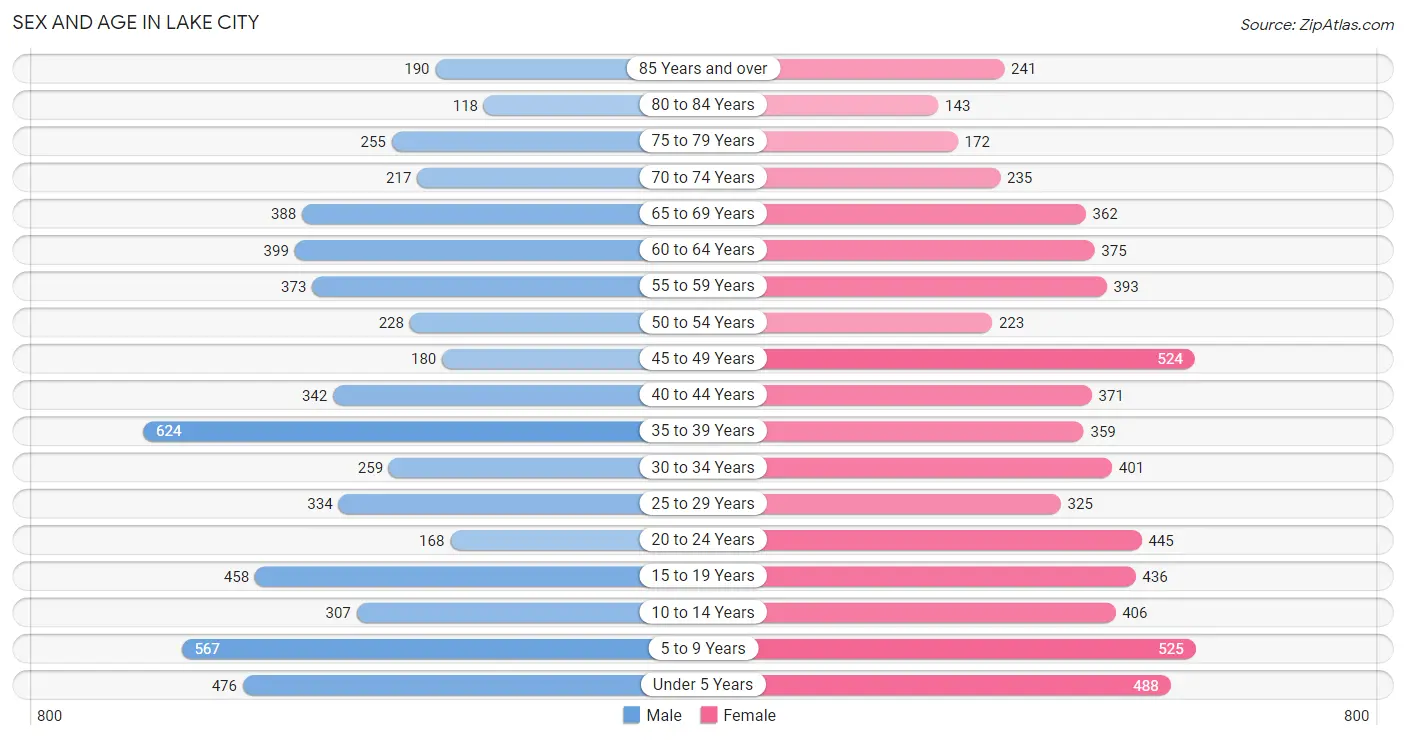
The most populous age groups in Lake City are 35 to 39 Years (624 | 10.6%) for men and 5 to 9 Years (525 | 8.2%) for women.
| Age Bracket | Male | Female |
| Under 5 Years | 476 (8.1%) | 488 (7.6%) |
| 5 to 9 Years | 567 (9.6%) | 525 (8.2%) |
| 10 to 14 Years | 307 (5.2%) | 406 (6.3%) |
| 15 to 19 Years | 458 (7.8%) | 436 (6.8%) |
| 20 to 24 Years | 168 (2.9%) | 445 (6.9%) |
| 25 to 29 Years | 334 (5.7%) | 325 (5.1%) |
| 30 to 34 Years | 259 (4.4%) | 401 (6.2%) |
| 35 to 39 Years | 624 (10.6%) | 359 (5.6%) |
| 40 to 44 Years | 342 (5.8%) | 371 (5.8%) |
| 45 to 49 Years | 180 (3.1%) | 524 (8.2%) |
| 50 to 54 Years | 228 (3.9%) | 223 (3.5%) |
| 55 to 59 Years | 373 (6.3%) | 393 (6.1%) |
| 60 to 64 Years | 399 (6.8%) | 375 (5.8%) |
| 65 to 69 Years | 388 (6.6%) | 362 (5.6%) |
| 70 to 74 Years | 217 (3.7%) | 235 (3.7%) |
| 75 to 79 Years | 255 (4.3%) | 172 (2.7%) |
| 80 to 84 Years | 118 (2.0%) | 143 (2.2%) |
| 85 Years and over | 190 (3.2%) | 241 (3.7%) |
| Total | 5,883 (100.0%) | 6,424 (100.0%) |
Families and Households in Lake City
Median Family Size in Lake City
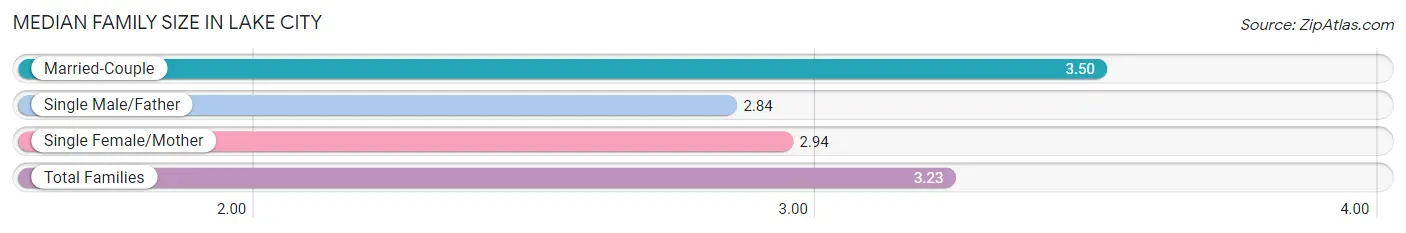
The median family size in Lake City is 3.23 persons per family, with married-couple families (1,413 | 53.7%) accounting for the largest median family size of 3.5 persons per family. On the other hand, single male/father families (240 | 9.1%) represent the smallest median family size with 2.84 persons per family.
| Family Type | # Families | Family Size |
| Married-Couple | 1,413 (53.7%) | 3.50 |
| Single Male/Father | 240 (9.1%) | 2.84 |
| Single Female/Mother | 977 (37.1%) | 2.94 |
| Total Families | 2,630 (100.0%) | 3.23 |
Median Household Size in Lake City
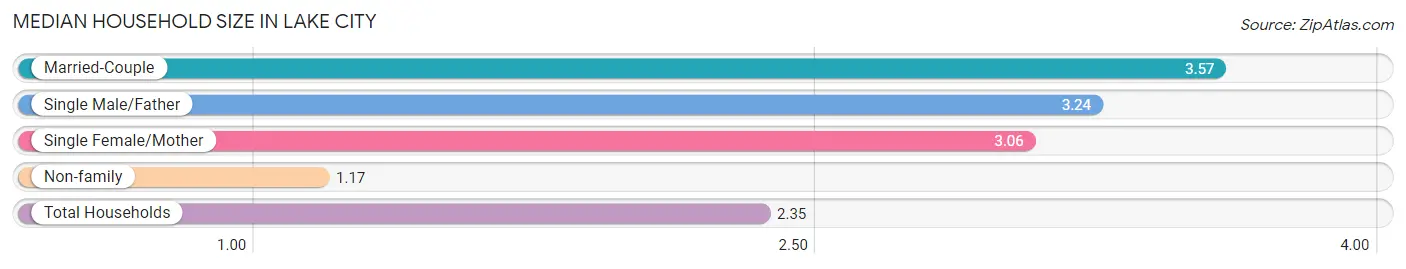
The median household size in Lake City is 2.35 persons per household, with married-couple households (1,413 | 29.0%) accounting for the largest median household size of 3.57 persons per household. non-family households (2,239 | 46.0%) represent the smallest median household size with 1.17 persons per household.
| Household Type | # Households | Household Size |
| Married-Couple | 1,413 (29.0%) | 3.57 |
| Single Male/Father | 240 (4.9%) | 3.24 |
| Single Female/Mother | 977 (20.1%) | 3.06 |
| Non-family | 2,239 (46.0%) | 1.17 |
| Total Households | 4,869 (100.0%) | 2.35 |
Household Size by Marriage Status in Lake City
Out of a total of 4,869 households in Lake City, 2,630 (54.0%) are family households, while 2,239 (46.0%) are nonfamily households. The most numerous type of family households are 2-person households, comprising 1,199, and the most common type of nonfamily households are 1-person households, comprising 1,878.
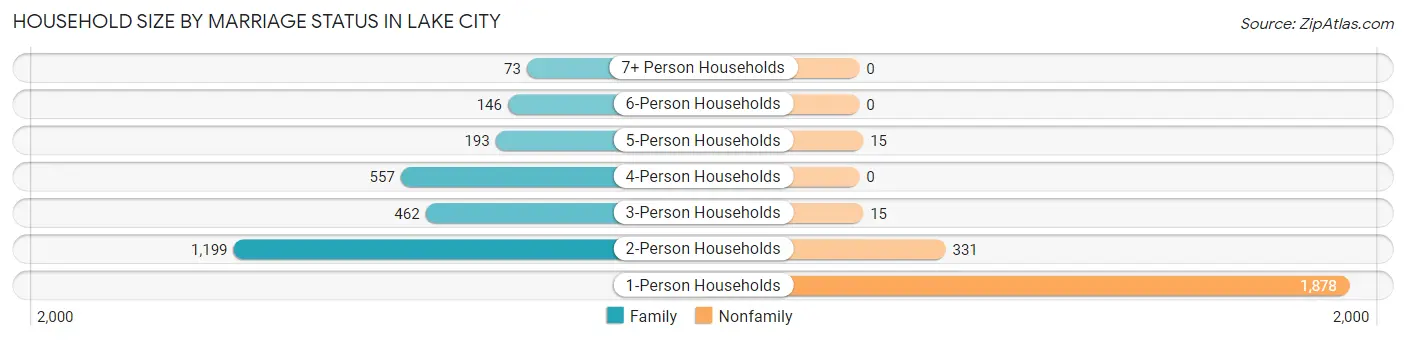
| Household Size | Family Households | Nonfamily Households |
| 1-Person Households | - | 1,878 (38.6%) |
| 2-Person Households | 1,199 (24.6%) | 331 (6.8%) |
| 3-Person Households | 462 (9.5%) | 15 (0.3%) |
| 4-Person Households | 557 (11.4%) | 0 (0.0%) |
| 5-Person Households | 193 (4.0%) | 15 (0.3%) |
| 6-Person Households | 146 (3.0%) | 0 (0.0%) |
| 7+ Person Households | 73 (1.5%) | 0 (0.0%) |
| Total | 2,630 (54.0%) | 2,239 (46.0%) |
Female Fertility in Lake City
Fertility by Age in Lake City
Average fertility rate in Lake City is 57.0 births per 1,000 women. Women in the age bracket of 20 to 34 years have the highest fertility rate with 142.0 births per 1,000 women. Women in the age bracket of 20 to 34 years acount for 100.0% of all women with births.
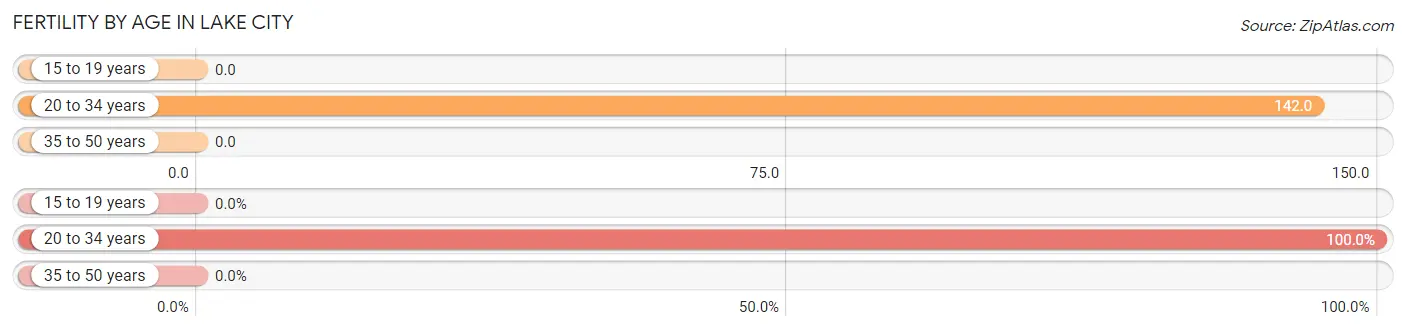
| Age Bracket | Women with Births | Births / 1,000 Women |
| 15 to 19 years | 0 (0.0%) | 0.0 |
| 20 to 34 years | 166 (100.0%) | 142.0 |
| 35 to 50 years | 0 (0.0%) | 0.0 |
| Total | 166 (100.0%) | 57.0 |
Fertility by Age by Marriage Status in Lake City
37.3% of women with births (166) in Lake City are married. The highest percentage of unmarried women with births falls into 20 to 34 years age bracket with 62.6% of them unmarried at the time of birth, while the lowest percentage of unmarried women with births belong to 20 to 34 years age bracket with 62.7% of them unmarried.
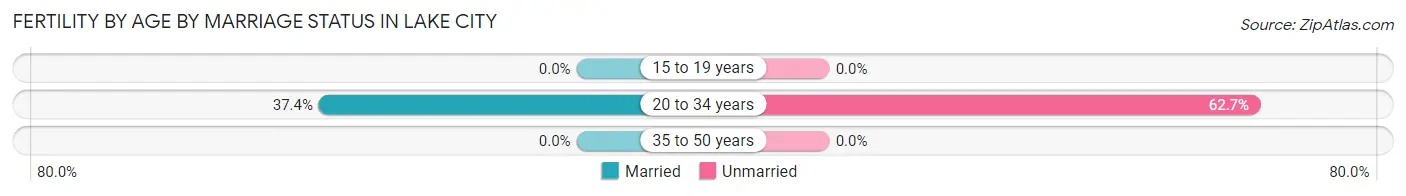
| Age Bracket | Married | Unmarried |
| 15 to 19 years | 0 (0.0%) | 0 (0.0%) |
| 20 to 34 years | 62 (37.3%) | 104 (62.6%) |
| 35 to 50 years | 0 (0.0%) | 0 (0.0%) |
| Total | 62 (37.3%) | 104 (62.6%) |
Fertility by Education in Lake City
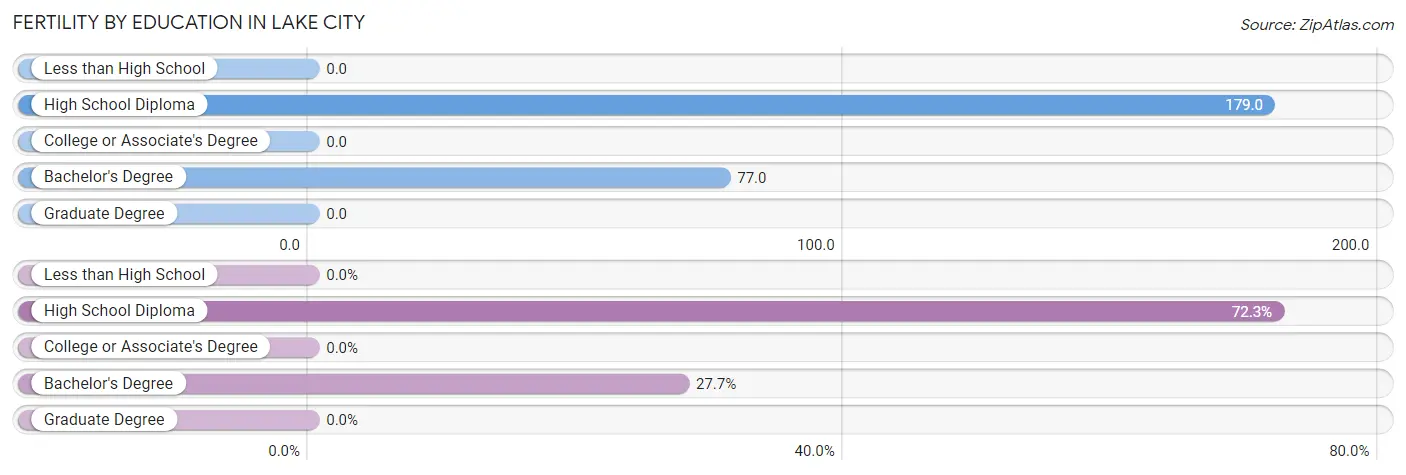
| Educational Attainment | Women with Births | Births / 1,000 Women |
| Less than High School | 0 (0.0%) | 0.0 |
| High School Diploma | 120 (72.3%) | 179.0 |
| College or Associate's Degree | 0 (0.0%) | 0.0 |
| Bachelor's Degree | 46 (27.7%) | 77.0 |
| Graduate Degree | 0 (0.0%) | 0.0 |
| Total | 166 (100.0%) | 57.0 |
Fertility by Education by Marriage Status in Lake City
62.6% of women with births in Lake City are unmarried. Women with the educational attainment of bachelor's degree are most likely to be married with 100.0% of them married at childbirth, while women with the educational attainment of high school diploma are least likely to be married with 86.7% of them unmarried at childbirth.
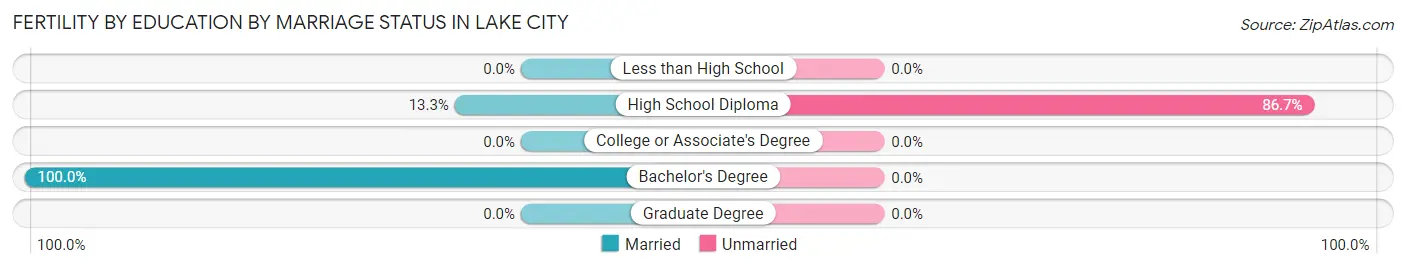
| Educational Attainment | Married | Unmarried |
| Less than High School | 0 (0.0%) | 0 (0.0%) |
| High School Diploma | 16 (13.3%) | 104 (86.7%) |
| College or Associate's Degree | 0 (0.0%) | 0 (0.0%) |
| Bachelor's Degree | 46 (100.0%) | 0 (0.0%) |
| Graduate Degree | 0 (0.0%) | 0 (0.0%) |
| Total | 62 (37.3%) | 104 (62.6%) |
Employment Characteristics in Lake City
Employment by Class of Employer in Lake City
Among the 4,995 employed individuals in Lake City, private company employees (3,166 | 63.4%), state government employees (558 | 11.2%), and not-for-profit organizations (392 | 7.9%) make up the most common classes of employment.
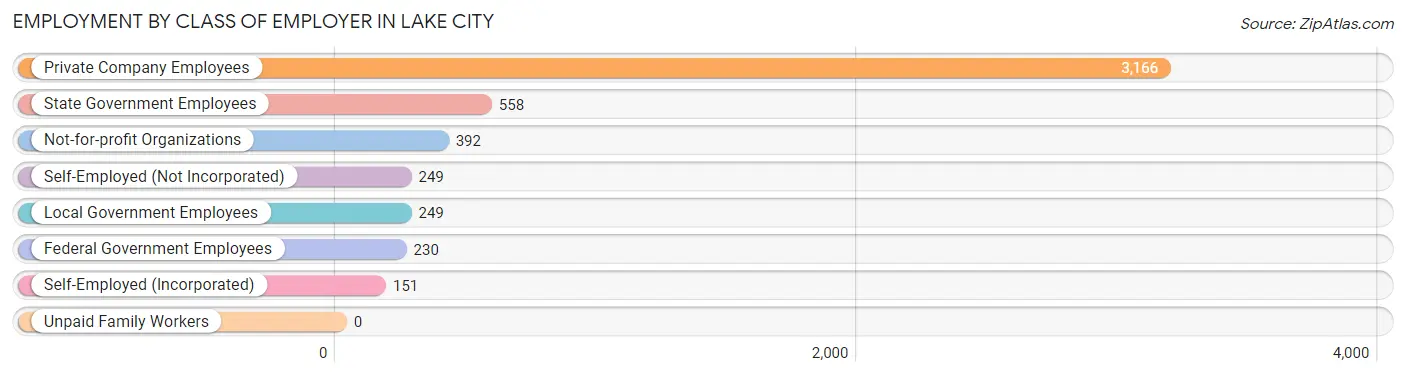
| Employer Class | # Employees | % Employees |
| Private Company Employees | 3,166 | 63.4% |
| Self-Employed (Incorporated) | 151 | 3.0% |
| Self-Employed (Not Incorporated) | 249 | 5.0% |
| Not-for-profit Organizations | 392 | 7.9% |
| Local Government Employees | 249 | 5.0% |
| State Government Employees | 558 | 11.2% |
| Federal Government Employees | 230 | 4.6% |
| Unpaid Family Workers | 0 | 0.0% |
| Total | 4,995 | 100.0% |
Employment Status by Age in Lake City
According to the labor force statistics for Lake City, out of the total population over 16 years of age (9,439), 56.1% or 5,295 individuals are in the labor force, with 5.4% or 286 of them unemployed. The age group with the highest labor force participation rate is 25 to 29 years, with 91.0% or 600 individuals in the labor force. Within the labor force, the 20 to 24 years age range has the highest percentage of unemployed individuals, with 21.7% or 114 of them being unemployed.
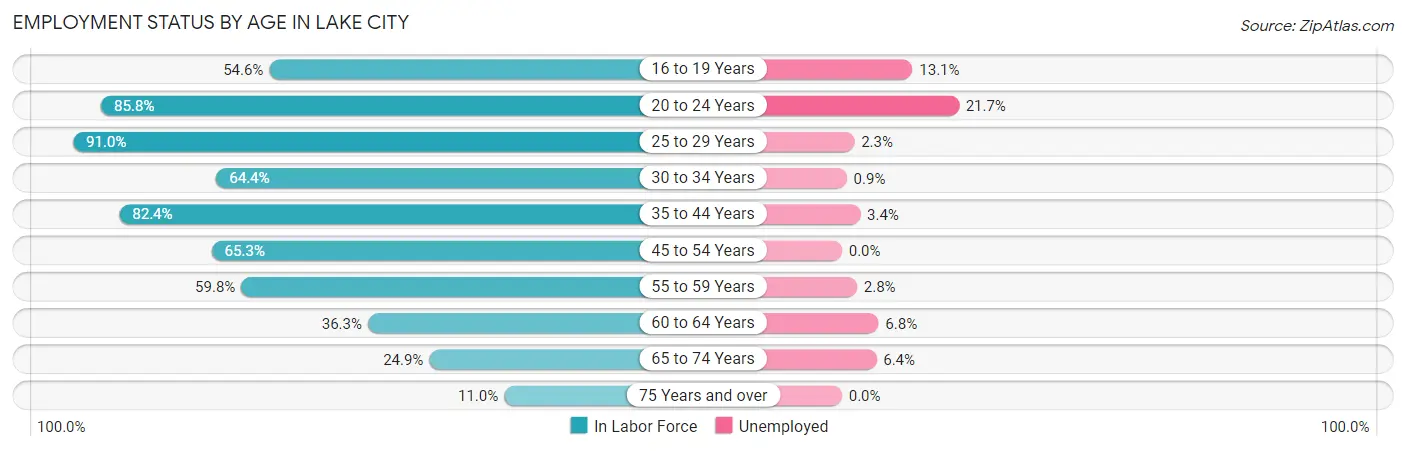
| Age Bracket | In Labor Force | Unemployed |
| 16 to 19 Years | 434 (54.6%) | 57 (13.1%) |
| 20 to 24 Years | 526 (85.8%) | 114 (21.7%) |
| 25 to 29 Years | 600 (91.0%) | 14 (2.3%) |
| 30 to 34 Years | 425 (64.4%) | 4 (0.9%) |
| 35 to 44 Years | 1,398 (82.4%) | 48 (3.4%) |
| 45 to 54 Years | 754 (65.3%) | 0 (0.0%) |
| 55 to 59 Years | 458 (59.8%) | 13 (2.8%) |
| 60 to 64 Years | 281 (36.3%) | 19 (6.8%) |
| 65 to 74 Years | 299 (24.9%) | 19 (6.4%) |
| 75 Years and over | 123 (11.0%) | 0 (0.0%) |
| Total | 5,295 (56.1%) | 286 (5.4%) |
Employment Status by Educational Attainment in Lake City
According to labor force statistics for Lake City, 68.6% of individuals (3,917) out of the total population between 25 and 64 years of age (5,710) are in the labor force, with 2.5% or 98 of them being unemployed. The group with the highest labor force participation rate are those with the educational attainment of college / associate degree, with 80.5% or 1,435 individuals in the labor force. Within the labor force, individuals with college / associate degree education have the highest percentage of unemployment, with 3.6% or 52 of them being unemployed.
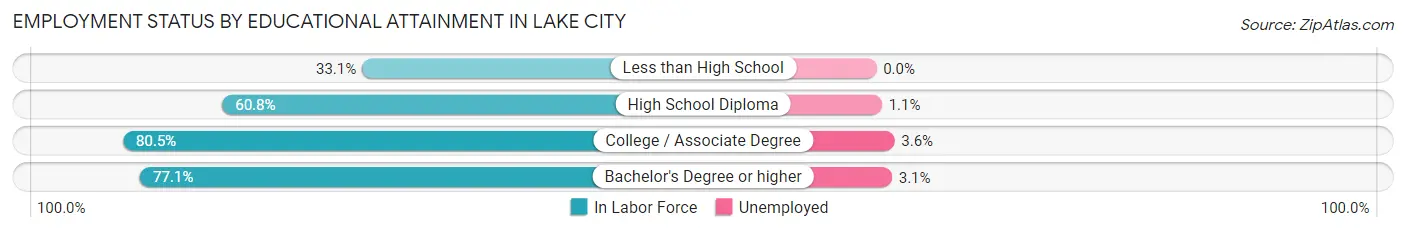
| Educational Attainment | In Labor Force | Unemployed |
| Less than High School | 153 (33.1%) | 0 (0.0%) |
| High School Diploma | 1,293 (60.8%) | 23 (1.1%) |
| College / Associate Degree | 1,435 (80.5%) | 64 (3.6%) |
| Bachelor's Degree or higher | 1,032 (77.1%) | 42 (3.1%) |
| Total | 3,917 (68.6%) | 143 (2.5%) |
Employment Occupations by Sex in Lake City
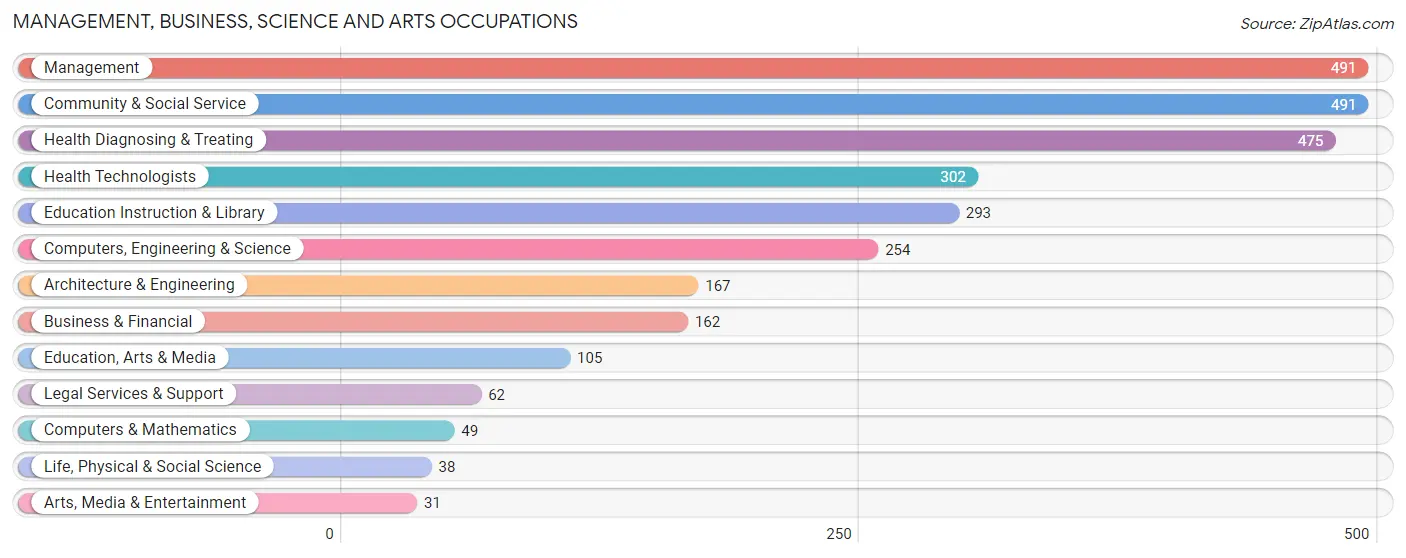
Management, Business, Science and Arts Occupations
The most common Management, Business, Science and Arts occupations in Lake City are Management (491 | 9.8%), Community & Social Service (491 | 9.8%), Health Diagnosing & Treating (475 | 9.5%), Health Technologists (302 | 6.0%), and Education Instruction & Library (293 | 5.9%).
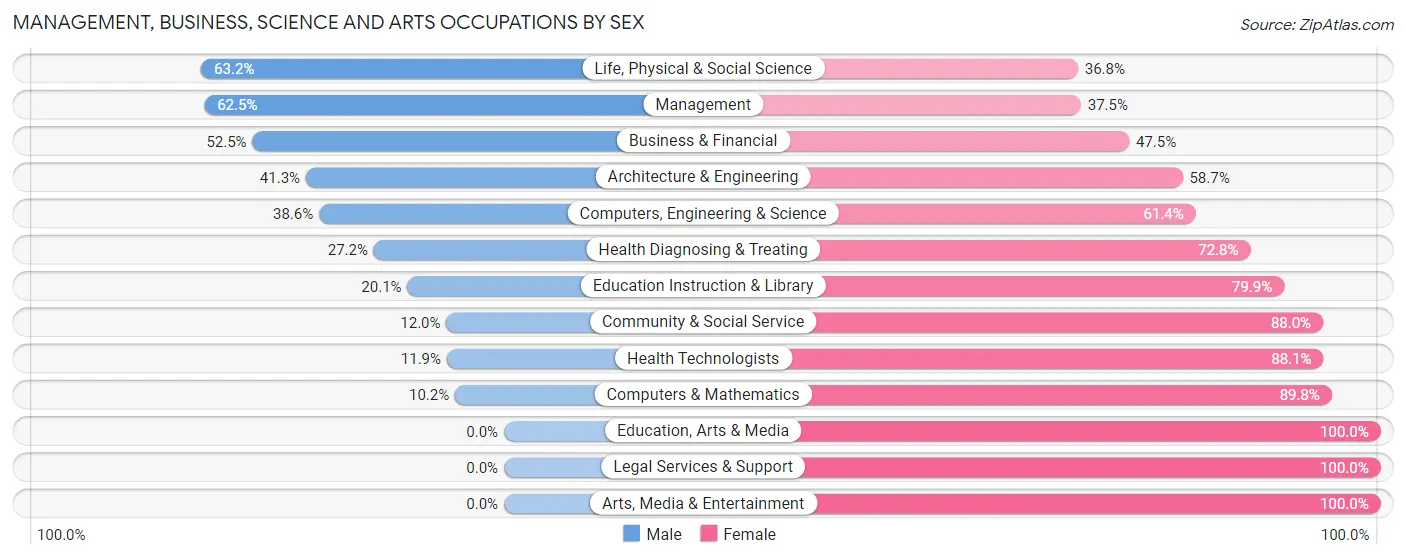
Management, Business, Science and Arts Occupations by Sex
Within the Management, Business, Science and Arts occupations in Lake City, the most male-oriented occupations are Life, Physical & Social Science (63.2%), Management (62.5%), and Business & Financial (52.5%), while the most female-oriented occupations are Education, Arts & Media (100.0%), Legal Services & Support (100.0%), and Arts, Media & Entertainment (100.0%).
| Occupation | Male | Female |
| Management | 307 (62.5%) | 184 (37.5%) |
| Business & Financial | 85 (52.5%) | 77 (47.5%) |
| Computers, Engineering & Science | 98 (38.6%) | 156 (61.4%) |
| Computers & Mathematics | 5 (10.2%) | 44 (89.8%) |
| Architecture & Engineering | 69 (41.3%) | 98 (58.7%) |
| Life, Physical & Social Science | 24 (63.2%) | 14 (36.8%) |
| Community & Social Service | 59 (12.0%) | 432 (88.0%) |
| Education, Arts & Media | 0 (0.0%) | 105 (100.0%) |
| Legal Services & Support | 0 (0.0%) | 62 (100.0%) |
| Education Instruction & Library | 59 (20.1%) | 234 (79.9%) |
| Arts, Media & Entertainment | 0 (0.0%) | 31 (100.0%) |
| Health Diagnosing & Treating | 129 (27.2%) | 346 (72.8%) |
| Health Technologists | 36 (11.9%) | 266 (88.1%) |
| Total (Category) | 678 (36.2%) | 1,195 (63.8%) |
| Total (Overall) | 2,085 (41.6%) | 2,925 (58.4%) |
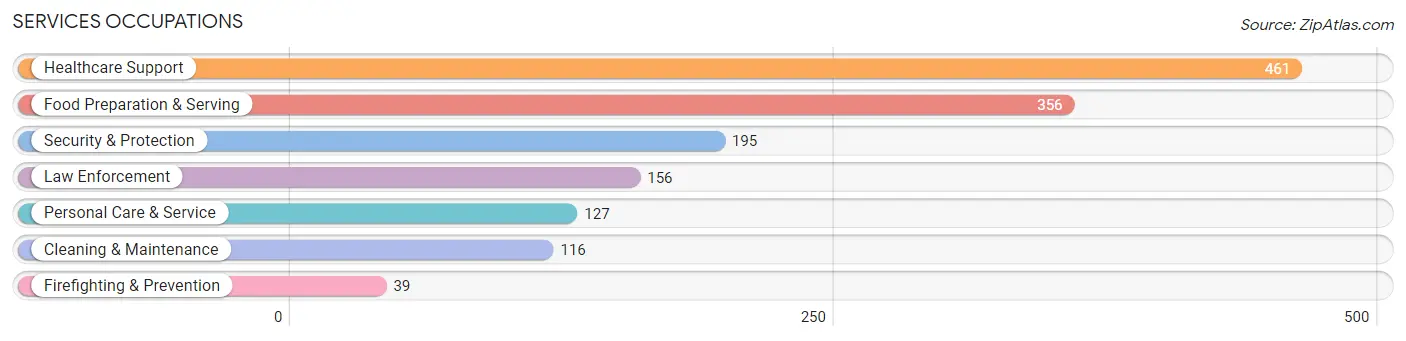
Services Occupations
The most common Services occupations in Lake City are Healthcare Support (461 | 9.2%), Food Preparation & Serving (356 | 7.1%), Security & Protection (195 | 3.9%), Law Enforcement (156 | 3.1%), and Personal Care & Service (127 | 2.5%).
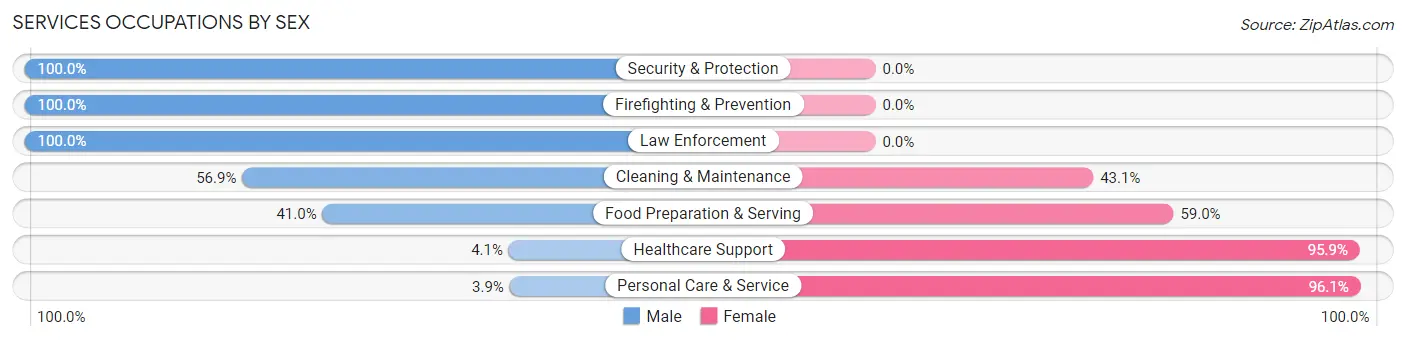
Services Occupations by Sex
Within the Services occupations in Lake City, the most male-oriented occupations are Security & Protection (100.0%), Firefighting & Prevention (100.0%), and Law Enforcement (100.0%), while the most female-oriented occupations are Personal Care & Service (96.1%), Healthcare Support (95.9%), and Food Preparation & Serving (59.0%).
| Occupation | Male | Female |
| Healthcare Support | 19 (4.1%) | 442 (95.9%) |
| Security & Protection | 195 (100.0%) | 0 (0.0%) |
| Firefighting & Prevention | 39 (100.0%) | 0 (0.0%) |
| Law Enforcement | 156 (100.0%) | 0 (0.0%) |
| Food Preparation & Serving | 146 (41.0%) | 210 (59.0%) |
| Cleaning & Maintenance | 66 (56.9%) | 50 (43.1%) |
| Personal Care & Service | 5 (3.9%) | 122 (96.1%) |
| Total (Category) | 431 (34.3%) | 824 (65.7%) |
| Total (Overall) | 2,085 (41.6%) | 2,925 (58.4%) |
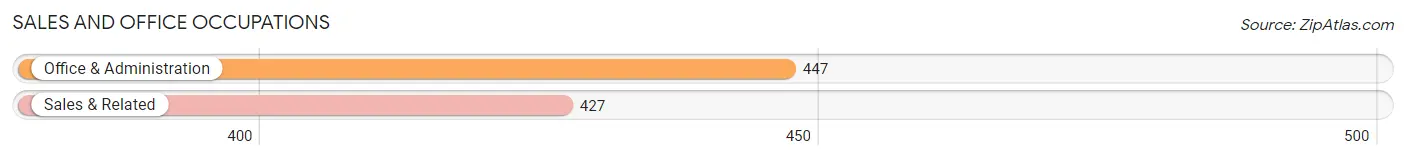
Sales and Office Occupations
The most common Sales and Office occupations in Lake City are Office & Administration (447 | 8.9%), and Sales & Related (427 | 8.5%).
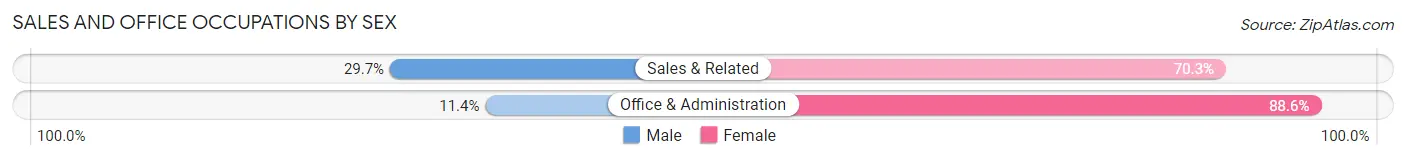
Sales and Office Occupations by Sex
| Occupation | Male | Female |
| Sales & Related | 127 (29.7%) | 300 (70.3%) |
| Office & Administration | 51 (11.4%) | 396 (88.6%) |
| Total (Category) | 178 (20.4%) | 696 (79.6%) |
| Total (Overall) | 2,085 (41.6%) | 2,925 (58.4%) |
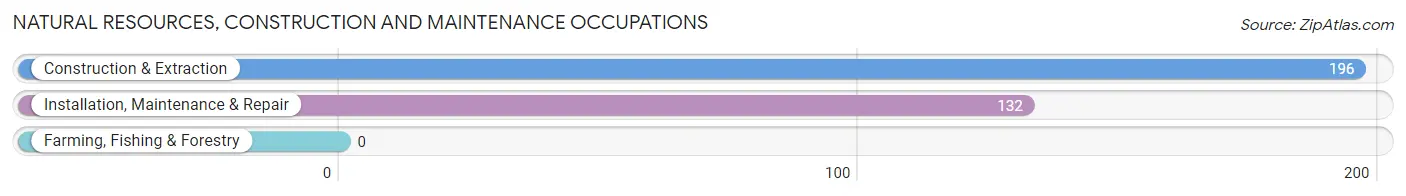
Natural Resources, Construction and Maintenance Occupations
The most common Natural Resources, Construction and Maintenance occupations in Lake City are Construction & Extraction (196 | 3.9%), and Installation, Maintenance & Repair (132 | 2.6%).
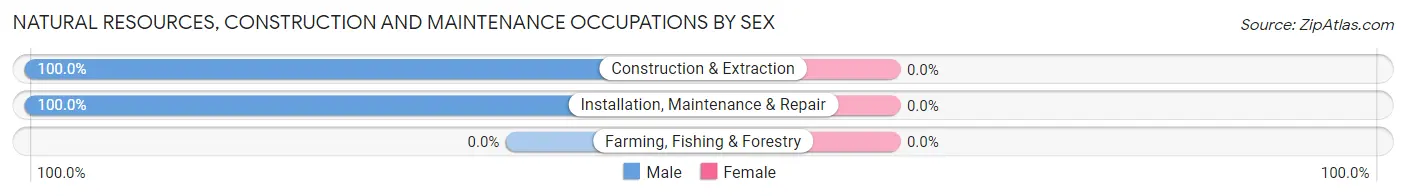
Natural Resources, Construction and Maintenance Occupations by Sex
| Occupation | Male | Female |
| Farming, Fishing & Forestry | 0 (0.0%) | 0 (0.0%) |
| Construction & Extraction | 196 (100.0%) | 0 (0.0%) |
| Installation, Maintenance & Repair | 132 (100.0%) | 0 (0.0%) |
| Total (Category) | 328 (100.0%) | 0 (0.0%) |
| Total (Overall) | 2,085 (41.6%) | 2,925 (58.4%) |
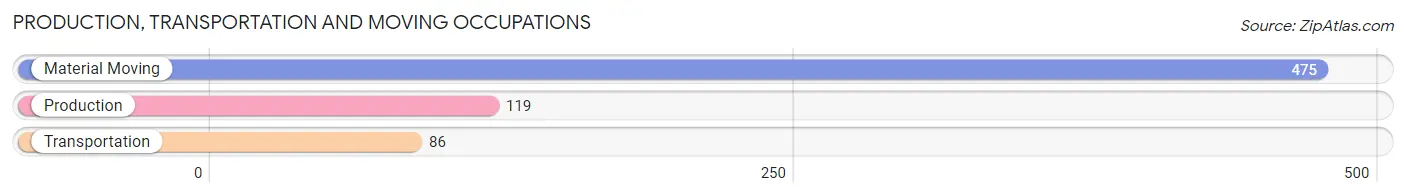
Production, Transportation and Moving Occupations
The most common Production, Transportation and Moving occupations in Lake City are Material Moving (475 | 9.5%), Production (119 | 2.4%), and Transportation (86 | 1.7%).
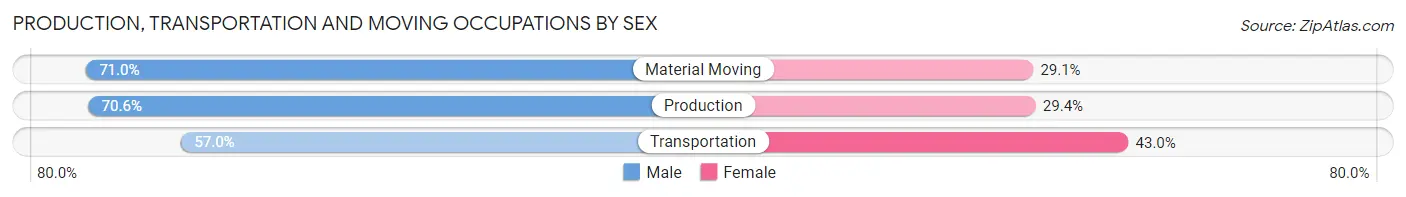
Production, Transportation and Moving Occupations by Sex
| Occupation | Male | Female |
| Production | 84 (70.6%) | 35 (29.4%) |
| Transportation | 49 (57.0%) | 37 (43.0%) |
| Material Moving | 337 (71.0%) | 138 (29.0%) |
| Total (Category) | 470 (69.1%) | 210 (30.9%) |
| Total (Overall) | 2,085 (41.6%) | 2,925 (58.4%) |
Employment Industries by Sex in Lake City
Employment Industries in Lake City
The major employment industries in Lake City include Health Care & Social Assistance (1,149 | 22.9%), Retail Trade (766 | 15.3%), Accommodation & Food Services (653 | 13.0%), Public Administration (568 | 11.3%), and Construction (453 | 9.0%).

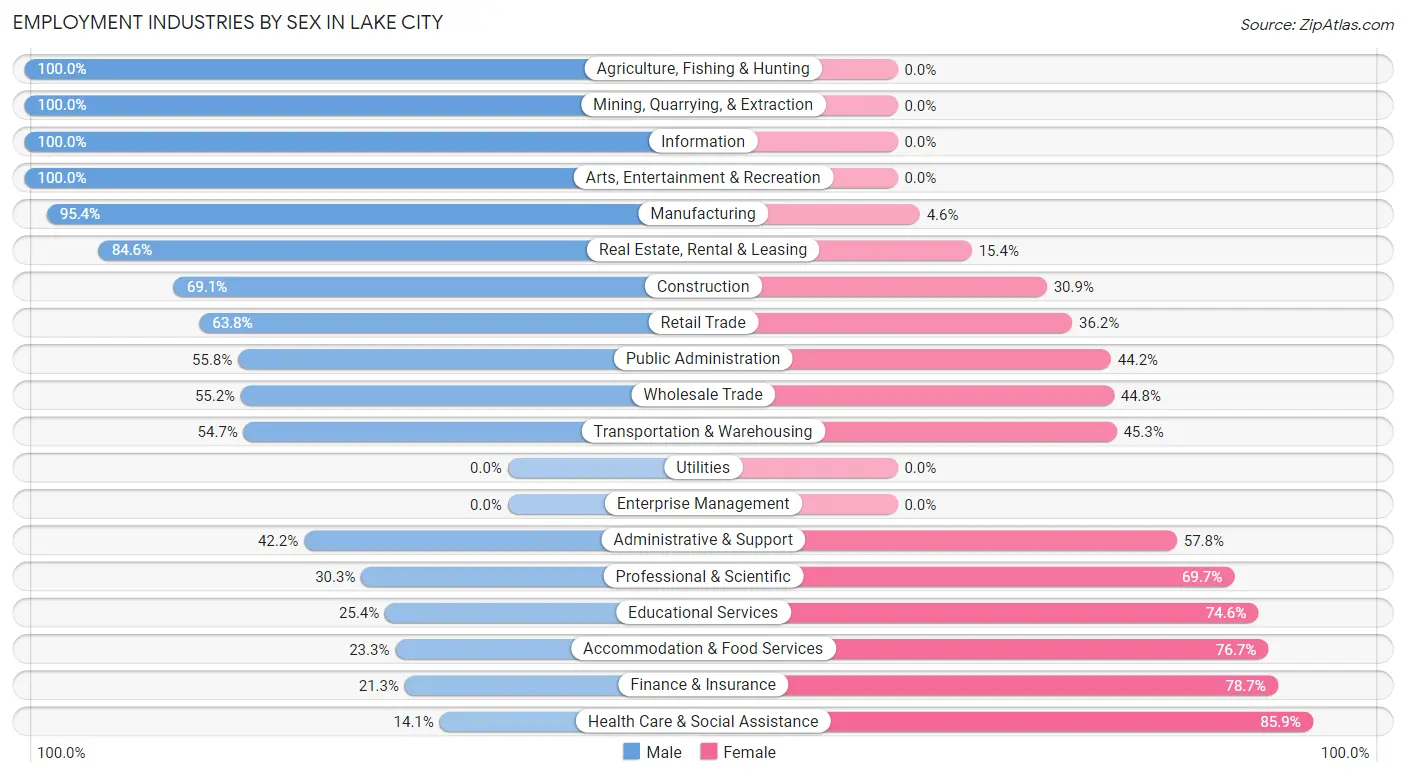
Employment Industries by Sex in Lake City
The Lake City industries that see more men than women are Agriculture, Fishing & Hunting (100.0%), Mining, Quarrying, & Extraction (100.0%), and Information (100.0%), whereas the industries that tend to have a higher number of women are Health Care & Social Assistance (85.9%), Finance & Insurance (78.7%), and Accommodation & Food Services (76.7%).
| Industry | Male | Female |
| Agriculture, Fishing & Hunting | 8 (100.0%) | 0 (0.0%) |
| Mining, Quarrying, & Extraction | 14 (100.0%) | 0 (0.0%) |
| Construction | 313 (69.1%) | 140 (30.9%) |
| Manufacturing | 186 (95.4%) | 9 (4.6%) |
| Wholesale Trade | 37 (55.2%) | 30 (44.8%) |
| Retail Trade | 489 (63.8%) | 277 (36.2%) |
| Transportation & Warehousing | 129 (54.7%) | 107 (45.3%) |
| Utilities | 0 (0.0%) | 0 (0.0%) |
| Information | 5 (100.0%) | 0 (0.0%) |
| Finance & Insurance | 13 (21.3%) | 48 (78.7%) |
| Real Estate, Rental & Leasing | 22 (84.6%) | 4 (15.4%) |
| Professional & Scientific | 57 (30.3%) | 131 (69.7%) |
| Enterprise Management | 0 (0.0%) | 0 (0.0%) |
| Administrative & Support | 35 (42.2%) | 48 (57.8%) |
| Educational Services | 66 (25.4%) | 194 (74.6%) |
| Health Care & Social Assistance | 162 (14.1%) | 987 (85.9%) |
| Arts, Entertainment & Recreation | 15 (100.0%) | 0 (0.0%) |
| Accommodation & Food Services | 152 (23.3%) | 501 (76.7%) |
| Public Administration | 317 (55.8%) | 251 (44.2%) |
| Total | 2,085 (41.6%) | 2,925 (58.4%) |
Education in Lake City
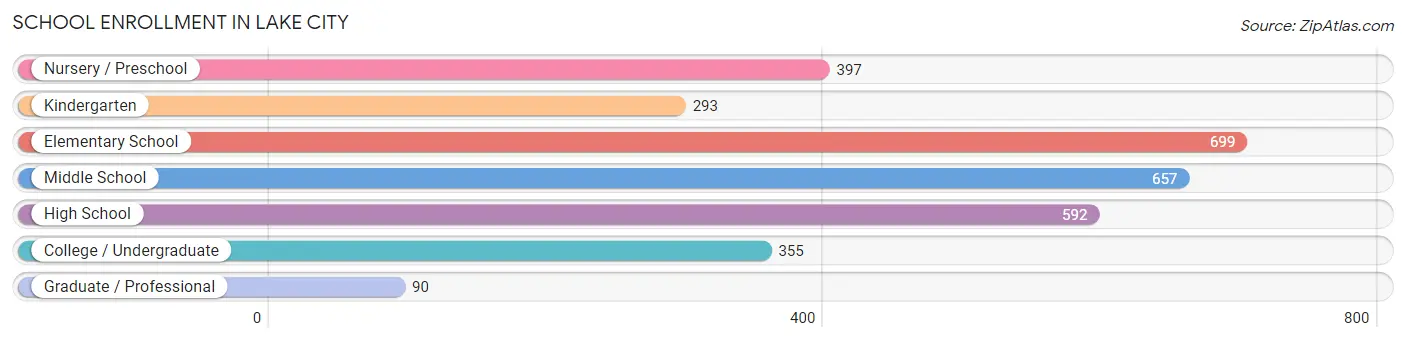
School Enrollment in Lake City
The most common levels of schooling among the 3,083 students in Lake City are elementary school (699 | 22.7%), middle school (657 | 21.3%), and high school (592 | 19.2%).
| School Level | # Students | % Students |
| Nursery / Preschool | 397 | 12.9% |
| Kindergarten | 293 | 9.5% |
| Elementary School | 699 | 22.7% |
| Middle School | 657 | 21.3% |
| High School | 592 | 19.2% |
| College / Undergraduate | 355 | 11.5% |
| Graduate / Professional | 90 | 2.9% |
| Total | 3,083 | 100.0% |
School Enrollment by Age by Funding Source in Lake City
Out of a total of 3,083 students who are enrolled in schools in Lake City, 555 (18.0%) attend a private institution, while the remaining 2,528 (82.0%) are enrolled in public schools. The age group of 10 to 14 year olds has the highest likelihood of being enrolled in private schools, with 239 (35.2% in the age bracket) enrolled. Conversely, the age group of 20 to 24 year olds has the lowest likelihood of being enrolled in a private school, with 52 (100.0% in the age bracket) attending a public institution.
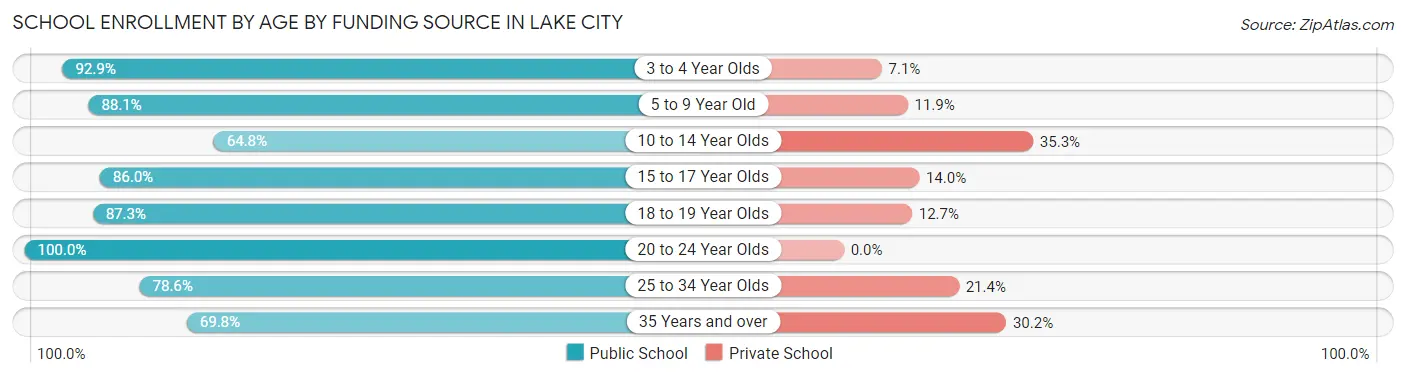
| Age Bracket | Public School | Private School |
| 3 to 4 Year Olds | 316 (92.9%) | 24 (7.1%) |
| 5 to 9 Year Old | 911 (88.1%) | 123 (11.9%) |
| 10 to 14 Year Olds | 439 (64.7%) | 239 (35.2%) |
| 15 to 17 Year Olds | 386 (86.0%) | 63 (14.0%) |
| 18 to 19 Year Olds | 227 (87.3%) | 33 (12.7%) |
| 20 to 24 Year Olds | 52 (100.0%) | 0 (0.0%) |
| 25 to 34 Year Olds | 77 (78.6%) | 21 (21.4%) |
| 35 Years and over | 120 (69.8%) | 52 (30.2%) |
| Total | 2,528 (82.0%) | 555 (18.0%) |
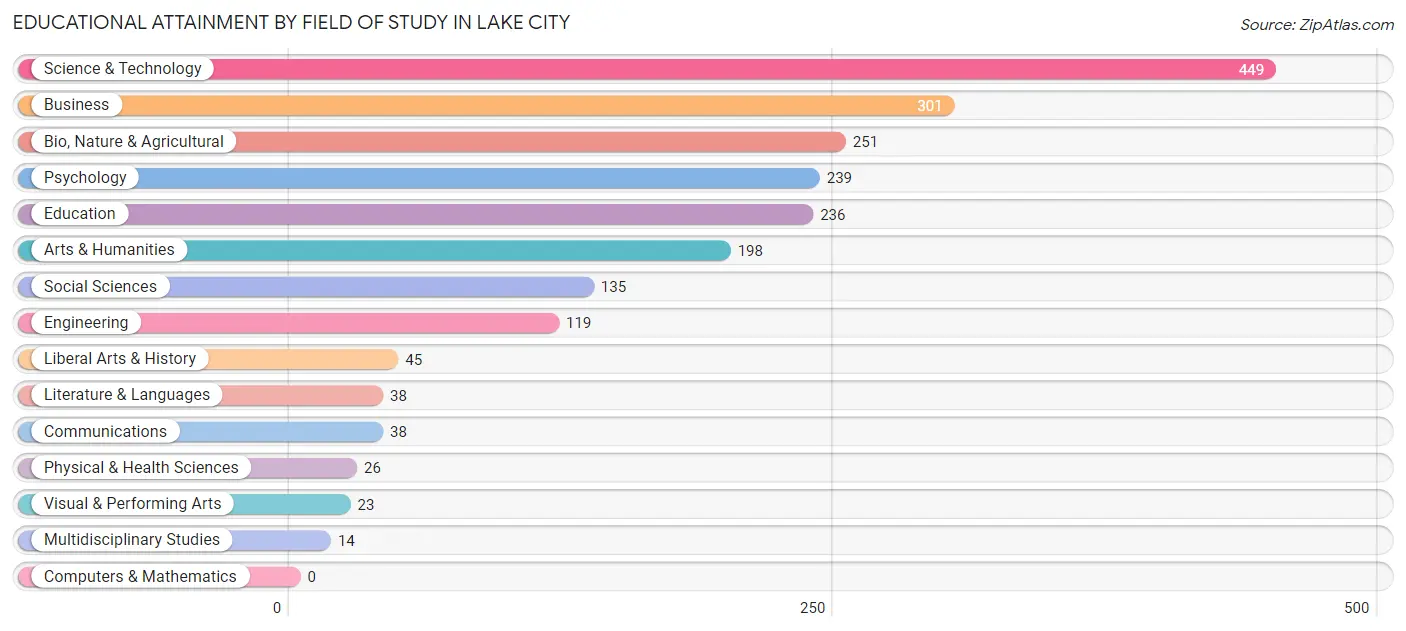
Educational Attainment by Field of Study in Lake City
Science & technology (449 | 21.3%), business (301 | 14.2%), bio, nature & agricultural (251 | 11.9%), psychology (239 | 11.3%), and education (236 | 11.2%) are the most common fields of study among 2,112 individuals in Lake City who have obtained a bachelor's degree or higher.
| Field of Study | # Graduates | % Graduates |
| Computers & Mathematics | 0 | 0.0% |
| Bio, Nature & Agricultural | 251 | 11.9% |
| Physical & Health Sciences | 26 | 1.2% |
| Psychology | 239 | 11.3% |
| Social Sciences | 135 | 6.4% |
| Engineering | 119 | 5.6% |
| Multidisciplinary Studies | 14 | 0.7% |
| Science & Technology | 449 | 21.3% |
| Business | 301 | 14.2% |
| Education | 236 | 11.2% |
| Literature & Languages | 38 | 1.8% |
| Liberal Arts & History | 45 | 2.1% |
| Visual & Performing Arts | 23 | 1.1% |
| Communications | 38 | 1.8% |
| Arts & Humanities | 198 | 9.4% |
| Total | 2,112 | 100.0% |
Transportation & Commute in Lake City
Vehicle Availability by Sex in Lake City
The most prevalent vehicle ownership categories in Lake City are males with 2 vehicles (1,002, accounting for 48.2%) and females with 2 vehicles (990, making up 34.4%).
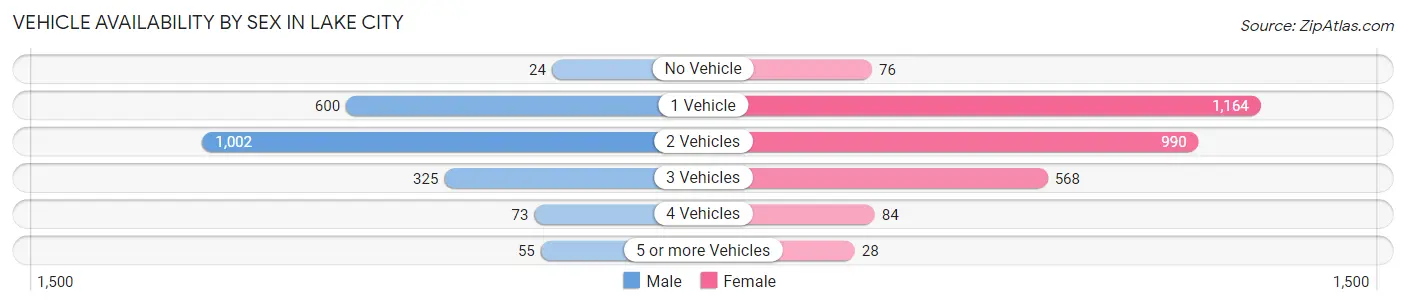
| Vehicles Available | Male | Female |
| No Vehicle | 24 (1.1%) | 76 (2.6%) |
| 1 Vehicle | 600 (28.9%) | 1,164 (40.0%) |
| 2 Vehicles | 1,002 (48.2%) | 990 (34.0%) |
| 3 Vehicles | 325 (15.6%) | 568 (19.5%) |
| 4 Vehicles | 73 (3.5%) | 84 (2.9%) |
| 5 or more Vehicles | 55 (2.6%) | 28 (1.0%) |
| Total | 2,079 (100.0%) | 2,910 (100.0%) |
Commute Time in Lake City
The most frequently occuring commute durations in Lake City are 5 to 9 minutes (1,216 commuters, 25.3%), 10 to 14 minutes (1,137 commuters, 23.6%), and 15 to 19 minutes (875 commuters, 18.2%).
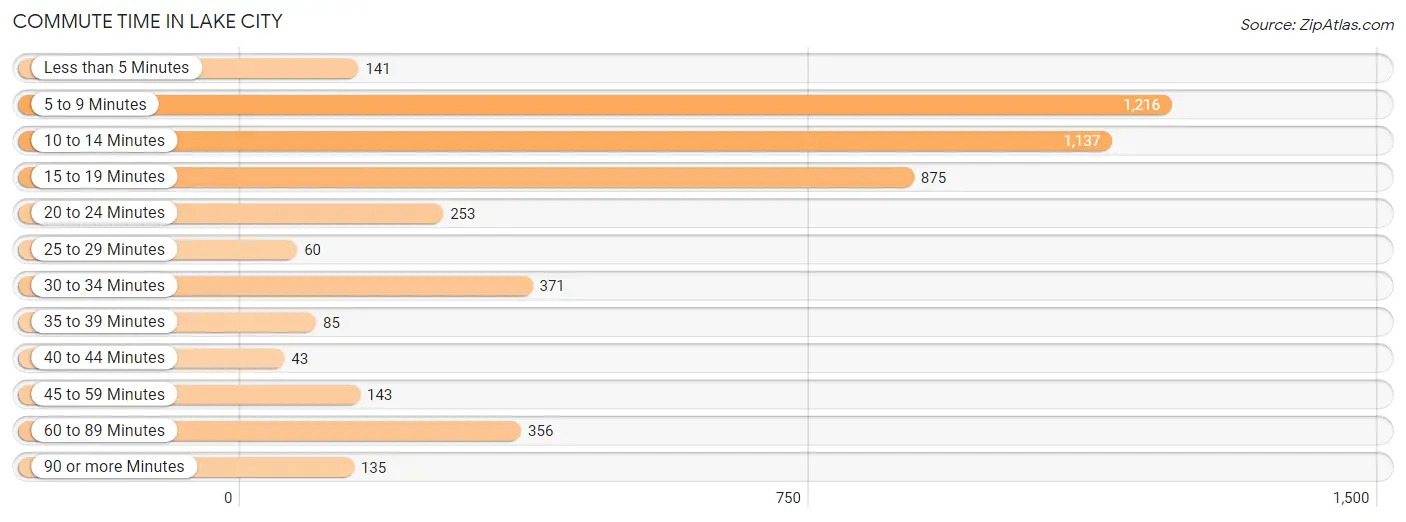
| Commute Time | # Commuters | % Commuters |
| Less than 5 Minutes | 141 | 2.9% |
| 5 to 9 Minutes | 1,216 | 25.3% |
| 10 to 14 Minutes | 1,137 | 23.6% |
| 15 to 19 Minutes | 875 | 18.2% |
| 20 to 24 Minutes | 253 | 5.2% |
| 25 to 29 Minutes | 60 | 1.3% |
| 30 to 34 Minutes | 371 | 7.7% |
| 35 to 39 Minutes | 85 | 1.8% |
| 40 to 44 Minutes | 43 | 0.9% |
| 45 to 59 Minutes | 143 | 3.0% |
| 60 to 89 Minutes | 356 | 7.4% |
| 90 or more Minutes | 135 | 2.8% |
Commute Time by Sex in Lake City
The most common commute times in Lake City are 15 to 19 minutes (514 commuters, 25.5%) for males and 5 to 9 minutes (913 commuters, 32.6%) for females.
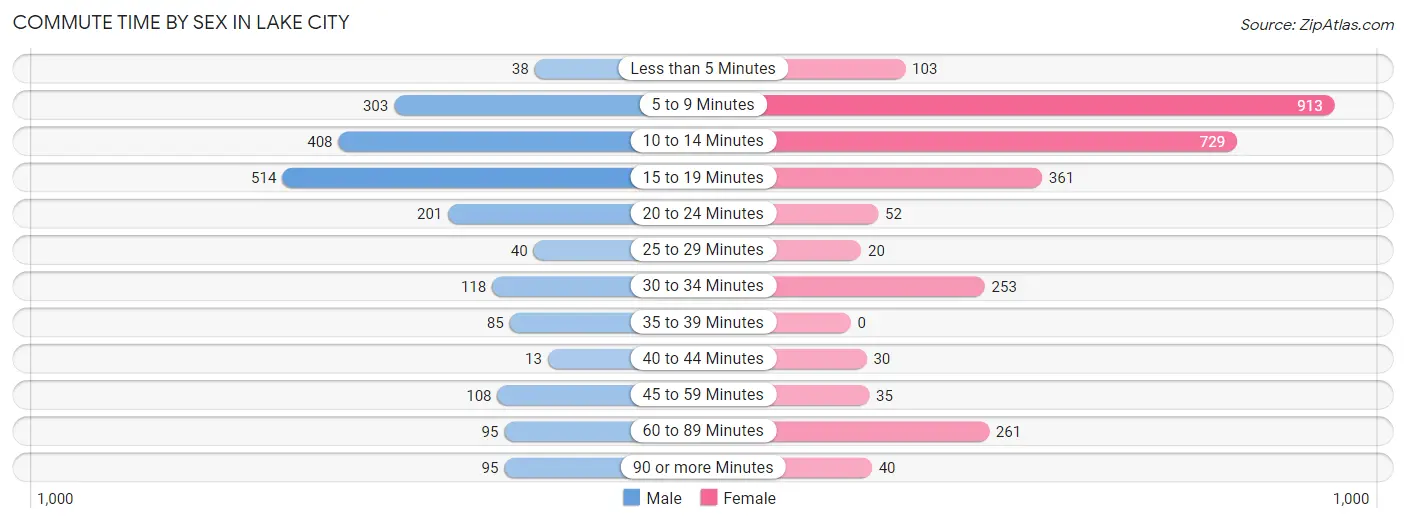
| Commute Time | Male | Female |
| Less than 5 Minutes | 38 (1.9%) | 103 (3.7%) |
| 5 to 9 Minutes | 303 (15.0%) | 913 (32.6%) |
| 10 to 14 Minutes | 408 (20.2%) | 729 (26.1%) |
| 15 to 19 Minutes | 514 (25.5%) | 361 (12.9%) |
| 20 to 24 Minutes | 201 (10.0%) | 52 (1.9%) |
| 25 to 29 Minutes | 40 (2.0%) | 20 (0.7%) |
| 30 to 34 Minutes | 118 (5.9%) | 253 (9.0%) |
| 35 to 39 Minutes | 85 (4.2%) | 0 (0.0%) |
| 40 to 44 Minutes | 13 (0.6%) | 30 (1.1%) |
| 45 to 59 Minutes | 108 (5.3%) | 35 (1.3%) |
| 60 to 89 Minutes | 95 (4.7%) | 261 (9.3%) |
| 90 or more Minutes | 95 (4.7%) | 40 (1.4%) |
Time of Departure to Work by Sex in Lake City
The most frequent times of departure to work in Lake City are 12:00 PM to 3:59 PM (319, 15.8%) for males and 4:00 PM to 11:59 PM (406, 14.5%) for females.
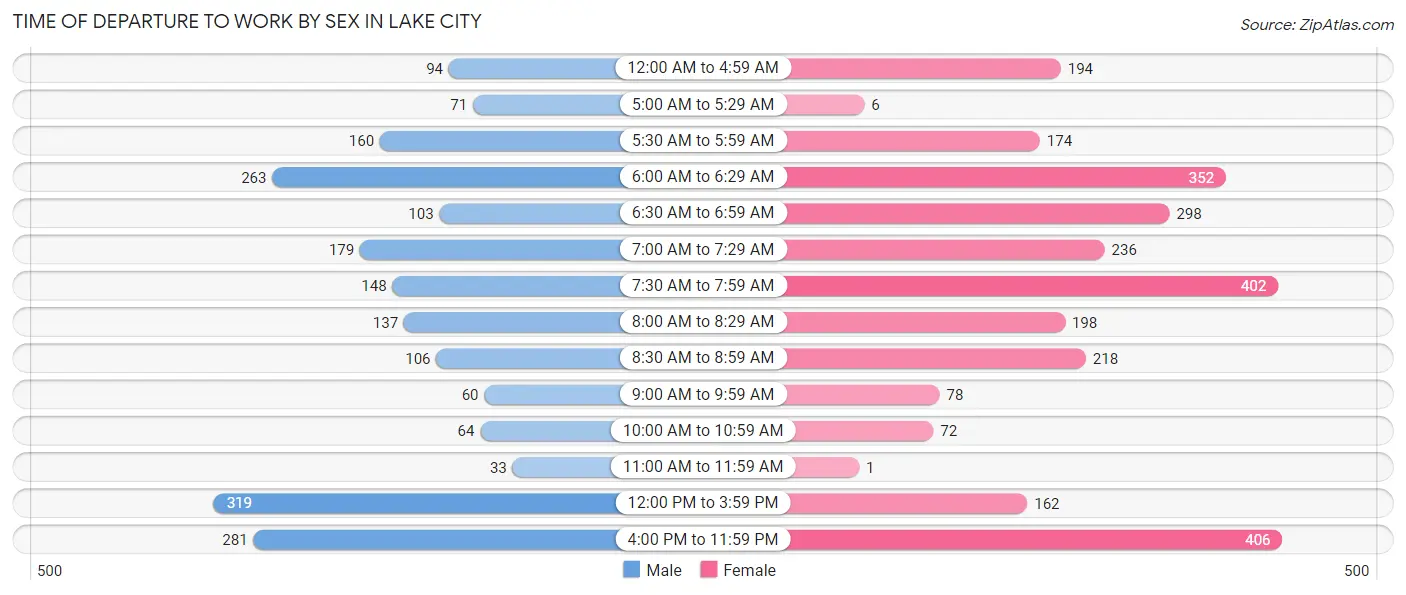
| Time of Departure | Male | Female |
| 12:00 AM to 4:59 AM | 94 (4.7%) | 194 (6.9%) |
| 5:00 AM to 5:29 AM | 71 (3.5%) | 6 (0.2%) |
| 5:30 AM to 5:59 AM | 160 (7.9%) | 174 (6.2%) |
| 6:00 AM to 6:29 AM | 263 (13.0%) | 352 (12.6%) |
| 6:30 AM to 6:59 AM | 103 (5.1%) | 298 (10.6%) |
| 7:00 AM to 7:29 AM | 179 (8.9%) | 236 (8.4%) |
| 7:30 AM to 7:59 AM | 148 (7.3%) | 402 (14.4%) |
| 8:00 AM to 8:29 AM | 137 (6.8%) | 198 (7.1%) |
| 8:30 AM to 8:59 AM | 106 (5.2%) | 218 (7.8%) |
| 9:00 AM to 9:59 AM | 60 (3.0%) | 78 (2.8%) |
| 10:00 AM to 10:59 AM | 64 (3.2%) | 72 (2.6%) |
| 11:00 AM to 11:59 AM | 33 (1.6%) | 1 (0.0%) |
| 12:00 PM to 3:59 PM | 319 (15.8%) | 162 (5.8%) |
| 4:00 PM to 11:59 PM | 281 (13.9%) | 406 (14.5%) |
| Total | 2,018 (100.0%) | 2,797 (100.0%) |
Housing Occupancy in Lake City
Occupancy by Ownership in Lake City
Of the total 4,869 dwellings in Lake City, owner-occupied units account for 1,885 (38.7%), while renter-occupied units make up 2,984 (61.3%).
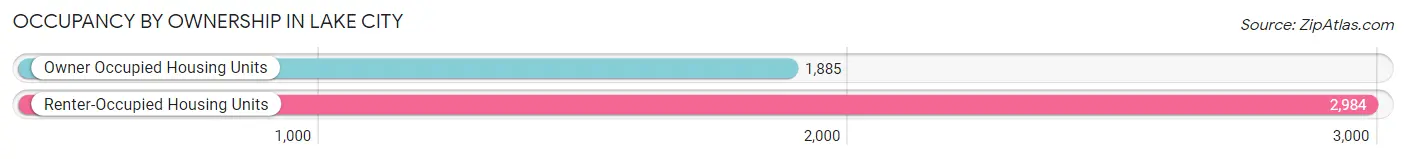
| Occupancy | # Housing Units | % Housing Units |
| Owner Occupied Housing Units | 1,885 | 38.7% |
| Renter-Occupied Housing Units | 2,984 | 61.3% |
| Total Occupied Housing Units | 4,869 | 100.0% |
Occupancy by Household Size in Lake City
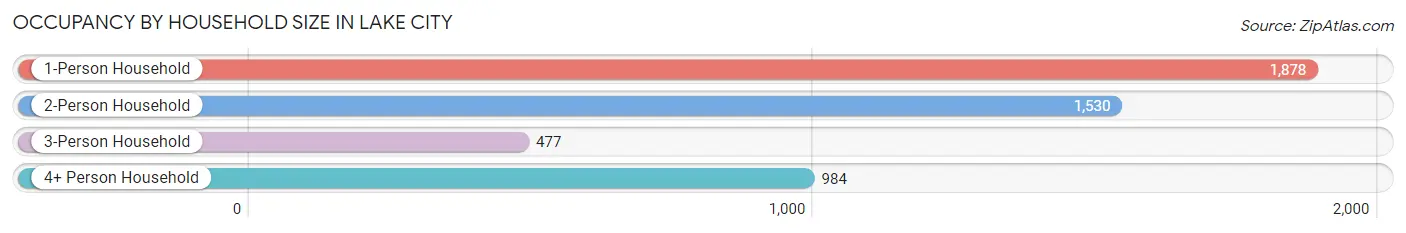
| Household Size | # Housing Units | % Housing Units |
| 1-Person Household | 1,878 | 38.6% |
| 2-Person Household | 1,530 | 31.4% |
| 3-Person Household | 477 | 9.8% |
| 4+ Person Household | 984 | 20.2% |
| Total Housing Units | 4,869 | 100.0% |
Occupancy by Ownership by Household Size in Lake City
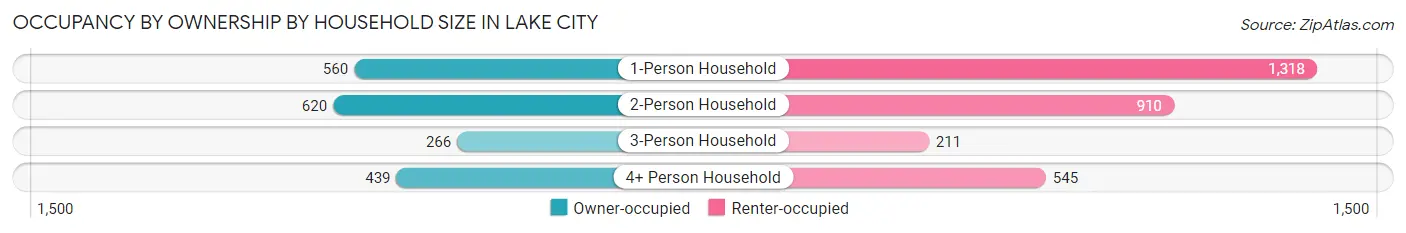
| Household Size | Owner-occupied | Renter-occupied |
| 1-Person Household | 560 (29.8%) | 1,318 (70.2%) |
| 2-Person Household | 620 (40.5%) | 910 (59.5%) |
| 3-Person Household | 266 (55.8%) | 211 (44.2%) |
| 4+ Person Household | 439 (44.6%) | 545 (55.4%) |
| Total Housing Units | 1,885 (38.7%) | 2,984 (61.3%) |
Occupancy by Educational Attainment in Lake City
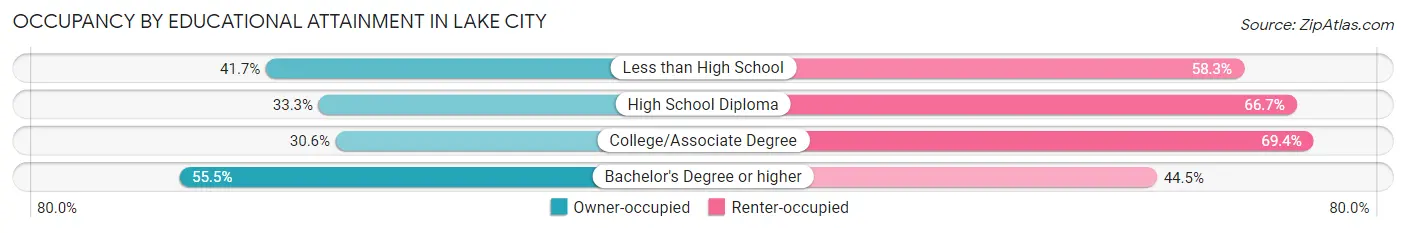
| Household Size | Owner-occupied | Renter-occupied |
| Less than High School | 168 (41.7%) | 235 (58.3%) |
| High School Diploma | 542 (33.3%) | 1,084 (66.7%) |
| College/Associate Degree | 494 (30.6%) | 1,119 (69.4%) |
| Bachelor's Degree or higher | 681 (55.5%) | 546 (44.5%) |
Occupancy by Age of Householder in Lake City
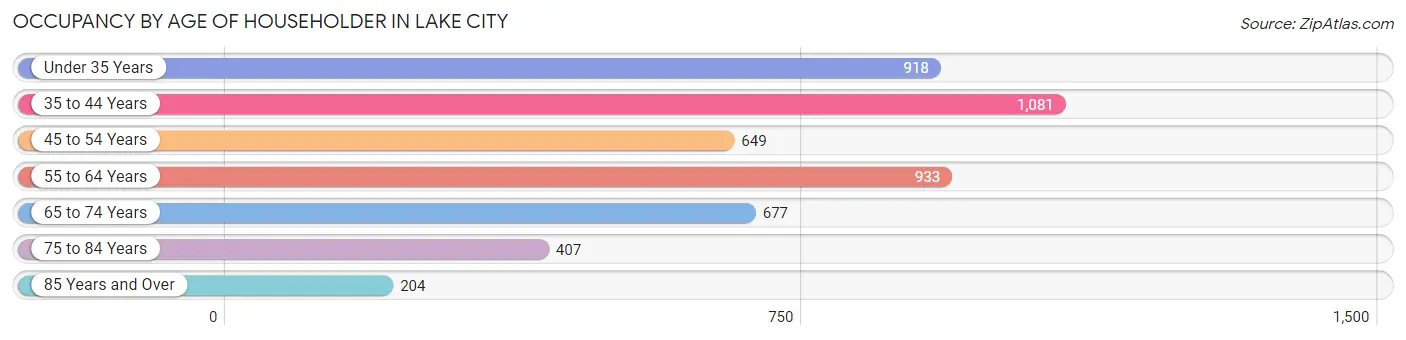
| Age Bracket | # Households | % Households |
| Under 35 Years | 918 | 18.9% |
| 35 to 44 Years | 1,081 | 22.2% |
| 45 to 54 Years | 649 | 13.3% |
| 55 to 64 Years | 933 | 19.2% |
| 65 to 74 Years | 677 | 13.9% |
| 75 to 84 Years | 407 | 8.4% |
| 85 Years and Over | 204 | 4.2% |
| Total | 4,869 | 100.0% |
Housing Finances in Lake City
Median Income by Occupancy in Lake City
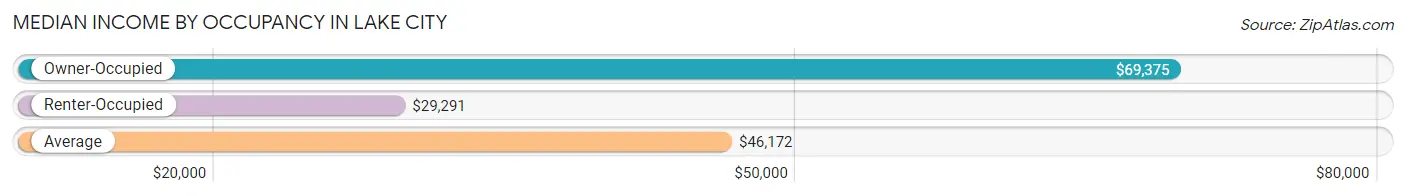
| Occupancy Type | # Households | Median Income |
| Owner-Occupied | 1,885 (38.7%) | $69,375 |
| Renter-Occupied | 2,984 (61.3%) | $29,291 |
| Average | 4,869 (100.0%) | $46,172 |
Occupancy by Householder Income Bracket in Lake City
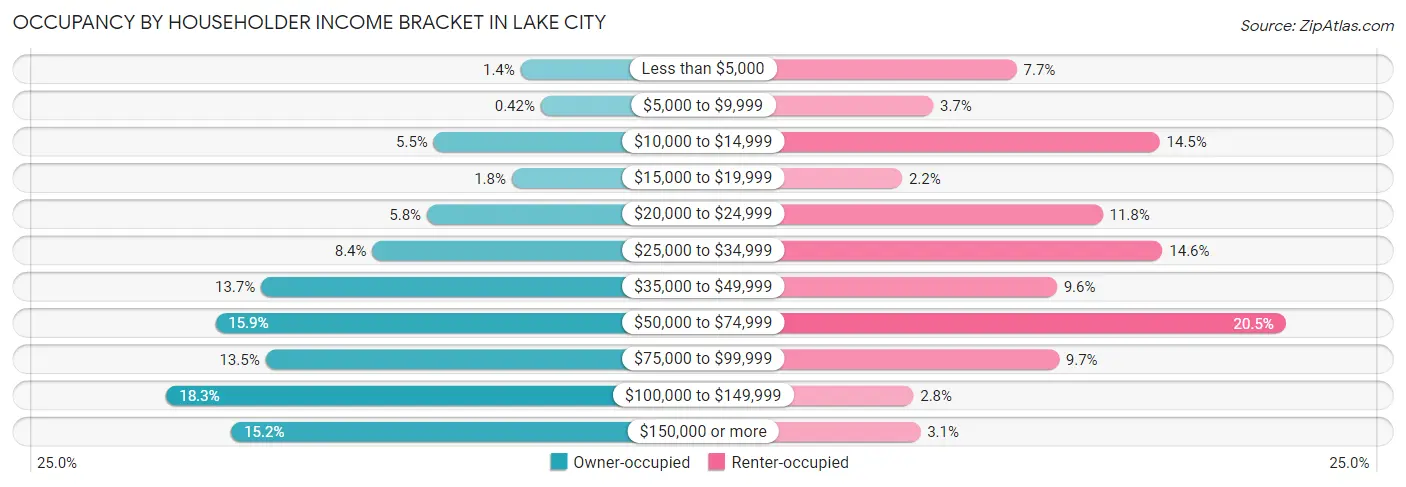
| Income Bracket | Owner-occupied | Renter-occupied |
| Less than $5,000 | 26 (1.4%) | 229 (7.7%) |
| $5,000 to $9,999 | 8 (0.4%) | 110 (3.7%) |
| $10,000 to $14,999 | 104 (5.5%) | 432 (14.5%) |
| $15,000 to $19,999 | 34 (1.8%) | 66 (2.2%) |
| $20,000 to $24,999 | 110 (5.8%) | 351 (11.8%) |
| $25,000 to $34,999 | 159 (8.4%) | 436 (14.6%) |
| $35,000 to $49,999 | 259 (13.7%) | 286 (9.6%) |
| $50,000 to $74,999 | 300 (15.9%) | 611 (20.5%) |
| $75,000 to $99,999 | 255 (13.5%) | 289 (9.7%) |
| $100,000 to $149,999 | 344 (18.2%) | 82 (2.8%) |
| $150,000 or more | 286 (15.2%) | 92 (3.1%) |
| Total | 1,885 (100.0%) | 2,984 (100.0%) |
Monthly Housing Cost Tiers in Lake City
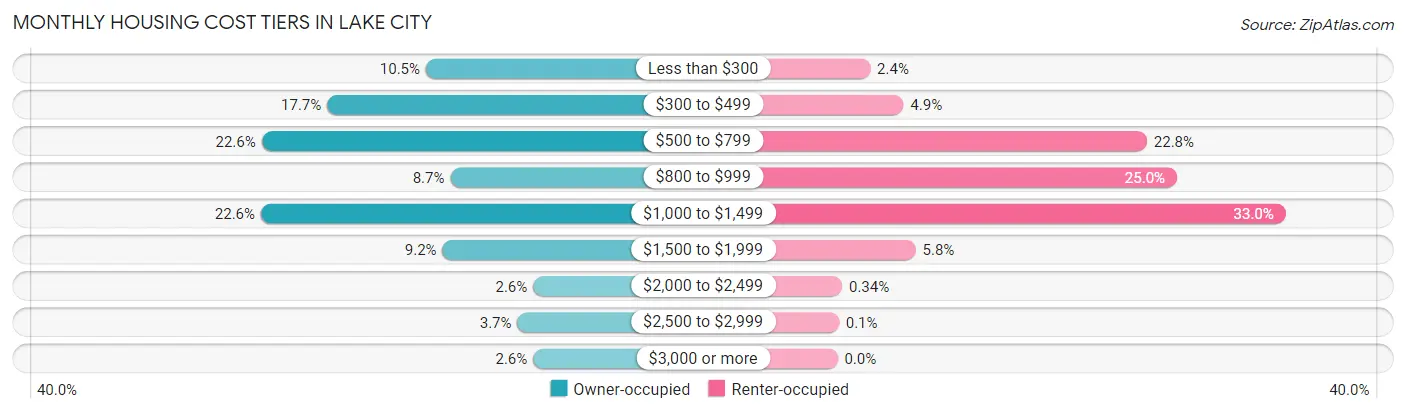
| Monthly Cost | Owner-occupied | Renter-occupied |
| Less than $300 | 197 (10.4%) | 72 (2.4%) |
| $300 to $499 | 334 (17.7%) | 145 (4.9%) |
| $500 to $799 | 425 (22.6%) | 680 (22.8%) |
| $800 to $999 | 163 (8.6%) | 746 (25.0%) |
| $1,000 to $1,499 | 426 (22.6%) | 985 (33.0%) |
| $1,500 to $1,999 | 174 (9.2%) | 172 (5.8%) |
| $2,000 to $2,499 | 48 (2.5%) | 10 (0.3%) |
| $2,500 to $2,999 | 70 (3.7%) | 3 (0.1%) |
| $3,000 or more | 48 (2.5%) | 0 (0.0%) |
| Total | 1,885 (100.0%) | 2,984 (100.0%) |
Physical Housing Characteristics in Lake City
Housing Structures in Lake City
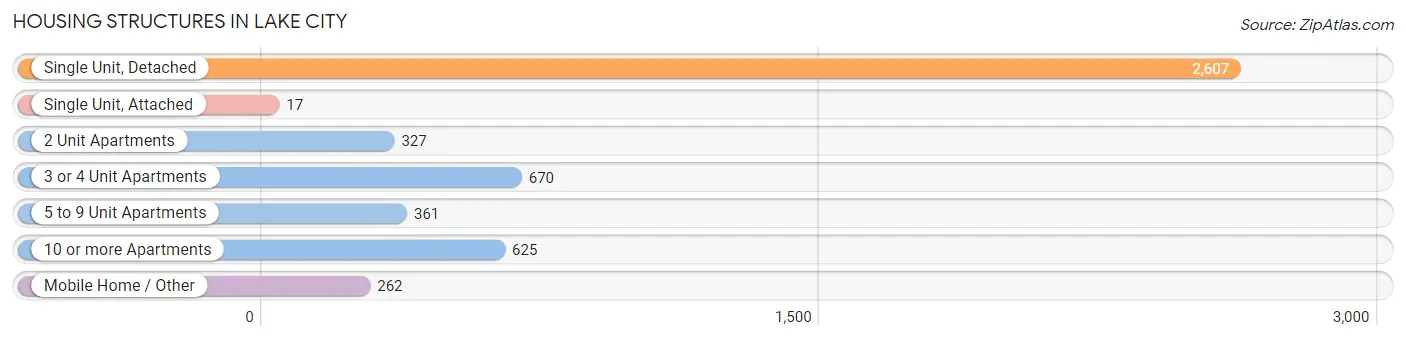
| Structure Type | # Housing Units | % Housing Units |
| Single Unit, Detached | 2,607 | 53.5% |
| Single Unit, Attached | 17 | 0.4% |
| 2 Unit Apartments | 327 | 6.7% |
| 3 or 4 Unit Apartments | 670 | 13.8% |
| 5 to 9 Unit Apartments | 361 | 7.4% |
| 10 or more Apartments | 625 | 12.8% |
| Mobile Home / Other | 262 | 5.4% |
| Total | 4,869 | 100.0% |
Housing Structures by Occupancy in Lake City
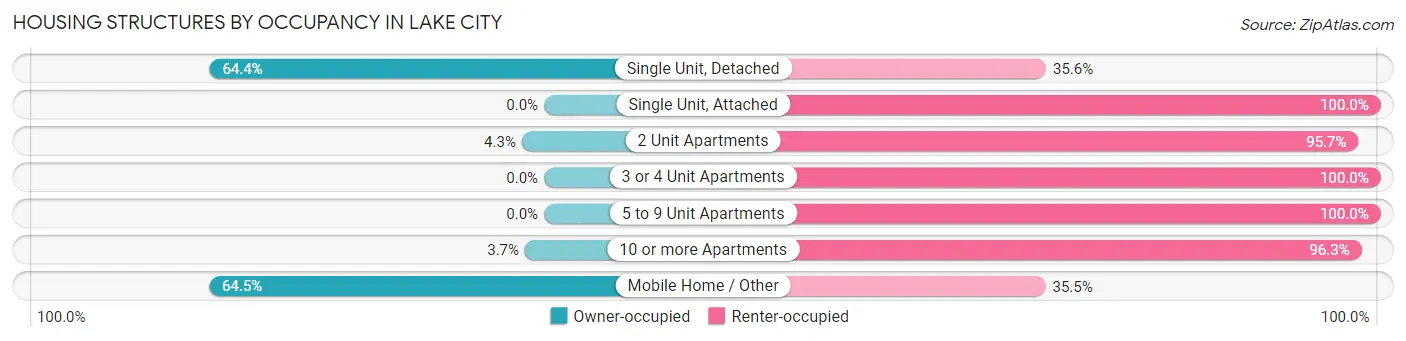
| Structure Type | Owner-occupied | Renter-occupied |
| Single Unit, Detached | 1,679 (64.4%) | 928 (35.6%) |
| Single Unit, Attached | 0 (0.0%) | 17 (100.0%) |
| 2 Unit Apartments | 14 (4.3%) | 313 (95.7%) |
| 3 or 4 Unit Apartments | 0 (0.0%) | 670 (100.0%) |
| 5 to 9 Unit Apartments | 0 (0.0%) | 361 (100.0%) |
| 10 or more Apartments | 23 (3.7%) | 602 (96.3%) |
| Mobile Home / Other | 169 (64.5%) | 93 (35.5%) |
| Total | 1,885 (38.7%) | 2,984 (61.3%) |
Housing Structures by Number of Rooms in Lake City
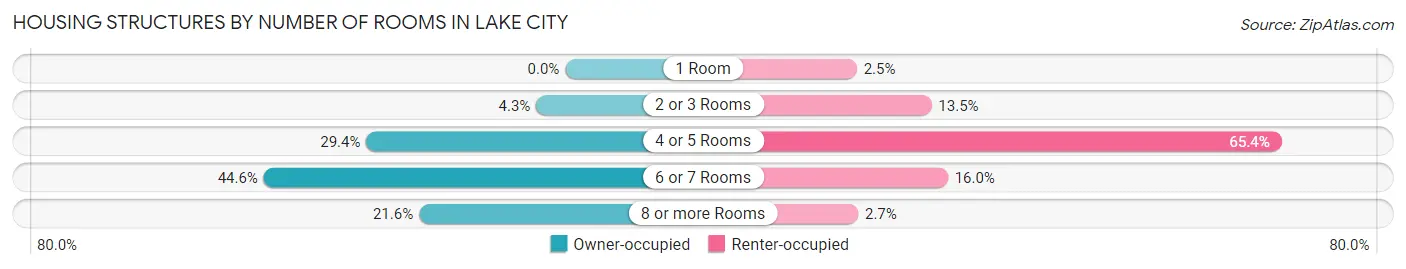
| Number of Rooms | Owner-occupied | Renter-occupied |
| 1 Room | 0 (0.0%) | 74 (2.5%) |
| 2 or 3 Rooms | 81 (4.3%) | 404 (13.5%) |
| 4 or 5 Rooms | 555 (29.4%) | 1,950 (65.3%) |
| 6 or 7 Rooms | 841 (44.6%) | 476 (16.0%) |
| 8 or more Rooms | 408 (21.6%) | 80 (2.7%) |
| Total | 1,885 (100.0%) | 2,984 (100.0%) |
Housing Structure by Heating Type in Lake City
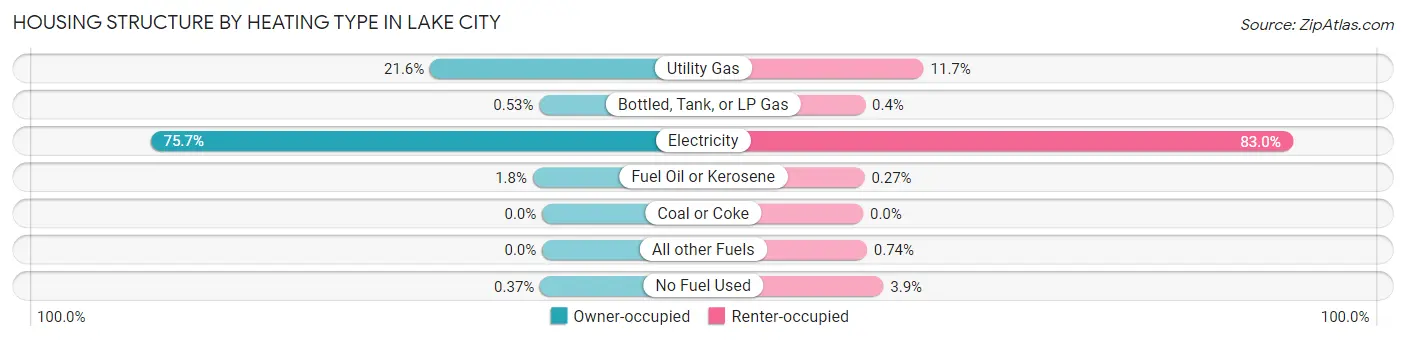
| Heating Type | Owner-occupied | Renter-occupied |
| Utility Gas | 408 (21.6%) | 349 (11.7%) |
| Bottled, Tank, or LP Gas | 10 (0.5%) | 12 (0.4%) |
| Electricity | 1,426 (75.6%) | 2,476 (83.0%) |
| Fuel Oil or Kerosene | 34 (1.8%) | 8 (0.3%) |
| Coal or Coke | 0 (0.0%) | 0 (0.0%) |
| All other Fuels | 0 (0.0%) | 22 (0.7%) |
| No Fuel Used | 7 (0.4%) | 117 (3.9%) |
| Total | 1,885 (100.0%) | 2,984 (100.0%) |
Household Vehicle Usage in Lake City
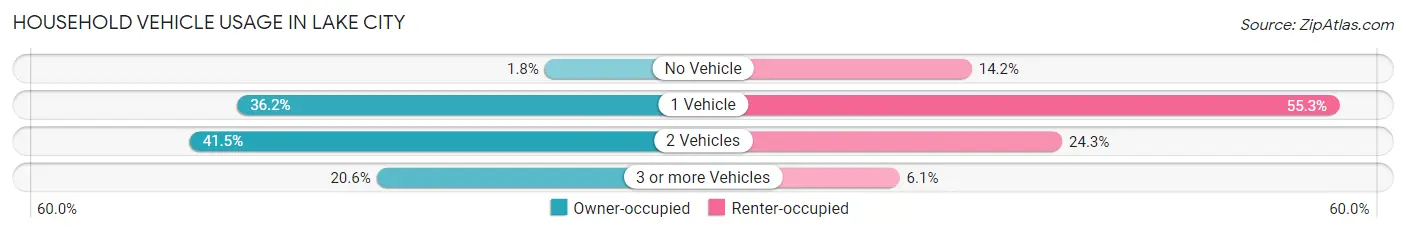
| Vehicles per Household | Owner-occupied | Renter-occupied |
| No Vehicle | 33 (1.8%) | 424 (14.2%) |
| 1 Vehicle | 682 (36.2%) | 1,651 (55.3%) |
| 2 Vehicles | 782 (41.5%) | 726 (24.3%) |
| 3 or more Vehicles | 388 (20.6%) | 183 (6.1%) |
| Total | 1,885 (100.0%) | 2,984 (100.0%) |
Real Estate & Mortgages in Lake City
Real Estate and Mortgage Overview in Lake City
| Characteristic | Without Mortgage | With Mortgage |
| Housing Units | 849 | 1,036 |
| Median Property Value | $107,500 | $172,400 |
| Median Household Income | $42,550 | $192 |
| Monthly Housing Costs | $458 | $48 |
| Real Estate Taxes | $913 | $4 |
Property Value by Mortgage Status in Lake City
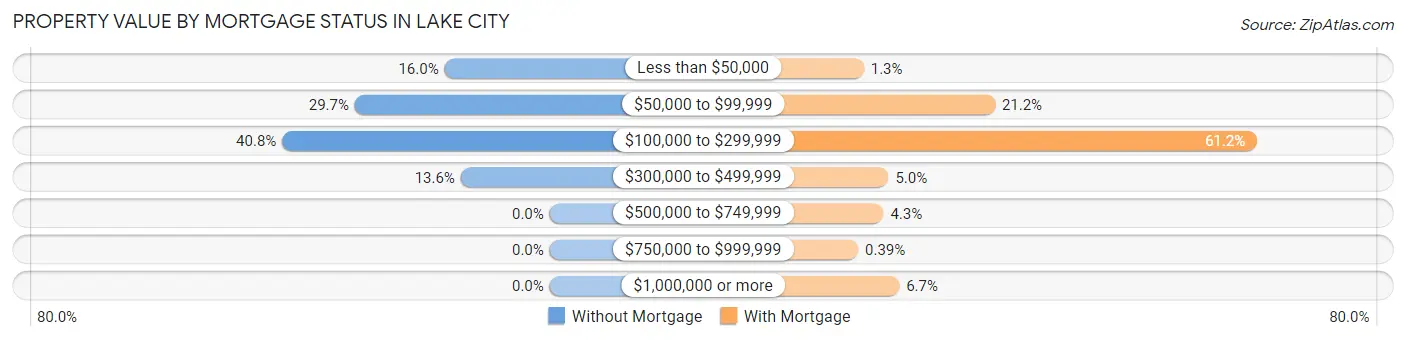
| Property Value | Without Mortgage | With Mortgage |
| Less than $50,000 | 136 (16.0%) | 13 (1.3%) |
| $50,000 to $99,999 | 252 (29.7%) | 220 (21.2%) |
| $100,000 to $299,999 | 346 (40.7%) | 634 (61.2%) |
| $300,000 to $499,999 | 115 (13.6%) | 52 (5.0%) |
| $500,000 to $749,999 | 0 (0.0%) | 44 (4.3%) |
| $750,000 to $999,999 | 0 (0.0%) | 4 (0.4%) |
| $1,000,000 or more | 0 (0.0%) | 69 (6.7%) |
| Total | 849 (100.0%) | 1,036 (100.0%) |
Household Income by Mortgage Status in Lake City
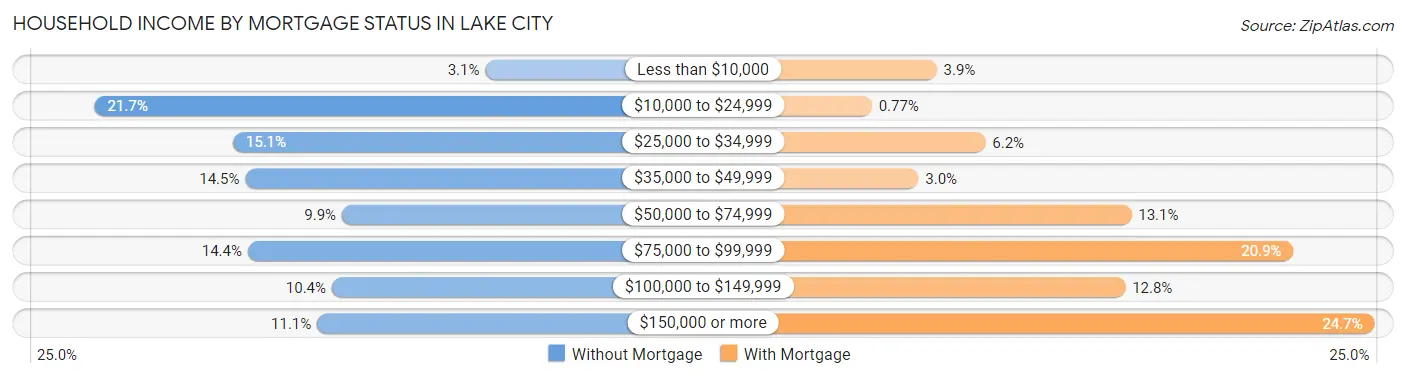
| Household Income | Without Mortgage | With Mortgage |
| Less than $10,000 | 26 (3.1%) | 40 (3.9%) |
| $10,000 to $24,999 | 184 (21.7%) | 8 (0.8%) |
| $25,000 to $34,999 | 128 (15.1%) | 64 (6.2%) |
| $35,000 to $49,999 | 123 (14.5%) | 31 (3.0%) |
| $50,000 to $74,999 | 84 (9.9%) | 136 (13.1%) |
| $75,000 to $99,999 | 122 (14.4%) | 216 (20.8%) |
| $100,000 to $149,999 | 88 (10.4%) | 133 (12.8%) |
| $150,000 or more | 94 (11.1%) | 256 (24.7%) |
| Total | 849 (100.0%) | 1,036 (100.0%) |
Property Value to Household Income Ratio in Lake City
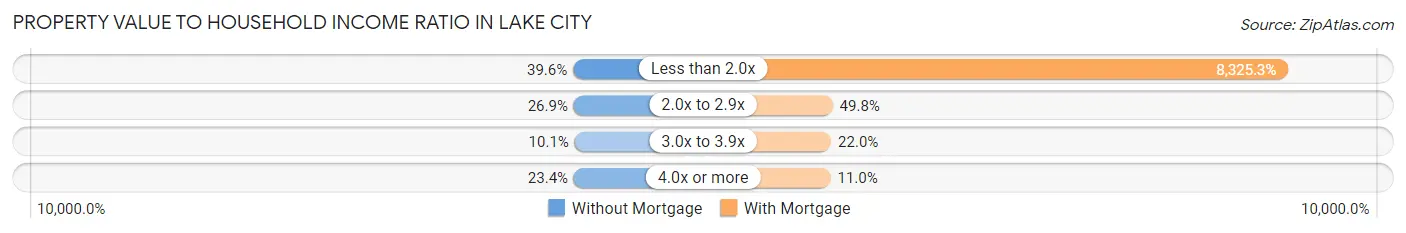
| Value-to-Income Ratio | Without Mortgage | With Mortgage |
| Less than 2.0x | 336 (39.6%) | 86,250 (8,325.3%) |
| 2.0x to 2.9x | 228 (26.9%) | 516 (49.8%) |
| 3.0x to 3.9x | 86 (10.1%) | 228 (22.0%) |
| 4.0x or more | 199 (23.4%) | 114 (11.0%) |
| Total | 849 (100.0%) | 1,036 (100.0%) |
Real Estate Taxes by Mortgage Status in Lake City
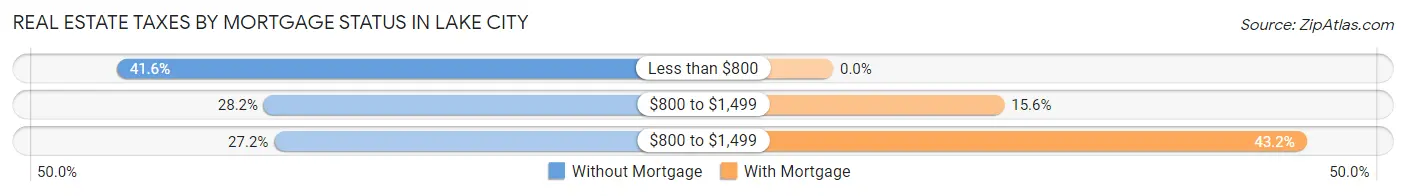
| Property Taxes | Without Mortgage | With Mortgage |
| Less than $800 | 353 (41.6%) | 0 (0.0%) |
| $800 to $1,499 | 239 (28.1%) | 162 (15.6%) |
| $800 to $1,499 | 231 (27.2%) | 448 (43.2%) |
| Total | 849 (100.0%) | 1,036 (100.0%) |
Health & Disability in Lake City
Health Insurance Coverage by Age in Lake City
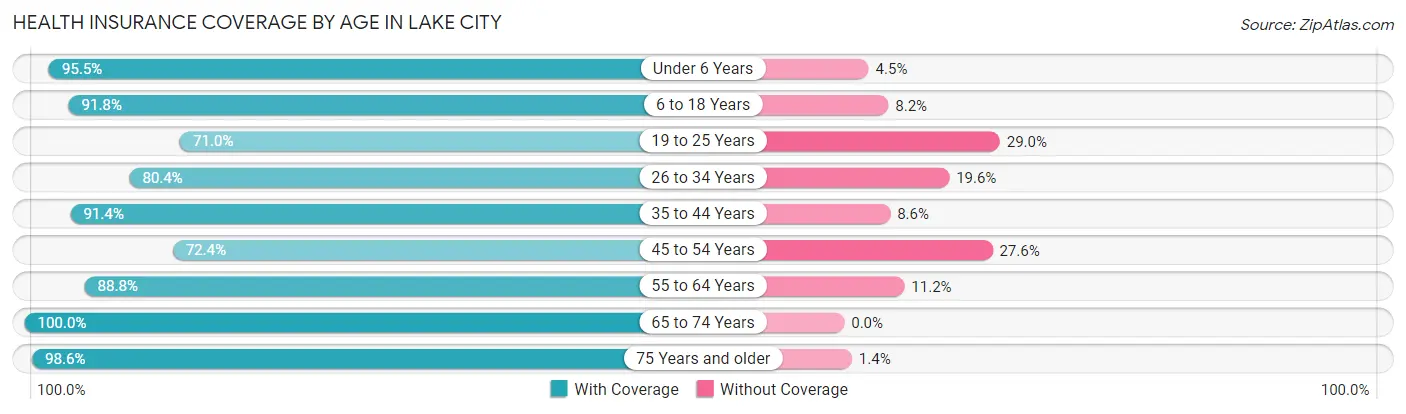
| Age Bracket | With Coverage | Without Coverage |
| Under 6 Years | 1,136 (95.5%) | 54 (4.5%) |
| 6 to 18 Years | 2,069 (91.8%) | 185 (8.2%) |
| 19 to 25 Years | 683 (71.0%) | 279 (29.0%) |
| 26 to 34 Years | 917 (80.4%) | 223 (19.6%) |
| 35 to 44 Years | 1,495 (91.4%) | 140 (8.6%) |
| 45 to 54 Years | 791 (72.4%) | 302 (27.6%) |
| 55 to 64 Years | 1,243 (88.8%) | 157 (11.2%) |
| 65 to 74 Years | 1,068 (100.0%) | 0 (0.0%) |
| 75 Years and older | 764 (98.6%) | 11 (1.4%) |
| Total | 10,166 (88.3%) | 1,351 (11.7%) |
Health Insurance Coverage by Citizenship Status in Lake City
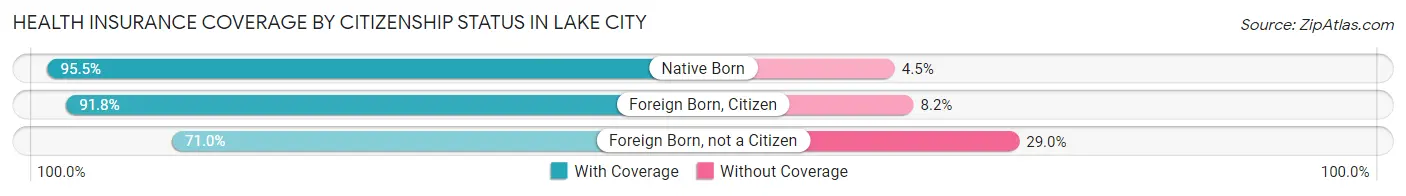
| Citizenship Status | With Coverage | Without Coverage |
| Native Born | 1,136 (95.5%) | 54 (4.5%) |
| Foreign Born, Citizen | 2,069 (91.8%) | 185 (8.2%) |
| Foreign Born, not a Citizen | 683 (71.0%) | 279 (29.0%) |
Health Insurance Coverage by Household Income in Lake City
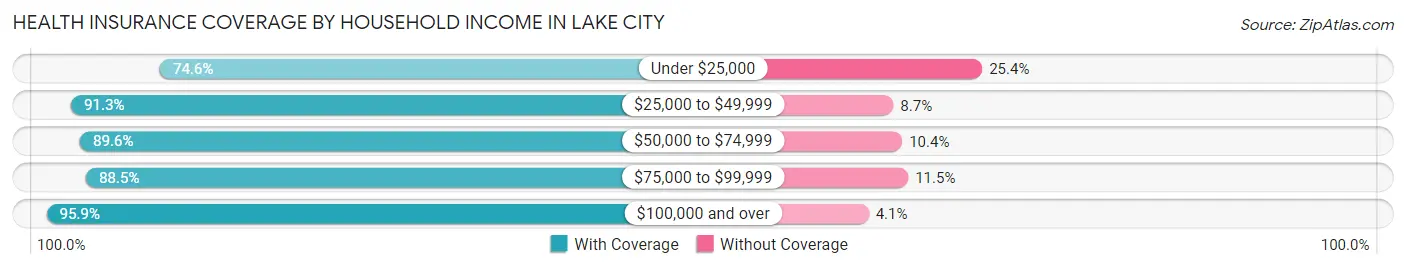
| Household Income | With Coverage | Without Coverage |
| Under $25,000 | 1,679 (74.6%) | 571 (25.4%) |
| $25,000 to $49,999 | 2,458 (91.3%) | 235 (8.7%) |
| $50,000 to $74,999 | 1,897 (89.6%) | 220 (10.4%) |
| $75,000 to $99,999 | 1,591 (88.5%) | 207 (11.5%) |
| $100,000 and over | 2,474 (95.9%) | 106 (4.1%) |
Public vs Private Health Insurance Coverage by Age in Lake City
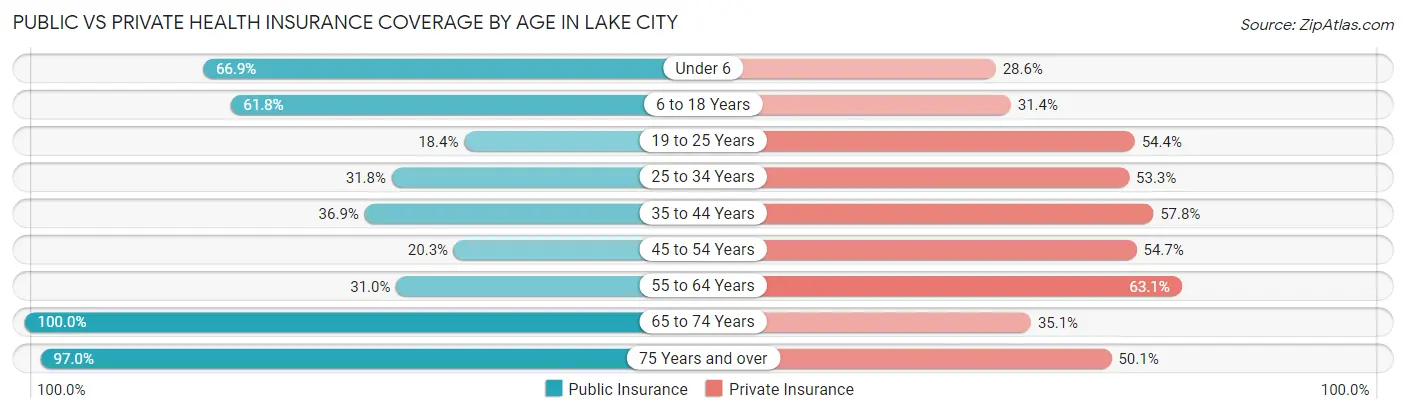
| Age Bracket | Public Insurance | Private Insurance |
| Under 6 | 796 (66.9%) | 340 (28.6%) |
| 6 to 18 Years | 1,393 (61.8%) | 707 (31.4%) |
| 19 to 25 Years | 177 (18.4%) | 523 (54.4%) |
| 25 to 34 Years | 363 (31.8%) | 608 (53.3%) |
| 35 to 44 Years | 603 (36.9%) | 945 (57.8%) |
| 45 to 54 Years | 222 (20.3%) | 598 (54.7%) |
| 55 to 64 Years | 434 (31.0%) | 883 (63.1%) |
| 65 to 74 Years | 1,068 (100.0%) | 375 (35.1%) |
| 75 Years and over | 752 (97.0%) | 388 (50.1%) |
| Total | 5,808 (50.4%) | 5,367 (46.6%) |
Disability Status by Sex by Age in Lake City
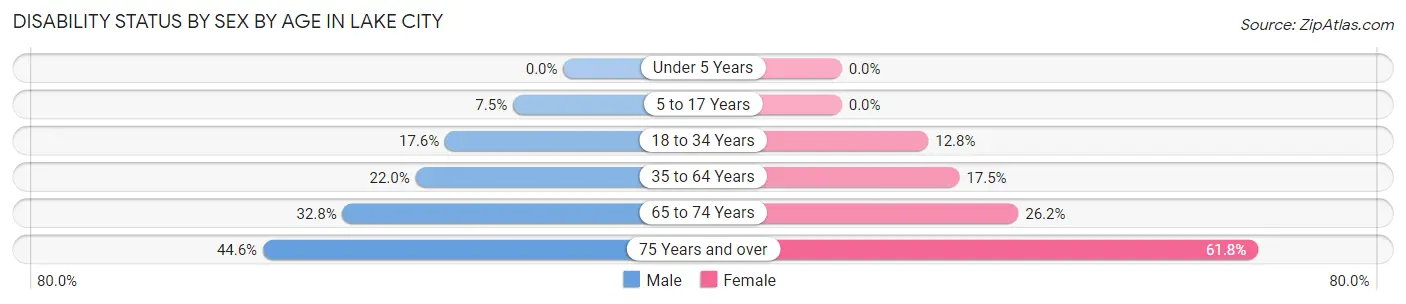
| Age Bracket | Male | Female |
| Under 5 Years | 0 (0.0%) | 0 (0.0%) |
| 5 to 17 Years | 83 (7.5%) | 0 (0.0%) |
| 18 to 34 Years | 164 (17.6%) | 179 (12.8%) |
| 35 to 64 Years | 421 (22.0%) | 386 (17.5%) |
| 65 to 74 Years | 160 (32.8%) | 152 (26.2%) |
| 75 Years and over | 153 (44.6%) | 267 (61.8%) |
Disability Class by Sex by Age in Lake City
Disability Class: Hearing Difficulty
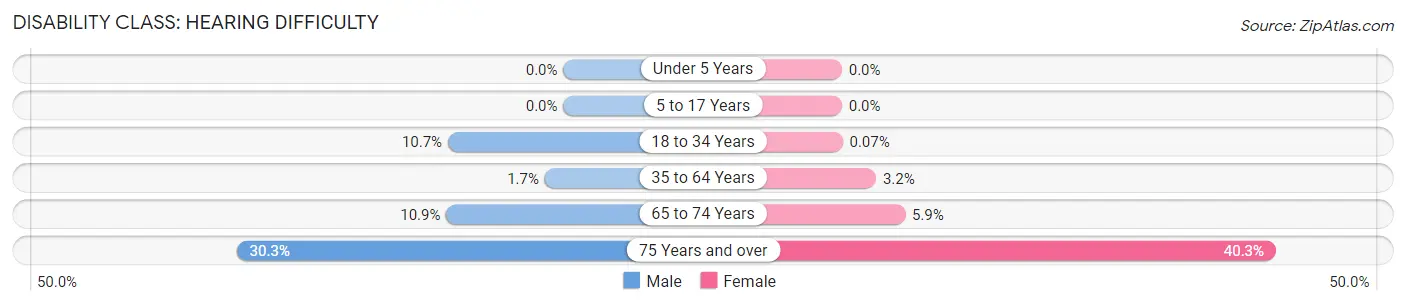
| Age Bracket | Male | Female |
| Under 5 Years | 0 (0.0%) | 0 (0.0%) |
| 5 to 17 Years | 0 (0.0%) | 0 (0.0%) |
| 18 to 34 Years | 100 (10.7%) | 1 (0.1%) |
| 35 to 64 Years | 33 (1.7%) | 70 (3.2%) |
| 65 to 74 Years | 53 (10.9%) | 34 (5.9%) |
| 75 Years and over | 104 (30.3%) | 174 (40.3%) |
Disability Class: Vision Difficulty
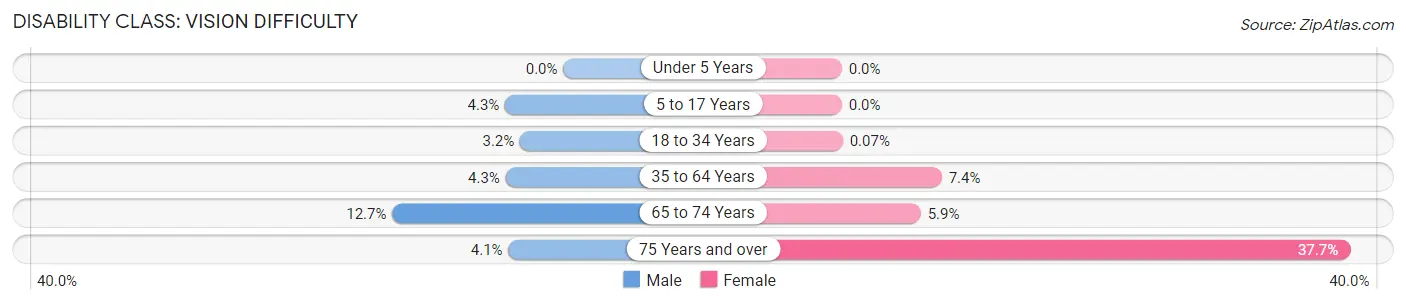
| Age Bracket | Male | Female |
| Under 5 Years | 0 (0.0%) | 0 (0.0%) |
| 5 to 17 Years | 48 (4.3%) | 0 (0.0%) |
| 18 to 34 Years | 30 (3.2%) | 1 (0.1%) |
| 35 to 64 Years | 82 (4.3%) | 164 (7.4%) |
| 65 to 74 Years | 62 (12.7%) | 34 (5.9%) |
| 75 Years and over | 14 (4.1%) | 163 (37.7%) |
Disability Class: Cognitive Difficulty
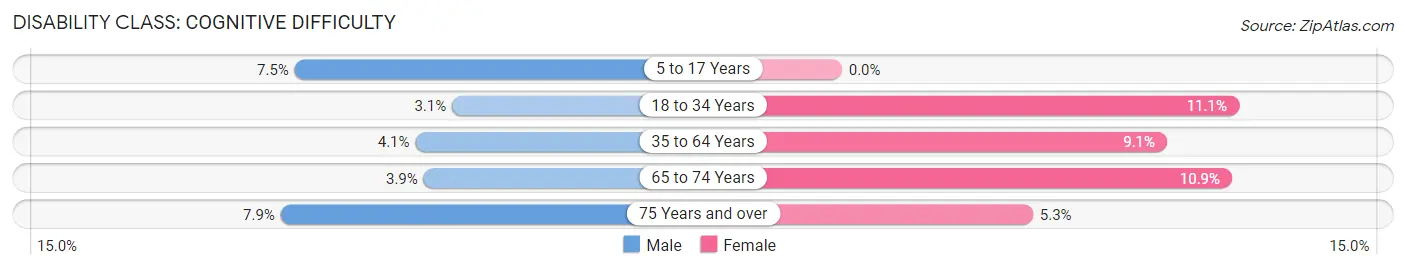
| Age Bracket | Male | Female |
| 5 to 17 Years | 83 (7.5%) | 0 (0.0%) |
| 18 to 34 Years | 29 (3.1%) | 154 (11.1%) |
| 35 to 64 Years | 79 (4.1%) | 200 (9.0%) |
| 65 to 74 Years | 19 (3.9%) | 63 (10.9%) |
| 75 Years and over | 27 (7.9%) | 23 (5.3%) |
Disability Class: Ambulatory Difficulty
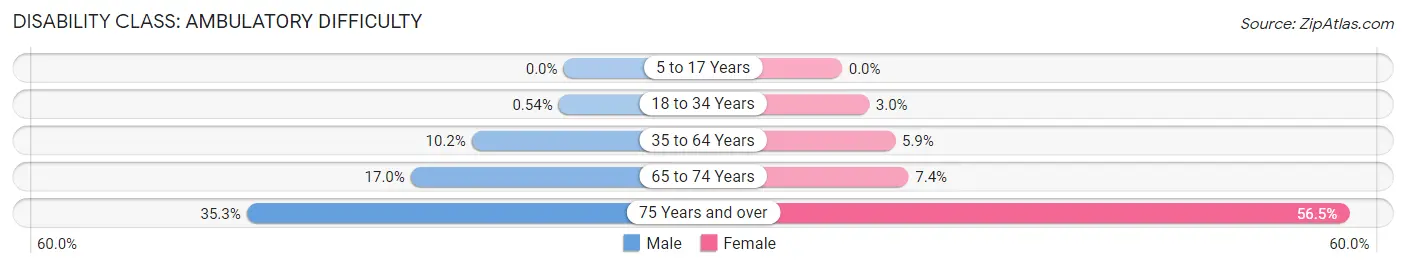
| Age Bracket | Male | Female |
| 5 to 17 Years | 0 (0.0%) | 0 (0.0%) |
| 18 to 34 Years | 5 (0.5%) | 42 (3.0%) |
| 35 to 64 Years | 196 (10.2%) | 131 (5.9%) |
| 65 to 74 Years | 83 (17.0%) | 43 (7.4%) |
| 75 Years and over | 121 (35.3%) | 244 (56.5%) |
Disability Class: Self-Care Difficulty
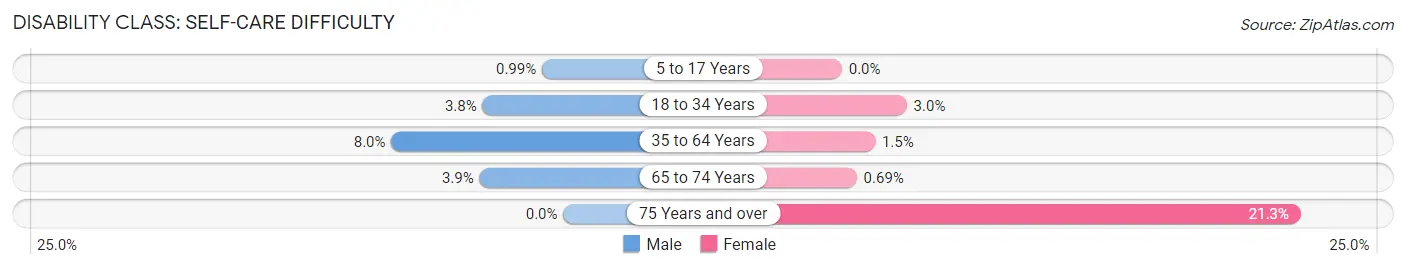
| Age Bracket | Male | Female |
| 5 to 17 Years | 11 (1.0%) | 0 (0.0%) |
| 18 to 34 Years | 35 (3.7%) | 42 (3.0%) |
| 35 to 64 Years | 153 (8.0%) | 34 (1.5%) |
| 65 to 74 Years | 19 (3.9%) | 4 (0.7%) |
| 75 Years and over | 0 (0.0%) | 92 (21.3%) |
Technology Access in Lake City
Computing Device Access in Lake City
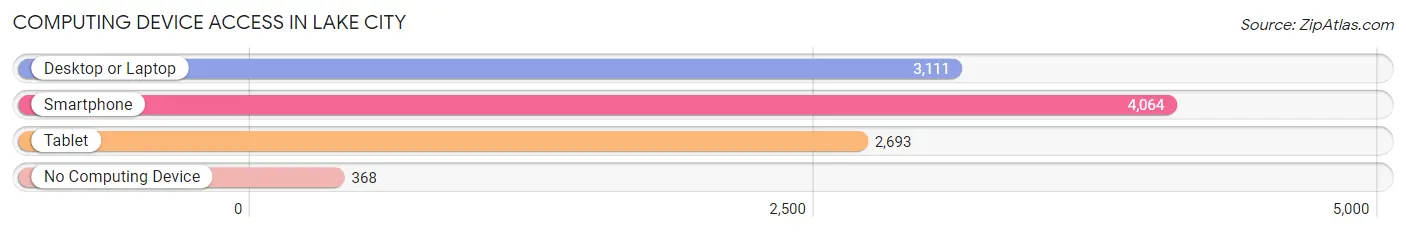
| Device Type | # Households | % Households |
| Desktop or Laptop | 3,111 | 63.9% |
| Smartphone | 4,064 | 83.5% |
| Tablet | 2,693 | 55.3% |
| No Computing Device | 368 | 7.6% |
| Total | 4,869 | 100.0% |
Internet Access in Lake City
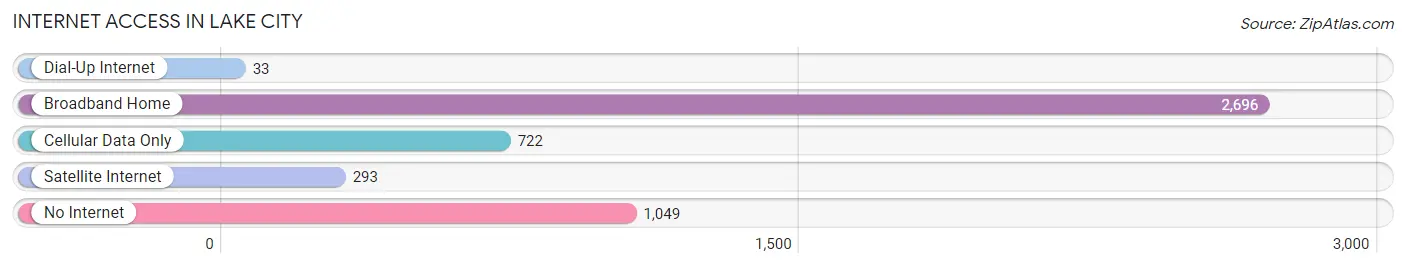
| Internet Type | # Households | % Households |
| Dial-Up Internet | 33 | 0.7% |
| Broadband Home | 2,696 | 55.4% |
| Cellular Data Only | 722 | 14.8% |
| Satellite Internet | 293 | 6.0% |
| No Internet | 1,049 | 21.5% |
| Total | 4,869 | 100.0% |
Lake City Summary
City of Lake City
Lake City is a city located in Columbia County, Florida, United States. It is the county seat of Columbia County and is the largest city in the county. The population of Lake City was 12,046 as of the 2010 census. The city is situated in the heart of the Suwannee Valley, and is known for its historic downtown, which is listed on the National Register of Historic Places.
History
The area that is now Lake City was first settled in 1859 by a group of settlers from Georgia. The settlement was originally known as Alligator, but was later renamed Lake City after the nearby Lake DeSoto. The city was incorporated in 1875 and was designated as the county seat of Columbia County.
In the late 19th century, Lake City was a major center for the timber industry, and the city was home to several large sawmills. The city also became a major railroad hub, with the Florida Railroad, the Atlantic Coast Line Railroad, and the Seaboard Air Line Railroad all having lines that ran through the city.
In the early 20th century, Lake City was a major center for the phosphate industry, and the city was home to several large phosphate mines. The city also became a major center for the production of paper products, and the city was home to several large paper mills.
Geography
Lake City is located in the heart of the Suwannee Valley, in the north-central part of Florida. The city is situated at the intersection of Interstate 10 and U.S. Highway 90. The city is located about 60 miles west of Jacksonville and about 70 miles east of Tallahassee.
The city is located at the headwaters of the Suwannee River, and is surrounded by several lakes, including Lake DeSoto, Lake Isabella, and Lake Montgomery. The city is also located near the Osceola National Forest, which is a popular destination for outdoor recreation.
Economy
The economy of Lake City is largely based on the service industry, with the city being home to several large hospitals, medical centers, and other health care facilities. The city is also home to several large manufacturing companies, including a paper mill, a phosphate mine, and a sawmill.
The city is also home to several large retail stores, including Walmart, Lowe’s, and Target. The city is also home to several large restaurants, including Applebee’s, Chili’s, and Olive Garden.
Demographics
As of the 2010 census, the population of Lake City was 12,046. The racial makeup of the city was 68.3% White, 25.2% African American, 0.5% Native American, 1.2% Asian, 0.1% Pacific Islander, 2.7% from other races, and 2.2% from two or more races. Hispanic or Latino of any race were 8.2% of the population.
The median income for a household in the city was $30,912, and the median income for a family was $37,813. The per capita income for the city was $17,845. About 17.2% of families and 21.3% of the population were below the poverty line, including 28.2% of those under age 18 and 14.2% of those age 65 or over.
Common Questions
What is Per Capita Income in Lake City?
Per Capita income in Lake City is $26,949.
What is the Median Family Income in Lake City?
Median Family Income in Lake City is $63,399.
What is the Median Household income in Lake City?
Median Household Income in Lake City is $46,172.
What is Income or Wage Gap in Lake City?
Income or Wage Gap in Lake City is 20.6%.
Women in Lake City earn 79.4 cents for every dollar earned by a man.
What is Family Income Deficit in Lake City?
Family Income Deficit in Lake City is $9,026.
Families that are below poverty line in Lake City earn $9,026 less on average than the poverty threshold level.
What is Inequality or Gini Index in Lake City?
Inequality or Gini Index in Lake City is 0.53.
What is the Total Population of Lake City?
Total Population of Lake City is 12,307.
What is the Total Male Population of Lake City?
Total Male Population of Lake City is 5,883.
What is the Total Female Population of Lake City?
Total Female Population of Lake City is 6,424.
What is the Ratio of Males per 100 Females in Lake City?
There are 91.58 Males per 100 Females in Lake City.
What is the Ratio of Females per 100 Males in Lake City?
There are 109.20 Females per 100 Males in Lake City.
What is the Median Population Age in Lake City?
Median Population Age in Lake City is 37.9 Years.
What is the Average Family Size in Lake City
Average Family Size in Lake City is 3.2 People.
What is the Average Household Size in Lake City
Average Household Size in Lake City is 2.4 People.
How Large is the Labor Force in Lake City?
There are 5,295 People in the Labor Forcein in Lake City.
What is the Percentage of People in the Labor Force in Lake City?
56.1% of People are in the Labor Force in Lake City.
What is the Unemployment Rate in Lake City?
Unemployment Rate in Lake City is 5.4%.