Cleveland, FL Map & Demographics
Cleveland Map
Cleveland Overview
$39,377
PER CAPITA INCOME
$65,949
AVG FAMILY INCOME
$44,971
AVG HOUSEHOLD INCOME
0.49
INEQUALITY / GINI INDEX
2,466
TOTAL POPULATION
1,188
MALE POPULATION
1,278
FEMALE POPULATION
92.96
MALES / 100 FEMALES
107.58
FEMALES / 100 MALES
66.0
MEDIAN AGE
2.3
AVG FAMILY SIZE
1.7
AVG HOUSEHOLD SIZE
640
LABOR FORCE [ PEOPLE ]
27.4%
PERCENT IN LABOR FORCE
Income in Cleveland
Income Overview in Cleveland
Per Capita Income in Cleveland is $39,377, while median incomes of families and households are $65,949 and $44,971 respectively.
| Characteristic | Number | Measure |
| Per Capita Income | 2,466 | $39,377 |
| Median Family Income | 676 | $65,949 |
| Mean Family Income | 676 | $98,825 |
| Median Household Income | 1,436 | $44,971 |
| Mean Household Income | 1,436 | $65,210 |
| Income Deficit | 676 | $0 |
| Wage / Income Gap (%) | 2,466 | 0.00% |
| Wage / Income Gap ($) | 2,466 | 100.00¢ per $1 |
| Gini / Inequality Index | 2,466 | 0.49 |
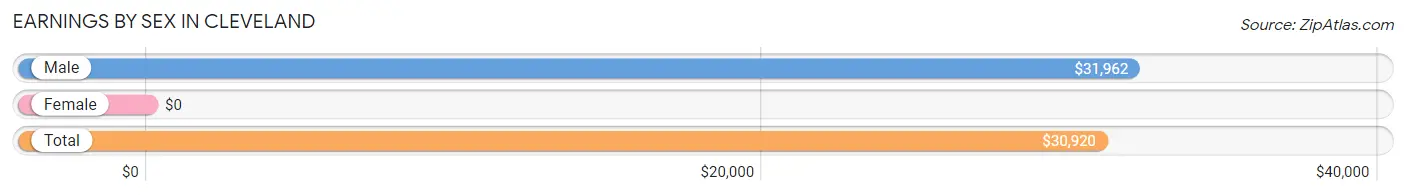
Earnings by Sex in Cleveland
| Sex | Number | Average Earnings |
| Male | 363 (51.9%) | $31,962 |
| Female | 337 (48.1%) | $0 |
| Total | 700 (100.0%) | $30,920 |
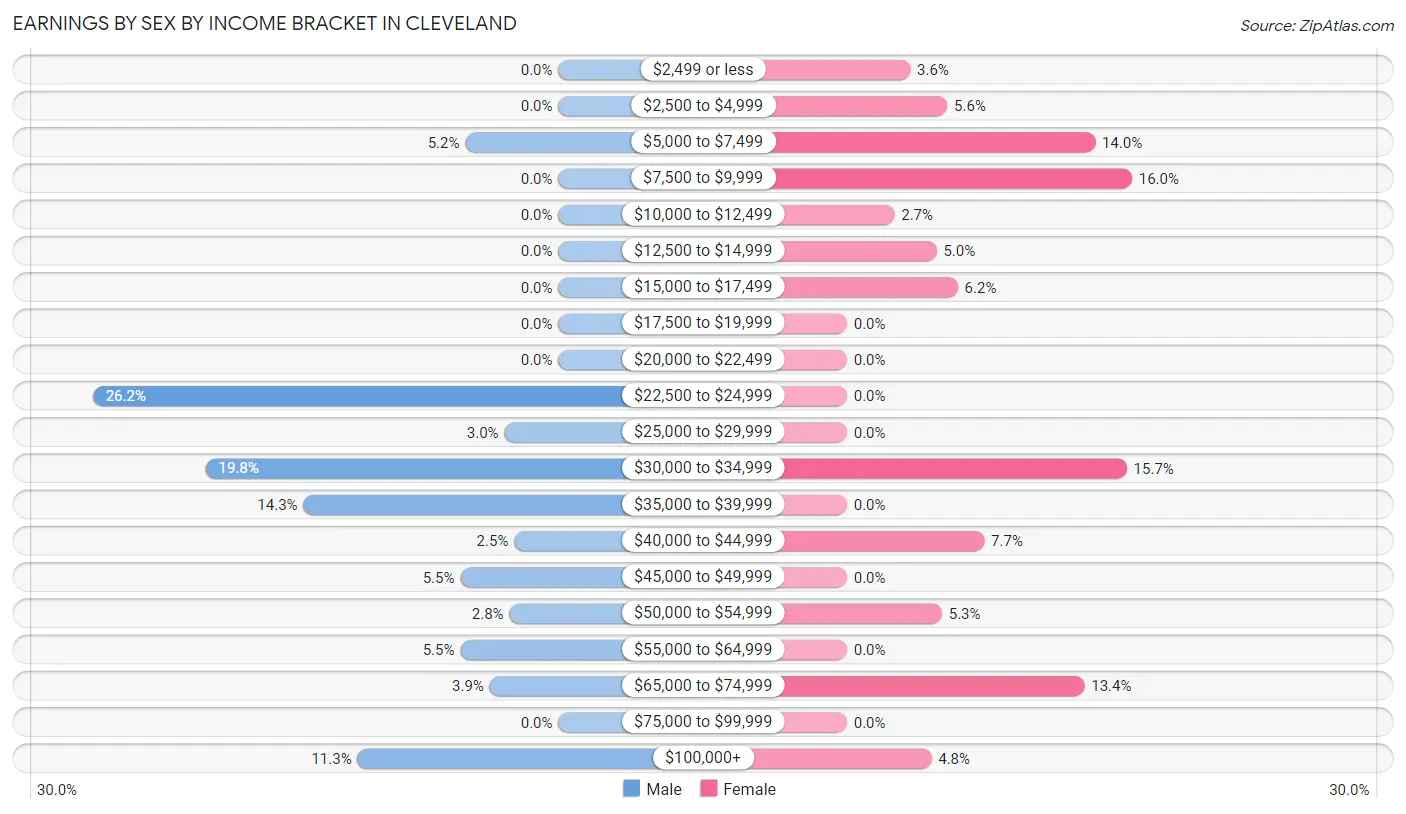
Earnings by Sex by Income Bracket in Cleveland
The most common earnings brackets in Cleveland are $22,500 to $24,999 for men (95 | 26.2%) and $7,500 to $9,999 for women (54 | 16.0%).
| Income | Male | Female |
| $2,499 or less | 0 (0.0%) | 12 (3.6%) |
| $2,500 to $4,999 | 0 (0.0%) | 19 (5.6%) |
| $5,000 to $7,499 | 19 (5.2%) | 47 (14.0%) |
| $7,500 to $9,999 | 0 (0.0%) | 54 (16.0%) |
| $10,000 to $12,499 | 0 (0.0%) | 9 (2.7%) |
| $12,500 to $14,999 | 0 (0.0%) | 17 (5.0%) |
| $15,000 to $17,499 | 0 (0.0%) | 21 (6.2%) |
| $17,500 to $19,999 | 0 (0.0%) | 0 (0.0%) |
| $20,000 to $22,499 | 0 (0.0%) | 0 (0.0%) |
| $22,500 to $24,999 | 95 (26.2%) | 0 (0.0%) |
| $25,000 to $29,999 | 11 (3.0%) | 0 (0.0%) |
| $30,000 to $34,999 | 72 (19.8%) | 53 (15.7%) |
| $35,000 to $39,999 | 52 (14.3%) | 0 (0.0%) |
| $40,000 to $44,999 | 9 (2.5%) | 26 (7.7%) |
| $45,000 to $49,999 | 20 (5.5%) | 0 (0.0%) |
| $50,000 to $54,999 | 10 (2.8%) | 18 (5.3%) |
| $55,000 to $64,999 | 20 (5.5%) | 0 (0.0%) |
| $65,000 to $74,999 | 14 (3.9%) | 45 (13.4%) |
| $75,000 to $99,999 | 0 (0.0%) | 0 (0.0%) |
| $100,000+ | 41 (11.3%) | 16 (4.8%) |
| Total | 363 (100.0%) | 337 (100.0%) |
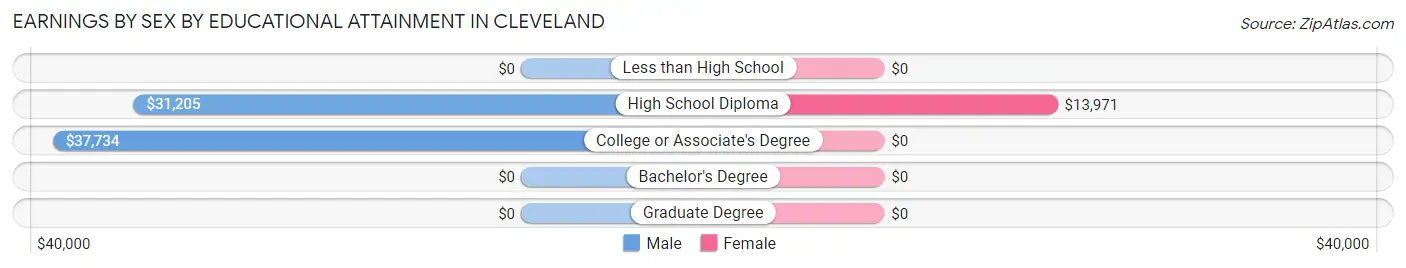
Earnings by Sex by Educational Attainment in Cleveland
| Educational Attainment | Male Income | Female Income |
| Less than High School | - | - |
| High School Diploma | $31,205 | $13,971 |
| College or Associate's Degree | $37,734 | $0 |
| Bachelor's Degree | - | - |
| Graduate Degree | - | - |
| Total | $31,962 | $0 |
Family Income in Cleveland
Family Income Brackets in Cleveland
According to the Cleveland family income data, there are 231 families falling into the $50,000 to $74,999 income range, which is the most common income bracket and makes up 34.2% of all families.
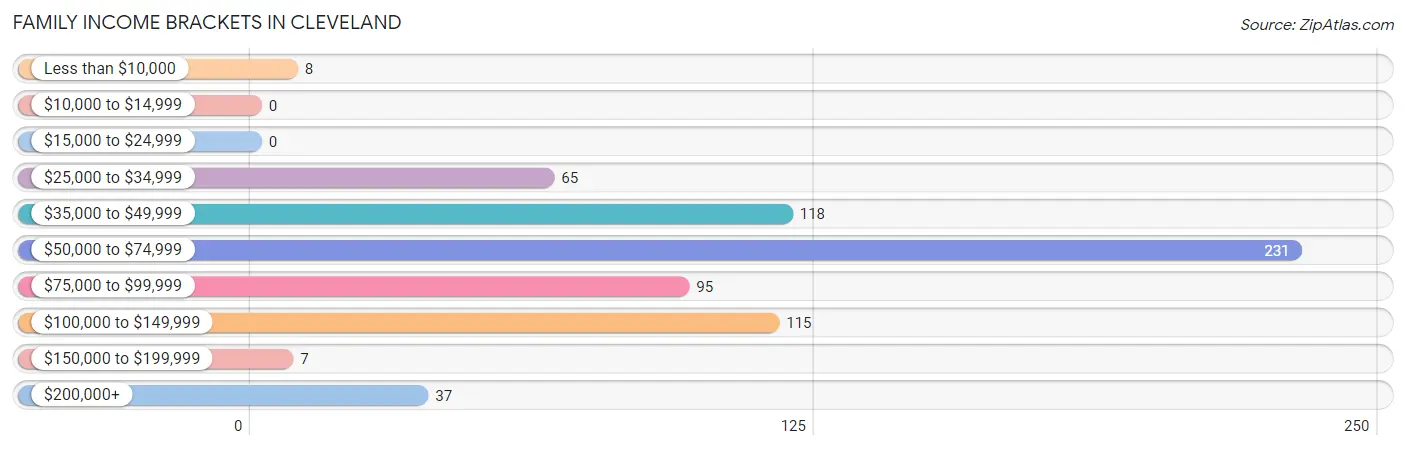
| Income Bracket | # Families | % Families |
| Less than $10,000 | 8 | 1.2% |
| $10,000 to $14,999 | 0 | 0.0% |
| $15,000 to $24,999 | 0 | 0.0% |
| $25,000 to $34,999 | 65 | 9.6% |
| $35,000 to $49,999 | 118 | 17.5% |
| $50,000 to $74,999 | 231 | 34.2% |
| $75,000 to $99,999 | 95 | 14.1% |
| $100,000 to $149,999 | 115 | 17.0% |
| $150,000 to $199,999 | 7 | 1.0% |
| $200,000+ | 37 | 5.5% |
Family Income by Famaliy Size in Cleveland
3-person families (125 | 18.5%) account for the highest median family income in Cleveland with $76,771 per family, while 2-person families (526 | 77.8%) have the highest median income of $32,824 per family member.
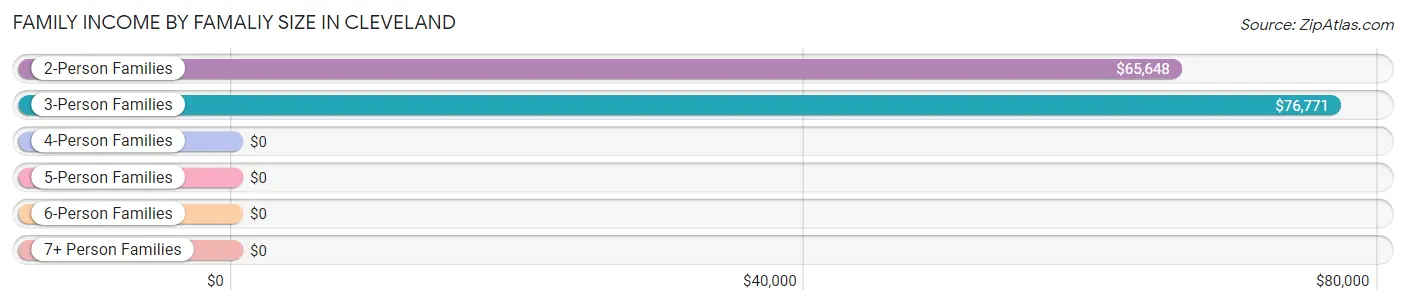
| Income Bracket | # Families | Median Income |
| 2-Person Families | 526 (77.8%) | $65,648 |
| 3-Person Families | 125 (18.5%) | $76,771 |
| 4-Person Families | 25 (3.7%) | $0 |
| 5-Person Families | 0 (0.0%) | $0 |
| 6-Person Families | 0 (0.0%) | $0 |
| 7+ Person Families | 0 (0.0%) | $0 |
| Total | 676 (100.0%) | $65,949 |
Family Income by Number of Earners in Cleveland
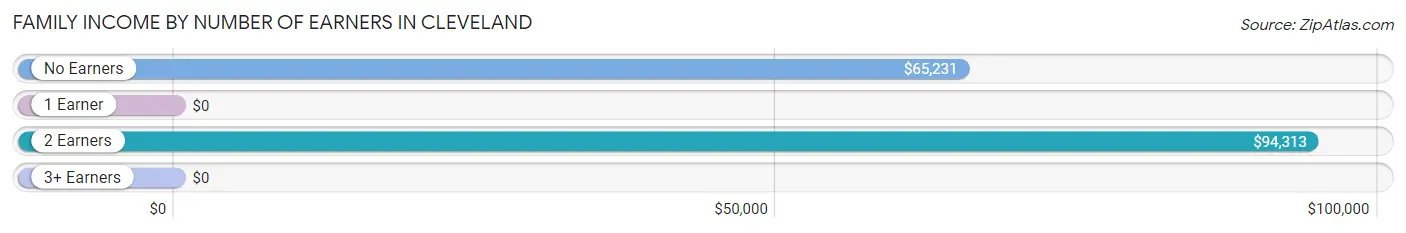
| Number of Earners | # Families | Median Income |
| No Earners | 380 (56.2%) | $65,231 |
| 1 Earner | 145 (21.4%) | $0 |
| 2 Earners | 151 (22.3%) | $94,313 |
| 3+ Earners | 0 (0.0%) | $0 |
| Total | 676 (100.0%) | $65,949 |
Household Income in Cleveland
Household Income Brackets in Cleveland
With 313 households falling in the category, the $50,000 to $74,999 income range is the most frequent in Cleveland, accounting for 21.8% of all households.
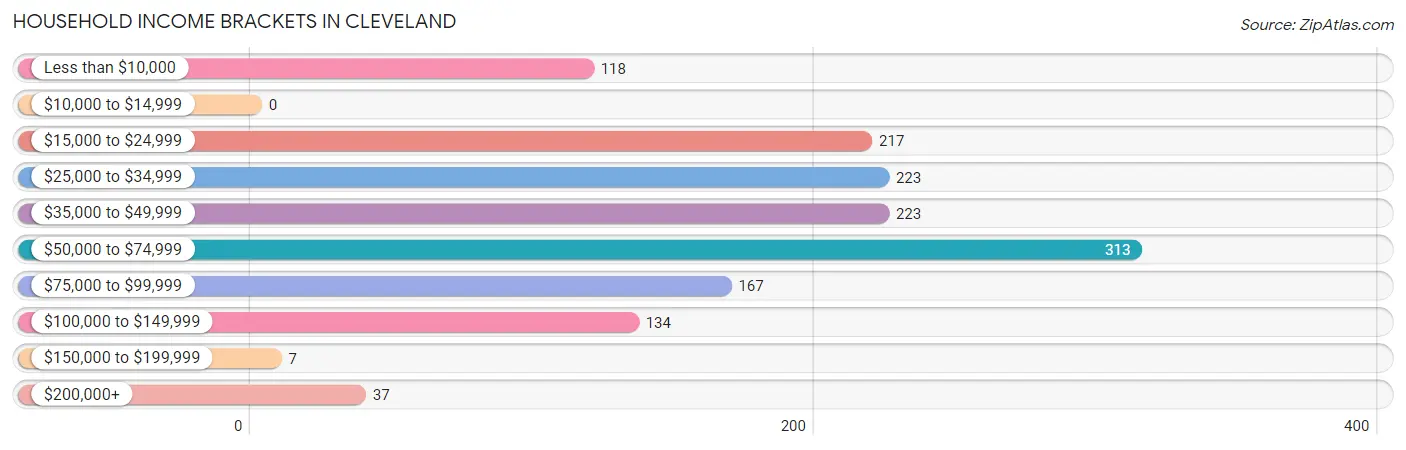
| Income Bracket | # Households | % Households |
| Less than $10,000 | 118 | 8.2% |
| $10,000 to $14,999 | 0 | 0.0% |
| $15,000 to $24,999 | 217 | 15.1% |
| $25,000 to $34,999 | 223 | 15.5% |
| $35,000 to $49,999 | 223 | 15.5% |
| $50,000 to $74,999 | 313 | 21.8% |
| $75,000 to $99,999 | 167 | 11.6% |
| $100,000 to $149,999 | 134 | 9.3% |
| $150,000 to $199,999 | 7 | 0.5% |
| $200,000+ | 37 | 2.6% |
Household Income by Householder Age in Cleveland
The median household income in Cleveland is $44,971, with the highest median household income of $48,224 found in the 65+ years age bracket for the primary householder. A total of 873 households (60.8%) fall into this category.
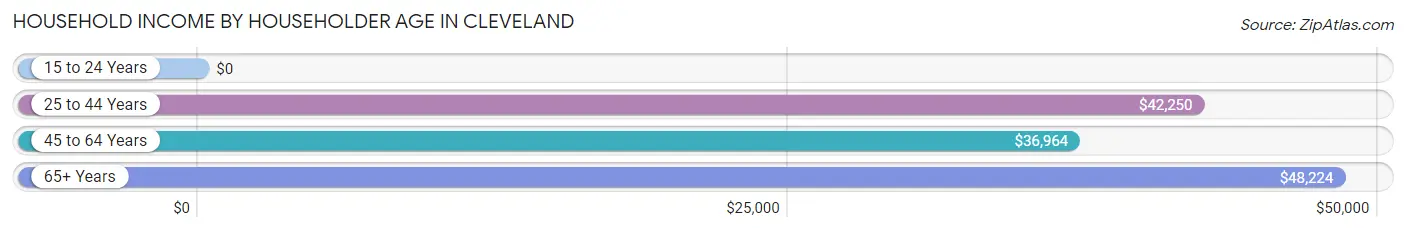
| Income Bracket | # Households | Median Income |
| 15 to 24 Years | 0 (0.0%) | $0 |
| 25 to 44 Years | 217 (15.1%) | $42,250 |
| 45 to 64 Years | 346 (24.1%) | $36,964 |
| 65+ Years | 873 (60.8%) | $48,224 |
| Total | 1,436 (100.0%) | $44,971 |
Poverty in Cleveland
Income Below Poverty by Sex and Age in Cleveland
With 4.7% poverty level for males and 10.6% for females among the residents of Cleveland, 55 to 64 year old males and under 5 year old females are the most vulnerable to poverty, with 36 males (20.2%) and 8 females (44.4%) in their respective age groups living below the poverty level.
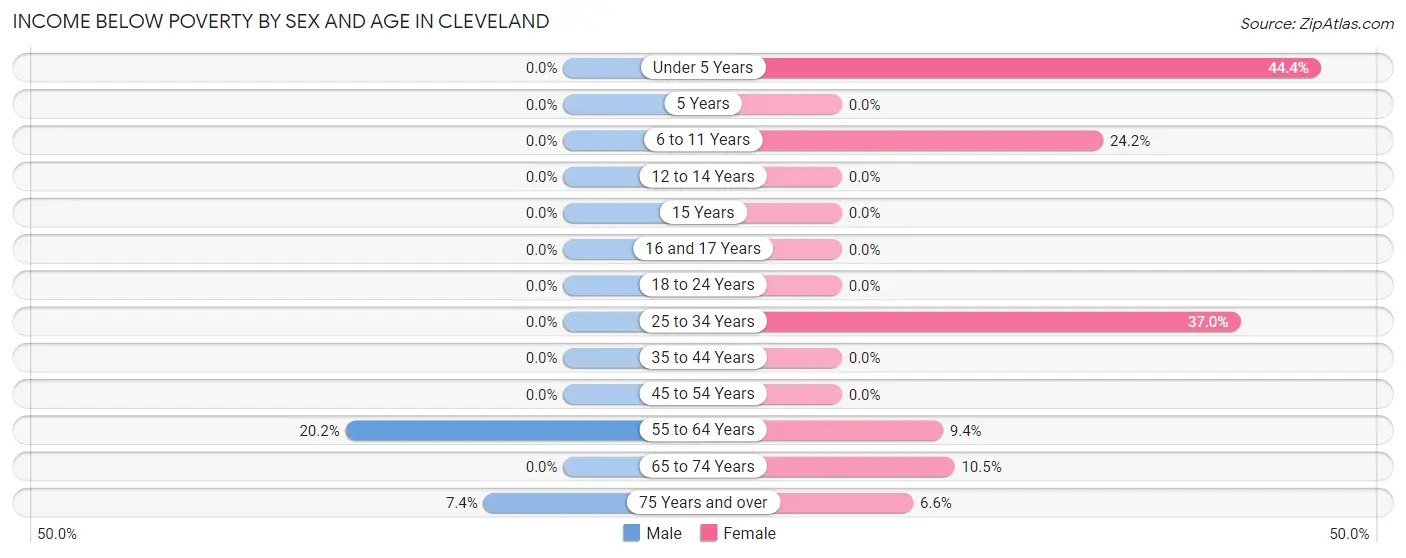
| Age Bracket | Male | Female |
| Under 5 Years | 0 (0.0%) | 8 (44.4%) |
| 5 Years | 0 (0.0%) | 0 (0.0%) |
| 6 to 11 Years | 0 (0.0%) | 8 (24.2%) |
| 12 to 14 Years | 0 (0.0%) | 0 (0.0%) |
| 15 Years | 0 (0.0%) | 0 (0.0%) |
| 16 and 17 Years | 0 (0.0%) | 0 (0.0%) |
| 18 to 24 Years | 0 (0.0%) | 0 (0.0%) |
| 25 to 34 Years | 0 (0.0%) | 34 (37.0%) |
| 35 to 44 Years | 0 (0.0%) | 0 (0.0%) |
| 45 to 54 Years | 0 (0.0%) | 0 (0.0%) |
| 55 to 64 Years | 36 (20.2%) | 24 (9.4%) |
| 65 to 74 Years | 0 (0.0%) | 43 (10.5%) |
| 75 Years and over | 20 (7.4%) | 19 (6.6%) |
| Total | 56 (4.7%) | 136 (10.6%) |
Income Above Poverty by Sex and Age in Cleveland
According to the poverty statistics in Cleveland, males aged under 5 years and females aged 12 to 14 years are the age groups that are most secure financially, with 100.0% of males and 100.0% of females in these age groups living above the poverty line.
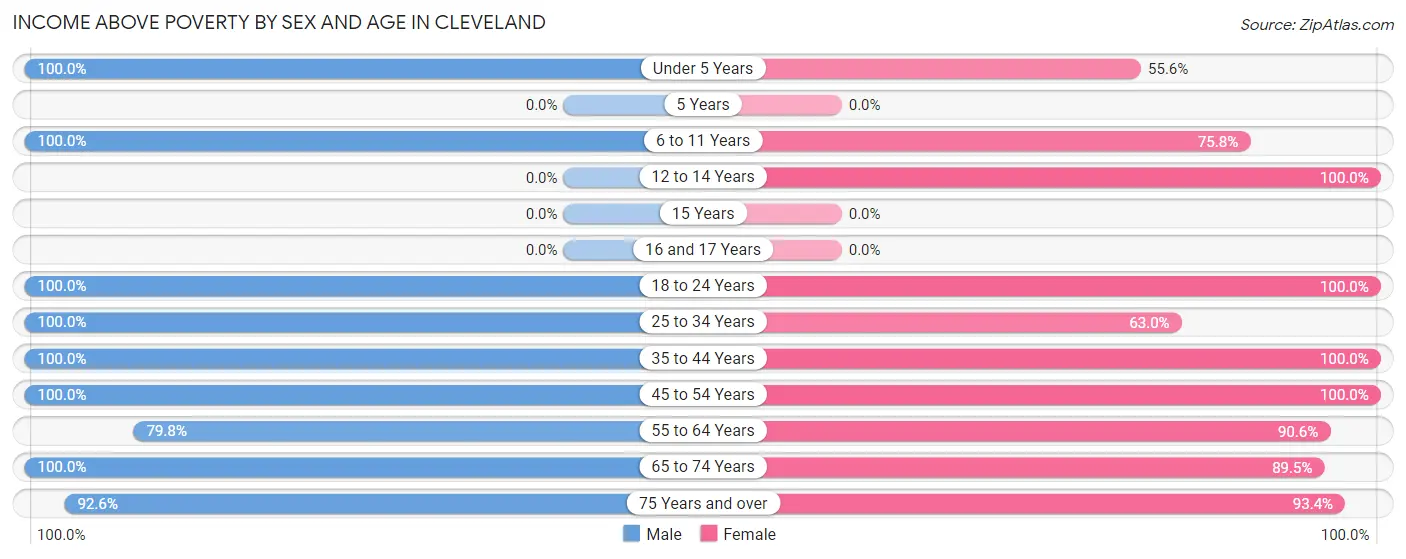
| Age Bracket | Male | Female |
| Under 5 Years | 27 (100.0%) | 10 (55.6%) |
| 5 Years | 0 (0.0%) | 0 (0.0%) |
| 6 to 11 Years | 18 (100.0%) | 25 (75.8%) |
| 12 to 14 Years | 0 (0.0%) | 33 (100.0%) |
| 15 Years | 0 (0.0%) | 0 (0.0%) |
| 16 and 17 Years | 0 (0.0%) | 0 (0.0%) |
| 18 to 24 Years | 17 (100.0%) | 52 (100.0%) |
| 25 to 34 Years | 127 (100.0%) | 58 (63.0%) |
| 35 to 44 Years | 65 (100.0%) | 35 (100.0%) |
| 45 to 54 Years | 182 (100.0%) | 61 (100.0%) |
| 55 to 64 Years | 142 (79.8%) | 232 (90.6%) |
| 65 to 74 Years | 304 (100.0%) | 368 (89.5%) |
| 75 Years and over | 250 (92.6%) | 268 (93.4%) |
| Total | 1,132 (95.3%) | 1,142 (89.4%) |
Income Below Poverty Among Married-Couple Families in Cleveland
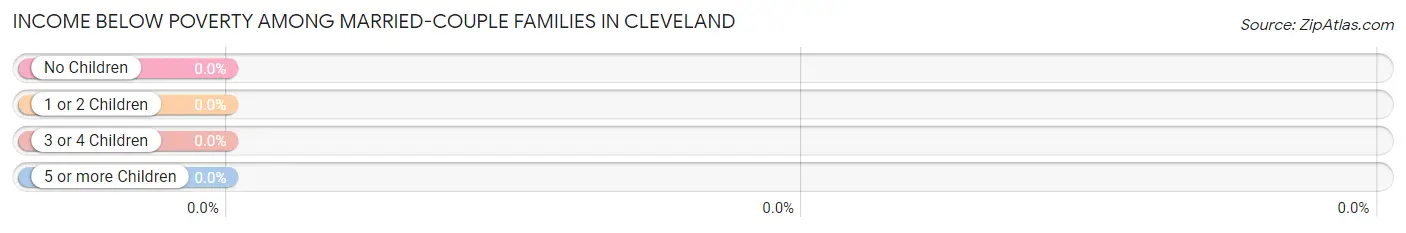
| Children | Above Poverty | Below Poverty |
| No Children | 531 (100.0%) | 0 (0.0%) |
| 1 or 2 Children | 59 (100.0%) | 0 (0.0%) |
| 3 or 4 Children | 0 (0.0%) | 0 (0.0%) |
| 5 or more Children | 0 (0.0%) | 0 (0.0%) |
| Total | 590 (100.0%) | 0 (0.0%) |
Income Below Poverty Among Single-Parent Households in Cleveland
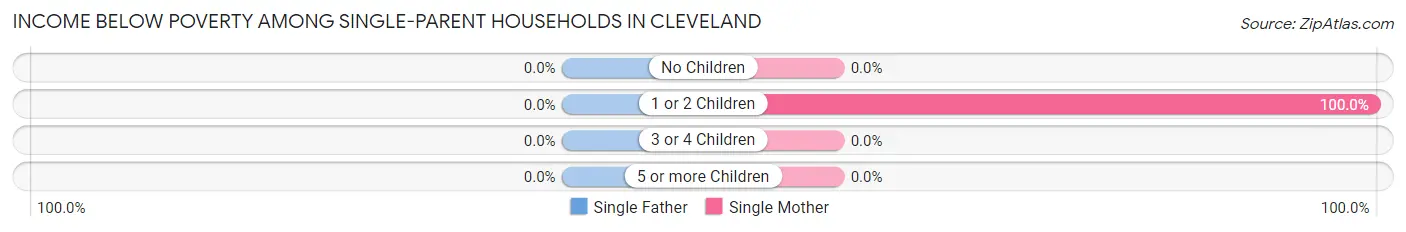
| Children | Single Father | Single Mother |
| No Children | 0 (0.0%) | 0 (0.0%) |
| 1 or 2 Children | 0 (0.0%) | 8 (100.0%) |
| 3 or 4 Children | 0 (0.0%) | 0 (0.0%) |
| 5 or more Children | 0 (0.0%) | 0 (0.0%) |
| Total | 0 (0.0%) | 8 (26.7%) |
Income Below Poverty Among Married-Couple vs Single-Parent Households in Cleveland
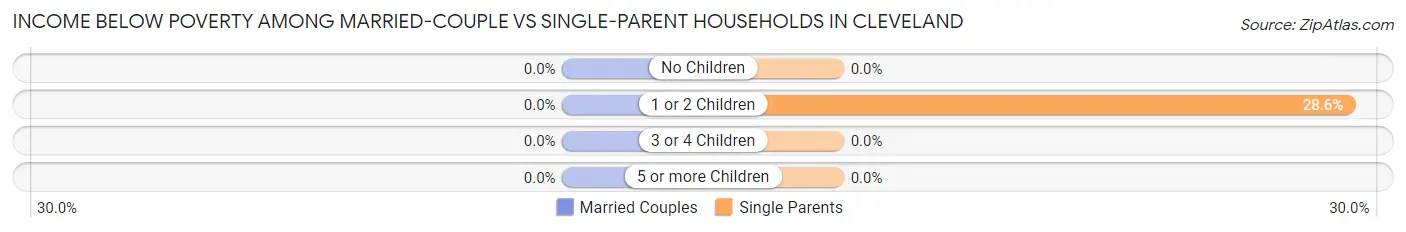
| Children | Married-Couple Families | Single-Parent Households |
| No Children | 0 (0.0%) | 0 (0.0%) |
| 1 or 2 Children | 0 (0.0%) | 8 (28.6%) |
| 3 or 4 Children | 0 (0.0%) | 0 (0.0%) |
| 5 or more Children | 0 (0.0%) | 0 (0.0%) |
| Total | 0 (0.0%) | 8 (9.3%) |
Race in Cleveland
The most populous races in Cleveland are White / Caucasian (2,141 | 86.8%), Hispanic or Latino (148 | 6.0%), and Two or more Races (147 | 6.0%).
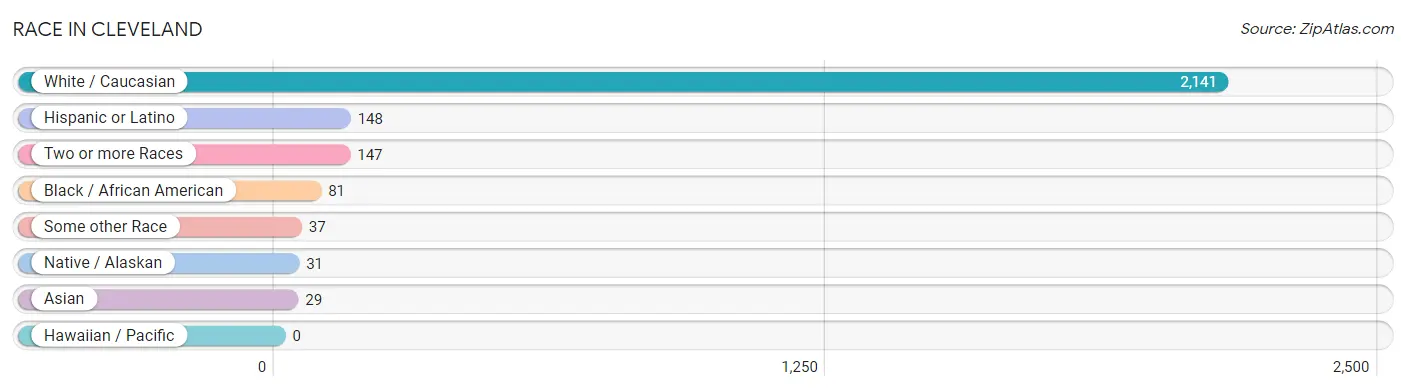
| Race | # Population | % Population |
| Asian | 29 | 1.2% |
| Black / African American | 81 | 3.3% |
| Hawaiian / Pacific | 0 | 0.0% |
| Hispanic or Latino | 148 | 6.0% |
| Native / Alaskan | 31 | 1.3% |
| White / Caucasian | 2,141 | 86.8% |
| Two or more Races | 147 | 6.0% |
| Some other Race | 37 | 1.5% |
| Total | 2,466 | 100.0% |
Ancestry in Cleveland
The most populous ancestries reported in Cleveland are American (498 | 20.2%), German (482 | 19.6%), Italian (227 | 9.2%), Irish (205 | 8.3%), and English (129 | 5.2%), together accounting for 62.5% of all Cleveland residents.
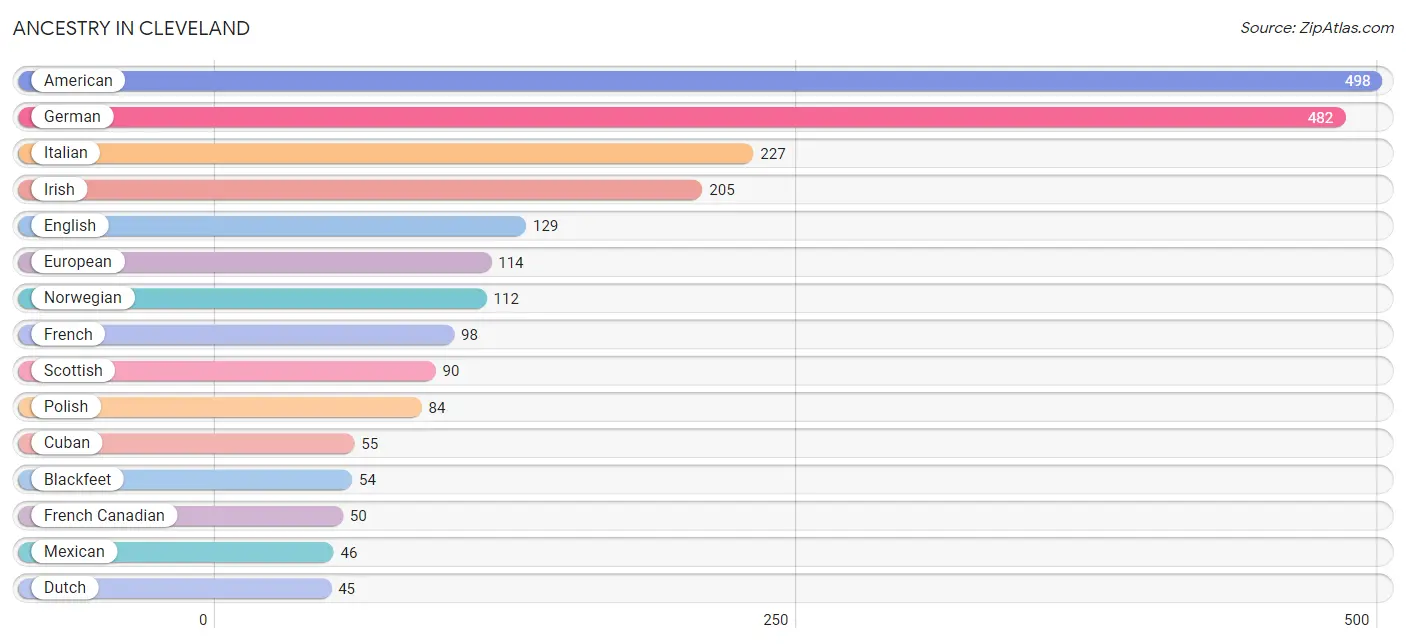
| Ancestry | # Population | % Population |
| American | 498 | 20.2% |
| Blackfeet | 54 | 2.2% |
| Cuban | 55 | 2.2% |
| Dutch | 45 | 1.8% |
| English | 129 | 5.2% |
| European | 114 | 4.6% |
| French | 98 | 4.0% |
| French Canadian | 50 | 2.0% |
| German | 482 | 19.6% |
| Irish | 205 | 8.3% |
| Italian | 227 | 9.2% |
| Mexican | 46 | 1.9% |
| Norwegian | 112 | 4.5% |
| Polish | 84 | 3.4% |
| Puerto Rican | 37 | 1.5% |
| Scotch-Irish | 19 | 0.8% |
| Scottish | 90 | 3.6% |
| Slovene | 8 | 0.3% |
| South American | 10 | 0.4% |
| Swedish | 18 | 0.7% |
| Thai | 29 | 1.2% |
| Ukrainian | 20 | 0.8% |
| Uruguayan | 10 | 0.4% | View All 23 Rows |
Immigrants in Cleveland
The most numerous immigrant groups reported in Cleveland came from Latin America (65 | 2.6%), Caribbean (55 | 2.2%), Cuba (55 | 2.2%), Asia (29 | 1.2%), and India (29 | 1.2%), together accounting for 9.5% of all Cleveland residents.
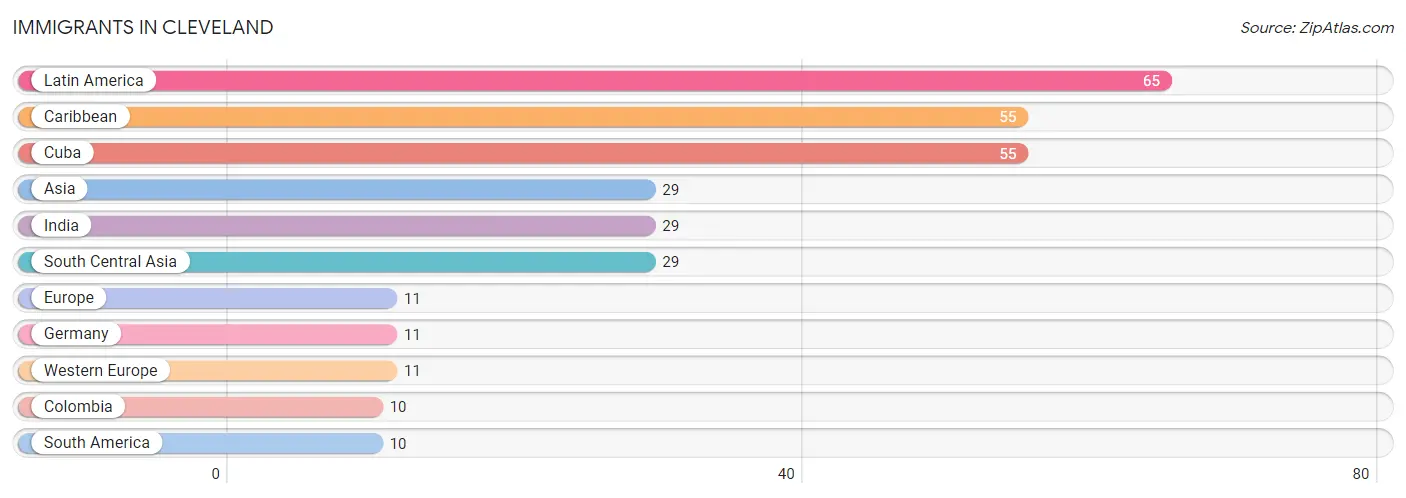
| Immigration Origin | # Population | % Population |
| Asia | 29 | 1.2% |
| Caribbean | 55 | 2.2% |
| Colombia | 10 | 0.4% |
| Cuba | 55 | 2.2% |
| Europe | 11 | 0.4% |
| Germany | 11 | 0.4% |
| India | 29 | 1.2% |
| Latin America | 65 | 2.6% |
| South America | 10 | 0.4% |
| South Central Asia | 29 | 1.2% |
| Western Europe | 11 | 0.4% | View All 11 Rows |
Sex and Age in Cleveland
Sex and Age in Cleveland
The most populous age groups in Cleveland are 65 to 69 Years (231 | 19.4%) for men and 70 to 74 Years (307 | 24.0%) for women.
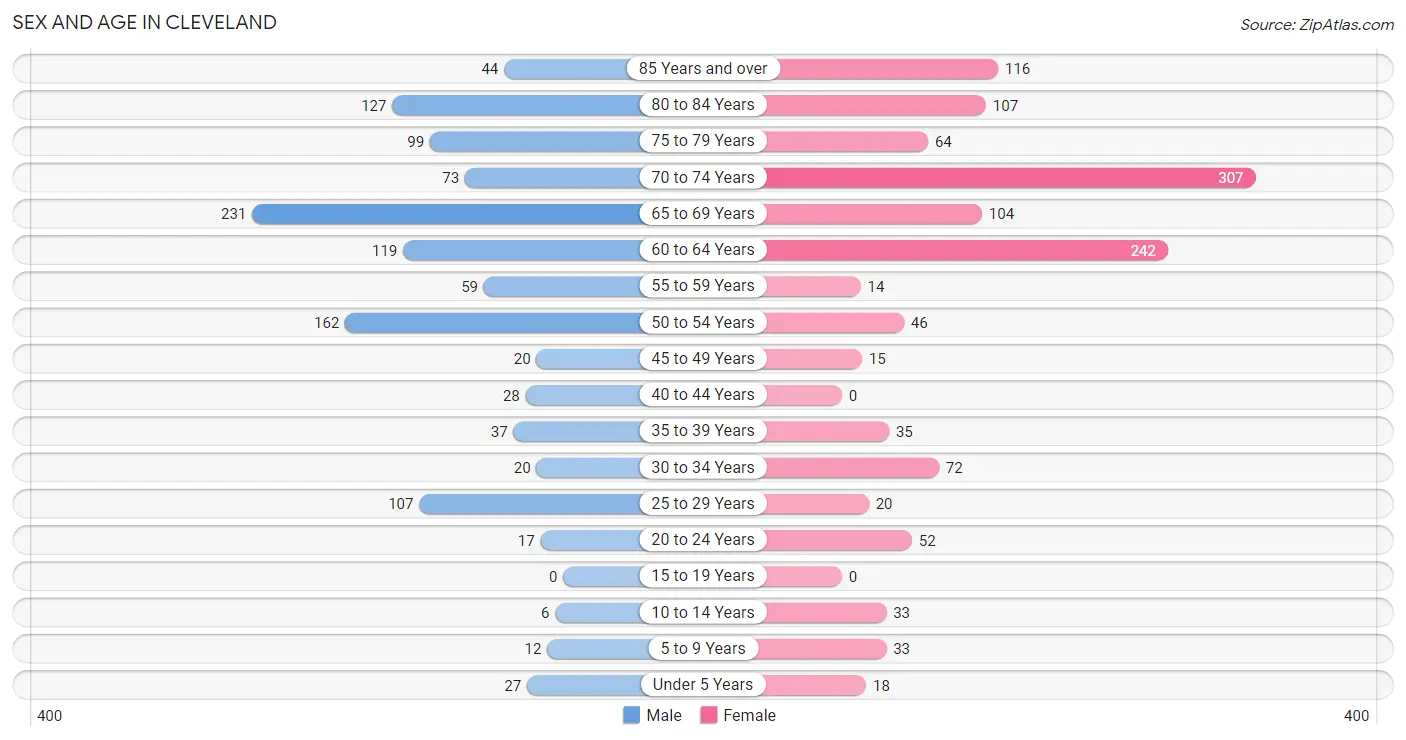
| Age Bracket | Male | Female |
| Under 5 Years | 27 (2.3%) | 18 (1.4%) |
| 5 to 9 Years | 12 (1.0%) | 33 (2.6%) |
| 10 to 14 Years | 6 (0.5%) | 33 (2.6%) |
| 15 to 19 Years | 0 (0.0%) | 0 (0.0%) |
| 20 to 24 Years | 17 (1.4%) | 52 (4.1%) |
| 25 to 29 Years | 107 (9.0%) | 20 (1.6%) |
| 30 to 34 Years | 20 (1.7%) | 72 (5.6%) |
| 35 to 39 Years | 37 (3.1%) | 35 (2.7%) |
| 40 to 44 Years | 28 (2.4%) | 0 (0.0%) |
| 45 to 49 Years | 20 (1.7%) | 15 (1.2%) |
| 50 to 54 Years | 162 (13.6%) | 46 (3.6%) |
| 55 to 59 Years | 59 (5.0%) | 14 (1.1%) |
| 60 to 64 Years | 119 (10.0%) | 242 (18.9%) |
| 65 to 69 Years | 231 (19.4%) | 104 (8.1%) |
| 70 to 74 Years | 73 (6.1%) | 307 (24.0%) |
| 75 to 79 Years | 99 (8.3%) | 64 (5.0%) |
| 80 to 84 Years | 127 (10.7%) | 107 (8.4%) |
| 85 Years and over | 44 (3.7%) | 116 (9.1%) |
| Total | 1,188 (100.0%) | 1,278 (100.0%) |
Families and Households in Cleveland
Median Family Size in Cleveland
The median family size in Cleveland is 2.33 persons per family, with single male/father families (56 | 8.3%) accounting for the largest median family size of 3.09 persons per family. On the other hand, married-couple families (590 | 87.3%) represent the smallest median family size with 2.24 persons per family.
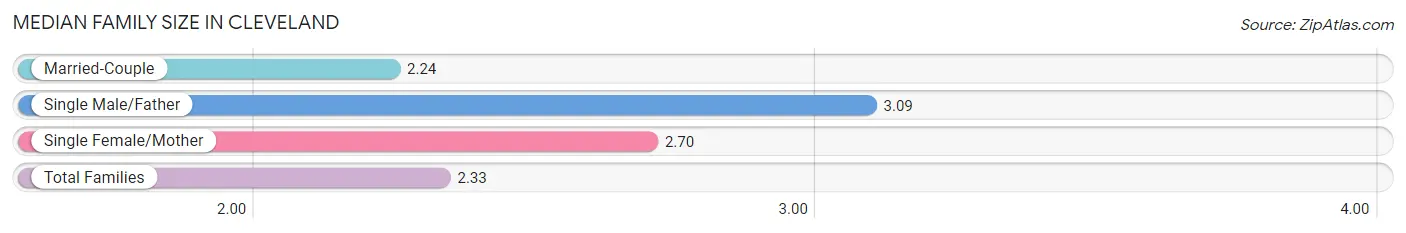
| Family Type | # Families | Family Size |
| Married-Couple | 590 (87.3%) | 2.24 |
| Single Male/Father | 56 (8.3%) | 3.09 |
| Single Female/Mother | 30 (4.4%) | 2.70 |
| Total Families | 676 (100.0%) | 2.33 |
Median Household Size in Cleveland
The median household size in Cleveland is 1.72 persons per household, with single male/father households (56 | 3.9%) accounting for the largest median household size of 3.55 persons per household. non-family households (760 | 52.9%) represent the smallest median household size with 1.13 persons per household.
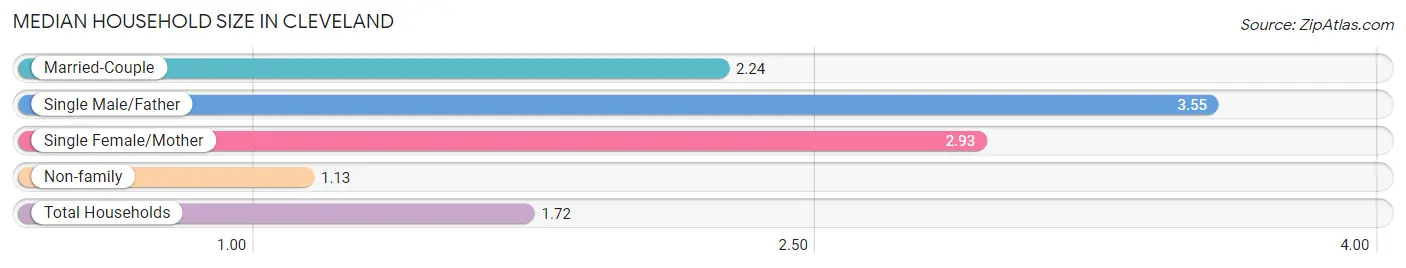
| Household Type | # Households | Household Size |
| Married-Couple | 590 (41.1%) | 2.24 |
| Single Male/Father | 56 (3.9%) | 3.55 |
| Single Female/Mother | 30 (2.1%) | 2.93 |
| Non-family | 760 (52.9%) | 1.13 |
| Total Households | 1,436 (100.0%) | 1.72 |
Household Size by Marriage Status in Cleveland
Out of a total of 1,436 households in Cleveland, 676 (47.1%) are family households, while 760 (52.9%) are nonfamily households. The most numerous type of family households are 2-person households, comprising 526, and the most common type of nonfamily households are 1-person households, comprising 681.
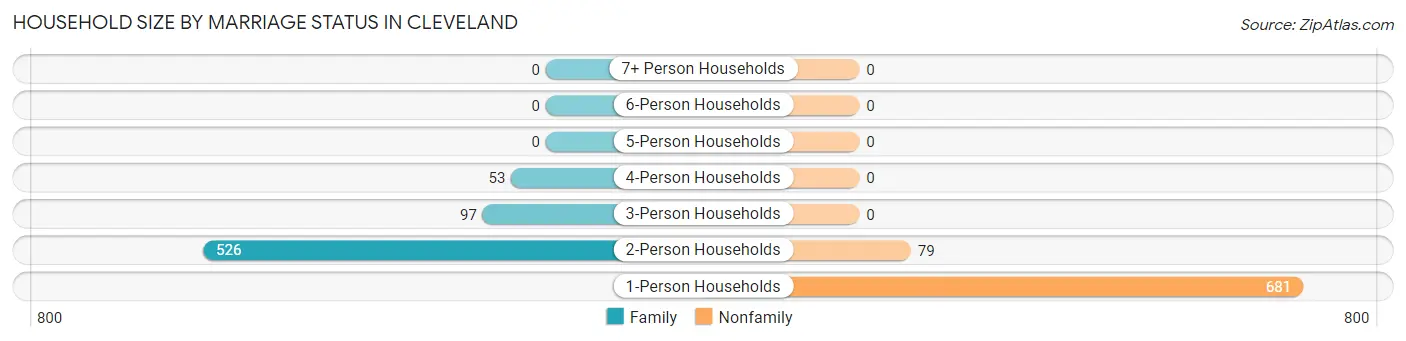
| Household Size | Family Households | Nonfamily Households |
| 1-Person Households | - | 681 (47.4%) |
| 2-Person Households | 526 (36.6%) | 79 (5.5%) |
| 3-Person Households | 97 (6.8%) | 0 (0.0%) |
| 4-Person Households | 53 (3.7%) | 0 (0.0%) |
| 5-Person Households | 0 (0.0%) | 0 (0.0%) |
| 6-Person Households | 0 (0.0%) | 0 (0.0%) |
| 7+ Person Households | 0 (0.0%) | 0 (0.0%) |
| Total | 676 (47.1%) | 760 (52.9%) |
Female Fertility in Cleveland
Fertility by Age in Cleveland
| Age Bracket | Women with Births | Births / 1,000 Women |
| 15 to 19 years | 0 (0.0%) | 0.0 |
| 20 to 34 years | 0 (0.0%) | 0.0 |
| 35 to 50 years | 0 (0.0%) | 0.0 |
| Total | 0 (0.0%) | 0.0 |
Fertility by Age by Marriage Status in Cleveland
| Age Bracket | Married | Unmarried |
| 15 to 19 years | 0 (0.0%) | 0 (0.0%) |
| 20 to 34 years | 0 (0.0%) | 0 (0.0%) |
| 35 to 50 years | 0 (0.0%) | 0 (0.0%) |
| Total | 0 (0.0%) | 0 (0.0%) |
Fertility by Education in Cleveland
| Educational Attainment | Women with Births | Births / 1,000 Women |
| Less than High School | 0 (0.0%) | 0.0 |
| High School Diploma | 0 (0.0%) | 0.0 |
| College or Associate's Degree | 0 (0.0%) | 0.0 |
| Bachelor's Degree | 0 (0.0%) | 0.0 |
| Graduate Degree | 0 (0.0%) | 0.0 |
| Total | 0 (0.0%) | 0.0 |
Fertility by Education by Marriage Status in Cleveland
| Educational Attainment | Married | Unmarried |
| Less than High School | 0 (0.0%) | 0 (0.0%) |
| High School Diploma | 0 (0.0%) | 0 (0.0%) |
| College or Associate's Degree | 0 (0.0%) | 0 (0.0%) |
| Bachelor's Degree | 0 (0.0%) | 0 (0.0%) |
| Graduate Degree | 0 (0.0%) | 0 (0.0%) |
| Total | 0 (0.0%) | 0 (0.0%) |
Employment Characteristics in Cleveland
Employment by Class of Employer in Cleveland
Among the 585 employed individuals in Cleveland, private company employees (496 | 84.8%), not-for-profit organizations (45 | 7.7%), and self-employed (not incorporated) (18 | 3.1%) make up the most common classes of employment.
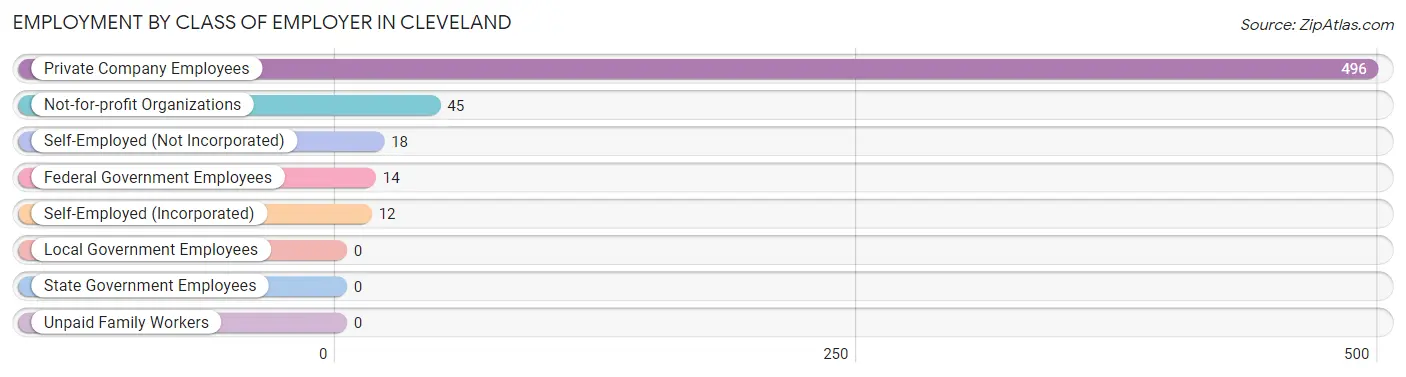
| Employer Class | # Employees | % Employees |
| Private Company Employees | 496 | 84.8% |
| Self-Employed (Incorporated) | 12 | 2.1% |
| Self-Employed (Not Incorporated) | 18 | 3.1% |
| Not-for-profit Organizations | 45 | 7.7% |
| Local Government Employees | 0 | 0.0% |
| State Government Employees | 0 | 0.0% |
| Federal Government Employees | 14 | 2.4% |
| Unpaid Family Workers | 0 | 0.0% |
| Total | 585 | 100.0% |
Employment Status by Age in Cleveland
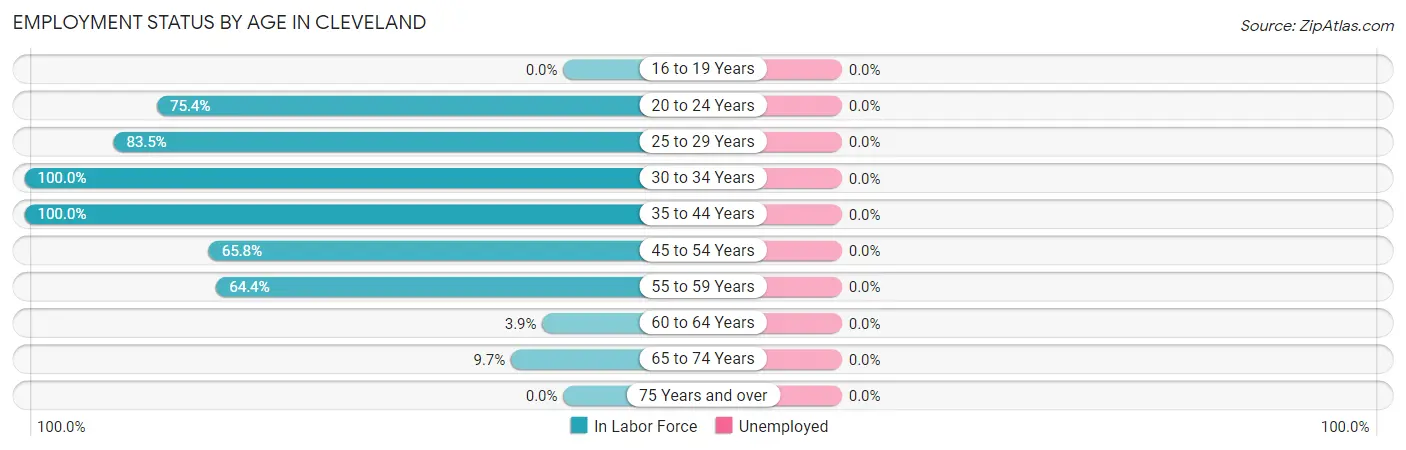
| Age Bracket | In Labor Force | Unemployed |
| 16 to 19 Years | 0 (0.0%) | 0 (0.0%) |
| 20 to 24 Years | 52 (75.4%) | 0 (0.0%) |
| 25 to 29 Years | 106 (83.5%) | 0 (0.0%) |
| 30 to 34 Years | 92 (100.0%) | 0 (0.0%) |
| 35 to 44 Years | 100 (100.0%) | 0 (0.0%) |
| 45 to 54 Years | 160 (65.8%) | 0 (0.0%) |
| 55 to 59 Years | 47 (64.4%) | 0 (0.0%) |
| 60 to 64 Years | 14 (3.9%) | 0 (0.0%) |
| 65 to 74 Years | 69 (9.7%) | 0 (0.0%) |
| 75 Years and over | 0 (0.0%) | 0 (0.0%) |
| Total | 640 (27.4%) | 0 (0.0%) |
Employment Status by Educational Attainment in Cleveland
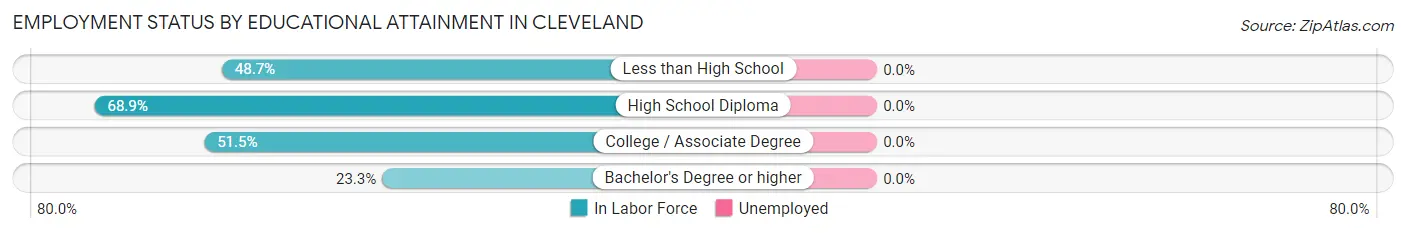
| Educational Attainment | In Labor Force | Unemployed |
| Less than High School | 19 (48.7%) | 0 (0.0%) |
| High School Diploma | 277 (68.9%) | 0 (0.0%) |
| College / Associate Degree | 171 (51.5%) | 0 (0.0%) |
| Bachelor's Degree or higher | 52 (23.3%) | 0 (0.0%) |
| Total | 519 (52.1%) | 0 (0.0%) |
Employment Occupations by Sex in Cleveland
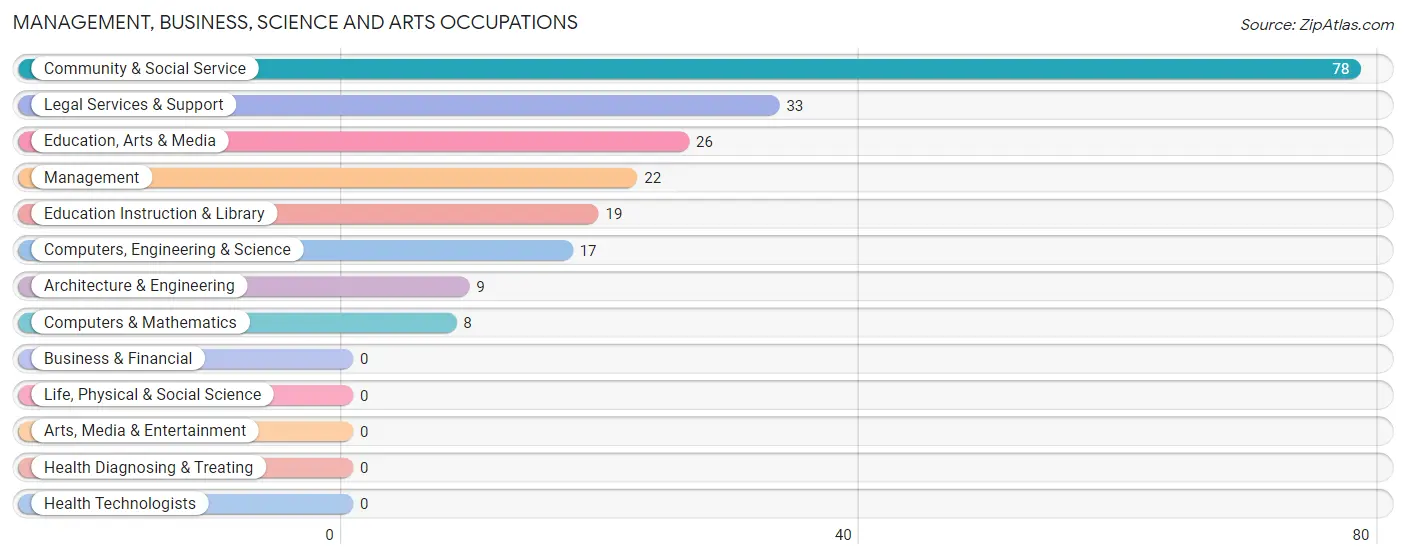
Management, Business, Science and Arts Occupations
The most common Management, Business, Science and Arts occupations in Cleveland are Community & Social Service (78 | 12.2%), Legal Services & Support (33 | 5.2%), Education, Arts & Media (26 | 4.1%), Management (22 | 3.4%), and Education Instruction & Library (19 | 3.0%).
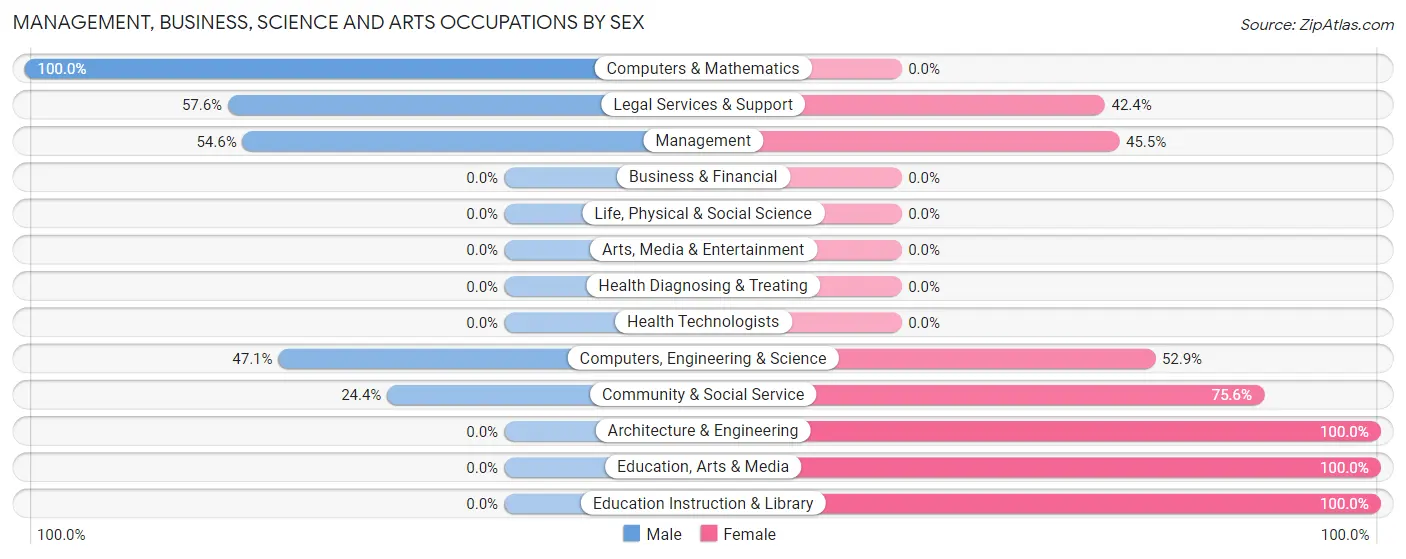
Management, Business, Science and Arts Occupations by Sex
Within the Management, Business, Science and Arts occupations in Cleveland, the most male-oriented occupations are Computers & Mathematics (100.0%), Legal Services & Support (57.6%), and Management (54.5%), while the most female-oriented occupations are Architecture & Engineering (100.0%), Education, Arts & Media (100.0%), and Education Instruction & Library (100.0%).
| Occupation | Male | Female |
| Management | 12 (54.5%) | 10 (45.5%) |
| Business & Financial | 0 (0.0%) | 0 (0.0%) |
| Computers, Engineering & Science | 8 (47.1%) | 9 (52.9%) |
| Computers & Mathematics | 8 (100.0%) | 0 (0.0%) |
| Architecture & Engineering | 0 (0.0%) | 9 (100.0%) |
| Life, Physical & Social Science | 0 (0.0%) | 0 (0.0%) |
| Community & Social Service | 19 (24.4%) | 59 (75.6%) |
| Education, Arts & Media | 0 (0.0%) | 26 (100.0%) |
| Legal Services & Support | 19 (57.6%) | 14 (42.4%) |
| Education Instruction & Library | 0 (0.0%) | 19 (100.0%) |
| Arts, Media & Entertainment | 0 (0.0%) | 0 (0.0%) |
| Health Diagnosing & Treating | 0 (0.0%) | 0 (0.0%) |
| Health Technologists | 0 (0.0%) | 0 (0.0%) |
| Total (Category) | 39 (33.3%) | 78 (66.7%) |
| Total (Overall) | 363 (56.7%) | 277 (43.3%) |
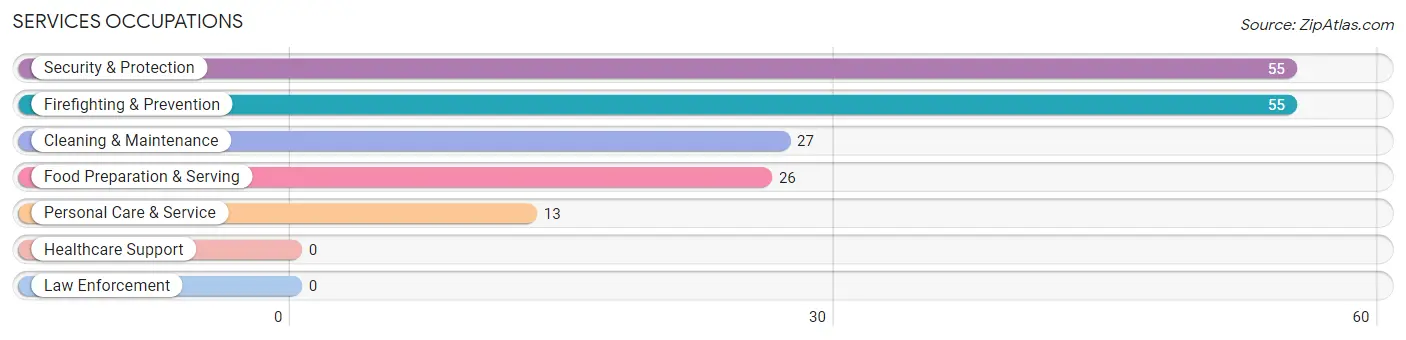
Services Occupations
The most common Services occupations in Cleveland are Security & Protection (55 | 8.6%), Firefighting & Prevention (55 | 8.6%), Cleaning & Maintenance (27 | 4.2%), Food Preparation & Serving (26 | 4.1%), and Personal Care & Service (13 | 2.0%).
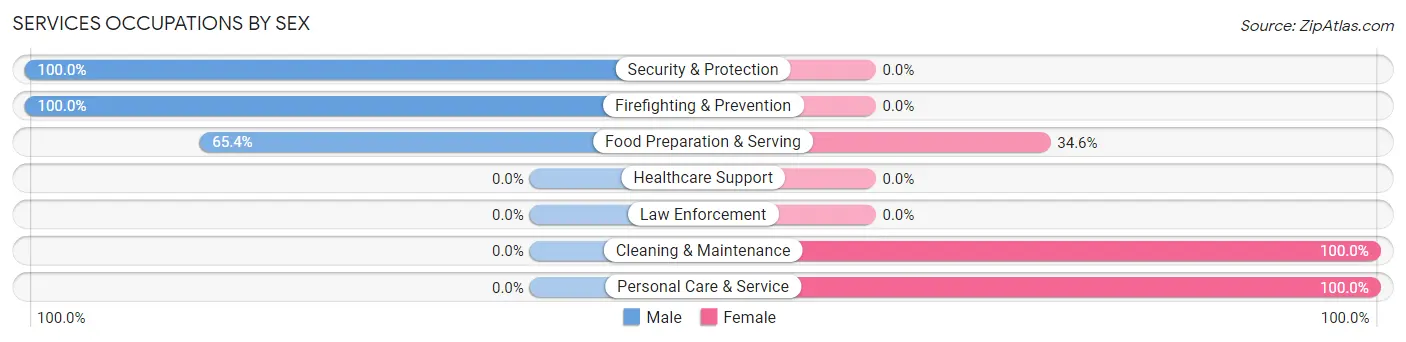
Services Occupations by Sex
Within the Services occupations in Cleveland, the most male-oriented occupations are Security & Protection (100.0%), Firefighting & Prevention (100.0%), and Food Preparation & Serving (65.4%), while the most female-oriented occupations are Cleaning & Maintenance (100.0%), Personal Care & Service (100.0%), and Food Preparation & Serving (34.6%).
| Occupation | Male | Female |
| Healthcare Support | 0 (0.0%) | 0 (0.0%) |
| Security & Protection | 55 (100.0%) | 0 (0.0%) |
| Firefighting & Prevention | 55 (100.0%) | 0 (0.0%) |
| Law Enforcement | 0 (0.0%) | 0 (0.0%) |
| Food Preparation & Serving | 17 (65.4%) | 9 (34.6%) |
| Cleaning & Maintenance | 0 (0.0%) | 27 (100.0%) |
| Personal Care & Service | 0 (0.0%) | 13 (100.0%) |
| Total (Category) | 72 (59.5%) | 49 (40.5%) |
| Total (Overall) | 363 (56.7%) | 277 (43.3%) |
Sales and Office Occupations
The most common Sales and Office occupations in Cleveland are Sales & Related (103 | 16.1%), and Office & Administration (68 | 10.6%).
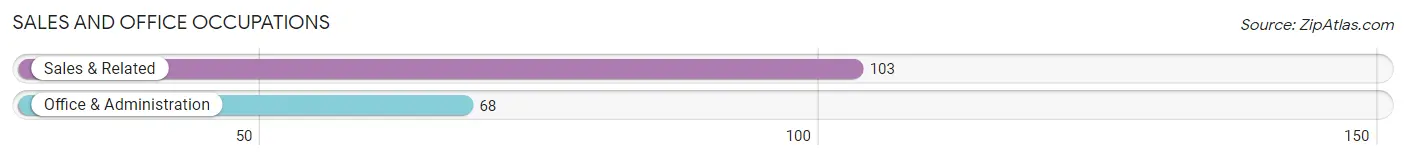
Sales and Office Occupations by Sex
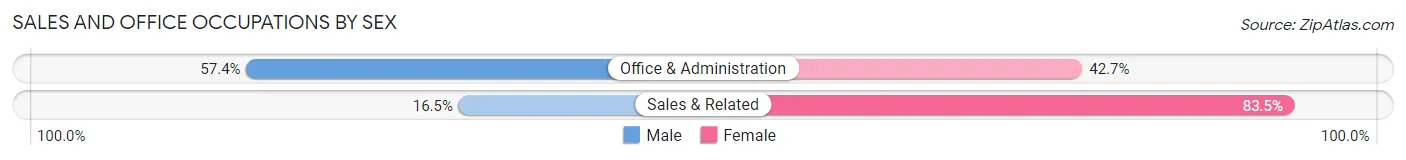
| Occupation | Male | Female |
| Sales & Related | 17 (16.5%) | 86 (83.5%) |
| Office & Administration | 39 (57.4%) | 29 (42.6%) |
| Total (Category) | 56 (32.8%) | 115 (67.2%) |
| Total (Overall) | 363 (56.7%) | 277 (43.3%) |
Natural Resources, Construction and Maintenance Occupations
The most common Natural Resources, Construction and Maintenance occupations in Cleveland are Construction & Extraction (61 | 9.5%), and Installation, Maintenance & Repair (14 | 2.2%).
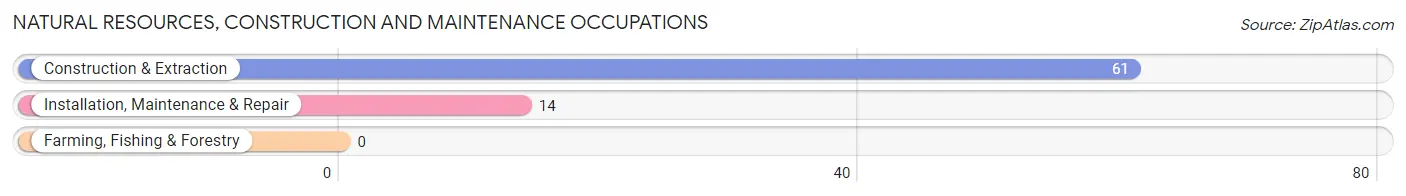
Natural Resources, Construction and Maintenance Occupations by Sex
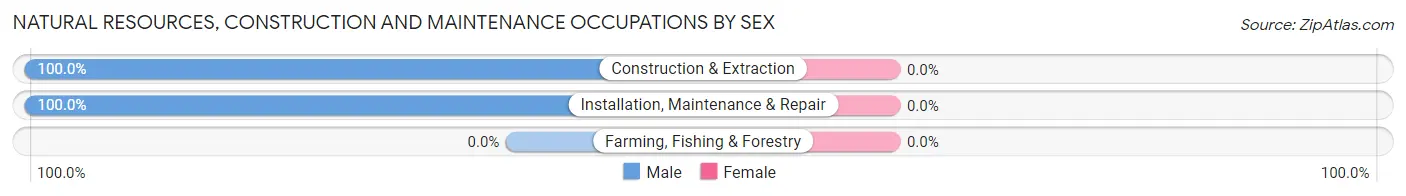
| Occupation | Male | Female |
| Farming, Fishing & Forestry | 0 (0.0%) | 0 (0.0%) |
| Construction & Extraction | 61 (100.0%) | 0 (0.0%) |
| Installation, Maintenance & Repair | 14 (100.0%) | 0 (0.0%) |
| Total (Category) | 75 (100.0%) | 0 (0.0%) |
| Total (Overall) | 363 (56.7%) | 277 (43.3%) |
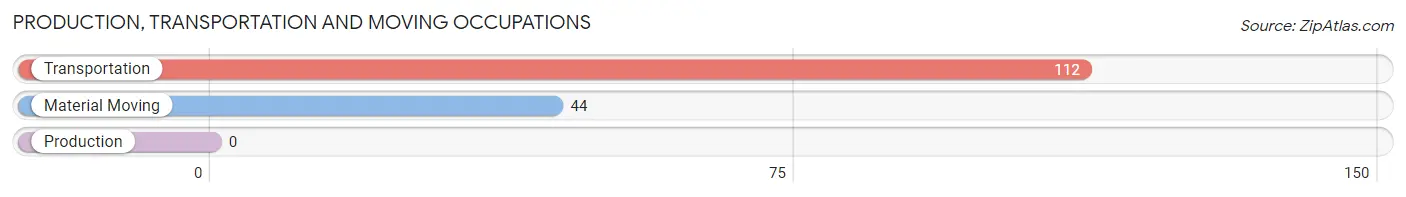
Production, Transportation and Moving Occupations
The most common Production, Transportation and Moving occupations in Cleveland are Transportation (112 | 17.5%), and Material Moving (44 | 6.9%).
Production, Transportation and Moving Occupations by Sex
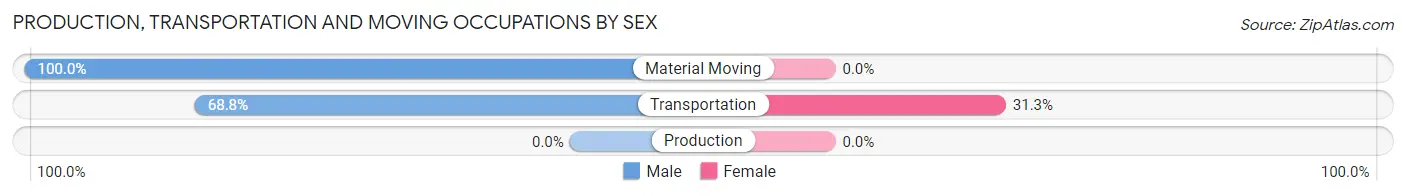
| Occupation | Male | Female |
| Production | 0 (0.0%) | 0 (0.0%) |
| Transportation | 77 (68.8%) | 35 (31.2%) |
| Material Moving | 44 (100.0%) | 0 (0.0%) |
| Total (Category) | 121 (77.6%) | 35 (22.4%) |
| Total (Overall) | 363 (56.7%) | 277 (43.3%) |
Employment Industries by Sex in Cleveland
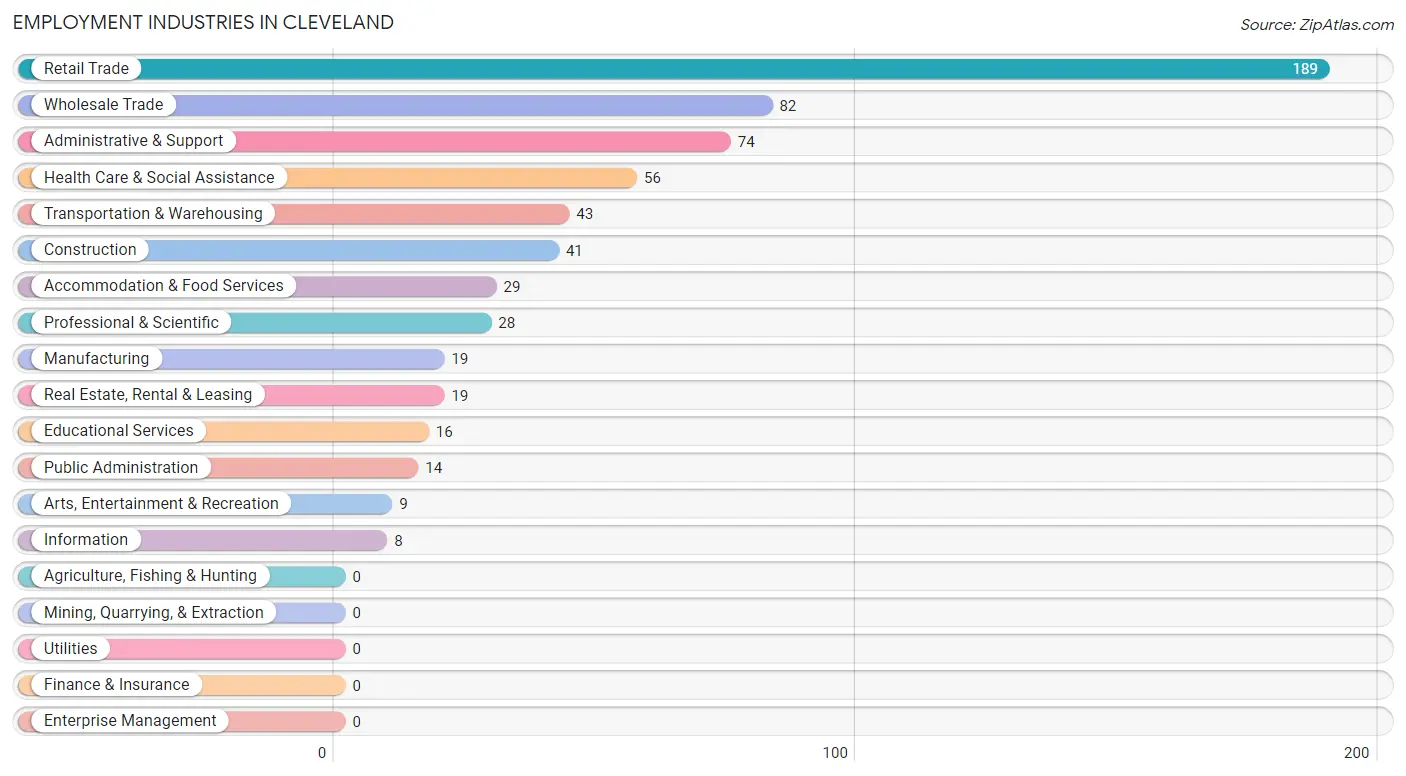
Employment Industries in Cleveland
The major employment industries in Cleveland include Retail Trade (189 | 29.5%), Wholesale Trade (82 | 12.8%), Administrative & Support (74 | 11.6%), Health Care & Social Assistance (56 | 8.7%), and Transportation & Warehousing (43 | 6.7%).
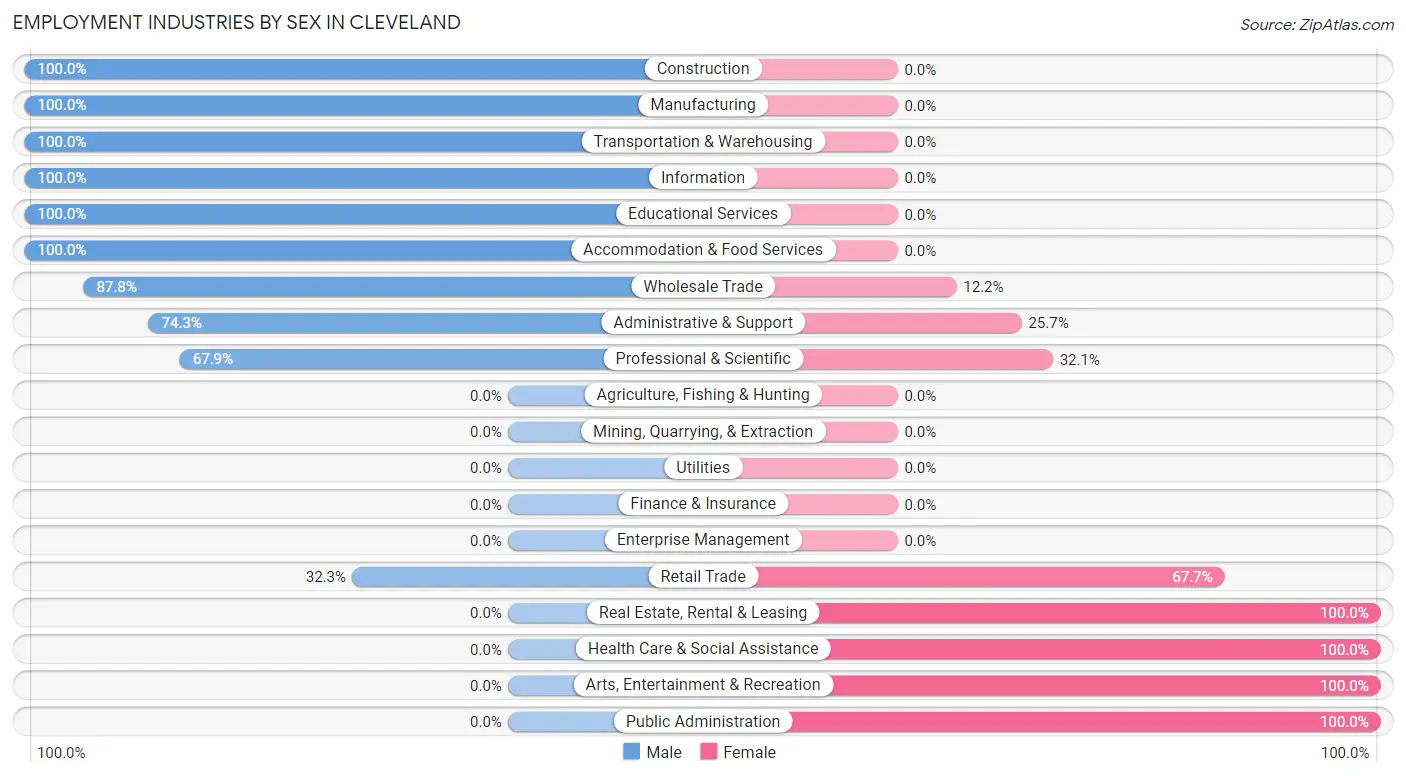
Employment Industries by Sex in Cleveland
The Cleveland industries that see more men than women are Construction (100.0%), Manufacturing (100.0%), and Transportation & Warehousing (100.0%), whereas the industries that tend to have a higher number of women are Real Estate, Rental & Leasing (100.0%), Health Care & Social Assistance (100.0%), and Arts, Entertainment & Recreation (100.0%).
| Industry | Male | Female |
| Agriculture, Fishing & Hunting | 0 (0.0%) | 0 (0.0%) |
| Mining, Quarrying, & Extraction | 0 (0.0%) | 0 (0.0%) |
| Construction | 41 (100.0%) | 0 (0.0%) |
| Manufacturing | 19 (100.0%) | 0 (0.0%) |
| Wholesale Trade | 72 (87.8%) | 10 (12.2%) |
| Retail Trade | 61 (32.3%) | 128 (67.7%) |
| Transportation & Warehousing | 43 (100.0%) | 0 (0.0%) |
| Utilities | 0 (0.0%) | 0 (0.0%) |
| Information | 8 (100.0%) | 0 (0.0%) |
| Finance & Insurance | 0 (0.0%) | 0 (0.0%) |
| Real Estate, Rental & Leasing | 0 (0.0%) | 19 (100.0%) |
| Professional & Scientific | 19 (67.9%) | 9 (32.1%) |
| Enterprise Management | 0 (0.0%) | 0 (0.0%) |
| Administrative & Support | 55 (74.3%) | 19 (25.7%) |
| Educational Services | 16 (100.0%) | 0 (0.0%) |
| Health Care & Social Assistance | 0 (0.0%) | 56 (100.0%) |
| Arts, Entertainment & Recreation | 0 (0.0%) | 9 (100.0%) |
| Accommodation & Food Services | 29 (100.0%) | 0 (0.0%) |
| Public Administration | 0 (0.0%) | 14 (100.0%) |
| Total | 363 (56.7%) | 277 (43.3%) |
Education in Cleveland
School Enrollment in Cleveland
The most common levels of schooling among the 192 students in Cleveland are college / undergraduate (110 | 57.3%), elementary school (45 | 23.4%), and middle school (25 | 13.0%).
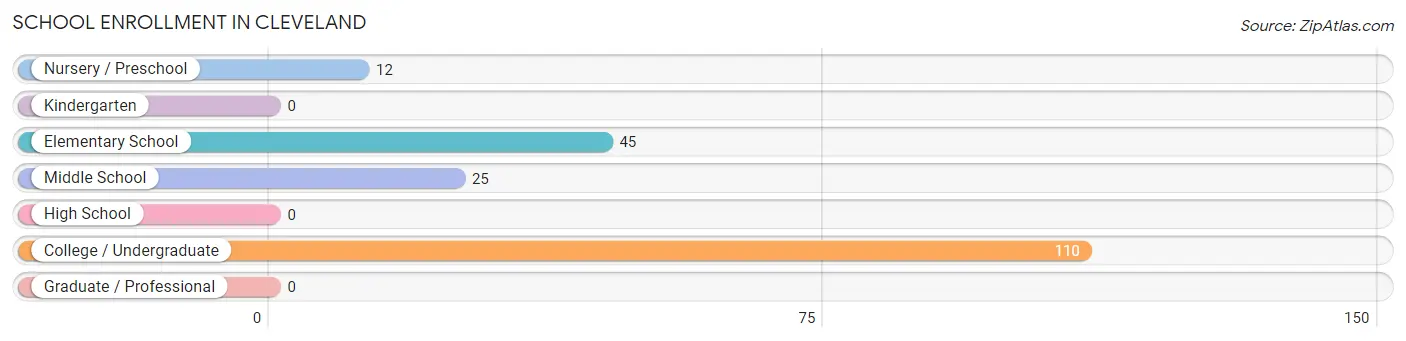
| School Level | # Students | % Students |
| Nursery / Preschool | 12 | 6.2% |
| Kindergarten | 0 | 0.0% |
| Elementary School | 45 | 23.4% |
| Middle School | 25 | 13.0% |
| High School | 0 | 0.0% |
| College / Undergraduate | 110 | 57.3% |
| Graduate / Professional | 0 | 0.0% |
| Total | 192 | 100.0% |
School Enrollment by Age by Funding Source in Cleveland
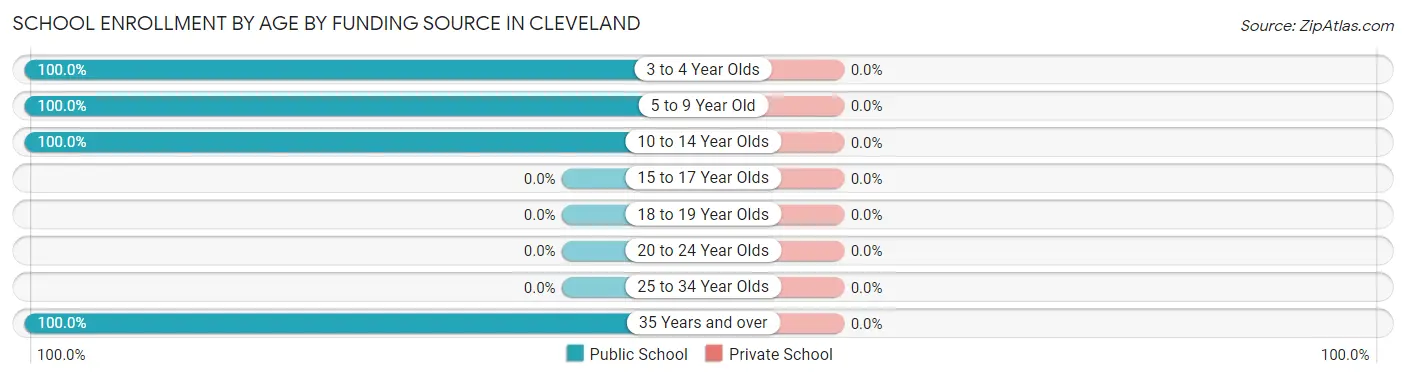
| Age Bracket | Public School | Private School |
| 3 to 4 Year Olds | 12 (100.0%) | 0 (0.0%) |
| 5 to 9 Year Old | 45 (100.0%) | 0 (0.0%) |
| 10 to 14 Year Olds | 25 (100.0%) | 0 (0.0%) |
| 15 to 17 Year Olds | 0 (0.0%) | 0 (0.0%) |
| 18 to 19 Year Olds | 0 (0.0%) | 0 (0.0%) |
| 20 to 24 Year Olds | 0 (0.0%) | 0 (0.0%) |
| 25 to 34 Year Olds | 0 (0.0%) | 0 (0.0%) |
| 35 Years and over | 110 (100.0%) | 0 (0.0%) |
| Total | 192 (100.0%) | 0 (0.0%) |
Educational Attainment by Field of Study in Cleveland
Education (282 | 43.4%), science & technology (127 | 19.6%), business (88 | 13.6%), social sciences (78 | 12.0%), and engineering (39 | 6.0%) are the most common fields of study among 649 individuals in Cleveland who have obtained a bachelor's degree or higher.
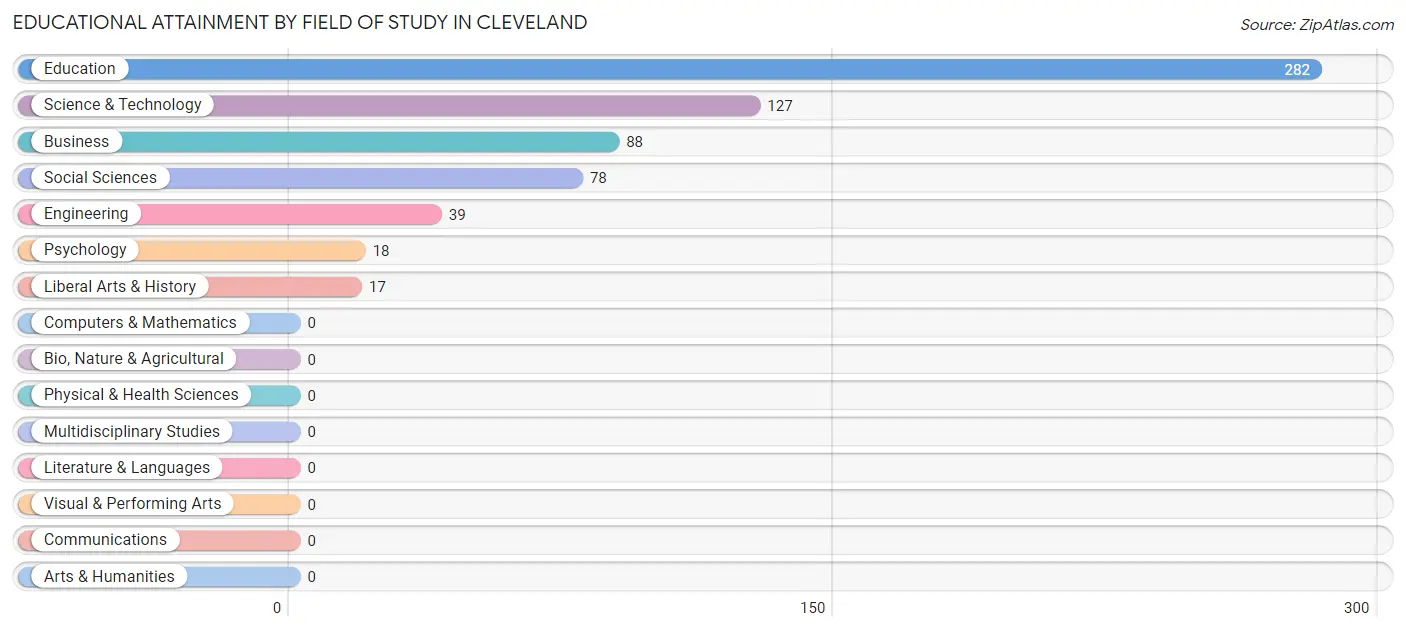
| Field of Study | # Graduates | % Graduates |
| Computers & Mathematics | 0 | 0.0% |
| Bio, Nature & Agricultural | 0 | 0.0% |
| Physical & Health Sciences | 0 | 0.0% |
| Psychology | 18 | 2.8% |
| Social Sciences | 78 | 12.0% |
| Engineering | 39 | 6.0% |
| Multidisciplinary Studies | 0 | 0.0% |
| Science & Technology | 127 | 19.6% |
| Business | 88 | 13.6% |
| Education | 282 | 43.4% |
| Literature & Languages | 0 | 0.0% |
| Liberal Arts & History | 17 | 2.6% |
| Visual & Performing Arts | 0 | 0.0% |
| Communications | 0 | 0.0% |
| Arts & Humanities | 0 | 0.0% |
| Total | 649 | 100.0% |
Transportation & Commute in Cleveland
Vehicle Availability by Sex in Cleveland
The most prevalent vehicle ownership categories in Cleveland are males with 2 vehicles (126, accounting for 40.9%) and females with 2 vehicles (127, making up 45.5%).
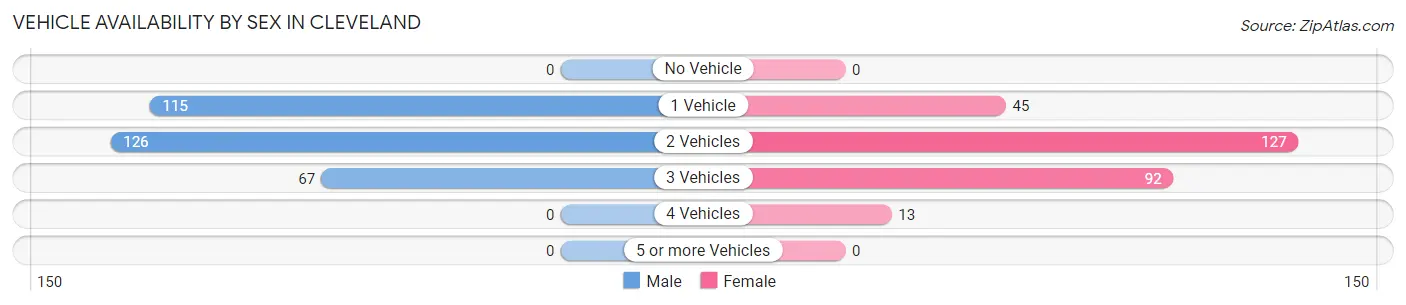
| Vehicles Available | Male | Female |
| No Vehicle | 0 (0.0%) | 0 (0.0%) |
| 1 Vehicle | 115 (37.3%) | 45 (16.3%) |
| 2 Vehicles | 126 (40.9%) | 127 (45.9%) |
| 3 Vehicles | 67 (21.7%) | 92 (33.2%) |
| 4 Vehicles | 0 (0.0%) | 13 (4.7%) |
| 5 or more Vehicles | 0 (0.0%) | 0 (0.0%) |
| Total | 308 (100.0%) | 277 (100.0%) |
Commute Time in Cleveland
The most frequently occuring commute durations in Cleveland are 20 to 24 minutes (108 commuters, 19.6%), 15 to 19 minutes (107 commuters, 19.4%), and less than 5 minutes (87 commuters, 15.8%).
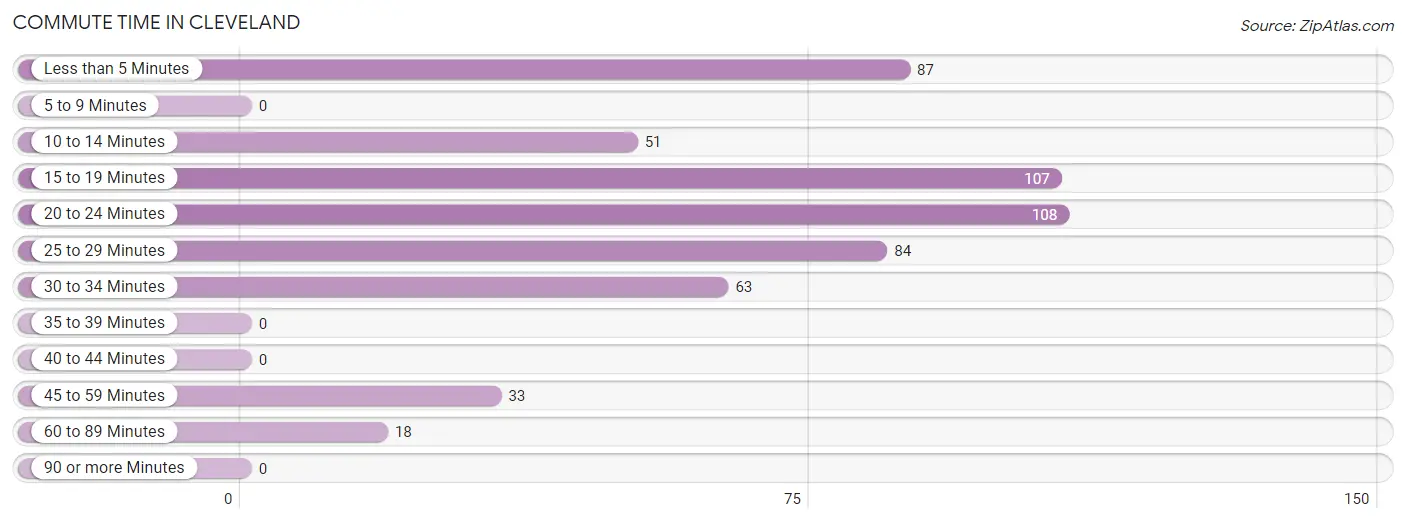
| Commute Time | # Commuters | % Commuters |
| Less than 5 Minutes | 87 | 15.8% |
| 5 to 9 Minutes | 0 | 0.0% |
| 10 to 14 Minutes | 51 | 9.3% |
| 15 to 19 Minutes | 107 | 19.4% |
| 20 to 24 Minutes | 108 | 19.6% |
| 25 to 29 Minutes | 84 | 15.2% |
| 30 to 34 Minutes | 63 | 11.4% |
| 35 to 39 Minutes | 0 | 0.0% |
| 40 to 44 Minutes | 0 | 0.0% |
| 45 to 59 Minutes | 33 | 6.0% |
| 60 to 89 Minutes | 18 | 3.3% |
| 90 or more Minutes | 0 | 0.0% |
Commute Time by Sex in Cleveland
The most common commute times in Cleveland are 15 to 19 minutes (87 commuters, 29.0%) for males and 20 to 24 minutes (98 commuters, 39.0%) for females.
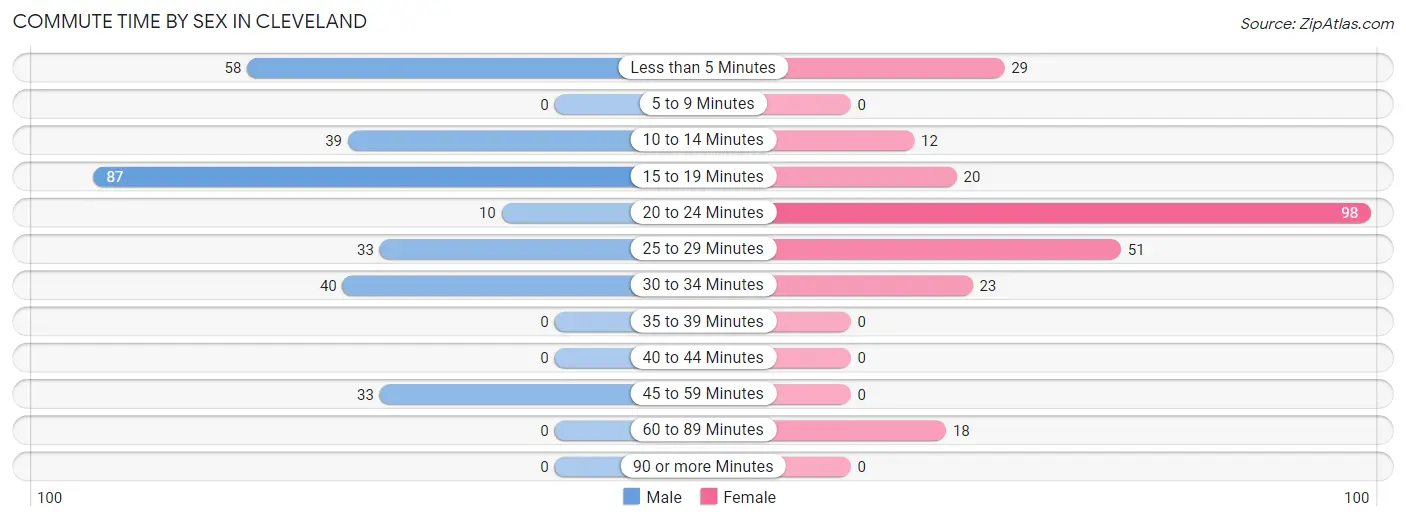
| Commute Time | Male | Female |
| Less than 5 Minutes | 58 (19.3%) | 29 (11.6%) |
| 5 to 9 Minutes | 0 (0.0%) | 0 (0.0%) |
| 10 to 14 Minutes | 39 (13.0%) | 12 (4.8%) |
| 15 to 19 Minutes | 87 (29.0%) | 20 (8.0%) |
| 20 to 24 Minutes | 10 (3.3%) | 98 (39.0%) |
| 25 to 29 Minutes | 33 (11.0%) | 51 (20.3%) |
| 30 to 34 Minutes | 40 (13.3%) | 23 (9.2%) |
| 35 to 39 Minutes | 0 (0.0%) | 0 (0.0%) |
| 40 to 44 Minutes | 0 (0.0%) | 0 (0.0%) |
| 45 to 59 Minutes | 33 (11.0%) | 0 (0.0%) |
| 60 to 89 Minutes | 0 (0.0%) | 18 (7.2%) |
| 90 or more Minutes | 0 (0.0%) | 0 (0.0%) |
Time of Departure to Work by Sex in Cleveland
The most frequent times of departure to work in Cleveland are 7:00 AM to 7:29 AM (87, 29.0%) for males and 7:00 AM to 7:29 AM (52, 20.7%) for females.
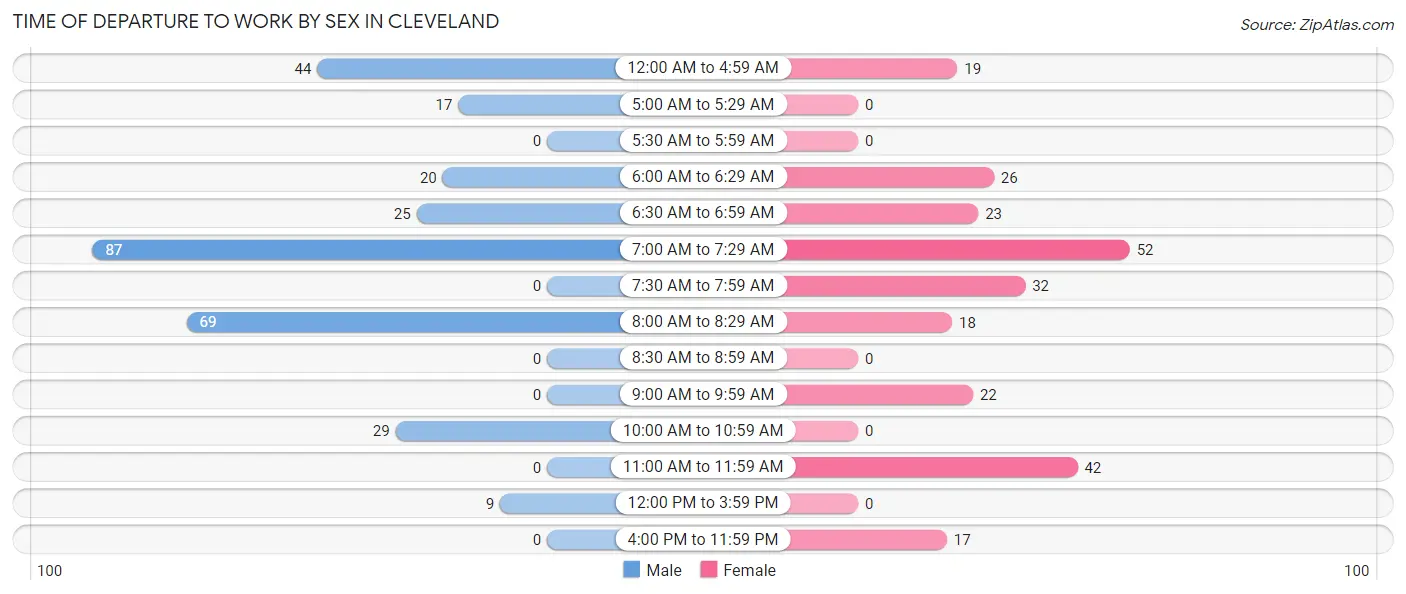
| Time of Departure | Male | Female |
| 12:00 AM to 4:59 AM | 44 (14.7%) | 19 (7.6%) |
| 5:00 AM to 5:29 AM | 17 (5.7%) | 0 (0.0%) |
| 5:30 AM to 5:59 AM | 0 (0.0%) | 0 (0.0%) |
| 6:00 AM to 6:29 AM | 20 (6.7%) | 26 (10.4%) |
| 6:30 AM to 6:59 AM | 25 (8.3%) | 23 (9.2%) |
| 7:00 AM to 7:29 AM | 87 (29.0%) | 52 (20.7%) |
| 7:30 AM to 7:59 AM | 0 (0.0%) | 32 (12.8%) |
| 8:00 AM to 8:29 AM | 69 (23.0%) | 18 (7.2%) |
| 8:30 AM to 8:59 AM | 0 (0.0%) | 0 (0.0%) |
| 9:00 AM to 9:59 AM | 0 (0.0%) | 22 (8.8%) |
| 10:00 AM to 10:59 AM | 29 (9.7%) | 0 (0.0%) |
| 11:00 AM to 11:59 AM | 0 (0.0%) | 42 (16.7%) |
| 12:00 PM to 3:59 PM | 9 (3.0%) | 0 (0.0%) |
| 4:00 PM to 11:59 PM | 0 (0.0%) | 17 (6.8%) |
| Total | 300 (100.0%) | 251 (100.0%) |
Housing Occupancy in Cleveland
Occupancy by Ownership in Cleveland
Of the total 1,436 dwellings in Cleveland, owner-occupied units account for 1,085 (75.6%), while renter-occupied units make up 351 (24.4%).
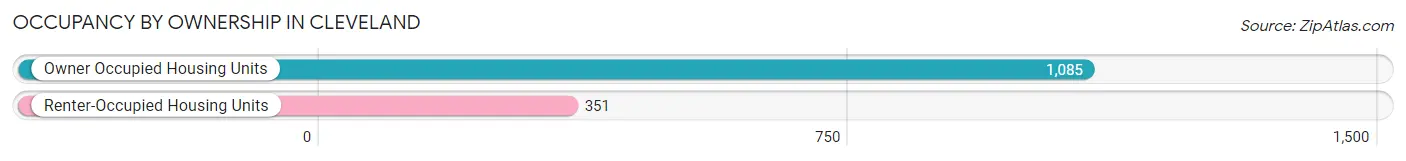
| Occupancy | # Housing Units | % Housing Units |
| Owner Occupied Housing Units | 1,085 | 75.6% |
| Renter-Occupied Housing Units | 351 | 24.4% |
| Total Occupied Housing Units | 1,436 | 100.0% |
Occupancy by Household Size in Cleveland
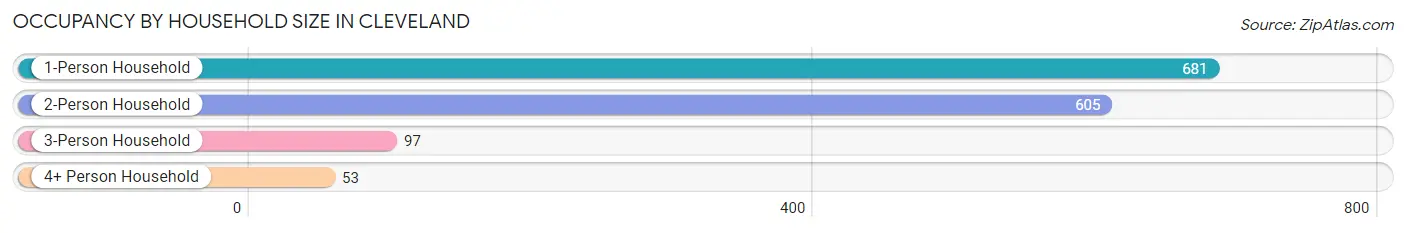
| Household Size | # Housing Units | % Housing Units |
| 1-Person Household | 681 | 47.4% |
| 2-Person Household | 605 | 42.1% |
| 3-Person Household | 97 | 6.8% |
| 4+ Person Household | 53 | 3.7% |
| Total Housing Units | 1,436 | 100.0% |
Occupancy by Ownership by Household Size in Cleveland
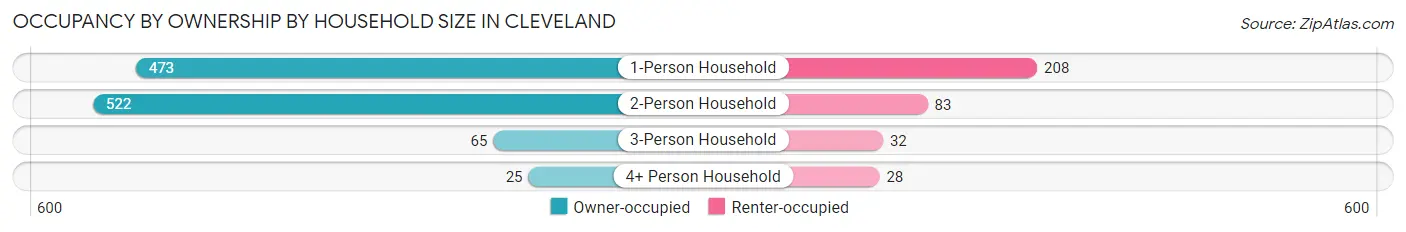
| Household Size | Owner-occupied | Renter-occupied |
| 1-Person Household | 473 (69.5%) | 208 (30.5%) |
| 2-Person Household | 522 (86.3%) | 83 (13.7%) |
| 3-Person Household | 65 (67.0%) | 32 (33.0%) |
| 4+ Person Household | 25 (47.2%) | 28 (52.8%) |
| Total Housing Units | 1,085 (75.6%) | 351 (24.4%) |
Occupancy by Educational Attainment in Cleveland
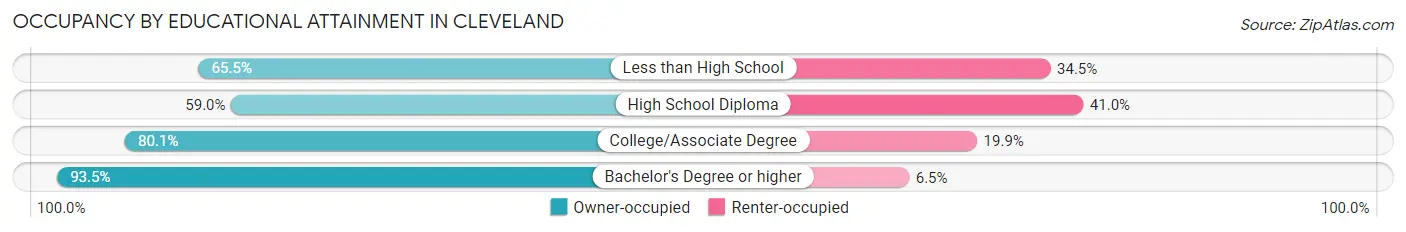
| Household Size | Owner-occupied | Renter-occupied |
| Less than High School | 38 (65.5%) | 20 (34.5%) |
| High School Diploma | 298 (59.0%) | 207 (41.0%) |
| College/Associate Degree | 402 (80.1%) | 100 (19.9%) |
| Bachelor's Degree or higher | 347 (93.5%) | 24 (6.5%) |
Occupancy by Age of Householder in Cleveland
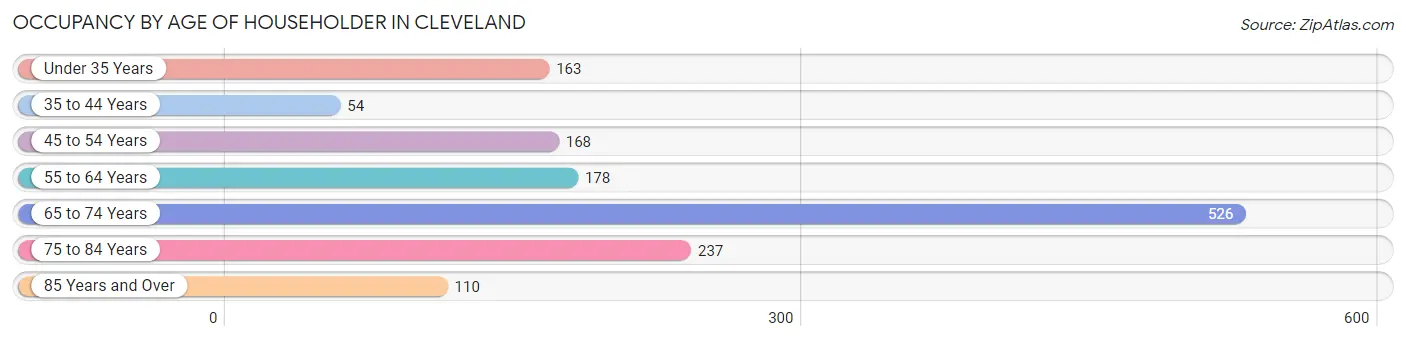
| Age Bracket | # Households | % Households |
| Under 35 Years | 163 | 11.4% |
| 35 to 44 Years | 54 | 3.8% |
| 45 to 54 Years | 168 | 11.7% |
| 55 to 64 Years | 178 | 12.4% |
| 65 to 74 Years | 526 | 36.6% |
| 75 to 84 Years | 237 | 16.5% |
| 85 Years and Over | 110 | 7.7% |
| Total | 1,436 | 100.0% |
Housing Finances in Cleveland
Median Income by Occupancy in Cleveland
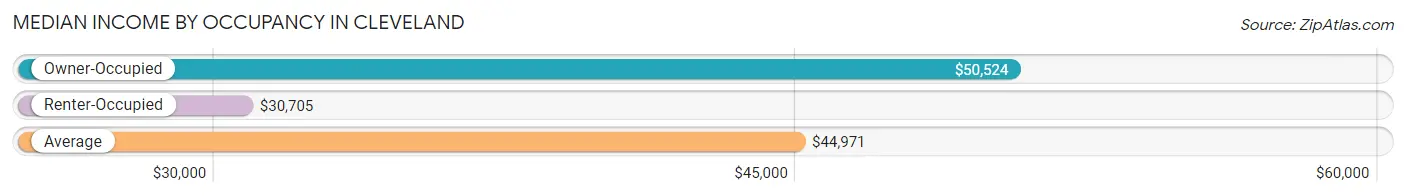
| Occupancy Type | # Households | Median Income |
| Owner-Occupied | 1,085 (75.6%) | $50,524 |
| Renter-Occupied | 351 (24.4%) | $30,705 |
| Average | 1,436 (100.0%) | $44,971 |
Occupancy by Householder Income Bracket in Cleveland
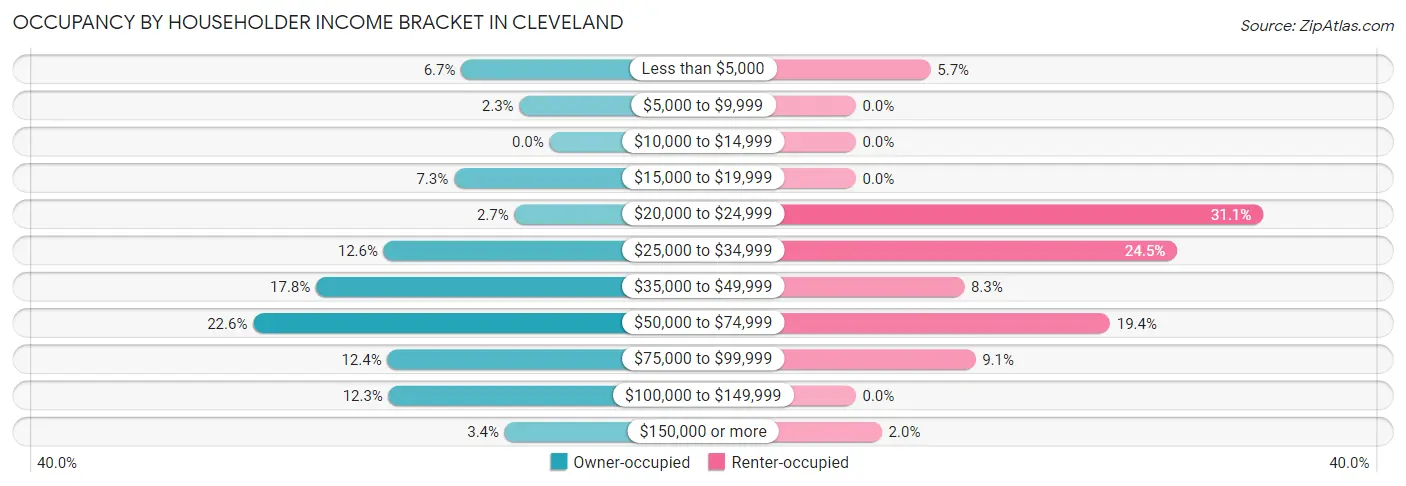
| Income Bracket | Owner-occupied | Renter-occupied |
| Less than $5,000 | 73 (6.7%) | 20 (5.7%) |
| $5,000 to $9,999 | 25 (2.3%) | 0 (0.0%) |
| $10,000 to $14,999 | 0 (0.0%) | 0 (0.0%) |
| $15,000 to $19,999 | 79 (7.3%) | 0 (0.0%) |
| $20,000 to $24,999 | 29 (2.7%) | 109 (31.0%) |
| $25,000 to $34,999 | 137 (12.6%) | 86 (24.5%) |
| $35,000 to $49,999 | 193 (17.8%) | 29 (8.3%) |
| $50,000 to $74,999 | 245 (22.6%) | 68 (19.4%) |
| $75,000 to $99,999 | 134 (12.3%) | 32 (9.1%) |
| $100,000 to $149,999 | 133 (12.3%) | 0 (0.0%) |
| $150,000 or more | 37 (3.4%) | 7 (2.0%) |
| Total | 1,085 (100.0%) | 351 (100.0%) |
Monthly Housing Cost Tiers in Cleveland
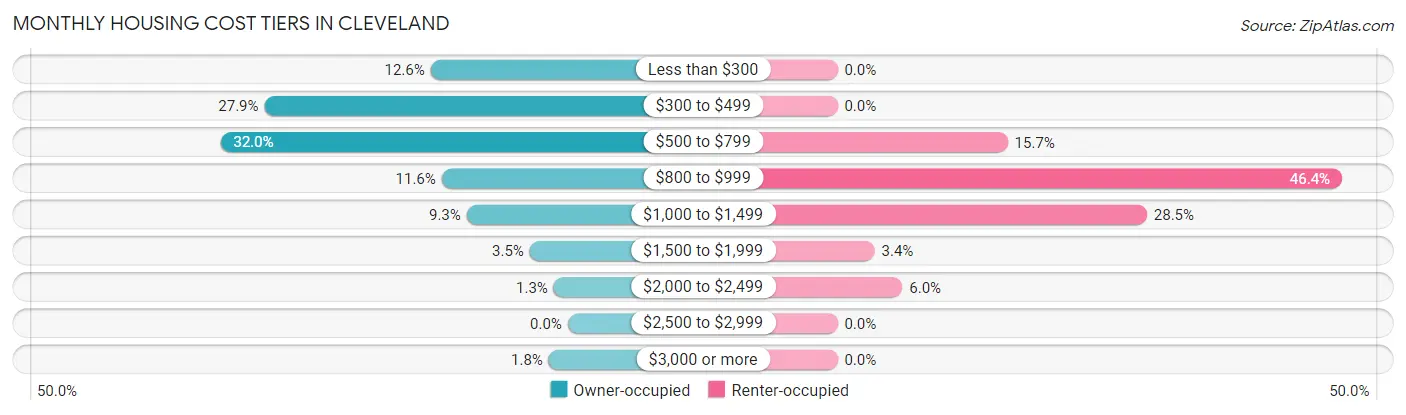
| Monthly Cost | Owner-occupied | Renter-occupied |
| Less than $300 | 137 (12.6%) | 0 (0.0%) |
| $300 to $499 | 303 (27.9%) | 0 (0.0%) |
| $500 to $799 | 347 (32.0%) | 55 (15.7%) |
| $800 to $999 | 126 (11.6%) | 163 (46.4%) |
| $1,000 to $1,499 | 101 (9.3%) | 100 (28.5%) |
| $1,500 to $1,999 | 38 (3.5%) | 12 (3.4%) |
| $2,000 to $2,499 | 14 (1.3%) | 21 (6.0%) |
| $2,500 to $2,999 | 0 (0.0%) | 0 (0.0%) |
| $3,000 or more | 19 (1.8%) | 0 (0.0%) |
| Total | 1,085 (100.0%) | 351 (100.0%) |
Physical Housing Characteristics in Cleveland
Housing Structures in Cleveland
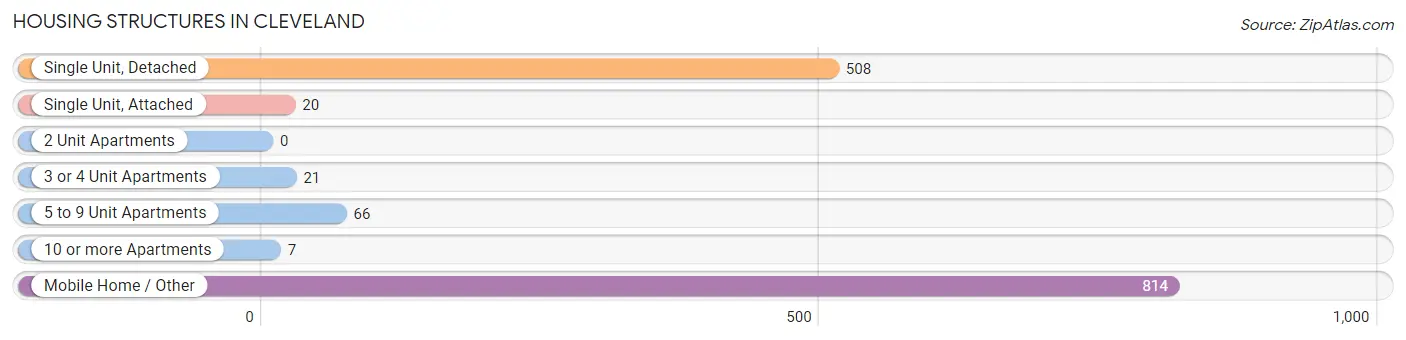
| Structure Type | # Housing Units | % Housing Units |
| Single Unit, Detached | 508 | 35.4% |
| Single Unit, Attached | 20 | 1.4% |
| 2 Unit Apartments | 0 | 0.0% |
| 3 or 4 Unit Apartments | 21 | 1.5% |
| 5 to 9 Unit Apartments | 66 | 4.6% |
| 10 or more Apartments | 7 | 0.5% |
| Mobile Home / Other | 814 | 56.7% |
| Total | 1,436 | 100.0% |
Housing Structures by Occupancy in Cleveland
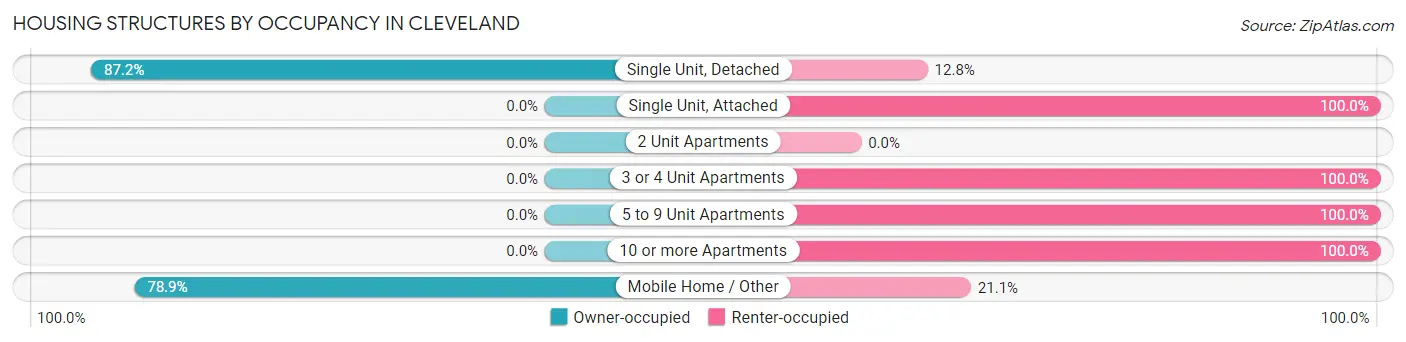
| Structure Type | Owner-occupied | Renter-occupied |
| Single Unit, Detached | 443 (87.2%) | 65 (12.8%) |
| Single Unit, Attached | 0 (0.0%) | 20 (100.0%) |
| 2 Unit Apartments | 0 (0.0%) | 0 (0.0%) |
| 3 or 4 Unit Apartments | 0 (0.0%) | 21 (100.0%) |
| 5 to 9 Unit Apartments | 0 (0.0%) | 66 (100.0%) |
| 10 or more Apartments | 0 (0.0%) | 7 (100.0%) |
| Mobile Home / Other | 642 (78.9%) | 172 (21.1%) |
| Total | 1,085 (75.6%) | 351 (24.4%) |
Housing Structures by Number of Rooms in Cleveland
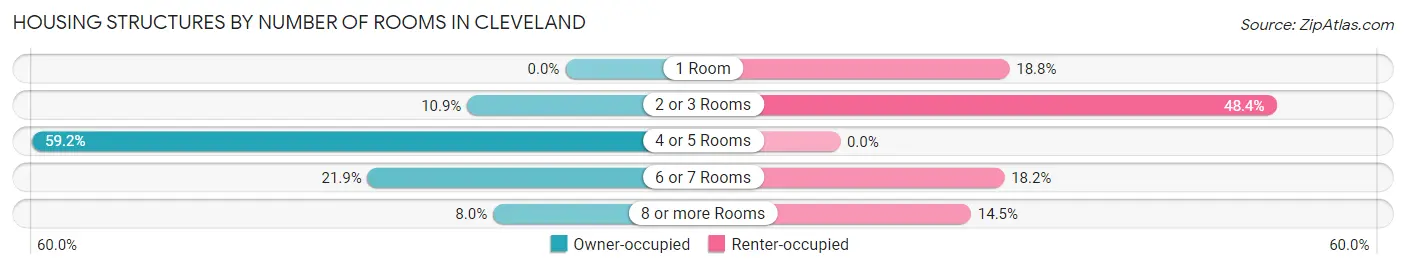
| Number of Rooms | Owner-occupied | Renter-occupied |
| 1 Room | 0 (0.0%) | 66 (18.8%) |
| 2 or 3 Rooms | 118 (10.9%) | 170 (48.4%) |
| 4 or 5 Rooms | 642 (59.2%) | 0 (0.0%) |
| 6 or 7 Rooms | 238 (21.9%) | 64 (18.2%) |
| 8 or more Rooms | 87 (8.0%) | 51 (14.5%) |
| Total | 1,085 (100.0%) | 351 (100.0%) |
Housing Structure by Heating Type in Cleveland
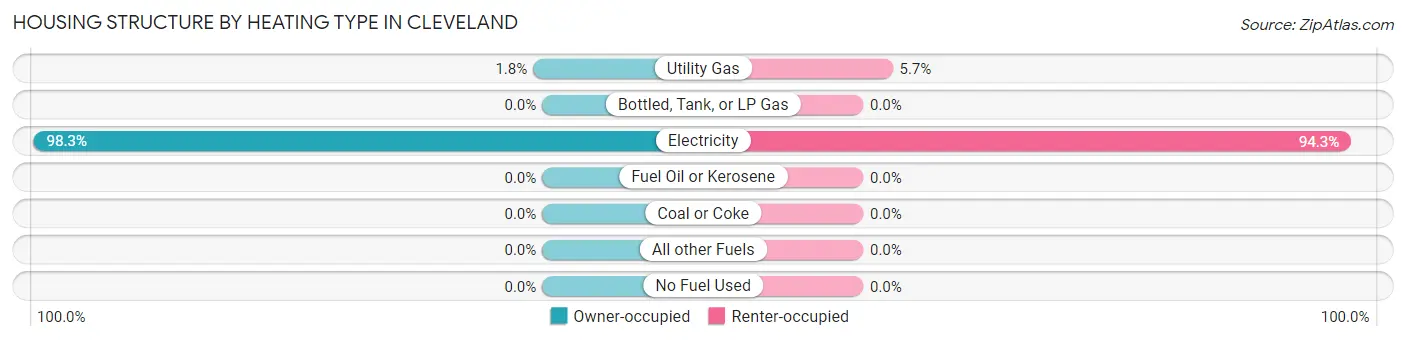
| Heating Type | Owner-occupied | Renter-occupied |
| Utility Gas | 19 (1.8%) | 20 (5.7%) |
| Bottled, Tank, or LP Gas | 0 (0.0%) | 0 (0.0%) |
| Electricity | 1,066 (98.3%) | 331 (94.3%) |
| Fuel Oil or Kerosene | 0 (0.0%) | 0 (0.0%) |
| Coal or Coke | 0 (0.0%) | 0 (0.0%) |
| All other Fuels | 0 (0.0%) | 0 (0.0%) |
| No Fuel Used | 0 (0.0%) | 0 (0.0%) |
| Total | 1,085 (100.0%) | 351 (100.0%) |
Household Vehicle Usage in Cleveland
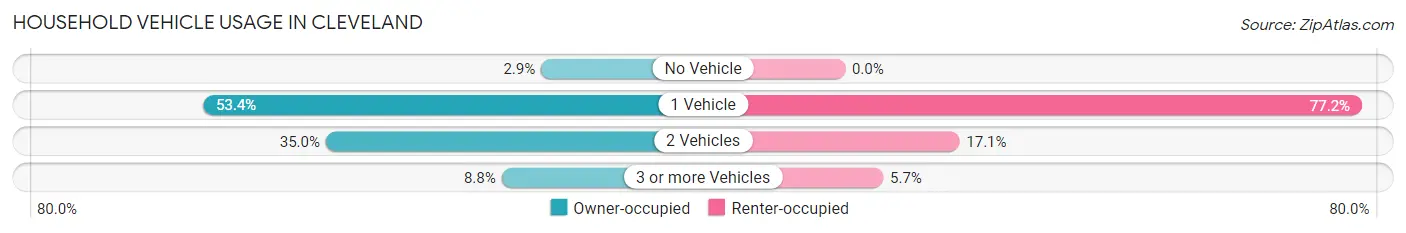
| Vehicles per Household | Owner-occupied | Renter-occupied |
| No Vehicle | 31 (2.9%) | 0 (0.0%) |
| 1 Vehicle | 579 (53.4%) | 271 (77.2%) |
| 2 Vehicles | 380 (35.0%) | 60 (17.1%) |
| 3 or more Vehicles | 95 (8.8%) | 20 (5.7%) |
| Total | 1,085 (100.0%) | 351 (100.0%) |
Real Estate & Mortgages in Cleveland
Real Estate and Mortgage Overview in Cleveland
| Characteristic | Without Mortgage | With Mortgage |
| Housing Units | 823 | 262 |
| Median Property Value | $131,300 | $158,300 |
| Median Household Income | $42,949 | $27 |
| Monthly Housing Costs | $489 | $19 |
| Real Estate Taxes | $1,166 | $35 |
Property Value by Mortgage Status in Cleveland
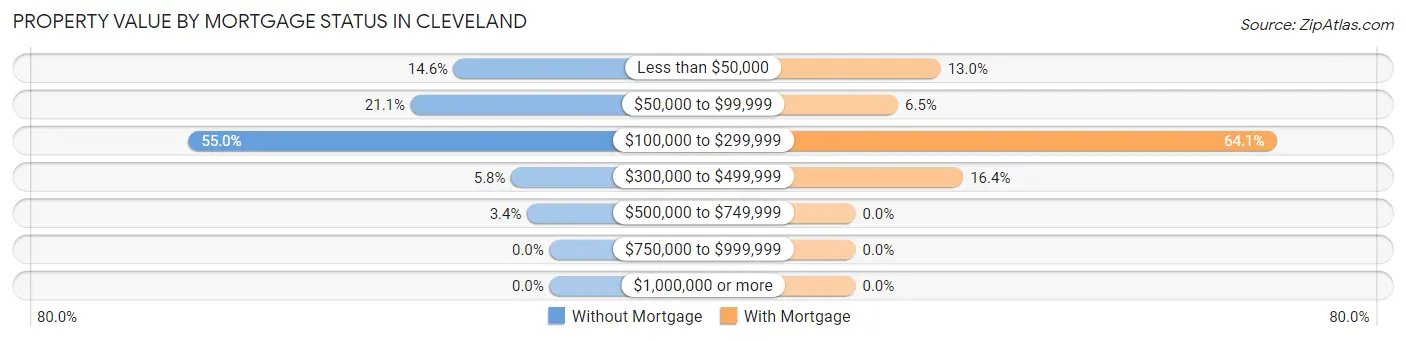
| Property Value | Without Mortgage | With Mortgage |
| Less than $50,000 | 120 (14.6%) | 34 (13.0%) |
| $50,000 to $99,999 | 174 (21.1%) | 17 (6.5%) |
| $100,000 to $299,999 | 453 (55.0%) | 168 (64.1%) |
| $300,000 to $499,999 | 48 (5.8%) | 43 (16.4%) |
| $500,000 to $749,999 | 28 (3.4%) | 0 (0.0%) |
| $750,000 to $999,999 | 0 (0.0%) | 0 (0.0%) |
| $1,000,000 or more | 0 (0.0%) | 0 (0.0%) |
| Total | 823 (100.0%) | 262 (100.0%) |
Household Income by Mortgage Status in Cleveland
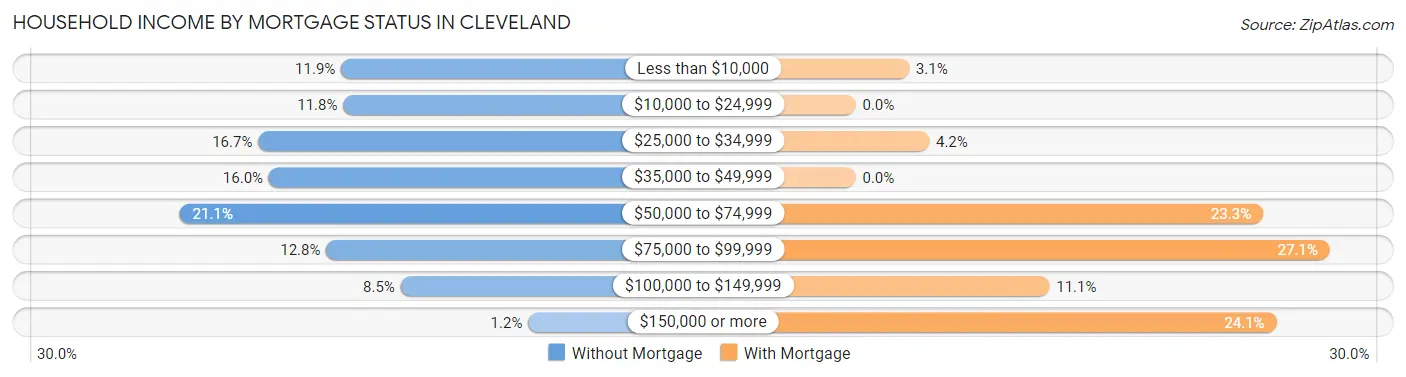
| Household Income | Without Mortgage | With Mortgage |
| Less than $10,000 | 98 (11.9%) | 8 (3.0%) |
| $10,000 to $24,999 | 97 (11.8%) | 0 (0.0%) |
| $25,000 to $34,999 | 137 (16.7%) | 11 (4.2%) |
| $35,000 to $49,999 | 132 (16.0%) | 0 (0.0%) |
| $50,000 to $74,999 | 174 (21.1%) | 61 (23.3%) |
| $75,000 to $99,999 | 105 (12.8%) | 71 (27.1%) |
| $100,000 to $149,999 | 70 (8.5%) | 29 (11.1%) |
| $150,000 or more | 10 (1.2%) | 63 (24.0%) |
| Total | 823 (100.0%) | 262 (100.0%) |
Property Value to Household Income Ratio in Cleveland
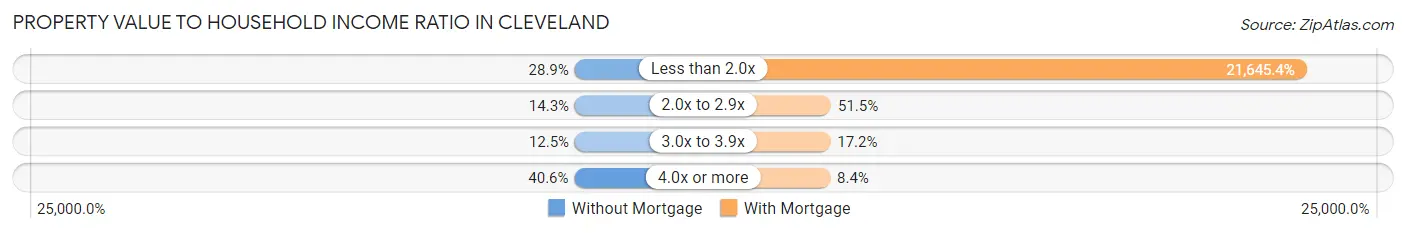
| Value-to-Income Ratio | Without Mortgage | With Mortgage |
| Less than 2.0x | 238 (28.9%) | 56,711 (21,645.4%) |
| 2.0x to 2.9x | 118 (14.3%) | 135 (51.5%) |
| 3.0x to 3.9x | 103 (12.5%) | 45 (17.2%) |
| 4.0x or more | 334 (40.6%) | 22 (8.4%) |
| Total | 823 (100.0%) | 262 (100.0%) |
Real Estate Taxes by Mortgage Status in Cleveland
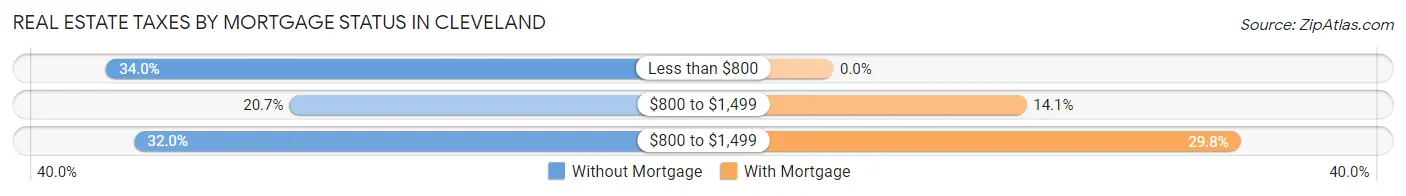
| Property Taxes | Without Mortgage | With Mortgage |
| Less than $800 | 280 (34.0%) | 0 (0.0%) |
| $800 to $1,499 | 170 (20.7%) | 37 (14.1%) |
| $800 to $1,499 | 263 (32.0%) | 78 (29.8%) |
| Total | 823 (100.0%) | 262 (100.0%) |
Health & Disability in Cleveland
Health Insurance Coverage by Age in Cleveland
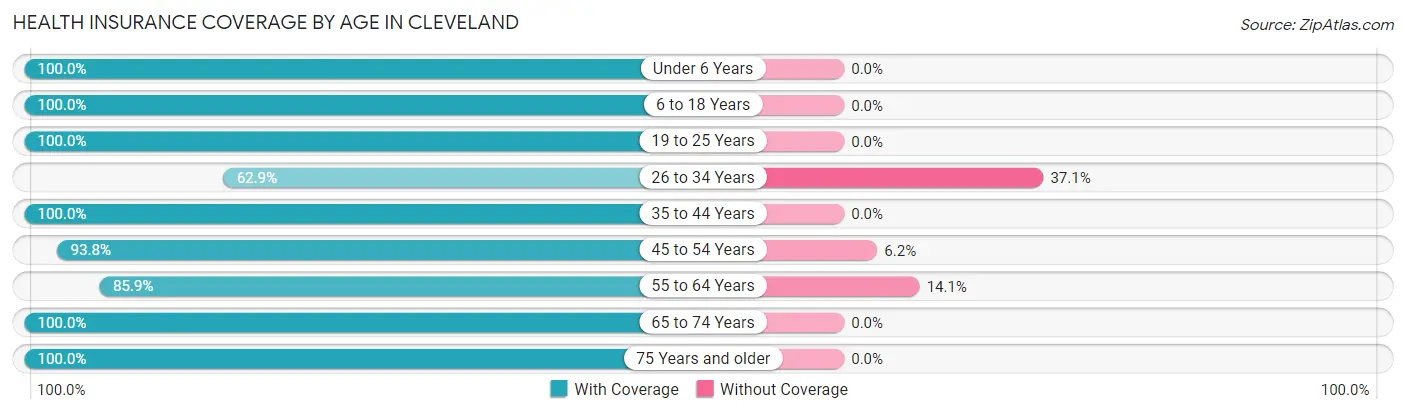
| Age Bracket | With Coverage | Without Coverage |
| Under 6 Years | 45 (100.0%) | 0 (0.0%) |
| 6 to 18 Years | 84 (100.0%) | 0 (0.0%) |
| 19 to 25 Years | 78 (100.0%) | 0 (0.0%) |
| 26 to 34 Years | 132 (62.9%) | 78 (37.1%) |
| 35 to 44 Years | 100 (100.0%) | 0 (0.0%) |
| 45 to 54 Years | 228 (93.8%) | 15 (6.2%) |
| 55 to 64 Years | 373 (85.9%) | 61 (14.1%) |
| 65 to 74 Years | 715 (100.0%) | 0 (0.0%) |
| 75 Years and older | 557 (100.0%) | 0 (0.0%) |
| Total | 2,312 (93.8%) | 154 (6.2%) |
Health Insurance Coverage by Citizenship Status in Cleveland
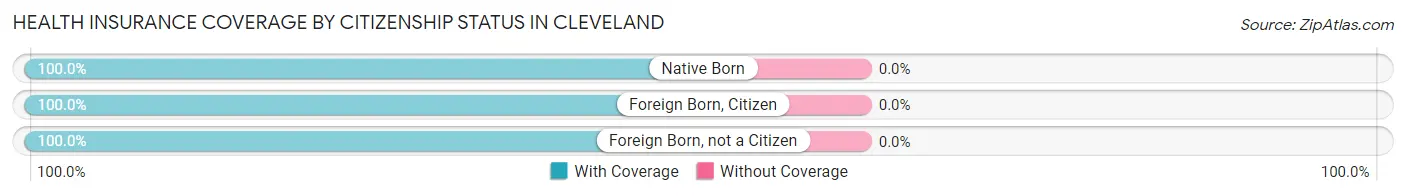
| Citizenship Status | With Coverage | Without Coverage |
| Native Born | 45 (100.0%) | 0 (0.0%) |
| Foreign Born, Citizen | 84 (100.0%) | 0 (0.0%) |
| Foreign Born, not a Citizen | 78 (100.0%) | 0 (0.0%) |
Health Insurance Coverage by Household Income in Cleveland

| Household Income | With Coverage | Without Coverage |
| Under $25,000 | 247 (73.7%) | 88 (26.3%) |
| $25,000 to $49,999 | 643 (96.4%) | 24 (3.6%) |
| $50,000 to $74,999 | 677 (95.1%) | 35 (4.9%) |
| $75,000 to $99,999 | 354 (100.0%) | 0 (0.0%) |
| $100,000 and over | 391 (98.2%) | 7 (1.8%) |
Public vs Private Health Insurance Coverage by Age in Cleveland
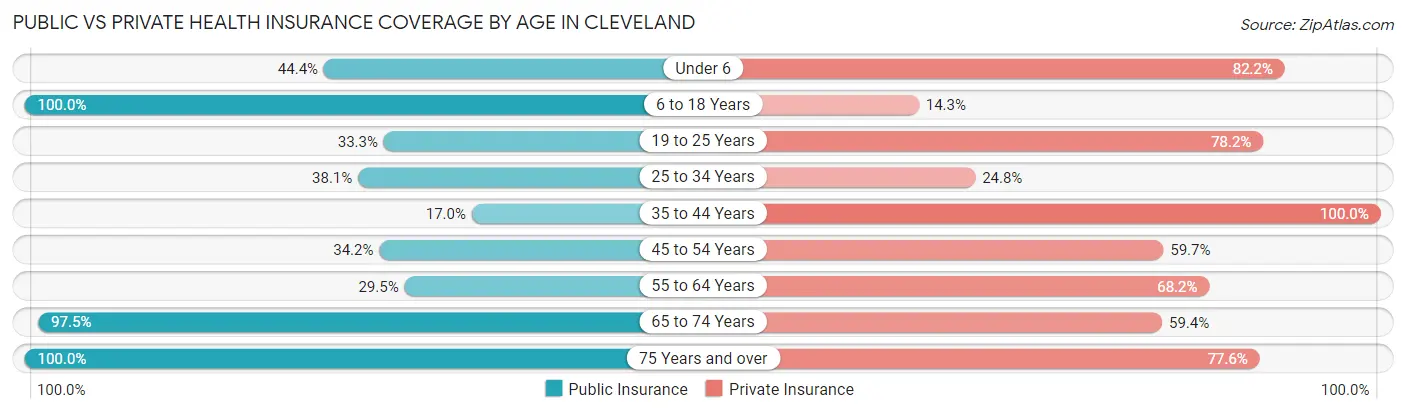
| Age Bracket | Public Insurance | Private Insurance |
| Under 6 | 20 (44.4%) | 37 (82.2%) |
| 6 to 18 Years | 84 (100.0%) | 12 (14.3%) |
| 19 to 25 Years | 26 (33.3%) | 61 (78.2%) |
| 25 to 34 Years | 80 (38.1%) | 52 (24.8%) |
| 35 to 44 Years | 17 (17.0%) | 100 (100.0%) |
| 45 to 54 Years | 83 (34.2%) | 145 (59.7%) |
| 55 to 64 Years | 128 (29.5%) | 296 (68.2%) |
| 65 to 74 Years | 697 (97.5%) | 425 (59.4%) |
| 75 Years and over | 557 (100.0%) | 432 (77.6%) |
| Total | 1,692 (68.6%) | 1,560 (63.3%) |
Disability Status by Sex by Age in Cleveland
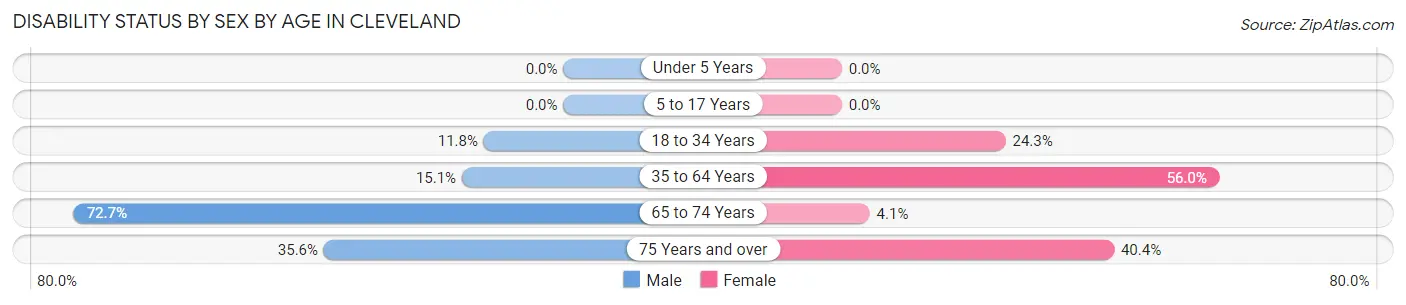
| Age Bracket | Male | Female |
| Under 5 Years | 0 (0.0%) | 0 (0.0%) |
| 5 to 17 Years | 0 (0.0%) | 0 (0.0%) |
| 18 to 34 Years | 17 (11.8%) | 35 (24.3%) |
| 35 to 64 Years | 64 (15.1%) | 197 (56.0%) |
| 65 to 74 Years | 221 (72.7%) | 17 (4.1%) |
| 75 Years and over | 96 (35.6%) | 116 (40.4%) |
Disability Class by Sex by Age in Cleveland
Disability Class: Hearing Difficulty
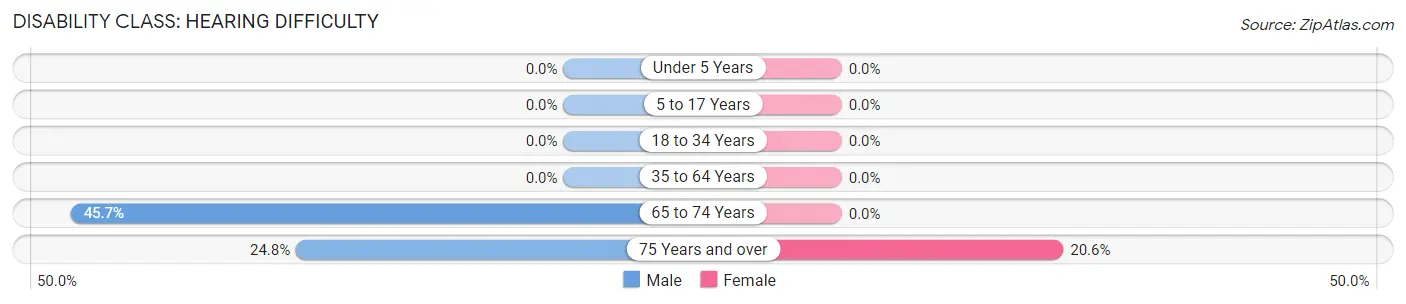
| Age Bracket | Male | Female |
| Under 5 Years | 0 (0.0%) | 0 (0.0%) |
| 5 to 17 Years | 0 (0.0%) | 0 (0.0%) |
| 18 to 34 Years | 0 (0.0%) | 0 (0.0%) |
| 35 to 64 Years | 0 (0.0%) | 0 (0.0%) |
| 65 to 74 Years | 139 (45.7%) | 0 (0.0%) |
| 75 Years and over | 67 (24.8%) | 59 (20.6%) |
Disability Class: Vision Difficulty
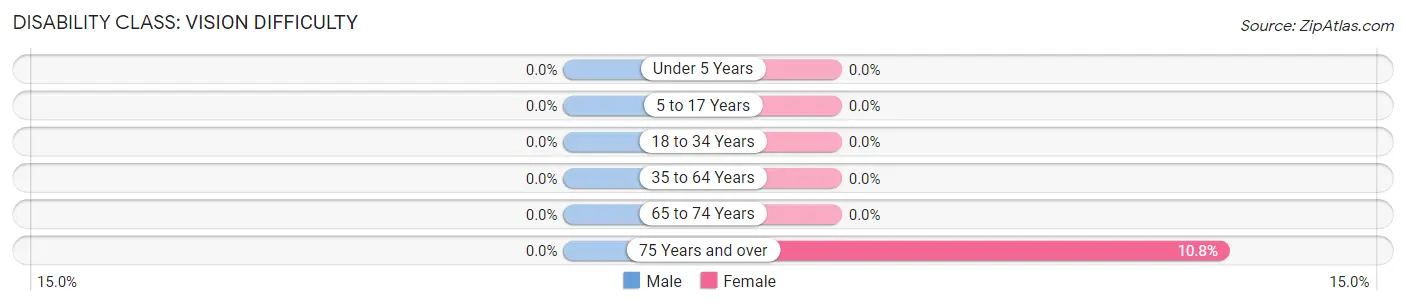
| Age Bracket | Male | Female |
| Under 5 Years | 0 (0.0%) | 0 (0.0%) |
| 5 to 17 Years | 0 (0.0%) | 0 (0.0%) |
| 18 to 34 Years | 0 (0.0%) | 0 (0.0%) |
| 35 to 64 Years | 0 (0.0%) | 0 (0.0%) |
| 65 to 74 Years | 0 (0.0%) | 0 (0.0%) |
| 75 Years and over | 0 (0.0%) | 31 (10.8%) |
Disability Class: Cognitive Difficulty
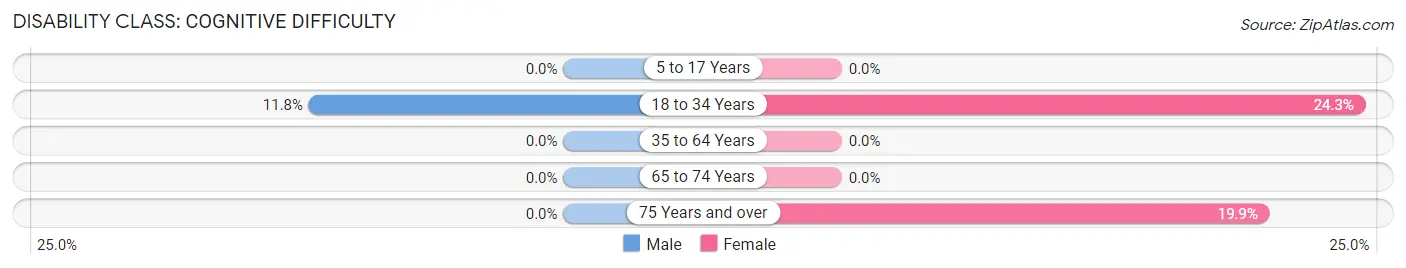
| Age Bracket | Male | Female |
| 5 to 17 Years | 0 (0.0%) | 0 (0.0%) |
| 18 to 34 Years | 17 (11.8%) | 35 (24.3%) |
| 35 to 64 Years | 0 (0.0%) | 0 (0.0%) |
| 65 to 74 Years | 0 (0.0%) | 0 (0.0%) |
| 75 Years and over | 0 (0.0%) | 57 (19.9%) |
Disability Class: Ambulatory Difficulty
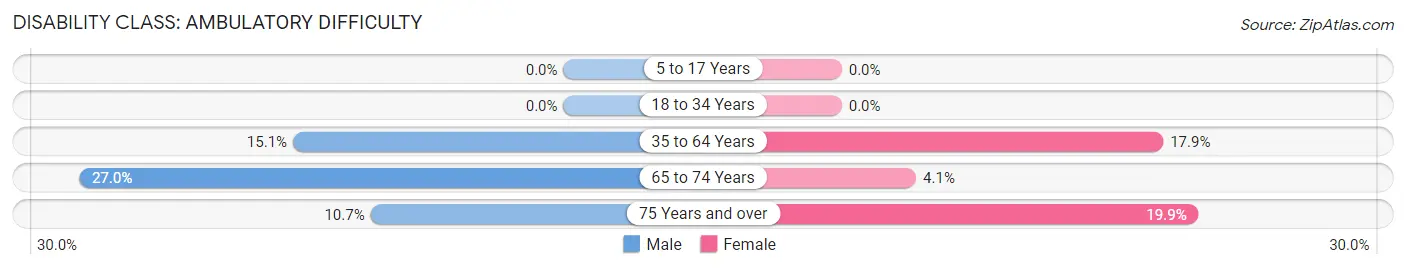
| Age Bracket | Male | Female |
| 5 to 17 Years | 0 (0.0%) | 0 (0.0%) |
| 18 to 34 Years | 0 (0.0%) | 0 (0.0%) |
| 35 to 64 Years | 64 (15.1%) | 63 (17.9%) |
| 65 to 74 Years | 82 (27.0%) | 17 (4.1%) |
| 75 Years and over | 29 (10.7%) | 57 (19.9%) |
Disability Class: Self-Care Difficulty
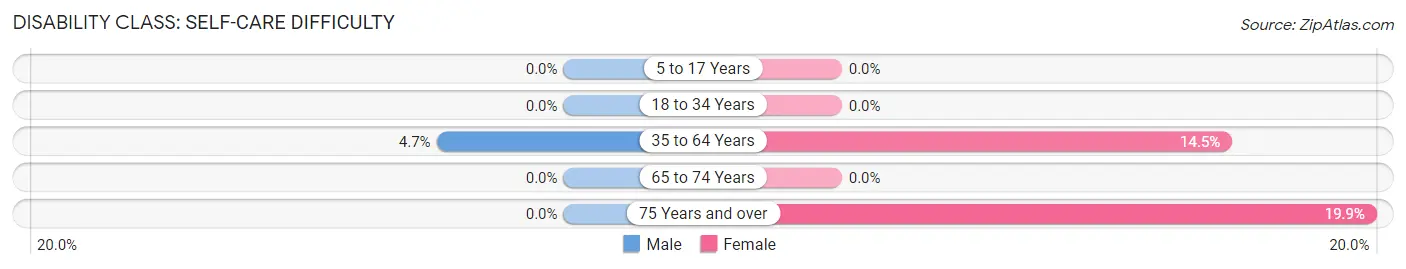
| Age Bracket | Male | Female |
| 5 to 17 Years | 0 (0.0%) | 0 (0.0%) |
| 18 to 34 Years | 0 (0.0%) | 0 (0.0%) |
| 35 to 64 Years | 20 (4.7%) | 51 (14.5%) |
| 65 to 74 Years | 0 (0.0%) | 0 (0.0%) |
| 75 Years and over | 0 (0.0%) | 57 (19.9%) |
Technology Access in Cleveland
Computing Device Access in Cleveland
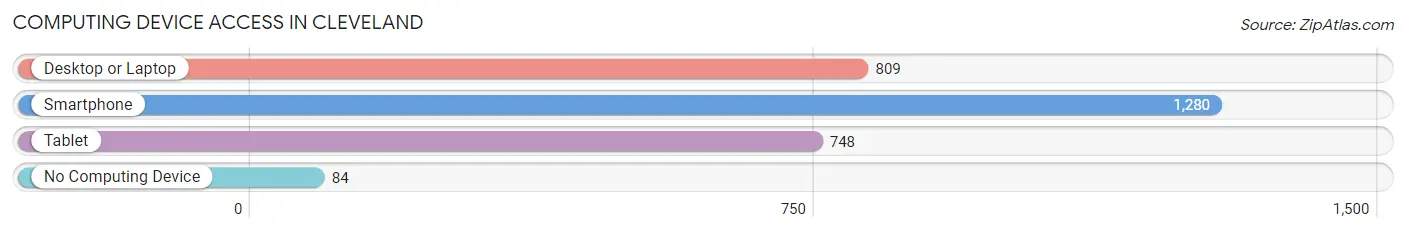
| Device Type | # Households | % Households |
| Desktop or Laptop | 809 | 56.3% |
| Smartphone | 1,280 | 89.1% |
| Tablet | 748 | 52.1% |
| No Computing Device | 84 | 5.9% |
| Total | 1,436 | 100.0% |
Internet Access in Cleveland
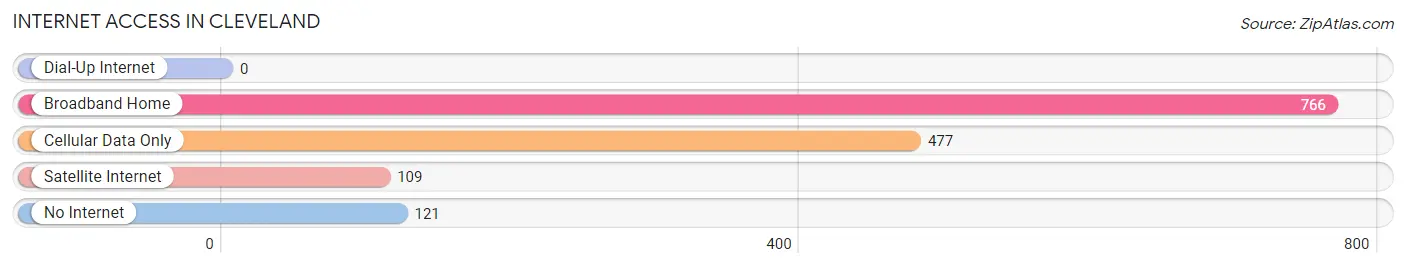
| Internet Type | # Households | % Households |
| Dial-Up Internet | 0 | 0.0% |
| Broadband Home | 766 | 53.3% |
| Cellular Data Only | 477 | 33.2% |
| Satellite Internet | 109 | 7.6% |
| No Internet | 121 | 8.4% |
| Total | 1,436 | 100.0% |
Cleveland Summary
Cleveland is a small town located in the state of Florida in the United States. It is located in the northeastern part of the state, about 25 miles east of Gainesville. The town has a population of about 1,000 people and is part of the Gainesville Metropolitan Statistical Area.
Geography
Cleveland is located in the northeastern part of Florida, about 25 miles east of Gainesville. The town is situated on the banks of the Suwannee River, which is a major tributary of the Gulf of Mexico. The town is surrounded by rolling hills and is located in a rural area. The town is located in the humid subtropical climate zone, with hot summers and mild winters. The average annual temperature is around 70 degrees Fahrenheit.
Economy
Cleveland is a small town with a limited economy. The town is primarily supported by agriculture and forestry. The town is home to several farms, which produce a variety of crops, including corn, soybeans, and cotton. The town is also home to several timber companies, which harvest timber from the surrounding forests. The town is also home to several small businesses, including restaurants, convenience stores, and gas stations.
Demographics
As of the 2010 census, the population of Cleveland was 1,000 people. The town is predominantly white, with about 85% of the population being white. The remaining 15% of the population is made up of African Americans, Hispanics, and other ethnicities. The median household income in the town is around $30,000, and the median home value is around $90,000.
History
Cleveland was founded in 1854 by a group of settlers from Georgia. The town was named after the city of Cleveland, Ohio, which was the hometown of one of the settlers. The town was originally a farming community, and the main crops grown were cotton and corn. The town was also home to several timber companies, which harvested timber from the surrounding forests.
In the early 1900s, the town began to experience a period of growth. The town was home to several businesses, including a sawmill, a gristmill, and a general store. The town was also home to several churches, and the town was served by a railroad line.
In the late 1900s, the town began to experience a period of decline. The timber industry began to decline, and the town began to lose population. The town was also affected by the Great Depression, and many of the businesses in the town closed.
Today, Cleveland is a small town with a limited economy. The town is primarily supported by agriculture and forestry. The town is home to several small businesses, including restaurants, convenience stores, and gas stations. The town is also home to several churches, and the town is served by a railroad line.
Common Questions
What is Per Capita Income in Cleveland?
Per Capita income in Cleveland is $39,377.
What is the Median Family Income in Cleveland?
Median Family Income in Cleveland is $65,949.
What is the Median Household income in Cleveland?
Median Household Income in Cleveland is $44,971.
What is Inequality or Gini Index in Cleveland?
Inequality or Gini Index in Cleveland is 0.49.
What is the Total Population of Cleveland?
Total Population of Cleveland is 2,466.
What is the Total Male Population of Cleveland?
Total Male Population of Cleveland is 1,188.
What is the Total Female Population of Cleveland?
Total Female Population of Cleveland is 1,278.
What is the Ratio of Males per 100 Females in Cleveland?
There are 92.96 Males per 100 Females in Cleveland.
What is the Ratio of Females per 100 Males in Cleveland?
There are 107.58 Females per 100 Males in Cleveland.
What is the Median Population Age in Cleveland?
Median Population Age in Cleveland is 66.0 Years.
What is the Average Family Size in Cleveland
Average Family Size in Cleveland is 2.3 People.
What is the Average Household Size in Cleveland
Average Household Size in Cleveland is 1.7 People.
How Large is the Labor Force in Cleveland?
There are 640 People in the Labor Forcein in Cleveland.
What is the Percentage of People in the Labor Force in Cleveland?
27.4% of People are in the Labor Force in Cleveland.