St Marks, FL Map & Demographics
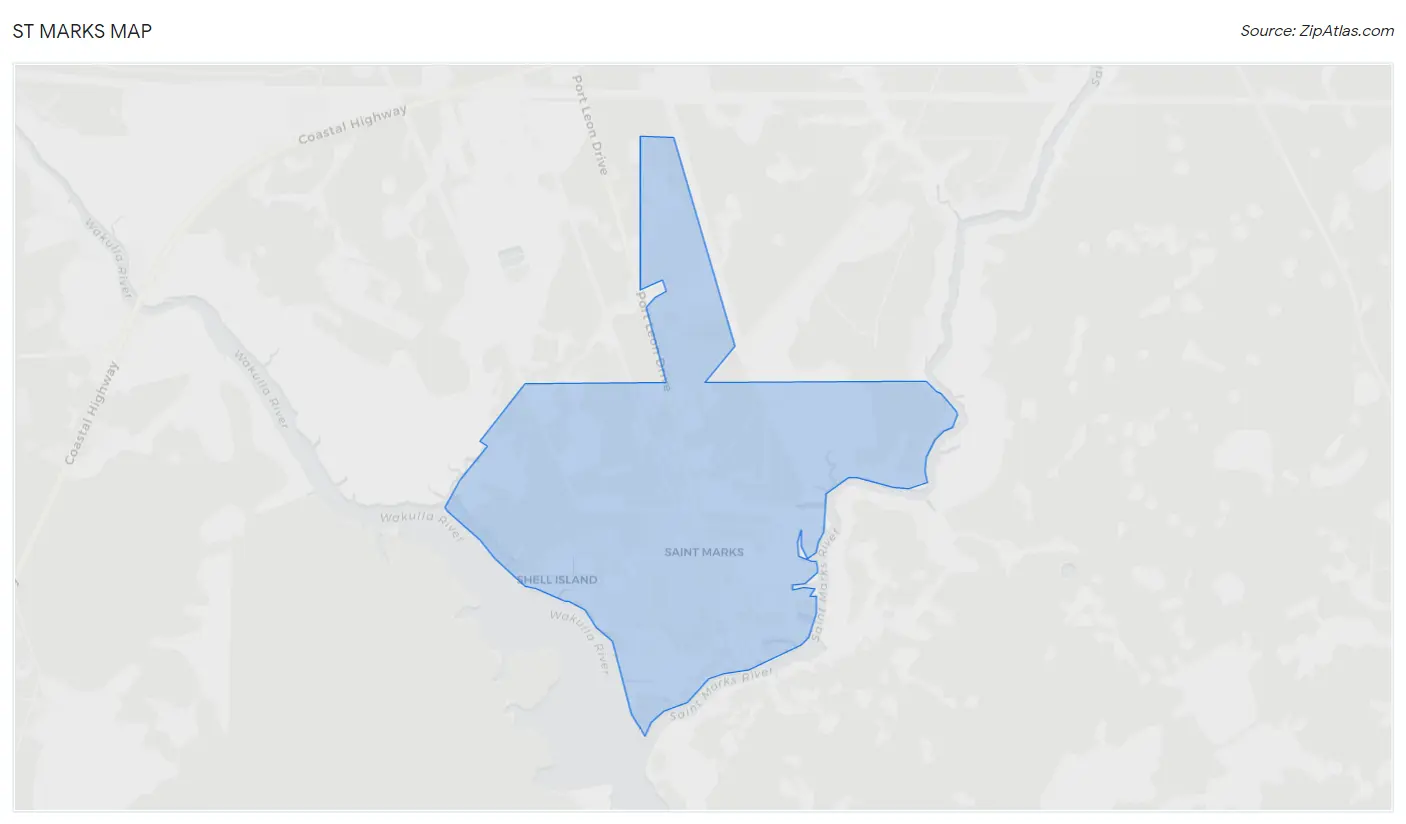
St Marks Map
St Marks Overview
$26,462
PER CAPITA INCOME
$47,500
AVG HOUSEHOLD INCOME
19.8%
WAGE / INCOME GAP [ % ]
80.2¢/ $1
WAGE / INCOME GAP [ $ ]
0.39
INEQUALITY / GINI INDEX
291
TOTAL POPULATION
144
MALE POPULATION
147
FEMALE POPULATION
97.96
MALES / 100 FEMALES
102.08
FEMALES / 100 MALES
60.1
MEDIAN AGE
2.0
AVG FAMILY SIZE
2.0
AVG HOUSEHOLD SIZE
90
LABOR FORCE [ PEOPLE ]
31.8%
PERCENT IN LABOR FORCE
5.6%
UNEMPLOYMENT RATE
Income in St Marks
Income Overview in St Marks
| Characteristic | Number | Measure |
| Per Capita Income | 291 | $26,462 |
| Median Family Income | 117 | $0 |
| Mean Family Income | 117 | $53,903 |
| Median Household Income | 148 | $47,500 |
| Mean Household Income | 148 | $51,197 |
| Income Deficit | 117 | $0 |
| Wage / Income Gap (%) | 291 | 19.82% |
| Wage / Income Gap ($) | 291 | 80.18¢ per $1 |
| Gini / Inequality Index | 291 | 0.39 |
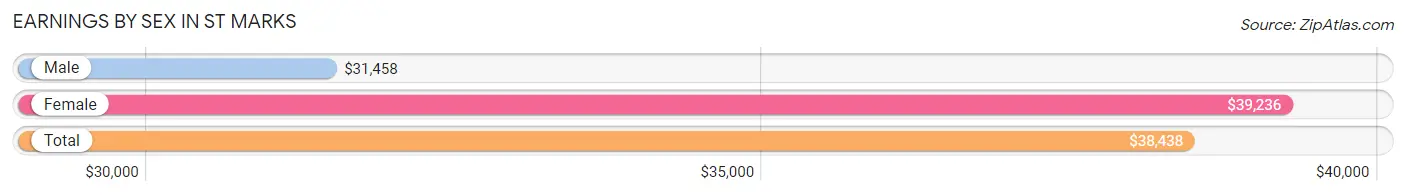
Earnings by Sex in St Marks
Average Earnings in St Marks are $38,438, $31,458 for men and $39,236 for women, a difference of 19.8%.
| Sex | Number | Average Earnings |
| Male | 42 (49.4%) | $31,458 |
| Female | 43 (50.6%) | $39,236 |
| Total | 85 (100.0%) | $38,438 |
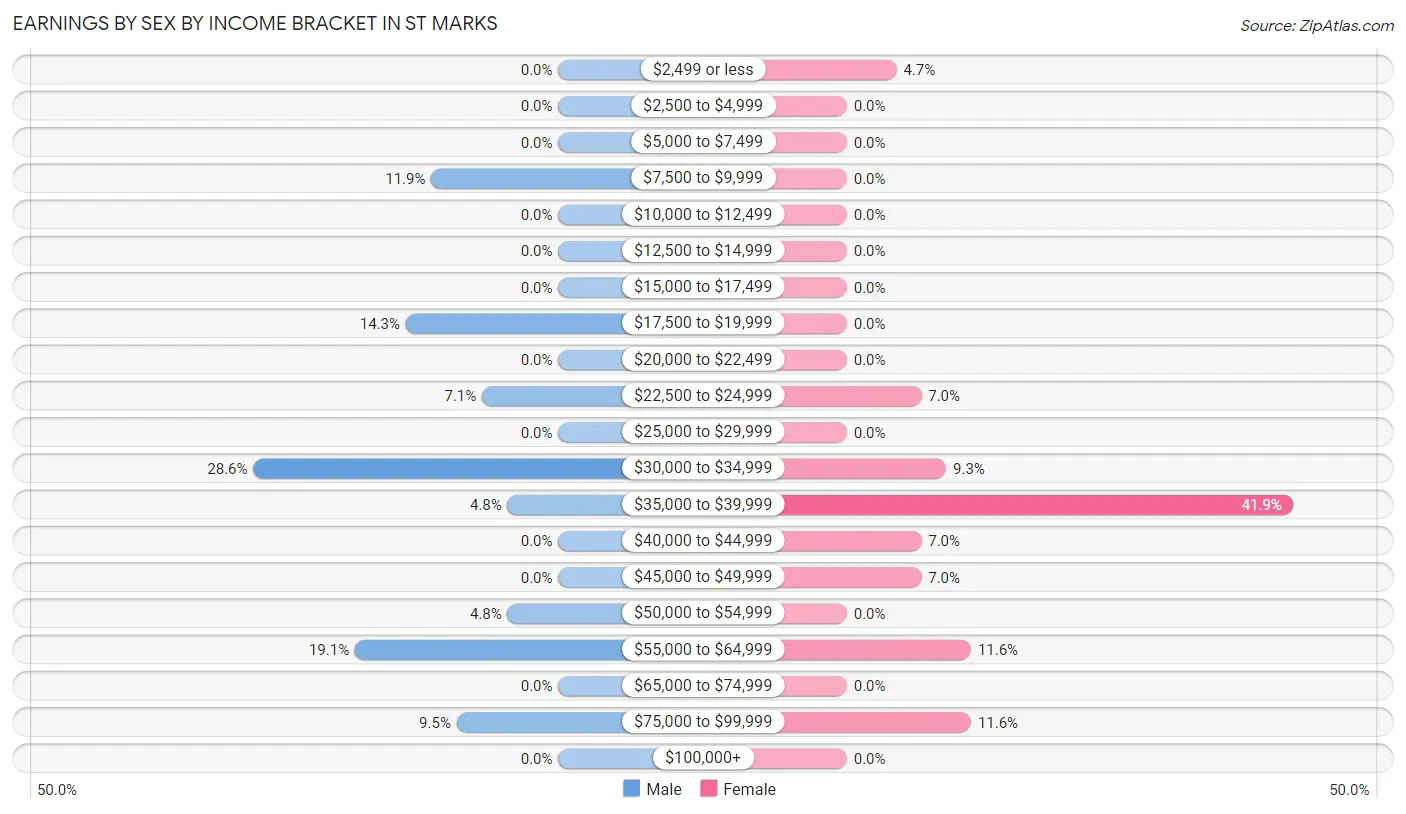
Earnings by Sex by Income Bracket in St Marks
The most common earnings brackets in St Marks are $30,000 to $34,999 for men (12 | 28.6%) and $35,000 to $39,999 for women (18 | 41.9%).
| Income | Male | Female |
| $2,499 or less | 0 (0.0%) | 2 (4.6%) |
| $2,500 to $4,999 | 0 (0.0%) | 0 (0.0%) |
| $5,000 to $7,499 | 0 (0.0%) | 0 (0.0%) |
| $7,500 to $9,999 | 5 (11.9%) | 0 (0.0%) |
| $10,000 to $12,499 | 0 (0.0%) | 0 (0.0%) |
| $12,500 to $14,999 | 0 (0.0%) | 0 (0.0%) |
| $15,000 to $17,499 | 0 (0.0%) | 0 (0.0%) |
| $17,500 to $19,999 | 6 (14.3%) | 0 (0.0%) |
| $20,000 to $22,499 | 0 (0.0%) | 0 (0.0%) |
| $22,500 to $24,999 | 3 (7.1%) | 3 (7.0%) |
| $25,000 to $29,999 | 0 (0.0%) | 0 (0.0%) |
| $30,000 to $34,999 | 12 (28.6%) | 4 (9.3%) |
| $35,000 to $39,999 | 2 (4.8%) | 18 (41.9%) |
| $40,000 to $44,999 | 0 (0.0%) | 3 (7.0%) |
| $45,000 to $49,999 | 0 (0.0%) | 3 (7.0%) |
| $50,000 to $54,999 | 2 (4.8%) | 0 (0.0%) |
| $55,000 to $64,999 | 8 (19.1%) | 5 (11.6%) |
| $65,000 to $74,999 | 0 (0.0%) | 0 (0.0%) |
| $75,000 to $99,999 | 4 (9.5%) | 5 (11.6%) |
| $100,000+ | 0 (0.0%) | 0 (0.0%) |
| Total | 42 (100.0%) | 43 (100.0%) |
Earnings by Sex by Educational Attainment in St Marks

| Educational Attainment | Male Income | Female Income |
| Less than High School | - | - |
| High School Diploma | - | - |
| College or Associate's Degree | - | - |
| Bachelor's Degree | - | - |
| Graduate Degree | - | - |
| Total | - | - |
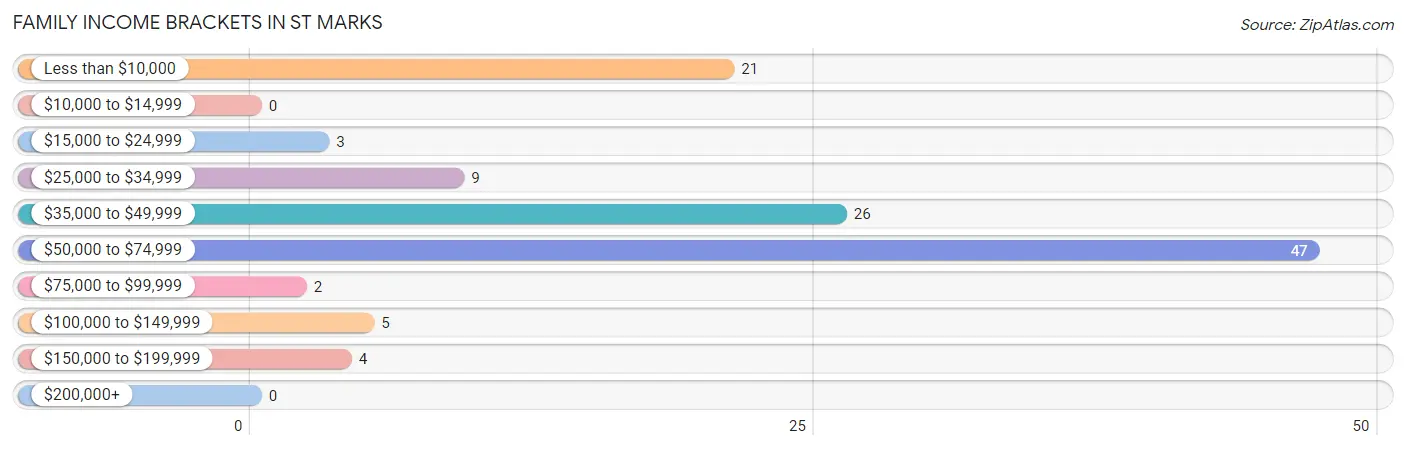
Family Income in St Marks
Family Income Brackets in St Marks
According to the St Marks family income data, there are 47 families falling into the $50,000 to $74,999 income range, which is the most common income bracket and makes up 40.2% of all families.
| Income Bracket | # Families | % Families |
| Less than $10,000 | 21 | 17.9% |
| $10,000 to $14,999 | 0 | 0.0% |
| $15,000 to $24,999 | 3 | 2.6% |
| $25,000 to $34,999 | 9 | 7.7% |
| $35,000 to $49,999 | 26 | 22.2% |
| $50,000 to $74,999 | 47 | 40.2% |
| $75,000 to $99,999 | 2 | 1.7% |
| $100,000 to $149,999 | 5 | 4.3% |
| $150,000 to $199,999 | 4 | 3.4% |
| $200,000+ | 0 | 0.0% |
Family Income by Famaliy Size in St Marks
| Income Bracket | # Families | Median Income |
| 2-Person Families | 109 (93.2%) | $0 |
| 3-Person Families | 3 (2.6%) | $0 |
| 4-Person Families | 5 (4.3%) | $0 |
| 5-Person Families | 0 (0.0%) | $0 |
| 6-Person Families | 0 (0.0%) | $0 |
| 7+ Person Families | 0 (0.0%) | $0 |
| Total | 117 (100.0%) | $0 |
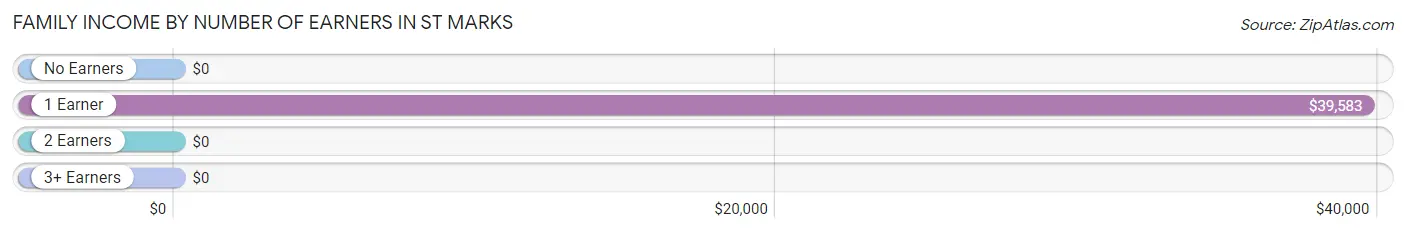
Family Income by Number of Earners in St Marks
| Number of Earners | # Families | Median Income |
| No Earners | 78 (66.7%) | $0 |
| 1 Earner | 20 (17.1%) | $39,583 |
| 2 Earners | 19 (16.2%) | $0 |
| 3+ Earners | 0 (0.0%) | $0 |
| Total | 117 (100.0%) | $0 |
Household Income in St Marks
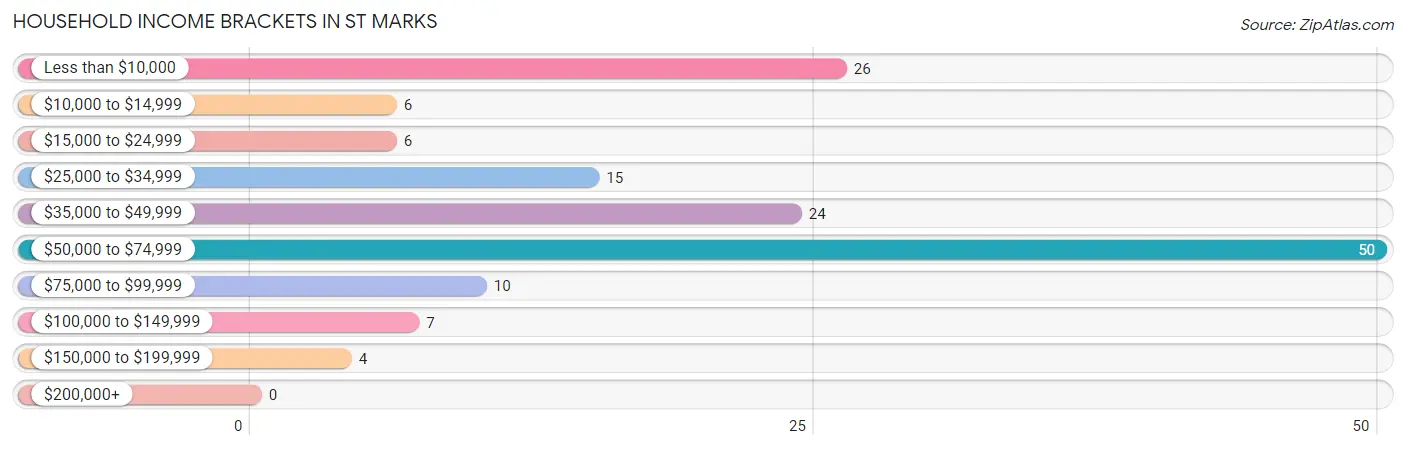
Household Income Brackets in St Marks
With 50 households falling in the category, the $50,000 to $74,999 income range is the most frequent in St Marks, accounting for 33.8% of all households.
| Income Bracket | # Households | % Households |
| Less than $10,000 | 26 | 17.6% |
| $10,000 to $14,999 | 6 | 4.1% |
| $15,000 to $24,999 | 6 | 4.1% |
| $25,000 to $34,999 | 15 | 10.1% |
| $35,000 to $49,999 | 24 | 16.2% |
| $50,000 to $74,999 | 50 | 33.8% |
| $75,000 to $99,999 | 10 | 6.8% |
| $100,000 to $149,999 | 7 | 4.7% |
| $150,000 to $199,999 | 4 | 2.7% |
| $200,000+ | 0 | 0.0% |
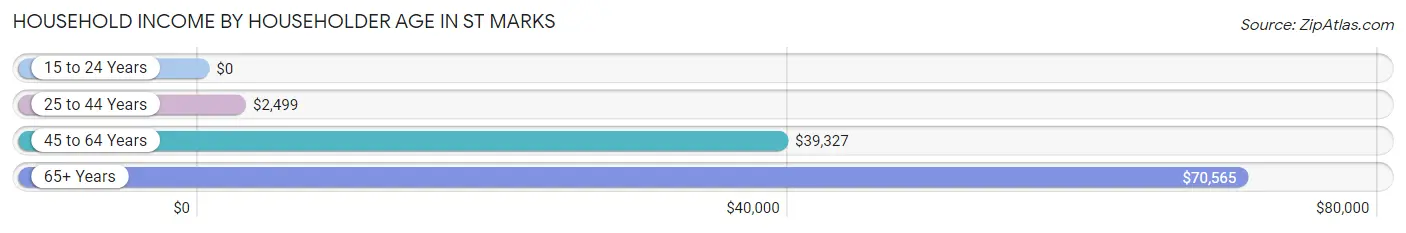
Household Income by Householder Age in St Marks
The median household income in St Marks is $47,500, with the highest median household income of $70,565 found in the 65+ years age bracket for the primary householder. A total of 73 households (49.3%) fall into this category.
| Income Bracket | # Households | Median Income |
| 15 to 24 Years | 0 (0.0%) | $0 |
| 25 to 44 Years | 26 (17.6%) | $2,499 |
| 45 to 64 Years | 49 (33.1%) | $39,327 |
| 65+ Years | 73 (49.3%) | $70,565 |
| Total | 148 (100.0%) | $47,500 |
Poverty in St Marks
Income Below Poverty by Sex and Age in St Marks
With 17.4% poverty level for males and 17.0% for females among the residents of St Marks, 25 to 34 year old males and under 5 year old females are the most vulnerable to poverty, with 19 males (57.6%) and 4 females (100.0%) in their respective age groups living below the poverty level.
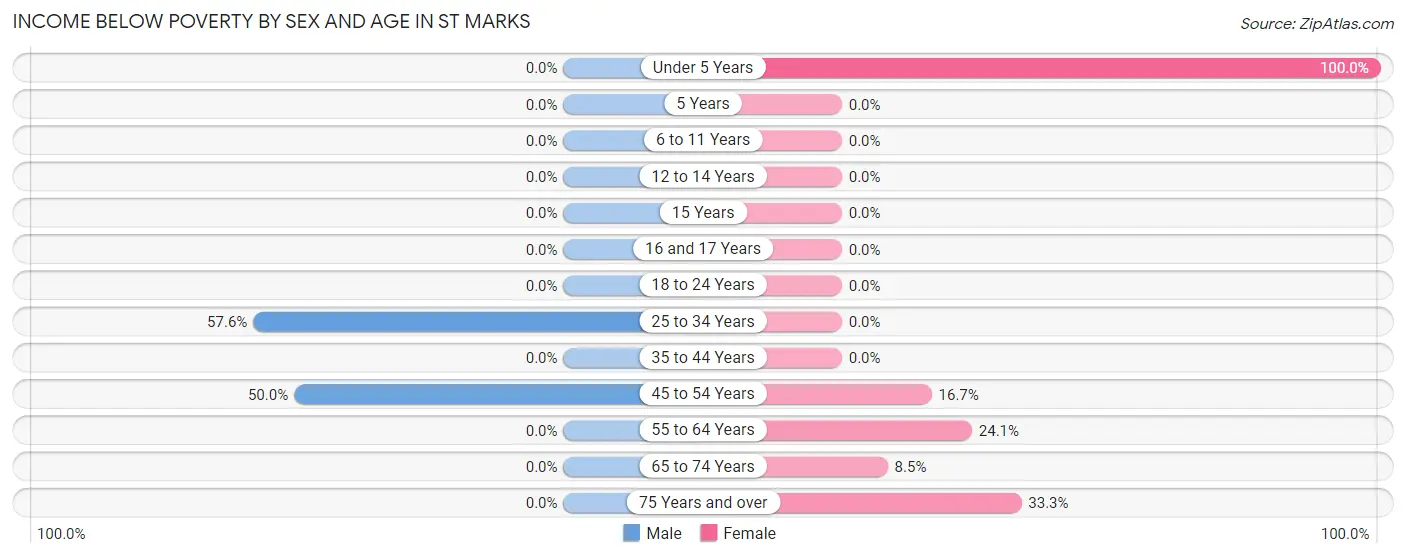
| Age Bracket | Male | Female |
| Under 5 Years | 0 (0.0%) | 4 (100.0%) |
| 5 Years | 0 (0.0%) | 0 (0.0%) |
| 6 to 11 Years | 0 (0.0%) | 0 (0.0%) |
| 12 to 14 Years | 0 (0.0%) | 0 (0.0%) |
| 15 Years | 0 (0.0%) | 0 (0.0%) |
| 16 and 17 Years | 0 (0.0%) | 0 (0.0%) |
| 18 to 24 Years | 0 (0.0%) | 0 (0.0%) |
| 25 to 34 Years | 19 (57.6%) | 0 (0.0%) |
| 35 to 44 Years | 0 (0.0%) | 0 (0.0%) |
| 45 to 54 Years | 6 (50.0%) | 5 (16.7%) |
| 55 to 64 Years | 0 (0.0%) | 7 (24.1%) |
| 65 to 74 Years | 0 (0.0%) | 4 (8.5%) |
| 75 Years and over | 0 (0.0%) | 5 (33.3%) |
| Total | 25 (17.4%) | 25 (17.0%) |
Income Above Poverty by Sex and Age in St Marks
According to the poverty statistics in St Marks, males aged 6 to 11 years and females aged 25 to 34 years are the age groups that are most secure financially, with 100.0% of males and 100.0% of females in these age groups living above the poverty line.
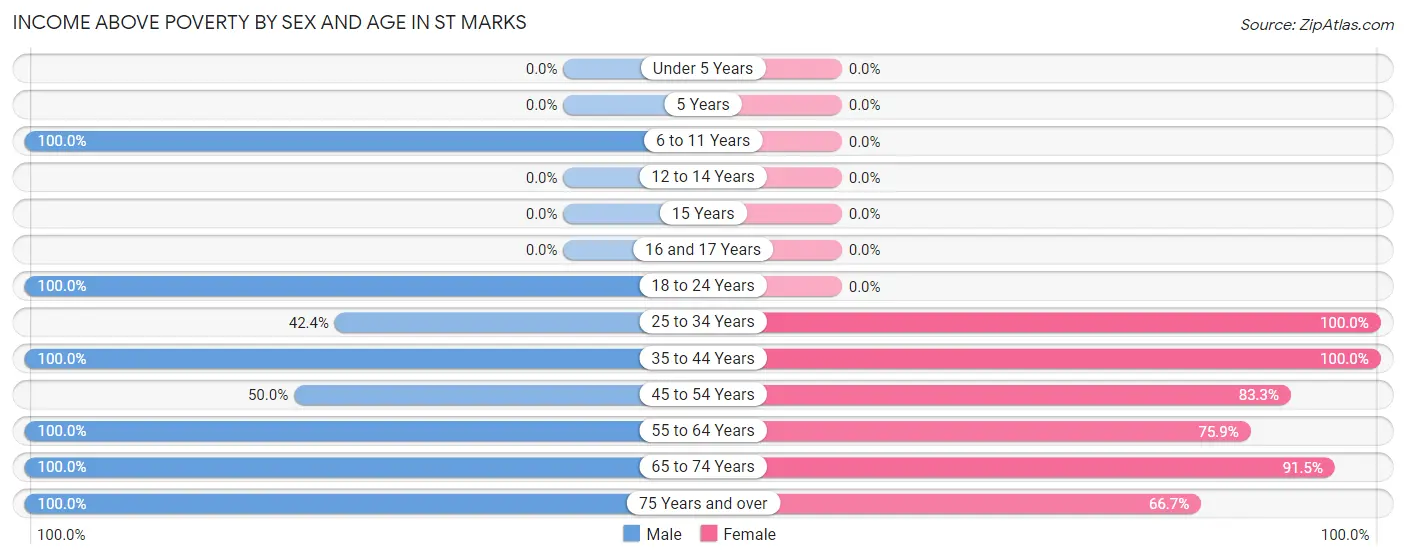
| Age Bracket | Male | Female |
| Under 5 Years | 0 (0.0%) | 0 (0.0%) |
| 5 Years | 0 (0.0%) | 0 (0.0%) |
| 6 to 11 Years | 4 (100.0%) | 0 (0.0%) |
| 12 to 14 Years | 0 (0.0%) | 0 (0.0%) |
| 15 Years | 0 (0.0%) | 0 (0.0%) |
| 16 and 17 Years | 0 (0.0%) | 0 (0.0%) |
| 18 to 24 Years | 20 (100.0%) | 0 (0.0%) |
| 25 to 34 Years | 14 (42.4%) | 2 (100.0%) |
| 35 to 44 Years | 5 (100.0%) | 20 (100.0%) |
| 45 to 54 Years | 6 (50.0%) | 25 (83.3%) |
| 55 to 64 Years | 7 (100.0%) | 22 (75.9%) |
| 65 to 74 Years | 19 (100.0%) | 43 (91.5%) |
| 75 Years and over | 44 (100.0%) | 10 (66.7%) |
| Total | 119 (82.6%) | 122 (83.0%) |
Income Below Poverty Among Married-Couple Families in St Marks
The poverty statistics for married-couple families in St Marks show that 6.2% or 5 of the total 80 families live below the poverty line. Families with no children have the highest poverty rate of 6.7%, comprising of 5 families. On the other hand, families with 1 or 2 children have the lowest poverty rate of 0.0%, which includes 0 families.
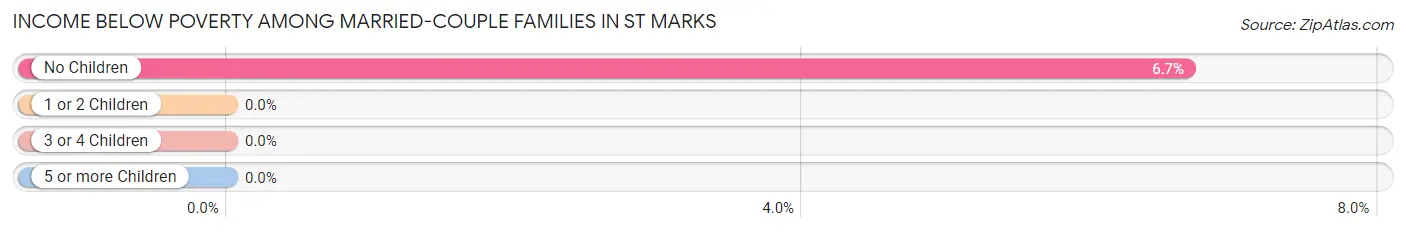
| Children | Above Poverty | Below Poverty |
| No Children | 70 (93.3%) | 5 (6.7%) |
| 1 or 2 Children | 5 (100.0%) | 0 (0.0%) |
| 3 or 4 Children | 0 (0.0%) | 0 (0.0%) |
| 5 or more Children | 0 (0.0%) | 0 (0.0%) |
| Total | 75 (93.8%) | 5 (6.2%) |
Income Below Poverty Among Single-Parent Households in St Marks
According to the poverty data in St Marks, 82.4% or 14 single-father households and 10.0% or 2 single-mother households are living below the poverty line. Among single-father households, those with 1 or 2 children have the highest poverty rate, with 14 households (100.0%) experiencing poverty. Likewise, among single-mother households, those with no children have the highest poverty rate, with 2 households (10.0%) falling below the poverty line.
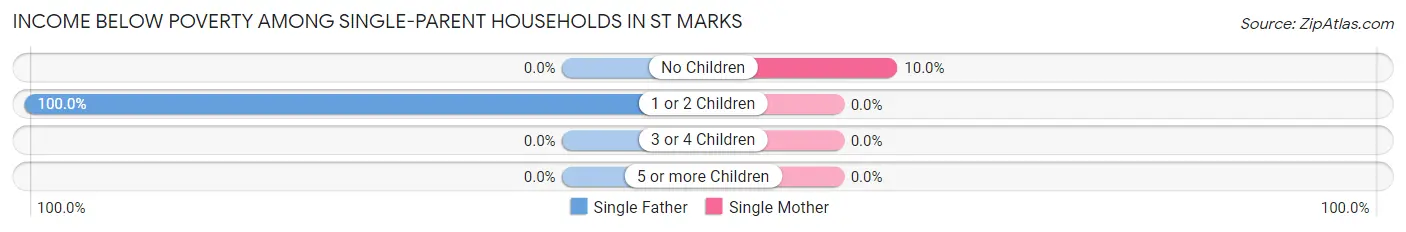
| Children | Single Father | Single Mother |
| No Children | 0 (0.0%) | 2 (10.0%) |
| 1 or 2 Children | 14 (100.0%) | 0 (0.0%) |
| 3 or 4 Children | 0 (0.0%) | 0 (0.0%) |
| 5 or more Children | 0 (0.0%) | 0 (0.0%) |
| Total | 14 (82.4%) | 2 (10.0%) |
Income Below Poverty Among Married-Couple vs Single-Parent Households in St Marks
The poverty data for St Marks shows that 5 of the married-couple family households (6.2%) and 16 of the single-parent households (43.2%) are living below the poverty level. Within the married-couple family households, those with no children have the highest poverty rate, with 5 households (6.7%) falling below the poverty line. Among the single-parent households, those with 1 or 2 children have the highest poverty rate, with 14 household (100.0%) living below poverty.
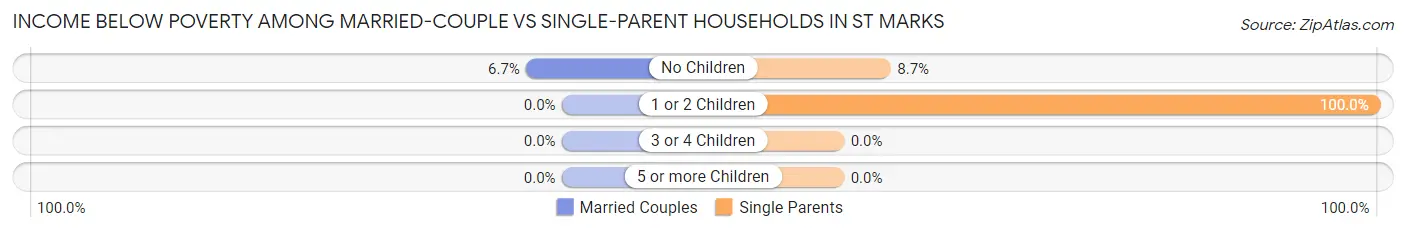
| Children | Married-Couple Families | Single-Parent Households |
| No Children | 5 (6.7%) | 2 (8.7%) |
| 1 or 2 Children | 0 (0.0%) | 14 (100.0%) |
| 3 or 4 Children | 0 (0.0%) | 0 (0.0%) |
| 5 or more Children | 0 (0.0%) | 0 (0.0%) |
| Total | 5 (6.2%) | 16 (43.2%) |
Race in St Marks
The most populous races in St Marks are White / Caucasian (285 | 97.9%), and Two or more Races (6 | 2.1%).
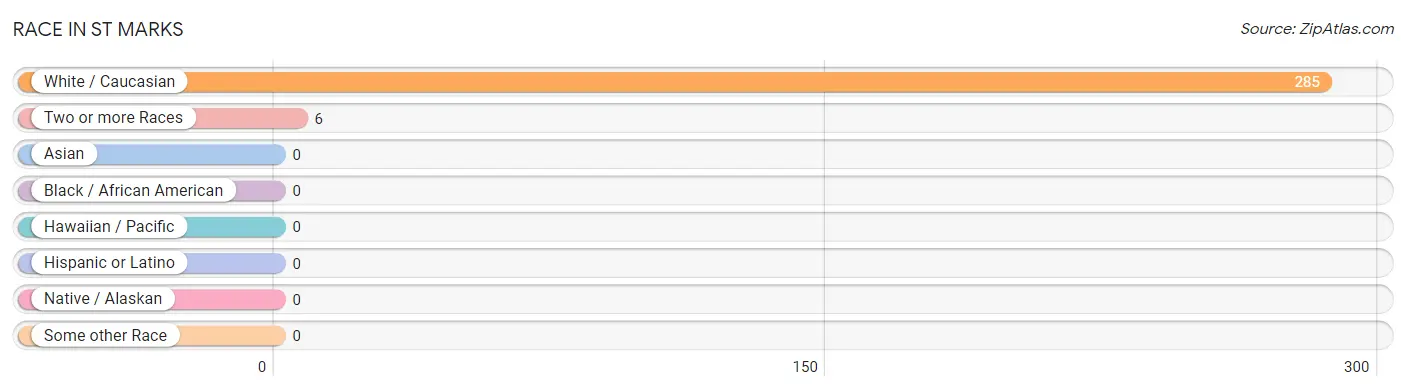
| Race | # Population | % Population |
| Asian | 0 | 0.0% |
| Black / African American | 0 | 0.0% |
| Hawaiian / Pacific | 0 | 0.0% |
| Hispanic or Latino | 0 | 0.0% |
| Native / Alaskan | 0 | 0.0% |
| White / Caucasian | 285 | 97.9% |
| Two or more Races | 6 | 2.1% |
| Some other Race | 0 | 0.0% |
| Total | 291 | 100.0% |
Ancestry in St Marks
The most populous ancestries reported in St Marks are American (33 | 11.3%), Irish (19 | 6.5%), European (15 | 5.1%), Polish (8 | 2.8%), and Dutch (7 | 2.4%), together accounting for 28.2% of all St Marks residents.
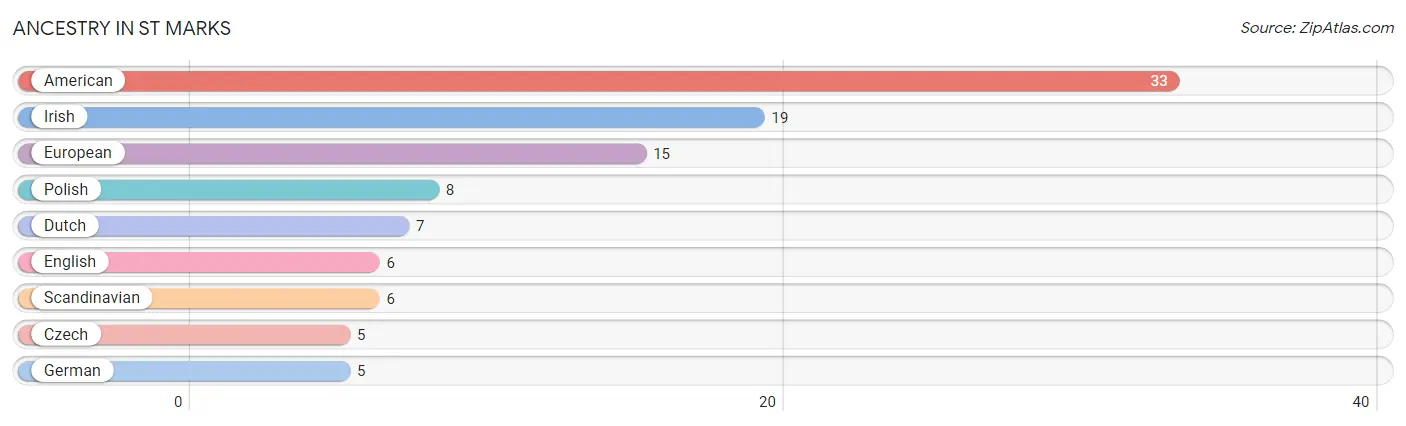
| Ancestry | # Population | % Population |
| American | 33 | 11.3% |
| Czech | 5 | 1.7% |
| Dutch | 7 | 2.4% |
| English | 6 | 2.1% |
| European | 15 | 5.1% |
| German | 5 | 1.7% |
| Irish | 19 | 6.5% |
| Polish | 8 | 2.8% |
| Scandinavian | 6 | 2.1% | View All 9 Rows |
Immigrants in St Marks

| Immigration Origin | # Population | % Population | View All 0 Rows |
Sex and Age in St Marks
Sex and Age in St Marks
The most populous age groups in St Marks are 75 to 79 Years (44 | 30.6%) for men and 70 to 74 Years (38 | 25.9%) for women.
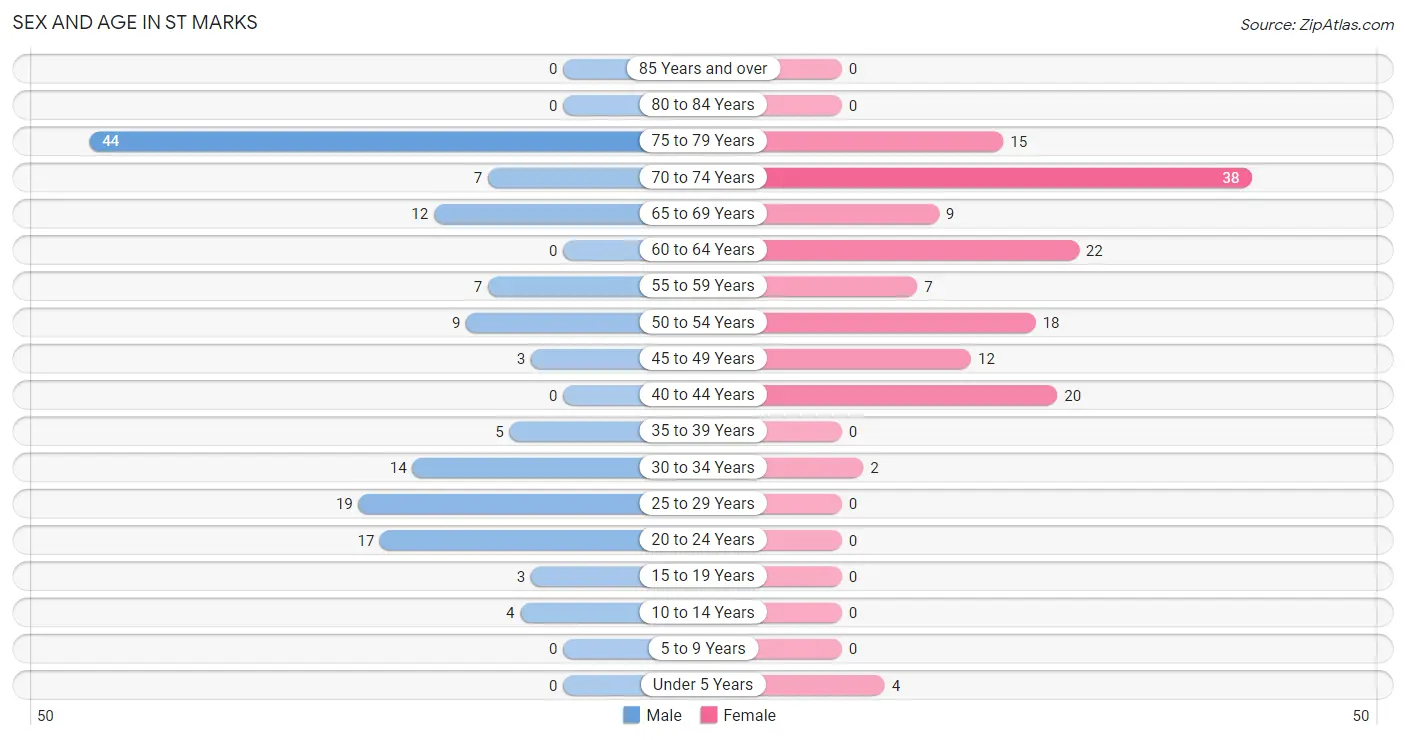
| Age Bracket | Male | Female |
| Under 5 Years | 0 (0.0%) | 4 (2.7%) |
| 5 to 9 Years | 0 (0.0%) | 0 (0.0%) |
| 10 to 14 Years | 4 (2.8%) | 0 (0.0%) |
| 15 to 19 Years | 3 (2.1%) | 0 (0.0%) |
| 20 to 24 Years | 17 (11.8%) | 0 (0.0%) |
| 25 to 29 Years | 19 (13.2%) | 0 (0.0%) |
| 30 to 34 Years | 14 (9.7%) | 2 (1.4%) |
| 35 to 39 Years | 5 (3.5%) | 0 (0.0%) |
| 40 to 44 Years | 0 (0.0%) | 20 (13.6%) |
| 45 to 49 Years | 3 (2.1%) | 12 (8.2%) |
| 50 to 54 Years | 9 (6.2%) | 18 (12.2%) |
| 55 to 59 Years | 7 (4.9%) | 7 (4.8%) |
| 60 to 64 Years | 0 (0.0%) | 22 (15.0%) |
| 65 to 69 Years | 12 (8.3%) | 9 (6.1%) |
| 70 to 74 Years | 7 (4.9%) | 38 (25.9%) |
| 75 to 79 Years | 44 (30.6%) | 15 (10.2%) |
| 80 to 84 Years | 0 (0.0%) | 0 (0.0%) |
| 85 Years and over | 0 (0.0%) | 0 (0.0%) |
| Total | 144 (100.0%) | 147 (100.0%) |
Families and Households in St Marks
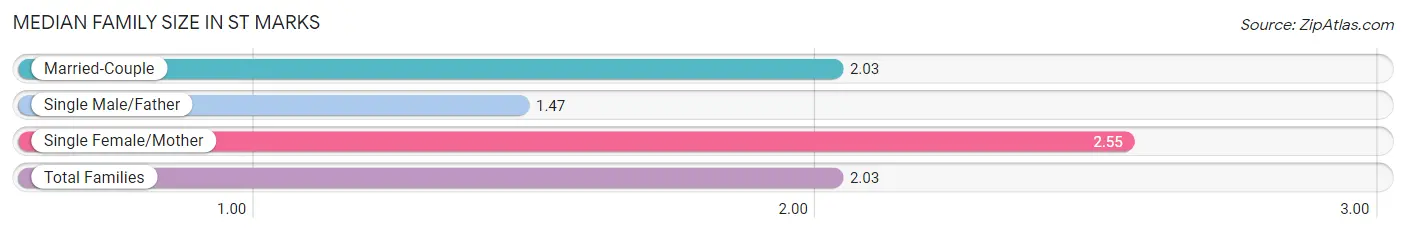
Median Family Size in St Marks
The median family size in St Marks is 2.03 persons per family, with single female/mother families (20 | 17.1%) accounting for the largest median family size of 2.55 persons per family. On the other hand, single male/father families (17 | 14.5%) represent the smallest median family size with 1.47 persons per family.
| Family Type | # Families | Family Size |
| Married-Couple | 80 (68.4%) | 2.03 |
| Single Male/Father | 17 (14.5%) | 1.47 |
| Single Female/Mother | 20 (17.1%) | 2.55 |
| Total Families | 117 (100.0%) | 2.03 |
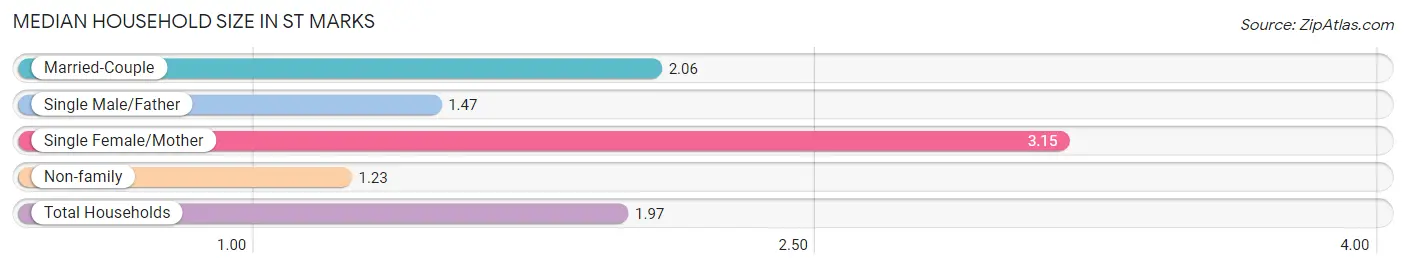
Median Household Size in St Marks
The median household size in St Marks is 1.97 persons per household, with single female/mother households (20 | 13.5%) accounting for the largest median household size of 3.15 persons per household. non-family households (31 | 20.9%) represent the smallest median household size with 1.23 persons per household.
| Household Type | # Households | Household Size |
| Married-Couple | 80 (54.0%) | 2.06 |
| Single Male/Father | 17 (11.5%) | 1.47 |
| Single Female/Mother | 20 (13.5%) | 3.15 |
| Non-family | 31 (20.9%) | 1.23 |
| Total Households | 148 (100.0%) | 1.97 |
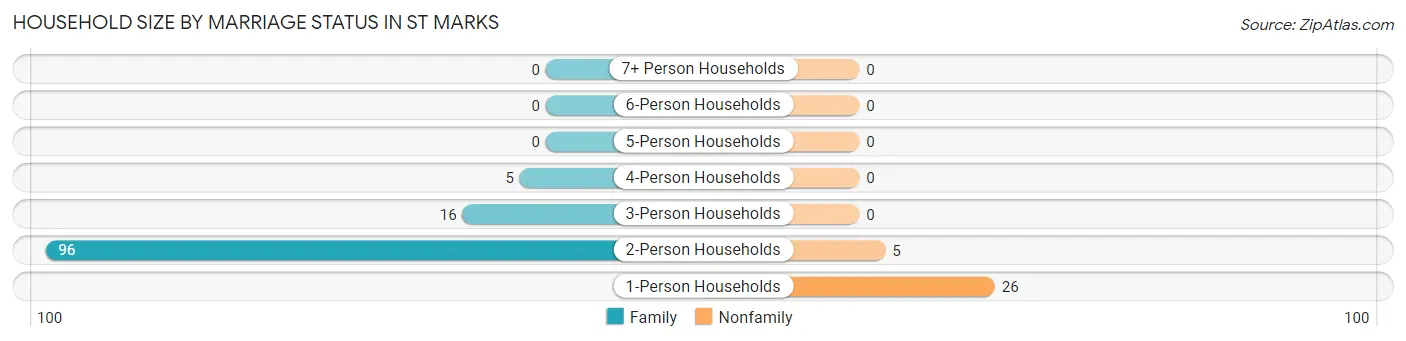
Household Size by Marriage Status in St Marks
Out of a total of 148 households in St Marks, 117 (79.0%) are family households, while 31 (20.9%) are nonfamily households. The most numerous type of family households are 2-person households, comprising 96, and the most common type of nonfamily households are 1-person households, comprising 26.
| Household Size | Family Households | Nonfamily Households |
| 1-Person Households | - | 26 (17.6%) |
| 2-Person Households | 96 (64.9%) | 5 (3.4%) |
| 3-Person Households | 16 (10.8%) | 0 (0.0%) |
| 4-Person Households | 5 (3.4%) | 0 (0.0%) |
| 5-Person Households | 0 (0.0%) | 0 (0.0%) |
| 6-Person Households | 0 (0.0%) | 0 (0.0%) |
| 7+ Person Households | 0 (0.0%) | 0 (0.0%) |
| Total | 117 (79.0%) | 31 (20.9%) |
Female Fertility in St Marks
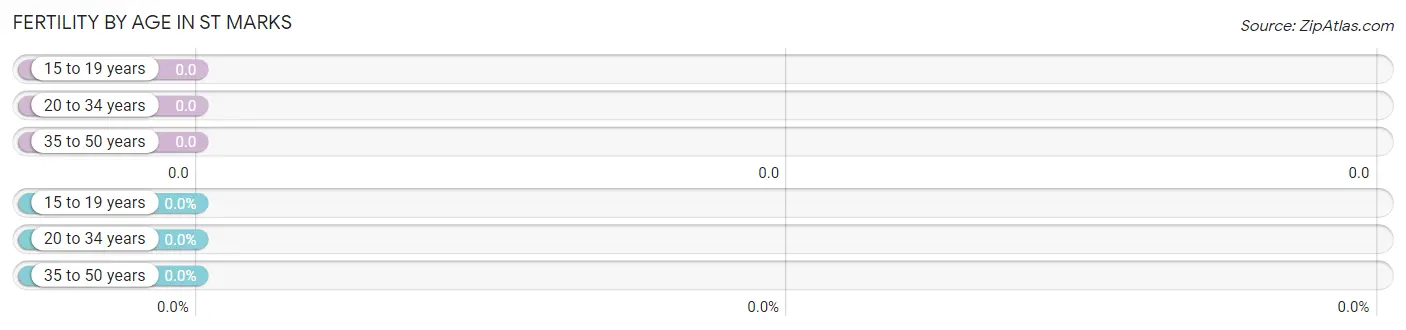
Fertility by Age in St Marks
| Age Bracket | Women with Births | Births / 1,000 Women |
| 15 to 19 years | 0 (0.0%) | 0.0 |
| 20 to 34 years | 0 (0.0%) | 0.0 |
| 35 to 50 years | 0 (0.0%) | 0.0 |
| Total | 0 (0.0%) | 0.0 |
Fertility by Age by Marriage Status in St Marks
| Age Bracket | Married | Unmarried |
| 15 to 19 years | 0 (0.0%) | 0 (0.0%) |
| 20 to 34 years | 0 (0.0%) | 0 (0.0%) |
| 35 to 50 years | 0 (0.0%) | 0 (0.0%) |
| Total | 0 (0.0%) | 0 (0.0%) |
Fertility by Education in St Marks
| Educational Attainment | Women with Births | Births / 1,000 Women |
| Less than High School | 0 (0.0%) | 0.0 |
| High School Diploma | 0 (0.0%) | 0.0 |
| College or Associate's Degree | 0 (0.0%) | 0.0 |
| Bachelor's Degree | 0 (0.0%) | 0.0 |
| Graduate Degree | 0 (0.0%) | 0.0 |
| Total | 0 (0.0%) | 0.0 |
Fertility by Education by Marriage Status in St Marks
| Educational Attainment | Married | Unmarried |
| Less than High School | 0 (0.0%) | 0 (0.0%) |
| High School Diploma | 0 (0.0%) | 0 (0.0%) |
| College or Associate's Degree | 0 (0.0%) | 0 (0.0%) |
| Bachelor's Degree | 0 (0.0%) | 0 (0.0%) |
| Graduate Degree | 0 (0.0%) | 0 (0.0%) |
| Total | 0 (0.0%) | 0 (0.0%) |
Employment Characteristics in St Marks
Employment by Class of Employer in St Marks
Among the 85 employed individuals in St Marks, private company employees (66 | 77.6%), self-employed (incorporated) (10 | 11.8%), and self-employed (not incorporated) (6 | 7.1%) make up the most common classes of employment.
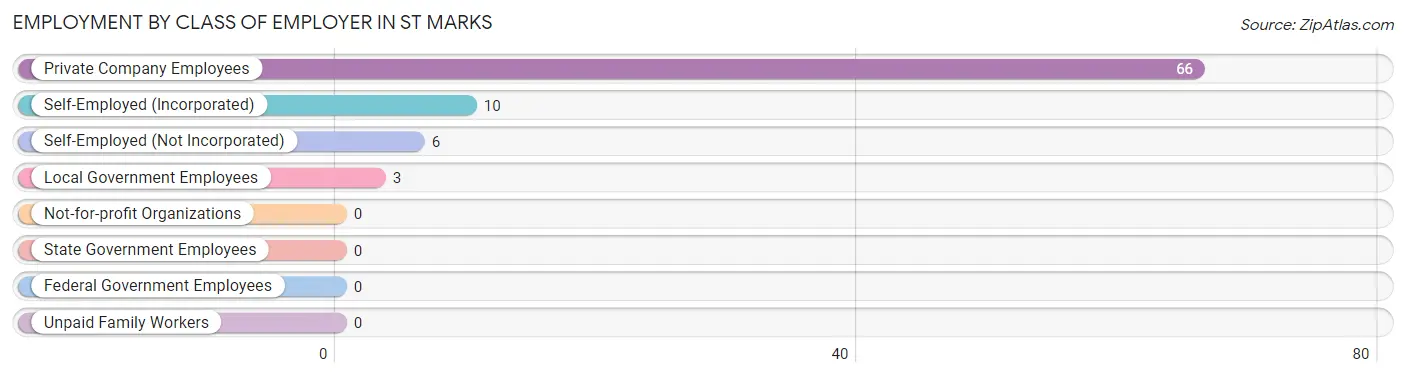
| Employer Class | # Employees | % Employees |
| Private Company Employees | 66 | 77.6% |
| Self-Employed (Incorporated) | 10 | 11.8% |
| Self-Employed (Not Incorporated) | 6 | 7.1% |
| Not-for-profit Organizations | 0 | 0.0% |
| Local Government Employees | 3 | 3.5% |
| State Government Employees | 0 | 0.0% |
| Federal Government Employees | 0 | 0.0% |
| Unpaid Family Workers | 0 | 0.0% |
| Total | 85 | 100.0% |
Employment Status by Age in St Marks
According to the labor force statistics for St Marks, out of the total population over 16 years of age (283), 31.8% or 90 individuals are in the labor force, with 5.6% or 5 of them unemployed. The age group with the highest labor force participation rate is 30 to 34 years, with 87.5% or 14 individuals in the labor force. Within the labor force, the 35 to 44 years age range has the highest percentage of unemployed individuals, with 50.0% or 5 of them being unemployed.
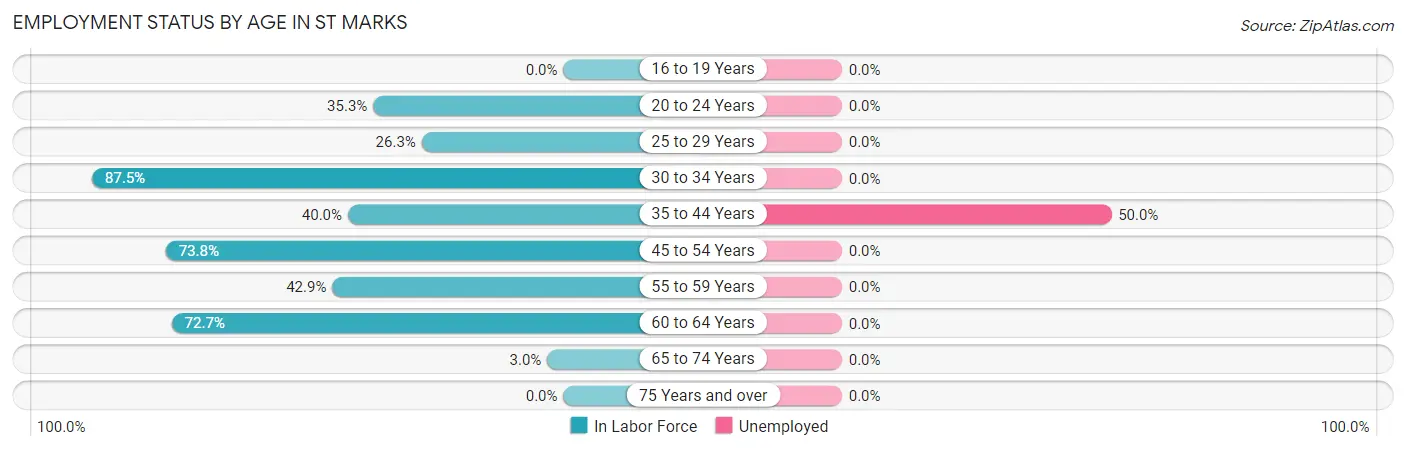
| Age Bracket | In Labor Force | Unemployed |
| 16 to 19 Years | 0 (0.0%) | 0 (0.0%) |
| 20 to 24 Years | 6 (35.3%) | 0 (0.0%) |
| 25 to 29 Years | 5 (26.3%) | 0 (0.0%) |
| 30 to 34 Years | 14 (87.5%) | 0 (0.0%) |
| 35 to 44 Years | 10 (40.0%) | 5 (50.0%) |
| 45 to 54 Years | 31 (73.8%) | 0 (0.0%) |
| 55 to 59 Years | 6 (42.9%) | 0 (0.0%) |
| 60 to 64 Years | 16 (72.7%) | 0 (0.0%) |
| 65 to 74 Years | 2 (3.0%) | 0 (0.0%) |
| 75 Years and over | 0 (0.0%) | 0 (0.0%) |
| Total | 90 (31.8%) | 5 (5.6%) |
Employment Status by Educational Attainment in St Marks
According to labor force statistics for St Marks, 59.4% of individuals (82) out of the total population between 25 and 64 years of age (138) are in the labor force, with 6.1% or 5 of them being unemployed. The group with the highest labor force participation rate are those with the educational attainment of college / associate degree, with 85.0% or 34 individuals in the labor force. Within the labor force, individuals with college / associate degree education have the highest percentage of unemployment, with 14.7% or 5 of them being unemployed.
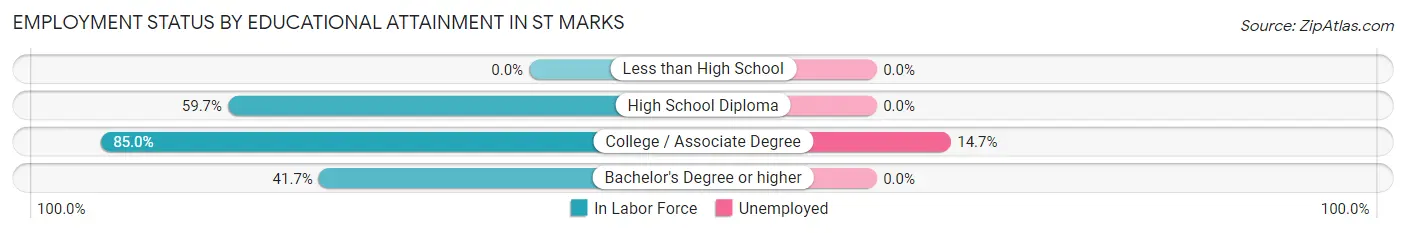
| Educational Attainment | In Labor Force | Unemployed |
| Less than High School | 0 (0.0%) | 0 (0.0%) |
| High School Diploma | 43 (59.7%) | 0 (0.0%) |
| College / Associate Degree | 34 (85.0%) | 6 (14.7%) |
| Bachelor's Degree or higher | 5 (41.7%) | 0 (0.0%) |
| Total | 82 (59.4%) | 8 (6.1%) |
Employment Occupations by Sex in St Marks
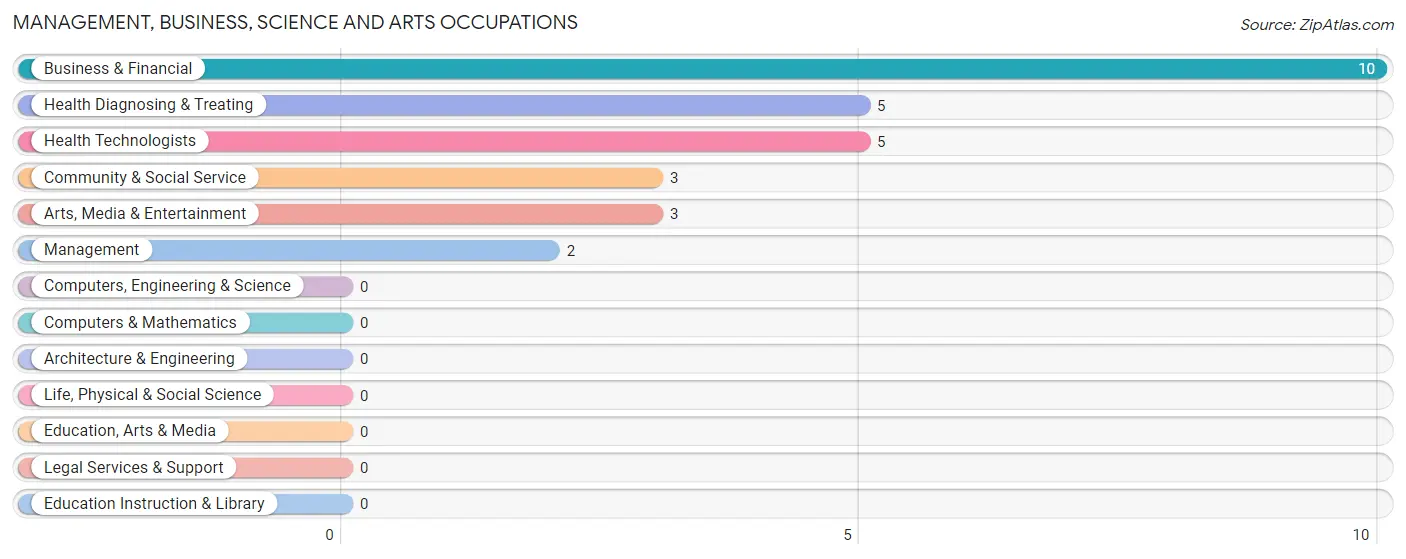
Management, Business, Science and Arts Occupations
The most common Management, Business, Science and Arts occupations in St Marks are Business & Financial (10 | 11.8%), Health Diagnosing & Treating (5 | 5.9%), Health Technologists (5 | 5.9%), Community & Social Service (3 | 3.5%), and Arts, Media & Entertainment (3 | 3.5%).
Management, Business, Science and Arts Occupations by Sex
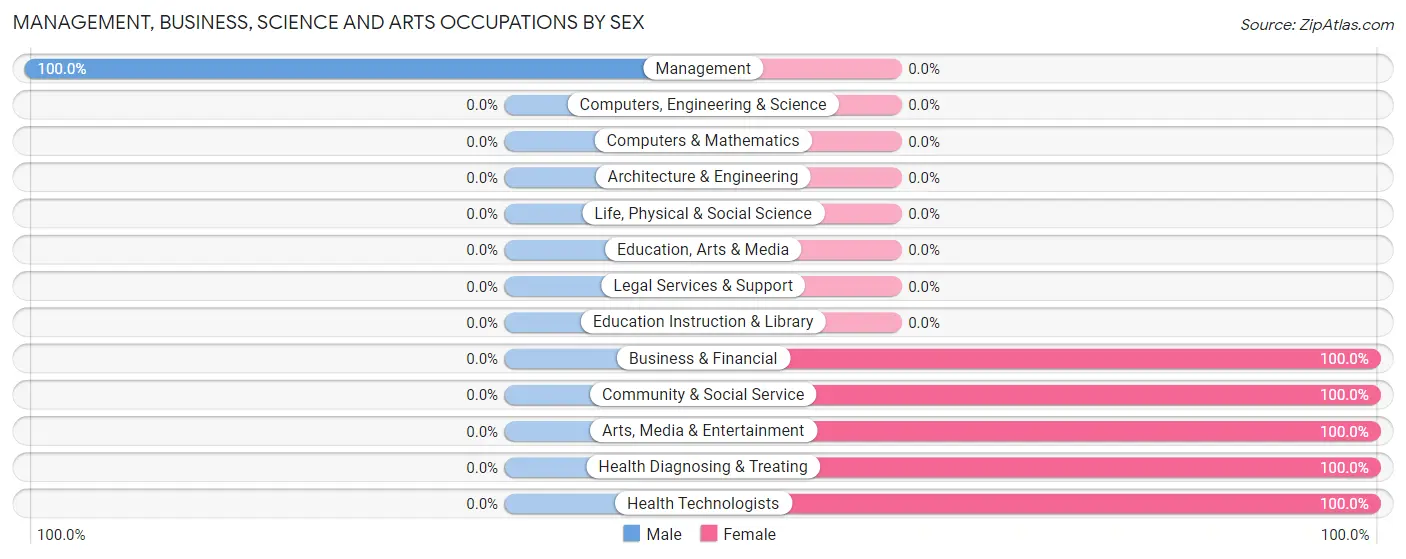
| Occupation | Male | Female |
| Management | 2 (100.0%) | 0 (0.0%) |
| Business & Financial | 0 (0.0%) | 10 (100.0%) |
| Computers, Engineering & Science | 0 (0.0%) | 0 (0.0%) |
| Computers & Mathematics | 0 (0.0%) | 0 (0.0%) |
| Architecture & Engineering | 0 (0.0%) | 0 (0.0%) |
| Life, Physical & Social Science | 0 (0.0%) | 0 (0.0%) |
| Community & Social Service | 0 (0.0%) | 3 (100.0%) |
| Education, Arts & Media | 0 (0.0%) | 0 (0.0%) |
| Legal Services & Support | 0 (0.0%) | 0 (0.0%) |
| Education Instruction & Library | 0 (0.0%) | 0 (0.0%) |
| Arts, Media & Entertainment | 0 (0.0%) | 3 (100.0%) |
| Health Diagnosing & Treating | 0 (0.0%) | 5 (100.0%) |
| Health Technologists | 0 (0.0%) | 5 (100.0%) |
| Total (Category) | 2 (10.0%) | 18 (90.0%) |
| Total (Overall) | 42 (49.4%) | 43 (50.6%) |
Services Occupations
The most common Services occupations in St Marks are Food Preparation & Serving (8 | 9.4%), Personal Care & Service (4 | 4.7%), and Cleaning & Maintenance (3 | 3.5%).
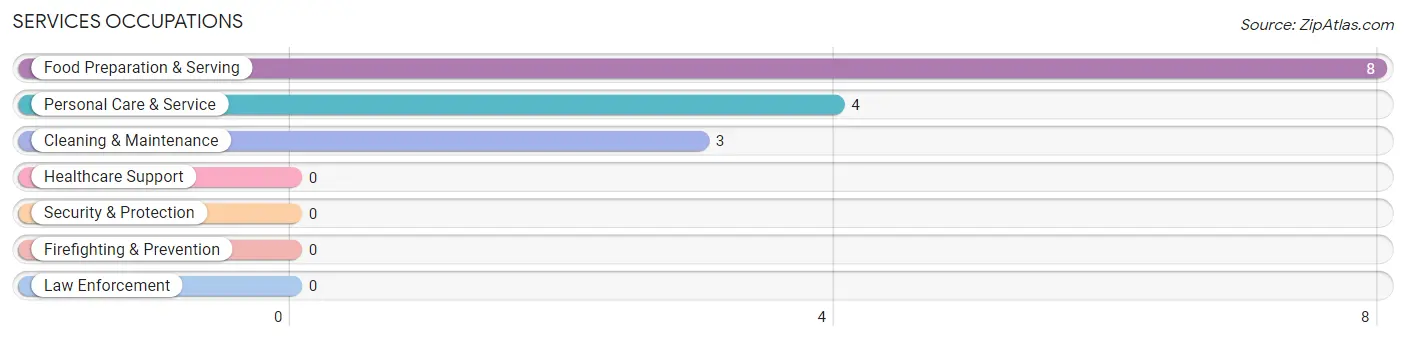
Services Occupations by Sex
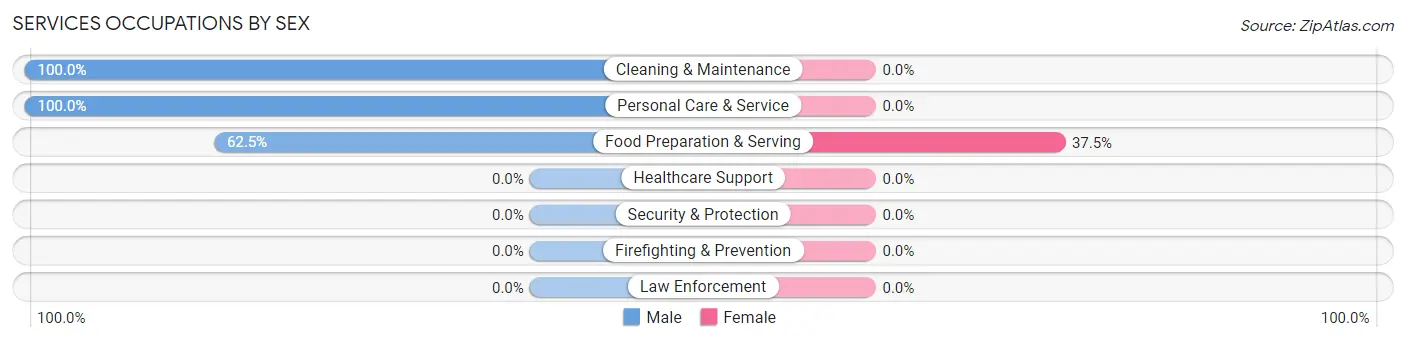
| Occupation | Male | Female |
| Healthcare Support | 0 (0.0%) | 0 (0.0%) |
| Security & Protection | 0 (0.0%) | 0 (0.0%) |
| Firefighting & Prevention | 0 (0.0%) | 0 (0.0%) |
| Law Enforcement | 0 (0.0%) | 0 (0.0%) |
| Food Preparation & Serving | 5 (62.5%) | 3 (37.5%) |
| Cleaning & Maintenance | 3 (100.0%) | 0 (0.0%) |
| Personal Care & Service | 4 (100.0%) | 0 (0.0%) |
| Total (Category) | 12 (80.0%) | 3 (20.0%) |
| Total (Overall) | 42 (49.4%) | 43 (50.6%) |
Sales and Office Occupations
The most common Sales and Office occupations in St Marks are Sales & Related (27 | 31.8%), and Office & Administration (3 | 3.5%).
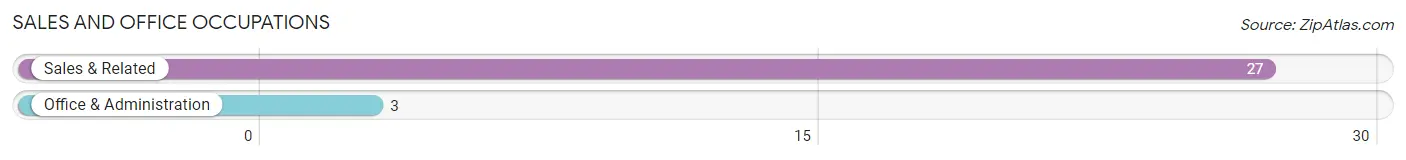
Sales and Office Occupations by Sex
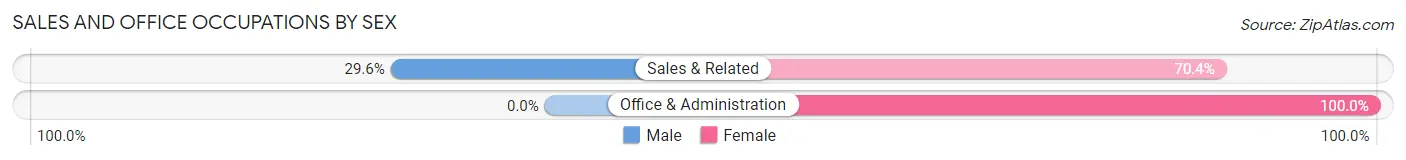
| Occupation | Male | Female |
| Sales & Related | 8 (29.6%) | 19 (70.4%) |
| Office & Administration | 0 (0.0%) | 3 (100.0%) |
| Total (Category) | 8 (26.7%) | 22 (73.3%) |
| Total (Overall) | 42 (49.4%) | 43 (50.6%) |
Natural Resources, Construction and Maintenance Occupations
The most common Natural Resources, Construction and Maintenance occupations in St Marks are , and Construction & Extraction (12 | 14.1%).
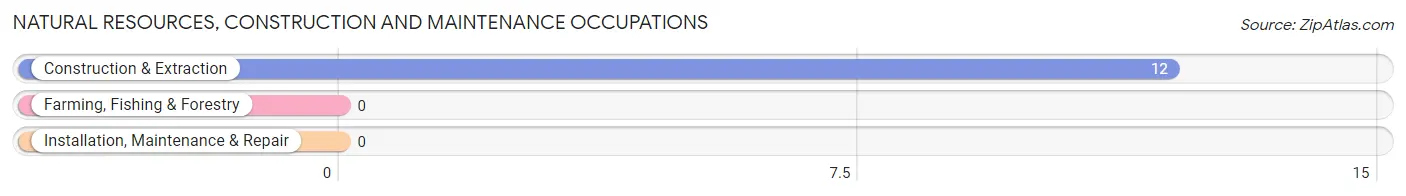
Natural Resources, Construction and Maintenance Occupations by Sex
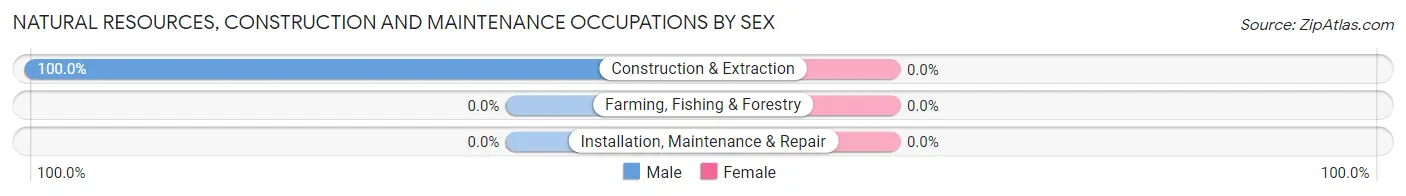
| Occupation | Male | Female |
| Farming, Fishing & Forestry | 0 (0.0%) | 0 (0.0%) |
| Construction & Extraction | 12 (100.0%) | 0 (0.0%) |
| Installation, Maintenance & Repair | 0 (0.0%) | 0 (0.0%) |
| Total (Category) | 12 (100.0%) | 0 (0.0%) |
| Total (Overall) | 42 (49.4%) | 43 (50.6%) |
Production, Transportation and Moving Occupations
The most common Production, Transportation and Moving occupations in St Marks are Material Moving (6 | 7.1%), and Transportation (2 | 2.4%).
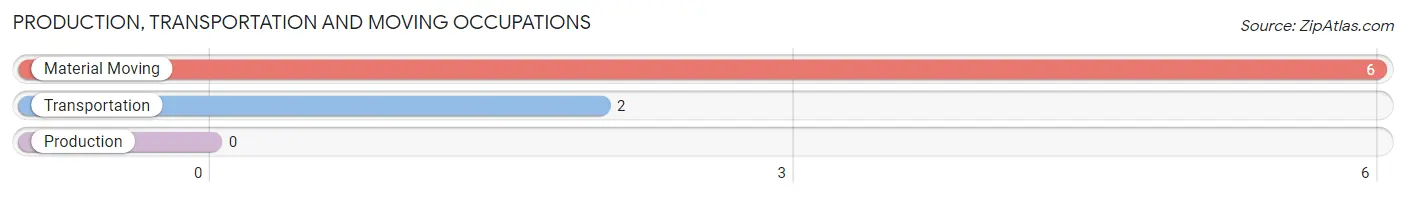
Production, Transportation and Moving Occupations by Sex
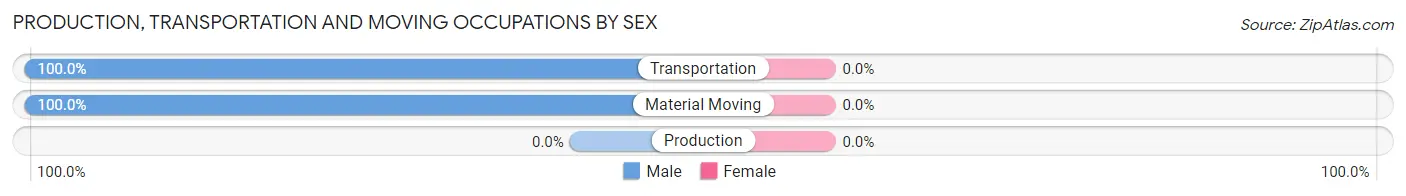
| Occupation | Male | Female |
| Production | 0 (0.0%) | 0 (0.0%) |
| Transportation | 2 (100.0%) | 0 (0.0%) |
| Material Moving | 6 (100.0%) | 0 (0.0%) |
| Total (Category) | 8 (100.0%) | 0 (0.0%) |
| Total (Overall) | 42 (49.4%) | 43 (50.6%) |
Employment Industries by Sex in St Marks
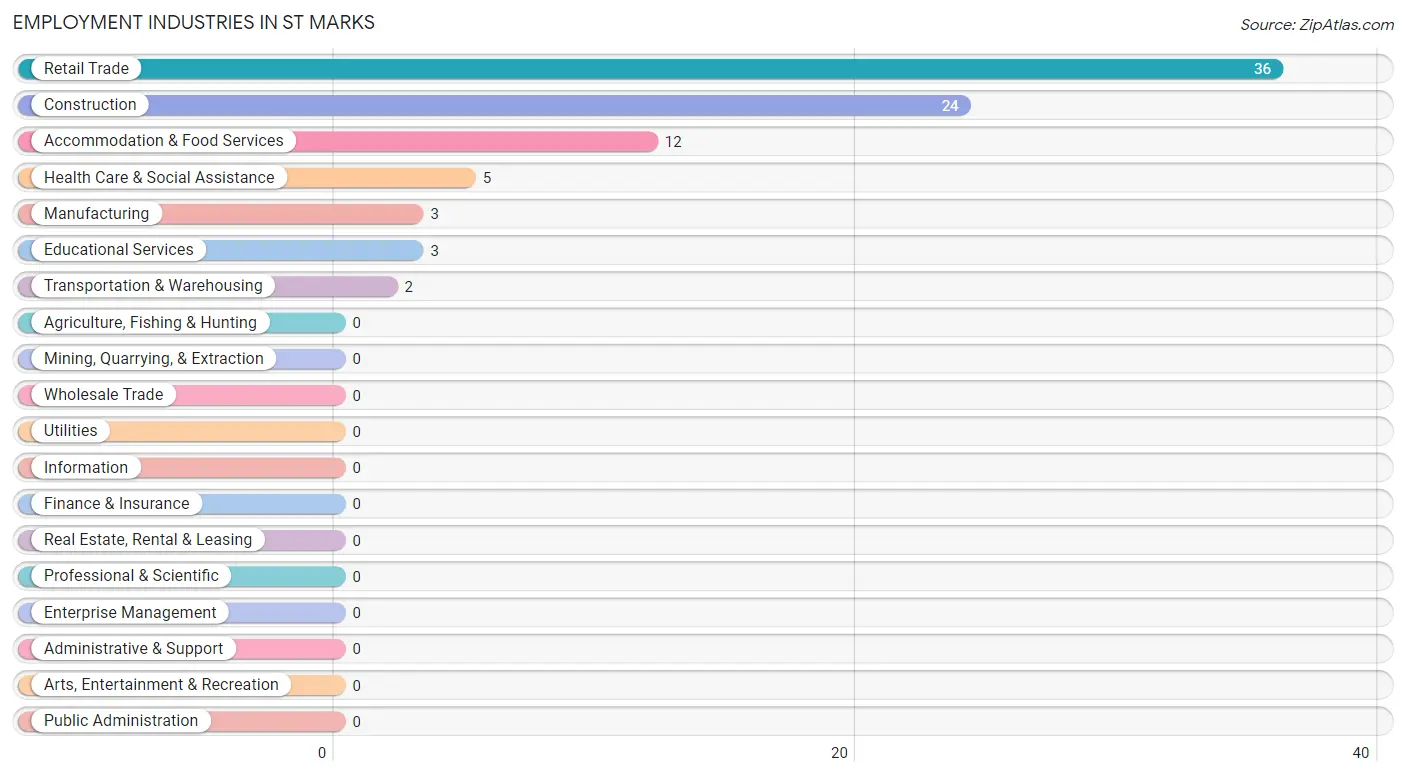
Employment Industries in St Marks
The major employment industries in St Marks include Retail Trade (36 | 42.3%), Construction (24 | 28.2%), Accommodation & Food Services (12 | 14.1%), Health Care & Social Assistance (5 | 5.9%), and Manufacturing (3 | 3.5%).
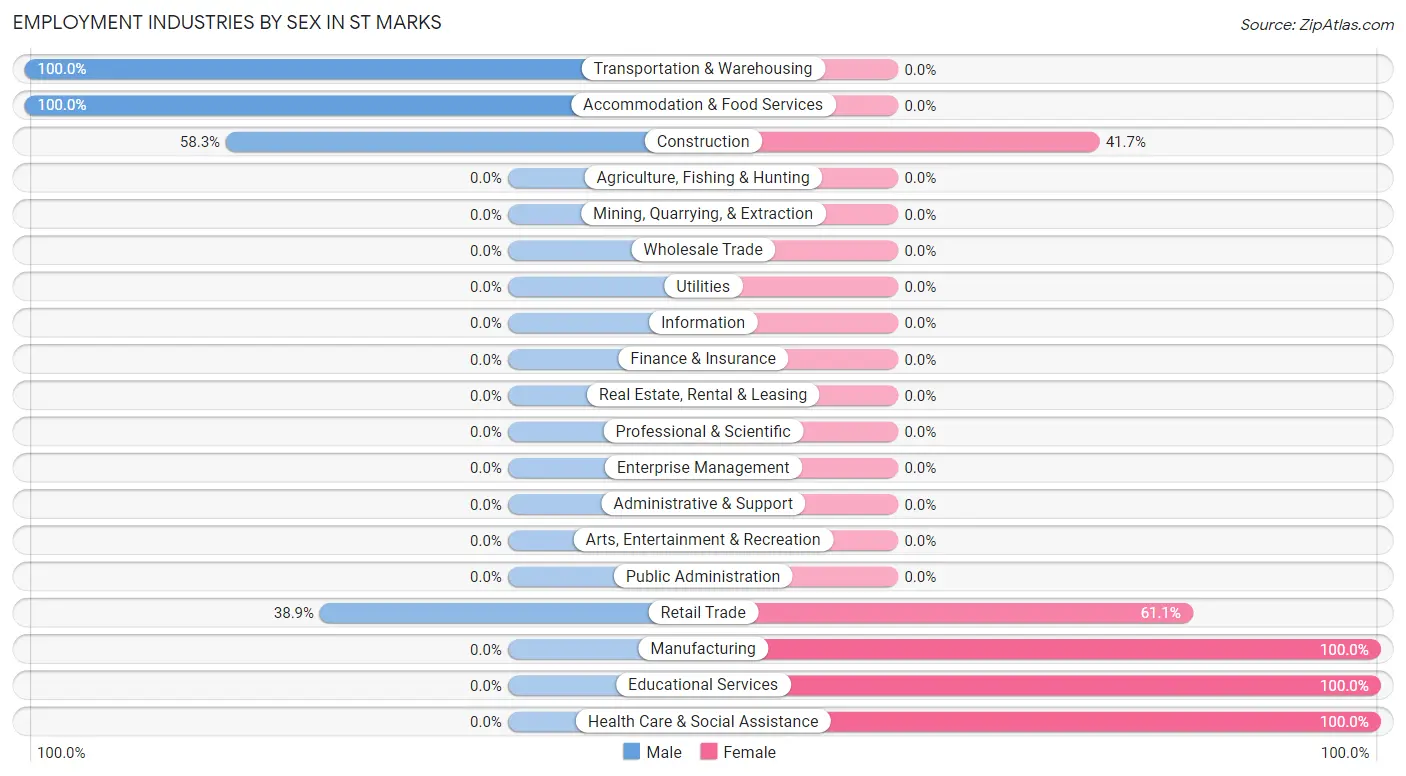
Employment Industries by Sex in St Marks
The St Marks industries that see more men than women are Transportation & Warehousing (100.0%), Accommodation & Food Services (100.0%), and Construction (58.3%), whereas the industries that tend to have a higher number of women are Manufacturing (100.0%), Educational Services (100.0%), and Health Care & Social Assistance (100.0%).
| Industry | Male | Female |
| Agriculture, Fishing & Hunting | 0 (0.0%) | 0 (0.0%) |
| Mining, Quarrying, & Extraction | 0 (0.0%) | 0 (0.0%) |
| Construction | 14 (58.3%) | 10 (41.7%) |
| Manufacturing | 0 (0.0%) | 3 (100.0%) |
| Wholesale Trade | 0 (0.0%) | 0 (0.0%) |
| Retail Trade | 14 (38.9%) | 22 (61.1%) |
| Transportation & Warehousing | 2 (100.0%) | 0 (0.0%) |
| Utilities | 0 (0.0%) | 0 (0.0%) |
| Information | 0 (0.0%) | 0 (0.0%) |
| Finance & Insurance | 0 (0.0%) | 0 (0.0%) |
| Real Estate, Rental & Leasing | 0 (0.0%) | 0 (0.0%) |
| Professional & Scientific | 0 (0.0%) | 0 (0.0%) |
| Enterprise Management | 0 (0.0%) | 0 (0.0%) |
| Administrative & Support | 0 (0.0%) | 0 (0.0%) |
| Educational Services | 0 (0.0%) | 3 (100.0%) |
| Health Care & Social Assistance | 0 (0.0%) | 5 (100.0%) |
| Arts, Entertainment & Recreation | 0 (0.0%) | 0 (0.0%) |
| Accommodation & Food Services | 12 (100.0%) | 0 (0.0%) |
| Public Administration | 0 (0.0%) | 0 (0.0%) |
| Total | 42 (49.4%) | 43 (50.6%) |
Education in St Marks
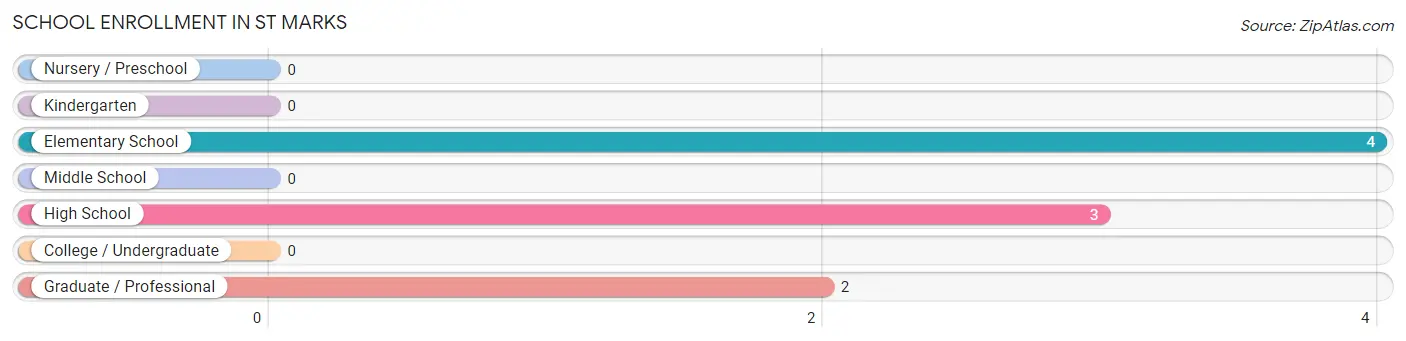
School Enrollment in St Marks
The most common levels of schooling among the 9 students in St Marks are elementary school (4 | 44.4%), high school (3 | 33.3%), and graduate / professional (2 | 22.2%).
| School Level | # Students | % Students |
| Nursery / Preschool | 0 | 0.0% |
| Kindergarten | 0 | 0.0% |
| Elementary School | 4 | 44.4% |
| Middle School | 0 | 0.0% |
| High School | 3 | 33.3% |
| College / Undergraduate | 0 | 0.0% |
| Graduate / Professional | 2 | 22.2% |
| Total | 9 | 100.0% |
School Enrollment by Age by Funding Source in St Marks
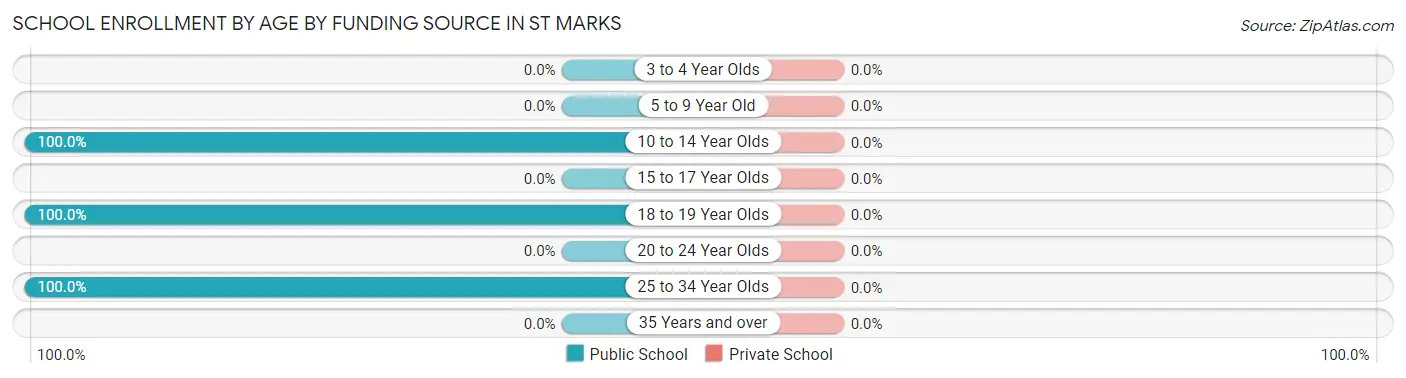
| Age Bracket | Public School | Private School |
| 3 to 4 Year Olds | 0 (0.0%) | 0 (0.0%) |
| 5 to 9 Year Old | 0 (0.0%) | 0 (0.0%) |
| 10 to 14 Year Olds | 4 (100.0%) | 0 (0.0%) |
| 15 to 17 Year Olds | 0 (0.0%) | 0 (0.0%) |
| 18 to 19 Year Olds | 3 (100.0%) | 0 (0.0%) |
| 20 to 24 Year Olds | 0 (0.0%) | 0 (0.0%) |
| 25 to 34 Year Olds | 2 (100.0%) | 0 (0.0%) |
| 35 Years and over | 0 (0.0%) | 0 (0.0%) |
| Total | 9 (100.0%) | 0 (0.0%) |
Educational Attainment by Field of Study in St Marks
Engineering (5 | 41.7%), business (5 | 41.7%), and arts & humanities (2 | 16.7%) are the most common fields of study among 12 individuals in St Marks who have obtained a bachelor's degree or higher.
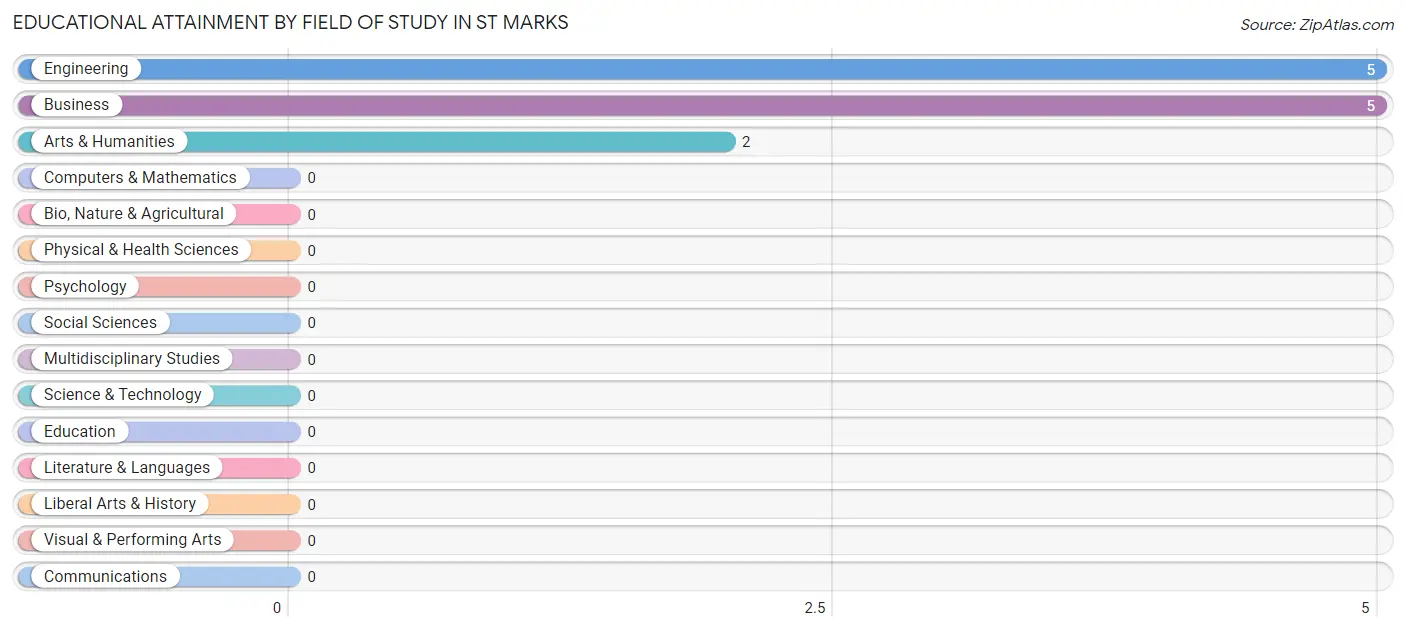
| Field of Study | # Graduates | % Graduates |
| Computers & Mathematics | 0 | 0.0% |
| Bio, Nature & Agricultural | 0 | 0.0% |
| Physical & Health Sciences | 0 | 0.0% |
| Psychology | 0 | 0.0% |
| Social Sciences | 0 | 0.0% |
| Engineering | 5 | 41.7% |
| Multidisciplinary Studies | 0 | 0.0% |
| Science & Technology | 0 | 0.0% |
| Business | 5 | 41.7% |
| Education | 0 | 0.0% |
| Literature & Languages | 0 | 0.0% |
| Liberal Arts & History | 0 | 0.0% |
| Visual & Performing Arts | 0 | 0.0% |
| Communications | 0 | 0.0% |
| Arts & Humanities | 2 | 16.7% |
| Total | 12 | 100.0% |
Transportation & Commute in St Marks
Vehicle Availability by Sex in St Marks
The most prevalent vehicle ownership categories in St Marks are males with 2 vehicles (21, accounting for 50.0%) and females with 2 vehicles (27, making up 48.8%).
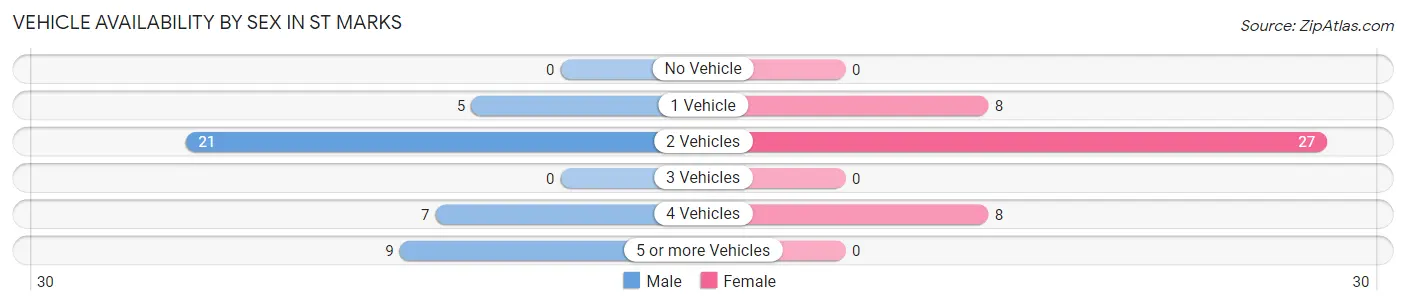
| Vehicles Available | Male | Female |
| No Vehicle | 0 (0.0%) | 0 (0.0%) |
| 1 Vehicle | 5 (11.9%) | 8 (18.6%) |
| 2 Vehicles | 21 (50.0%) | 27 (62.8%) |
| 3 Vehicles | 0 (0.0%) | 0 (0.0%) |
| 4 Vehicles | 7 (16.7%) | 8 (18.6%) |
| 5 or more Vehicles | 9 (21.4%) | 0 (0.0%) |
| Total | 42 (100.0%) | 43 (100.0%) |
Commute Time in St Marks
The most frequently occuring commute durations in St Marks are 45 to 59 minutes (25 commuters, 30.9%), 30 to 34 minutes (14 commuters, 17.3%), and 20 to 24 minutes (10 commuters, 12.3%).
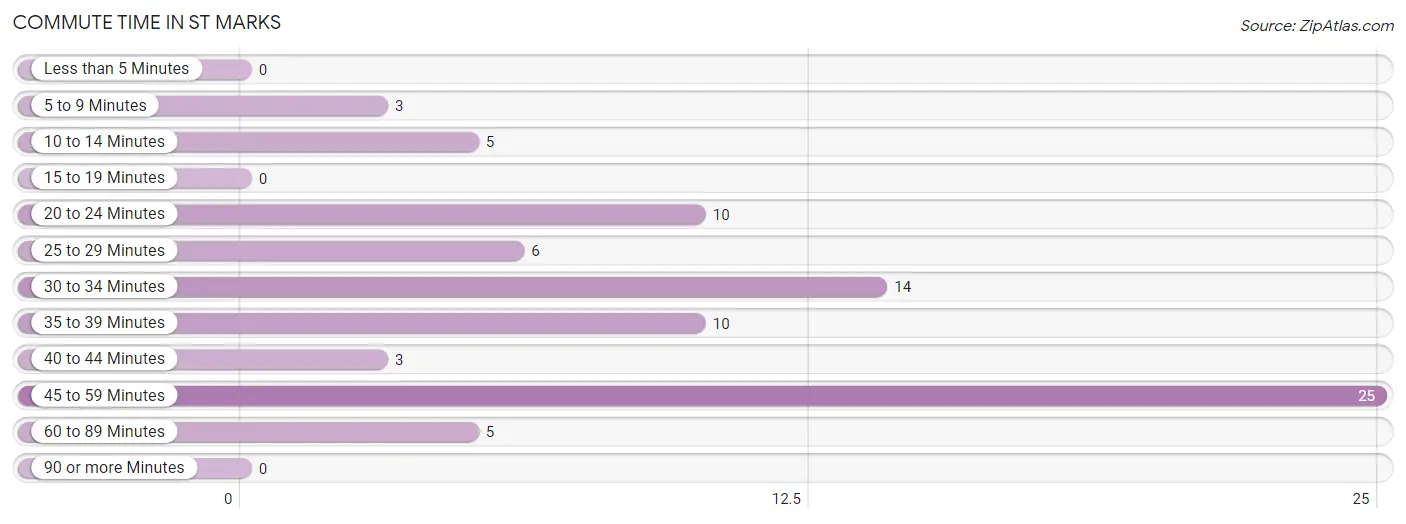
| Commute Time | # Commuters | % Commuters |
| Less than 5 Minutes | 0 | 0.0% |
| 5 to 9 Minutes | 3 | 3.7% |
| 10 to 14 Minutes | 5 | 6.2% |
| 15 to 19 Minutes | 0 | 0.0% |
| 20 to 24 Minutes | 10 | 12.3% |
| 25 to 29 Minutes | 6 | 7.4% |
| 30 to 34 Minutes | 14 | 17.3% |
| 35 to 39 Minutes | 10 | 12.3% |
| 40 to 44 Minutes | 3 | 3.7% |
| 45 to 59 Minutes | 25 | 30.9% |
| 60 to 89 Minutes | 5 | 6.2% |
| 90 or more Minutes | 0 | 0.0% |
Commute Time by Sex in St Marks
The most common commute times in St Marks are 45 to 59 minutes (12 commuters, 31.6%) for males and 45 to 59 minutes (13 commuters, 30.2%) for females.
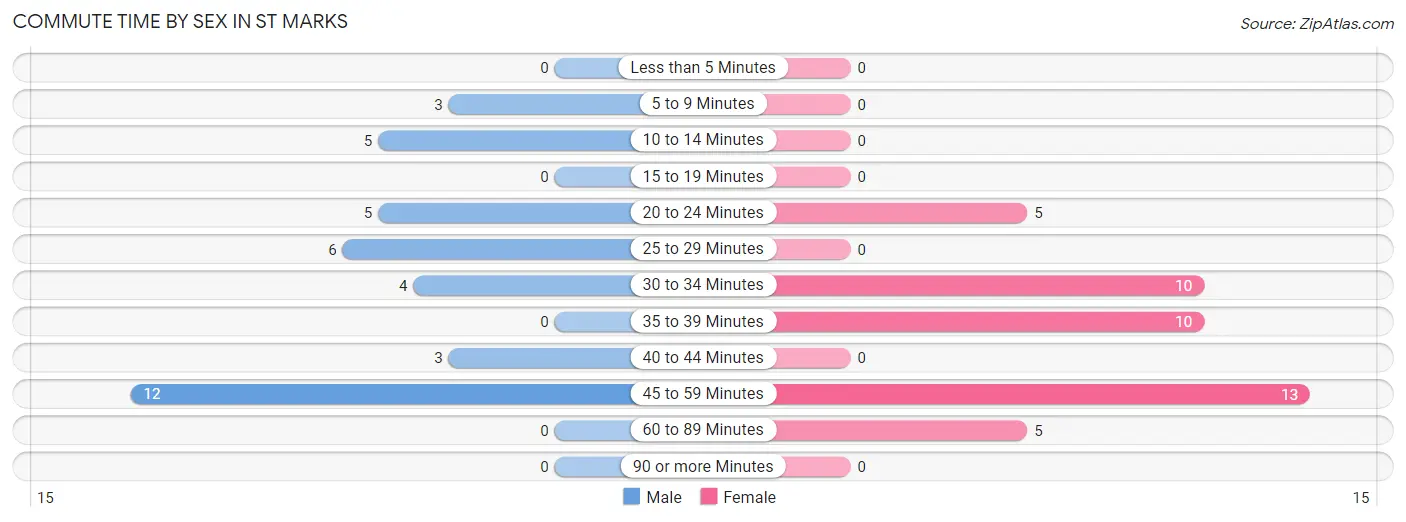
| Commute Time | Male | Female |
| Less than 5 Minutes | 0 (0.0%) | 0 (0.0%) |
| 5 to 9 Minutes | 3 (7.9%) | 0 (0.0%) |
| 10 to 14 Minutes | 5 (13.2%) | 0 (0.0%) |
| 15 to 19 Minutes | 0 (0.0%) | 0 (0.0%) |
| 20 to 24 Minutes | 5 (13.2%) | 5 (11.6%) |
| 25 to 29 Minutes | 6 (15.8%) | 0 (0.0%) |
| 30 to 34 Minutes | 4 (10.5%) | 10 (23.3%) |
| 35 to 39 Minutes | 0 (0.0%) | 10 (23.3%) |
| 40 to 44 Minutes | 3 (7.9%) | 0 (0.0%) |
| 45 to 59 Minutes | 12 (31.6%) | 13 (30.2%) |
| 60 to 89 Minutes | 0 (0.0%) | 5 (11.6%) |
| 90 or more Minutes | 0 (0.0%) | 0 (0.0%) |
Time of Departure to Work by Sex in St Marks
The most frequent times of departure to work in St Marks are 12:00 PM to 3:59 PM (23, 60.5%) for males and 7:00 AM to 7:29 AM (15, 34.9%) for females.
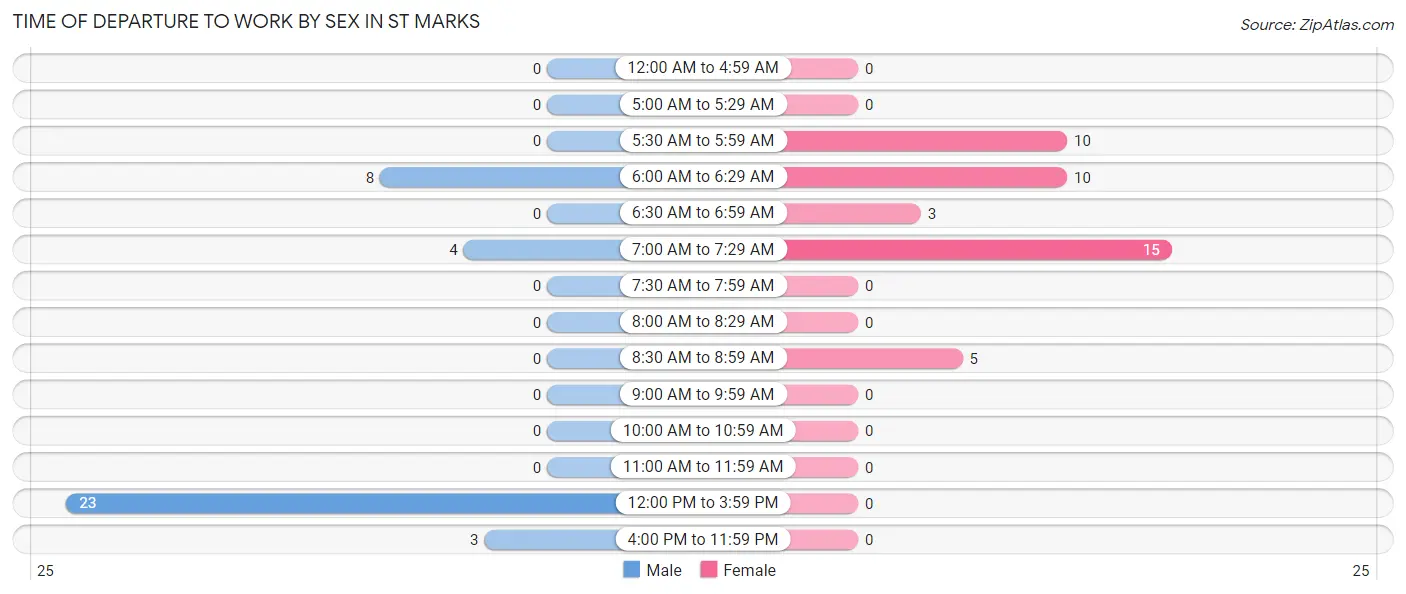
| Time of Departure | Male | Female |
| 12:00 AM to 4:59 AM | 0 (0.0%) | 0 (0.0%) |
| 5:00 AM to 5:29 AM | 0 (0.0%) | 0 (0.0%) |
| 5:30 AM to 5:59 AM | 0 (0.0%) | 10 (23.3%) |
| 6:00 AM to 6:29 AM | 8 (21.0%) | 10 (23.3%) |
| 6:30 AM to 6:59 AM | 0 (0.0%) | 3 (7.0%) |
| 7:00 AM to 7:29 AM | 4 (10.5%) | 15 (34.9%) |
| 7:30 AM to 7:59 AM | 0 (0.0%) | 0 (0.0%) |
| 8:00 AM to 8:29 AM | 0 (0.0%) | 0 (0.0%) |
| 8:30 AM to 8:59 AM | 0 (0.0%) | 5 (11.6%) |
| 9:00 AM to 9:59 AM | 0 (0.0%) | 0 (0.0%) |
| 10:00 AM to 10:59 AM | 0 (0.0%) | 0 (0.0%) |
| 11:00 AM to 11:59 AM | 0 (0.0%) | 0 (0.0%) |
| 12:00 PM to 3:59 PM | 23 (60.5%) | 0 (0.0%) |
| 4:00 PM to 11:59 PM | 3 (7.9%) | 0 (0.0%) |
| Total | 38 (100.0%) | 43 (100.0%) |
Housing Occupancy in St Marks
Occupancy by Ownership in St Marks
Of the total 148 dwellings in St Marks, owner-occupied units account for 114 (77.0%), while renter-occupied units make up 34 (23.0%).
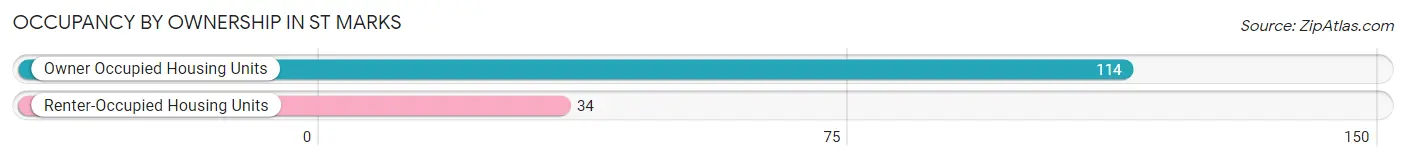
| Occupancy | # Housing Units | % Housing Units |
| Owner Occupied Housing Units | 114 | 77.0% |
| Renter-Occupied Housing Units | 34 | 23.0% |
| Total Occupied Housing Units | 148 | 100.0% |
Occupancy by Household Size in St Marks
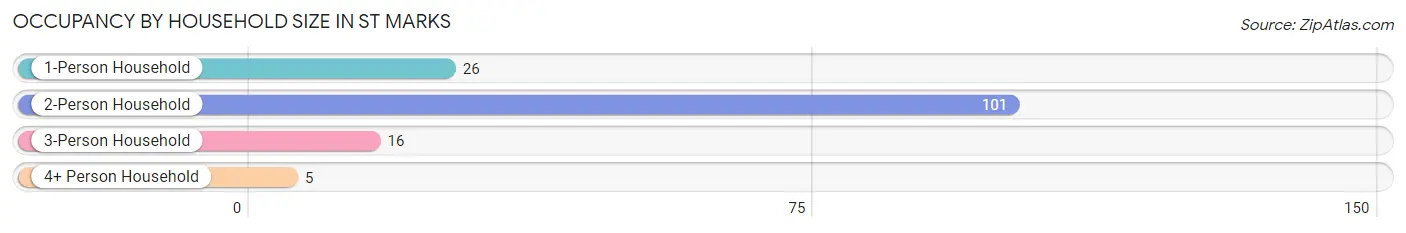
| Household Size | # Housing Units | % Housing Units |
| 1-Person Household | 26 | 17.6% |
| 2-Person Household | 101 | 68.2% |
| 3-Person Household | 16 | 10.8% |
| 4+ Person Household | 5 | 3.4% |
| Total Housing Units | 148 | 100.0% |
Occupancy by Ownership by Household Size in St Marks
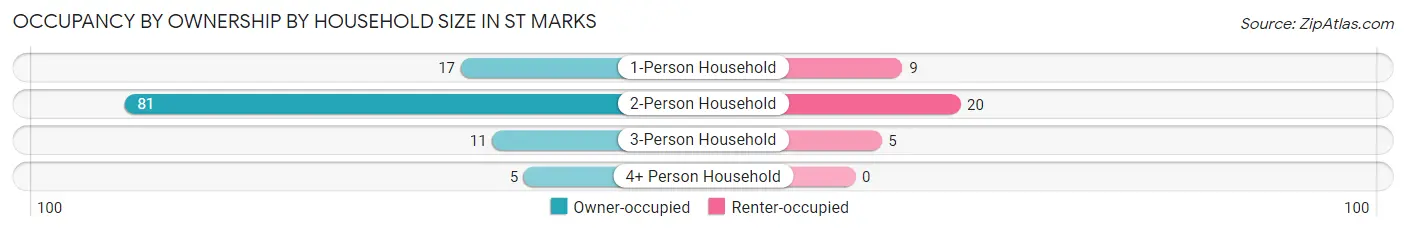
| Household Size | Owner-occupied | Renter-occupied |
| 1-Person Household | 17 (65.4%) | 9 (34.6%) |
| 2-Person Household | 81 (80.2%) | 20 (19.8%) |
| 3-Person Household | 11 (68.8%) | 5 (31.2%) |
| 4+ Person Household | 5 (100.0%) | 0 (0.0%) |
| Total Housing Units | 114 (77.0%) | 34 (23.0%) |
Occupancy by Educational Attainment in St Marks
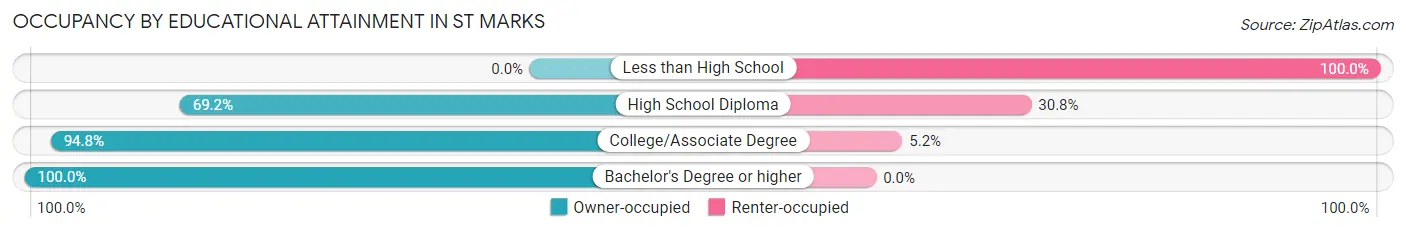
| Household Size | Owner-occupied | Renter-occupied |
| Less than High School | 0 (0.0%) | 14 (100.0%) |
| High School Diploma | 36 (69.2%) | 16 (30.8%) |
| College/Associate Degree | 73 (94.8%) | 4 (5.2%) |
| Bachelor's Degree or higher | 5 (100.0%) | 0 (0.0%) |
Occupancy by Age of Householder in St Marks
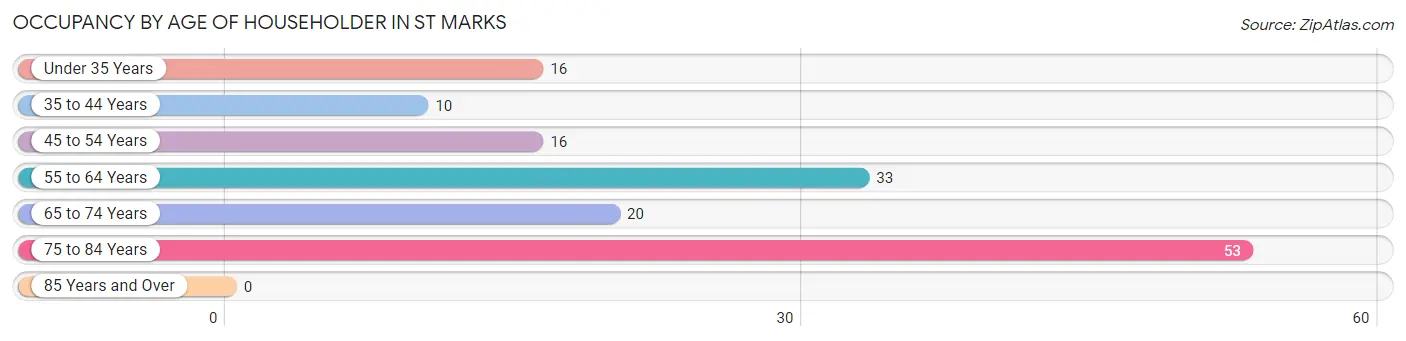
| Age Bracket | # Households | % Households |
| Under 35 Years | 16 | 10.8% |
| 35 to 44 Years | 10 | 6.8% |
| 45 to 54 Years | 16 | 10.8% |
| 55 to 64 Years | 33 | 22.3% |
| 65 to 74 Years | 20 | 13.5% |
| 75 to 84 Years | 53 | 35.8% |
| 85 Years and Over | 0 | 0.0% |
| Total | 148 | 100.0% |
Housing Finances in St Marks
Median Income by Occupancy in St Marks
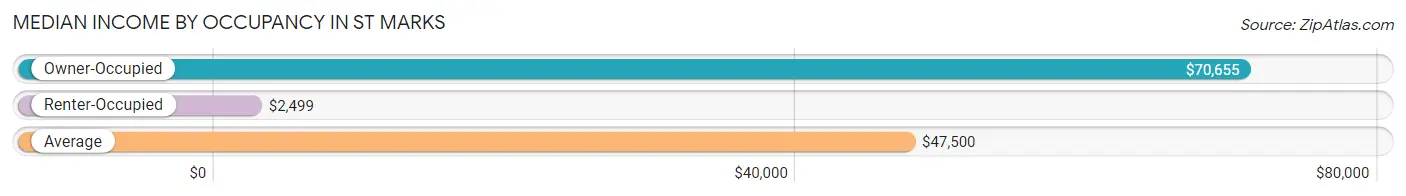
| Occupancy Type | # Households | Median Income |
| Owner-Occupied | 114 (77.0%) | $70,655 |
| Renter-Occupied | 34 (23.0%) | $2,499 |
| Average | 148 (100.0%) | $47,500 |
Occupancy by Householder Income Bracket in St Marks
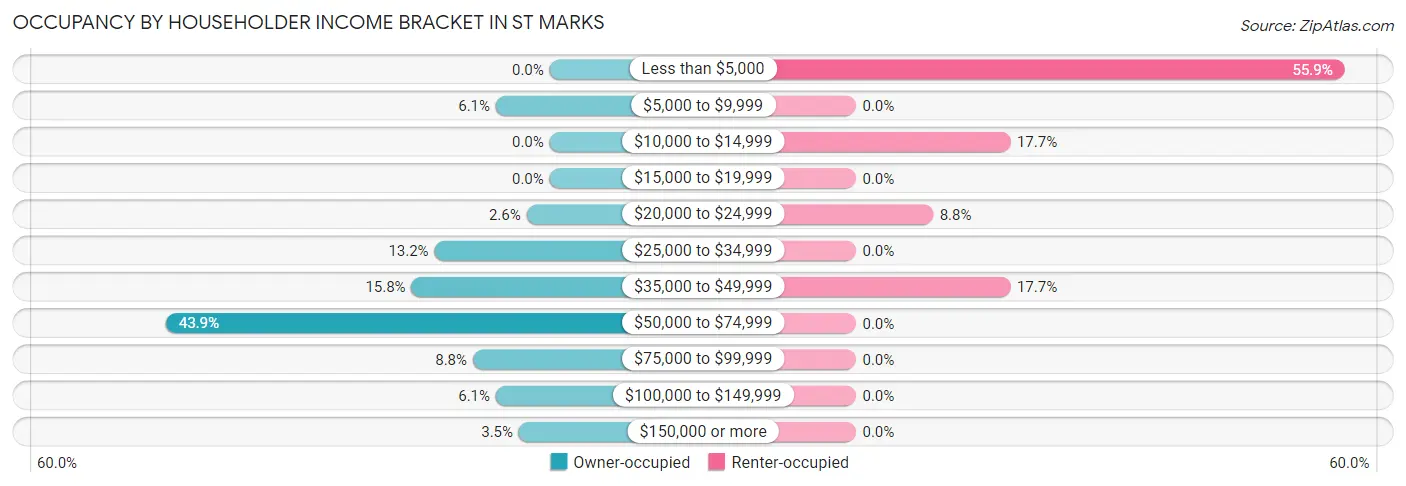
| Income Bracket | Owner-occupied | Renter-occupied |
| Less than $5,000 | 0 (0.0%) | 19 (55.9%) |
| $5,000 to $9,999 | 7 (6.1%) | 0 (0.0%) |
| $10,000 to $14,999 | 0 (0.0%) | 6 (17.6%) |
| $15,000 to $19,999 | 0 (0.0%) | 0 (0.0%) |
| $20,000 to $24,999 | 3 (2.6%) | 3 (8.8%) |
| $25,000 to $34,999 | 15 (13.2%) | 0 (0.0%) |
| $35,000 to $49,999 | 18 (15.8%) | 6 (17.6%) |
| $50,000 to $74,999 | 50 (43.9%) | 0 (0.0%) |
| $75,000 to $99,999 | 10 (8.8%) | 0 (0.0%) |
| $100,000 to $149,999 | 7 (6.1%) | 0 (0.0%) |
| $150,000 or more | 4 (3.5%) | 0 (0.0%) |
| Total | 114 (100.0%) | 34 (100.0%) |
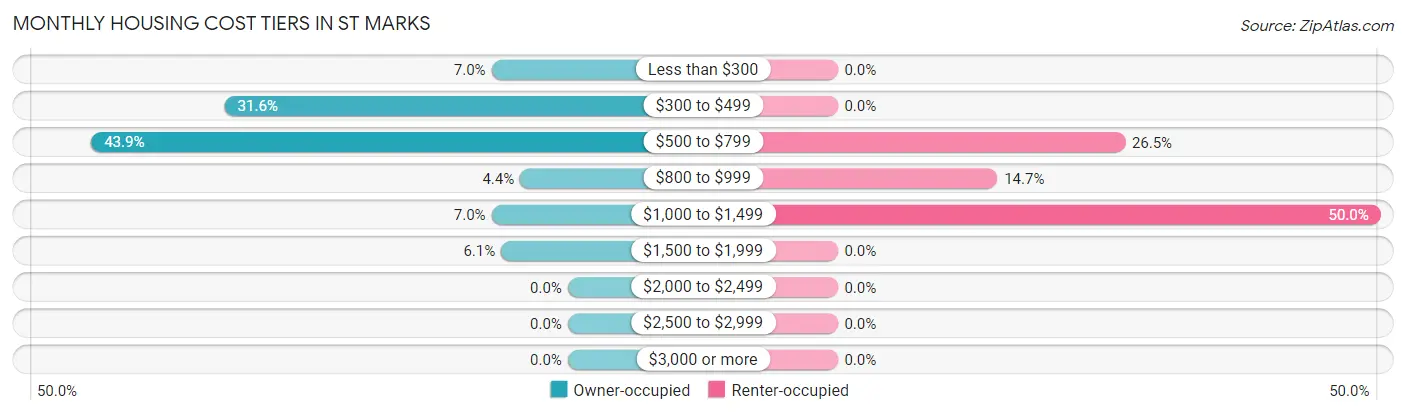
Monthly Housing Cost Tiers in St Marks
| Monthly Cost | Owner-occupied | Renter-occupied |
| Less than $300 | 8 (7.0%) | 0 (0.0%) |
| $300 to $499 | 36 (31.6%) | 0 (0.0%) |
| $500 to $799 | 50 (43.9%) | 9 (26.5%) |
| $800 to $999 | 5 (4.4%) | 5 (14.7%) |
| $1,000 to $1,499 | 8 (7.0%) | 17 (50.0%) |
| $1,500 to $1,999 | 7 (6.1%) | 0 (0.0%) |
| $2,000 to $2,499 | 0 (0.0%) | 0 (0.0%) |
| $2,500 to $2,999 | 0 (0.0%) | 0 (0.0%) |
| $3,000 or more | 0 (0.0%) | 0 (0.0%) |
| Total | 114 (100.0%) | 34 (100.0%) |
Physical Housing Characteristics in St Marks
Housing Structures in St Marks
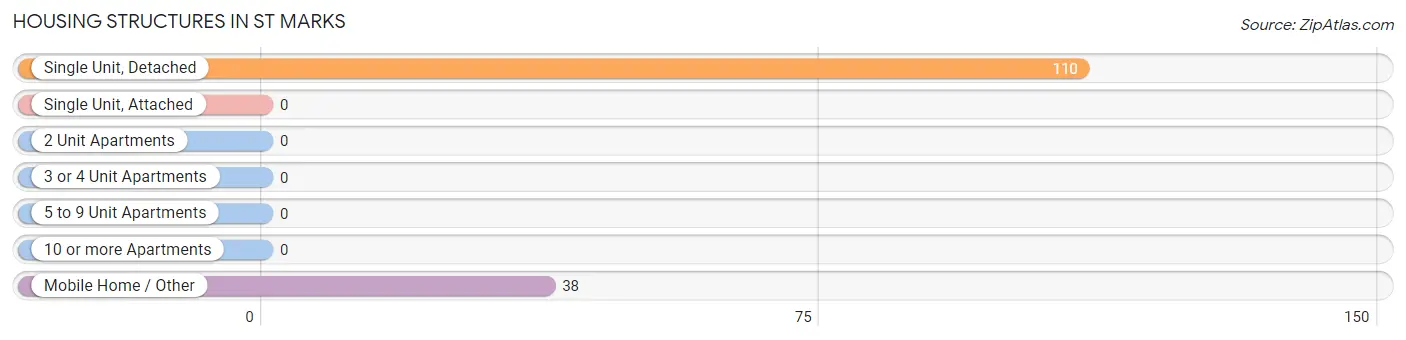
| Structure Type | # Housing Units | % Housing Units |
| Single Unit, Detached | 110 | 74.3% |
| Single Unit, Attached | 0 | 0.0% |
| 2 Unit Apartments | 0 | 0.0% |
| 3 or 4 Unit Apartments | 0 | 0.0% |
| 5 to 9 Unit Apartments | 0 | 0.0% |
| 10 or more Apartments | 0 | 0.0% |
| Mobile Home / Other | 38 | 25.7% |
| Total | 148 | 100.0% |
Housing Structures by Occupancy in St Marks
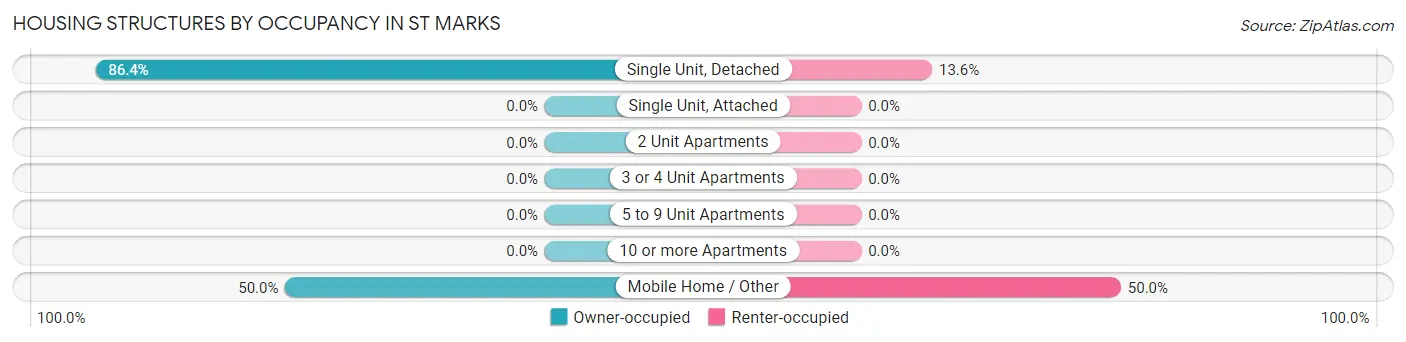
| Structure Type | Owner-occupied | Renter-occupied |
| Single Unit, Detached | 95 (86.4%) | 15 (13.6%) |
| Single Unit, Attached | 0 (0.0%) | 0 (0.0%) |
| 2 Unit Apartments | 0 (0.0%) | 0 (0.0%) |
| 3 or 4 Unit Apartments | 0 (0.0%) | 0 (0.0%) |
| 5 to 9 Unit Apartments | 0 (0.0%) | 0 (0.0%) |
| 10 or more Apartments | 0 (0.0%) | 0 (0.0%) |
| Mobile Home / Other | 19 (50.0%) | 19 (50.0%) |
| Total | 114 (77.0%) | 34 (23.0%) |
Housing Structures by Number of Rooms in St Marks
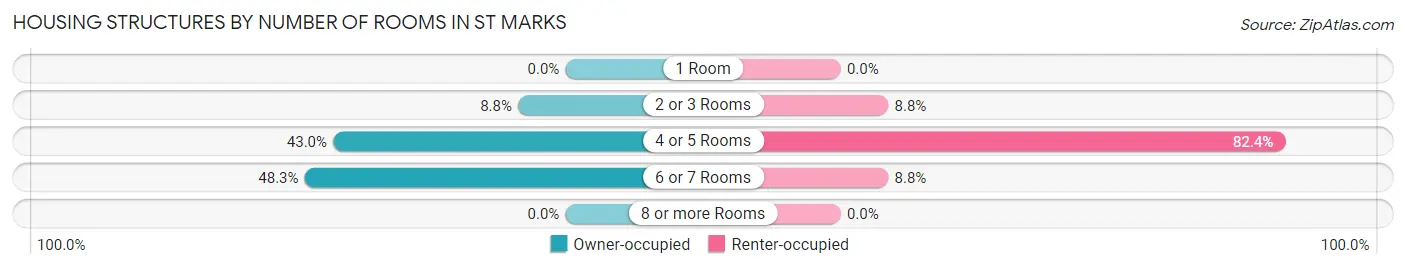
| Number of Rooms | Owner-occupied | Renter-occupied |
| 1 Room | 0 (0.0%) | 0 (0.0%) |
| 2 or 3 Rooms | 10 (8.8%) | 3 (8.8%) |
| 4 or 5 Rooms | 49 (43.0%) | 28 (82.4%) |
| 6 or 7 Rooms | 55 (48.2%) | 3 (8.8%) |
| 8 or more Rooms | 0 (0.0%) | 0 (0.0%) |
| Total | 114 (100.0%) | 34 (100.0%) |
Housing Structure by Heating Type in St Marks
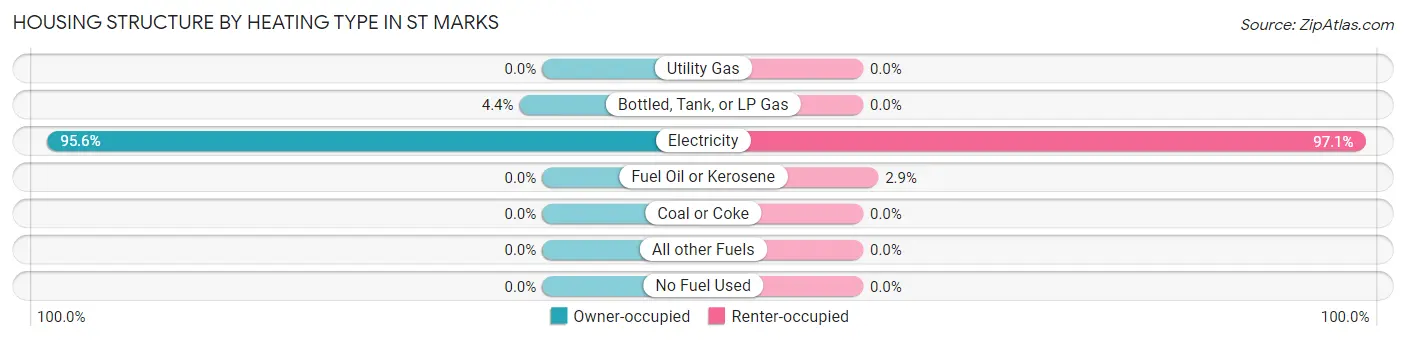
| Heating Type | Owner-occupied | Renter-occupied |
| Utility Gas | 0 (0.0%) | 0 (0.0%) |
| Bottled, Tank, or LP Gas | 5 (4.4%) | 0 (0.0%) |
| Electricity | 109 (95.6%) | 33 (97.1%) |
| Fuel Oil or Kerosene | 0 (0.0%) | 1 (2.9%) |
| Coal or Coke | 0 (0.0%) | 0 (0.0%) |
| All other Fuels | 0 (0.0%) | 0 (0.0%) |
| No Fuel Used | 0 (0.0%) | 0 (0.0%) |
| Total | 114 (100.0%) | 34 (100.0%) |
Household Vehicle Usage in St Marks
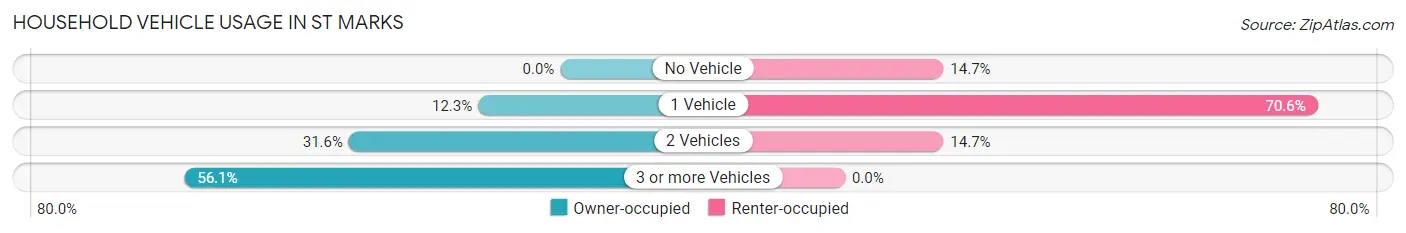
| Vehicles per Household | Owner-occupied | Renter-occupied |
| No Vehicle | 0 (0.0%) | 5 (14.7%) |
| 1 Vehicle | 14 (12.3%) | 24 (70.6%) |
| 2 Vehicles | 36 (31.6%) | 5 (14.7%) |
| 3 or more Vehicles | 64 (56.1%) | 0 (0.0%) |
| Total | 114 (100.0%) | 34 (100.0%) |
Real Estate & Mortgages in St Marks
Real Estate and Mortgage Overview in St Marks
| Characteristic | Without Mortgage | With Mortgage |
| Housing Units | 86 | 28 |
| Median Property Value | $309,500 | $122,500 |
| Median Household Income | $71,250 | $4 |
| Monthly Housing Costs | $519 | $0 |
| Real Estate Taxes | $2,119 | $3 |
Property Value by Mortgage Status in St Marks
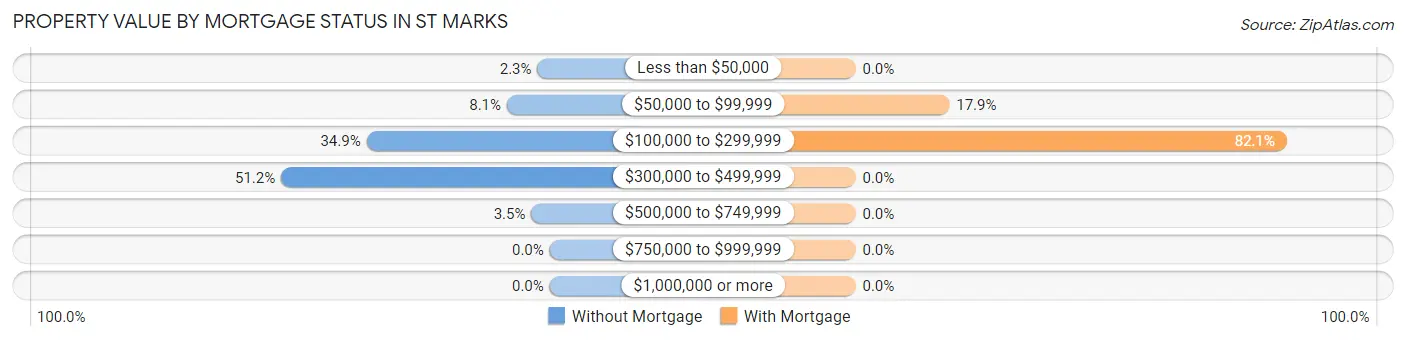
| Property Value | Without Mortgage | With Mortgage |
| Less than $50,000 | 2 (2.3%) | 0 (0.0%) |
| $50,000 to $99,999 | 7 (8.1%) | 5 (17.9%) |
| $100,000 to $299,999 | 30 (34.9%) | 23 (82.1%) |
| $300,000 to $499,999 | 44 (51.2%) | 0 (0.0%) |
| $500,000 to $749,999 | 3 (3.5%) | 0 (0.0%) |
| $750,000 to $999,999 | 0 (0.0%) | 0 (0.0%) |
| $1,000,000 or more | 0 (0.0%) | 0 (0.0%) |
| Total | 86 (100.0%) | 28 (100.0%) |
Household Income by Mortgage Status in St Marks
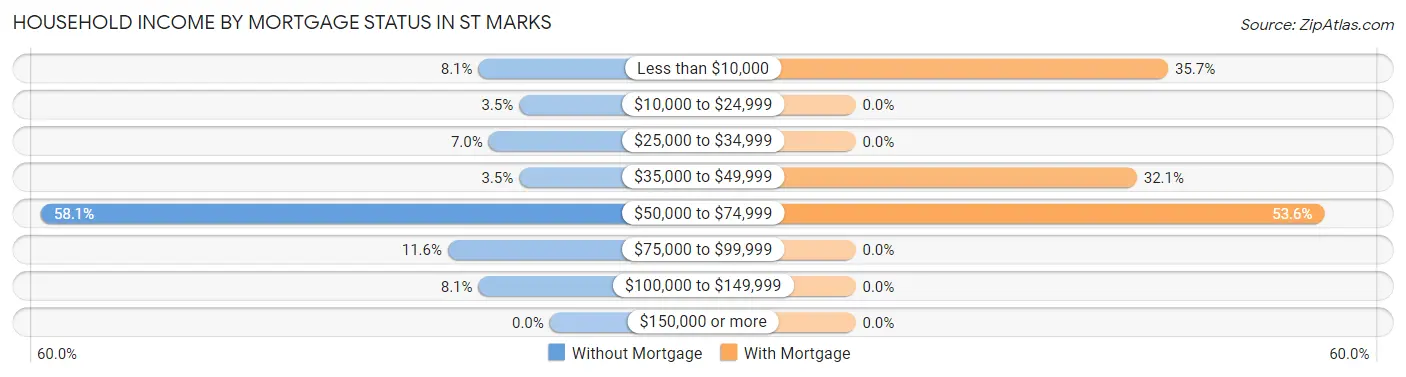
| Household Income | Without Mortgage | With Mortgage |
| Less than $10,000 | 7 (8.1%) | 10 (35.7%) |
| $10,000 to $24,999 | 3 (3.5%) | 0 (0.0%) |
| $25,000 to $34,999 | 6 (7.0%) | 0 (0.0%) |
| $35,000 to $49,999 | 3 (3.5%) | 9 (32.1%) |
| $50,000 to $74,999 | 50 (58.1%) | 15 (53.6%) |
| $75,000 to $99,999 | 10 (11.6%) | 0 (0.0%) |
| $100,000 to $149,999 | 7 (8.1%) | 0 (0.0%) |
| $150,000 or more | 0 (0.0%) | 0 (0.0%) |
| Total | 86 (100.0%) | 28 (100.0%) |
Property Value to Household Income Ratio in St Marks
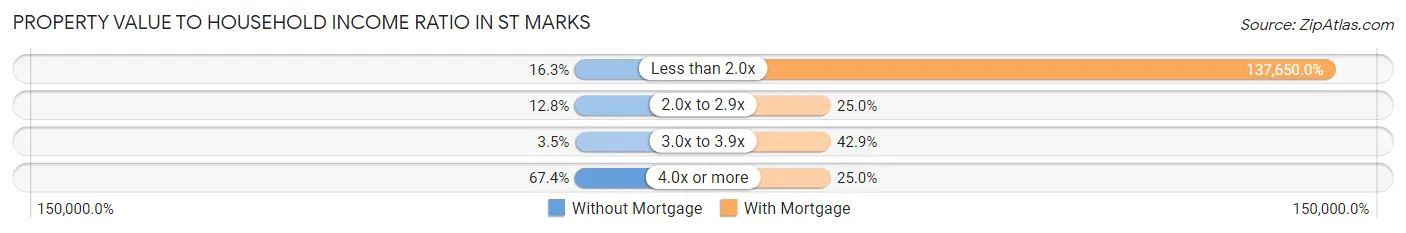
| Value-to-Income Ratio | Without Mortgage | With Mortgage |
| Less than 2.0x | 14 (16.3%) | 38,542 (137,650.0%) |
| 2.0x to 2.9x | 11 (12.8%) | 7 (25.0%) |
| 3.0x to 3.9x | 3 (3.5%) | 12 (42.9%) |
| 4.0x or more | 58 (67.4%) | 7 (25.0%) |
| Total | 86 (100.0%) | 28 (100.0%) |
Real Estate Taxes by Mortgage Status in St Marks
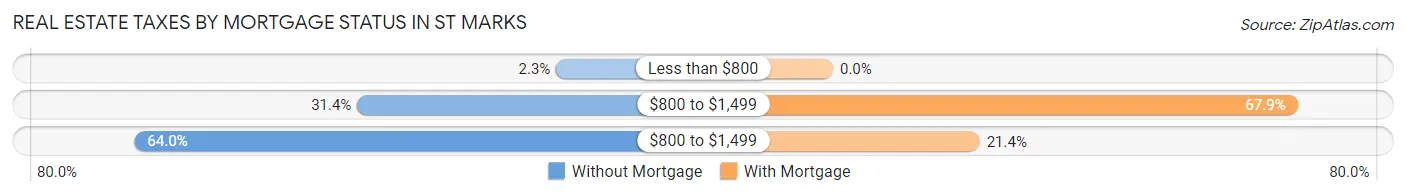
| Property Taxes | Without Mortgage | With Mortgage |
| Less than $800 | 2 (2.3%) | 0 (0.0%) |
| $800 to $1,499 | 27 (31.4%) | 19 (67.9%) |
| $800 to $1,499 | 55 (63.9%) | 6 (21.4%) |
| Total | 86 (100.0%) | 28 (100.0%) |
Health & Disability in St Marks
Health Insurance Coverage by Age in St Marks
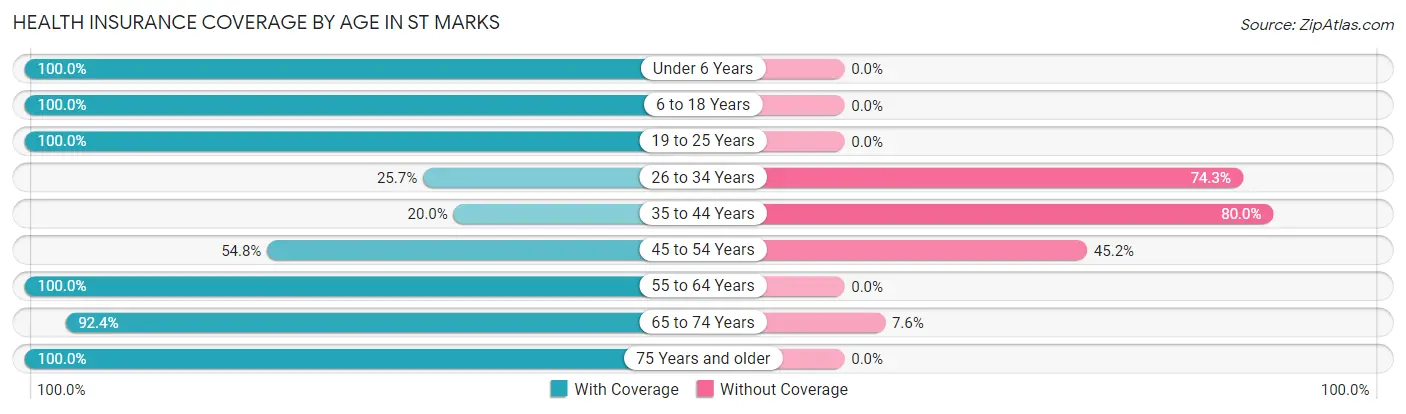
| Age Bracket | With Coverage | Without Coverage |
| Under 6 Years | 4 (100.0%) | 0 (0.0%) |
| 6 to 18 Years | 7 (100.0%) | 0 (0.0%) |
| 19 to 25 Years | 17 (100.0%) | 0 (0.0%) |
| 26 to 34 Years | 9 (25.7%) | 26 (74.3%) |
| 35 to 44 Years | 5 (20.0%) | 20 (80.0%) |
| 45 to 54 Years | 23 (54.8%) | 19 (45.2%) |
| 55 to 64 Years | 36 (100.0%) | 0 (0.0%) |
| 65 to 74 Years | 61 (92.4%) | 5 (7.6%) |
| 75 Years and older | 59 (100.0%) | 0 (0.0%) |
| Total | 221 (75.9%) | 70 (24.0%) |
Health Insurance Coverage by Citizenship Status in St Marks
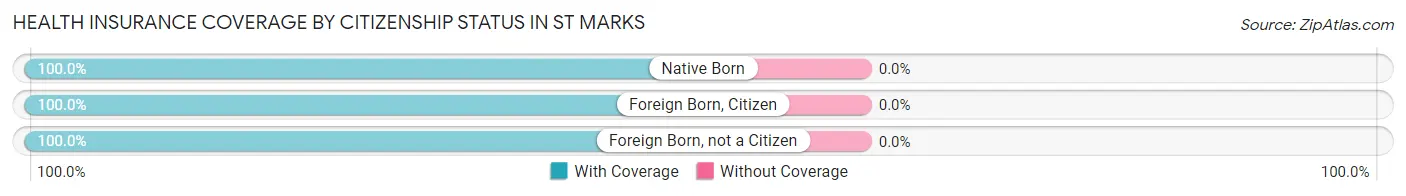
| Citizenship Status | With Coverage | Without Coverage |
| Native Born | 4 (100.0%) | 0 (0.0%) |
| Foreign Born, Citizen | 7 (100.0%) | 0 (0.0%) |
| Foreign Born, not a Citizen | 17 (100.0%) | 0 (0.0%) |
Health Insurance Coverage by Household Income in St Marks
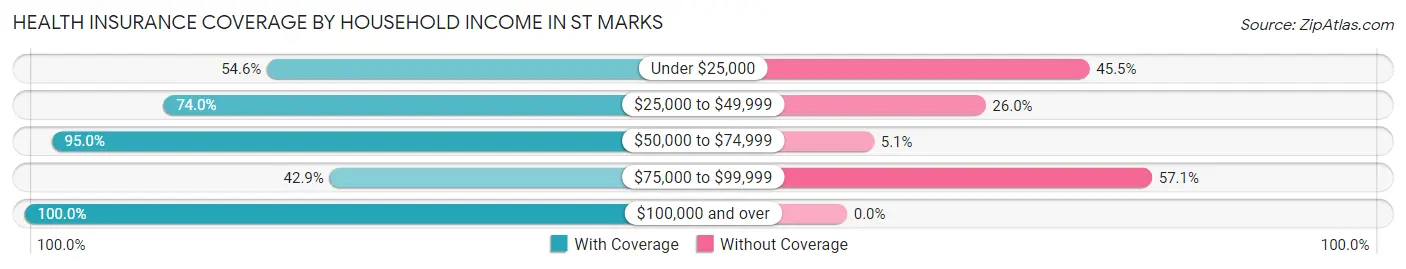
| Household Income | With Coverage | Without Coverage |
| Under $25,000 | 30 (54.5%) | 25 (45.5%) |
| $25,000 to $49,999 | 57 (74.0%) | 20 (26.0%) |
| $50,000 to $74,999 | 94 (95.0%) | 5 (5.1%) |
| $75,000 to $99,999 | 15 (42.9%) | 20 (57.1%) |
| $100,000 and over | 25 (100.0%) | 0 (0.0%) |
Public vs Private Health Insurance Coverage by Age in St Marks
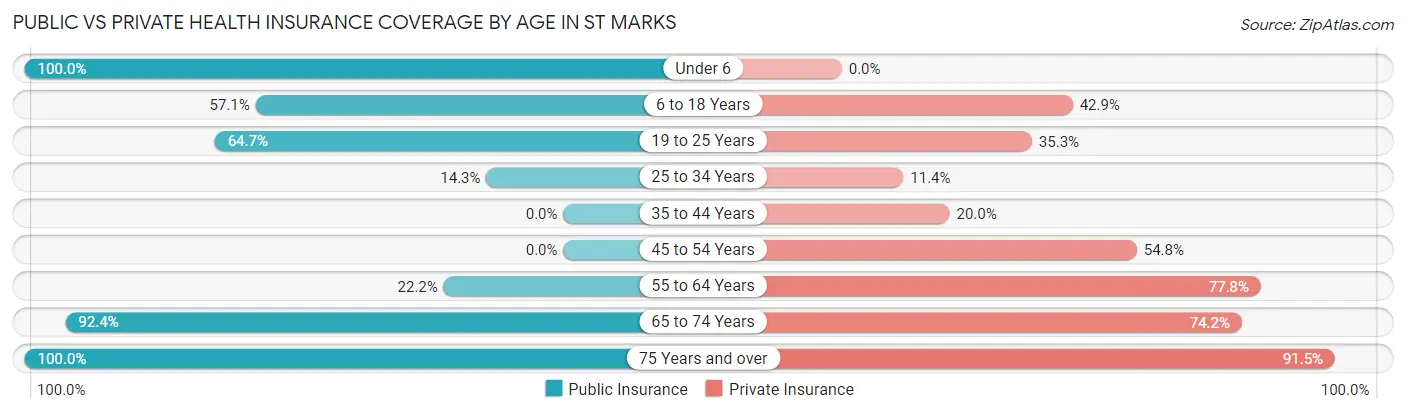
| Age Bracket | Public Insurance | Private Insurance |
| Under 6 | 4 (100.0%) | 0 (0.0%) |
| 6 to 18 Years | 4 (57.1%) | 3 (42.9%) |
| 19 to 25 Years | 11 (64.7%) | 6 (35.3%) |
| 25 to 34 Years | 5 (14.3%) | 4 (11.4%) |
| 35 to 44 Years | 0 (0.0%) | 5 (20.0%) |
| 45 to 54 Years | 0 (0.0%) | 23 (54.8%) |
| 55 to 64 Years | 8 (22.2%) | 28 (77.8%) |
| 65 to 74 Years | 61 (92.4%) | 49 (74.2%) |
| 75 Years and over | 59 (100.0%) | 54 (91.5%) |
| Total | 152 (52.2%) | 172 (59.1%) |
Disability Status by Sex by Age in St Marks
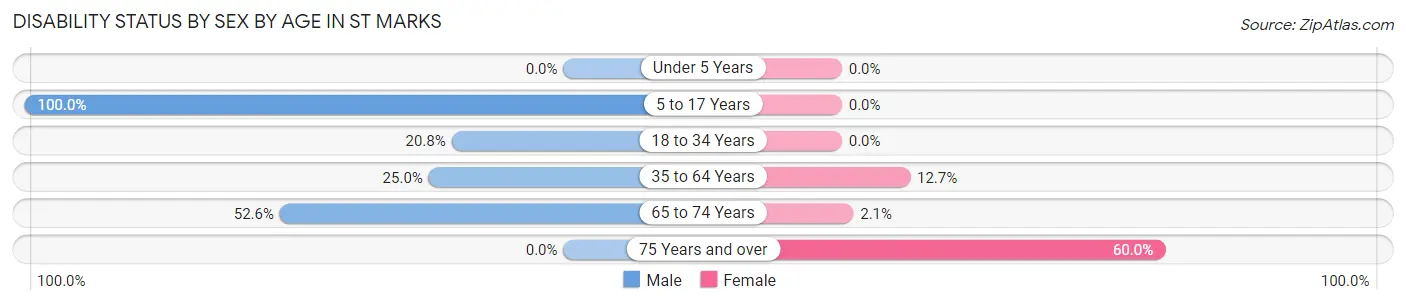
| Age Bracket | Male | Female |
| Under 5 Years | 0 (0.0%) | 0 (0.0%) |
| 5 to 17 Years | 4 (100.0%) | 0 (0.0%) |
| 18 to 34 Years | 11 (20.7%) | 0 (0.0%) |
| 35 to 64 Years | 6 (25.0%) | 10 (12.7%) |
| 65 to 74 Years | 10 (52.6%) | 1 (2.1%) |
| 75 Years and over | 0 (0.0%) | 9 (60.0%) |
Disability Class by Sex by Age in St Marks
Disability Class: Hearing Difficulty
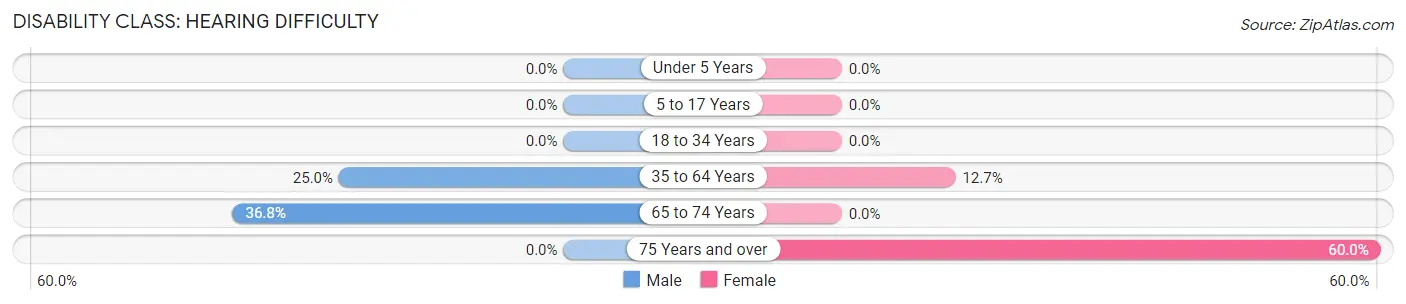
| Age Bracket | Male | Female |
| Under 5 Years | 0 (0.0%) | 0 (0.0%) |
| 5 to 17 Years | 0 (0.0%) | 0 (0.0%) |
| 18 to 34 Years | 0 (0.0%) | 0 (0.0%) |
| 35 to 64 Years | 6 (25.0%) | 10 (12.7%) |
| 65 to 74 Years | 7 (36.8%) | 0 (0.0%) |
| 75 Years and over | 0 (0.0%) | 9 (60.0%) |
Disability Class: Vision Difficulty
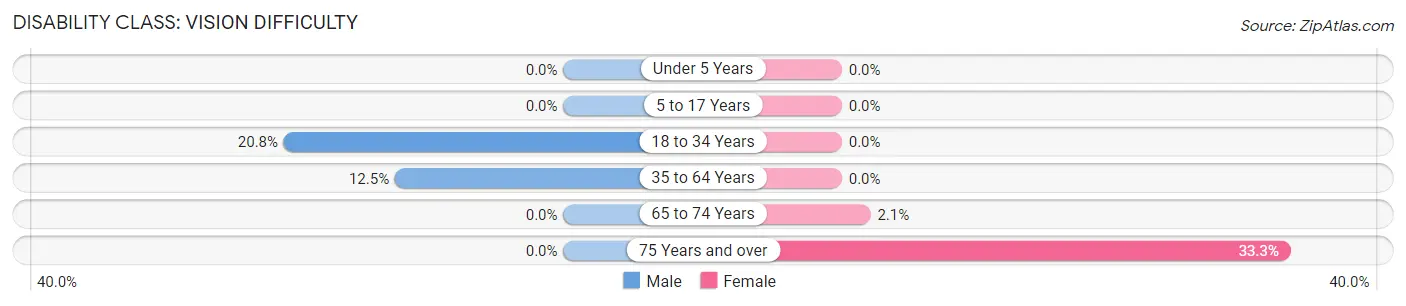
| Age Bracket | Male | Female |
| Under 5 Years | 0 (0.0%) | 0 (0.0%) |
| 5 to 17 Years | 0 (0.0%) | 0 (0.0%) |
| 18 to 34 Years | 11 (20.7%) | 0 (0.0%) |
| 35 to 64 Years | 3 (12.5%) | 0 (0.0%) |
| 65 to 74 Years | 0 (0.0%) | 1 (2.1%) |
| 75 Years and over | 0 (0.0%) | 5 (33.3%) |
Disability Class: Cognitive Difficulty
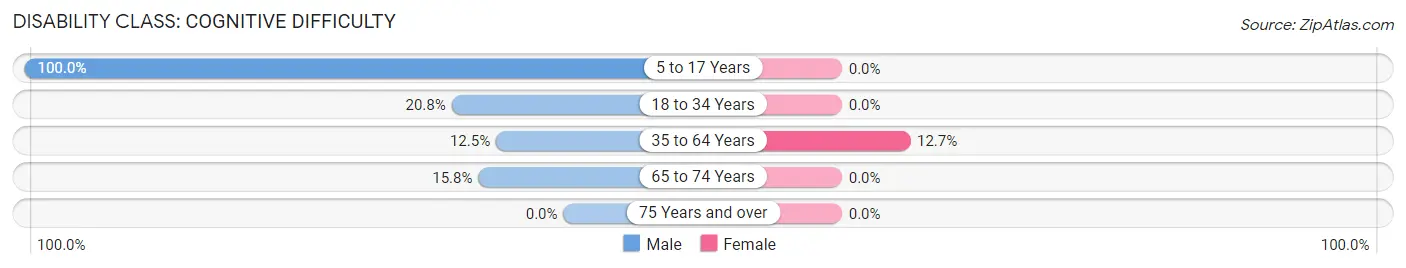
| Age Bracket | Male | Female |
| 5 to 17 Years | 4 (100.0%) | 0 (0.0%) |
| 18 to 34 Years | 11 (20.7%) | 0 (0.0%) |
| 35 to 64 Years | 3 (12.5%) | 10 (12.7%) |
| 65 to 74 Years | 3 (15.8%) | 0 (0.0%) |
| 75 Years and over | 0 (0.0%) | 0 (0.0%) |
Disability Class: Ambulatory Difficulty
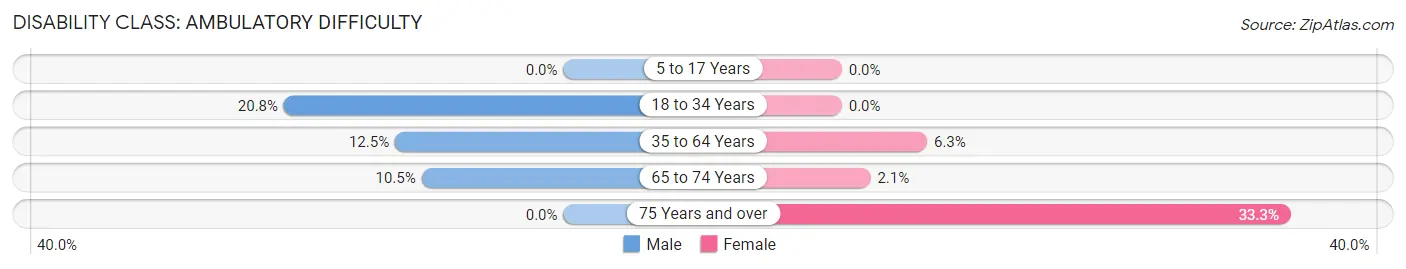
| Age Bracket | Male | Female |
| 5 to 17 Years | 0 (0.0%) | 0 (0.0%) |
| 18 to 34 Years | 11 (20.7%) | 0 (0.0%) |
| 35 to 64 Years | 3 (12.5%) | 5 (6.3%) |
| 65 to 74 Years | 2 (10.5%) | 1 (2.1%) |
| 75 Years and over | 0 (0.0%) | 5 (33.3%) |
Disability Class: Self-Care Difficulty
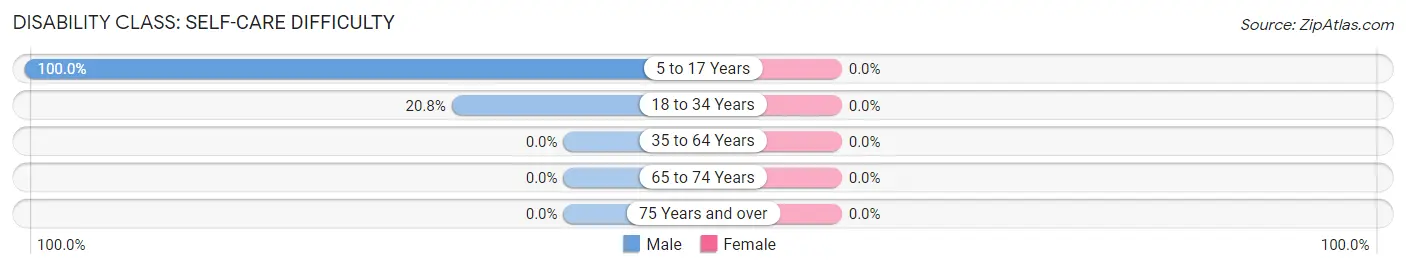
| Age Bracket | Male | Female |
| 5 to 17 Years | 4 (100.0%) | 0 (0.0%) |
| 18 to 34 Years | 11 (20.7%) | 0 (0.0%) |
| 35 to 64 Years | 0 (0.0%) | 0 (0.0%) |
| 65 to 74 Years | 0 (0.0%) | 0 (0.0%) |
| 75 Years and over | 0 (0.0%) | 0 (0.0%) |
Technology Access in St Marks
Computing Device Access in St Marks
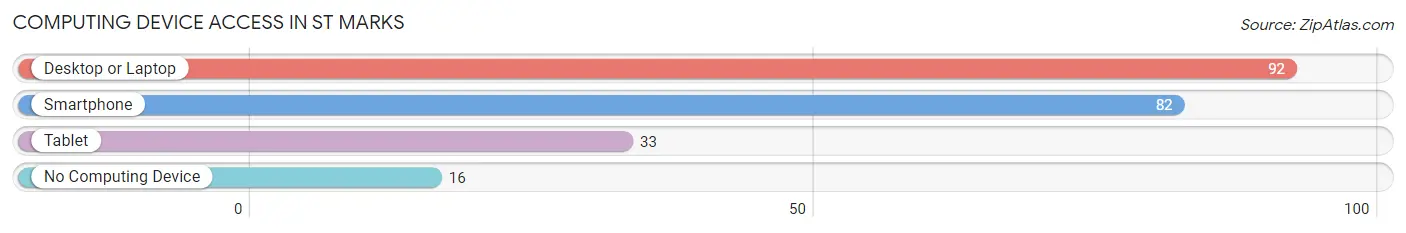
| Device Type | # Households | % Households |
| Desktop or Laptop | 92 | 62.2% |
| Smartphone | 82 | 55.4% |
| Tablet | 33 | 22.3% |
| No Computing Device | 16 | 10.8% |
| Total | 148 | 100.0% |
Internet Access in St Marks
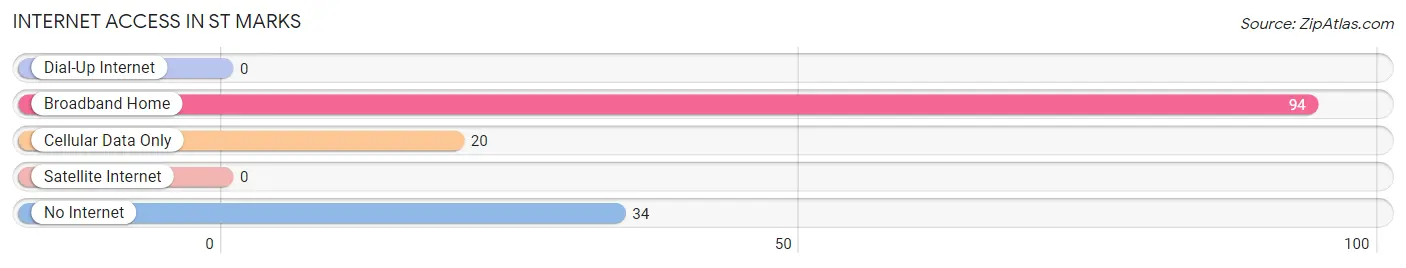
| Internet Type | # Households | % Households |
| Dial-Up Internet | 0 | 0.0% |
| Broadband Home | 94 | 63.5% |
| Cellular Data Only | 20 | 13.5% |
| Satellite Internet | 0 | 0.0% |
| No Internet | 34 | 23.0% |
| Total | 148 | 100.0% |
St Marks Summary
St. Marks is a small city located in Wakulla County, Florida, United States. It is situated on the St. Marks River, which flows into the Gulf of Mexico. The city is located about 20 miles south of Tallahassee, the state capital. As of the 2010 census, the population of St. Marks was 576.
History
The area around St. Marks has been inhabited for thousands of years. The first known inhabitants were Native Americans, who lived in the area for centuries before the arrival of Europeans. The first Europeans to settle in the area were Spanish explorers, who arrived in the late 1500s. The Spanish established a mission in the area, which was later abandoned.
In the early 1800s, the area was settled by American settlers, who established a trading post and a small port. The port was used to ship cotton and other goods to other parts of the country. The town was officially incorporated in 1829 and was named after St. Mark, the patron saint of the local Catholic church.
In the late 1800s, the town became a popular tourist destination, with visitors coming to fish and hunt in the area. The town also became a popular spot for artists and writers, who were drawn to the area's natural beauty.
In the early 1900s, the town's economy was largely based on fishing and shrimping. The town also had a thriving lumber industry, with several sawmills located in the area.
In the late 1900s, the town's economy shifted to tourism, with visitors coming to enjoy the area's natural beauty and outdoor activities. The town also became a popular spot for retirees, who were drawn to the area's mild climate and low cost of living.
Geography
St. Marks is located in Wakulla County, Florida, on the St. Marks River. The city is located about 20 miles south of Tallahassee, the state capital. The city has a total area of 1.2 square miles, all of which is land.
The city is located in a humid subtropical climate zone, with hot, humid summers and mild winters. The average temperature in the summer is around 90 degrees Fahrenheit, while the average temperature in the winter is around 60 degrees Fahrenheit.
Economy
The economy of St. Marks is largely based on tourism and retirement. The city is a popular spot for retirees, who are drawn to the area's mild climate and low cost of living. The city also attracts visitors who come to enjoy the area's natural beauty and outdoor activities.
The city also has a thriving fishing and shrimping industry, with several seafood restaurants located in the area. The city also has a small port, which is used to ship goods to other parts of the country.
Demographics
As of the 2010 census, the population of St. Marks was 576. The racial makeup of the city was 94.3% White, 2.6% African American, 0.2% Native American, 0.2% Asian, 0.2% from other races, and 2.7% from two or more races. Hispanic or Latino of any race were 1.7% of the population.
The median household income in St. Marks was $37,500, and the median family income was $45,000. The per capita income in the city was $20,000. About 11.7% of the population was below the poverty line.
Common Questions
What is Per Capita Income in St Marks?
Per Capita income in St Marks is $26,462.
What is the Median Household income in St Marks?
Median Household Income in St Marks is $47,500.
What is Income or Wage Gap in St Marks?
Income or Wage Gap in St Marks is 19.8%.
Women in St Marks earn 80.2 cents for every dollar earned by a man.
What is Inequality or Gini Index in St Marks?
Inequality or Gini Index in St Marks is 0.39.
What is the Total Population of St Marks?
Total Population of St Marks is 291.
What is the Total Male Population of St Marks?
Total Male Population of St Marks is 144.
What is the Total Female Population of St Marks?
Total Female Population of St Marks is 147.
What is the Ratio of Males per 100 Females in St Marks?
There are 97.96 Males per 100 Females in St Marks.
What is the Ratio of Females per 100 Males in St Marks?
There are 102.08 Females per 100 Males in St Marks.
What is the Median Population Age in St Marks?
Median Population Age in St Marks is 60.1 Years.
What is the Average Family Size in St Marks
Average Family Size in St Marks is 2.0 People.
What is the Average Household Size in St Marks
Average Household Size in St Marks is 2.0 People.
How Large is the Labor Force in St Marks?
There are 90 People in the Labor Forcein in St Marks.
What is the Percentage of People in the Labor Force in St Marks?
31.8% of People are in the Labor Force in St Marks.
What is the Unemployment Rate in St Marks?
Unemployment Rate in St Marks is 5.6%.