Grenelefe, FL Map & Demographics
Grenelefe Map
Grenelefe Overview
$25,770
PER CAPITA INCOME
$87,226
AVG FAMILY INCOME
$57,692
AVG HOUSEHOLD INCOME
29.2%
WAGE / INCOME GAP [ % ]
70.8¢/ $1
WAGE / INCOME GAP [ $ ]
0.37
INEQUALITY / GINI INDEX
2,995
TOTAL POPULATION
1,399
MALE POPULATION
1,596
FEMALE POPULATION
87.66
MALES / 100 FEMALES
114.08
FEMALES / 100 MALES
38.7
MEDIAN AGE
3.9
AVG FAMILY SIZE
3.0
AVG HOUSEHOLD SIZE
1,359
LABOR FORCE [ PEOPLE ]
59.9%
PERCENT IN LABOR FORCE
Income in Grenelefe
Income Overview in Grenelefe
Per Capita Income in Grenelefe is $25,770, while median incomes of families and households are $87,226 and $57,692 respectively.
| Characteristic | Number | Measure |
| Per Capita Income | 2,995 | $25,770 |
| Median Family Income | 640 | $87,226 |
| Mean Family Income | 640 | $89,853 |
| Median Household Income | 996 | $57,692 |
| Mean Household Income | 996 | $72,593 |
| Income Deficit | 640 | $0 |
| Wage / Income Gap (%) | 2,995 | 29.20% |
| Wage / Income Gap ($) | 2,995 | 70.80¢ per $1 |
| Gini / Inequality Index | 2,995 | 0.37 |
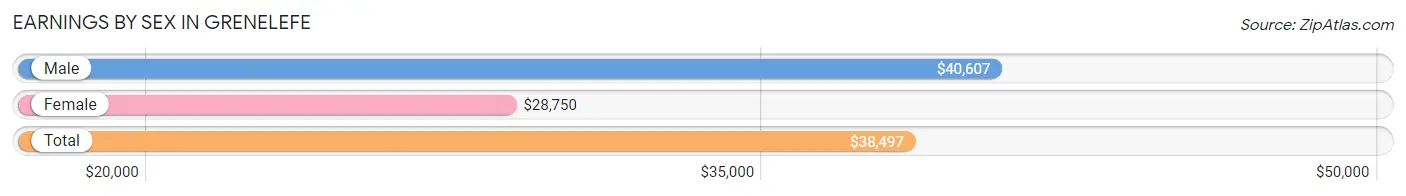
Earnings by Sex in Grenelefe
Average Earnings in Grenelefe are $38,497, $40,607 for men and $28,750 for women, a difference of 29.2%.
| Sex | Number | Average Earnings |
| Male | 739 (53.7%) | $40,607 |
| Female | 636 (46.3%) | $28,750 |
| Total | 1,375 (100.0%) | $38,497 |
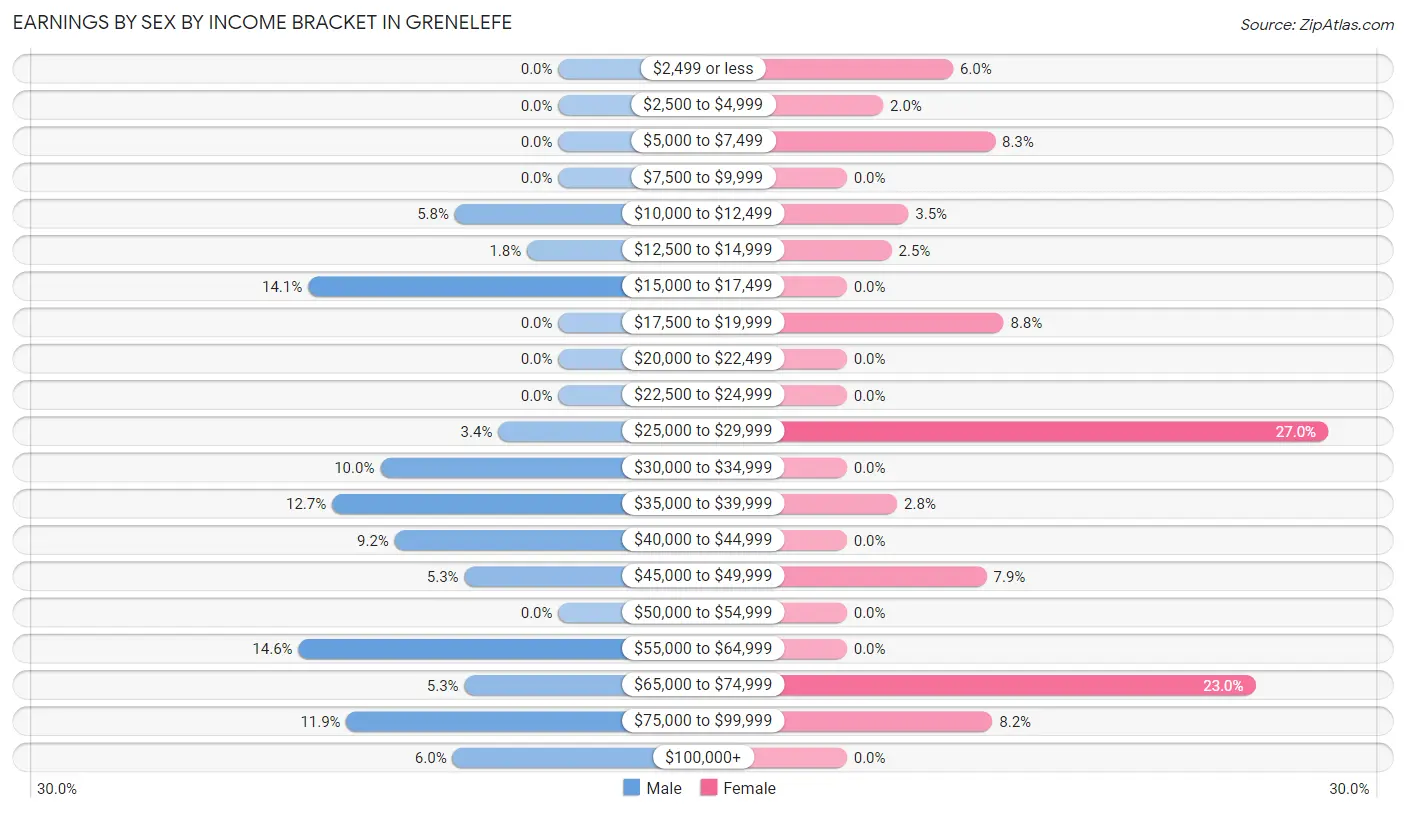
Earnings by Sex by Income Bracket in Grenelefe
The most common earnings brackets in Grenelefe are $55,000 to $64,999 for men (108 | 14.6%) and $25,000 to $29,999 for women (172 | 27.0%).
| Income | Male | Female |
| $2,499 or less | 0 (0.0%) | 38 (6.0%) |
| $2,500 to $4,999 | 0 (0.0%) | 13 (2.0%) |
| $5,000 to $7,499 | 0 (0.0%) | 53 (8.3%) |
| $7,500 to $9,999 | 0 (0.0%) | 0 (0.0%) |
| $10,000 to $12,499 | 43 (5.8%) | 22 (3.5%) |
| $12,500 to $14,999 | 13 (1.8%) | 16 (2.5%) |
| $15,000 to $17,499 | 104 (14.1%) | 0 (0.0%) |
| $17,500 to $19,999 | 0 (0.0%) | 56 (8.8%) |
| $20,000 to $22,499 | 0 (0.0%) | 0 (0.0%) |
| $22,500 to $24,999 | 0 (0.0%) | 0 (0.0%) |
| $25,000 to $29,999 | 25 (3.4%) | 172 (27.0%) |
| $30,000 to $34,999 | 74 (10.0%) | 0 (0.0%) |
| $35,000 to $39,999 | 94 (12.7%) | 18 (2.8%) |
| $40,000 to $44,999 | 68 (9.2%) | 0 (0.0%) |
| $45,000 to $49,999 | 39 (5.3%) | 50 (7.9%) |
| $50,000 to $54,999 | 0 (0.0%) | 0 (0.0%) |
| $55,000 to $64,999 | 108 (14.6%) | 0 (0.0%) |
| $65,000 to $74,999 | 39 (5.3%) | 146 (23.0%) |
| $75,000 to $99,999 | 88 (11.9%) | 52 (8.2%) |
| $100,000+ | 44 (5.9%) | 0 (0.0%) |
| Total | 739 (100.0%) | 636 (100.0%) |
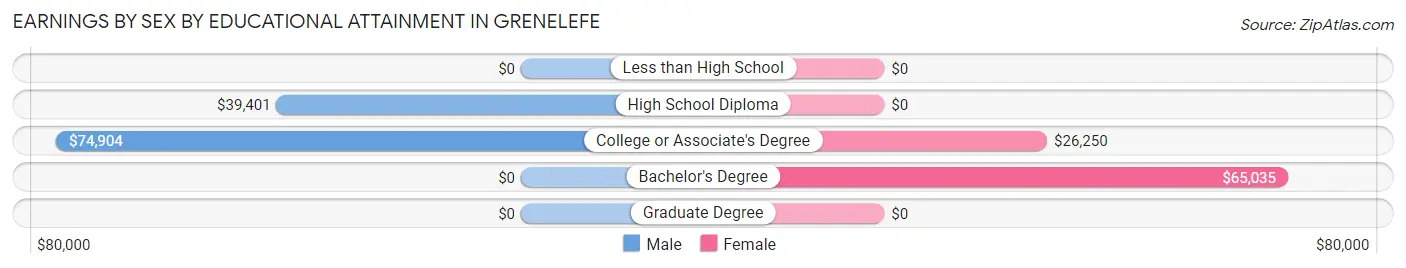
Earnings by Sex by Educational Attainment in Grenelefe
Average earnings in Grenelefe are $41,857 for men and $28,942 for women, a difference of 30.9%. Men with an educational attainment of college or associate's degree enjoy the highest average annual earnings of $74,904, while those with high school diploma education earn the least with $39,401. Women with an educational attainment of bachelor's degree earn the most with the average annual earnings of $65,035, while those with college or associate's degree education have the smallest earnings of $26,250.
| Educational Attainment | Male Income | Female Income |
| Less than High School | - | - |
| High School Diploma | $39,401 | $0 |
| College or Associate's Degree | $74,904 | $26,250 |
| Bachelor's Degree | - | - |
| Graduate Degree | - | - |
| Total | $41,857 | $28,942 |
Family Income in Grenelefe
Family Income Brackets in Grenelefe
According to the Grenelefe family income data, there are 237 families falling into the $100,000 to $149,999 income range, which is the most common income bracket and makes up 37.0% of all families.
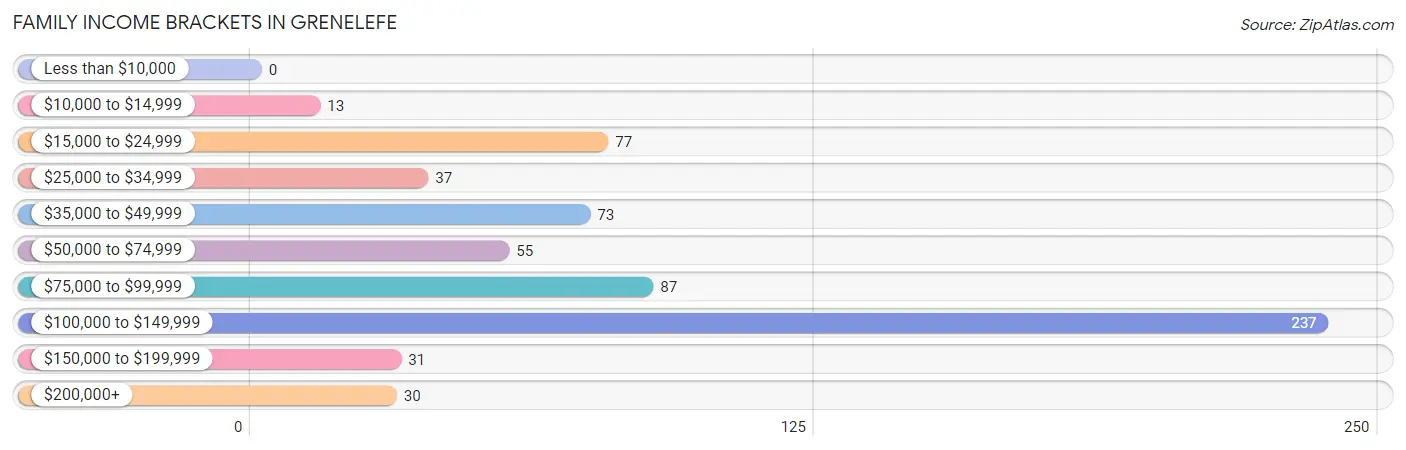
| Income Bracket | # Families | % Families |
| Less than $10,000 | 0 | 0.0% |
| $10,000 to $14,999 | 13 | 2.0% |
| $15,000 to $24,999 | 77 | 12.0% |
| $25,000 to $34,999 | 37 | 5.8% |
| $35,000 to $49,999 | 73 | 11.4% |
| $50,000 to $74,999 | 55 | 8.6% |
| $75,000 to $99,999 | 87 | 13.6% |
| $100,000 to $149,999 | 237 | 37.0% |
| $150,000 to $199,999 | 31 | 4.8% |
| $200,000+ | 30 | 4.7% |
Family Income by Famaliy Size in Grenelefe
4-person families (38 | 5.9%) account for the highest median family income in Grenelefe with $190,714 per family, while 2-person families (413 | 64.5%) have the highest median income of $56,422 per family member.
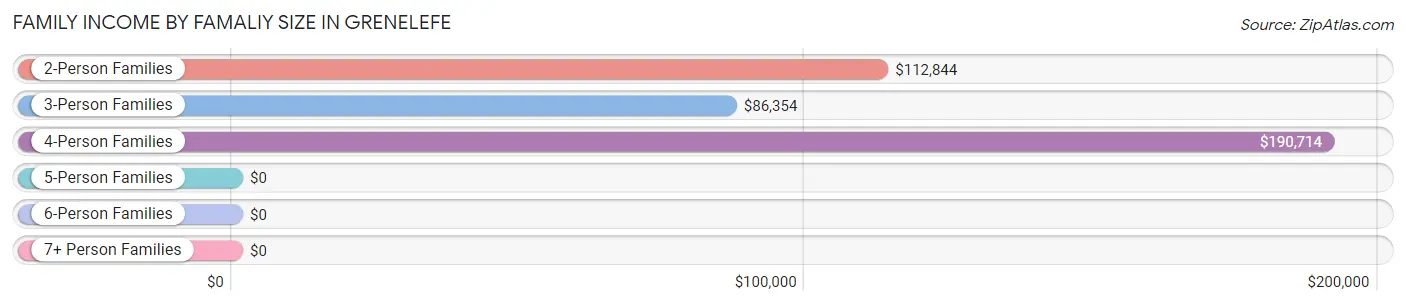
| Income Bracket | # Families | Median Income |
| 2-Person Families | 413 (64.5%) | $112,844 |
| 3-Person Families | 75 (11.7%) | $86,354 |
| 4-Person Families | 38 (5.9%) | $190,714 |
| 5-Person Families | 29 (4.5%) | $0 |
| 6-Person Families | 0 (0.0%) | $0 |
| 7+ Person Families | 85 (13.3%) | $0 |
| Total | 640 (100.0%) | $87,226 |
Family Income by Number of Earners in Grenelefe
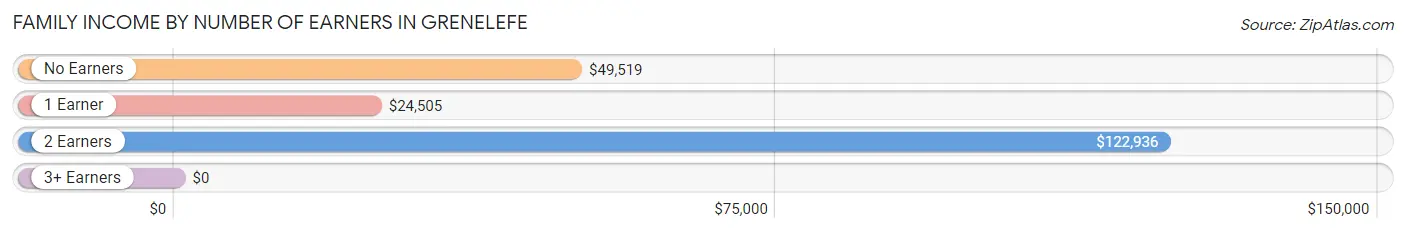
| Number of Earners | # Families | Median Income |
| No Earners | 127 (19.8%) | $49,519 |
| 1 Earner | 161 (25.2%) | $24,505 |
| 2 Earners | 315 (49.2%) | $122,936 |
| 3+ Earners | 37 (5.8%) | $0 |
| Total | 640 (100.0%) | $87,226 |
Household Income in Grenelefe
Household Income Brackets in Grenelefe
With 237 households falling in the category, the $100,000 to $149,999 income range is the most frequent in Grenelefe, accounting for 23.8% of all households.
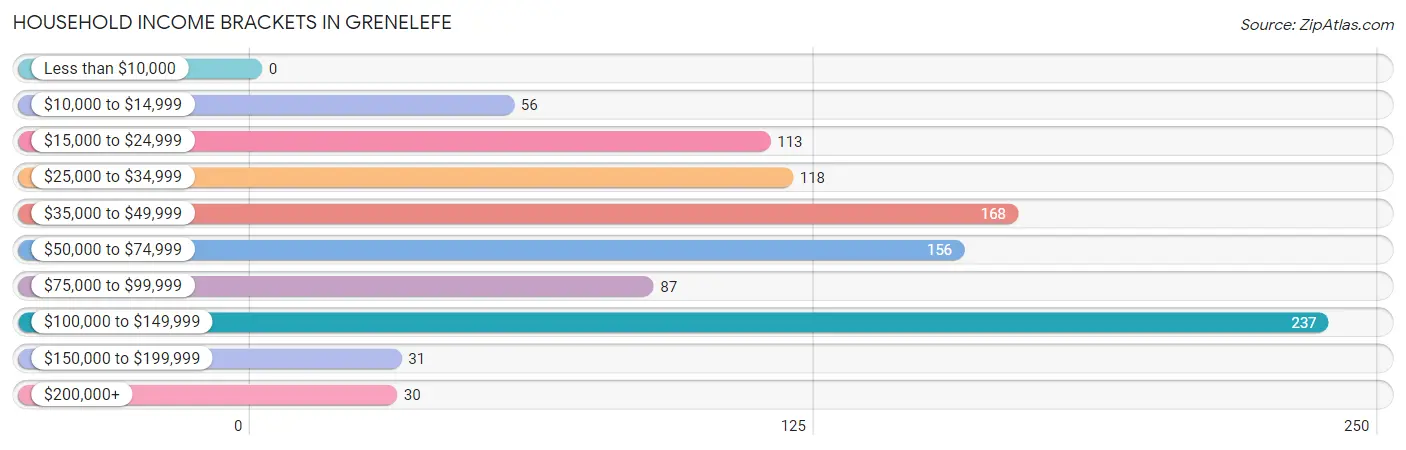
| Income Bracket | # Households | % Households |
| Less than $10,000 | 0 | 0.0% |
| $10,000 to $14,999 | 56 | 5.6% |
| $15,000 to $24,999 | 113 | 11.3% |
| $25,000 to $34,999 | 118 | 11.8% |
| $35,000 to $49,999 | 168 | 16.9% |
| $50,000 to $74,999 | 156 | 15.7% |
| $75,000 to $99,999 | 87 | 8.7% |
| $100,000 to $149,999 | 237 | 23.8% |
| $150,000 to $199,999 | 31 | 3.1% |
| $200,000+ | 30 | 3.0% |
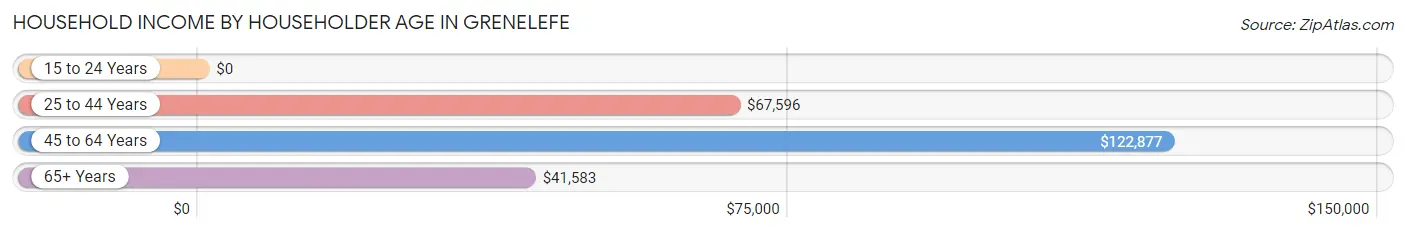
Household Income by Householder Age in Grenelefe
The median household income in Grenelefe is $57,692, with the highest median household income of $122,877 found in the 45 to 64 years age bracket for the primary householder. A total of 348 households (34.9%) fall into this category. Meanwhile, the 15 to 24 years age bracket for the primary householder has the lowest median household income of $0, with 91 households (9.1%) in this group.
| Income Bracket | # Households | Median Income |
| 15 to 24 Years | 91 (9.1%) | $0 |
| 25 to 44 Years | 301 (30.2%) | $67,596 |
| 45 to 64 Years | 348 (34.9%) | $122,877 |
| 65+ Years | 256 (25.7%) | $41,583 |
| Total | 996 (100.0%) | $57,692 |
Poverty in Grenelefe
Income Below Poverty by Sex and Age in Grenelefe
With 26.7% poverty level for males and 21.5% for females among the residents of Grenelefe, 16 and 17 year old males and under 5 year old females are the most vulnerable to poverty, with 54 males (100.0%) and 38 females (66.7%) in their respective age groups living below the poverty level.
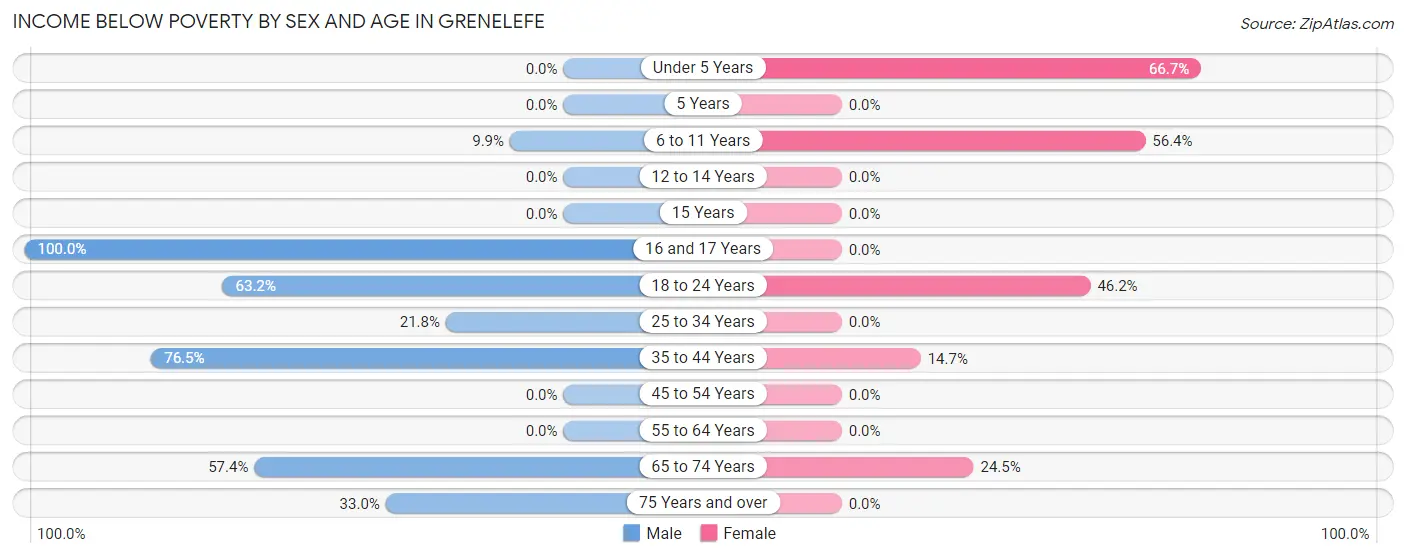
| Age Bracket | Male | Female |
| Under 5 Years | 0 (0.0%) | 38 (66.7%) |
| 5 Years | 0 (0.0%) | 0 (0.0%) |
| 6 to 11 Years | 14 (9.9%) | 173 (56.4%) |
| 12 to 14 Years | 0 (0.0%) | 0 (0.0%) |
| 15 Years | 0 (0.0%) | 0 (0.0%) |
| 16 and 17 Years | 54 (100.0%) | 0 (0.0%) |
| 18 to 24 Years | 43 (63.2%) | 48 (46.2%) |
| 25 to 34 Years | 48 (21.8%) | 0 (0.0%) |
| 35 to 44 Years | 117 (76.5%) | 29 (14.6%) |
| 45 to 54 Years | 0 (0.0%) | 0 (0.0%) |
| 55 to 64 Years | 0 (0.0%) | 0 (0.0%) |
| 65 to 74 Years | 35 (57.4%) | 56 (24.4%) |
| 75 Years and over | 62 (33.0%) | 0 (0.0%) |
| Total | 373 (26.7%) | 344 (21.5%) |
Income Above Poverty by Sex and Age in Grenelefe
According to the poverty statistics in Grenelefe, males aged under 5 years and females aged 12 to 14 years are the age groups that are most secure financially, with 100.0% of males and 100.0% of females in these age groups living above the poverty line.
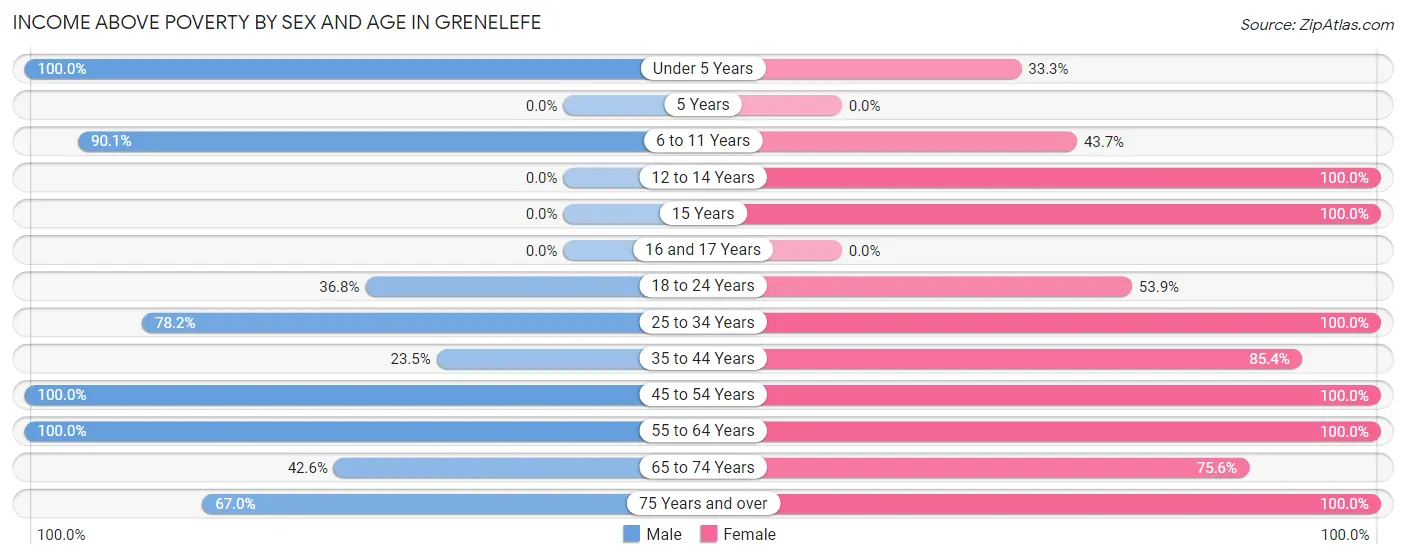
| Age Bracket | Male | Female |
| Under 5 Years | 109 (100.0%) | 19 (33.3%) |
| 5 Years | 0 (0.0%) | 0 (0.0%) |
| 6 to 11 Years | 127 (90.1%) | 134 (43.6%) |
| 12 to 14 Years | 0 (0.0%) | 89 (100.0%) |
| 15 Years | 0 (0.0%) | 24 (100.0%) |
| 16 and 17 Years | 0 (0.0%) | 0 (0.0%) |
| 18 to 24 Years | 25 (36.8%) | 56 (53.8%) |
| 25 to 34 Years | 172 (78.2%) | 267 (100.0%) |
| 35 to 44 Years | 36 (23.5%) | 169 (85.4%) |
| 45 to 54 Years | 234 (100.0%) | 199 (100.0%) |
| 55 to 64 Years | 171 (100.0%) | 57 (100.0%) |
| 65 to 74 Years | 26 (42.6%) | 173 (75.5%) |
| 75 Years and over | 126 (67.0%) | 65 (100.0%) |
| Total | 1,026 (73.3%) | 1,252 (78.4%) |
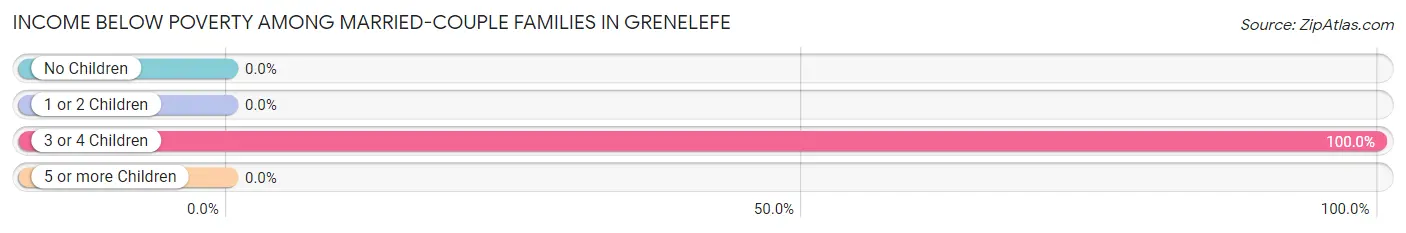
Income Below Poverty Among Married-Couple Families in Grenelefe
The poverty statistics for married-couple families in Grenelefe show that 5.9% or 29 of the total 492 families live below the poverty line. Families with 3 or 4 children have the highest poverty rate of 100.0%, comprising of 29 families. On the other hand, families with no children have the lowest poverty rate of 0.0%, which includes 0 families.
| Children | Above Poverty | Below Poverty |
| No Children | 331 (100.0%) | 0 (0.0%) |
| 1 or 2 Children | 95 (100.0%) | 0 (0.0%) |
| 3 or 4 Children | 0 (0.0%) | 29 (100.0%) |
| 5 or more Children | 37 (100.0%) | 0 (0.0%) |
| Total | 463 (94.1%) | 29 (5.9%) |
Income Below Poverty Among Single-Parent Households in Grenelefe
According to the poverty data in Grenelefe, 23.2% or 13 single-father households and 52.2% or 48 single-mother households are living below the poverty line. Among single-father households, those with 1 or 2 children have the highest poverty rate, with 13 households (100.0%) experiencing poverty. Likewise, among single-mother households, those with 3 or 4 children have the highest poverty rate, with 48 households (100.0%) falling below the poverty line.
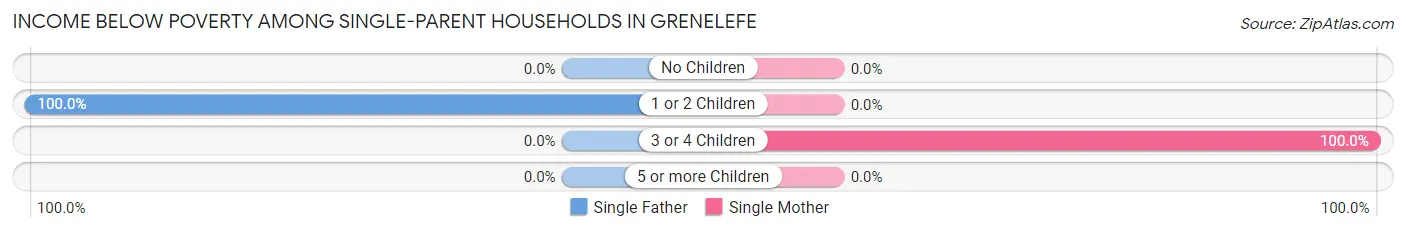
| Children | Single Father | Single Mother |
| No Children | 0 (0.0%) | 0 (0.0%) |
| 1 or 2 Children | 13 (100.0%) | 0 (0.0%) |
| 3 or 4 Children | 0 (0.0%) | 48 (100.0%) |
| 5 or more Children | 0 (0.0%) | 0 (0.0%) |
| Total | 13 (23.2%) | 48 (52.2%) |
Income Below Poverty Among Married-Couple vs Single-Parent Households in Grenelefe
The poverty data for Grenelefe shows that 29 of the married-couple family households (5.9%) and 61 of the single-parent households (41.2%) are living below the poverty level. Within the married-couple family households, those with 3 or 4 children have the highest poverty rate, with 29 households (100.0%) falling below the poverty line. Among the single-parent households, those with 3 or 4 children have the highest poverty rate, with 48 household (100.0%) living below poverty.
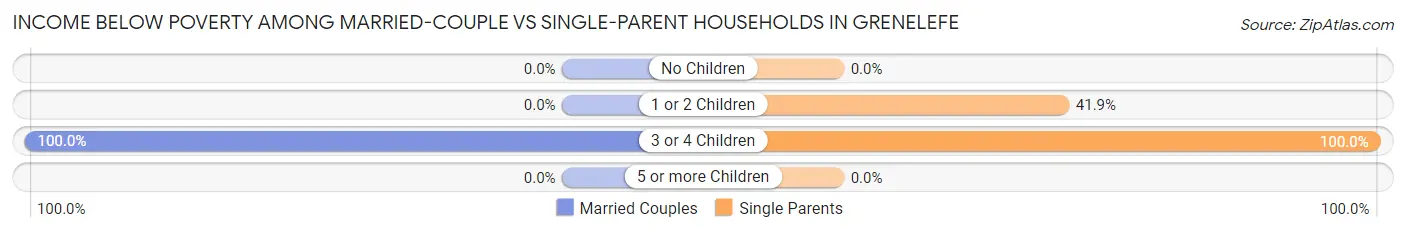
| Children | Married-Couple Families | Single-Parent Households |
| No Children | 0 (0.0%) | 0 (0.0%) |
| 1 or 2 Children | 0 (0.0%) | 13 (41.9%) |
| 3 or 4 Children | 29 (100.0%) | 48 (100.0%) |
| 5 or more Children | 0 (0.0%) | 0 (0.0%) |
| Total | 29 (5.9%) | 61 (41.2%) |
Race in Grenelefe
The most populous races in Grenelefe are White / Caucasian (2,253 | 75.2%), Hispanic or Latino (1,318 | 44.0%), and Some other Race (552 | 18.4%).
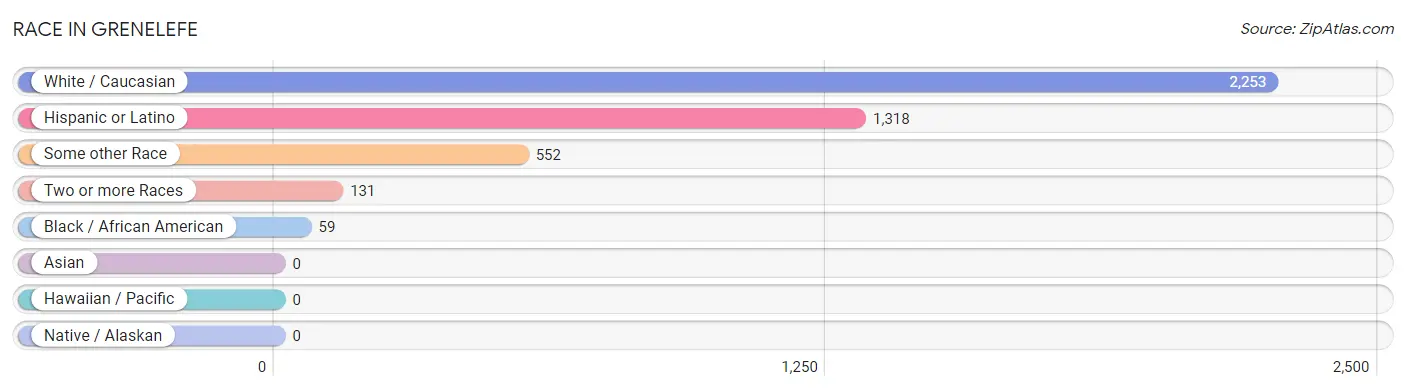
| Race | # Population | % Population |
| Asian | 0 | 0.0% |
| Black / African American | 59 | 2.0% |
| Hawaiian / Pacific | 0 | 0.0% |
| Hispanic or Latino | 1,318 | 44.0% |
| Native / Alaskan | 0 | 0.0% |
| White / Caucasian | 2,253 | 75.2% |
| Two or more Races | 131 | 4.4% |
| Some other Race | 552 | 18.4% |
| Total | 2,995 | 100.0% |
Ancestry in Grenelefe
The most populous ancestries reported in Grenelefe are Puerto Rican (1,061 | 35.4%), American (677 | 22.6%), Irish (169 | 5.6%), English (164 | 5.5%), and German (111 | 3.7%), together accounting for 72.9% of all Grenelefe residents.
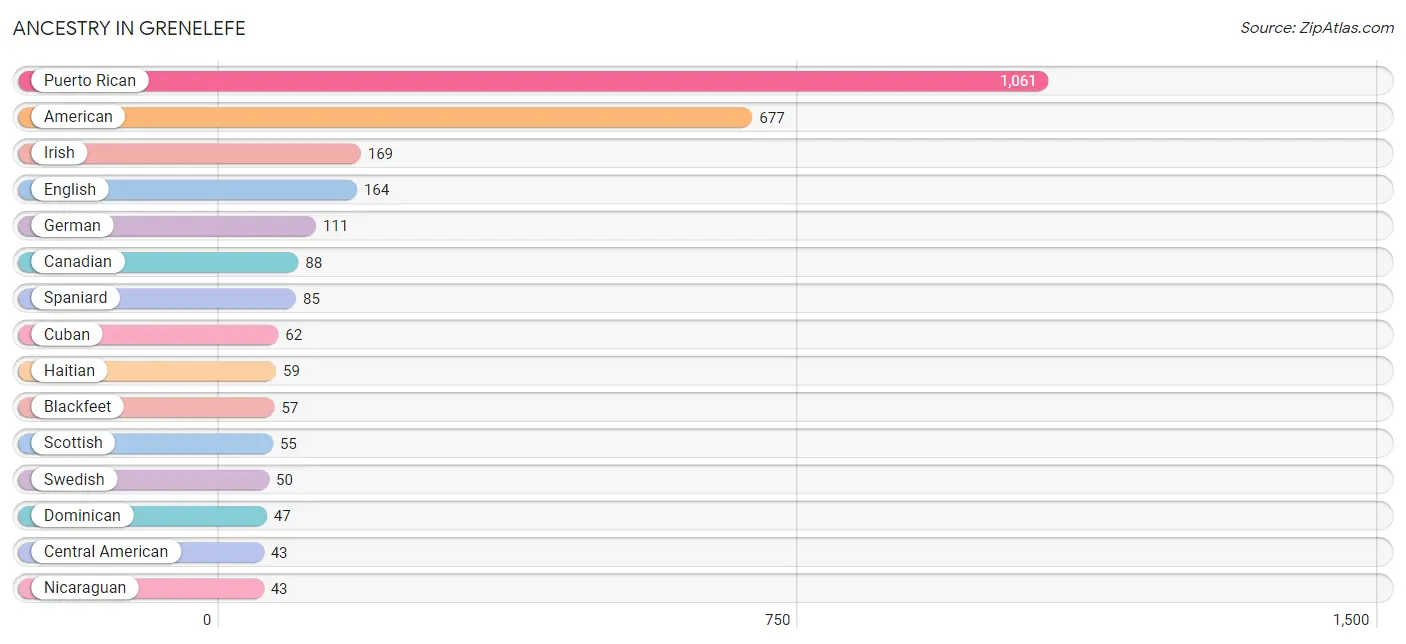
| Ancestry | # Population | % Population |
| American | 677 | 22.6% |
| Blackfeet | 57 | 1.9% |
| Canadian | 88 | 2.9% |
| Central American | 43 | 1.4% |
| Cuban | 62 | 2.1% |
| Dominican | 47 | 1.6% |
| Dutch | 19 | 0.6% |
| English | 164 | 5.5% |
| French | 33 | 1.1% |
| German | 111 | 3.7% |
| Haitian | 59 | 2.0% |
| Irish | 169 | 5.6% |
| Italian | 40 | 1.3% |
| Mexican | 20 | 0.7% |
| Nicaraguan | 43 | 1.4% |
| Pennsylvania German | 12 | 0.4% |
| Polish | 27 | 0.9% |
| Puerto Rican | 1,061 | 35.4% |
| Russian | 41 | 1.4% |
| Scotch-Irish | 23 | 0.8% |
| Scottish | 55 | 1.8% |
| Spaniard | 85 | 2.8% |
| Swedish | 50 | 1.7% |
| Welsh | 39 | 1.3% |
| West Indian | 19 | 0.6% | View All 25 Rows |
Immigrants in Grenelefe
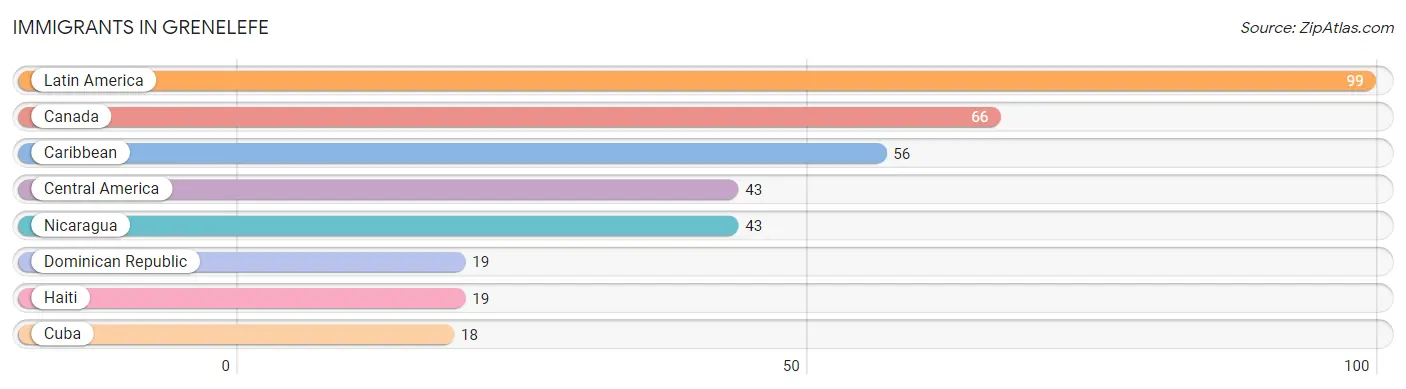
The most numerous immigrant groups reported in Grenelefe came from Latin America (99 | 3.3%), Canada (66 | 2.2%), Caribbean (56 | 1.9%), Central America (43 | 1.4%), and Nicaragua (43 | 1.4%), together accounting for 10.3% of all Grenelefe residents.
| Immigration Origin | # Population | % Population |
| Canada | 66 | 2.2% |
| Caribbean | 56 | 1.9% |
| Central America | 43 | 1.4% |
| Cuba | 18 | 0.6% |
| Dominican Republic | 19 | 0.6% |
| Haiti | 19 | 0.6% |
| Latin America | 99 | 3.3% |
| Nicaragua | 43 | 1.4% | View All 8 Rows |
Sex and Age in Grenelefe
Sex and Age in Grenelefe
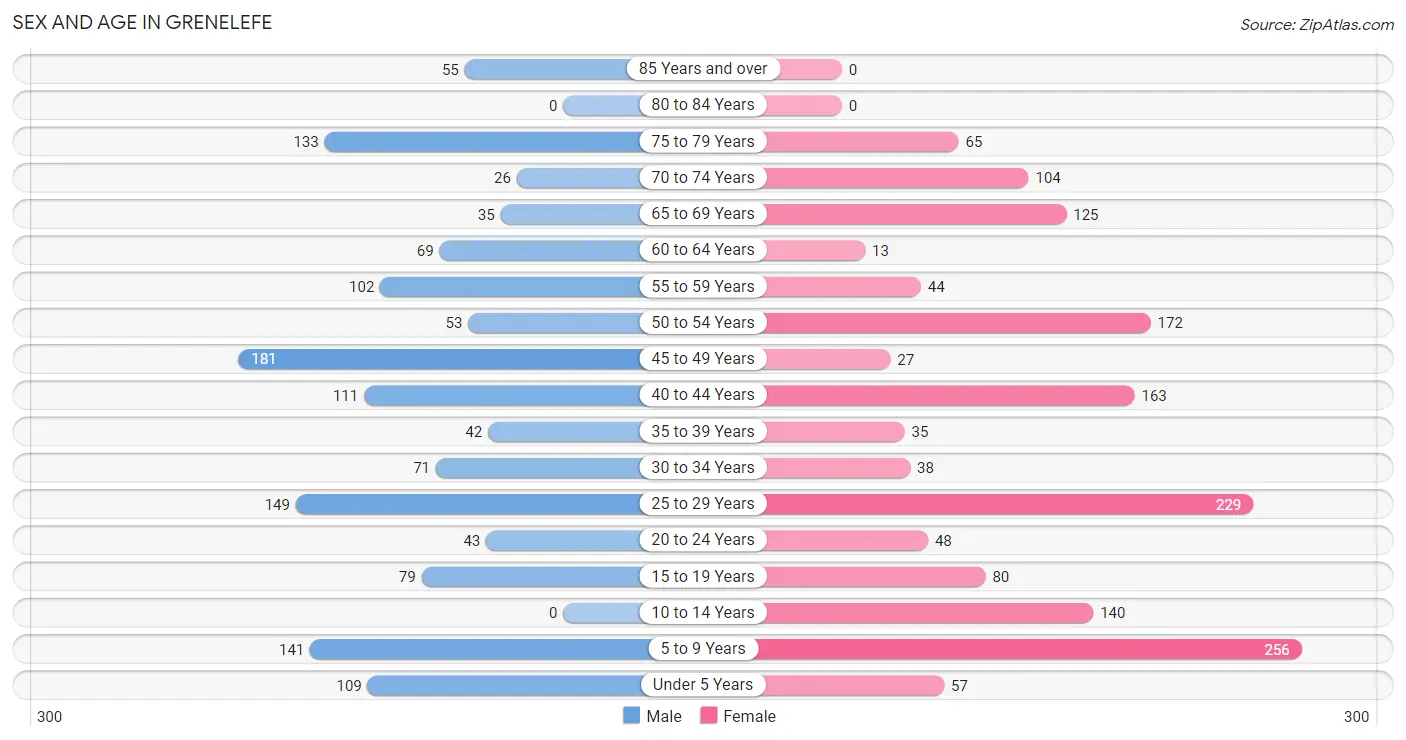
The most populous age groups in Grenelefe are 45 to 49 Years (181 | 12.9%) for men and 5 to 9 Years (256 | 16.0%) for women.
| Age Bracket | Male | Female |
| Under 5 Years | 109 (7.8%) | 57 (3.6%) |
| 5 to 9 Years | 141 (10.1%) | 256 (16.0%) |
| 10 to 14 Years | 0 (0.0%) | 140 (8.8%) |
| 15 to 19 Years | 79 (5.7%) | 80 (5.0%) |
| 20 to 24 Years | 43 (3.1%) | 48 (3.0%) |
| 25 to 29 Years | 149 (10.6%) | 229 (14.3%) |
| 30 to 34 Years | 71 (5.1%) | 38 (2.4%) |
| 35 to 39 Years | 42 (3.0%) | 35 (2.2%) |
| 40 to 44 Years | 111 (7.9%) | 163 (10.2%) |
| 45 to 49 Years | 181 (12.9%) | 27 (1.7%) |
| 50 to 54 Years | 53 (3.8%) | 172 (10.8%) |
| 55 to 59 Years | 102 (7.3%) | 44 (2.8%) |
| 60 to 64 Years | 69 (4.9%) | 13 (0.8%) |
| 65 to 69 Years | 35 (2.5%) | 125 (7.8%) |
| 70 to 74 Years | 26 (1.9%) | 104 (6.5%) |
| 75 to 79 Years | 133 (9.5%) | 65 (4.1%) |
| 80 to 84 Years | 0 (0.0%) | 0 (0.0%) |
| 85 Years and over | 55 (3.9%) | 0 (0.0%) |
| Total | 1,399 (100.0%) | 1,596 (100.0%) |
Families and Households in Grenelefe
Median Family Size in Grenelefe
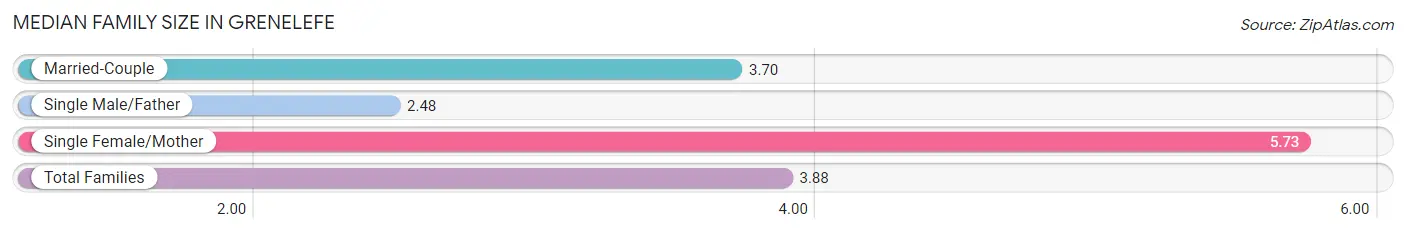
The median family size in Grenelefe is 3.88 persons per family, with single female/mother families (92 | 14.4%) accounting for the largest median family size of 5.73 persons per family. On the other hand, single male/father families (56 | 8.7%) represent the smallest median family size with 2.48 persons per family.
| Family Type | # Families | Family Size |
| Married-Couple | 492 (76.9%) | 3.70 |
| Single Male/Father | 56 (8.7%) | 2.48 |
| Single Female/Mother | 92 (14.4%) | 5.73 |
| Total Families | 640 (100.0%) | 3.88 |
Median Household Size in Grenelefe
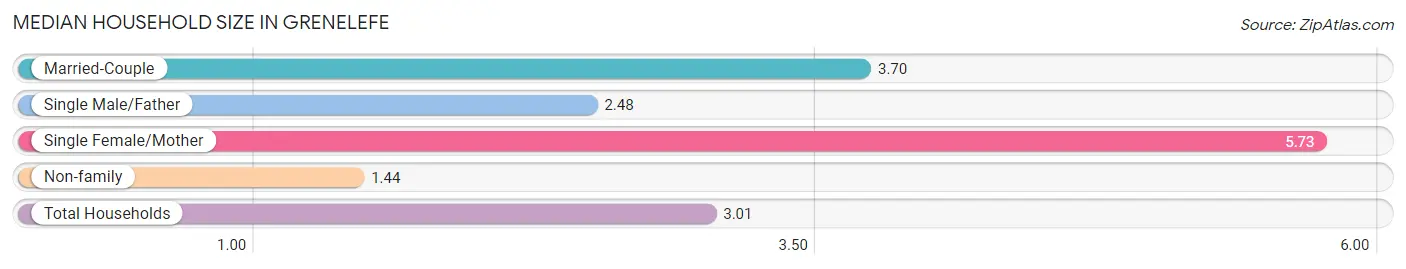
The median household size in Grenelefe is 3.01 persons per household, with single female/mother households (92 | 9.2%) accounting for the largest median household size of 5.73 persons per household. non-family households (356 | 35.7%) represent the smallest median household size with 1.44 persons per household.
| Household Type | # Households | Household Size |
| Married-Couple | 492 (49.4%) | 3.70 |
| Single Male/Father | 56 (5.6%) | 2.48 |
| Single Female/Mother | 92 (9.2%) | 5.73 |
| Non-family | 356 (35.7%) | 1.44 |
| Total Households | 996 (100.0%) | 3.01 |
Household Size by Marriage Status in Grenelefe
Out of a total of 996 households in Grenelefe, 640 (64.3%) are family households, while 356 (35.7%) are nonfamily households. The most numerous type of family households are 2-person households, comprising 413, and the most common type of nonfamily households are 1-person households, comprising 211.
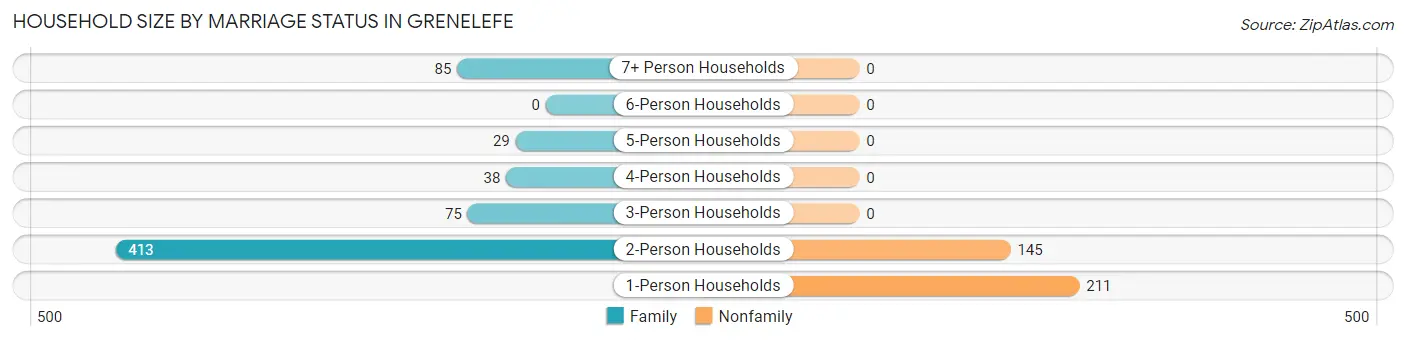
| Household Size | Family Households | Nonfamily Households |
| 1-Person Households | - | 211 (21.2%) |
| 2-Person Households | 413 (41.5%) | 145 (14.6%) |
| 3-Person Households | 75 (7.5%) | 0 (0.0%) |
| 4-Person Households | 38 (3.8%) | 0 (0.0%) |
| 5-Person Households | 29 (2.9%) | 0 (0.0%) |
| 6-Person Households | 0 (0.0%) | 0 (0.0%) |
| 7+ Person Households | 85 (8.5%) | 0 (0.0%) |
| Total | 640 (64.3%) | 356 (35.7%) |
Female Fertility in Grenelefe
Fertility by Age in Grenelefe
Average fertility rate in Grenelefe is 32.0 births per 1,000 women. Women in the age bracket of 20 to 34 years have the highest fertility rate with 63.0 births per 1,000 women. Women in the age bracket of 20 to 34 years acount for 100.0% of all women with births.
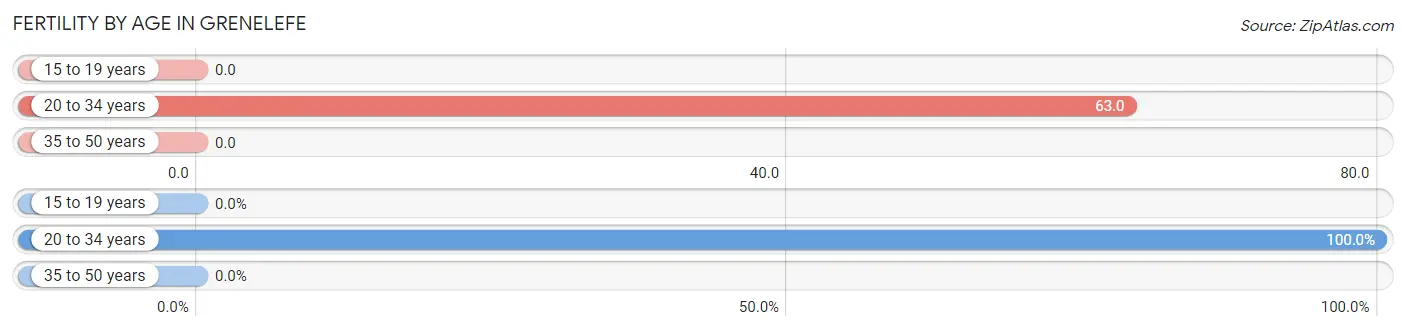
| Age Bracket | Women with Births | Births / 1,000 Women |
| 15 to 19 years | 0 (0.0%) | 0.0 |
| 20 to 34 years | 20 (100.0%) | 63.0 |
| 35 to 50 years | 0 (0.0%) | 0.0 |
| Total | 20 (100.0%) | 32.0 |
Fertility by Age by Marriage Status in Grenelefe
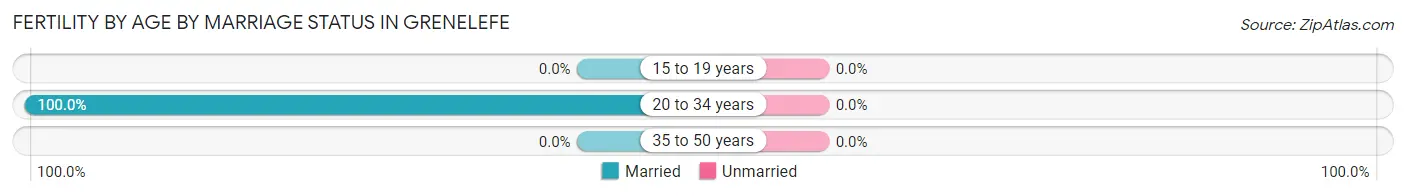
| Age Bracket | Married | Unmarried |
| 15 to 19 years | 0 (0.0%) | 0 (0.0%) |
| 20 to 34 years | 20 (100.0%) | 0 (0.0%) |
| 35 to 50 years | 0 (0.0%) | 0 (0.0%) |
| Total | 20 (100.0%) | 0 (0.0%) |
Fertility by Education in Grenelefe
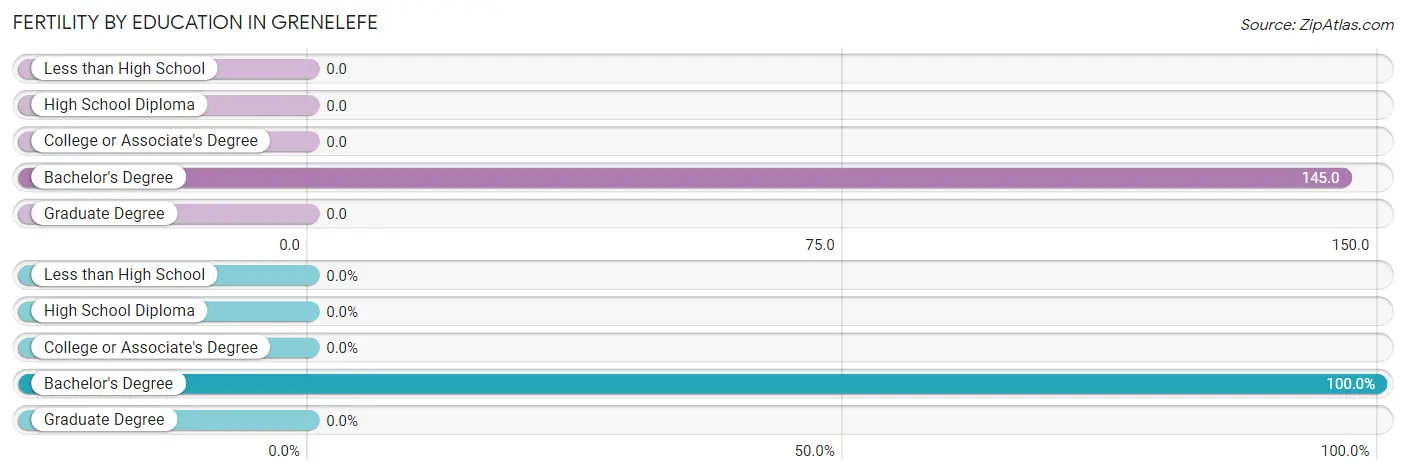
| Educational Attainment | Women with Births | Births / 1,000 Women |
| Less than High School | 0 (0.0%) | 0.0 |
| High School Diploma | 0 (0.0%) | 0.0 |
| College or Associate's Degree | 0 (0.0%) | 0.0 |
| Bachelor's Degree | 20 (100.0%) | 145.0 |
| Graduate Degree | 0 (0.0%) | 0.0 |
| Total | 20 (100.0%) | 32.0 |
Fertility by Education by Marriage Status in Grenelefe
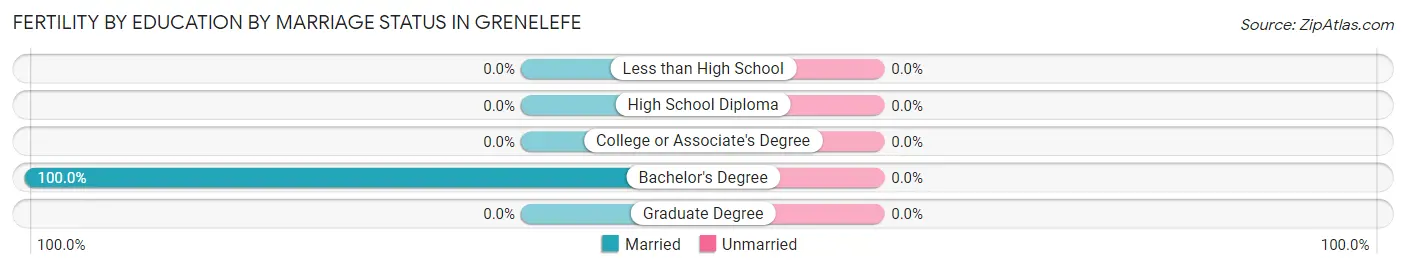
| Educational Attainment | Married | Unmarried |
| Less than High School | 0 (0.0%) | 0 (0.0%) |
| High School Diploma | 0 (0.0%) | 0 (0.0%) |
| College or Associate's Degree | 0 (0.0%) | 0 (0.0%) |
| Bachelor's Degree | 20 (100.0%) | 0 (0.0%) |
| Graduate Degree | 0 (0.0%) | 0 (0.0%) |
| Total | 20 (100.0%) | 0 (0.0%) |
Employment Characteristics in Grenelefe
Employment by Class of Employer in Grenelefe
Among the 1,359 employed individuals in Grenelefe, private company employees (963 | 70.9%), self-employed (incorporated) (146 | 10.7%), and local government employees (120 | 8.8%) make up the most common classes of employment.
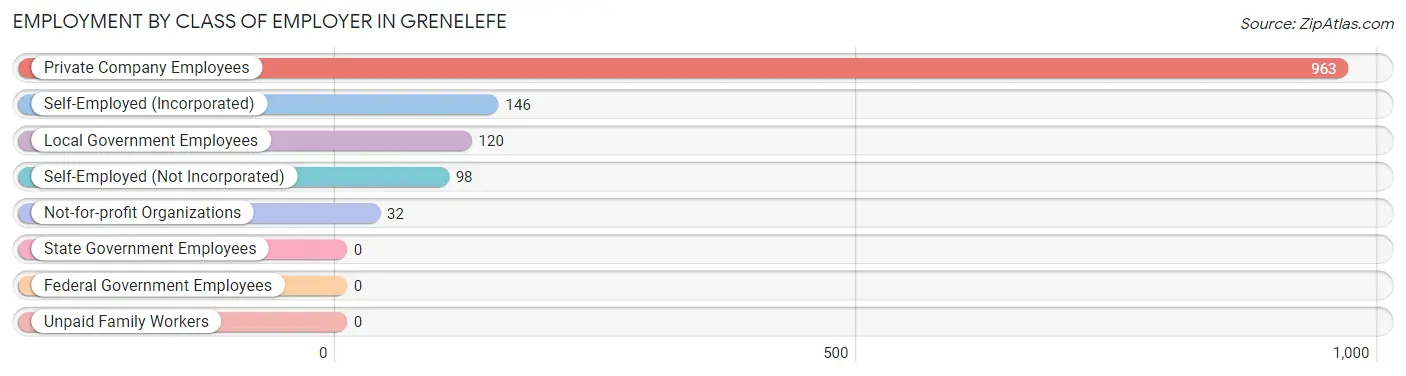
| Employer Class | # Employees | % Employees |
| Private Company Employees | 963 | 70.9% |
| Self-Employed (Incorporated) | 146 | 10.7% |
| Self-Employed (Not Incorporated) | 98 | 7.2% |
| Not-for-profit Organizations | 32 | 2.4% |
| Local Government Employees | 120 | 8.8% |
| State Government Employees | 0 | 0.0% |
| Federal Government Employees | 0 | 0.0% |
| Unpaid Family Workers | 0 | 0.0% |
| Total | 1,359 | 100.0% |
Employment Status by Age in Grenelefe
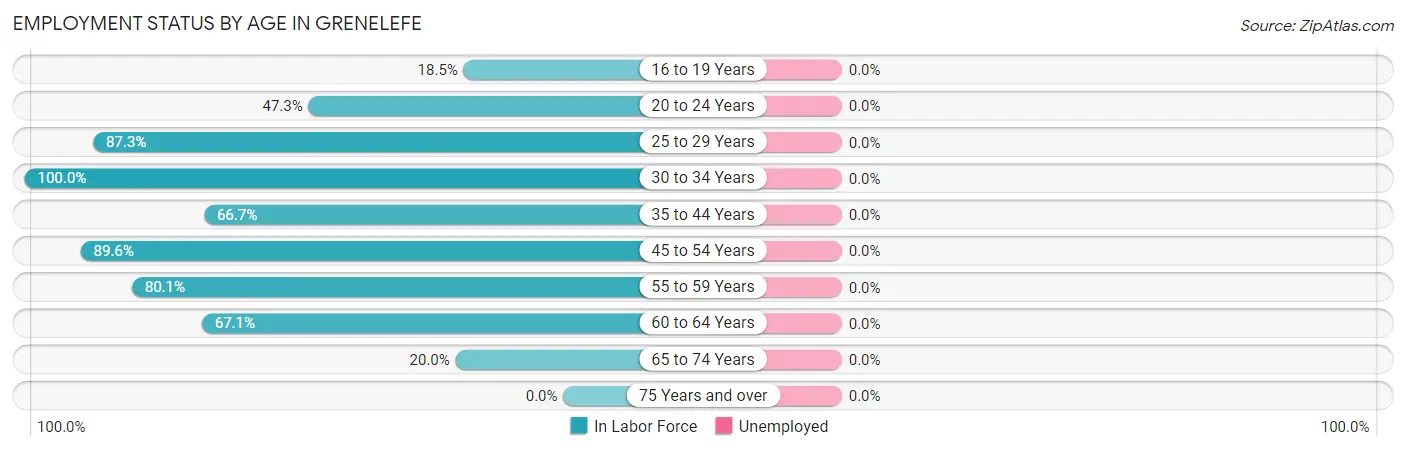
| Age Bracket | In Labor Force | Unemployed |
| 16 to 19 Years | 25 (18.5%) | 0 (0.0%) |
| 20 to 24 Years | 43 (47.3%) | 0 (0.0%) |
| 25 to 29 Years | 330 (87.3%) | 0 (0.0%) |
| 30 to 34 Years | 109 (100.0%) | 0 (0.0%) |
| 35 to 44 Years | 234 (66.7%) | 0 (0.0%) |
| 45 to 54 Years | 388 (89.6%) | 0 (0.0%) |
| 55 to 59 Years | 117 (80.1%) | 0 (0.0%) |
| 60 to 64 Years | 55 (67.1%) | 0 (0.0%) |
| 65 to 74 Years | 58 (20.0%) | 0 (0.0%) |
| 75 Years and over | 0 (0.0%) | 0 (0.0%) |
| Total | 1,359 (59.9%) | 0 (0.0%) |
Employment Status by Educational Attainment in Grenelefe
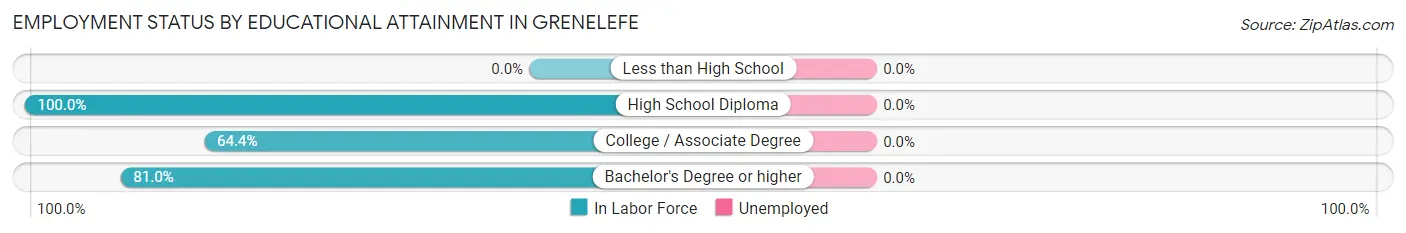
| Educational Attainment | In Labor Force | Unemployed |
| Less than High School | 0 (0.0%) | 0 (0.0%) |
| High School Diploma | 532 (100.0%) | 0 (0.0%) |
| College / Associate Degree | 318 (64.4%) | 0 (0.0%) |
| Bachelor's Degree or higher | 383 (81.0%) | 0 (0.0%) |
| Total | 1,234 (82.3%) | 0 (0.0%) |
Employment Occupations by Sex in Grenelefe
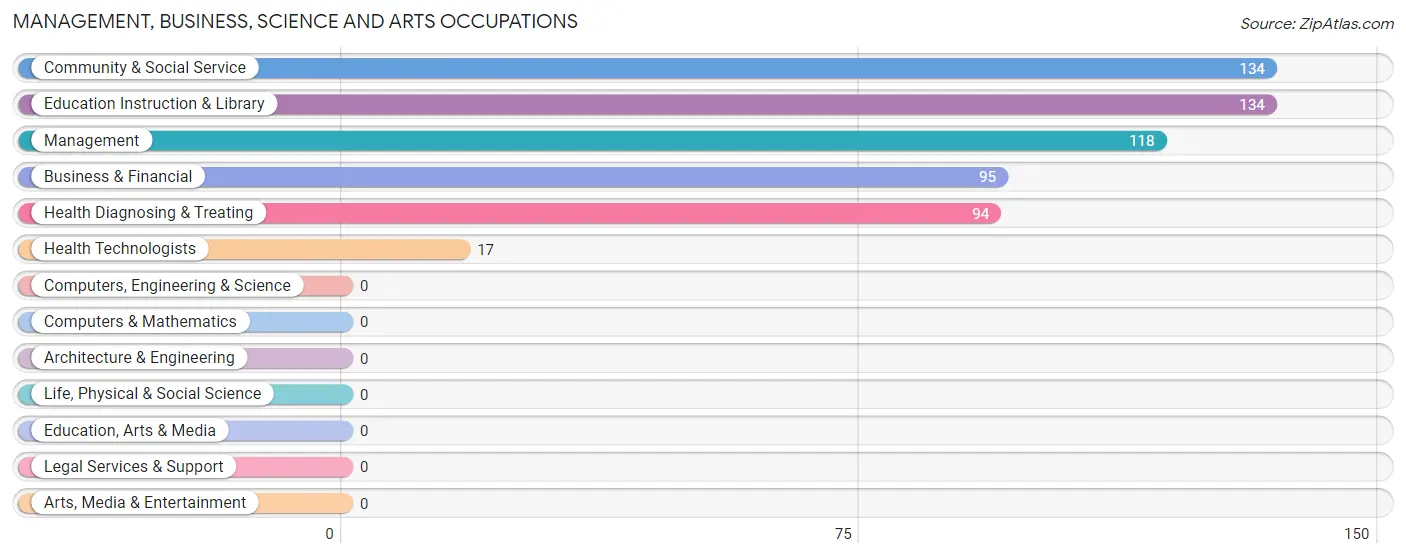
Management, Business, Science and Arts Occupations
The most common Management, Business, Science and Arts occupations in Grenelefe are Community & Social Service (134 | 9.9%), Education Instruction & Library (134 | 9.9%), Management (118 | 8.7%), Business & Financial (95 | 7.0%), and Health Diagnosing & Treating (94 | 6.9%).
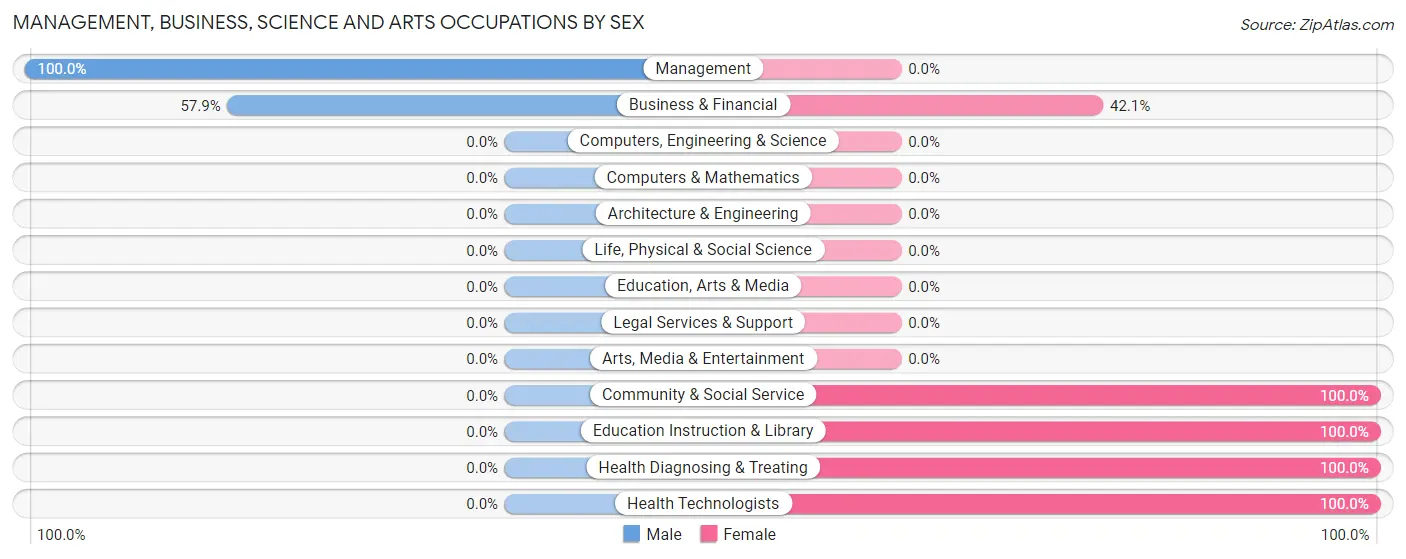
Management, Business, Science and Arts Occupations by Sex
Within the Management, Business, Science and Arts occupations in Grenelefe, the most male-oriented occupations are Management (100.0%), and Business & Financial (57.9%), while the most female-oriented occupations are Community & Social Service (100.0%), Education Instruction & Library (100.0%), and Health Diagnosing & Treating (100.0%).
| Occupation | Male | Female |
| Management | 118 (100.0%) | 0 (0.0%) |
| Business & Financial | 55 (57.9%) | 40 (42.1%) |
| Computers, Engineering & Science | 0 (0.0%) | 0 (0.0%) |
| Computers & Mathematics | 0 (0.0%) | 0 (0.0%) |
| Architecture & Engineering | 0 (0.0%) | 0 (0.0%) |
| Life, Physical & Social Science | 0 (0.0%) | 0 (0.0%) |
| Community & Social Service | 0 (0.0%) | 134 (100.0%) |
| Education, Arts & Media | 0 (0.0%) | 0 (0.0%) |
| Legal Services & Support | 0 (0.0%) | 0 (0.0%) |
| Education Instruction & Library | 0 (0.0%) | 134 (100.0%) |
| Arts, Media & Entertainment | 0 (0.0%) | 0 (0.0%) |
| Health Diagnosing & Treating | 0 (0.0%) | 94 (100.0%) |
| Health Technologists | 0 (0.0%) | 17 (100.0%) |
| Total (Category) | 173 (39.2%) | 268 (60.8%) |
| Total (Overall) | 739 (54.4%) | 620 (45.6%) |
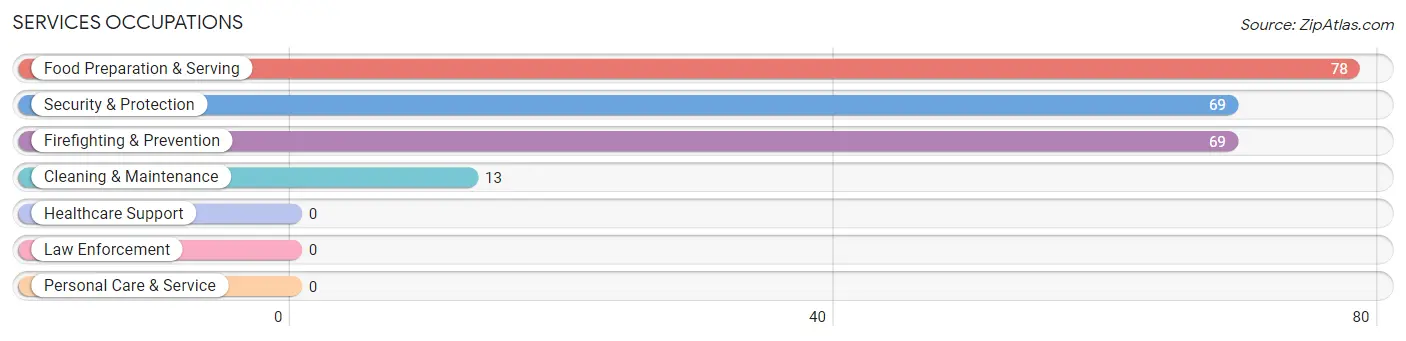
Services Occupations
The most common Services occupations in Grenelefe are Food Preparation & Serving (78 | 5.7%), Security & Protection (69 | 5.1%), Firefighting & Prevention (69 | 5.1%), and Cleaning & Maintenance (13 | 1.0%).
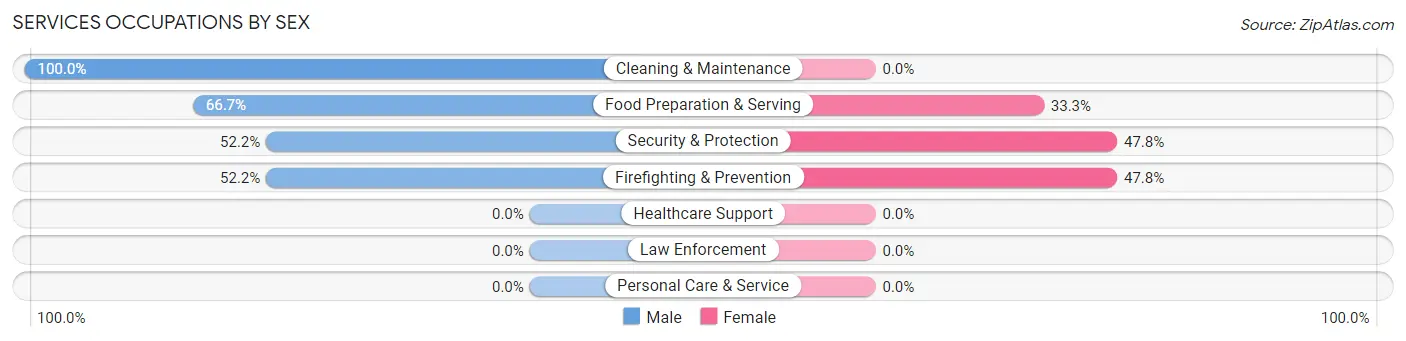
Services Occupations by Sex
Within the Services occupations in Grenelefe, the most male-oriented occupations are Cleaning & Maintenance (100.0%), Food Preparation & Serving (66.7%), and Security & Protection (52.2%), while the most female-oriented occupations are Security & Protection (47.8%), Firefighting & Prevention (47.8%), and Food Preparation & Serving (33.3%).
| Occupation | Male | Female |
| Healthcare Support | 0 (0.0%) | 0 (0.0%) |
| Security & Protection | 36 (52.2%) | 33 (47.8%) |
| Firefighting & Prevention | 36 (52.2%) | 33 (47.8%) |
| Law Enforcement | 0 (0.0%) | 0 (0.0%) |
| Food Preparation & Serving | 52 (66.7%) | 26 (33.3%) |
| Cleaning & Maintenance | 13 (100.0%) | 0 (0.0%) |
| Personal Care & Service | 0 (0.0%) | 0 (0.0%) |
| Total (Category) | 101 (63.1%) | 59 (36.9%) |
| Total (Overall) | 739 (54.4%) | 620 (45.6%) |
Sales and Office Occupations
The most common Sales and Office occupations in Grenelefe are Office & Administration (183 | 13.5%), and Sales & Related (128 | 9.4%).
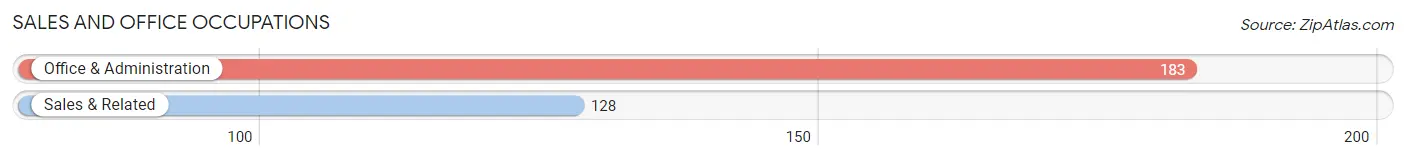
Sales and Office Occupations by Sex
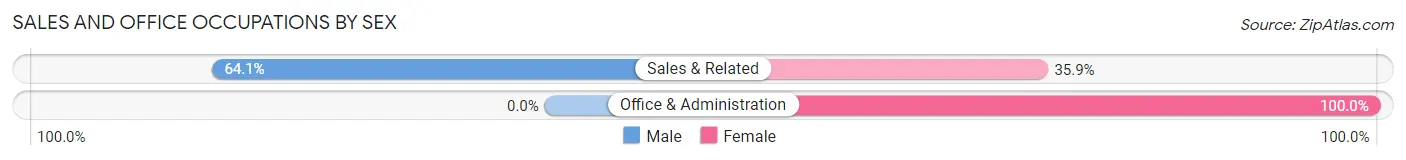
| Occupation | Male | Female |
| Sales & Related | 82 (64.1%) | 46 (35.9%) |
| Office & Administration | 0 (0.0%) | 183 (100.0%) |
| Total (Category) | 82 (26.4%) | 229 (73.6%) |
| Total (Overall) | 739 (54.4%) | 620 (45.6%) |
Natural Resources, Construction and Maintenance Occupations
The most common Natural Resources, Construction and Maintenance occupations in Grenelefe are Construction & Extraction (137 | 10.1%), and Installation, Maintenance & Repair (39 | 2.9%).
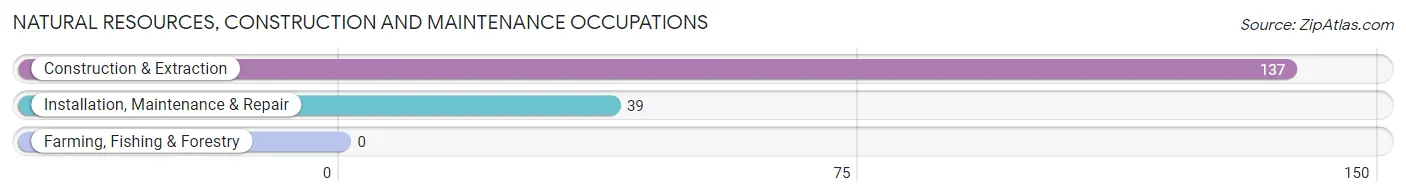
Natural Resources, Construction and Maintenance Occupations by Sex
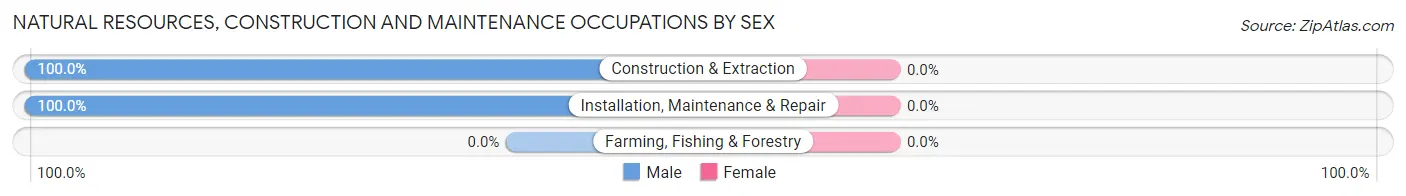
| Occupation | Male | Female |
| Farming, Fishing & Forestry | 0 (0.0%) | 0 (0.0%) |
| Construction & Extraction | 137 (100.0%) | 0 (0.0%) |
| Installation, Maintenance & Repair | 39 (100.0%) | 0 (0.0%) |
| Total (Category) | 176 (100.0%) | 0 (0.0%) |
| Total (Overall) | 739 (54.4%) | 620 (45.6%) |
Production, Transportation and Moving Occupations
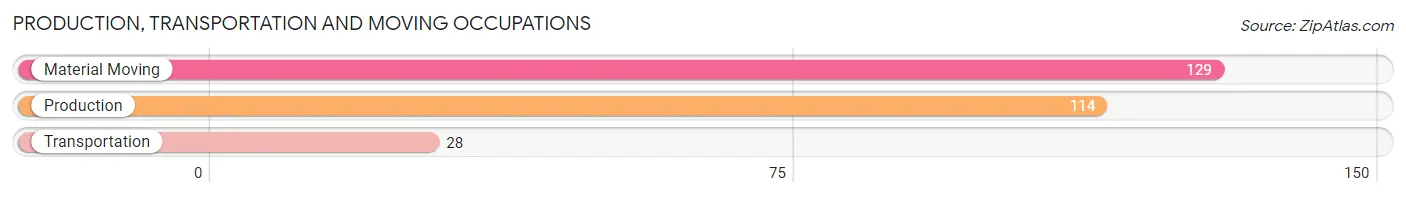
The most common Production, Transportation and Moving occupations in Grenelefe are Material Moving (129 | 9.5%), Production (114 | 8.4%), and Transportation (28 | 2.1%).
Production, Transportation and Moving Occupations by Sex
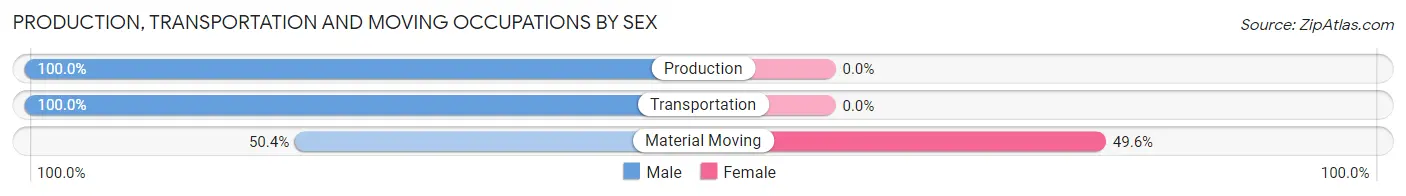
| Occupation | Male | Female |
| Production | 114 (100.0%) | 0 (0.0%) |
| Transportation | 28 (100.0%) | 0 (0.0%) |
| Material Moving | 65 (50.4%) | 64 (49.6%) |
| Total (Category) | 207 (76.4%) | 64 (23.6%) |
| Total (Overall) | 739 (54.4%) | 620 (45.6%) |
Employment Industries by Sex in Grenelefe
Employment Industries in Grenelefe
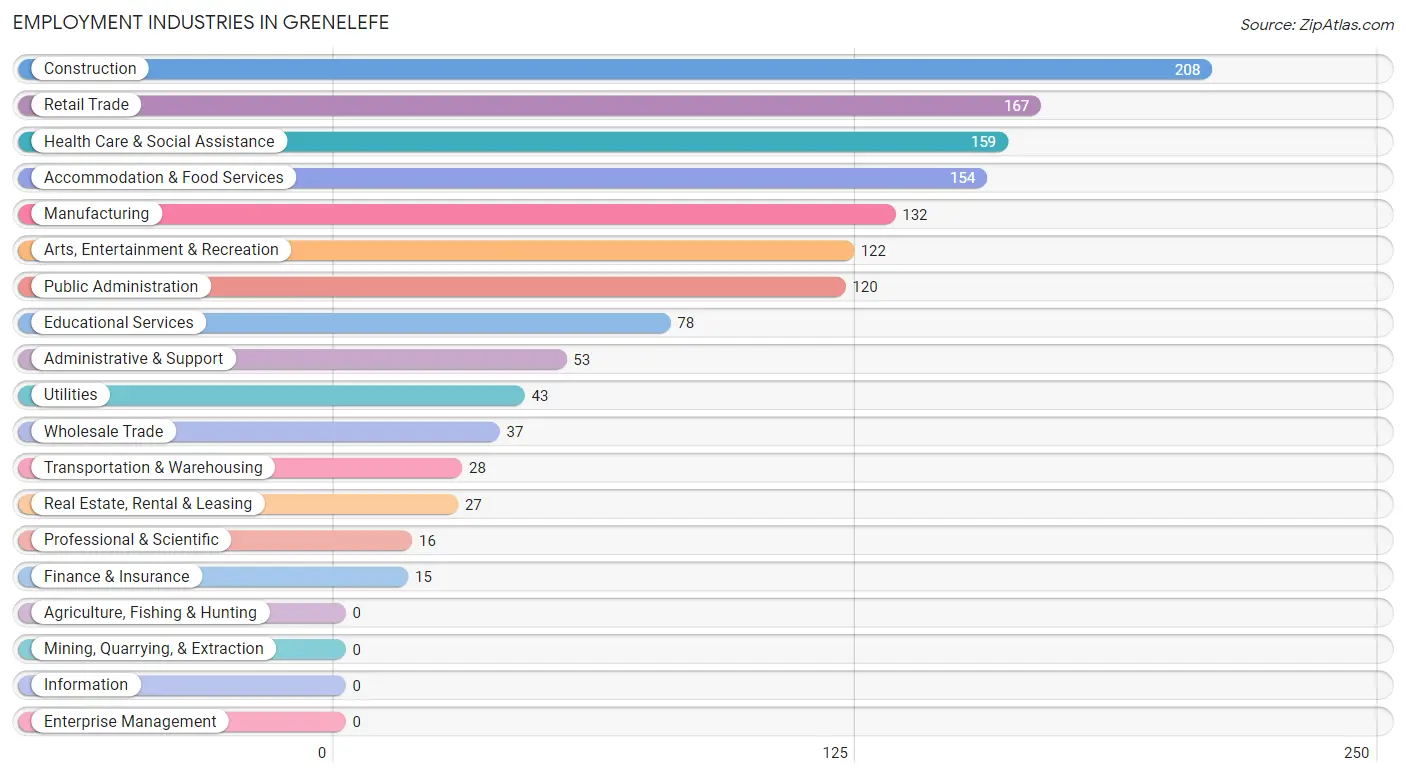
The major employment industries in Grenelefe include Construction (208 | 15.3%), Retail Trade (167 | 12.3%), Health Care & Social Assistance (159 | 11.7%), Accommodation & Food Services (154 | 11.3%), and Manufacturing (132 | 9.7%).
Employment Industries by Sex in Grenelefe
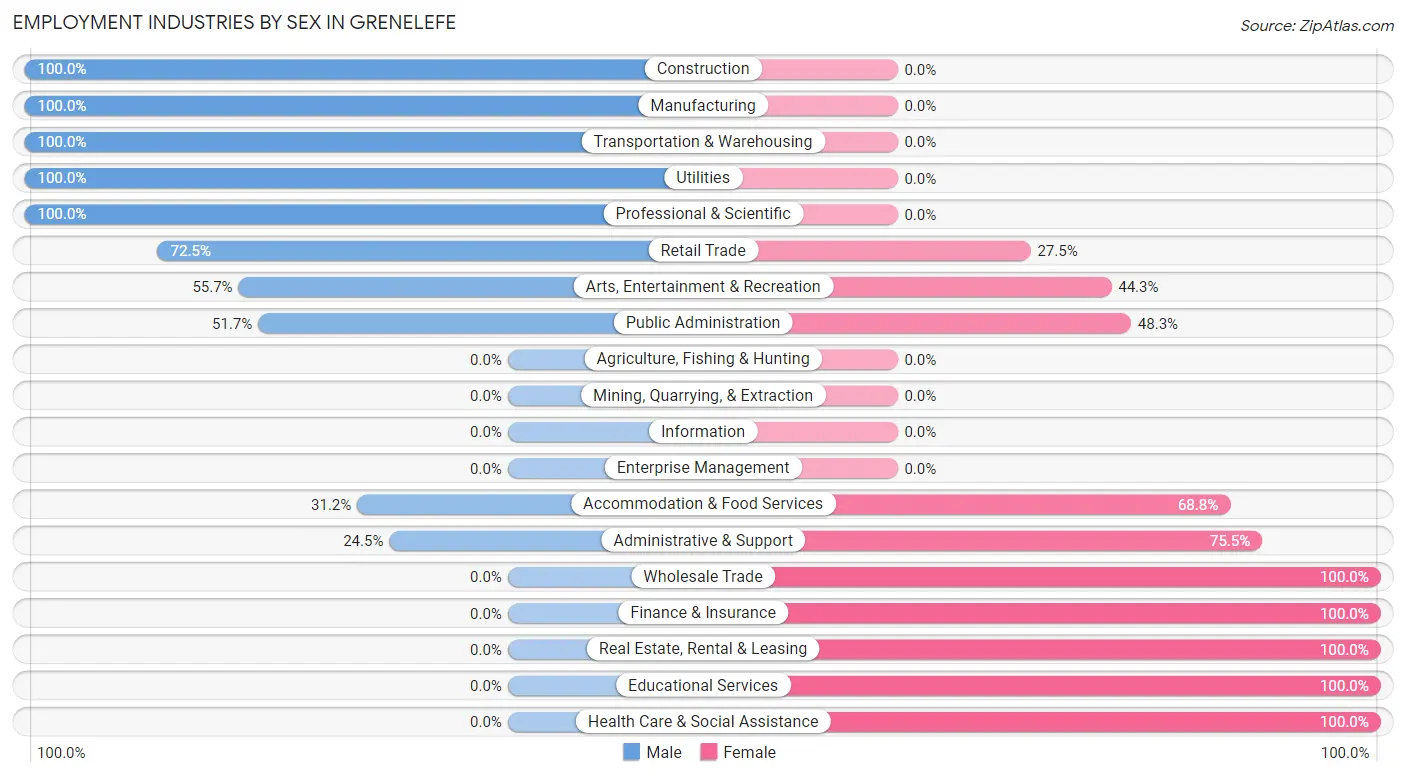
The Grenelefe industries that see more men than women are Construction (100.0%), Manufacturing (100.0%), and Transportation & Warehousing (100.0%), whereas the industries that tend to have a higher number of women are Wholesale Trade (100.0%), Finance & Insurance (100.0%), and Real Estate, Rental & Leasing (100.0%).
| Industry | Male | Female |
| Agriculture, Fishing & Hunting | 0 (0.0%) | 0 (0.0%) |
| Mining, Quarrying, & Extraction | 0 (0.0%) | 0 (0.0%) |
| Construction | 208 (100.0%) | 0 (0.0%) |
| Manufacturing | 132 (100.0%) | 0 (0.0%) |
| Wholesale Trade | 0 (0.0%) | 37 (100.0%) |
| Retail Trade | 121 (72.5%) | 46 (27.5%) |
| Transportation & Warehousing | 28 (100.0%) | 0 (0.0%) |
| Utilities | 43 (100.0%) | 0 (0.0%) |
| Information | 0 (0.0%) | 0 (0.0%) |
| Finance & Insurance | 0 (0.0%) | 15 (100.0%) |
| Real Estate, Rental & Leasing | 0 (0.0%) | 27 (100.0%) |
| Professional & Scientific | 16 (100.0%) | 0 (0.0%) |
| Enterprise Management | 0 (0.0%) | 0 (0.0%) |
| Administrative & Support | 13 (24.5%) | 40 (75.5%) |
| Educational Services | 0 (0.0%) | 78 (100.0%) |
| Health Care & Social Assistance | 0 (0.0%) | 159 (100.0%) |
| Arts, Entertainment & Recreation | 68 (55.7%) | 54 (44.3%) |
| Accommodation & Food Services | 48 (31.2%) | 106 (68.8%) |
| Public Administration | 62 (51.7%) | 58 (48.3%) |
| Total | 739 (54.4%) | 620 (45.6%) |
Education in Grenelefe
School Enrollment in Grenelefe
The most common levels of schooling among the 889 students in Grenelefe are elementary school (397 | 44.7%), middle school (140 | 15.8%), and college / undergraduate (125 | 14.1%).
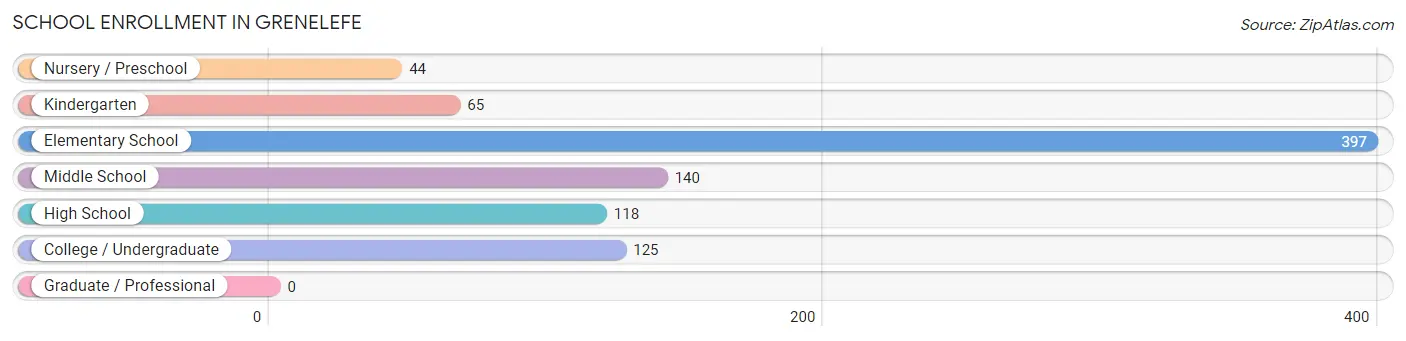
| School Level | # Students | % Students |
| Nursery / Preschool | 44 | 5.0% |
| Kindergarten | 65 | 7.3% |
| Elementary School | 397 | 44.7% |
| Middle School | 140 | 15.8% |
| High School | 118 | 13.3% |
| College / Undergraduate | 125 | 14.1% |
| Graduate / Professional | 0 | 0.0% |
| Total | 889 | 100.0% |
School Enrollment by Age by Funding Source in Grenelefe
Out of a total of 889 students who are enrolled in schools in Grenelefe, 197 (22.2%) attend a private institution, while the remaining 692 (77.8%) are enrolled in public schools. The age group of 10 to 14 year olds has the highest likelihood of being enrolled in private schools, with 89 (63.6% in the age bracket) enrolled. Conversely, the age group of 3 to 4 year olds has the lowest likelihood of being enrolled in a private school, with 109 (100.0% in the age bracket) attending a public institution.
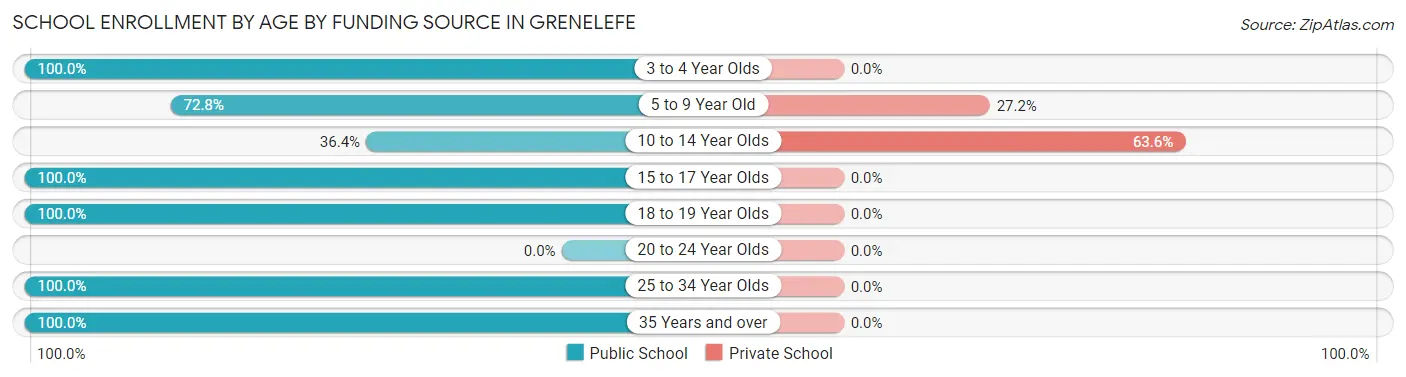
| Age Bracket | Public School | Private School |
| 3 to 4 Year Olds | 109 (100.0%) | 0 (0.0%) |
| 5 to 9 Year Old | 289 (72.8%) | 108 (27.2%) |
| 10 to 14 Year Olds | 51 (36.4%) | 89 (63.6%) |
| 15 to 17 Year Olds | 78 (100.0%) | 0 (0.0%) |
| 18 to 19 Year Olds | 40 (100.0%) | 0 (0.0%) |
| 20 to 24 Year Olds | 0 (0.0%) | 0 (0.0%) |
| 25 to 34 Year Olds | 18 (100.0%) | 0 (0.0%) |
| 35 Years and over | 107 (100.0%) | 0 (0.0%) |
| Total | 692 (77.8%) | 197 (22.2%) |
Educational Attainment by Field of Study in Grenelefe
Business (212 | 42.6%), education (113 | 22.7%), engineering (48 | 9.6%), visual & performing arts (41 | 8.2%), and science & technology (30 | 6.0%) are the most common fields of study among 498 individuals in Grenelefe who have obtained a bachelor's degree or higher.
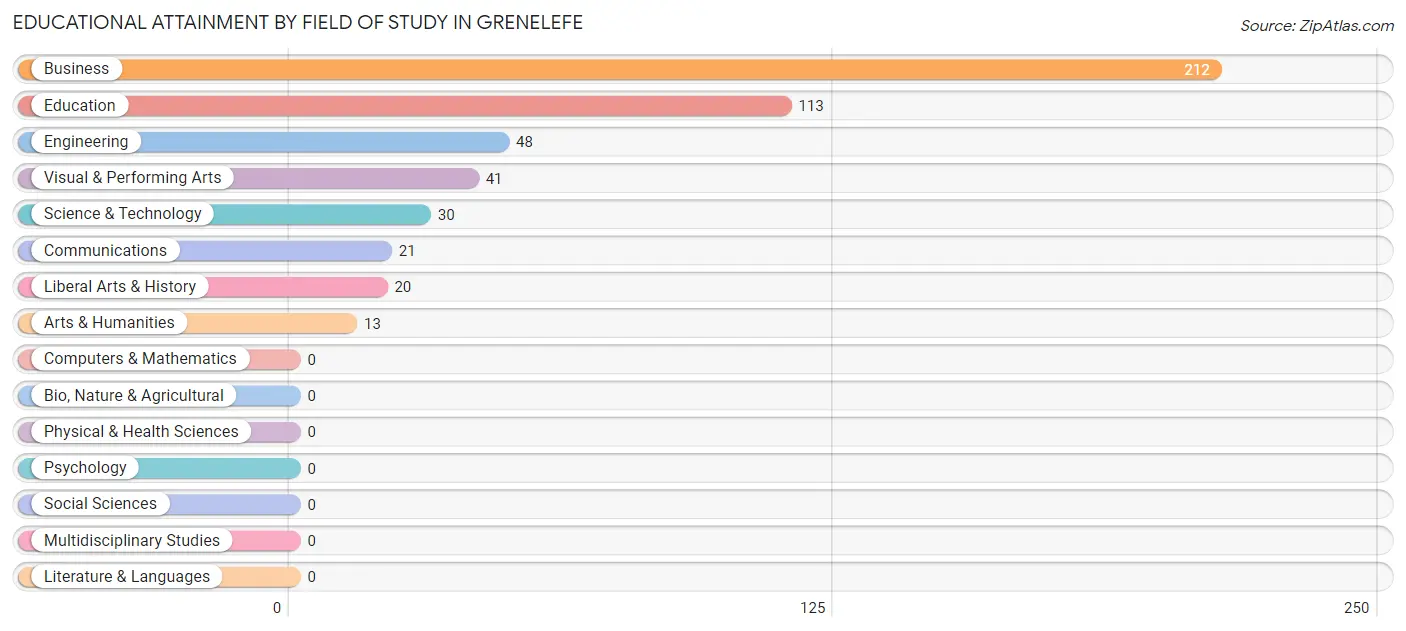
| Field of Study | # Graduates | % Graduates |
| Computers & Mathematics | 0 | 0.0% |
| Bio, Nature & Agricultural | 0 | 0.0% |
| Physical & Health Sciences | 0 | 0.0% |
| Psychology | 0 | 0.0% |
| Social Sciences | 0 | 0.0% |
| Engineering | 48 | 9.6% |
| Multidisciplinary Studies | 0 | 0.0% |
| Science & Technology | 30 | 6.0% |
| Business | 212 | 42.6% |
| Education | 113 | 22.7% |
| Literature & Languages | 0 | 0.0% |
| Liberal Arts & History | 20 | 4.0% |
| Visual & Performing Arts | 41 | 8.2% |
| Communications | 21 | 4.2% |
| Arts & Humanities | 13 | 2.6% |
| Total | 498 | 100.0% |
Transportation & Commute in Grenelefe
Vehicle Availability by Sex in Grenelefe
The most prevalent vehicle ownership categories in Grenelefe are males with 2 vehicles (307, accounting for 41.5%) and females with 2 vehicles (357, making up 49.5%).
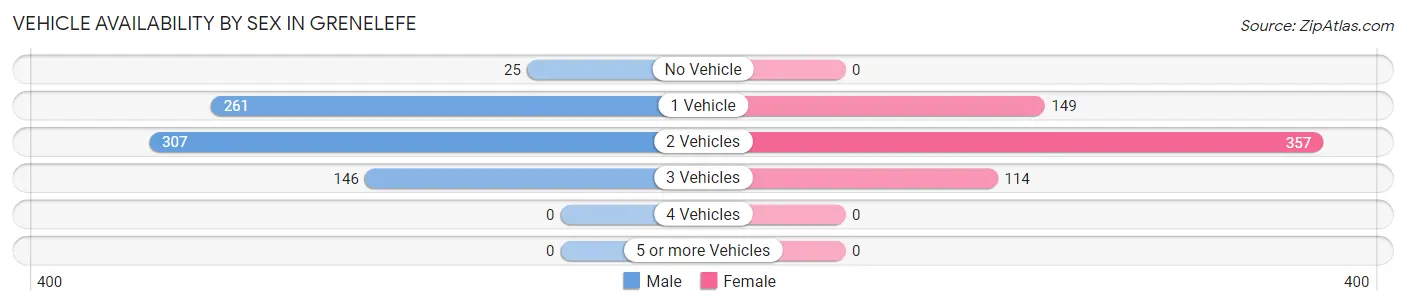
| Vehicles Available | Male | Female |
| No Vehicle | 25 (3.4%) | 0 (0.0%) |
| 1 Vehicle | 261 (35.3%) | 149 (24.0%) |
| 2 Vehicles | 307 (41.5%) | 357 (57.6%) |
| 3 Vehicles | 146 (19.8%) | 114 (18.4%) |
| 4 Vehicles | 0 (0.0%) | 0 (0.0%) |
| 5 or more Vehicles | 0 (0.0%) | 0 (0.0%) |
| Total | 739 (100.0%) | 620 (100.0%) |
Commute Time in Grenelefe
The most frequently occuring commute durations in Grenelefe are 25 to 29 minutes (275 commuters, 26.2%), 15 to 19 minutes (260 commuters, 24.8%), and 60 to 89 minutes (157 commuters, 14.9%).
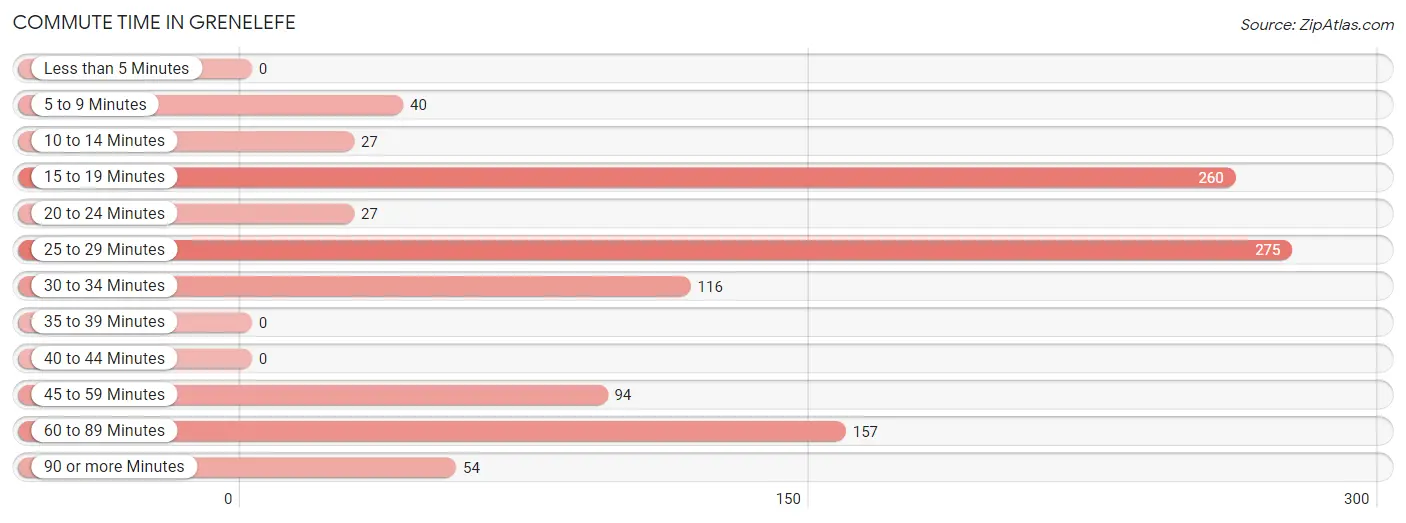
| Commute Time | # Commuters | % Commuters |
| Less than 5 Minutes | 0 | 0.0% |
| 5 to 9 Minutes | 40 | 3.8% |
| 10 to 14 Minutes | 27 | 2.6% |
| 15 to 19 Minutes | 260 | 24.8% |
| 20 to 24 Minutes | 27 | 2.6% |
| 25 to 29 Minutes | 275 | 26.2% |
| 30 to 34 Minutes | 116 | 11.1% |
| 35 to 39 Minutes | 0 | 0.0% |
| 40 to 44 Minutes | 0 | 0.0% |
| 45 to 59 Minutes | 94 | 8.9% |
| 60 to 89 Minutes | 157 | 14.9% |
| 90 or more Minutes | 54 | 5.1% |
Commute Time by Sex in Grenelefe
The most common commute times in Grenelefe are 15 to 19 minutes (243 commuters, 36.2%) for males and 60 to 89 minutes (136 commuters, 35.9%) for females.
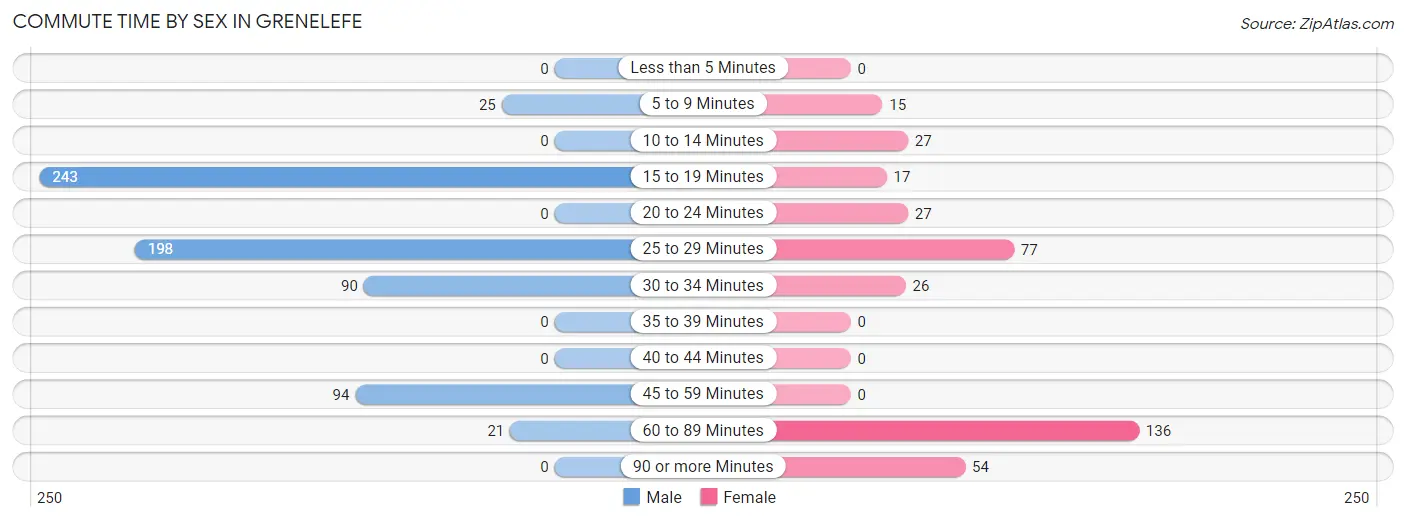
| Commute Time | Male | Female |
| Less than 5 Minutes | 0 (0.0%) | 0 (0.0%) |
| 5 to 9 Minutes | 25 (3.7%) | 15 (4.0%) |
| 10 to 14 Minutes | 0 (0.0%) | 27 (7.1%) |
| 15 to 19 Minutes | 243 (36.2%) | 17 (4.5%) |
| 20 to 24 Minutes | 0 (0.0%) | 27 (7.1%) |
| 25 to 29 Minutes | 198 (29.5%) | 77 (20.3%) |
| 30 to 34 Minutes | 90 (13.4%) | 26 (6.9%) |
| 35 to 39 Minutes | 0 (0.0%) | 0 (0.0%) |
| 40 to 44 Minutes | 0 (0.0%) | 0 (0.0%) |
| 45 to 59 Minutes | 94 (14.0%) | 0 (0.0%) |
| 60 to 89 Minutes | 21 (3.1%) | 136 (35.9%) |
| 90 or more Minutes | 0 (0.0%) | 54 (14.2%) |
Time of Departure to Work by Sex in Grenelefe
The most frequent times of departure to work in Grenelefe are 6:00 AM to 6:29 AM (190, 28.3%) for males and 6:00 AM to 6:29 AM (168, 44.3%) for females.
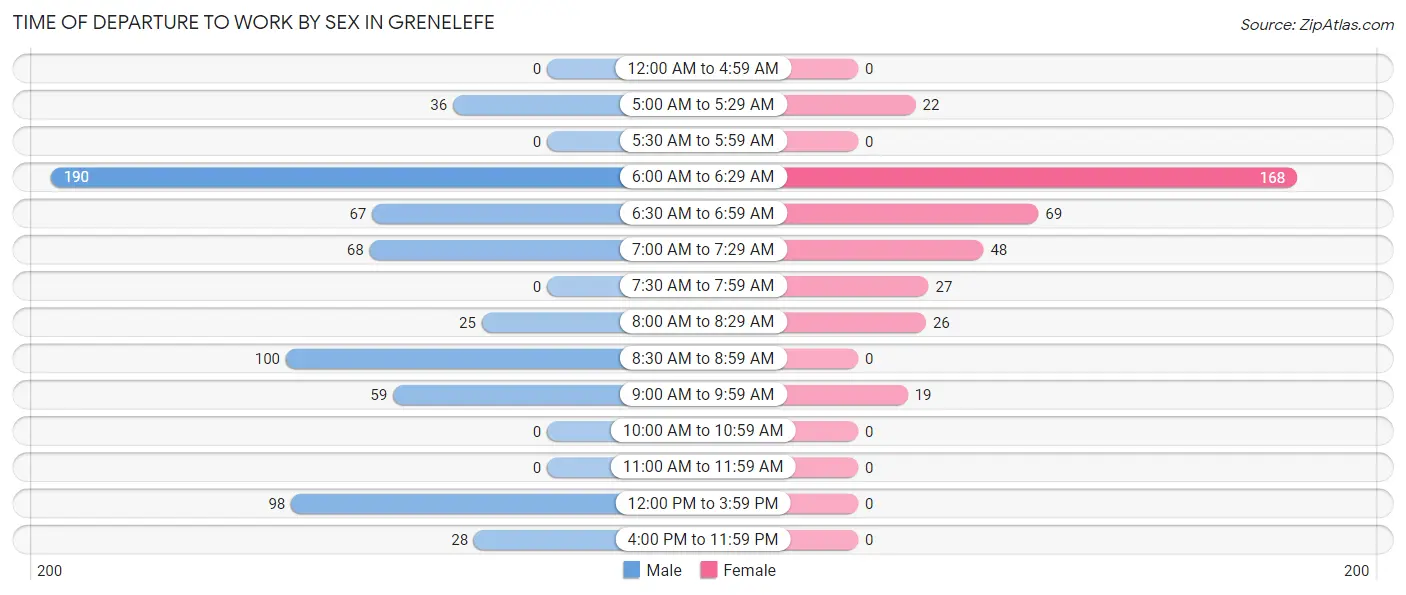
| Time of Departure | Male | Female |
| 12:00 AM to 4:59 AM | 0 (0.0%) | 0 (0.0%) |
| 5:00 AM to 5:29 AM | 36 (5.4%) | 22 (5.8%) |
| 5:30 AM to 5:59 AM | 0 (0.0%) | 0 (0.0%) |
| 6:00 AM to 6:29 AM | 190 (28.3%) | 168 (44.3%) |
| 6:30 AM to 6:59 AM | 67 (10.0%) | 69 (18.2%) |
| 7:00 AM to 7:29 AM | 68 (10.1%) | 48 (12.7%) |
| 7:30 AM to 7:59 AM | 0 (0.0%) | 27 (7.1%) |
| 8:00 AM to 8:29 AM | 25 (3.7%) | 26 (6.9%) |
| 8:30 AM to 8:59 AM | 100 (14.9%) | 0 (0.0%) |
| 9:00 AM to 9:59 AM | 59 (8.8%) | 19 (5.0%) |
| 10:00 AM to 10:59 AM | 0 (0.0%) | 0 (0.0%) |
| 11:00 AM to 11:59 AM | 0 (0.0%) | 0 (0.0%) |
| 12:00 PM to 3:59 PM | 98 (14.6%) | 0 (0.0%) |
| 4:00 PM to 11:59 PM | 28 (4.2%) | 0 (0.0%) |
| Total | 671 (100.0%) | 379 (100.0%) |
Housing Occupancy in Grenelefe
Occupancy by Ownership in Grenelefe
Of the total 996 dwellings in Grenelefe, owner-occupied units account for 468 (47.0%), while renter-occupied units make up 528 (53.0%).
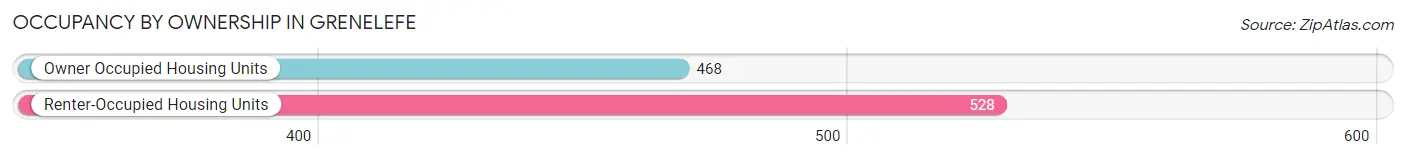
| Occupancy | # Housing Units | % Housing Units |
| Owner Occupied Housing Units | 468 | 47.0% |
| Renter-Occupied Housing Units | 528 | 53.0% |
| Total Occupied Housing Units | 996 | 100.0% |
Occupancy by Household Size in Grenelefe
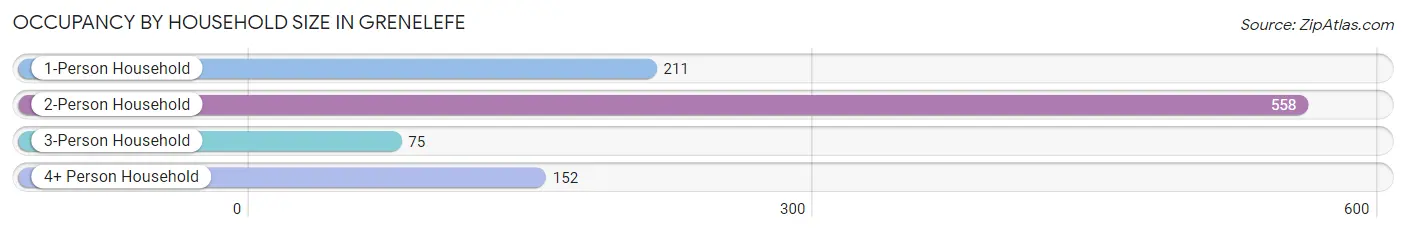
| Household Size | # Housing Units | % Housing Units |
| 1-Person Household | 211 | 21.2% |
| 2-Person Household | 558 | 56.0% |
| 3-Person Household | 75 | 7.5% |
| 4+ Person Household | 152 | 15.3% |
| Total Housing Units | 996 | 100.0% |
Occupancy by Ownership by Household Size in Grenelefe
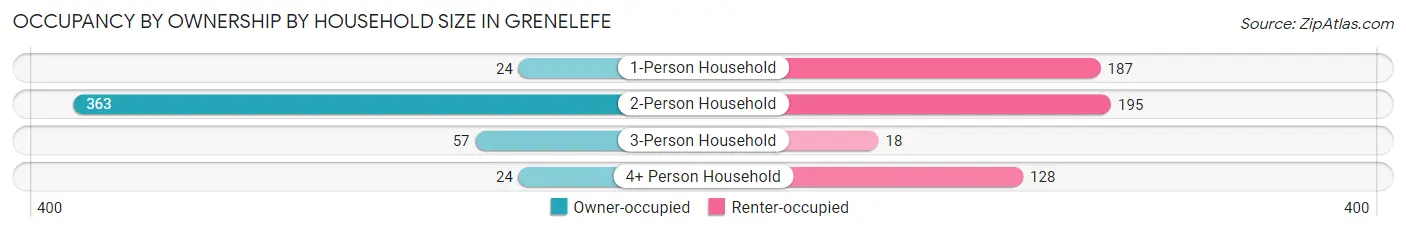
| Household Size | Owner-occupied | Renter-occupied |
| 1-Person Household | 24 (11.4%) | 187 (88.6%) |
| 2-Person Household | 363 (65.0%) | 195 (34.9%) |
| 3-Person Household | 57 (76.0%) | 18 (24.0%) |
| 4+ Person Household | 24 (15.8%) | 128 (84.2%) |
| Total Housing Units | 468 (47.0%) | 528 (53.0%) |
Occupancy by Educational Attainment in Grenelefe
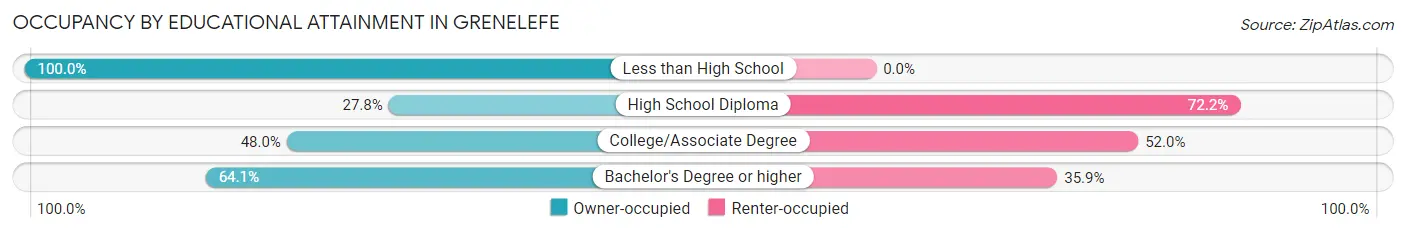
| Household Size | Owner-occupied | Renter-occupied |
| Less than High School | 34 (100.0%) | 0 (0.0%) |
| High School Diploma | 93 (27.8%) | 241 (72.2%) |
| College/Associate Degree | 184 (48.0%) | 199 (52.0%) |
| Bachelor's Degree or higher | 157 (64.1%) | 88 (35.9%) |
Occupancy by Age of Householder in Grenelefe
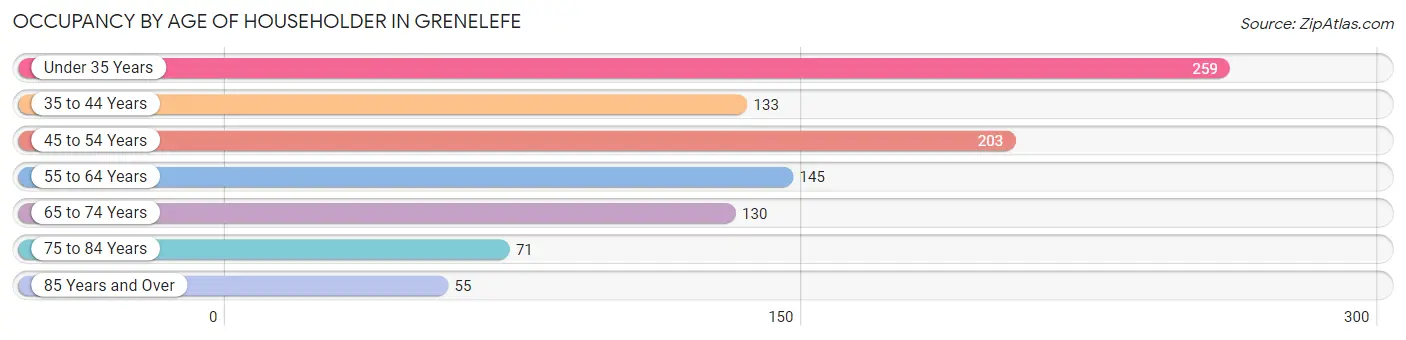
| Age Bracket | # Households | % Households |
| Under 35 Years | 259 | 26.0% |
| 35 to 44 Years | 133 | 13.4% |
| 45 to 54 Years | 203 | 20.4% |
| 55 to 64 Years | 145 | 14.6% |
| 65 to 74 Years | 130 | 13.1% |
| 75 to 84 Years | 71 | 7.1% |
| 85 Years and Over | 55 | 5.5% |
| Total | 996 | 100.0% |
Housing Finances in Grenelefe
Median Income by Occupancy in Grenelefe
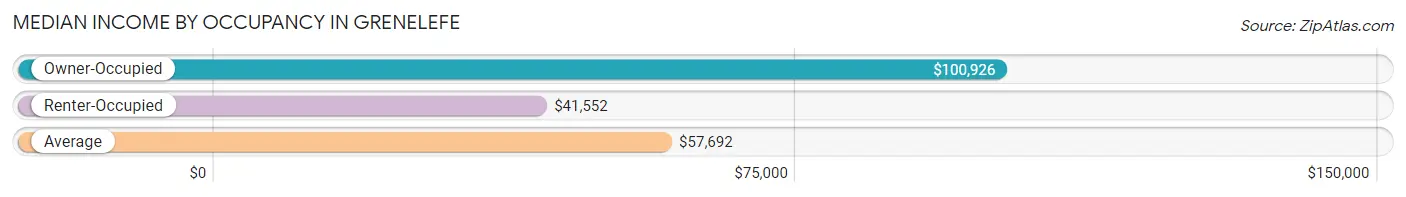
| Occupancy Type | # Households | Median Income |
| Owner-Occupied | 468 (47.0%) | $100,926 |
| Renter-Occupied | 528 (53.0%) | $41,552 |
| Average | 996 (100.0%) | $57,692 |
Occupancy by Householder Income Bracket in Grenelefe
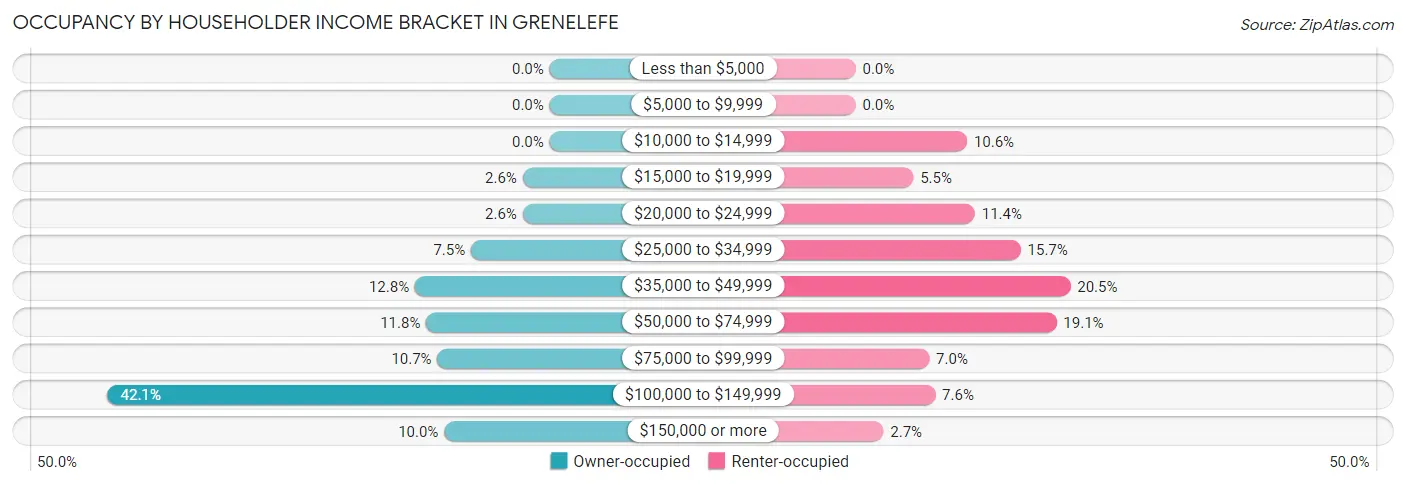
| Income Bracket | Owner-occupied | Renter-occupied |
| Less than $5,000 | 0 (0.0%) | 0 (0.0%) |
| $5,000 to $9,999 | 0 (0.0%) | 0 (0.0%) |
| $10,000 to $14,999 | 0 (0.0%) | 56 (10.6%) |
| $15,000 to $19,999 | 12 (2.6%) | 29 (5.5%) |
| $20,000 to $24,999 | 12 (2.6%) | 60 (11.4%) |
| $25,000 to $34,999 | 35 (7.5%) | 83 (15.7%) |
| $35,000 to $49,999 | 60 (12.8%) | 108 (20.4%) |
| $50,000 to $74,999 | 55 (11.7%) | 101 (19.1%) |
| $75,000 to $99,999 | 50 (10.7%) | 37 (7.0%) |
| $100,000 to $149,999 | 197 (42.1%) | 40 (7.6%) |
| $150,000 or more | 47 (10.0%) | 14 (2.6%) |
| Total | 468 (100.0%) | 528 (100.0%) |
Monthly Housing Cost Tiers in Grenelefe
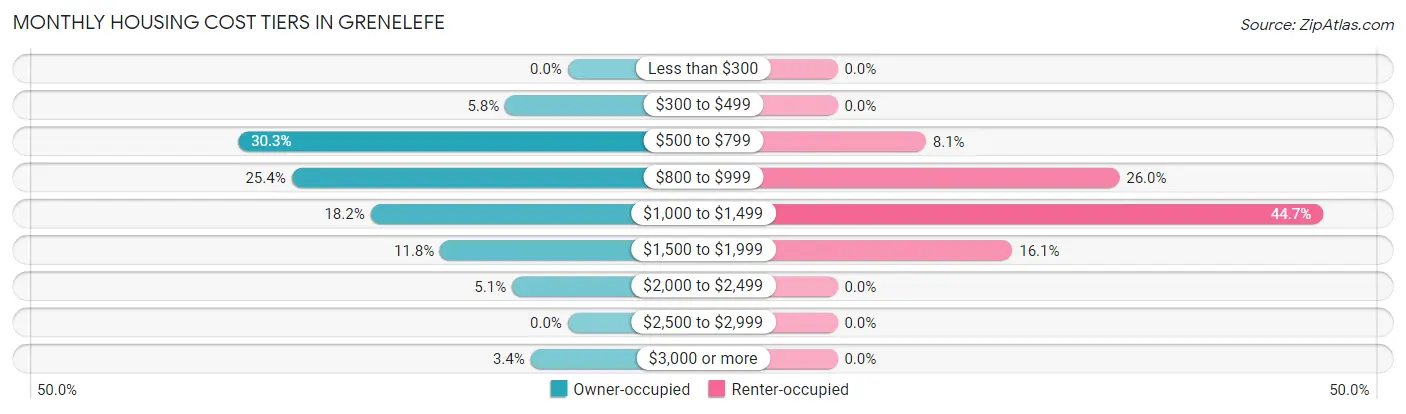
| Monthly Cost | Owner-occupied | Renter-occupied |
| Less than $300 | 0 (0.0%) | 0 (0.0%) |
| $300 to $499 | 27 (5.8%) | 0 (0.0%) |
| $500 to $799 | 142 (30.3%) | 43 (8.1%) |
| $800 to $999 | 119 (25.4%) | 137 (26.0%) |
| $1,000 to $1,499 | 85 (18.2%) | 236 (44.7%) |
| $1,500 to $1,999 | 55 (11.7%) | 85 (16.1%) |
| $2,000 to $2,499 | 24 (5.1%) | 0 (0.0%) |
| $2,500 to $2,999 | 0 (0.0%) | 0 (0.0%) |
| $3,000 or more | 16 (3.4%) | 0 (0.0%) |
| Total | 468 (100.0%) | 528 (100.0%) |
Physical Housing Characteristics in Grenelefe
Housing Structures in Grenelefe
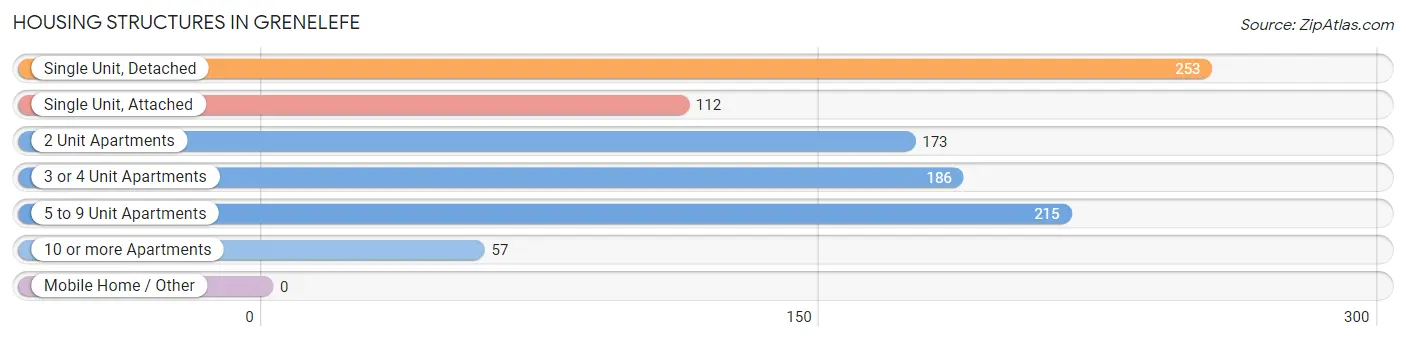
| Structure Type | # Housing Units | % Housing Units |
| Single Unit, Detached | 253 | 25.4% |
| Single Unit, Attached | 112 | 11.2% |
| 2 Unit Apartments | 173 | 17.4% |
| 3 or 4 Unit Apartments | 186 | 18.7% |
| 5 to 9 Unit Apartments | 215 | 21.6% |
| 10 or more Apartments | 57 | 5.7% |
| Mobile Home / Other | 0 | 0.0% |
| Total | 996 | 100.0% |
Housing Structures by Occupancy in Grenelefe
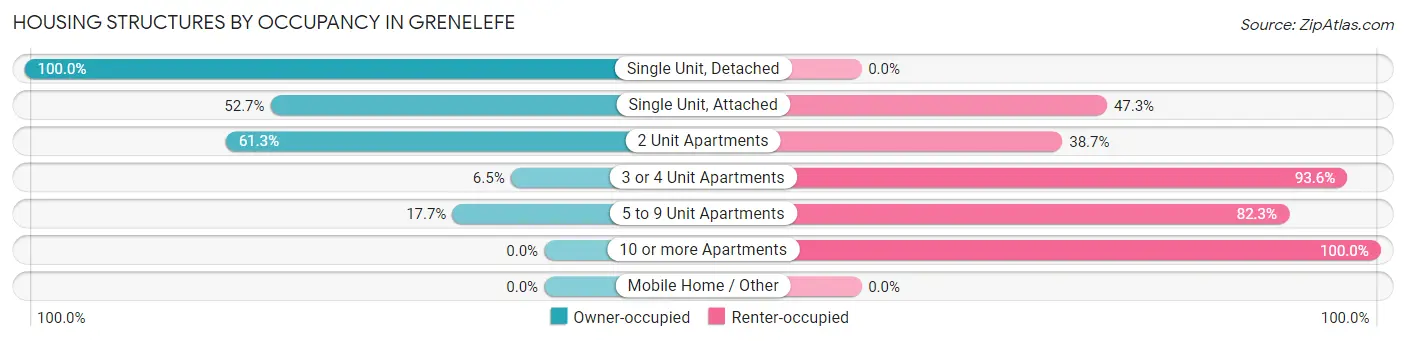
| Structure Type | Owner-occupied | Renter-occupied |
| Single Unit, Detached | 253 (100.0%) | 0 (0.0%) |
| Single Unit, Attached | 59 (52.7%) | 53 (47.3%) |
| 2 Unit Apartments | 106 (61.3%) | 67 (38.7%) |
| 3 or 4 Unit Apartments | 12 (6.5%) | 174 (93.5%) |
| 5 to 9 Unit Apartments | 38 (17.7%) | 177 (82.3%) |
| 10 or more Apartments | 0 (0.0%) | 57 (100.0%) |
| Mobile Home / Other | 0 (0.0%) | 0 (0.0%) |
| Total | 468 (47.0%) | 528 (53.0%) |
Housing Structures by Number of Rooms in Grenelefe
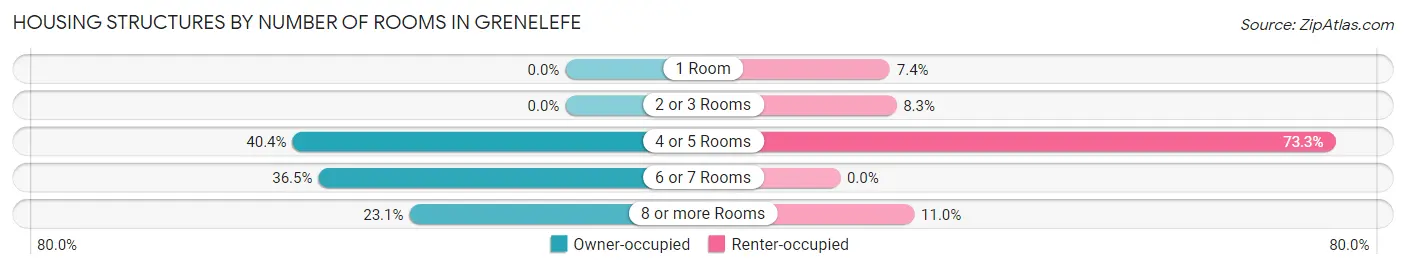
| Number of Rooms | Owner-occupied | Renter-occupied |
| 1 Room | 0 (0.0%) | 39 (7.4%) |
| 2 or 3 Rooms | 0 (0.0%) | 44 (8.3%) |
| 4 or 5 Rooms | 189 (40.4%) | 387 (73.3%) |
| 6 or 7 Rooms | 171 (36.5%) | 0 (0.0%) |
| 8 or more Rooms | 108 (23.1%) | 58 (11.0%) |
| Total | 468 (100.0%) | 528 (100.0%) |
Housing Structure by Heating Type in Grenelefe
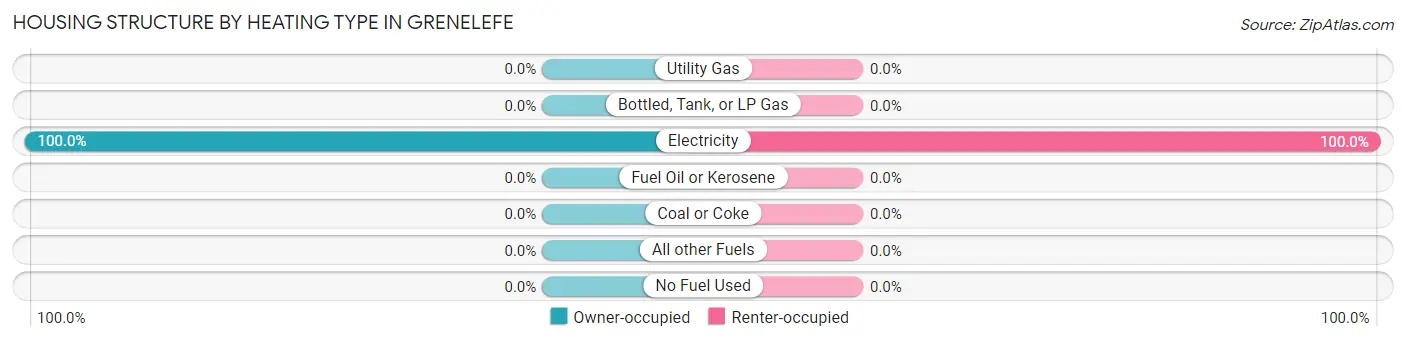
| Heating Type | Owner-occupied | Renter-occupied |
| Utility Gas | 0 (0.0%) | 0 (0.0%) |
| Bottled, Tank, or LP Gas | 0 (0.0%) | 0 (0.0%) |
| Electricity | 468 (100.0%) | 528 (100.0%) |
| Fuel Oil or Kerosene | 0 (0.0%) | 0 (0.0%) |
| Coal or Coke | 0 (0.0%) | 0 (0.0%) |
| All other Fuels | 0 (0.0%) | 0 (0.0%) |
| No Fuel Used | 0 (0.0%) | 0 (0.0%) |
| Total | 468 (100.0%) | 528 (100.0%) |
Household Vehicle Usage in Grenelefe
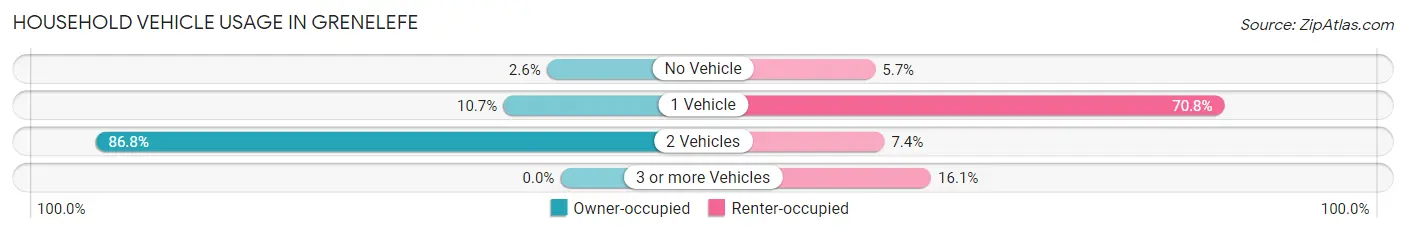
| Vehicles per Household | Owner-occupied | Renter-occupied |
| No Vehicle | 12 (2.6%) | 30 (5.7%) |
| 1 Vehicle | 50 (10.7%) | 374 (70.8%) |
| 2 Vehicles | 406 (86.8%) | 39 (7.4%) |
| 3 or more Vehicles | 0 (0.0%) | 85 (16.1%) |
| Total | 468 (100.0%) | 528 (100.0%) |
Real Estate & Mortgages in Grenelefe
Real Estate and Mortgage Overview in Grenelefe
| Characteristic | Without Mortgage | With Mortgage |
| Housing Units | 241 | 227 |
| Median Property Value | $291,700 | $191,200 |
| Median Household Income | $55,163 | $23 |
| Monthly Housing Costs | $758 | $16 |
| Real Estate Taxes | $2,414 | $0 |
Property Value by Mortgage Status in Grenelefe
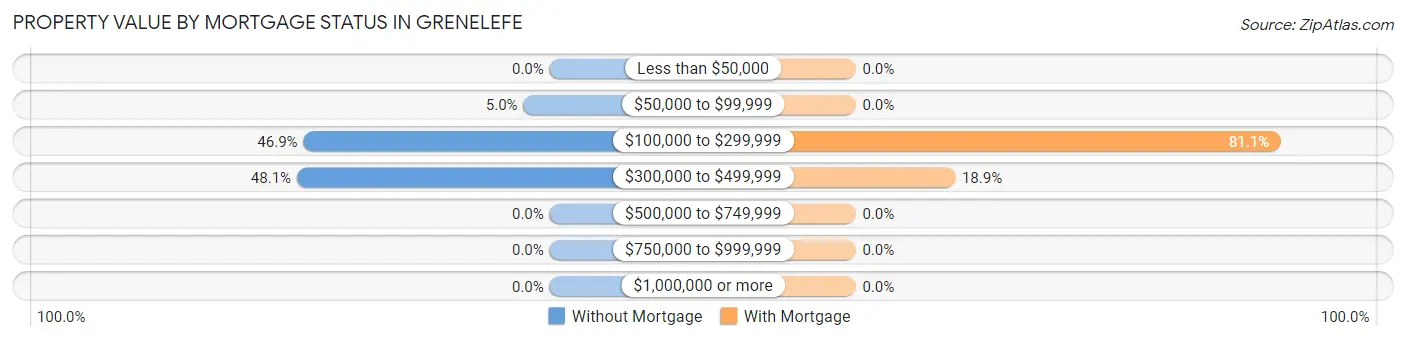
| Property Value | Without Mortgage | With Mortgage |
| Less than $50,000 | 0 (0.0%) | 0 (0.0%) |
| $50,000 to $99,999 | 12 (5.0%) | 0 (0.0%) |
| $100,000 to $299,999 | 113 (46.9%) | 184 (81.1%) |
| $300,000 to $499,999 | 116 (48.1%) | 43 (18.9%) |
| $500,000 to $749,999 | 0 (0.0%) | 0 (0.0%) |
| $750,000 to $999,999 | 0 (0.0%) | 0 (0.0%) |
| $1,000,000 or more | 0 (0.0%) | 0 (0.0%) |
| Total | 241 (100.0%) | 227 (100.0%) |
Household Income by Mortgage Status in Grenelefe
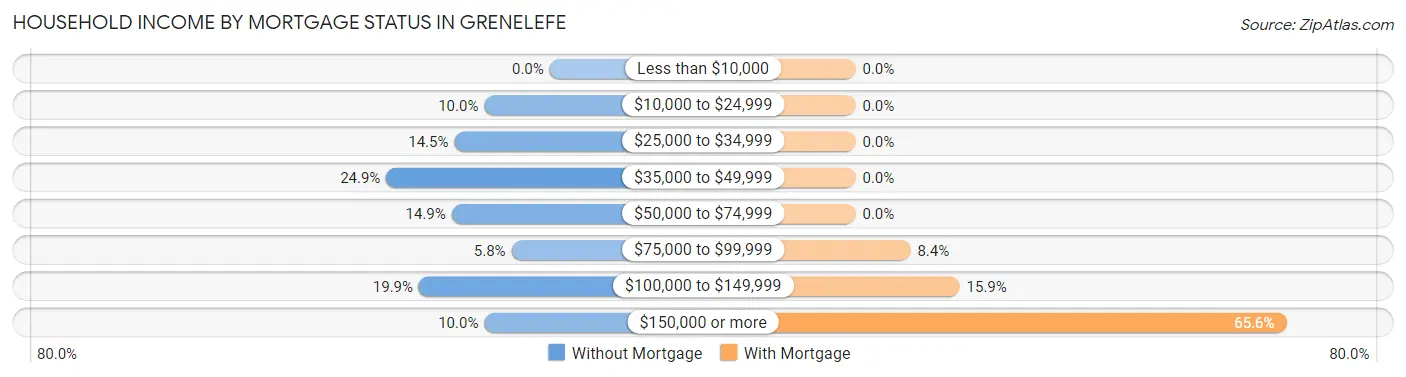
| Household Income | Without Mortgage | With Mortgage |
| Less than $10,000 | 0 (0.0%) | 0 (0.0%) |
| $10,000 to $24,999 | 24 (10.0%) | 0 (0.0%) |
| $25,000 to $34,999 | 35 (14.5%) | 0 (0.0%) |
| $35,000 to $49,999 | 60 (24.9%) | 0 (0.0%) |
| $50,000 to $74,999 | 36 (14.9%) | 0 (0.0%) |
| $75,000 to $99,999 | 14 (5.8%) | 19 (8.4%) |
| $100,000 to $149,999 | 48 (19.9%) | 36 (15.9%) |
| $150,000 or more | 24 (10.0%) | 149 (65.6%) |
| Total | 241 (100.0%) | 227 (100.0%) |
Property Value to Household Income Ratio in Grenelefe
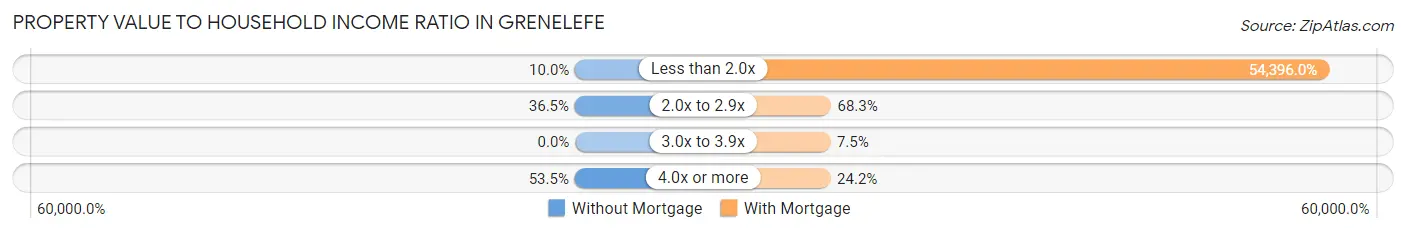
| Value-to-Income Ratio | Without Mortgage | With Mortgage |
| Less than 2.0x | 24 (10.0%) | 123,479 (54,396.0%) |
| 2.0x to 2.9x | 88 (36.5%) | 155 (68.3%) |
| 3.0x to 3.9x | 0 (0.0%) | 17 (7.5%) |
| 4.0x or more | 129 (53.5%) | 55 (24.2%) |
| Total | 241 (100.0%) | 227 (100.0%) |
Real Estate Taxes by Mortgage Status in Grenelefe
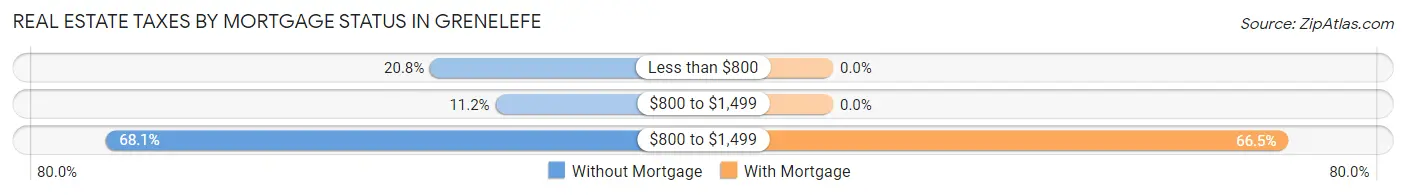
| Property Taxes | Without Mortgage | With Mortgage |
| Less than $800 | 50 (20.7%) | 0 (0.0%) |
| $800 to $1,499 | 27 (11.2%) | 0 (0.0%) |
| $800 to $1,499 | 164 (68.0%) | 151 (66.5%) |
| Total | 241 (100.0%) | 227 (100.0%) |
Health & Disability in Grenelefe
Health Insurance Coverage by Age in Grenelefe
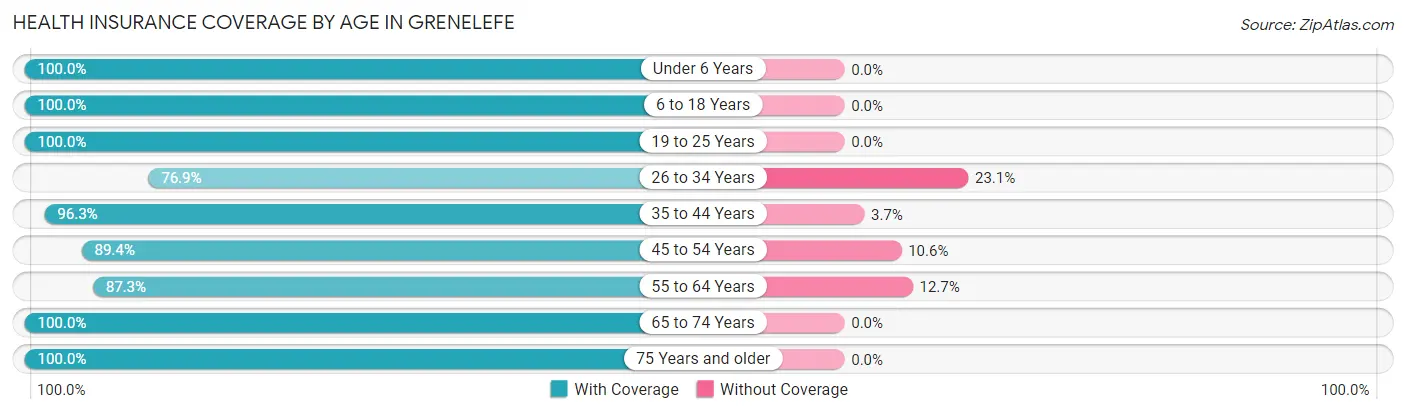
| Age Bracket | With Coverage | Without Coverage |
| Under 6 Years | 166 (100.0%) | 0 (0.0%) |
| 6 to 18 Years | 696 (100.0%) | 0 (0.0%) |
| 19 to 25 Years | 292 (100.0%) | 0 (0.0%) |
| 26 to 34 Years | 220 (76.9%) | 66 (23.1%) |
| 35 to 44 Years | 338 (96.3%) | 13 (3.7%) |
| 45 to 54 Years | 387 (89.4%) | 46 (10.6%) |
| 55 to 64 Years | 199 (87.3%) | 29 (12.7%) |
| 65 to 74 Years | 290 (100.0%) | 0 (0.0%) |
| 75 Years and older | 253 (100.0%) | 0 (0.0%) |
| Total | 2,841 (94.9%) | 154 (5.1%) |
Health Insurance Coverage by Citizenship Status in Grenelefe
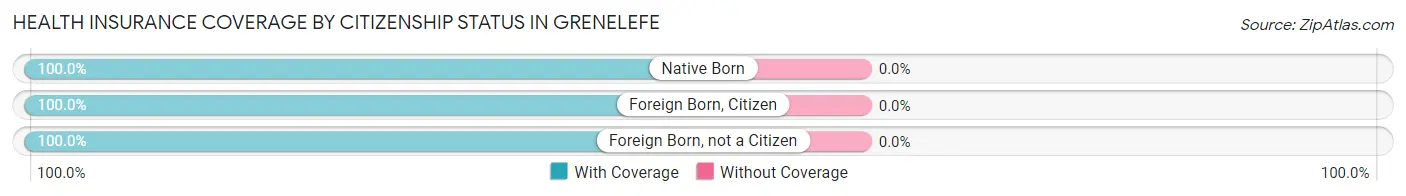
| Citizenship Status | With Coverage | Without Coverage |
| Native Born | 166 (100.0%) | 0 (0.0%) |
| Foreign Born, Citizen | 696 (100.0%) | 0 (0.0%) |
| Foreign Born, not a Citizen | 292 (100.0%) | 0 (0.0%) |
Health Insurance Coverage by Household Income in Grenelefe
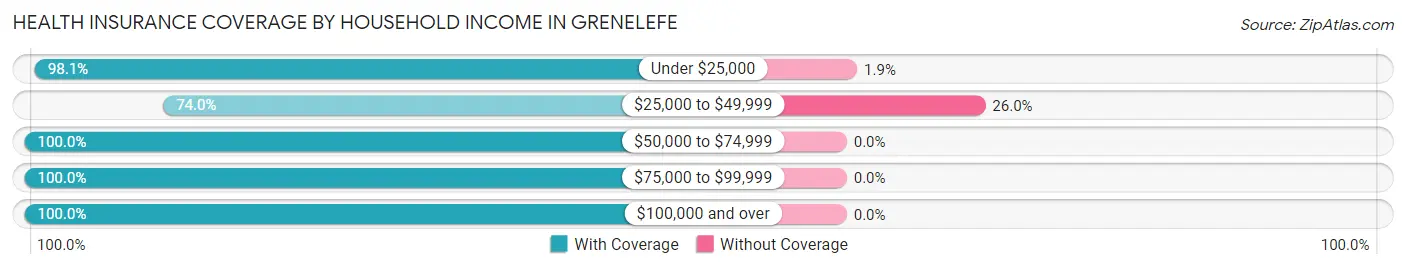
| Household Income | With Coverage | Without Coverage |
| Under $25,000 | 657 (98.1%) | 13 (1.9%) |
| $25,000 to $49,999 | 402 (74.0%) | 141 (26.0%) |
| $50,000 to $74,999 | 280 (100.0%) | 0 (0.0%) |
| $75,000 to $99,999 | 758 (100.0%) | 0 (0.0%) |
| $100,000 and over | 744 (100.0%) | 0 (0.0%) |
Public vs Private Health Insurance Coverage by Age in Grenelefe
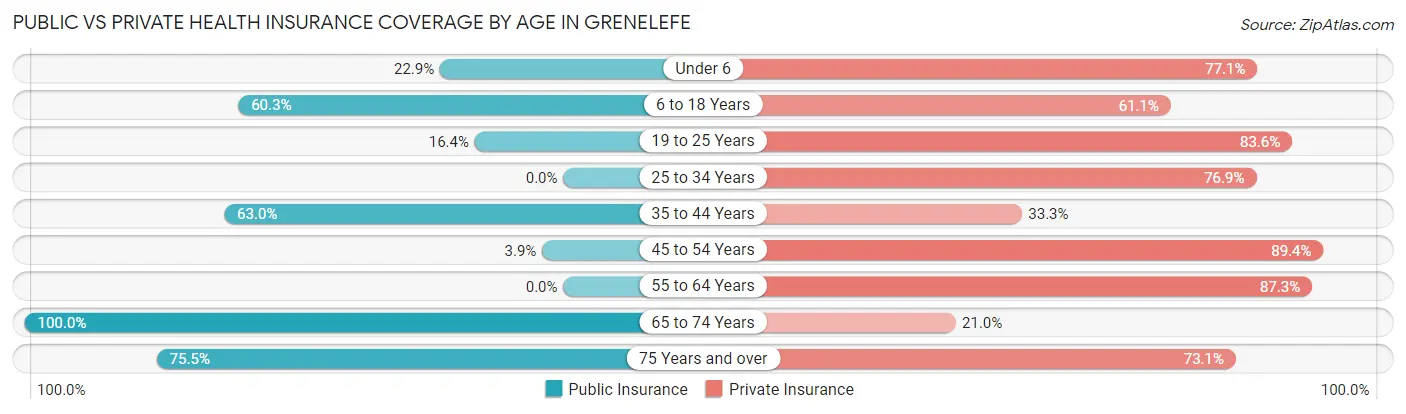
| Age Bracket | Public Insurance | Private Insurance |
| Under 6 | 38 (22.9%) | 128 (77.1%) |
| 6 to 18 Years | 420 (60.3%) | 425 (61.1%) |
| 19 to 25 Years | 48 (16.4%) | 244 (83.6%) |
| 25 to 34 Years | 0 (0.0%) | 220 (76.9%) |
| 35 to 44 Years | 221 (63.0%) | 117 (33.3%) |
| 45 to 54 Years | 17 (3.9%) | 387 (89.4%) |
| 55 to 64 Years | 0 (0.0%) | 199 (87.3%) |
| 65 to 74 Years | 290 (100.0%) | 61 (21.0%) |
| 75 Years and over | 191 (75.5%) | 185 (73.1%) |
| Total | 1,225 (40.9%) | 1,966 (65.6%) |
Disability Status by Sex by Age in Grenelefe
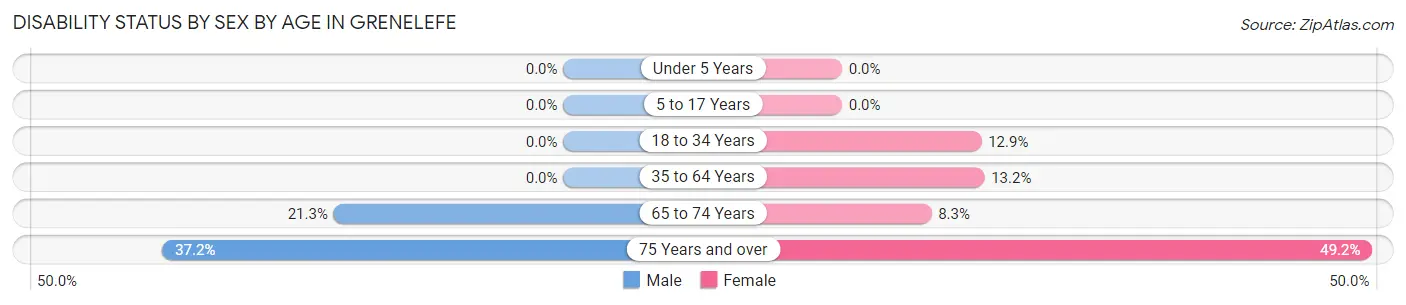
| Age Bracket | Male | Female |
| Under 5 Years | 0 (0.0%) | 0 (0.0%) |
| 5 to 17 Years | 0 (0.0%) | 0 (0.0%) |
| 18 to 34 Years | 0 (0.0%) | 48 (12.9%) |
| 35 to 64 Years | 0 (0.0%) | 60 (13.2%) |
| 65 to 74 Years | 13 (21.3%) | 19 (8.3%) |
| 75 Years and over | 70 (37.2%) | 32 (49.2%) |
Disability Class by Sex by Age in Grenelefe
Disability Class: Hearing Difficulty
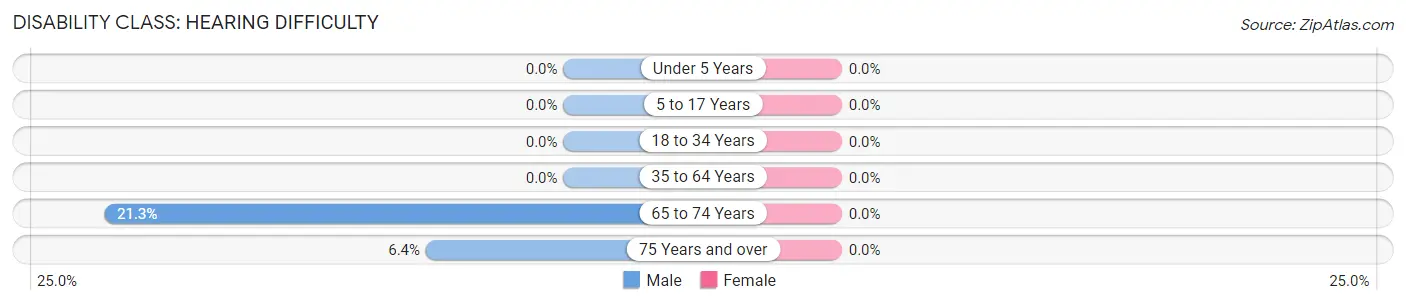
| Age Bracket | Male | Female |
| Under 5 Years | 0 (0.0%) | 0 (0.0%) |
| 5 to 17 Years | 0 (0.0%) | 0 (0.0%) |
| 18 to 34 Years | 0 (0.0%) | 0 (0.0%) |
| 35 to 64 Years | 0 (0.0%) | 0 (0.0%) |
| 65 to 74 Years | 13 (21.3%) | 0 (0.0%) |
| 75 Years and over | 12 (6.4%) | 0 (0.0%) |
Disability Class: Vision Difficulty

| Age Bracket | Male | Female |
| Under 5 Years | 0 (0.0%) | 0 (0.0%) |
| 5 to 17 Years | 0 (0.0%) | 0 (0.0%) |
| 18 to 34 Years | 0 (0.0%) | 0 (0.0%) |
| 35 to 64 Years | 0 (0.0%) | 0 (0.0%) |
| 65 to 74 Years | 0 (0.0%) | 0 (0.0%) |
| 75 Years and over | 0 (0.0%) | 0 (0.0%) |
Disability Class: Cognitive Difficulty
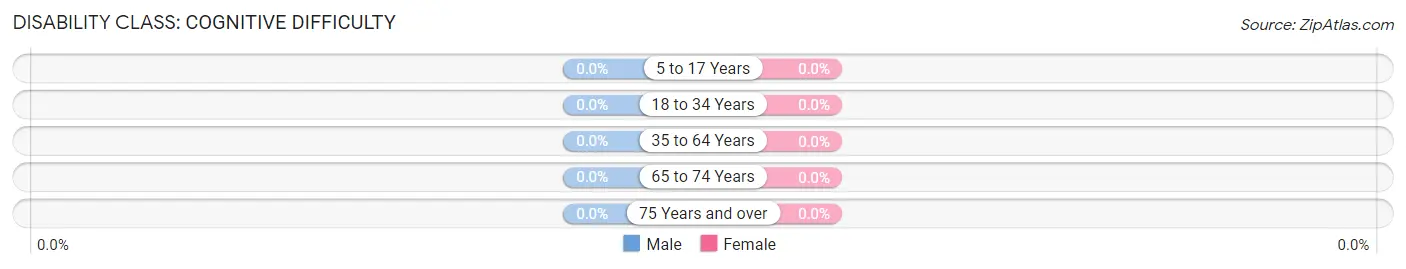
| Age Bracket | Male | Female |
| 5 to 17 Years | 0 (0.0%) | 0 (0.0%) |
| 18 to 34 Years | 0 (0.0%) | 0 (0.0%) |
| 35 to 64 Years | 0 (0.0%) | 0 (0.0%) |
| 65 to 74 Years | 0 (0.0%) | 0 (0.0%) |
| 75 Years and over | 0 (0.0%) | 0 (0.0%) |
Disability Class: Ambulatory Difficulty
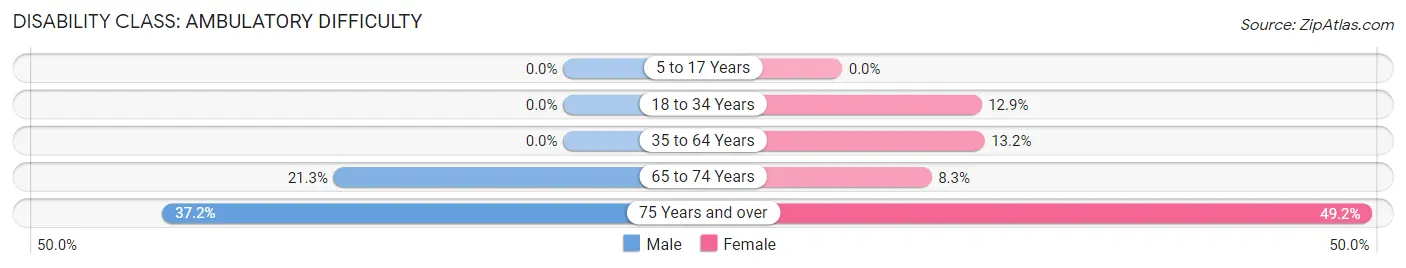
| Age Bracket | Male | Female |
| 5 to 17 Years | 0 (0.0%) | 0 (0.0%) |
| 18 to 34 Years | 0 (0.0%) | 48 (12.9%) |
| 35 to 64 Years | 0 (0.0%) | 60 (13.2%) |
| 65 to 74 Years | 13 (21.3%) | 19 (8.3%) |
| 75 Years and over | 70 (37.2%) | 32 (49.2%) |
Disability Class: Self-Care Difficulty
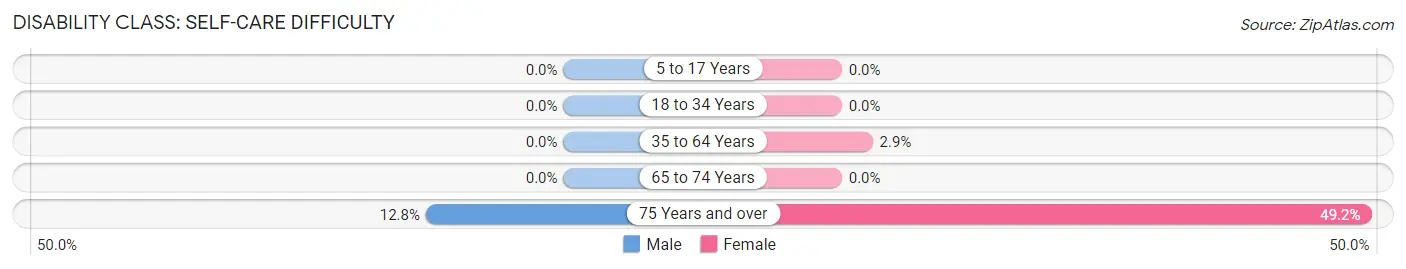
| Age Bracket | Male | Female |
| 5 to 17 Years | 0 (0.0%) | 0 (0.0%) |
| 18 to 34 Years | 0 (0.0%) | 0 (0.0%) |
| 35 to 64 Years | 0 (0.0%) | 13 (2.9%) |
| 65 to 74 Years | 0 (0.0%) | 0 (0.0%) |
| 75 Years and over | 24 (12.8%) | 32 (49.2%) |
Technology Access in Grenelefe
Computing Device Access in Grenelefe
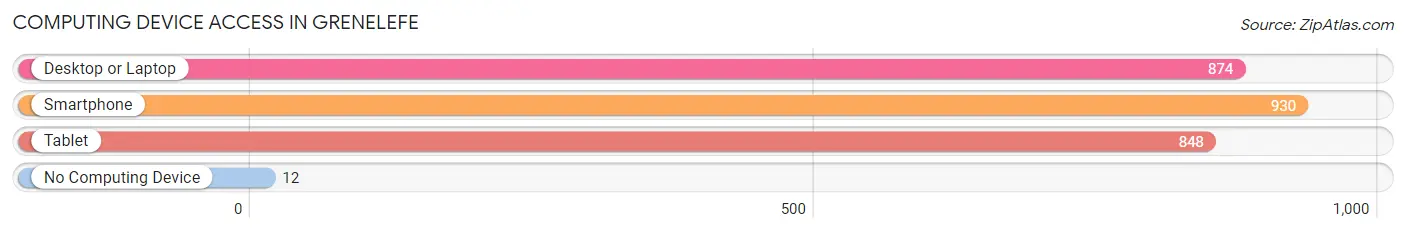
| Device Type | # Households | % Households |
| Desktop or Laptop | 874 | 87.7% |
| Smartphone | 930 | 93.4% |
| Tablet | 848 | 85.1% |
| No Computing Device | 12 | 1.2% |
| Total | 996 | 100.0% |
Internet Access in Grenelefe
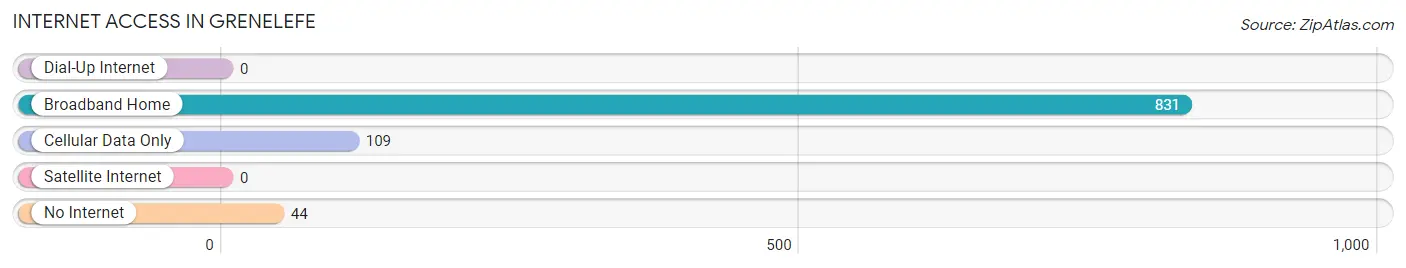
| Internet Type | # Households | % Households |
| Dial-Up Internet | 0 | 0.0% |
| Broadband Home | 831 | 83.4% |
| Cellular Data Only | 109 | 10.9% |
| Satellite Internet | 0 | 0.0% |
| No Internet | 44 | 4.4% |
| Total | 996 | 100.0% |
Grenelefe Summary
Grenelefe is a census-designated place (CDP) located in Polk County, Florida, United States. It is situated on the south shore of Lake Tohopekaliga, approximately 20 miles south of the city of Lakeland. The population of Grenelefe was 1,845 at the 2010 census.
History
Grenelefe was founded in the early 1970s by the Grenelefe Corporation, a real estate development company. The name Grenelefe is derived from the words “green” and “leaf”, and was chosen to reflect the lush, green foliage of the area. The development was planned as a golf and country club community, and the first golf course was opened in 1973. The community was incorporated as a municipality in 1975, but was later dissolved in 1987.
Geography
Grenelefe is located at 28°1'25" North, 81°37'25" West (28.023607, -81.623607). According to the United States Census Bureau, the CDP has a total area of 4.2 square miles, of which 4.1 square miles is land and 0.1 square miles is water.
Economy
Grenelefe is primarily a residential community, and the majority of its residents are employed in the nearby cities of Lakeland and Winter Haven. The community is home to two golf courses, the Grenelefe Golf and Tennis Resort and the Grenelefe Country Club. The resort also features a hotel, restaurant, and spa.
Demographics
As of the census of 2010, there were 1,845 people, 790 households, and 545 families residing in the CDP. The population density was 449.8 people per square mile. The racial makeup of the CDP was 94.2% White, 1.7% African American, 0.2% Native American, 1.2% Asian, 0.1% Pacific Islander, 1.2% from other races, and 1.6% from two or more races. Hispanic or Latino of any race were 4.2% of the population.
The median income for a household in the CDP was $45,000, and the median income for a family was $50,000. Males had a median income of $35,000 versus $25,000 for females. The per capita income for the CDP was $21,000. About 6.2% of families and 8.2% of the population were below the poverty line, including 11.2% of those under age 18 and 4.2% of those age 65 or over.
Common Questions
What is Per Capita Income in Grenelefe?
Per Capita income in Grenelefe is $25,770.
What is the Median Family Income in Grenelefe?
Median Family Income in Grenelefe is $87,226.
What is the Median Household income in Grenelefe?
Median Household Income in Grenelefe is $57,692.
What is Income or Wage Gap in Grenelefe?
Income or Wage Gap in Grenelefe is 29.2%.
Women in Grenelefe earn 70.8 cents for every dollar earned by a man.
What is Inequality or Gini Index in Grenelefe?
Inequality or Gini Index in Grenelefe is 0.37.
What is the Total Population of Grenelefe?
Total Population of Grenelefe is 2,995.
What is the Total Male Population of Grenelefe?
Total Male Population of Grenelefe is 1,399.
What is the Total Female Population of Grenelefe?
Total Female Population of Grenelefe is 1,596.
What is the Ratio of Males per 100 Females in Grenelefe?
There are 87.66 Males per 100 Females in Grenelefe.
What is the Ratio of Females per 100 Males in Grenelefe?
There are 114.08 Females per 100 Males in Grenelefe.
What is the Median Population Age in Grenelefe?
Median Population Age in Grenelefe is 38.7 Years.
What is the Average Family Size in Grenelefe
Average Family Size in Grenelefe is 3.9 People.
What is the Average Household Size in Grenelefe
Average Household Size in Grenelefe is 3.0 People.
How Large is the Labor Force in Grenelefe?
There are 1,359 People in the Labor Forcein in Grenelefe.
What is the Percentage of People in the Labor Force in Grenelefe?
59.9% of People are in the Labor Force in Grenelefe.