Noma, FL Map & Demographics
Noma Map
Noma Overview
$19,383
PER CAPITA INCOME
$43,750
AVG FAMILY INCOME
$41,319
AVG HOUSEHOLD INCOME
41.4%
WAGE / INCOME GAP [ % ]
58.6¢/ $1
WAGE / INCOME GAP [ $ ]
0.41
INEQUALITY / GINI INDEX
254
TOTAL POPULATION
144
MALE POPULATION
110
FEMALE POPULATION
130.91
MALES / 100 FEMALES
76.39
FEMALES / 100 MALES
43.6
MEDIAN AGE
3.5
AVG FAMILY SIZE
2.6
AVG HOUSEHOLD SIZE
110
LABOR FORCE [ PEOPLE ]
53.9%
PERCENT IN LABOR FORCE
3.6%
UNEMPLOYMENT RATE
Noma Area Codes
Income in Noma
Income Overview in Noma
Per Capita Income in Noma is $19,383, while median incomes of families and households are $43,750 and $41,319 respectively.
| Characteristic | Number | Measure |
| Per Capita Income | 254 | $19,383 |
| Median Family Income | 60 | $43,750 |
| Mean Family Income | 60 | $56,740 |
| Median Household Income | 97 | $41,319 |
| Mean Household Income | 97 | $47,616 |
| Income Deficit | 60 | $0 |
| Wage / Income Gap (%) | 254 | 41.38% |
| Wage / Income Gap ($) | 254 | 58.62¢ per $1 |
| Gini / Inequality Index | 254 | 0.41 |
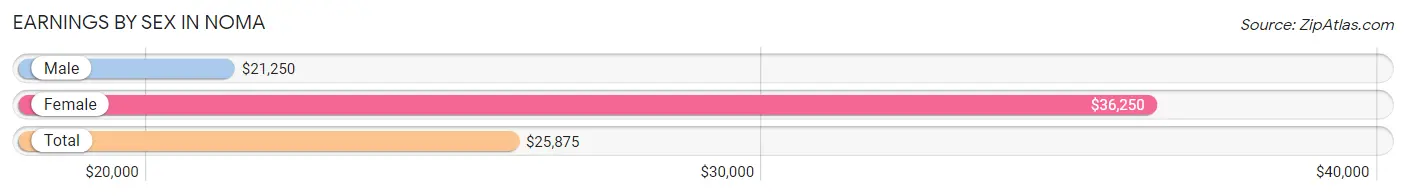
Earnings by Sex in Noma
Average Earnings in Noma are $25,875, $21,250 for men and $36,250 for women, a difference of 41.4%.
| Sex | Number | Average Earnings |
| Male | 79 (65.8%) | $21,250 |
| Female | 41 (34.2%) | $36,250 |
| Total | 120 (100.0%) | $25,875 |
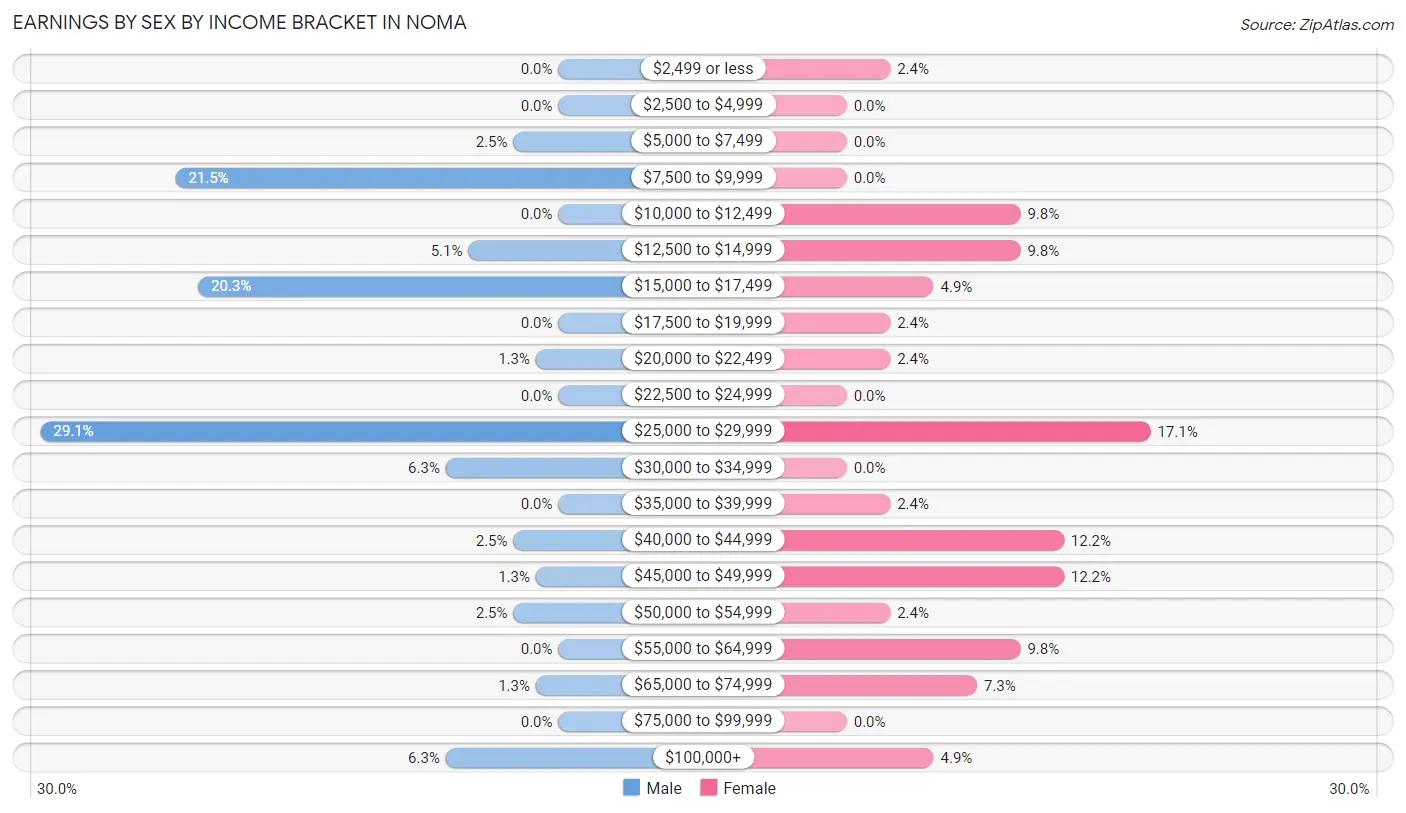
Earnings by Sex by Income Bracket in Noma
The most common earnings brackets in Noma are $25,000 to $29,999 for men (23 | 29.1%) and $25,000 to $29,999 for women (7 | 17.1%).
| Income | Male | Female |
| $2,499 or less | 0 (0.0%) | 1 (2.4%) |
| $2,500 to $4,999 | 0 (0.0%) | 0 (0.0%) |
| $5,000 to $7,499 | 2 (2.5%) | 0 (0.0%) |
| $7,500 to $9,999 | 17 (21.5%) | 0 (0.0%) |
| $10,000 to $12,499 | 0 (0.0%) | 4 (9.8%) |
| $12,500 to $14,999 | 4 (5.1%) | 4 (9.8%) |
| $15,000 to $17,499 | 16 (20.3%) | 2 (4.9%) |
| $17,500 to $19,999 | 0 (0.0%) | 1 (2.4%) |
| $20,000 to $22,499 | 1 (1.3%) | 1 (2.4%) |
| $22,500 to $24,999 | 0 (0.0%) | 0 (0.0%) |
| $25,000 to $29,999 | 23 (29.1%) | 7 (17.1%) |
| $30,000 to $34,999 | 5 (6.3%) | 0 (0.0%) |
| $35,000 to $39,999 | 0 (0.0%) | 1 (2.4%) |
| $40,000 to $44,999 | 2 (2.5%) | 5 (12.2%) |
| $45,000 to $49,999 | 1 (1.3%) | 5 (12.2%) |
| $50,000 to $54,999 | 2 (2.5%) | 1 (2.4%) |
| $55,000 to $64,999 | 0 (0.0%) | 4 (9.8%) |
| $65,000 to $74,999 | 1 (1.3%) | 3 (7.3%) |
| $75,000 to $99,999 | 0 (0.0%) | 0 (0.0%) |
| $100,000+ | 5 (6.3%) | 2 (4.9%) |
| Total | 79 (100.0%) | 41 (100.0%) |
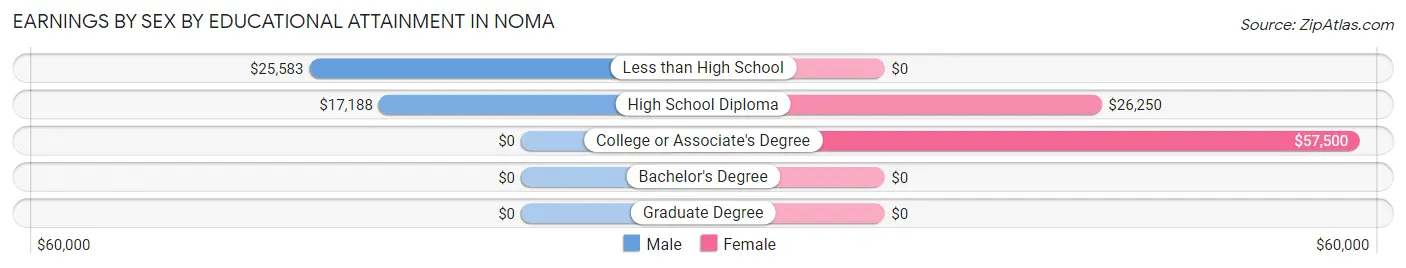
Earnings by Sex by Educational Attainment in Noma
Average earnings in Noma are $25,368 for men and $36,250 for women, a difference of 30.0%. Men with an educational attainment of less than high school enjoy the highest average annual earnings of $25,583, while those with high school diploma education earn the least with $17,188. Women with an educational attainment of college or associate's degree earn the most with the average annual earnings of $57,500, while those with high school diploma education have the smallest earnings of $26,250.
| Educational Attainment | Male Income | Female Income |
| Less than High School | $25,583 | $0 |
| High School Diploma | $17,188 | $26,250 |
| College or Associate's Degree | - | - |
| Bachelor's Degree | - | - |
| Graduate Degree | - | - |
| Total | $25,368 | $36,250 |
Family Income in Noma
Family Income Brackets in Noma
According to the Noma family income data, there are 31 families falling into the $35,000 to $49,999 income range, which is the most common income bracket and makes up 51.7% of all families.
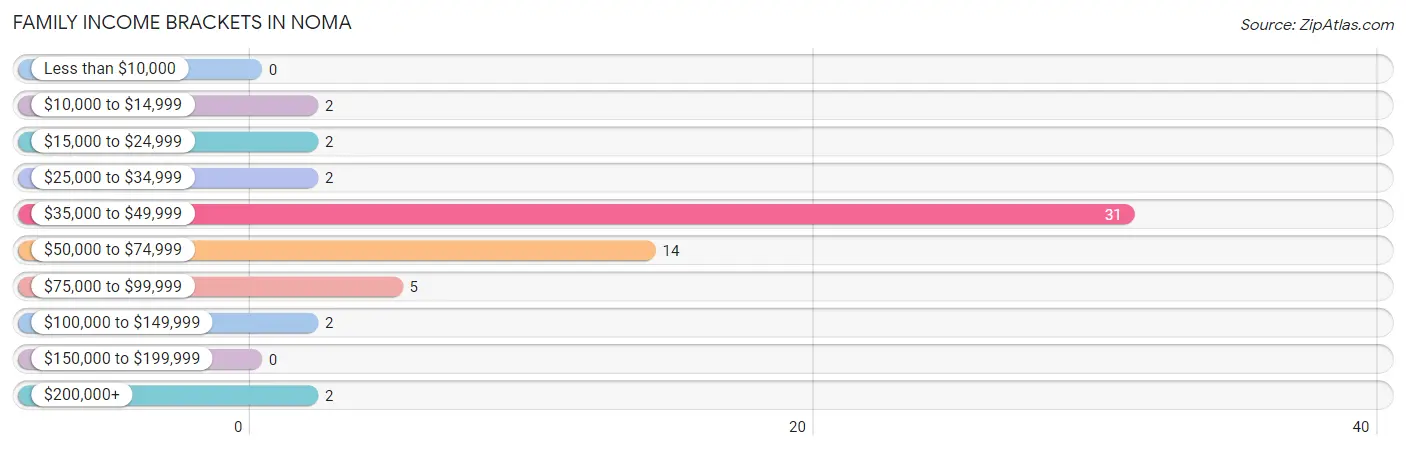
| Income Bracket | # Families | % Families |
| Less than $10,000 | 0 | 0.0% |
| $10,000 to $14,999 | 2 | 3.3% |
| $15,000 to $24,999 | 2 | 3.3% |
| $25,000 to $34,999 | 2 | 3.3% |
| $35,000 to $49,999 | 31 | 51.7% |
| $50,000 to $74,999 | 14 | 23.3% |
| $75,000 to $99,999 | 5 | 8.3% |
| $100,000 to $149,999 | 2 | 3.3% |
| $150,000 to $199,999 | 0 | 0.0% |
| $200,000+ | 2 | 3.3% |
Family Income by Famaliy Size in Noma
4-person families (7 | 11.7%) account for the highest median family income in Noma with $68,125 per family, while 2-person families (38 | 63.3%) have the highest median income of $21,250 per family member.
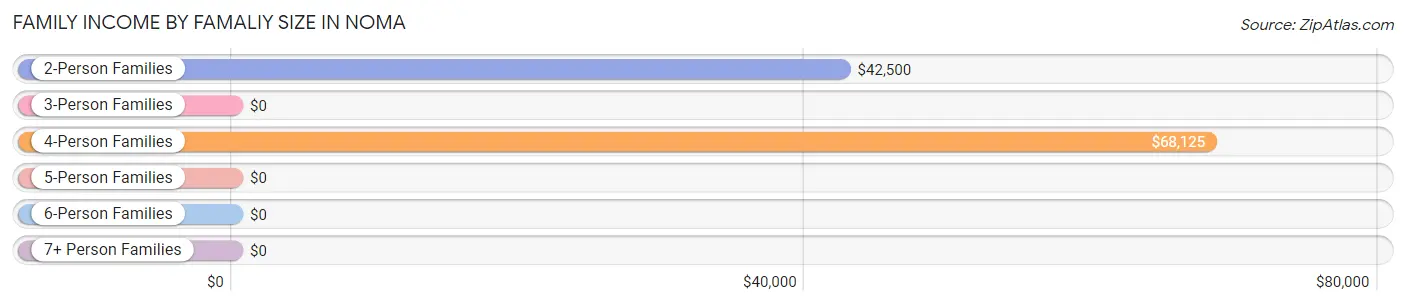
| Income Bracket | # Families | Median Income |
| 2-Person Families | 38 (63.3%) | $42,500 |
| 3-Person Families | 7 (11.7%) | $0 |
| 4-Person Families | 7 (11.7%) | $68,125 |
| 5-Person Families | 5 (8.3%) | $0 |
| 6-Person Families | 1 (1.7%) | $0 |
| 7+ Person Families | 2 (3.3%) | $0 |
| Total | 60 (100.0%) | $43,750 |
Family Income by Number of Earners in Noma
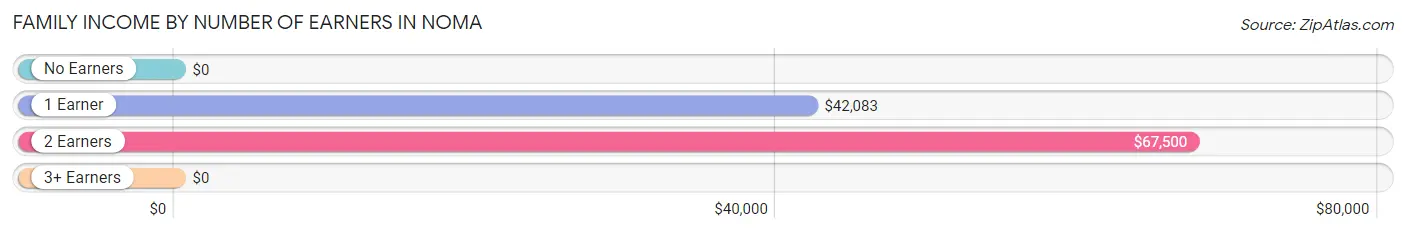
| Number of Earners | # Families | Median Income |
| No Earners | 6 (10.0%) | $0 |
| 1 Earner | 30 (50.0%) | $42,083 |
| 2 Earners | 24 (40.0%) | $67,500 |
| 3+ Earners | 0 (0.0%) | $0 |
| Total | 60 (100.0%) | $43,750 |
Household Income in Noma
Household Income Brackets in Noma
With 33 households falling in the category, the $35,000 to $49,999 income range is the most frequent in Noma, accounting for 34.0% of all households. In contrast, only 2 households (2.1%) fall into the $100,000 to $149,999 income bracket, making it the least populous group.
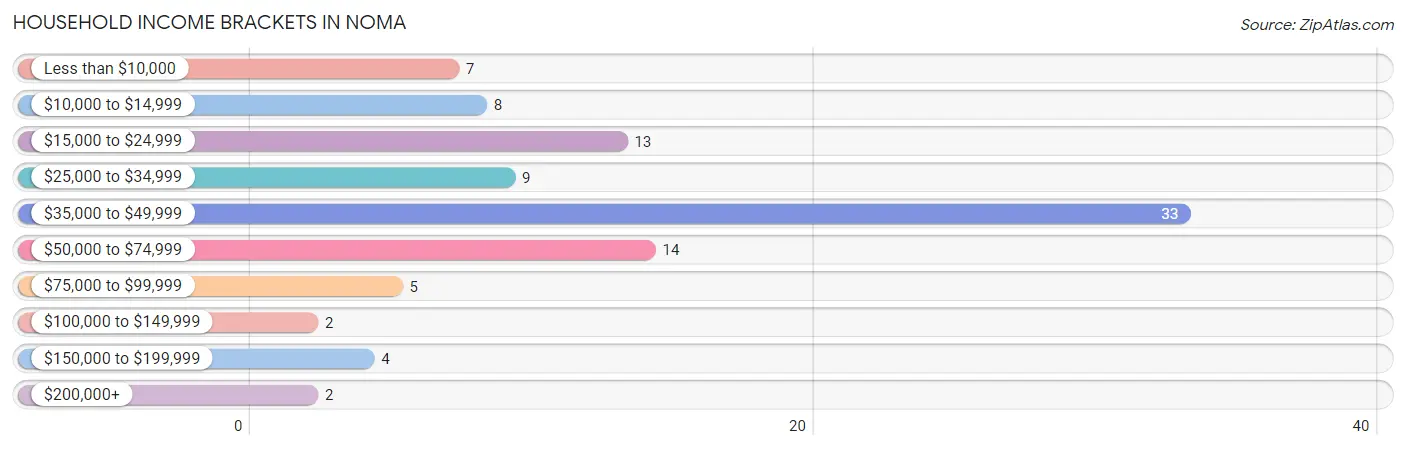
| Income Bracket | # Households | % Households |
| Less than $10,000 | 7 | 7.2% |
| $10,000 to $14,999 | 8 | 8.2% |
| $15,000 to $24,999 | 13 | 13.4% |
| $25,000 to $34,999 | 9 | 9.3% |
| $35,000 to $49,999 | 33 | 34.0% |
| $50,000 to $74,999 | 14 | 14.4% |
| $75,000 to $99,999 | 5 | 5.2% |
| $100,000 to $149,999 | 2 | 2.1% |
| $150,000 to $199,999 | 4 | 4.1% |
| $200,000+ | 2 | 2.1% |
Household Income by Householder Age in Noma
The median household income in Noma is $41,319, with the highest median household income of $48,750 found in the 25 to 44 years age bracket for the primary householder. A total of 22 households (22.7%) fall into this category.
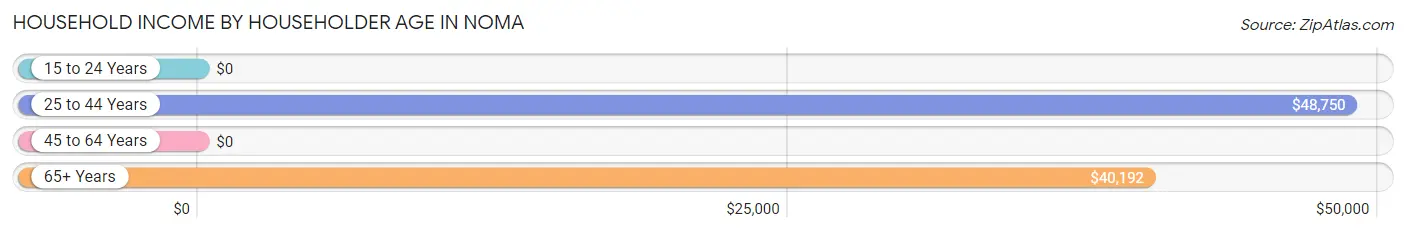
| Income Bracket | # Households | Median Income |
| 15 to 24 Years | 0 (0.0%) | $0 |
| 25 to 44 Years | 22 (22.7%) | $48,750 |
| 45 to 64 Years | 37 (38.1%) | $0 |
| 65+ Years | 38 (39.2%) | $40,192 |
| Total | 97 (100.0%) | $41,319 |
Poverty in Noma
Income Below Poverty by Sex and Age in Noma
With 22.2% poverty level for males and 21.8% for females among the residents of Noma, under 5 year old males and under 5 year old females are the most vulnerable to poverty, with 2 males (100.0%) and 3 females (100.0%) in their respective age groups living below the poverty level.
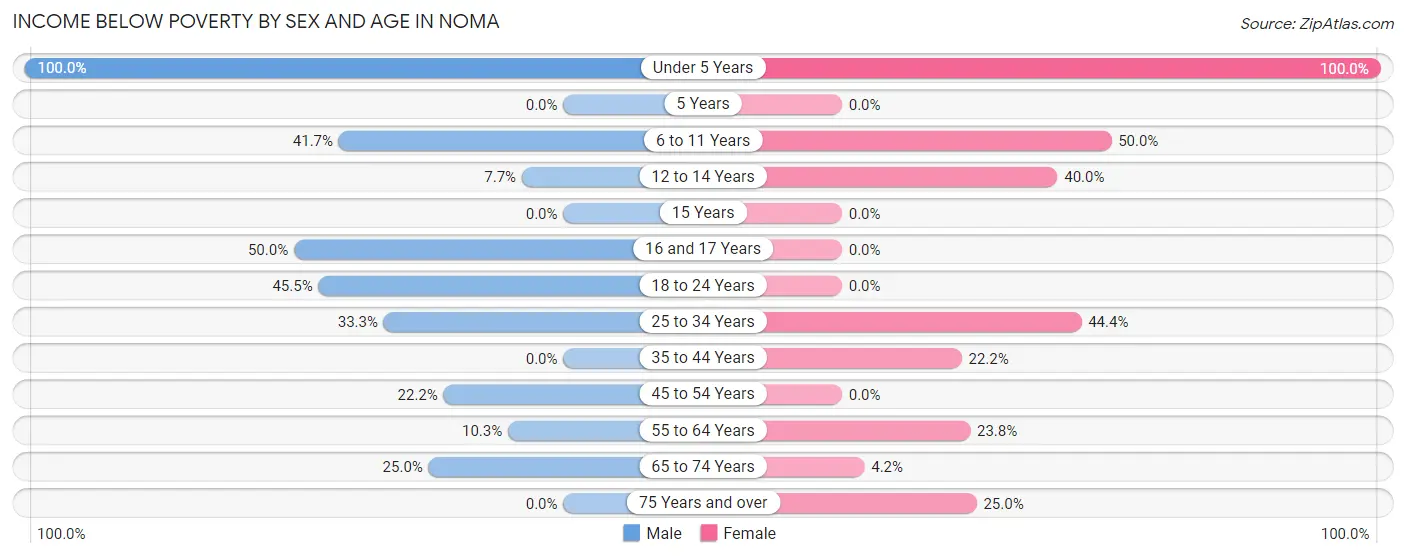
| Age Bracket | Male | Female |
| Under 5 Years | 2 (100.0%) | 3 (100.0%) |
| 5 Years | 0 (0.0%) | 0 (0.0%) |
| 6 to 11 Years | 5 (41.7%) | 3 (50.0%) |
| 12 to 14 Years | 1 (7.7%) | 2 (40.0%) |
| 15 Years | 0 (0.0%) | 0 (0.0%) |
| 16 and 17 Years | 2 (50.0%) | 0 (0.0%) |
| 18 to 24 Years | 5 (45.5%) | 0 (0.0%) |
| 25 to 34 Years | 7 (33.3%) | 4 (44.4%) |
| 35 to 44 Years | 0 (0.0%) | 4 (22.2%) |
| 45 to 54 Years | 4 (22.2%) | 0 (0.0%) |
| 55 to 64 Years | 4 (10.3%) | 5 (23.8%) |
| 65 to 74 Years | 2 (25.0%) | 1 (4.2%) |
| 75 Years and over | 0 (0.0%) | 2 (25.0%) |
| Total | 32 (22.2%) | 24 (21.8%) |
Income Above Poverty by Sex and Age in Noma
According to the poverty statistics in Noma, males aged 5 years and females aged 15 years are the age groups that are most secure financially, with 100.0% of males and 100.0% of females in these age groups living above the poverty line.
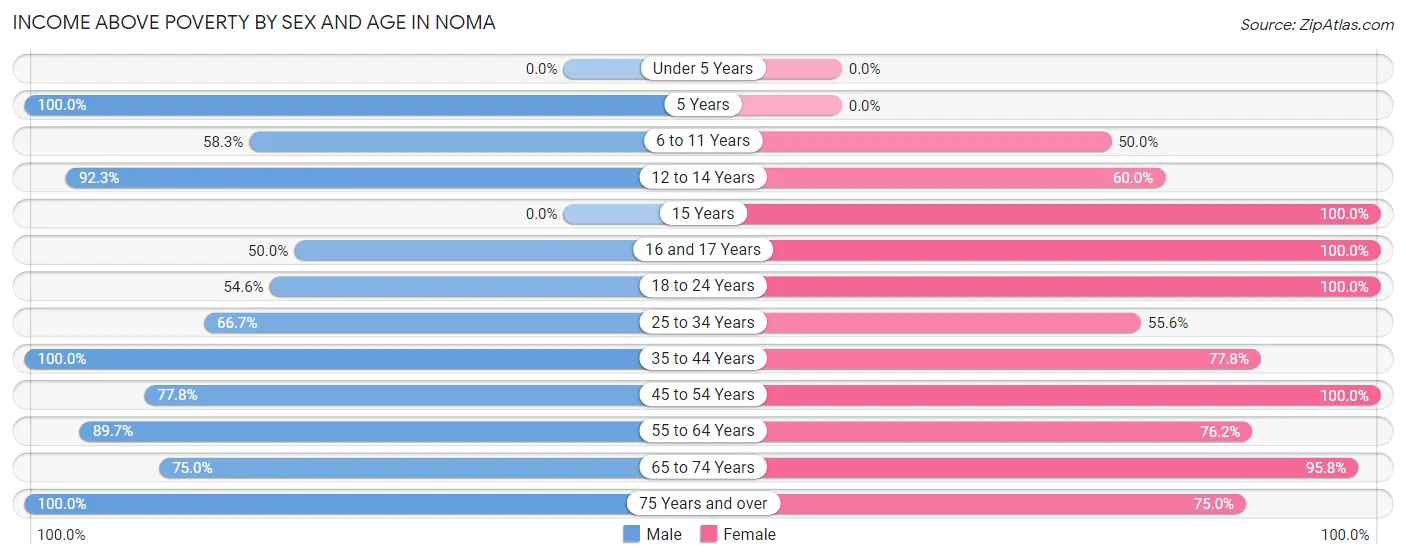
| Age Bracket | Male | Female |
| Under 5 Years | 0 (0.0%) | 0 (0.0%) |
| 5 Years | 2 (100.0%) | 0 (0.0%) |
| 6 to 11 Years | 7 (58.3%) | 3 (50.0%) |
| 12 to 14 Years | 12 (92.3%) | 3 (60.0%) |
| 15 Years | 0 (0.0%) | 7 (100.0%) |
| 16 and 17 Years | 2 (50.0%) | 3 (100.0%) |
| 18 to 24 Years | 6 (54.5%) | 1 (100.0%) |
| 25 to 34 Years | 14 (66.7%) | 5 (55.6%) |
| 35 to 44 Years | 12 (100.0%) | 14 (77.8%) |
| 45 to 54 Years | 14 (77.8%) | 5 (100.0%) |
| 55 to 64 Years | 35 (89.7%) | 16 (76.2%) |
| 65 to 74 Years | 6 (75.0%) | 23 (95.8%) |
| 75 Years and over | 2 (100.0%) | 6 (75.0%) |
| Total | 112 (77.8%) | 86 (78.2%) |
Income Below Poverty Among Married-Couple Families in Noma
The poverty statistics for married-couple families in Noma show that 4.2% or 2 of the total 48 families live below the poverty line. Families with 5 or more children have the highest poverty rate of 100.0%, comprising of 2 families. On the other hand, families with no children have the lowest poverty rate of 0.0%, which includes 0 families.
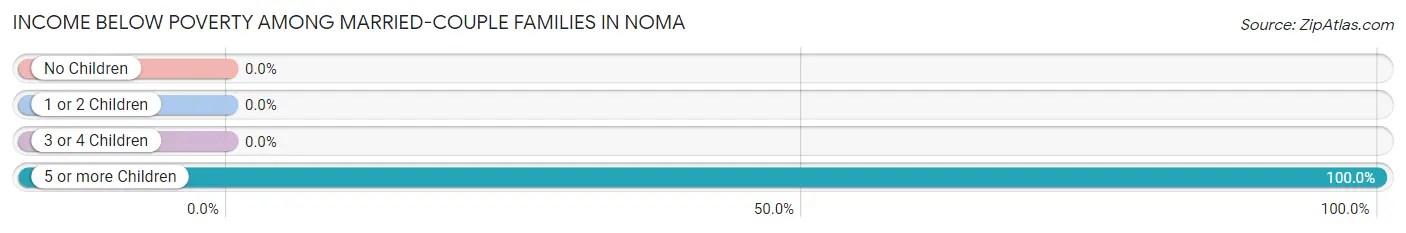
| Children | Above Poverty | Below Poverty |
| No Children | 33 (100.0%) | 0 (0.0%) |
| 1 or 2 Children | 8 (100.0%) | 0 (0.0%) |
| 3 or 4 Children | 5 (100.0%) | 0 (0.0%) |
| 5 or more Children | 0 (0.0%) | 2 (100.0%) |
| Total | 46 (95.8%) | 2 (4.2%) |
Income Below Poverty Among Single-Parent Households in Noma
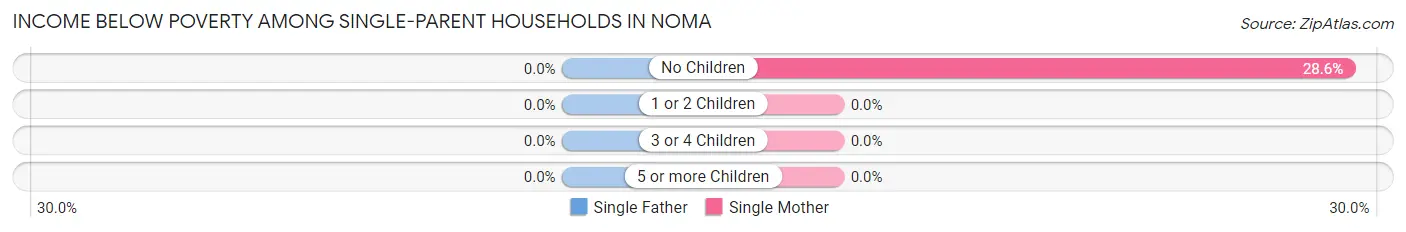
| Children | Single Father | Single Mother |
| No Children | 0 (0.0%) | 2 (28.6%) |
| 1 or 2 Children | 0 (0.0%) | 0 (0.0%) |
| 3 or 4 Children | 0 (0.0%) | 0 (0.0%) |
| 5 or more Children | 0 (0.0%) | 0 (0.0%) |
| Total | 0 (0.0%) | 2 (20.0%) |
Income Below Poverty Among Married-Couple vs Single-Parent Households in Noma
The poverty data for Noma shows that 2 of the married-couple family households (4.2%) and 2 of the single-parent households (16.7%) are living below the poverty level. Within the married-couple family households, those with 5 or more children have the highest poverty rate, with 2 households (100.0%) falling below the poverty line. Among the single-parent households, those with no children have the highest poverty rate, with 2 household (22.2%) living below poverty.
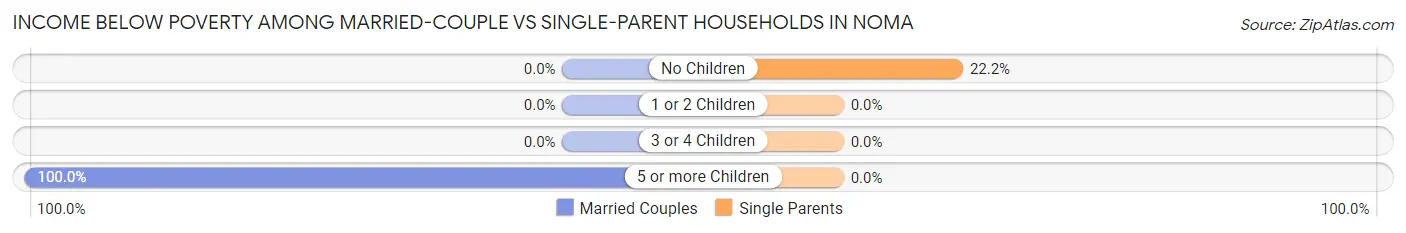
| Children | Married-Couple Families | Single-Parent Households |
| No Children | 0 (0.0%) | 2 (22.2%) |
| 1 or 2 Children | 0 (0.0%) | 0 (0.0%) |
| 3 or 4 Children | 0 (0.0%) | 0 (0.0%) |
| 5 or more Children | 2 (100.0%) | 0 (0.0%) |
| Total | 2 (4.2%) | 2 (16.7%) |
Race in Noma
The most populous races in Noma are White / Caucasian (195 | 76.8%), Black / African American (53 | 20.9%), and Two or more Races (6 | 2.4%).
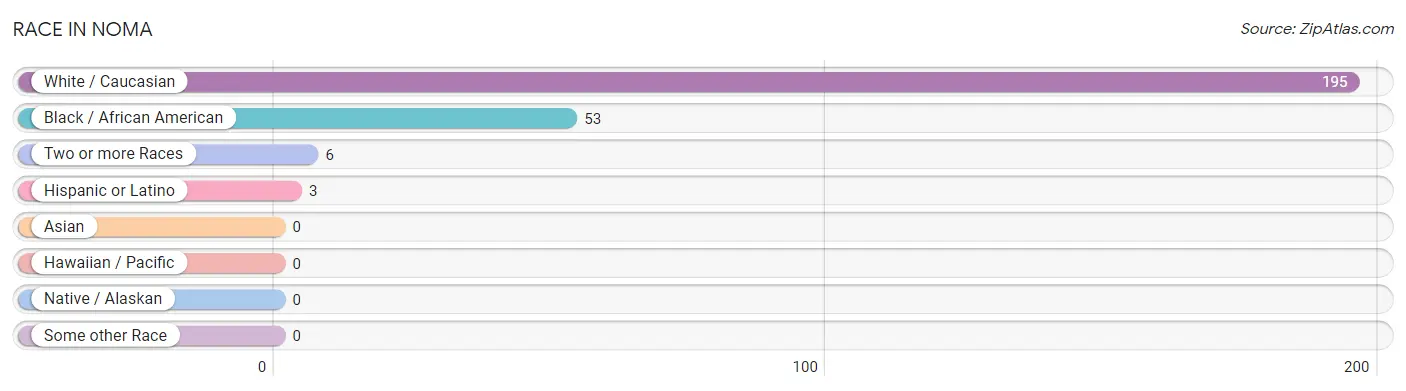
| Race | # Population | % Population |
| Asian | 0 | 0.0% |
| Black / African American | 53 | 20.9% |
| Hawaiian / Pacific | 0 | 0.0% |
| Hispanic or Latino | 3 | 1.2% |
| Native / Alaskan | 0 | 0.0% |
| White / Caucasian | 195 | 76.8% |
| Two or more Races | 6 | 2.4% |
| Some other Race | 0 | 0.0% |
| Total | 254 | 100.0% |
Ancestry in Noma
The most populous ancestries reported in Noma are American (75 | 29.5%), English (30 | 11.8%), Scottish (17 | 6.7%), Haitian (11 | 4.3%), and Irish (11 | 4.3%), together accounting for 56.7% of all Noma residents.
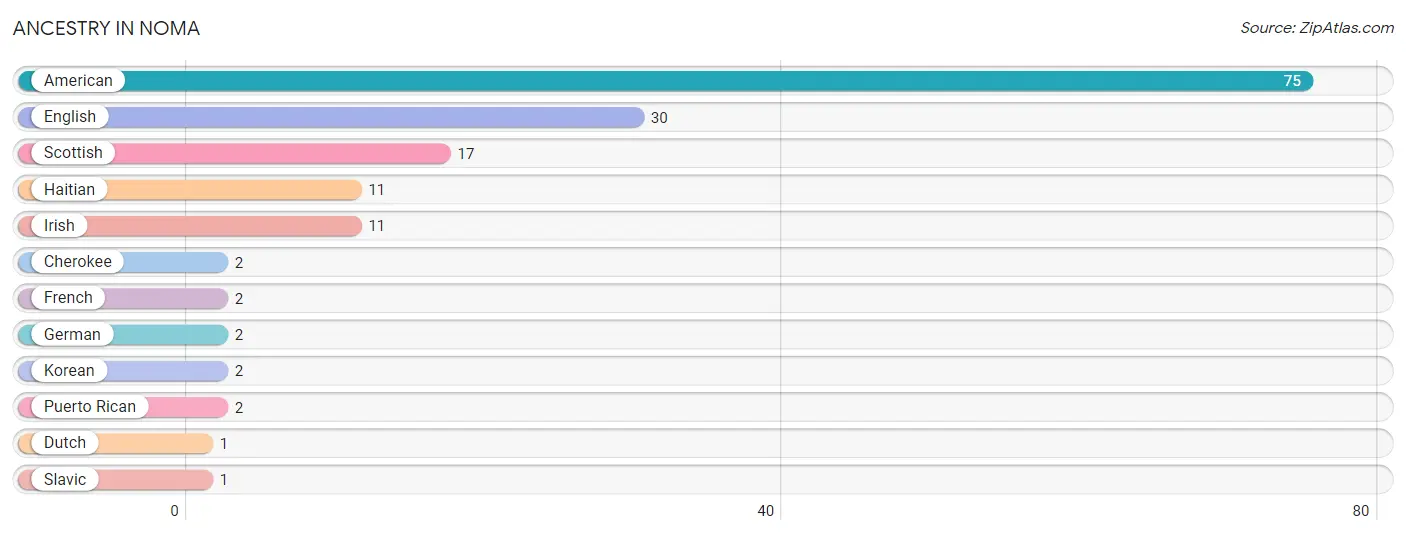
| Ancestry | # Population | % Population |
| American | 75 | 29.5% |
| Cherokee | 2 | 0.8% |
| Dutch | 1 | 0.4% |
| English | 30 | 11.8% |
| French | 2 | 0.8% |
| German | 2 | 0.8% |
| Haitian | 11 | 4.3% |
| Irish | 11 | 4.3% |
| Korean | 2 | 0.8% |
| Puerto Rican | 2 | 0.8% |
| Scottish | 17 | 6.7% |
| Slavic | 1 | 0.4% | View All 12 Rows |
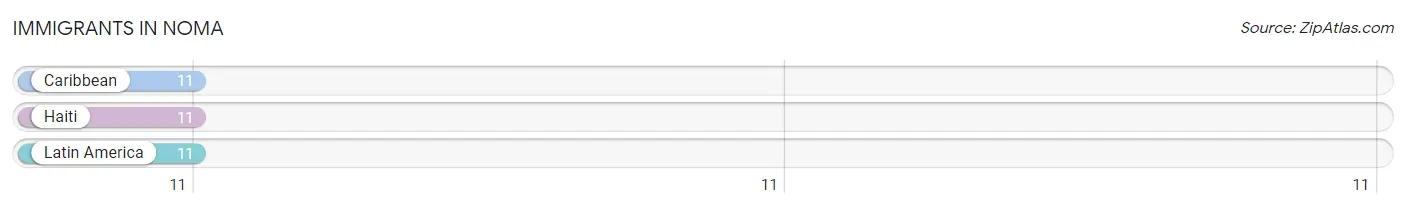
Immigrants in Noma
The most numerous immigrant groups reported in Noma came from Caribbean (11 | 4.3%), Haiti (11 | 4.3%), and Latin America (11 | 4.3%), together accounting for 13.0% of all Noma residents.
| Immigration Origin | # Population | % Population |
| Caribbean | 11 | 4.3% |
| Haiti | 11 | 4.3% |
| Latin America | 11 | 4.3% | View All 3 Rows |
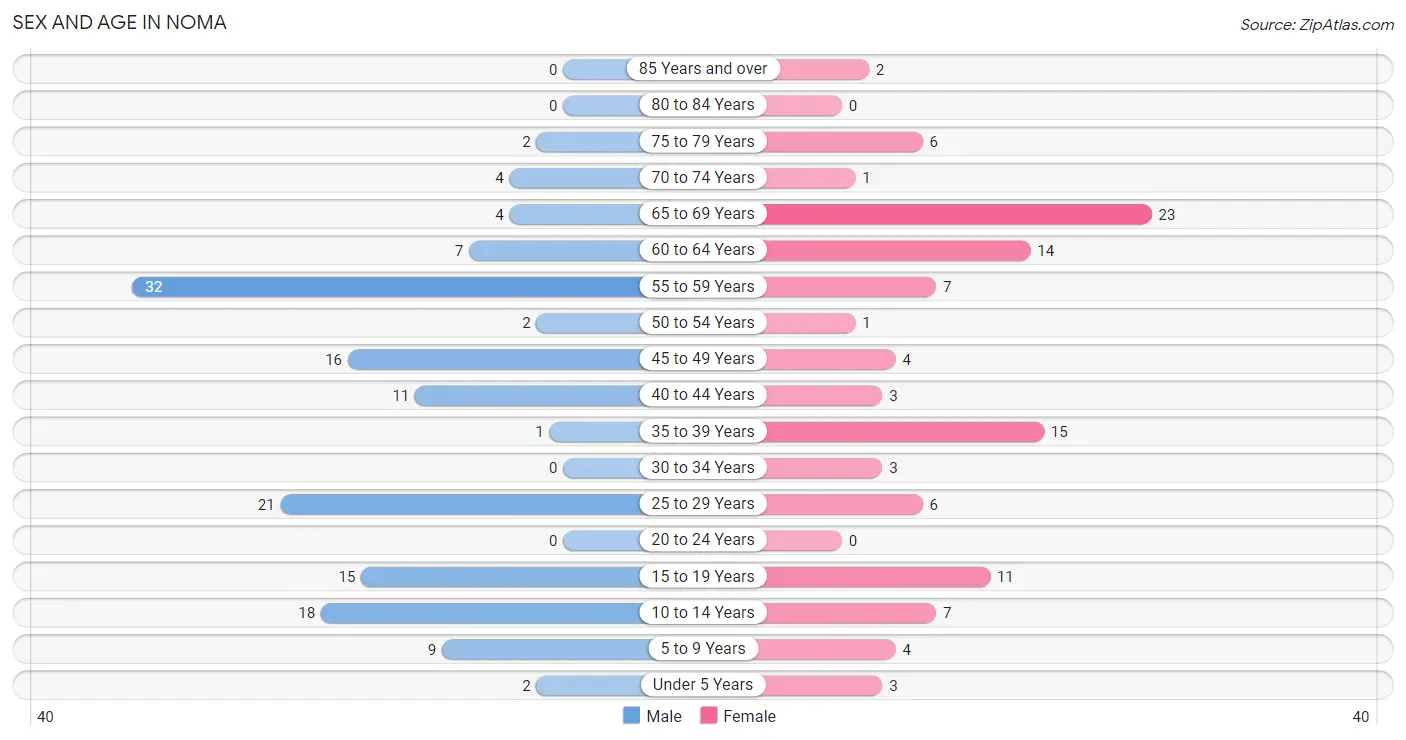
Sex and Age in Noma
Sex and Age in Noma
The most populous age groups in Noma are 55 to 59 Years (32 | 22.2%) for men and 65 to 69 Years (23 | 20.9%) for women.
| Age Bracket | Male | Female |
| Under 5 Years | 2 (1.4%) | 3 (2.7%) |
| 5 to 9 Years | 9 (6.2%) | 4 (3.6%) |
| 10 to 14 Years | 18 (12.5%) | 7 (6.4%) |
| 15 to 19 Years | 15 (10.4%) | 11 (10.0%) |
| 20 to 24 Years | 0 (0.0%) | 0 (0.0%) |
| 25 to 29 Years | 21 (14.6%) | 6 (5.4%) |
| 30 to 34 Years | 0 (0.0%) | 3 (2.7%) |
| 35 to 39 Years | 1 (0.7%) | 15 (13.6%) |
| 40 to 44 Years | 11 (7.6%) | 3 (2.7%) |
| 45 to 49 Years | 16 (11.1%) | 4 (3.6%) |
| 50 to 54 Years | 2 (1.4%) | 1 (0.9%) |
| 55 to 59 Years | 32 (22.2%) | 7 (6.4%) |
| 60 to 64 Years | 7 (4.9%) | 14 (12.7%) |
| 65 to 69 Years | 4 (2.8%) | 23 (20.9%) |
| 70 to 74 Years | 4 (2.8%) | 1 (0.9%) |
| 75 to 79 Years | 2 (1.4%) | 6 (5.4%) |
| 80 to 84 Years | 0 (0.0%) | 0 (0.0%) |
| 85 Years and over | 0 (0.0%) | 2 (1.8%) |
| Total | 144 (100.0%) | 110 (100.0%) |
Families and Households in Noma
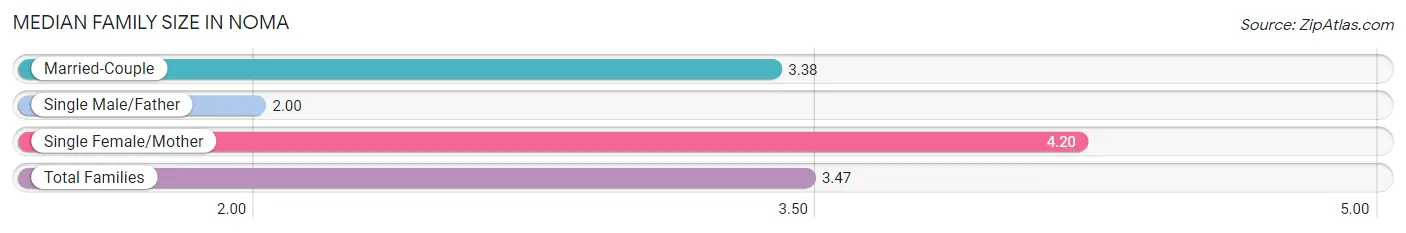
Median Family Size in Noma
The median family size in Noma is 3.47 persons per family, with single female/mother families (10 | 16.7%) accounting for the largest median family size of 4.2 persons per family. On the other hand, single male/father families (2 | 3.3%) represent the smallest median family size with 2.00 persons per family.
| Family Type | # Families | Family Size |
| Married-Couple | 48 (80.0%) | 3.38 |
| Single Male/Father | 2 (3.3%) | 2.00 |
| Single Female/Mother | 10 (16.7%) | 4.20 |
| Total Families | 60 (100.0%) | 3.47 |
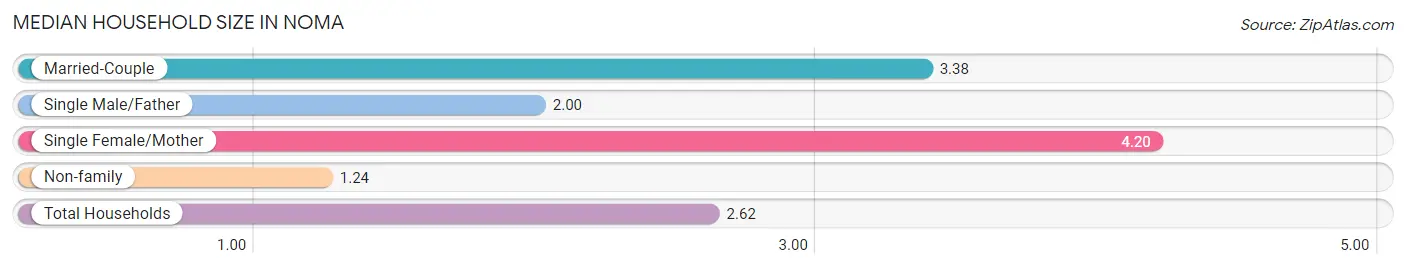
Median Household Size in Noma
The median household size in Noma is 2.62 persons per household, with single female/mother households (10 | 10.3%) accounting for the largest median household size of 4.2 persons per household. non-family households (37 | 38.1%) represent the smallest median household size with 1.24 persons per household.
| Household Type | # Households | Household Size |
| Married-Couple | 48 (49.5%) | 3.38 |
| Single Male/Father | 2 (2.1%) | 2.00 |
| Single Female/Mother | 10 (10.3%) | 4.20 |
| Non-family | 37 (38.1%) | 1.24 |
| Total Households | 97 (100.0%) | 2.62 |
Household Size by Marriage Status in Noma
Out of a total of 97 households in Noma, 60 (61.9%) are family households, while 37 (38.1%) are nonfamily households. The most numerous type of family households are 2-person households, comprising 38, and the most common type of nonfamily households are 1-person households, comprising 29.
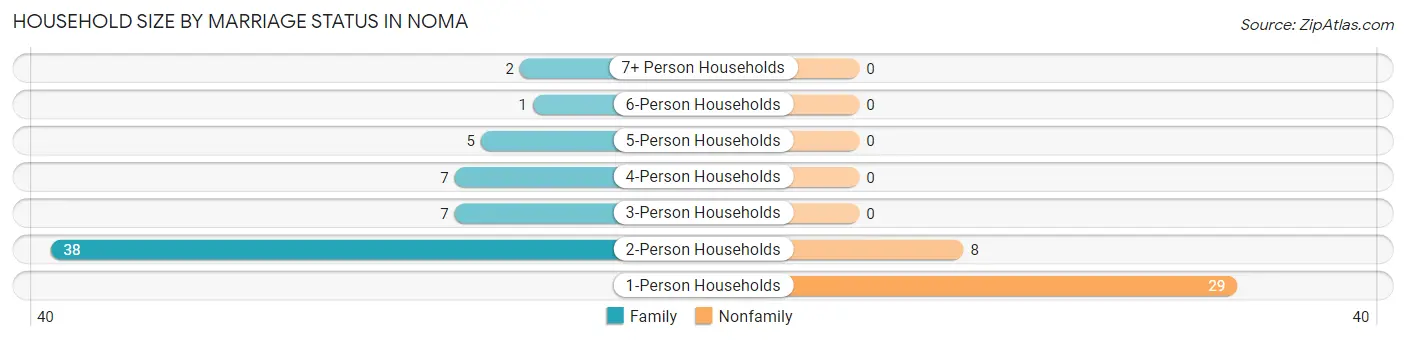
| Household Size | Family Households | Nonfamily Households |
| 1-Person Households | - | 29 (29.9%) |
| 2-Person Households | 38 (39.2%) | 8 (8.3%) |
| 3-Person Households | 7 (7.2%) | 0 (0.0%) |
| 4-Person Households | 7 (7.2%) | 0 (0.0%) |
| 5-Person Households | 5 (5.1%) | 0 (0.0%) |
| 6-Person Households | 1 (1.0%) | 0 (0.0%) |
| 7+ Person Households | 2 (2.1%) | 0 (0.0%) |
| Total | 60 (61.9%) | 37 (38.1%) |
Female Fertility in Noma
Fertility by Age in Noma
| Age Bracket | Women with Births | Births / 1,000 Women |
| 15 to 19 years | 0 (0.0%) | 0.0 |
| 20 to 34 years | 0 (0.0%) | 0.0 |
| 35 to 50 years | 0 (0.0%) | 0.0 |
| Total | 0 (0.0%) | 0.0 |
Fertility by Age by Marriage Status in Noma
| Age Bracket | Married | Unmarried |
| 15 to 19 years | 0 (0.0%) | 0 (0.0%) |
| 20 to 34 years | 0 (0.0%) | 0 (0.0%) |
| 35 to 50 years | 0 (0.0%) | 0 (0.0%) |
| Total | 0 (0.0%) | 0 (0.0%) |
Fertility by Education in Noma
| Educational Attainment | Women with Births | Births / 1,000 Women |
| Less than High School | 0 (0.0%) | 0.0 |
| High School Diploma | 0 (0.0%) | 0.0 |
| College or Associate's Degree | 0 (0.0%) | 0.0 |
| Bachelor's Degree | 0 (0.0%) | 0.0 |
| Graduate Degree | 0 (0.0%) | 0.0 |
| Total | 0 (0.0%) | 0.0 |
Fertility by Education by Marriage Status in Noma
| Educational Attainment | Married | Unmarried |
| Less than High School | 0 (0.0%) | 0 (0.0%) |
| High School Diploma | 0 (0.0%) | 0 (0.0%) |
| College or Associate's Degree | 0 (0.0%) | 0 (0.0%) |
| Bachelor's Degree | 0 (0.0%) | 0 (0.0%) |
| Graduate Degree | 0 (0.0%) | 0 (0.0%) |
| Total | 0 (0.0%) | 0 (0.0%) |
Employment Characteristics in Noma
Employment by Class of Employer in Noma
Among the 106 employed individuals in Noma, private company employees (54 | 50.9%), federal government employees (17 | 16.0%), and state government employees (13 | 12.3%) make up the most common classes of employment.
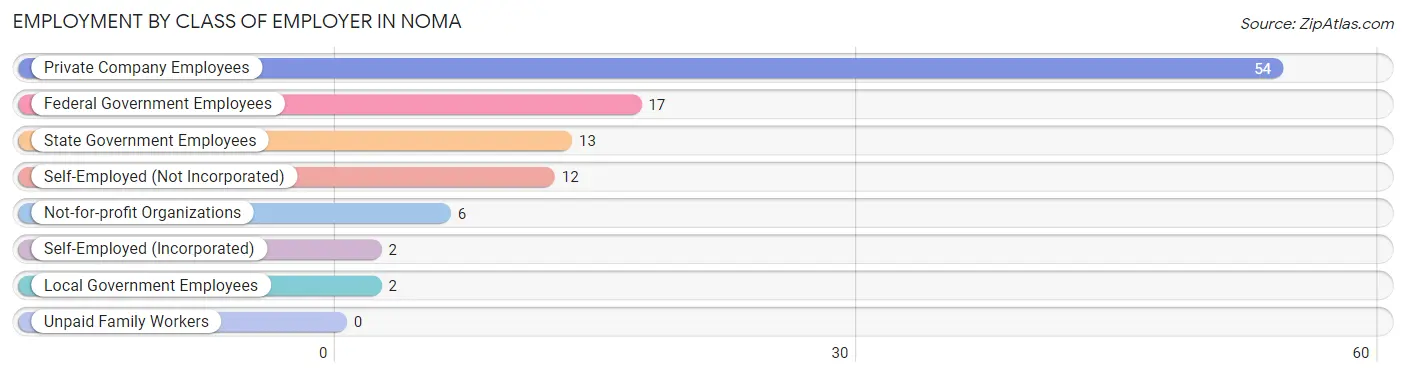
| Employer Class | # Employees | % Employees |
| Private Company Employees | 54 | 50.9% |
| Self-Employed (Incorporated) | 2 | 1.9% |
| Self-Employed (Not Incorporated) | 12 | 11.3% |
| Not-for-profit Organizations | 6 | 5.7% |
| Local Government Employees | 2 | 1.9% |
| State Government Employees | 13 | 12.3% |
| Federal Government Employees | 17 | 16.0% |
| Unpaid Family Workers | 0 | 0.0% |
| Total | 106 | 100.0% |
Employment Status by Age in Noma
According to the labor force statistics for Noma, out of the total population over 16 years of age (204), 53.9% or 110 individuals are in the labor force, with 3.6% or 4 of them unemployed. The age group with the highest labor force participation rate is 30 to 34 years, with 100.0% or 3 individuals in the labor force. Within the labor force, the 35 to 44 years age range has the highest percentage of unemployed individuals, with 8.0% or 2 of them being unemployed.
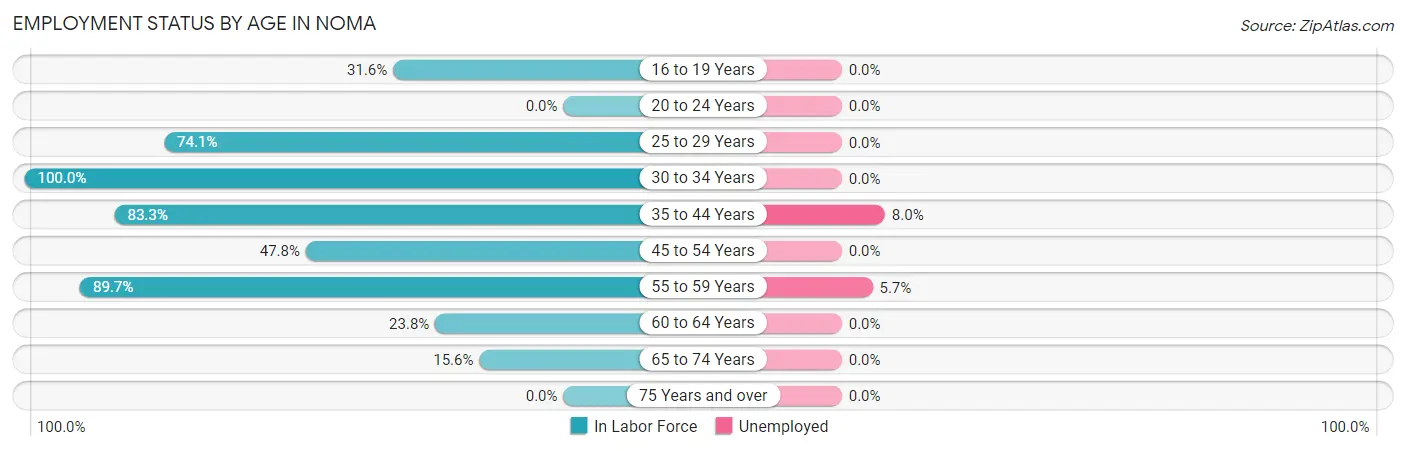
| Age Bracket | In Labor Force | Unemployed |
| 16 to 19 Years | 6 (31.6%) | 0 (0.0%) |
| 20 to 24 Years | 0 (0.0%) | 0 (0.0%) |
| 25 to 29 Years | 20 (74.1%) | 0 (0.0%) |
| 30 to 34 Years | 3 (100.0%) | 0 (0.0%) |
| 35 to 44 Years | 25 (83.3%) | 2 (8.0%) |
| 45 to 54 Years | 11 (47.8%) | 0 (0.0%) |
| 55 to 59 Years | 35 (89.7%) | 2 (5.7%) |
| 60 to 64 Years | 5 (23.8%) | 0 (0.0%) |
| 65 to 74 Years | 5 (15.6%) | 0 (0.0%) |
| 75 Years and over | 0 (0.0%) | 0 (0.0%) |
| Total | 110 (53.9%) | 4 (3.6%) |
Employment Status by Educational Attainment in Noma
According to labor force statistics for Noma, 69.2% of individuals (99) out of the total population between 25 and 64 years of age (143) are in the labor force, with 4.0% or 4 of them being unemployed. The group with the highest labor force participation rate are those with the educational attainment of college / associate degree, with 95.7% or 22 individuals in the labor force. Within the labor force, individuals with high school diploma education have the highest percentage of unemployment, with 8.5% or 4 of them being unemployed.
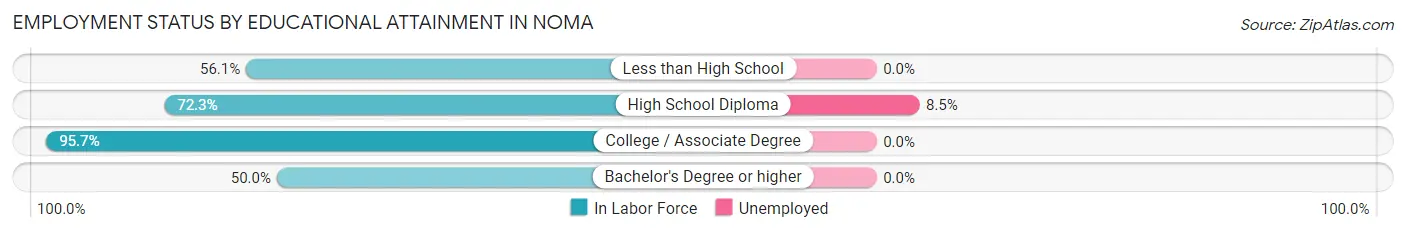
| Educational Attainment | In Labor Force | Unemployed |
| Less than High School | 23 (56.1%) | 0 (0.0%) |
| High School Diploma | 47 (72.3%) | 6 (8.5%) |
| College / Associate Degree | 22 (95.7%) | 0 (0.0%) |
| Bachelor's Degree or higher | 7 (50.0%) | 0 (0.0%) |
| Total | 99 (69.2%) | 6 (4.0%) |
Employment Occupations by Sex in Noma
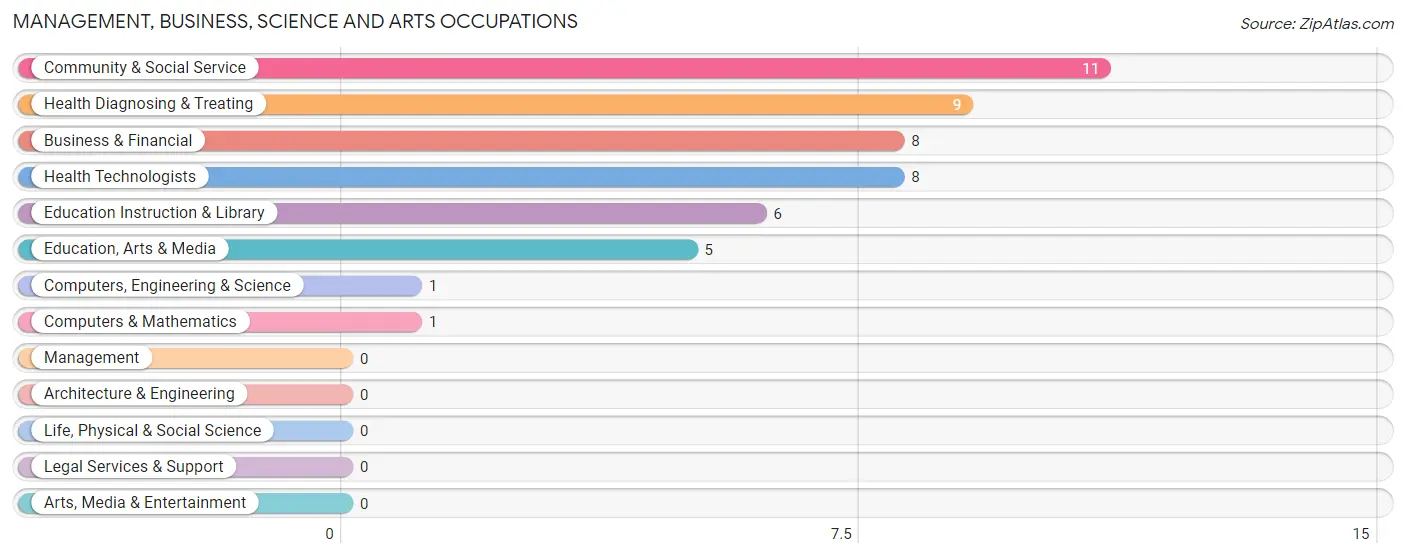
Management, Business, Science and Arts Occupations
The most common Management, Business, Science and Arts occupations in Noma are Community & Social Service (11 | 10.4%), Health Diagnosing & Treating (9 | 8.5%), Business & Financial (8 | 7.5%), Health Technologists (8 | 7.5%), and Education Instruction & Library (6 | 5.7%).
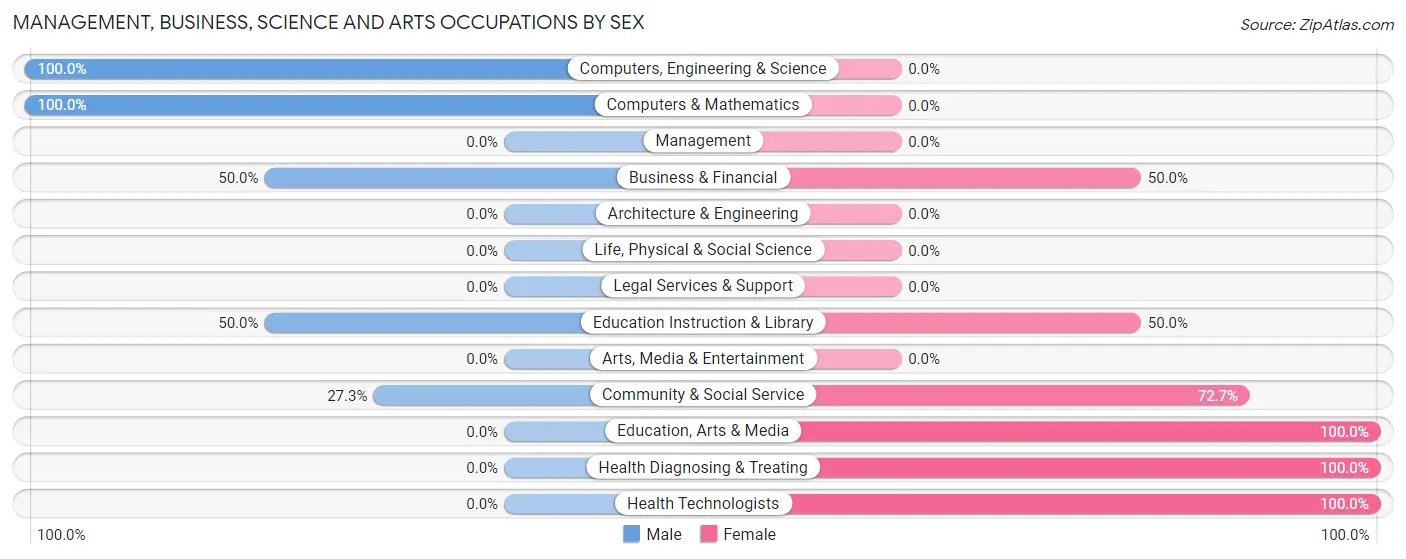
Management, Business, Science and Arts Occupations by Sex
Within the Management, Business, Science and Arts occupations in Noma, the most male-oriented occupations are Computers, Engineering & Science (100.0%), Computers & Mathematics (100.0%), and Business & Financial (50.0%), while the most female-oriented occupations are Education, Arts & Media (100.0%), Health Diagnosing & Treating (100.0%), and Health Technologists (100.0%).
| Occupation | Male | Female |
| Management | 0 (0.0%) | 0 (0.0%) |
| Business & Financial | 4 (50.0%) | 4 (50.0%) |
| Computers, Engineering & Science | 1 (100.0%) | 0 (0.0%) |
| Computers & Mathematics | 1 (100.0%) | 0 (0.0%) |
| Architecture & Engineering | 0 (0.0%) | 0 (0.0%) |
| Life, Physical & Social Science | 0 (0.0%) | 0 (0.0%) |
| Community & Social Service | 3 (27.3%) | 8 (72.7%) |
| Education, Arts & Media | 0 (0.0%) | 5 (100.0%) |
| Legal Services & Support | 0 (0.0%) | 0 (0.0%) |
| Education Instruction & Library | 3 (50.0%) | 3 (50.0%) |
| Arts, Media & Entertainment | 0 (0.0%) | 0 (0.0%) |
| Health Diagnosing & Treating | 0 (0.0%) | 9 (100.0%) |
| Health Technologists | 0 (0.0%) | 8 (100.0%) |
| Total (Category) | 8 (27.6%) | 21 (72.4%) |
| Total (Overall) | 67 (63.2%) | 39 (36.8%) |
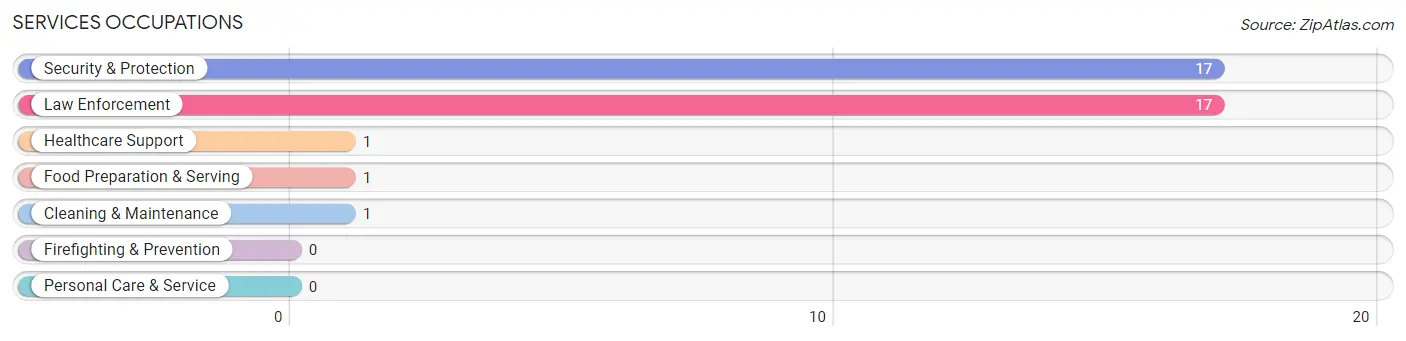
Services Occupations
The most common Services occupations in Noma are Security & Protection (17 | 16.0%), Law Enforcement (17 | 16.0%), Healthcare Support (1 | 0.9%), Food Preparation & Serving (1 | 0.9%), and Cleaning & Maintenance (1 | 0.9%).
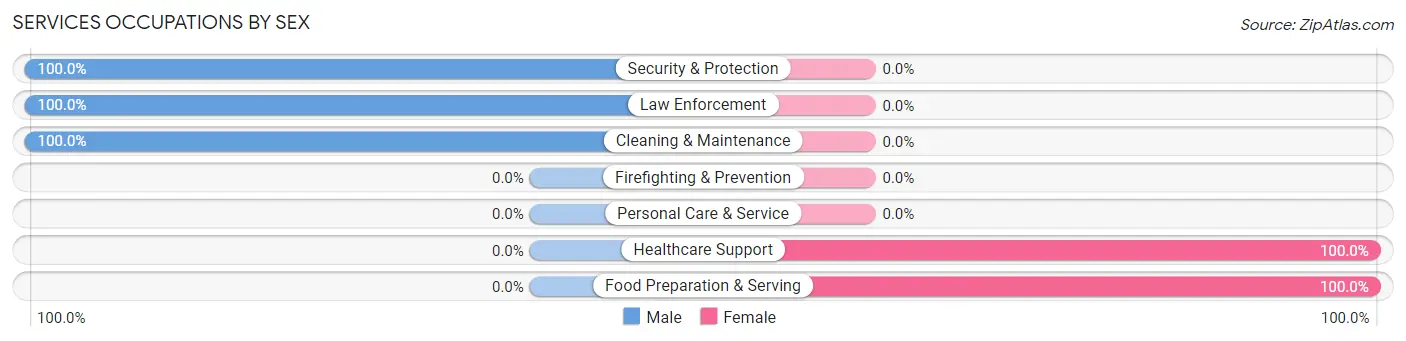
Services Occupations by Sex
Within the Services occupations in Noma, the most male-oriented occupations are Security & Protection (100.0%), Law Enforcement (100.0%), and Cleaning & Maintenance (100.0%), while the most female-oriented occupations are Healthcare Support (100.0%), and Food Preparation & Serving (100.0%).
| Occupation | Male | Female |
| Healthcare Support | 0 (0.0%) | 1 (100.0%) |
| Security & Protection | 17 (100.0%) | 0 (0.0%) |
| Firefighting & Prevention | 0 (0.0%) | 0 (0.0%) |
| Law Enforcement | 17 (100.0%) | 0 (0.0%) |
| Food Preparation & Serving | 0 (0.0%) | 1 (100.0%) |
| Cleaning & Maintenance | 1 (100.0%) | 0 (0.0%) |
| Personal Care & Service | 0 (0.0%) | 0 (0.0%) |
| Total (Category) | 18 (90.0%) | 2 (10.0%) |
| Total (Overall) | 67 (63.2%) | 39 (36.8%) |
Sales and Office Occupations
The most common Sales and Office occupations in Noma are Office & Administration (10 | 9.4%), and Sales & Related (8 | 7.5%).
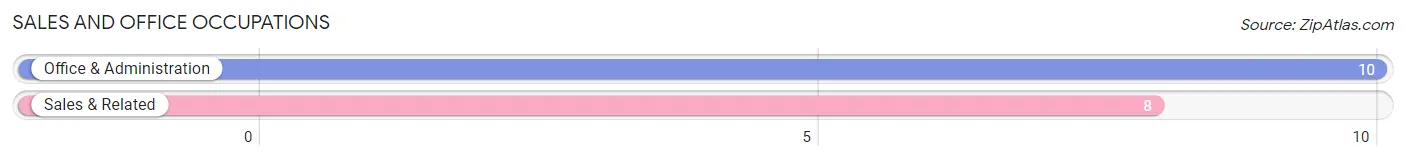
Sales and Office Occupations by Sex
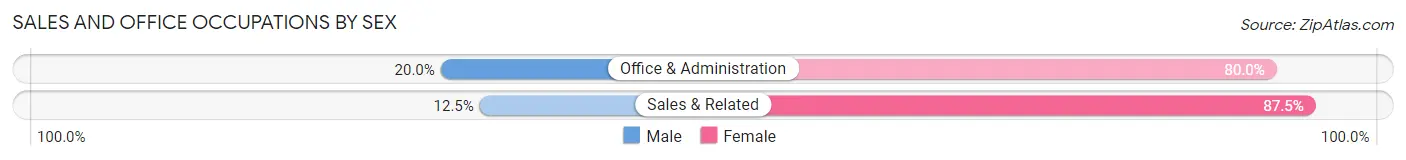
| Occupation | Male | Female |
| Sales & Related | 1 (12.5%) | 7 (87.5%) |
| Office & Administration | 2 (20.0%) | 8 (80.0%) |
| Total (Category) | 3 (16.7%) | 15 (83.3%) |
| Total (Overall) | 67 (63.2%) | 39 (36.8%) |
Natural Resources, Construction and Maintenance Occupations
The most common Natural Resources, Construction and Maintenance occupations in Noma are Construction & Extraction (14 | 13.2%), and Farming, Fishing & Forestry (2 | 1.9%).
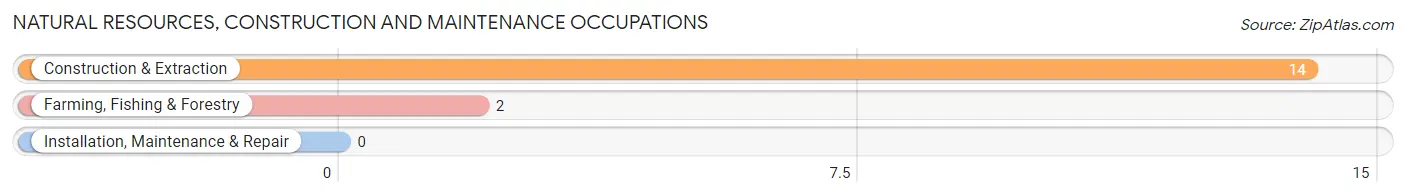
Natural Resources, Construction and Maintenance Occupations by Sex
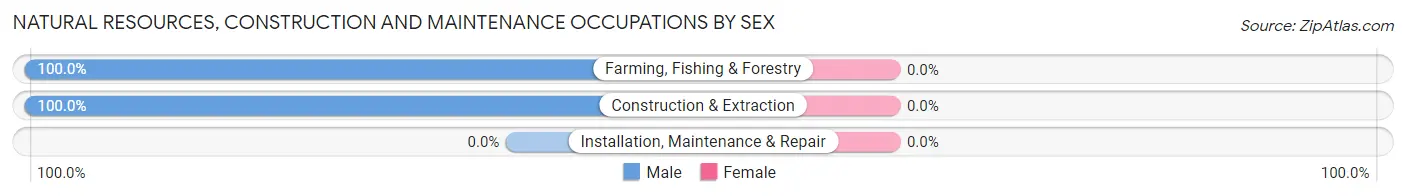
| Occupation | Male | Female |
| Farming, Fishing & Forestry | 2 (100.0%) | 0 (0.0%) |
| Construction & Extraction | 14 (100.0%) | 0 (0.0%) |
| Installation, Maintenance & Repair | 0 (0.0%) | 0 (0.0%) |
| Total (Category) | 16 (100.0%) | 0 (0.0%) |
| Total (Overall) | 67 (63.2%) | 39 (36.8%) |
Production, Transportation and Moving Occupations
The most common Production, Transportation and Moving occupations in Noma are Material Moving (12 | 11.3%), Transportation (10 | 9.4%), and Production (1 | 0.9%).
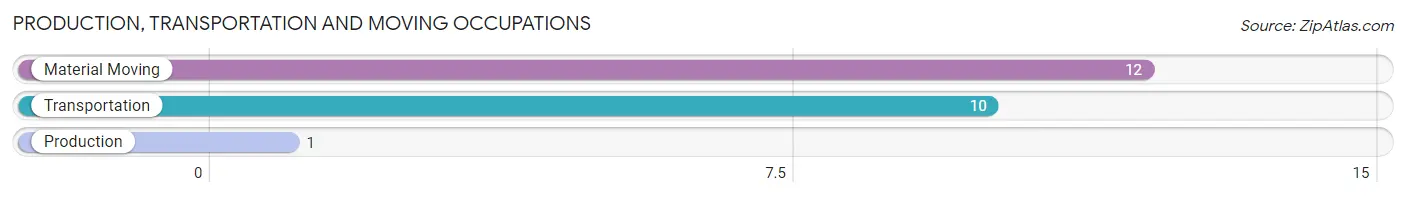
Production, Transportation and Moving Occupations by Sex
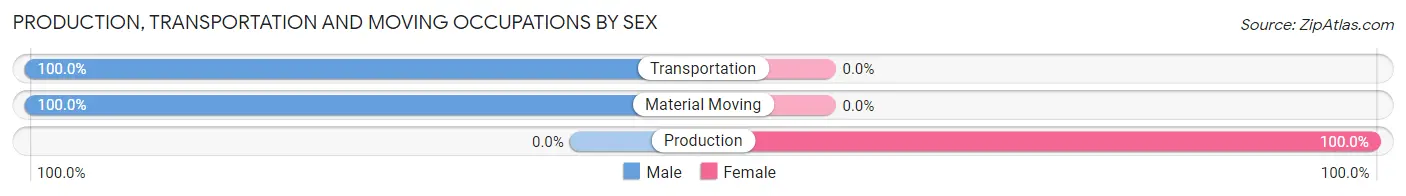
| Occupation | Male | Female |
| Production | 0 (0.0%) | 1 (100.0%) |
| Transportation | 10 (100.0%) | 0 (0.0%) |
| Material Moving | 12 (100.0%) | 0 (0.0%) |
| Total (Category) | 22 (95.7%) | 1 (4.3%) |
| Total (Overall) | 67 (63.2%) | 39 (36.8%) |
Employment Industries by Sex in Noma
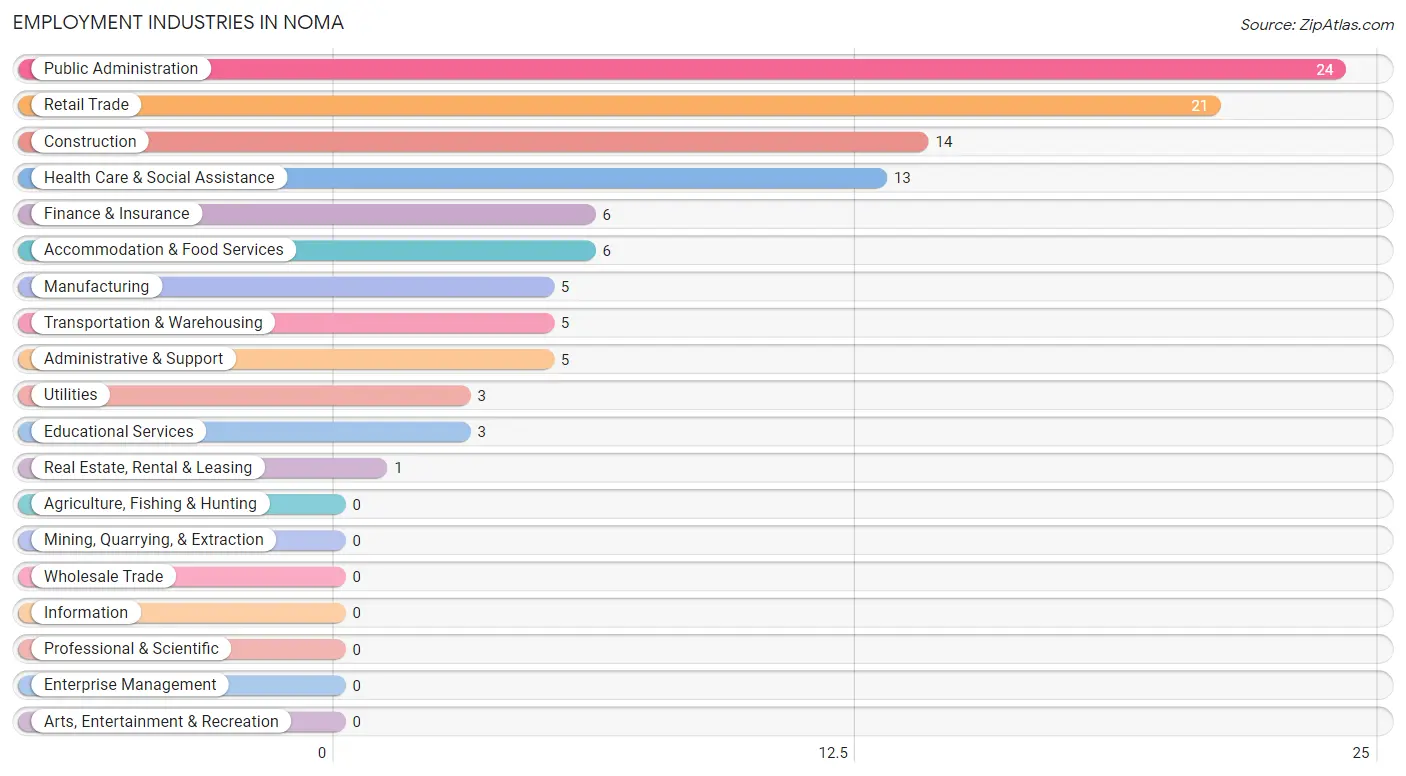
Employment Industries in Noma
The major employment industries in Noma include Public Administration (24 | 22.6%), Retail Trade (21 | 19.8%), Construction (14 | 13.2%), Health Care & Social Assistance (13 | 12.3%), and Finance & Insurance (6 | 5.7%).
Employment Industries by Sex in Noma
The Noma industries that see more men than women are Transportation & Warehousing (100.0%), Utilities (100.0%), and Administrative & Support (100.0%), whereas the industries that tend to have a higher number of women are Real Estate, Rental & Leasing (100.0%), Educational Services (100.0%), and Health Care & Social Assistance (92.3%).
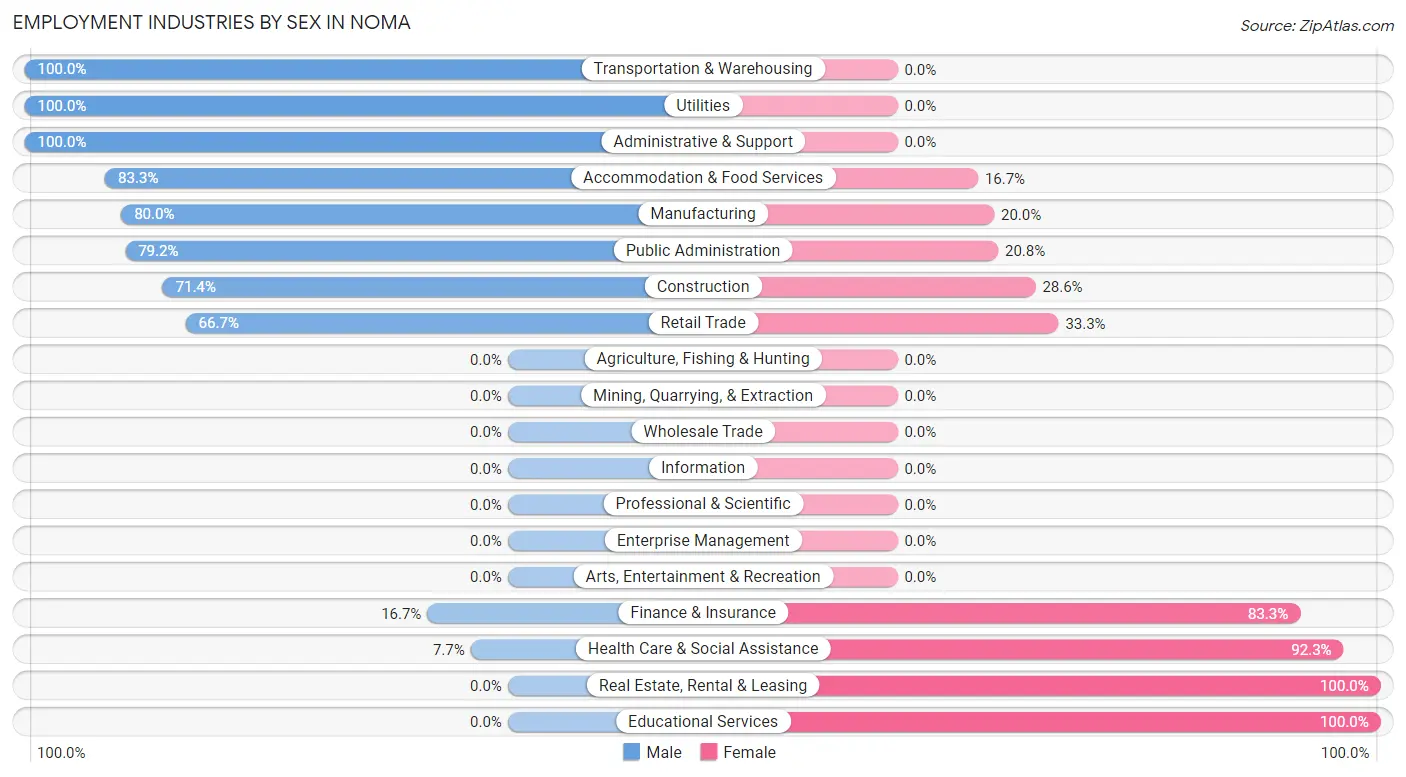
| Industry | Male | Female |
| Agriculture, Fishing & Hunting | 0 (0.0%) | 0 (0.0%) |
| Mining, Quarrying, & Extraction | 0 (0.0%) | 0 (0.0%) |
| Construction | 10 (71.4%) | 4 (28.6%) |
| Manufacturing | 4 (80.0%) | 1 (20.0%) |
| Wholesale Trade | 0 (0.0%) | 0 (0.0%) |
| Retail Trade | 14 (66.7%) | 7 (33.3%) |
| Transportation & Warehousing | 5 (100.0%) | 0 (0.0%) |
| Utilities | 3 (100.0%) | 0 (0.0%) |
| Information | 0 (0.0%) | 0 (0.0%) |
| Finance & Insurance | 1 (16.7%) | 5 (83.3%) |
| Real Estate, Rental & Leasing | 0 (0.0%) | 1 (100.0%) |
| Professional & Scientific | 0 (0.0%) | 0 (0.0%) |
| Enterprise Management | 0 (0.0%) | 0 (0.0%) |
| Administrative & Support | 5 (100.0%) | 0 (0.0%) |
| Educational Services | 0 (0.0%) | 3 (100.0%) |
| Health Care & Social Assistance | 1 (7.7%) | 12 (92.3%) |
| Arts, Entertainment & Recreation | 0 (0.0%) | 0 (0.0%) |
| Accommodation & Food Services | 5 (83.3%) | 1 (16.7%) |
| Public Administration | 19 (79.2%) | 5 (20.8%) |
| Total | 67 (63.2%) | 39 (36.8%) |
Education in Noma
School Enrollment in Noma
The most common levels of schooling among the 68 students in Noma are middle school (28 | 41.2%), high school (12 | 17.6%), and elementary school (11 | 16.2%).
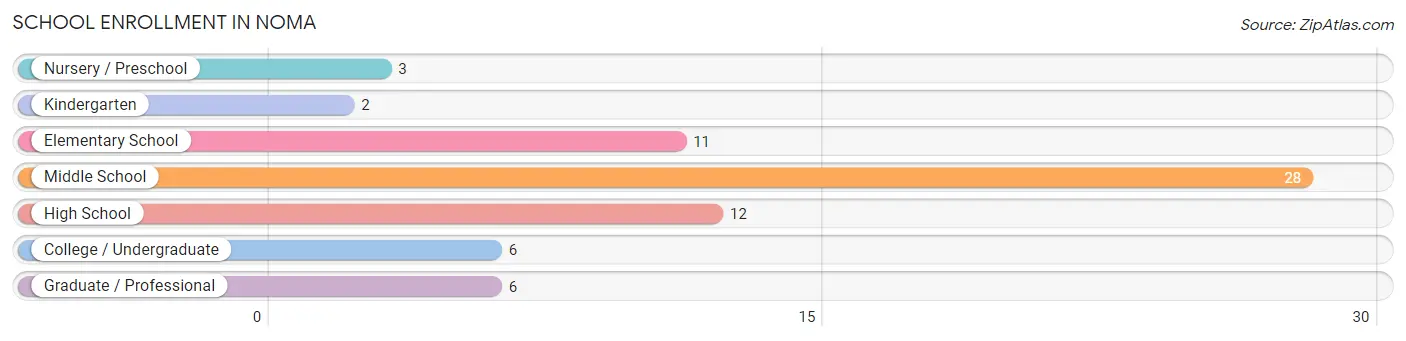
| School Level | # Students | % Students |
| Nursery / Preschool | 3 | 4.4% |
| Kindergarten | 2 | 2.9% |
| Elementary School | 11 | 16.2% |
| Middle School | 28 | 41.2% |
| High School | 12 | 17.6% |
| College / Undergraduate | 6 | 8.8% |
| Graduate / Professional | 6 | 8.8% |
| Total | 68 | 100.0% |
School Enrollment by Age by Funding Source in Noma
Out of a total of 68 students who are enrolled in schools in Noma, 27 (39.7%) attend a private institution, while the remaining 41 (60.3%) are enrolled in public schools. The age group of 3 to 4 year olds has the highest likelihood of being enrolled in private schools, with 3 (100.0% in the age bracket) enrolled. Conversely, the age group of 18 to 19 year olds has the lowest likelihood of being enrolled in a private school, with 6 (100.0% in the age bracket) attending a public institution.
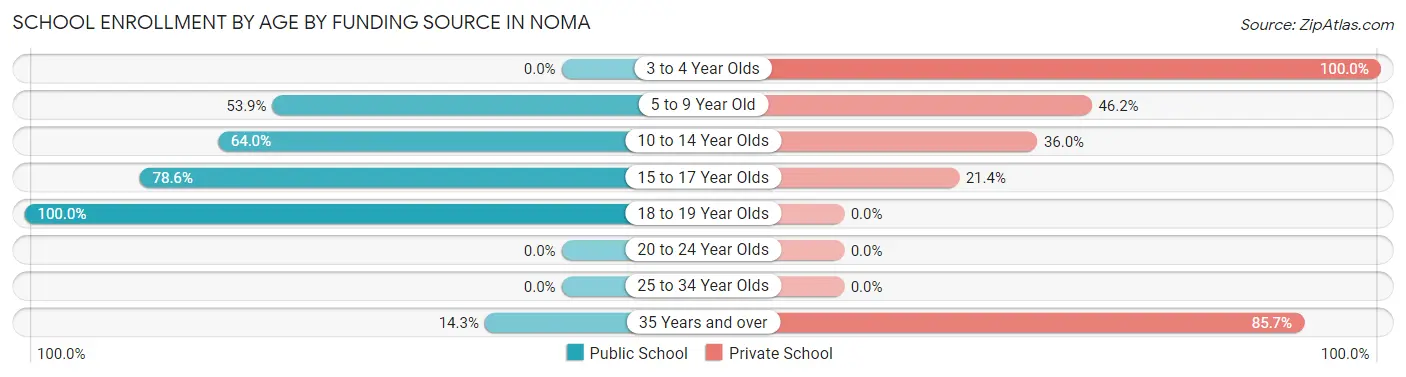
| Age Bracket | Public School | Private School |
| 3 to 4 Year Olds | 0 (0.0%) | 3 (100.0%) |
| 5 to 9 Year Old | 7 (53.8%) | 6 (46.2%) |
| 10 to 14 Year Olds | 16 (64.0%) | 9 (36.0%) |
| 15 to 17 Year Olds | 11 (78.6%) | 3 (21.4%) |
| 18 to 19 Year Olds | 6 (100.0%) | 0 (0.0%) |
| 20 to 24 Year Olds | 0 (0.0%) | 0 (0.0%) |
| 25 to 34 Year Olds | 0 (0.0%) | 0 (0.0%) |
| 35 Years and over | 1 (14.3%) | 6 (85.7%) |
| Total | 41 (60.3%) | 27 (39.7%) |
Educational Attainment by Field of Study in Noma
Arts & humanities (8 | 47.1%), education (4 | 23.5%), business (2 | 11.8%), liberal arts & history (2 | 11.8%), and literature & languages (1 | 5.9%) are the most common fields of study among 17 individuals in Noma who have obtained a bachelor's degree or higher.
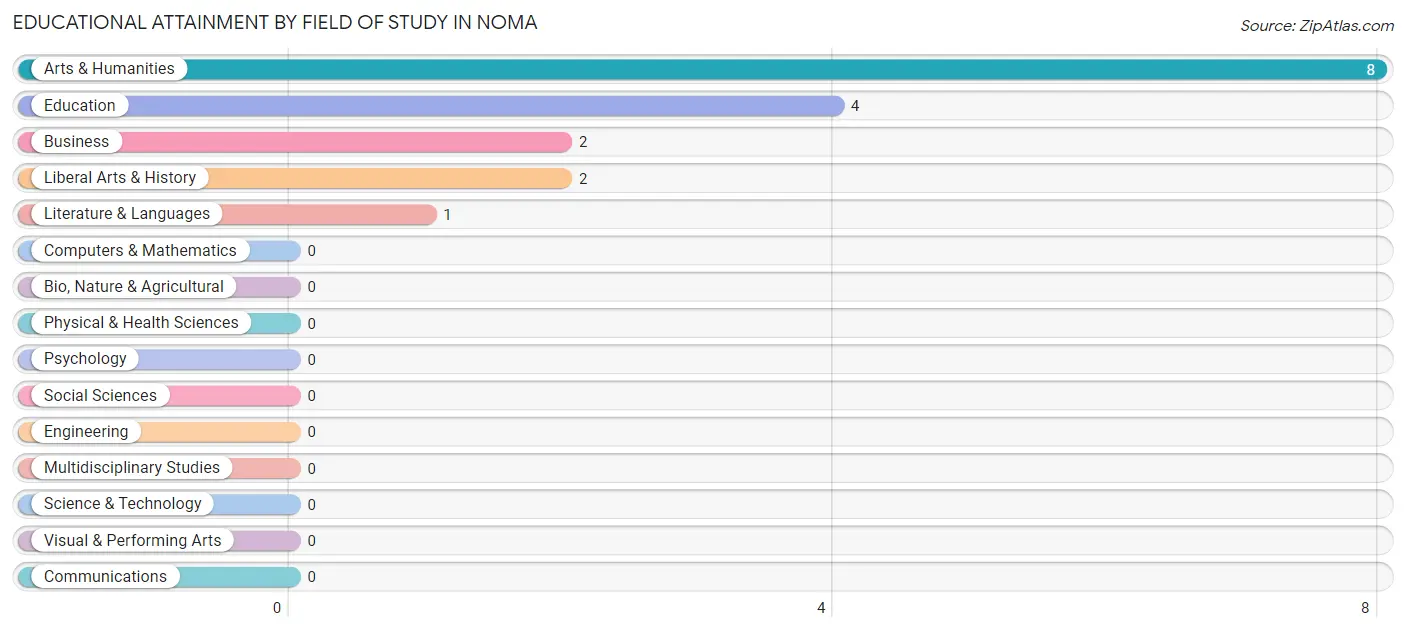
| Field of Study | # Graduates | % Graduates |
| Computers & Mathematics | 0 | 0.0% |
| Bio, Nature & Agricultural | 0 | 0.0% |
| Physical & Health Sciences | 0 | 0.0% |
| Psychology | 0 | 0.0% |
| Social Sciences | 0 | 0.0% |
| Engineering | 0 | 0.0% |
| Multidisciplinary Studies | 0 | 0.0% |
| Science & Technology | 0 | 0.0% |
| Business | 2 | 11.8% |
| Education | 4 | 23.5% |
| Literature & Languages | 1 | 5.9% |
| Liberal Arts & History | 2 | 11.8% |
| Visual & Performing Arts | 0 | 0.0% |
| Communications | 0 | 0.0% |
| Arts & Humanities | 8 | 47.1% |
| Total | 17 | 100.0% |
Transportation & Commute in Noma
Vehicle Availability by Sex in Noma
The most prevalent vehicle ownership categories in Noma are males with 2 vehicles (32, accounting for 47.8%) and females with 2 vehicles (11, making up 82.1%).
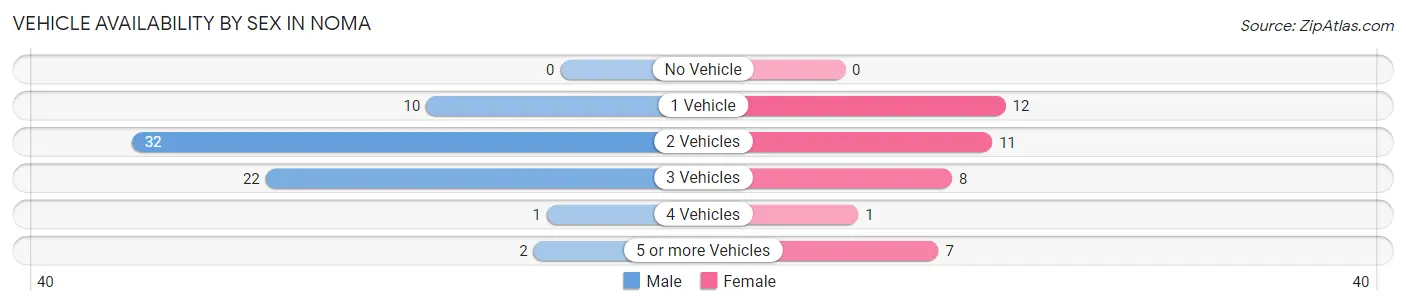
| Vehicles Available | Male | Female |
| No Vehicle | 0 (0.0%) | 0 (0.0%) |
| 1 Vehicle | 10 (14.9%) | 12 (30.8%) |
| 2 Vehicles | 32 (47.8%) | 11 (28.2%) |
| 3 Vehicles | 22 (32.8%) | 8 (20.5%) |
| 4 Vehicles | 1 (1.5%) | 1 (2.6%) |
| 5 or more Vehicles | 2 (3.0%) | 7 (17.9%) |
| Total | 67 (100.0%) | 39 (100.0%) |
Commute Time in Noma
The most frequently occuring commute durations in Noma are 30 to 34 minutes (25 commuters, 23.6%), 10 to 14 minutes (21 commuters, 19.8%), and 45 to 59 minutes (16 commuters, 15.1%).
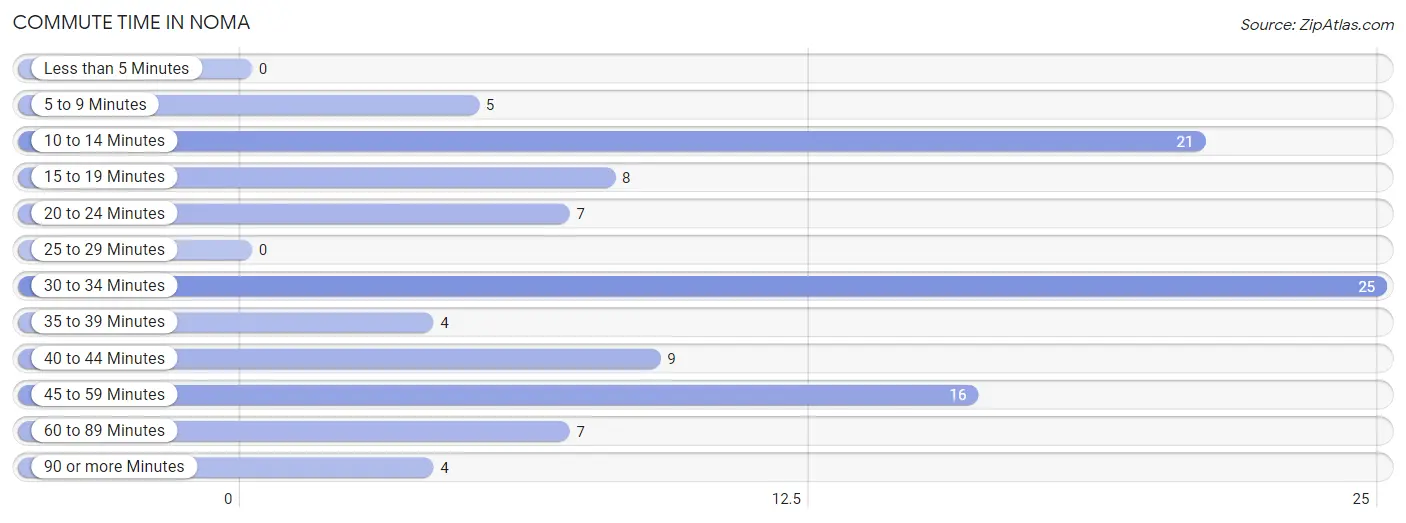
| Commute Time | # Commuters | % Commuters |
| Less than 5 Minutes | 0 | 0.0% |
| 5 to 9 Minutes | 5 | 4.7% |
| 10 to 14 Minutes | 21 | 19.8% |
| 15 to 19 Minutes | 8 | 7.5% |
| 20 to 24 Minutes | 7 | 6.6% |
| 25 to 29 Minutes | 0 | 0.0% |
| 30 to 34 Minutes | 25 | 23.6% |
| 35 to 39 Minutes | 4 | 3.8% |
| 40 to 44 Minutes | 9 | 8.5% |
| 45 to 59 Minutes | 16 | 15.1% |
| 60 to 89 Minutes | 7 | 6.6% |
| 90 or more Minutes | 4 | 3.8% |
Commute Time by Sex in Noma
The most common commute times in Noma are 10 to 14 minutes (17 commuters, 25.4%) for males and 30 to 34 minutes (18 commuters, 46.2%) for females.
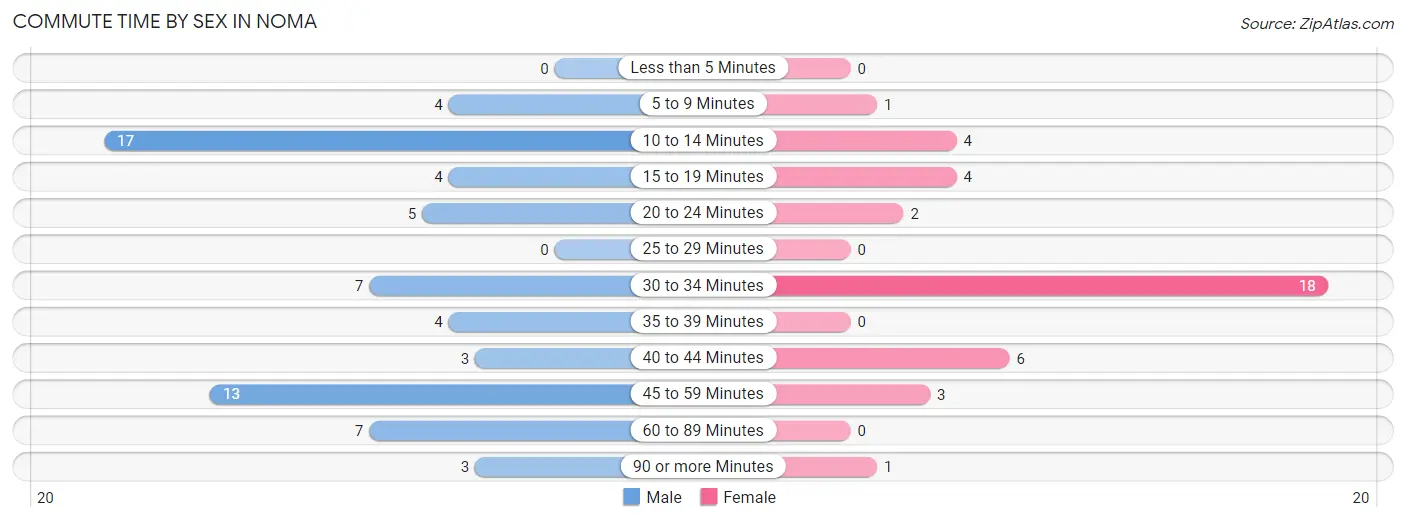
| Commute Time | Male | Female |
| Less than 5 Minutes | 0 (0.0%) | 0 (0.0%) |
| 5 to 9 Minutes | 4 (6.0%) | 1 (2.6%) |
| 10 to 14 Minutes | 17 (25.4%) | 4 (10.3%) |
| 15 to 19 Minutes | 4 (6.0%) | 4 (10.3%) |
| 20 to 24 Minutes | 5 (7.5%) | 2 (5.1%) |
| 25 to 29 Minutes | 0 (0.0%) | 0 (0.0%) |
| 30 to 34 Minutes | 7 (10.4%) | 18 (46.2%) |
| 35 to 39 Minutes | 4 (6.0%) | 0 (0.0%) |
| 40 to 44 Minutes | 3 (4.5%) | 6 (15.4%) |
| 45 to 59 Minutes | 13 (19.4%) | 3 (7.7%) |
| 60 to 89 Minutes | 7 (10.4%) | 0 (0.0%) |
| 90 or more Minutes | 3 (4.5%) | 1 (2.6%) |
Time of Departure to Work by Sex in Noma
The most frequent times of departure to work in Noma are 4:00 PM to 11:59 PM (17, 25.4%) for males and 6:00 AM to 6:29 AM (18, 46.2%) for females.
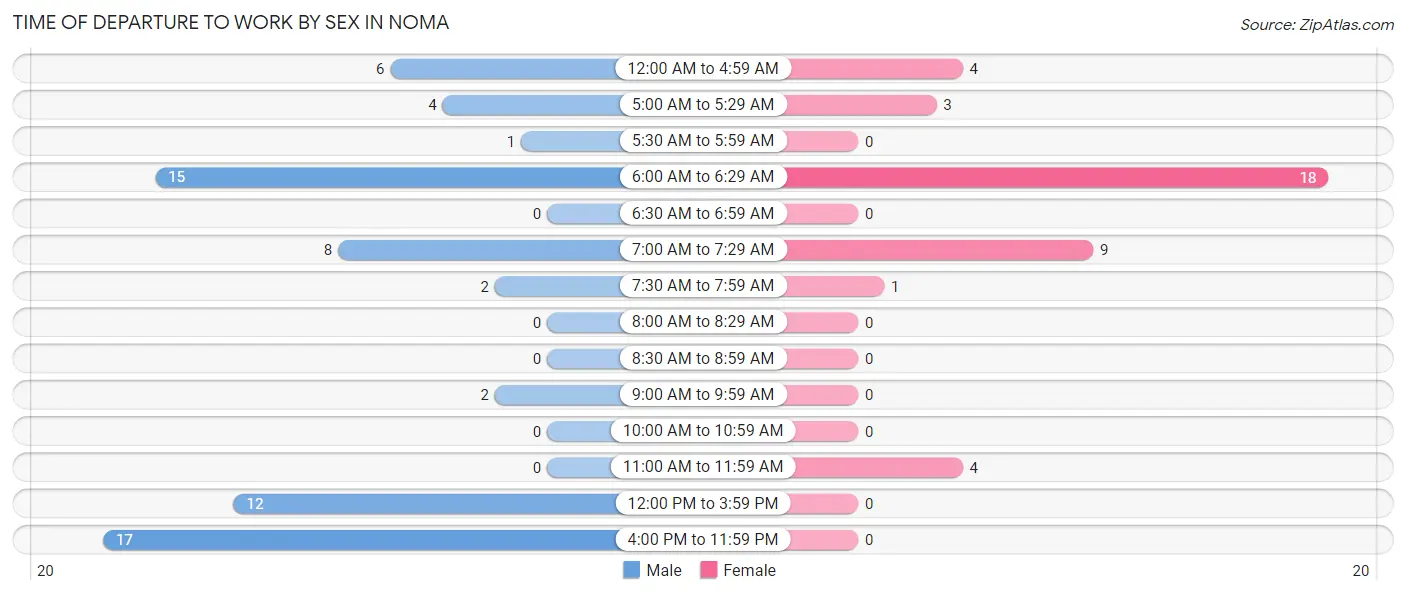
| Time of Departure | Male | Female |
| 12:00 AM to 4:59 AM | 6 (9.0%) | 4 (10.3%) |
| 5:00 AM to 5:29 AM | 4 (6.0%) | 3 (7.7%) |
| 5:30 AM to 5:59 AM | 1 (1.5%) | 0 (0.0%) |
| 6:00 AM to 6:29 AM | 15 (22.4%) | 18 (46.2%) |
| 6:30 AM to 6:59 AM | 0 (0.0%) | 0 (0.0%) |
| 7:00 AM to 7:29 AM | 8 (11.9%) | 9 (23.1%) |
| 7:30 AM to 7:59 AM | 2 (3.0%) | 1 (2.6%) |
| 8:00 AM to 8:29 AM | 0 (0.0%) | 0 (0.0%) |
| 8:30 AM to 8:59 AM | 0 (0.0%) | 0 (0.0%) |
| 9:00 AM to 9:59 AM | 2 (3.0%) | 0 (0.0%) |
| 10:00 AM to 10:59 AM | 0 (0.0%) | 0 (0.0%) |
| 11:00 AM to 11:59 AM | 0 (0.0%) | 4 (10.3%) |
| 12:00 PM to 3:59 PM | 12 (17.9%) | 0 (0.0%) |
| 4:00 PM to 11:59 PM | 17 (25.4%) | 0 (0.0%) |
| Total | 67 (100.0%) | 39 (100.0%) |
Housing Occupancy in Noma
Occupancy by Ownership in Noma
Of the total 97 dwellings in Noma, owner-occupied units account for 76 (78.3%), while renter-occupied units make up 21 (21.6%).
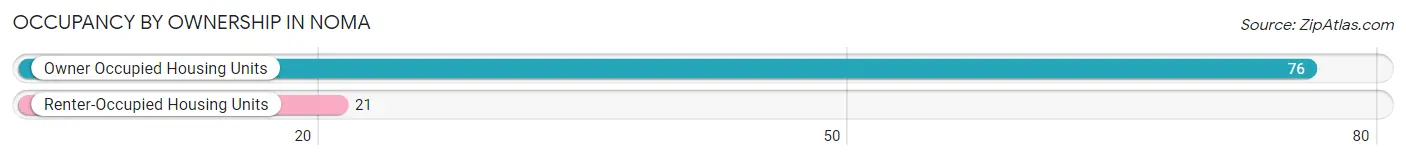
| Occupancy | # Housing Units | % Housing Units |
| Owner Occupied Housing Units | 76 | 78.3% |
| Renter-Occupied Housing Units | 21 | 21.6% |
| Total Occupied Housing Units | 97 | 100.0% |
Occupancy by Household Size in Noma
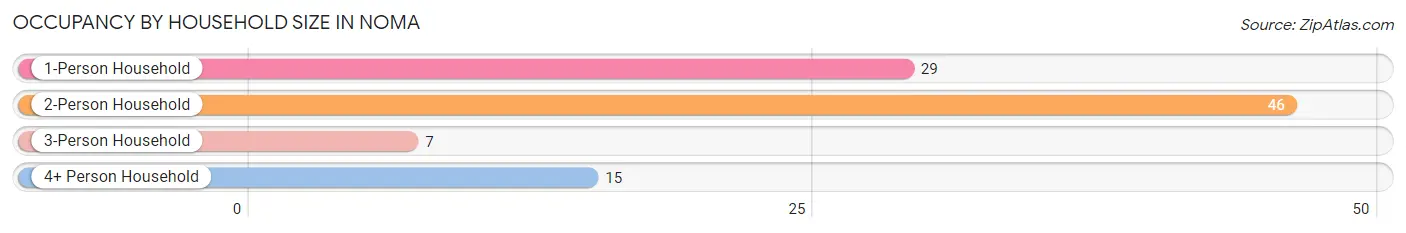
| Household Size | # Housing Units | % Housing Units |
| 1-Person Household | 29 | 29.9% |
| 2-Person Household | 46 | 47.4% |
| 3-Person Household | 7 | 7.2% |
| 4+ Person Household | 15 | 15.5% |
| Total Housing Units | 97 | 100.0% |
Occupancy by Ownership by Household Size in Noma
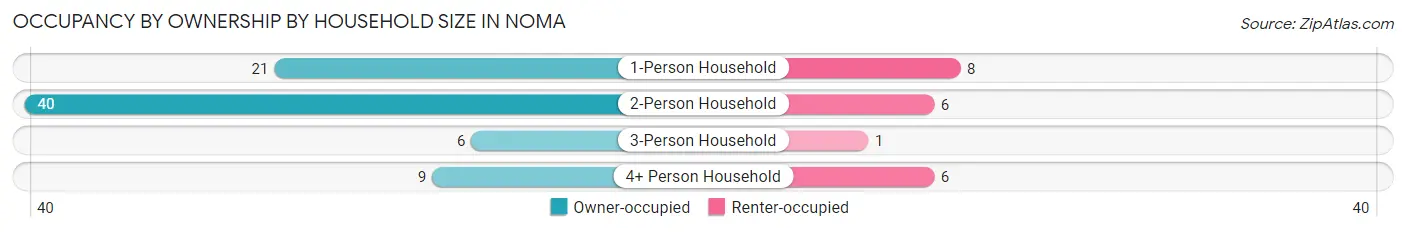
| Household Size | Owner-occupied | Renter-occupied |
| 1-Person Household | 21 (72.4%) | 8 (27.6%) |
| 2-Person Household | 40 (87.0%) | 6 (13.0%) |
| 3-Person Household | 6 (85.7%) | 1 (14.3%) |
| 4+ Person Household | 9 (60.0%) | 6 (40.0%) |
| Total Housing Units | 76 (78.3%) | 21 (21.6%) |
Occupancy by Educational Attainment in Noma
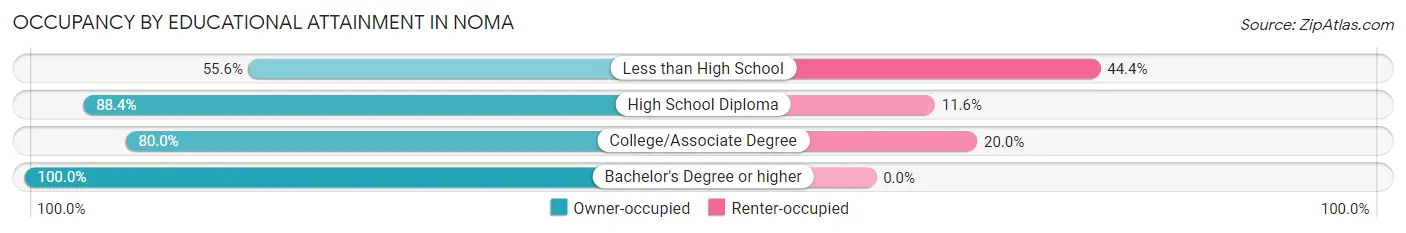
| Household Size | Owner-occupied | Renter-occupied |
| Less than High School | 15 (55.6%) | 12 (44.4%) |
| High School Diploma | 38 (88.4%) | 5 (11.6%) |
| College/Associate Degree | 16 (80.0%) | 4 (20.0%) |
| Bachelor's Degree or higher | 7 (100.0%) | 0 (0.0%) |
Occupancy by Age of Householder in Noma
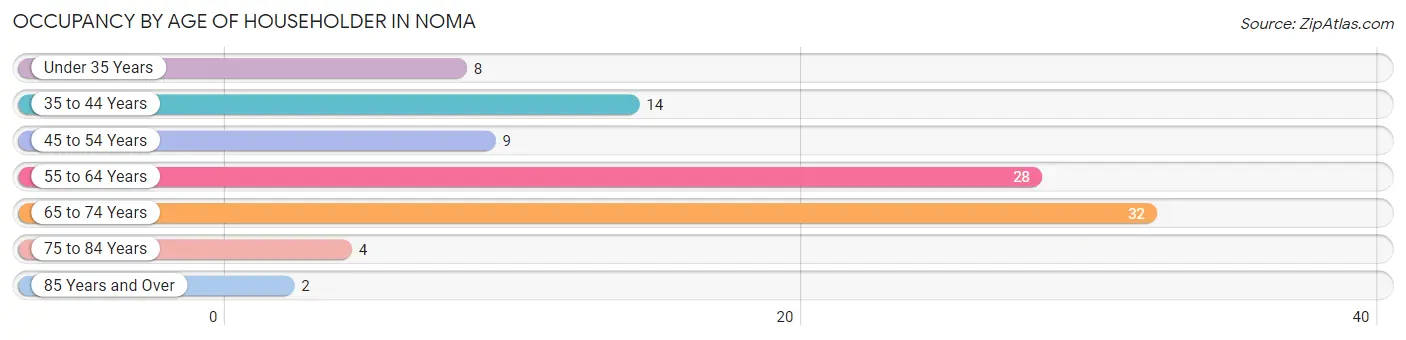
| Age Bracket | # Households | % Households |
| Under 35 Years | 8 | 8.3% |
| 35 to 44 Years | 14 | 14.4% |
| 45 to 54 Years | 9 | 9.3% |
| 55 to 64 Years | 28 | 28.9% |
| 65 to 74 Years | 32 | 33.0% |
| 75 to 84 Years | 4 | 4.1% |
| 85 Years and Over | 2 | 2.1% |
| Total | 97 | 100.0% |
Housing Finances in Noma
Median Income by Occupancy in Noma
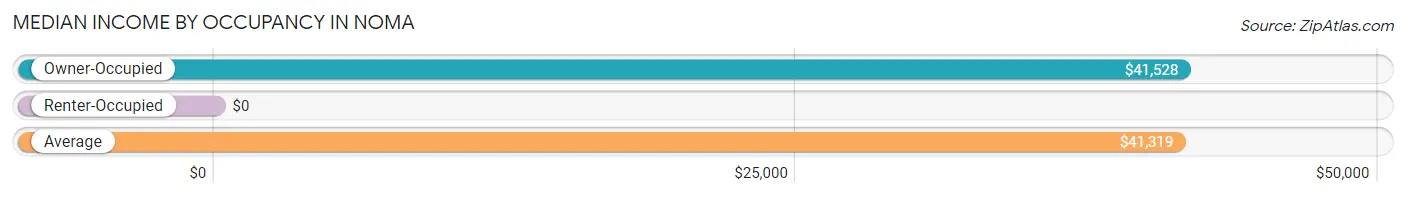
| Occupancy Type | # Households | Median Income |
| Owner-Occupied | 76 (78.3%) | $41,528 |
| Renter-Occupied | 21 (21.6%) | $0 |
| Average | 97 (100.0%) | $41,319 |
Occupancy by Householder Income Bracket in Noma
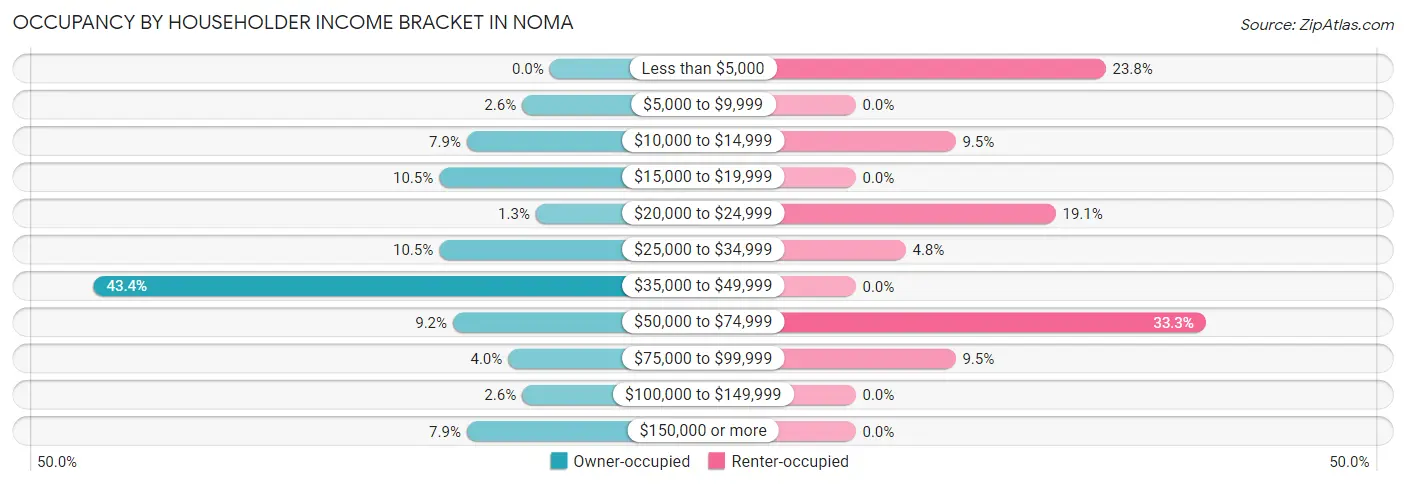
| Income Bracket | Owner-occupied | Renter-occupied |
| Less than $5,000 | 0 (0.0%) | 5 (23.8%) |
| $5,000 to $9,999 | 2 (2.6%) | 0 (0.0%) |
| $10,000 to $14,999 | 6 (7.9%) | 2 (9.5%) |
| $15,000 to $19,999 | 8 (10.5%) | 0 (0.0%) |
| $20,000 to $24,999 | 1 (1.3%) | 4 (19.1%) |
| $25,000 to $34,999 | 8 (10.5%) | 1 (4.8%) |
| $35,000 to $49,999 | 33 (43.4%) | 0 (0.0%) |
| $50,000 to $74,999 | 7 (9.2%) | 7 (33.3%) |
| $75,000 to $99,999 | 3 (4.0%) | 2 (9.5%) |
| $100,000 to $149,999 | 2 (2.6%) | 0 (0.0%) |
| $150,000 or more | 6 (7.9%) | 0 (0.0%) |
| Total | 76 (100.0%) | 21 (100.0%) |
Monthly Housing Cost Tiers in Noma
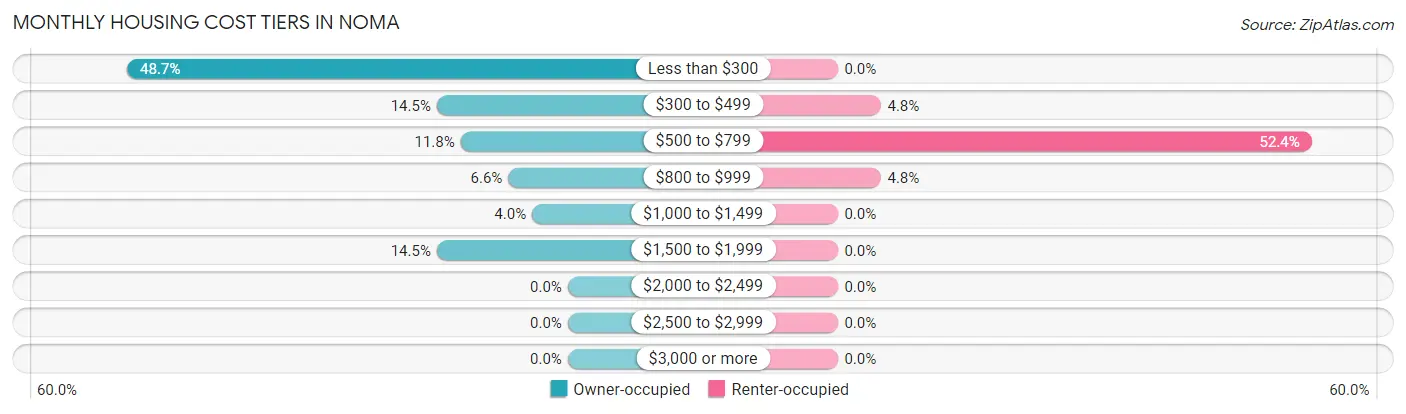
| Monthly Cost | Owner-occupied | Renter-occupied |
| Less than $300 | 37 (48.7%) | 0 (0.0%) |
| $300 to $499 | 11 (14.5%) | 1 (4.8%) |
| $500 to $799 | 9 (11.8%) | 11 (52.4%) |
| $800 to $999 | 5 (6.6%) | 1 (4.8%) |
| $1,000 to $1,499 | 3 (4.0%) | 0 (0.0%) |
| $1,500 to $1,999 | 11 (14.5%) | 0 (0.0%) |
| $2,000 to $2,499 | 0 (0.0%) | 0 (0.0%) |
| $2,500 to $2,999 | 0 (0.0%) | 0 (0.0%) |
| $3,000 or more | 0 (0.0%) | 0 (0.0%) |
| Total | 76 (100.0%) | 21 (100.0%) |
Physical Housing Characteristics in Noma
Housing Structures in Noma
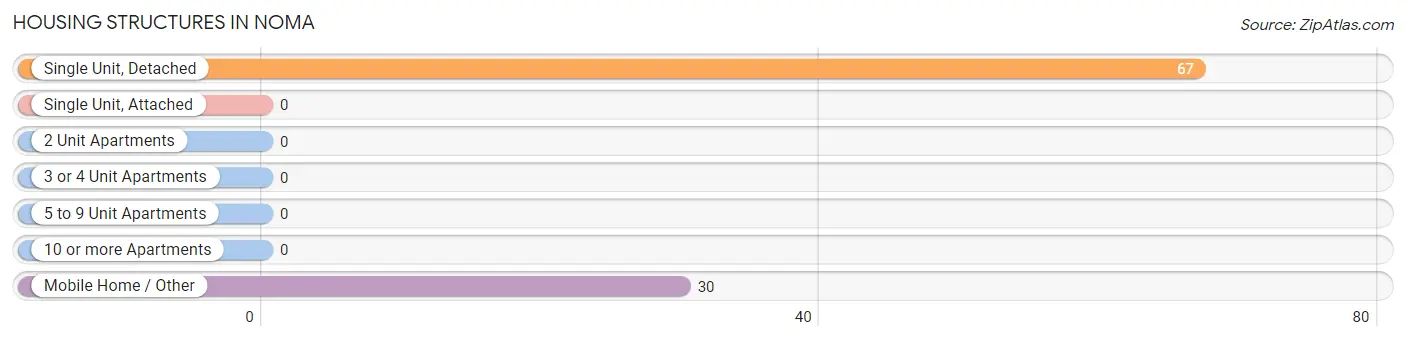
| Structure Type | # Housing Units | % Housing Units |
| Single Unit, Detached | 67 | 69.1% |
| Single Unit, Attached | 0 | 0.0% |
| 2 Unit Apartments | 0 | 0.0% |
| 3 or 4 Unit Apartments | 0 | 0.0% |
| 5 to 9 Unit Apartments | 0 | 0.0% |
| 10 or more Apartments | 0 | 0.0% |
| Mobile Home / Other | 30 | 30.9% |
| Total | 97 | 100.0% |
Housing Structures by Occupancy in Noma
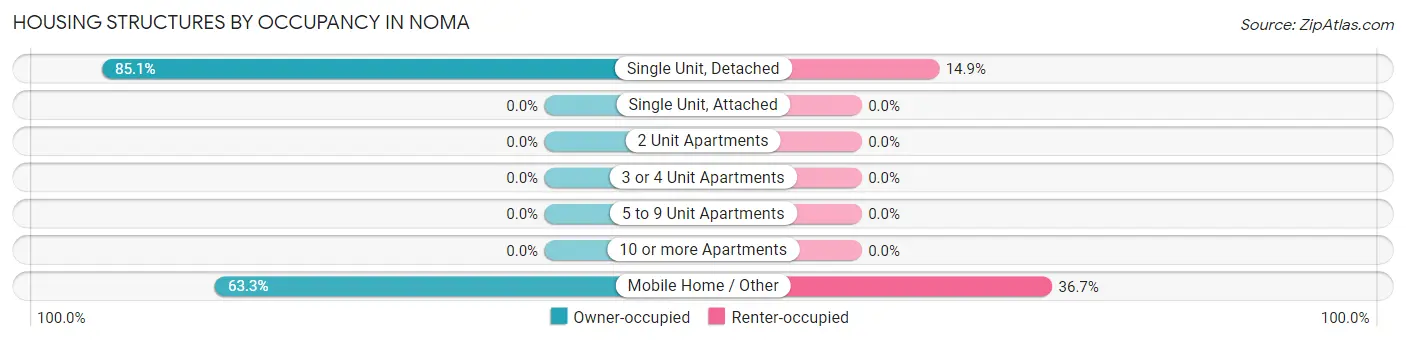
| Structure Type | Owner-occupied | Renter-occupied |
| Single Unit, Detached | 57 (85.1%) | 10 (14.9%) |
| Single Unit, Attached | 0 (0.0%) | 0 (0.0%) |
| 2 Unit Apartments | 0 (0.0%) | 0 (0.0%) |
| 3 or 4 Unit Apartments | 0 (0.0%) | 0 (0.0%) |
| 5 to 9 Unit Apartments | 0 (0.0%) | 0 (0.0%) |
| 10 or more Apartments | 0 (0.0%) | 0 (0.0%) |
| Mobile Home / Other | 19 (63.3%) | 11 (36.7%) |
| Total | 76 (78.3%) | 21 (21.6%) |
Housing Structures by Number of Rooms in Noma
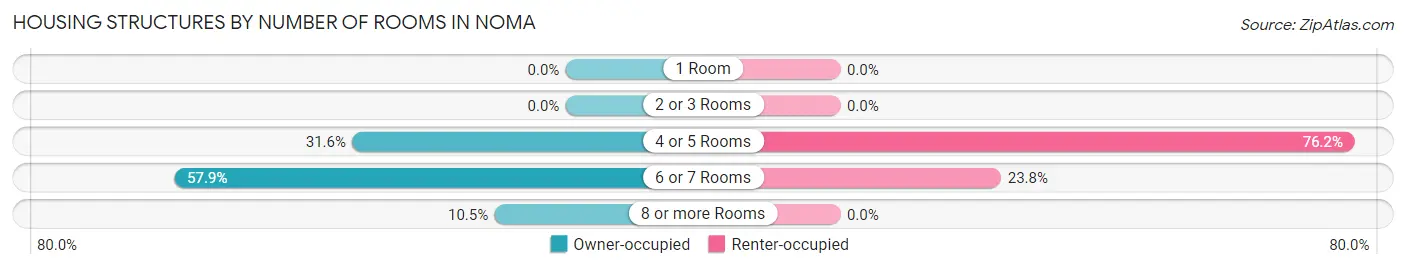
| Number of Rooms | Owner-occupied | Renter-occupied |
| 1 Room | 0 (0.0%) | 0 (0.0%) |
| 2 or 3 Rooms | 0 (0.0%) | 0 (0.0%) |
| 4 or 5 Rooms | 24 (31.6%) | 16 (76.2%) |
| 6 or 7 Rooms | 44 (57.9%) | 5 (23.8%) |
| 8 or more Rooms | 8 (10.5%) | 0 (0.0%) |
| Total | 76 (100.0%) | 21 (100.0%) |
Housing Structure by Heating Type in Noma
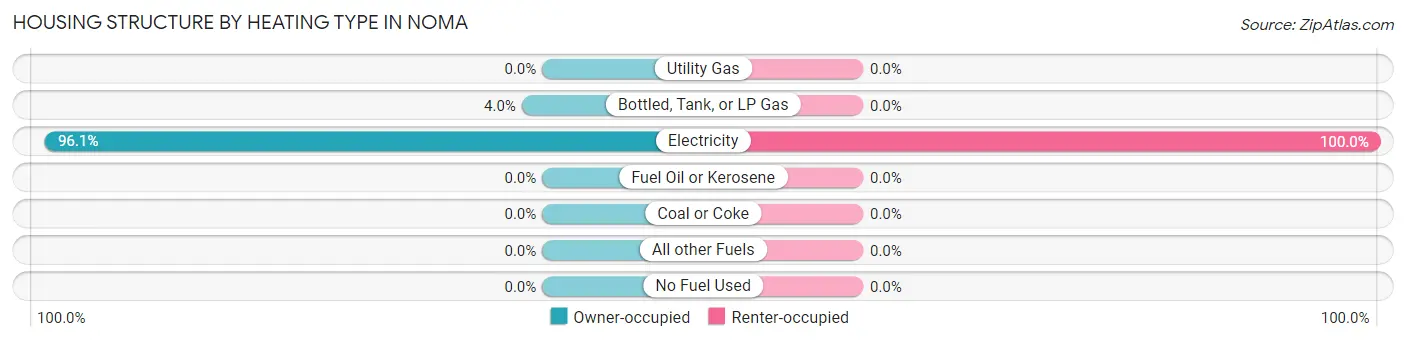
| Heating Type | Owner-occupied | Renter-occupied |
| Utility Gas | 0 (0.0%) | 0 (0.0%) |
| Bottled, Tank, or LP Gas | 3 (4.0%) | 0 (0.0%) |
| Electricity | 73 (96.1%) | 21 (100.0%) |
| Fuel Oil or Kerosene | 0 (0.0%) | 0 (0.0%) |
| Coal or Coke | 0 (0.0%) | 0 (0.0%) |
| All other Fuels | 0 (0.0%) | 0 (0.0%) |
| No Fuel Used | 0 (0.0%) | 0 (0.0%) |
| Total | 76 (100.0%) | 21 (100.0%) |
Household Vehicle Usage in Noma
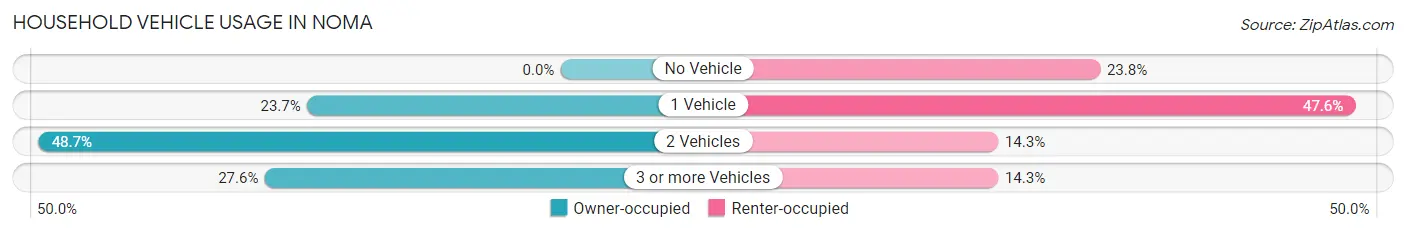
| Vehicles per Household | Owner-occupied | Renter-occupied |
| No Vehicle | 0 (0.0%) | 5 (23.8%) |
| 1 Vehicle | 18 (23.7%) | 10 (47.6%) |
| 2 Vehicles | 37 (48.7%) | 3 (14.3%) |
| 3 or more Vehicles | 21 (27.6%) | 3 (14.3%) |
| Total | 76 (100.0%) | 21 (100.0%) |
Real Estate & Mortgages in Noma
Real Estate and Mortgage Overview in Noma
| Characteristic | Without Mortgage | With Mortgage |
| Housing Units | 59 | 17 |
| Median Property Value | $38,800 | $121,900 |
| Median Household Income | $40,625 | $2 |
| Monthly Housing Costs | $231 | $0 |
| Real Estate Taxes | - | - |
Property Value by Mortgage Status in Noma
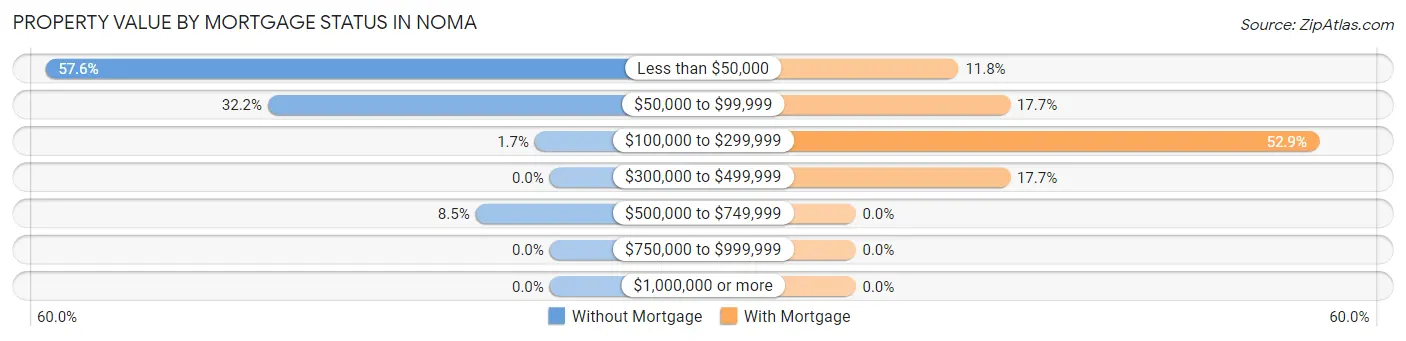
| Property Value | Without Mortgage | With Mortgage |
| Less than $50,000 | 34 (57.6%) | 2 (11.8%) |
| $50,000 to $99,999 | 19 (32.2%) | 3 (17.6%) |
| $100,000 to $299,999 | 1 (1.7%) | 9 (52.9%) |
| $300,000 to $499,999 | 0 (0.0%) | 3 (17.6%) |
| $500,000 to $749,999 | 5 (8.5%) | 0 (0.0%) |
| $750,000 to $999,999 | 0 (0.0%) | 0 (0.0%) |
| $1,000,000 or more | 0 (0.0%) | 0 (0.0%) |
| Total | 59 (100.0%) | 17 (100.0%) |
Household Income by Mortgage Status in Noma
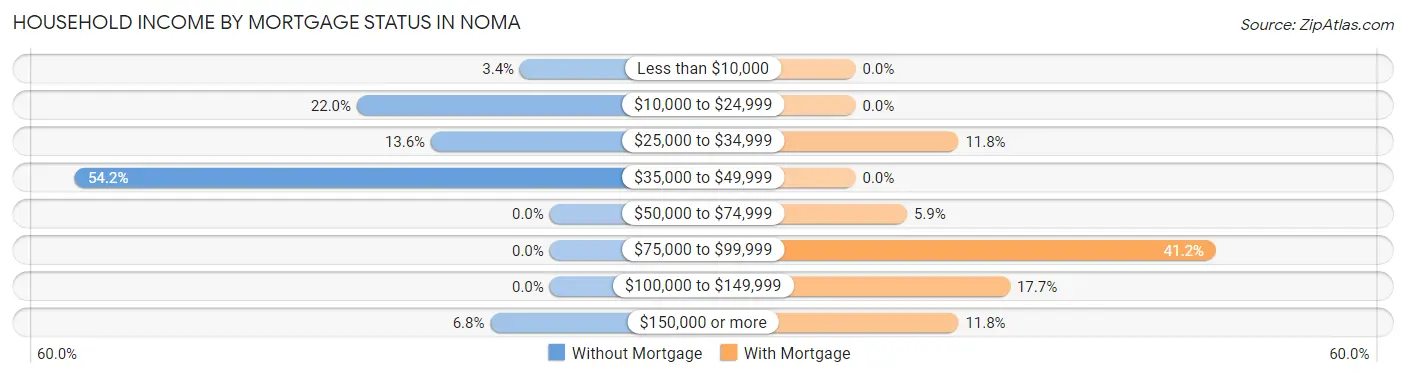
| Household Income | Without Mortgage | With Mortgage |
| Less than $10,000 | 2 (3.4%) | 0 (0.0%) |
| $10,000 to $24,999 | 13 (22.0%) | 0 (0.0%) |
| $25,000 to $34,999 | 8 (13.6%) | 2 (11.8%) |
| $35,000 to $49,999 | 32 (54.2%) | 0 (0.0%) |
| $50,000 to $74,999 | 0 (0.0%) | 1 (5.9%) |
| $75,000 to $99,999 | 0 (0.0%) | 7 (41.2%) |
| $100,000 to $149,999 | 0 (0.0%) | 3 (17.6%) |
| $150,000 or more | 4 (6.8%) | 2 (11.8%) |
| Total | 59 (100.0%) | 17 (100.0%) |
Property Value to Household Income Ratio in Noma
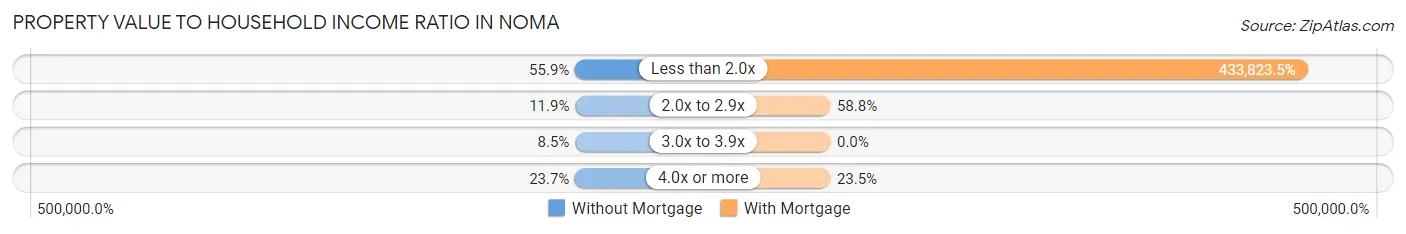
| Value-to-Income Ratio | Without Mortgage | With Mortgage |
| Less than 2.0x | 33 (55.9%) | 73,750 (433,823.5%) |
| 2.0x to 2.9x | 7 (11.9%) | 10 (58.8%) |
| 3.0x to 3.9x | 5 (8.5%) | 0 (0.0%) |
| 4.0x or more | 14 (23.7%) | 4 (23.5%) |
| Total | 59 (100.0%) | 17 (100.0%) |
Real Estate Taxes by Mortgage Status in Noma
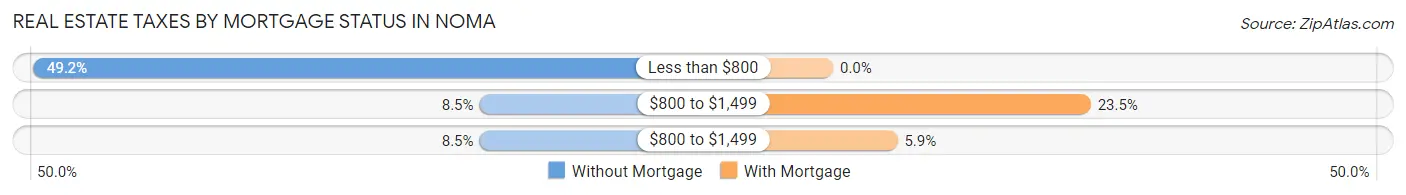
| Property Taxes | Without Mortgage | With Mortgage |
| Less than $800 | 29 (49.1%) | 0 (0.0%) |
| $800 to $1,499 | 5 (8.5%) | 4 (23.5%) |
| $800 to $1,499 | 5 (8.5%) | 1 (5.9%) |
| Total | 59 (100.0%) | 17 (100.0%) |
Health & Disability in Noma
Health Insurance Coverage by Age in Noma
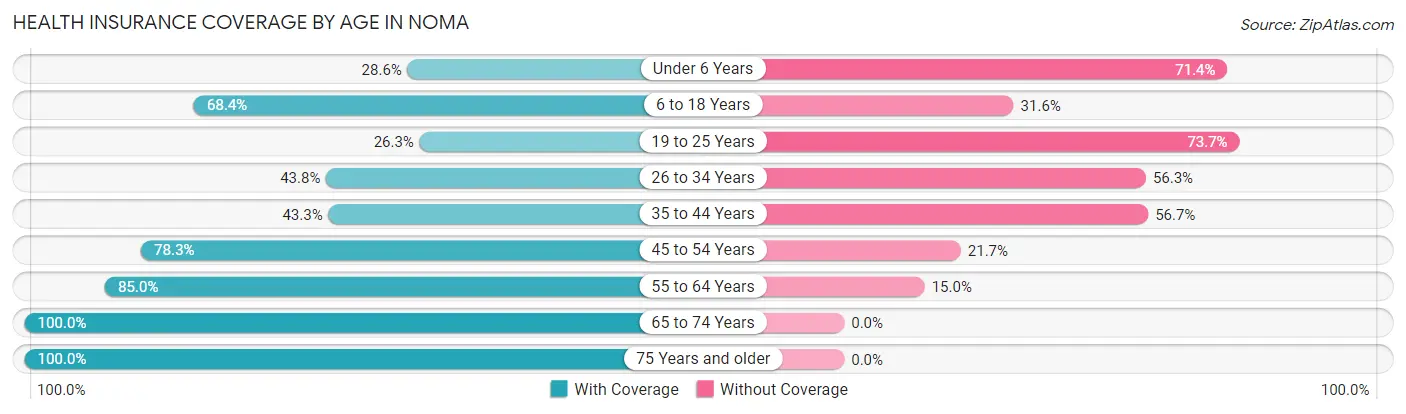
| Age Bracket | With Coverage | Without Coverage |
| Under 6 Years | 2 (28.6%) | 5 (71.4%) |
| 6 to 18 Years | 39 (68.4%) | 18 (31.6%) |
| 19 to 25 Years | 5 (26.3%) | 14 (73.7%) |
| 26 to 34 Years | 7 (43.8%) | 9 (56.2%) |
| 35 to 44 Years | 13 (43.3%) | 17 (56.7%) |
| 45 to 54 Years | 18 (78.3%) | 5 (21.7%) |
| 55 to 64 Years | 51 (85.0%) | 9 (15.0%) |
| 65 to 74 Years | 32 (100.0%) | 0 (0.0%) |
| 75 Years and older | 10 (100.0%) | 0 (0.0%) |
| Total | 177 (69.7%) | 77 (30.3%) |
Health Insurance Coverage by Citizenship Status in Noma
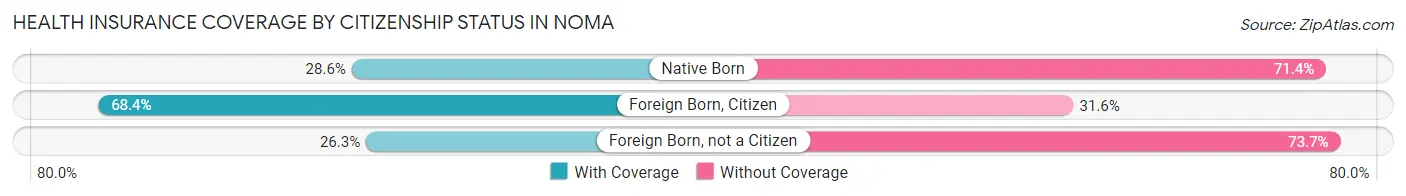
| Citizenship Status | With Coverage | Without Coverage |
| Native Born | 2 (28.6%) | 5 (71.4%) |
| Foreign Born, Citizen | 39 (68.4%) | 18 (31.6%) |
| Foreign Born, not a Citizen | 5 (26.3%) | 14 (73.7%) |
Health Insurance Coverage by Household Income in Noma
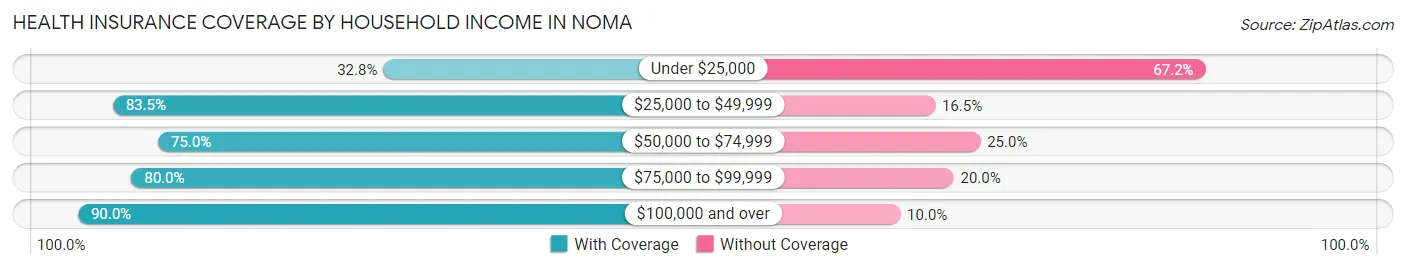
| Household Income | With Coverage | Without Coverage |
| Under $25,000 | 21 (32.8%) | 43 (67.2%) |
| $25,000 to $49,999 | 96 (83.5%) | 19 (16.5%) |
| $50,000 to $74,999 | 30 (75.0%) | 10 (25.0%) |
| $75,000 to $99,999 | 12 (80.0%) | 3 (20.0%) |
| $100,000 and over | 18 (90.0%) | 2 (10.0%) |
Public vs Private Health Insurance Coverage by Age in Noma
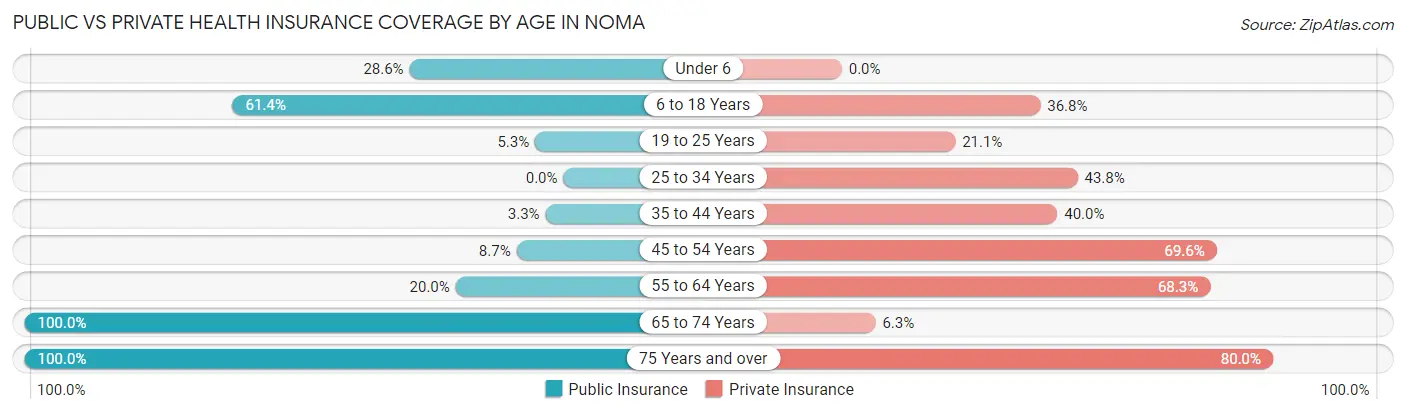
| Age Bracket | Public Insurance | Private Insurance |
| Under 6 | 2 (28.6%) | 0 (0.0%) |
| 6 to 18 Years | 35 (61.4%) | 21 (36.8%) |
| 19 to 25 Years | 1 (5.3%) | 4 (21.0%) |
| 25 to 34 Years | 0 (0.0%) | 7 (43.8%) |
| 35 to 44 Years | 1 (3.3%) | 12 (40.0%) |
| 45 to 54 Years | 2 (8.7%) | 16 (69.6%) |
| 55 to 64 Years | 12 (20.0%) | 41 (68.3%) |
| 65 to 74 Years | 32 (100.0%) | 2 (6.2%) |
| 75 Years and over | 10 (100.0%) | 8 (80.0%) |
| Total | 95 (37.4%) | 111 (43.7%) |
Disability Status by Sex by Age in Noma
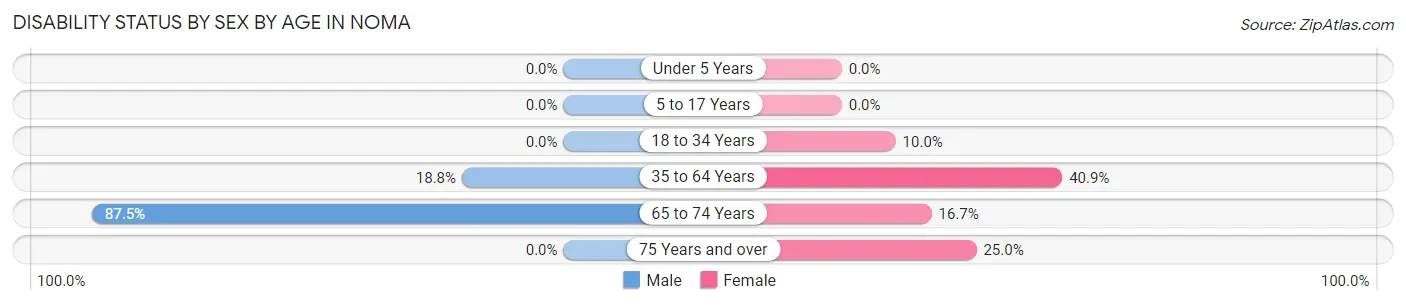
| Age Bracket | Male | Female |
| Under 5 Years | 0 (0.0%) | 0 (0.0%) |
| 5 to 17 Years | 0 (0.0%) | 0 (0.0%) |
| 18 to 34 Years | 0 (0.0%) | 1 (10.0%) |
| 35 to 64 Years | 13 (18.8%) | 18 (40.9%) |
| 65 to 74 Years | 7 (87.5%) | 4 (16.7%) |
| 75 Years and over | 0 (0.0%) | 2 (25.0%) |
Disability Class by Sex by Age in Noma
Disability Class: Hearing Difficulty
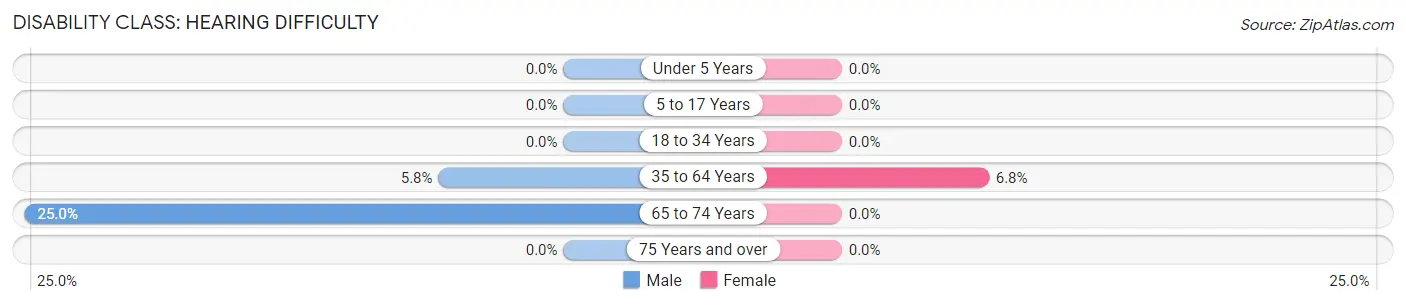
| Age Bracket | Male | Female |
| Under 5 Years | 0 (0.0%) | 0 (0.0%) |
| 5 to 17 Years | 0 (0.0%) | 0 (0.0%) |
| 18 to 34 Years | 0 (0.0%) | 0 (0.0%) |
| 35 to 64 Years | 4 (5.8%) | 3 (6.8%) |
| 65 to 74 Years | 2 (25.0%) | 0 (0.0%) |
| 75 Years and over | 0 (0.0%) | 0 (0.0%) |
Disability Class: Vision Difficulty
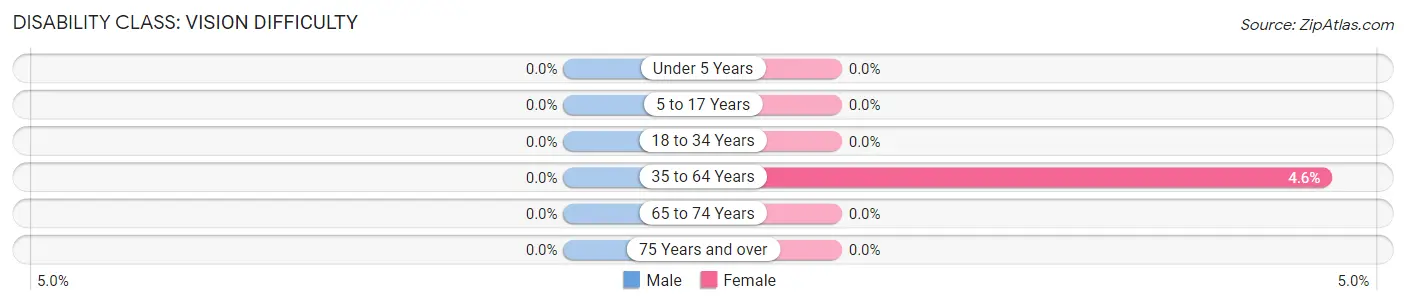
| Age Bracket | Male | Female |
| Under 5 Years | 0 (0.0%) | 0 (0.0%) |
| 5 to 17 Years | 0 (0.0%) | 0 (0.0%) |
| 18 to 34 Years | 0 (0.0%) | 0 (0.0%) |
| 35 to 64 Years | 0 (0.0%) | 2 (4.5%) |
| 65 to 74 Years | 0 (0.0%) | 0 (0.0%) |
| 75 Years and over | 0 (0.0%) | 0 (0.0%) |
Disability Class: Cognitive Difficulty
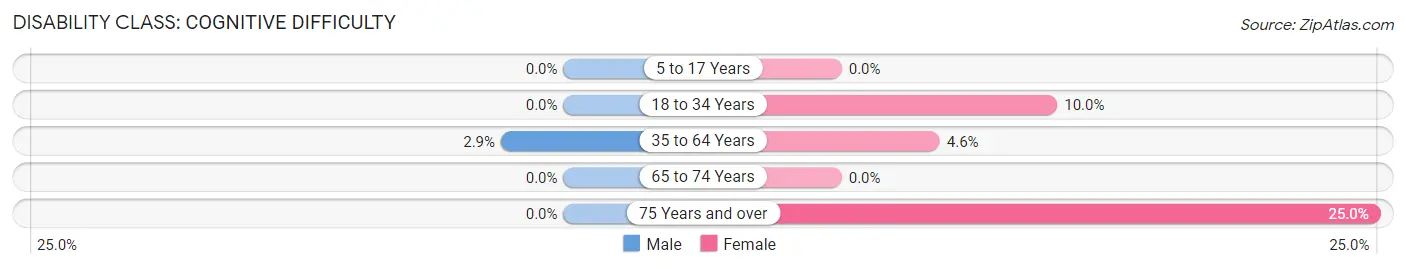
| Age Bracket | Male | Female |
| 5 to 17 Years | 0 (0.0%) | 0 (0.0%) |
| 18 to 34 Years | 0 (0.0%) | 1 (10.0%) |
| 35 to 64 Years | 2 (2.9%) | 2 (4.5%) |
| 65 to 74 Years | 0 (0.0%) | 0 (0.0%) |
| 75 Years and over | 0 (0.0%) | 2 (25.0%) |
Disability Class: Ambulatory Difficulty
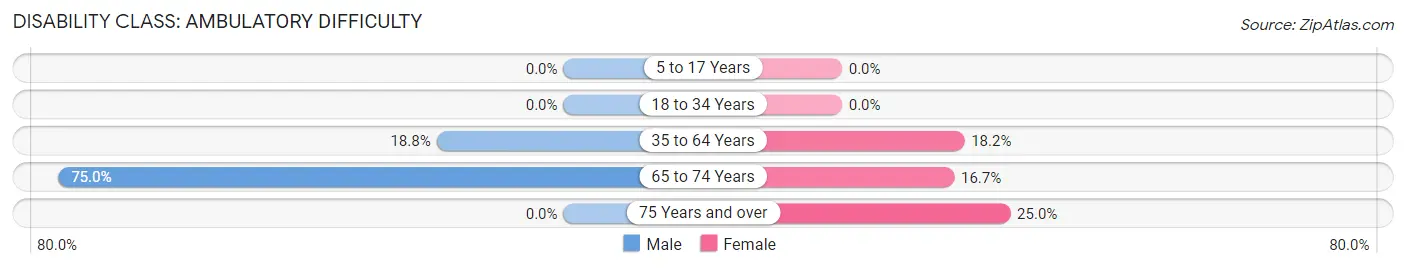
| Age Bracket | Male | Female |
| 5 to 17 Years | 0 (0.0%) | 0 (0.0%) |
| 18 to 34 Years | 0 (0.0%) | 0 (0.0%) |
| 35 to 64 Years | 13 (18.8%) | 8 (18.2%) |
| 65 to 74 Years | 6 (75.0%) | 4 (16.7%) |
| 75 Years and over | 0 (0.0%) | 2 (25.0%) |
Disability Class: Self-Care Difficulty
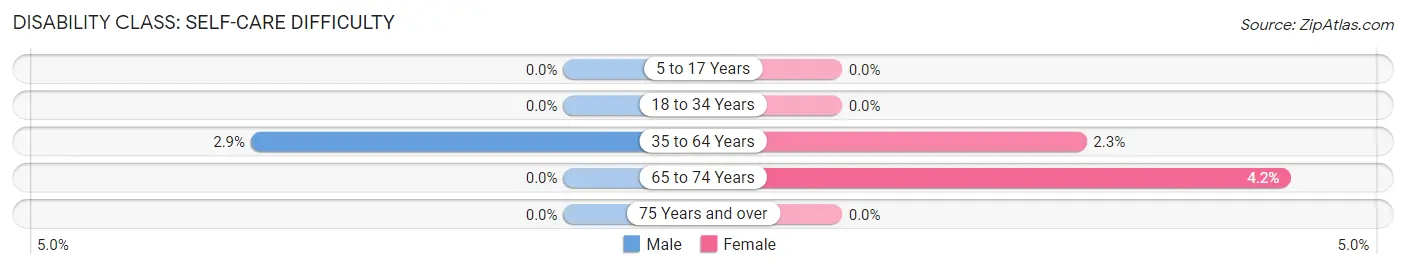
| Age Bracket | Male | Female |
| 5 to 17 Years | 0 (0.0%) | 0 (0.0%) |
| 18 to 34 Years | 0 (0.0%) | 0 (0.0%) |
| 35 to 64 Years | 2 (2.9%) | 1 (2.3%) |
| 65 to 74 Years | 0 (0.0%) | 1 (4.2%) |
| 75 Years and over | 0 (0.0%) | 0 (0.0%) |
Technology Access in Noma
Computing Device Access in Noma
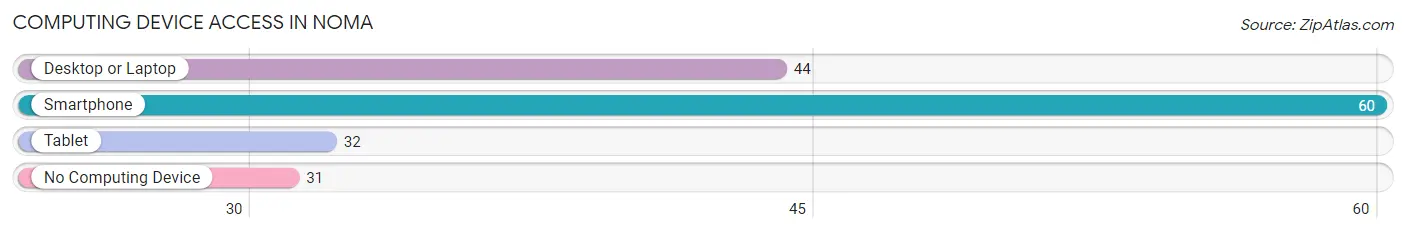
| Device Type | # Households | % Households |
| Desktop or Laptop | 44 | 45.4% |
| Smartphone | 60 | 61.9% |
| Tablet | 32 | 33.0% |
| No Computing Device | 31 | 32.0% |
| Total | 97 | 100.0% |
Internet Access in Noma
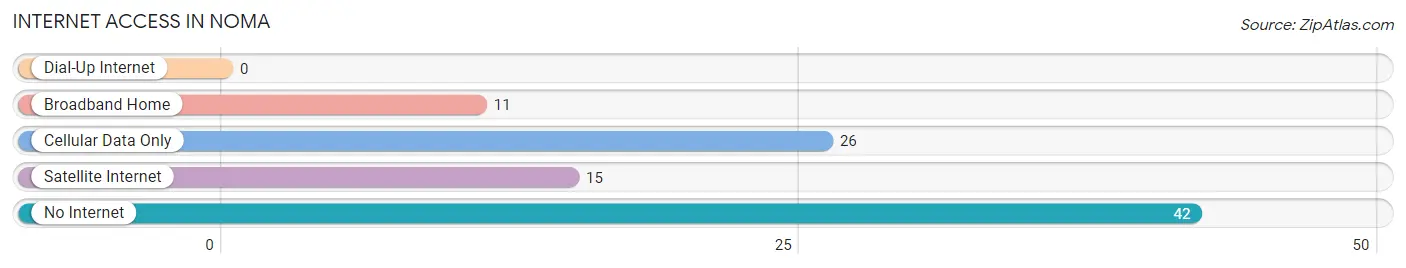
| Internet Type | # Households | % Households |
| Dial-Up Internet | 0 | 0.0% |
| Broadband Home | 11 | 11.3% |
| Cellular Data Only | 26 | 26.8% |
| Satellite Internet | 15 | 15.5% |
| No Internet | 42 | 43.3% |
| Total | 97 | 100.0% |
Noma Summary
Noma is a small town located in the Florida Panhandle, in the northwest corner of Walton County. It is situated on the banks of the Choctawhatchee River, and is bordered by the towns of Bruce and Ponce de Leon. The town was founded in 1883 and was named after the Choctaw word for “river”.
History
Noma was founded in 1883 by a group of settlers from Alabama. The town was originally known as “Noma Station”, as it was a stop on the Pensacola and Atlantic Railroad. The town was officially incorporated in 1887, and the first post office was established in 1888.
In the early 1900s, Noma was a thriving agricultural community, with cotton, corn, and peanuts being the main crops. The town also had a sawmill, a grist mill, and a turpentine still. In the 1920s, the town began to decline as the railroad stopped running and the population began to dwindle.
In the 1950s, Noma began to experience a resurgence as the timber industry began to boom. The town was also home to a number of small businesses, including a grocery store, a hardware store, and a gas station.
Geography
Noma is located in the Florida Panhandle, in the northwest corner of Walton County. It is situated on the banks of the Choctawhatchee River, and is bordered by the towns of Bruce and Ponce de Leon. The town is located approximately 25 miles east of the Alabama state line, and is approximately 40 miles west of Panama City.
The town has a total area of 1.2 square miles, all of which is land. The terrain is mostly flat, with some rolling hills. The climate is humid subtropical, with hot, humid summers and mild winters.
Economy
Noma’s economy is largely based on agriculture and timber. The town is home to a number of small businesses, including a grocery store, a hardware store, and a gas station. The town is also home to a number of farms, which produce cotton, corn, peanuts, and other crops.
The town is also home to a number of timber companies, which harvest timber from the surrounding forests. The timber industry is the largest employer in the town, and provides jobs for many of the town’s residents.
Demographics
As of the 2010 census, Noma had a population of 545. The racial makeup of the town was 97.3% White, 0.7% African American, 0.2% Native American, 0.2% Asian, and 1.6% from other races. The median household income was $30,000, and the median family income was $35,000.
The town is home to a number of churches, including the First Baptist Church of Noma, the Noma United Methodist Church, and the Noma Church of God. The town also has a public library, a post office, and a volunteer fire department.
Noma is a small town with a rich history and a bright future. The town is home to a number of small businesses, farms, and timber companies, and provides jobs for many of its residents. The town is also home to a number of churches, a public library, and a volunteer fire department. Noma is a great place to live, work, and raise a family.
Common Questions
What is Per Capita Income in Noma?
Per Capita income in Noma is $19,383.
What is the Median Family Income in Noma?
Median Family Income in Noma is $43,750.
What is the Median Household income in Noma?
Median Household Income in Noma is $41,319.
What is Income or Wage Gap in Noma?
Income or Wage Gap in Noma is 41.4%.
Women in Noma earn 58.6 cents for every dollar earned by a man.
What is Inequality or Gini Index in Noma?
Inequality or Gini Index in Noma is 0.41.
What is the Total Population of Noma?
Total Population of Noma is 254.
What is the Total Male Population of Noma?
Total Male Population of Noma is 144.
What is the Total Female Population of Noma?
Total Female Population of Noma is 110.
What is the Ratio of Males per 100 Females in Noma?
There are 130.91 Males per 100 Females in Noma.
What is the Ratio of Females per 100 Males in Noma?
There are 76.39 Females per 100 Males in Noma.
What is the Median Population Age in Noma?
Median Population Age in Noma is 43.6 Years.
What is the Average Family Size in Noma
Average Family Size in Noma is 3.5 People.
What is the Average Household Size in Noma
Average Household Size in Noma is 2.6 People.
How Large is the Labor Force in Noma?
There are 110 People in the Labor Forcein in Noma.
What is the Percentage of People in the Labor Force in Noma?
53.9% of People are in the Labor Force in Noma.
What is the Unemployment Rate in Noma?
Unemployment Rate in Noma is 3.6%.