Winter Beach, FL Map & Demographics
Winter Beach Map
Winter Beach Overview
$35,320
PER CAPITA INCOME
$96,989
AVG FAMILY INCOME
$82,045
AVG HOUSEHOLD INCOME
48.2%
WAGE / INCOME GAP [ % ]
51.8¢/ $1
WAGE / INCOME GAP [ $ ]
$12,014
FAMILY INCOME DEFICIT
0.45
INEQUALITY / GINI INDEX
4,273
TOTAL POPULATION
1,950
MALE POPULATION
2,323
FEMALE POPULATION
83.94
MALES / 100 FEMALES
119.13
FEMALES / 100 MALES
55.8
MEDIAN AGE
3.6
AVG FAMILY SIZE
3.1
AVG HOUSEHOLD SIZE
1,263
LABOR FORCE [ PEOPLE ]
35.3%
PERCENT IN LABOR FORCE
6.8%
UNEMPLOYMENT RATE
Winter Beach Area Codes
Income in Winter Beach
Income Overview in Winter Beach
Per Capita Income in Winter Beach is $35,320, while median incomes of families and households are $96,989 and $82,045 respectively.
| Characteristic | Number | Measure |
| Per Capita Income | 4,273 | $35,320 |
| Median Family Income | 1,097 | $96,989 |
| Mean Family Income | 1,097 | $114,985 |
| Median Household Income | 1,360 | $82,045 |
| Mean Household Income | 1,360 | $103,309 |
| Income Deficit | 1,097 | $12,014 |
| Wage / Income Gap (%) | 4,273 | 48.23% |
| Wage / Income Gap ($) | 4,273 | 51.77¢ per $1 |
| Gini / Inequality Index | 4,273 | 0.45 |
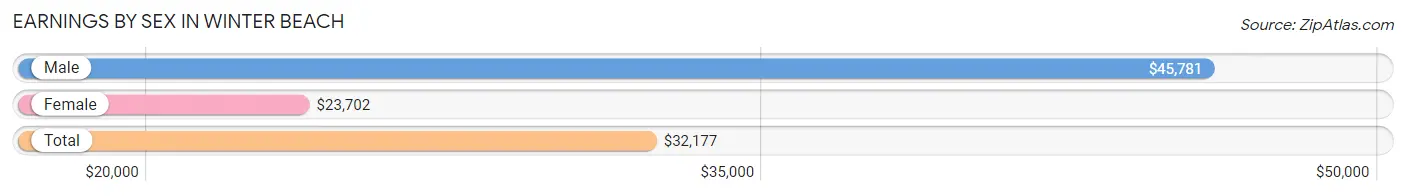
Earnings by Sex in Winter Beach
Average Earnings in Winter Beach are $32,177, $45,781 for men and $23,702 for women, a difference of 48.2%.
| Sex | Number | Average Earnings |
| Male | 711 (50.0%) | $45,781 |
| Female | 710 (50.0%) | $23,702 |
| Total | 1,421 (100.0%) | $32,177 |
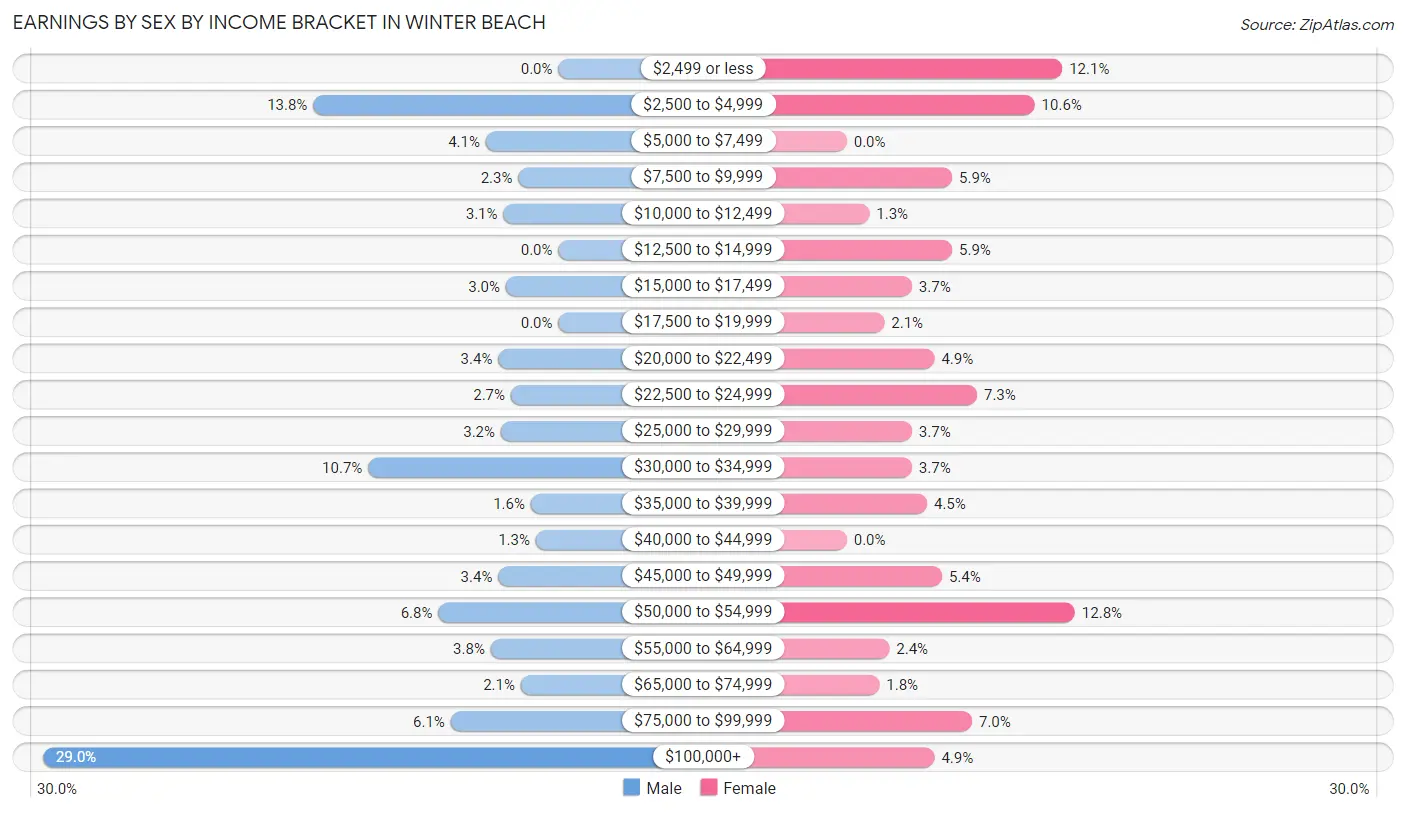
Earnings by Sex by Income Bracket in Winter Beach
The most common earnings brackets in Winter Beach are $100,000+ for men (206 | 29.0%) and $50,000 to $54,999 for women (91 | 12.8%).
| Income | Male | Female |
| $2,499 or less | 0 (0.0%) | 86 (12.1%) |
| $2,500 to $4,999 | 98 (13.8%) | 75 (10.6%) |
| $5,000 to $7,499 | 29 (4.1%) | 0 (0.0%) |
| $7,500 to $9,999 | 16 (2.2%) | 42 (5.9%) |
| $10,000 to $12,499 | 22 (3.1%) | 9 (1.3%) |
| $12,500 to $14,999 | 0 (0.0%) | 42 (5.9%) |
| $15,000 to $17,499 | 21 (2.9%) | 26 (3.7%) |
| $17,500 to $19,999 | 0 (0.0%) | 15 (2.1%) |
| $20,000 to $22,499 | 24 (3.4%) | 35 (4.9%) |
| $22,500 to $24,999 | 19 (2.7%) | 52 (7.3%) |
| $25,000 to $29,999 | 23 (3.2%) | 26 (3.7%) |
| $30,000 to $34,999 | 76 (10.7%) | 26 (3.7%) |
| $35,000 to $39,999 | 11 (1.5%) | 32 (4.5%) |
| $40,000 to $44,999 | 9 (1.3%) | 0 (0.0%) |
| $45,000 to $49,999 | 24 (3.4%) | 38 (5.3%) |
| $50,000 to $54,999 | 48 (6.8%) | 91 (12.8%) |
| $55,000 to $64,999 | 27 (3.8%) | 17 (2.4%) |
| $65,000 to $74,999 | 15 (2.1%) | 13 (1.8%) |
| $75,000 to $99,999 | 43 (6.0%) | 50 (7.0%) |
| $100,000+ | 206 (29.0%) | 35 (4.9%) |
| Total | 711 (100.0%) | 710 (100.0%) |
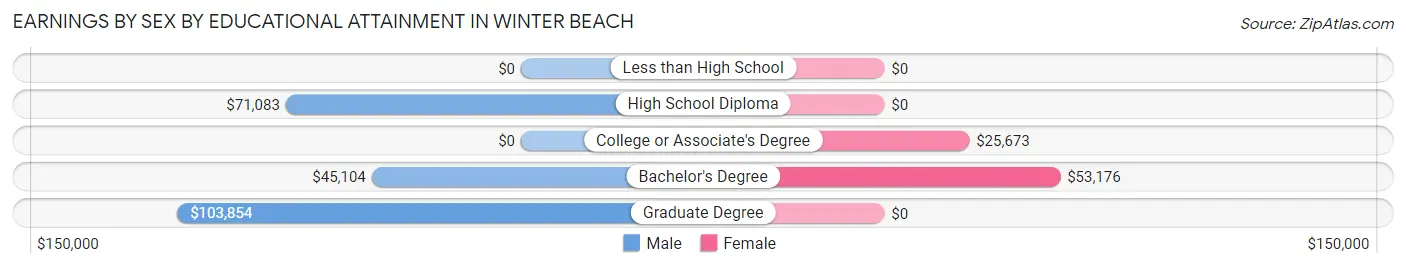
Earnings by Sex by Educational Attainment in Winter Beach
Average earnings in Winter Beach are $60,917 for men and $34,952 for women, a difference of 42.6%. Men with an educational attainment of graduate degree enjoy the highest average annual earnings of $103,854, while those with bachelor's degree education earn the least with $45,104. Women with an educational attainment of bachelor's degree earn the most with the average annual earnings of $53,176, while those with college or associate's degree education have the smallest earnings of $25,673.
| Educational Attainment | Male Income | Female Income |
| Less than High School | - | - |
| High School Diploma | $71,083 | $0 |
| College or Associate's Degree | - | - |
| Bachelor's Degree | $45,104 | $53,176 |
| Graduate Degree | $103,854 | $0 |
| Total | $60,917 | $34,952 |
Family Income in Winter Beach
Family Income Brackets in Winter Beach
According to the Winter Beach family income data, there are 258 families falling into the $100,000 to $149,999 income range, which is the most common income bracket and makes up 23.5% of all families.
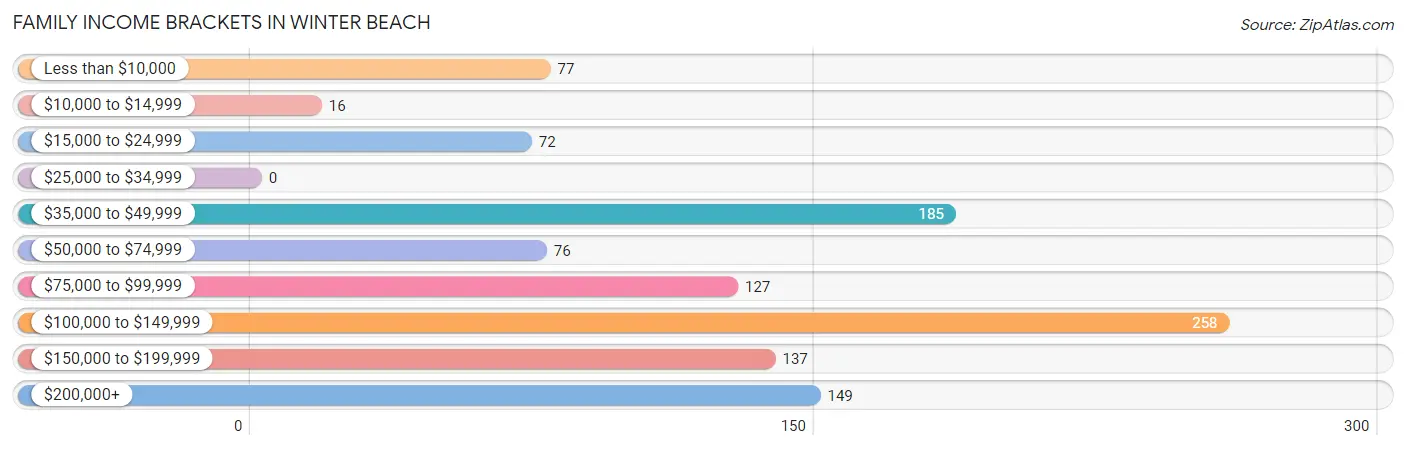
| Income Bracket | # Families | % Families |
| Less than $10,000 | 77 | 7.0% |
| $10,000 to $14,999 | 16 | 1.5% |
| $15,000 to $24,999 | 72 | 6.6% |
| $25,000 to $34,999 | 0 | 0.0% |
| $35,000 to $49,999 | 185 | 16.9% |
| $50,000 to $74,999 | 76 | 6.9% |
| $75,000 to $99,999 | 127 | 11.6% |
| $100,000 to $149,999 | 258 | 23.5% |
| $150,000 to $199,999 | 137 | 12.5% |
| $200,000+ | 149 | 13.6% |
Family Income by Famaliy Size in Winter Beach
3-person families (156 | 14.2%) account for the highest median family income in Winter Beach with $148,875 per family, while 3-person families (156 | 14.2%) have the highest median income of $49,625 per family member.
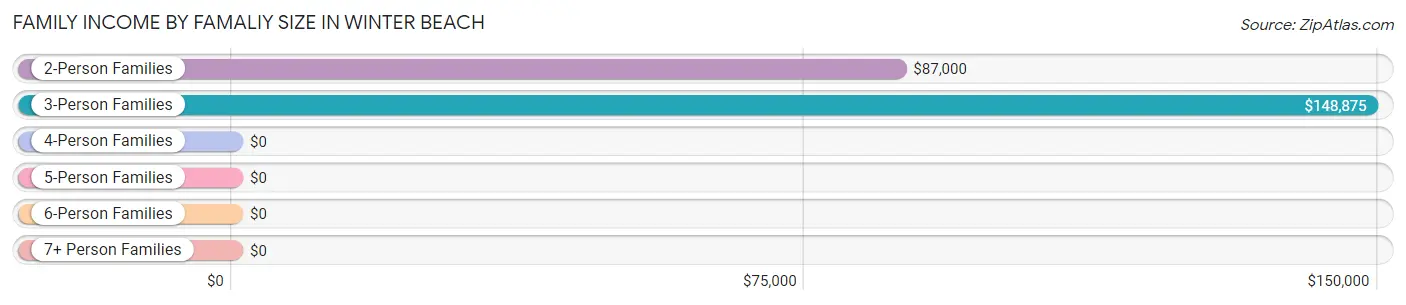
| Income Bracket | # Families | Median Income |
| 2-Person Families | 686 (62.5%) | $87,000 |
| 3-Person Families | 156 (14.2%) | $148,875 |
| 4-Person Families | 42 (3.8%) | $0 |
| 5-Person Families | 119 (10.8%) | $0 |
| 6-Person Families | 39 (3.6%) | $0 |
| 7+ Person Families | 55 (5.0%) | $0 |
| Total | 1,097 (100.0%) | $96,989 |
Family Income by Number of Earners in Winter Beach
The median family income in Winter Beach is $96,989, with families comprising 3+ earners (83) having the highest median family income of $250,001, while families with no earners (453) have the lowest median family income of $67,019, accounting for 7.6% and 41.3% of families, respectively.
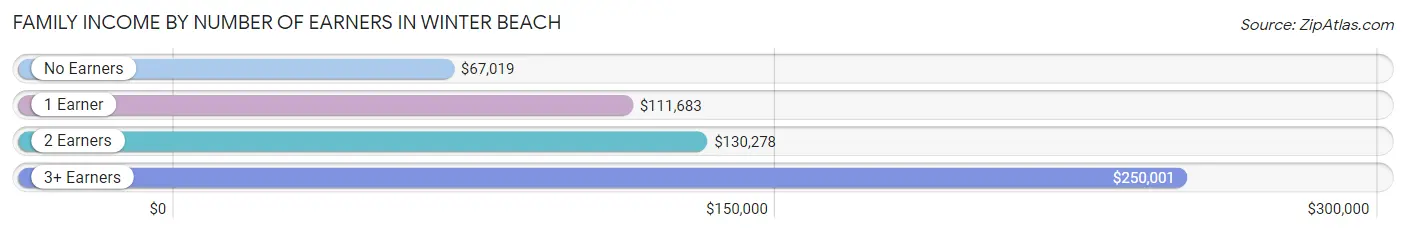
| Number of Earners | # Families | Median Income |
| No Earners | 453 (41.3%) | $67,019 |
| 1 Earner | 159 (14.5%) | $111,683 |
| 2 Earners | 402 (36.6%) | $130,278 |
| 3+ Earners | 83 (7.6%) | $250,001 |
| Total | 1,097 (100.0%) | $96,989 |
Household Income in Winter Beach
Household Income Brackets in Winter Beach
With 317 households falling in the category, the $100,000 to $149,999 income range is the most frequent in Winter Beach, accounting for 23.3% of all households. In contrast, only 16 households (1.2%) fall into the $10,000 to $14,999 income bracket, making it the least populous group.
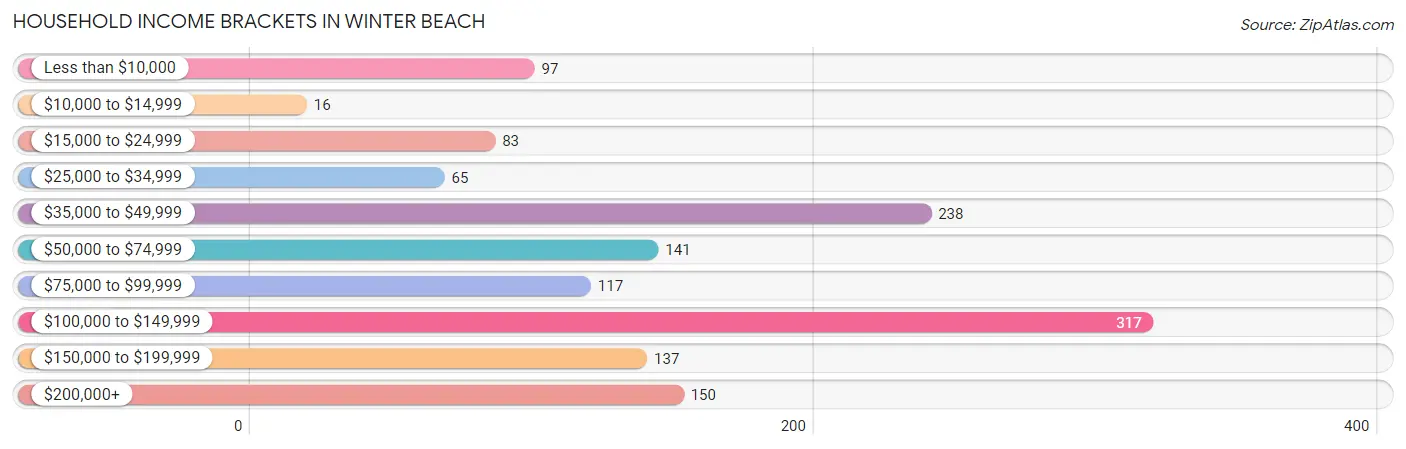
| Income Bracket | # Households | % Households |
| Less than $10,000 | 97 | 7.1% |
| $10,000 to $14,999 | 16 | 1.2% |
| $15,000 to $24,999 | 83 | 6.1% |
| $25,000 to $34,999 | 65 | 4.8% |
| $35,000 to $49,999 | 238 | 17.5% |
| $50,000 to $74,999 | 141 | 10.4% |
| $75,000 to $99,999 | 117 | 8.6% |
| $100,000 to $149,999 | 317 | 23.3% |
| $150,000 to $199,999 | 137 | 10.1% |
| $200,000+ | 150 | 11.0% |
Household Income by Householder Age in Winter Beach
The median household income in Winter Beach is $82,045, with the highest median household income of $225,357 found in the 25 to 44 years age bracket for the primary householder. A total of 158 households (11.6%) fall into this category.
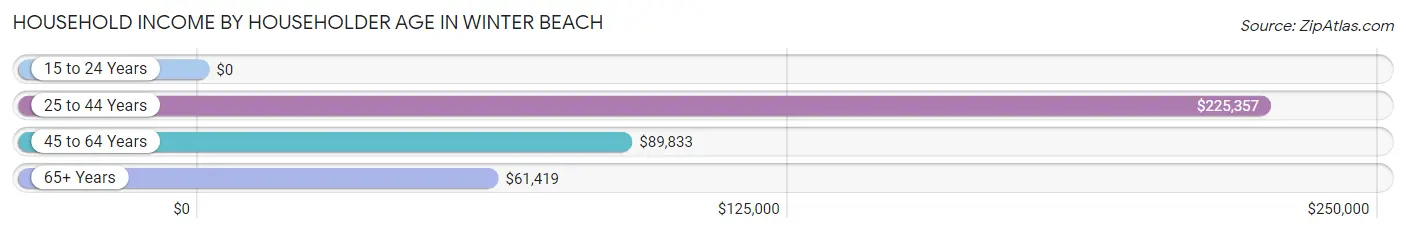
| Income Bracket | # Households | Median Income |
| 15 to 24 Years | 0 (0.0%) | $0 |
| 25 to 44 Years | 158 (11.6%) | $225,357 |
| 45 to 64 Years | 494 (36.3%) | $89,833 |
| 65+ Years | 708 (52.1%) | $61,419 |
| Total | 1,360 (100.0%) | $82,045 |
Poverty in Winter Beach
Income Below Poverty by Sex and Age in Winter Beach
With 12.2% poverty level for males and 8.0% for females among the residents of Winter Beach, 12 to 14 year old males and 55 to 64 year old females are the most vulnerable to poverty, with 15 males (100.0%) and 108 females (26.3%) in their respective age groups living below the poverty level.
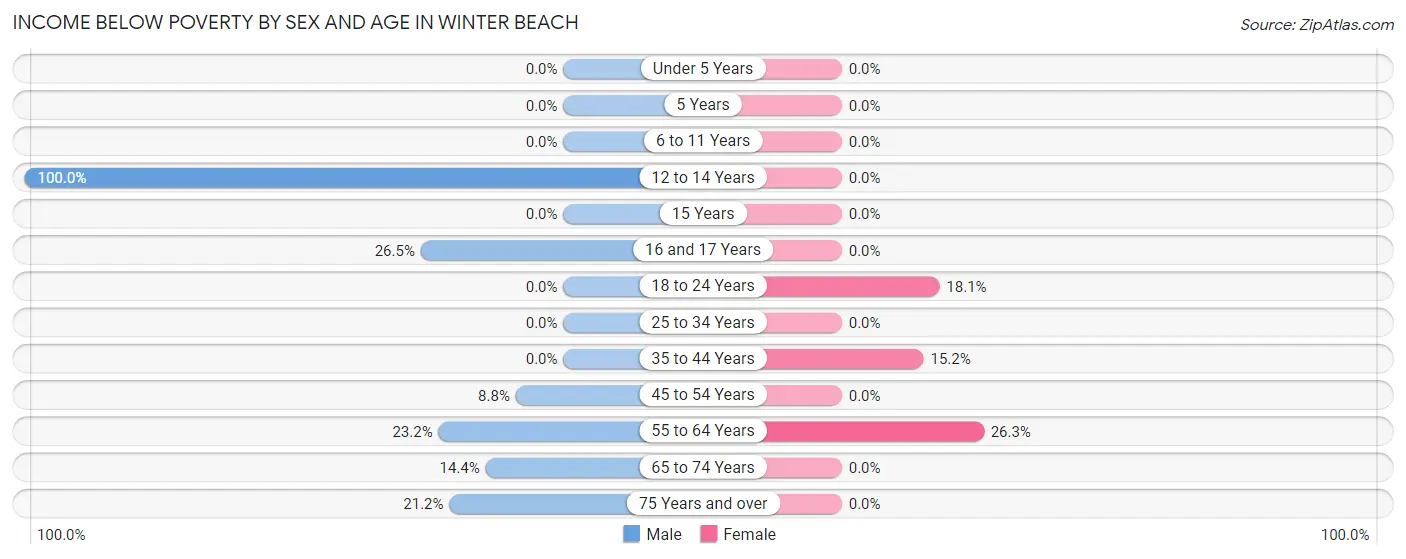
| Age Bracket | Male | Female |
| Under 5 Years | 0 (0.0%) | 0 (0.0%) |
| 5 Years | 0 (0.0%) | 0 (0.0%) |
| 6 to 11 Years | 0 (0.0%) | 0 (0.0%) |
| 12 to 14 Years | 15 (100.0%) | 0 (0.0%) |
| 15 Years | 0 (0.0%) | 0 (0.0%) |
| 16 and 17 Years | 27 (26.5%) | 0 (0.0%) |
| 18 to 24 Years | 0 (0.0%) | 50 (18.1%) |
| 25 to 34 Years | 0 (0.0%) | 0 (0.0%) |
| 35 to 44 Years | 0 (0.0%) | 27 (15.2%) |
| 45 to 54 Years | 16 (8.8%) | 0 (0.0%) |
| 55 to 64 Years | 70 (23.2%) | 108 (26.3%) |
| 65 to 74 Years | 59 (14.4%) | 0 (0.0%) |
| 75 Years and over | 51 (21.2%) | 0 (0.0%) |
| Total | 238 (12.2%) | 185 (8.0%) |
Income Above Poverty by Sex and Age in Winter Beach
According to the poverty statistics in Winter Beach, males aged under 5 years and females aged under 5 years are the age groups that are most secure financially, with 100.0% of males and 100.0% of females in these age groups living above the poverty line.
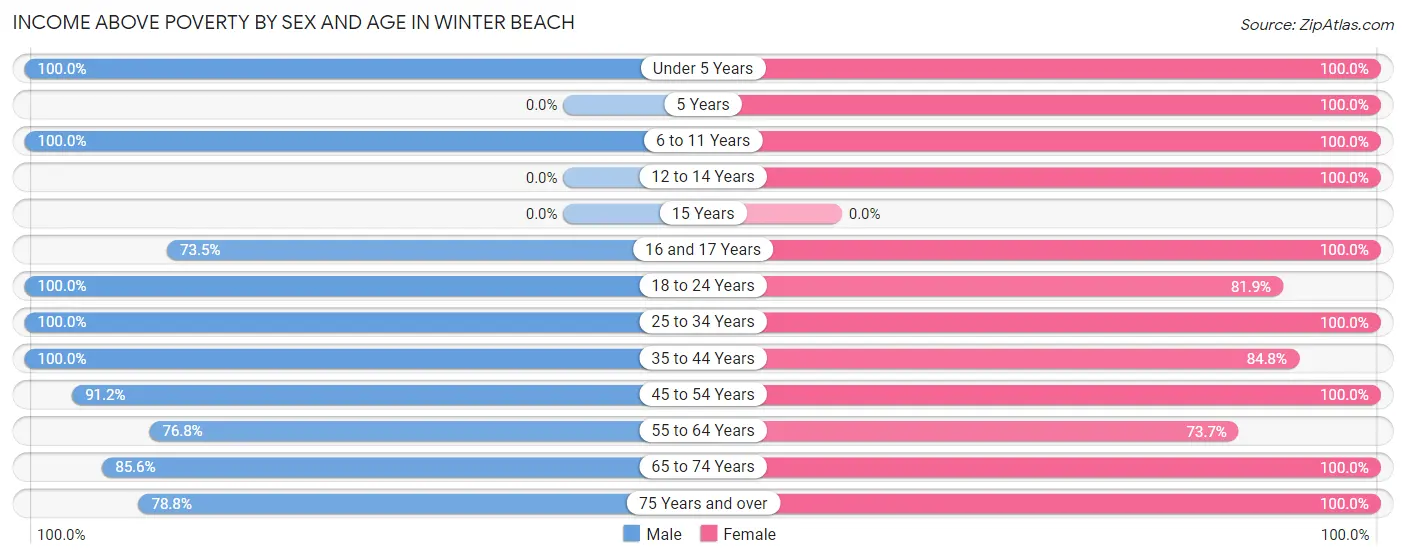
| Age Bracket | Male | Female |
| Under 5 Years | 246 (100.0%) | 27 (100.0%) |
| 5 Years | 0 (0.0%) | 49 (100.0%) |
| 6 to 11 Years | 84 (100.0%) | 55 (100.0%) |
| 12 to 14 Years | 0 (0.0%) | 220 (100.0%) |
| 15 Years | 0 (0.0%) | 0 (0.0%) |
| 16 and 17 Years | 75 (73.5%) | 44 (100.0%) |
| 18 to 24 Years | 160 (100.0%) | 226 (81.9%) |
| 25 to 34 Years | 75 (100.0%) | 158 (100.0%) |
| 35 to 44 Years | 135 (100.0%) | 151 (84.8%) |
| 45 to 54 Years | 165 (91.2%) | 99 (100.0%) |
| 55 to 64 Years | 232 (76.8%) | 302 (73.7%) |
| 65 to 74 Years | 350 (85.6%) | 436 (100.0%) |
| 75 Years and over | 190 (78.8%) | 366 (100.0%) |
| Total | 1,712 (87.8%) | 2,133 (92.0%) |
Income Below Poverty Among Married-Couple Families in Winter Beach
The poverty statistics for married-couple families in Winter Beach show that 12.2% or 127 of the total 1,043 families live below the poverty line. Families with 1 or 2 children have the highest poverty rate of 16.1%, comprising of 37 families. On the other hand, families with 3 or 4 children have the lowest poverty rate of 0.0%, which includes 0 families.
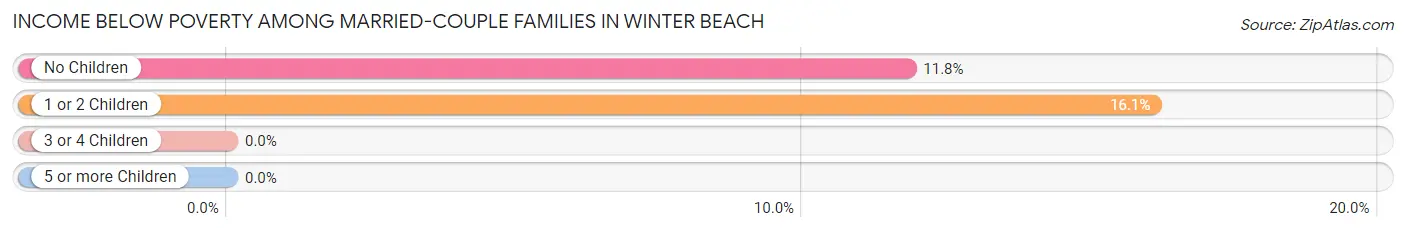
| Children | Above Poverty | Below Poverty |
| No Children | 672 (88.2%) | 90 (11.8%) |
| 1 or 2 Children | 193 (83.9%) | 37 (16.1%) |
| 3 or 4 Children | 51 (100.0%) | 0 (0.0%) |
| 5 or more Children | 0 (0.0%) | 0 (0.0%) |
| Total | 916 (87.8%) | 127 (12.2%) |
Income Below Poverty Among Single-Parent Households in Winter Beach
| Children | Single Father | Single Mother |
| No Children | 0 (0.0%) | 0 (0.0%) |
| 1 or 2 Children | 0 (0.0%) | 0 (0.0%) |
| 3 or 4 Children | 0 (0.0%) | 0 (0.0%) |
| 5 or more Children | 0 (0.0%) | 0 (0.0%) |
| Total | 0 (0.0%) | 0 (0.0%) |
Income Below Poverty Among Married-Couple vs Single-Parent Households in Winter Beach
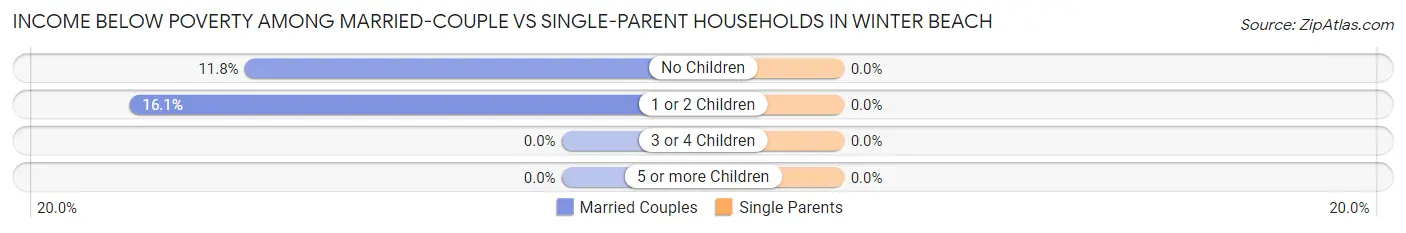
| Children | Married-Couple Families | Single-Parent Households |
| No Children | 90 (11.8%) | 0 (0.0%) |
| 1 or 2 Children | 37 (16.1%) | 0 (0.0%) |
| 3 or 4 Children | 0 (0.0%) | 0 (0.0%) |
| 5 or more Children | 0 (0.0%) | 0 (0.0%) |
| Total | 127 (12.2%) | 0 (0.0%) |
Race in Winter Beach
The most populous races in Winter Beach are White / Caucasian (3,339 | 78.1%), Hispanic or Latino (773 | 18.1%), and Two or more Races (574 | 13.4%).
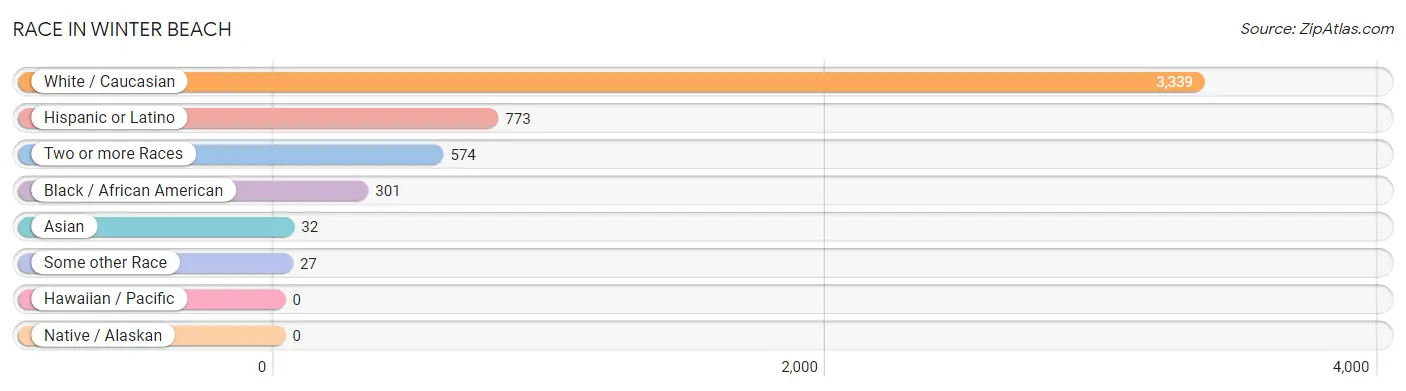
| Race | # Population | % Population |
| Asian | 32 | 0.7% |
| Black / African American | 301 | 7.0% |
| Hawaiian / Pacific | 0 | 0.0% |
| Hispanic or Latino | 773 | 18.1% |
| Native / Alaskan | 0 | 0.0% |
| White / Caucasian | 3,339 | 78.1% |
| Two or more Races | 574 | 13.4% |
| Some other Race | 27 | 0.6% |
| Total | 4,273 | 100.0% |
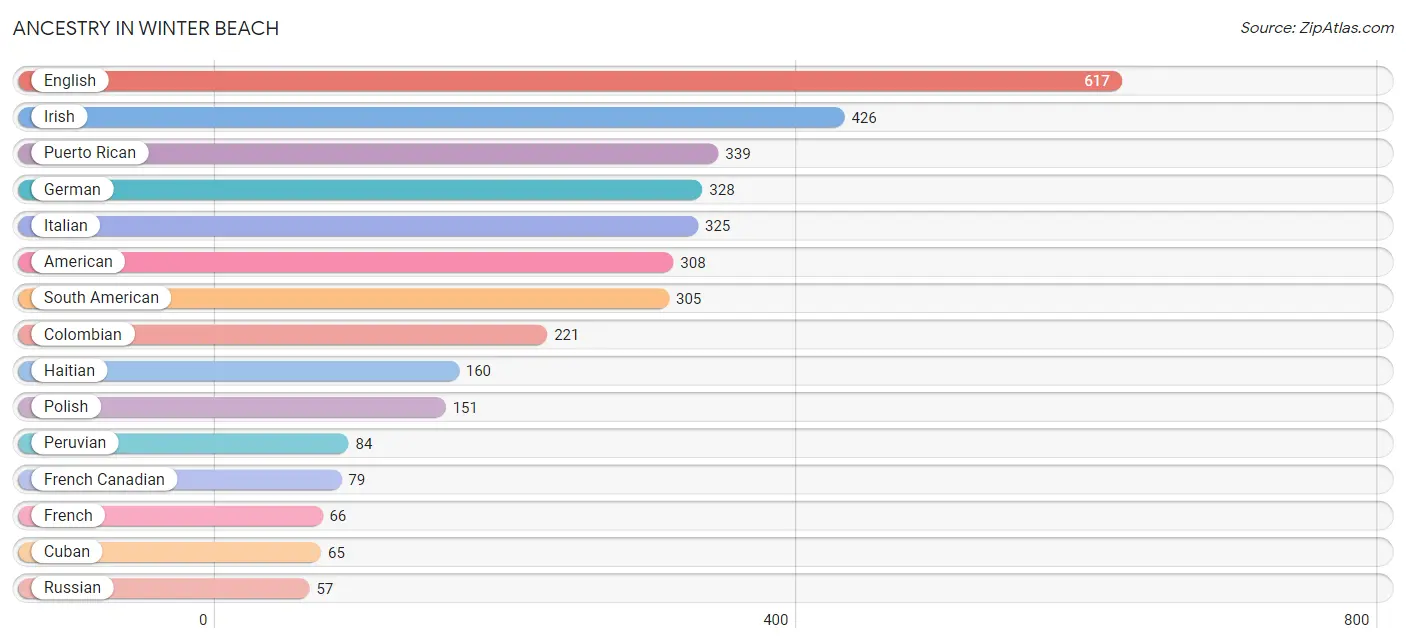
Ancestry in Winter Beach
The most populous ancestries reported in Winter Beach are English (617 | 14.4%), Irish (426 | 10.0%), Puerto Rican (339 | 7.9%), German (328 | 7.7%), and Italian (325 | 7.6%), together accounting for 47.6% of all Winter Beach residents.
| Ancestry | # Population | % Population |
| American | 308 | 7.2% |
| Austrian | 21 | 0.5% |
| Bhutanese | 9 | 0.2% |
| British | 21 | 0.5% |
| Central American | 26 | 0.6% |
| Colombian | 221 | 5.2% |
| Creek | 42 | 1.0% |
| Croatian | 8 | 0.2% |
| Cuban | 65 | 1.5% |
| Czech | 28 | 0.7% |
| Danish | 18 | 0.4% |
| Dominican | 38 | 0.9% |
| Dutch | 55 | 1.3% |
| English | 617 | 14.4% |
| European | 12 | 0.3% |
| Finnish | 17 | 0.4% |
| French | 66 | 1.5% |
| French Canadian | 79 | 1.8% |
| German | 328 | 7.7% |
| Greek | 22 | 0.5% |
| Haitian | 160 | 3.7% |
| Hungarian | 10 | 0.2% |
| Irish | 426 | 10.0% |
| Italian | 325 | 7.6% |
| Jamaican | 22 | 0.5% |
| Nicaraguan | 26 | 0.6% |
| Norwegian | 28 | 0.7% |
| Peruvian | 84 | 2.0% |
| Polish | 151 | 3.5% |
| Puerto Rican | 339 | 7.9% |
| Romanian | 39 | 0.9% |
| Russian | 57 | 1.3% |
| Scandinavian | 19 | 0.4% |
| Scotch-Irish | 29 | 0.7% |
| Scottish | 51 | 1.2% |
| Slovak | 8 | 0.2% |
| South American | 305 | 7.1% |
| Sri Lankan | 19 | 0.4% |
| Swedish | 29 | 0.7% |
| Swiss | 31 | 0.7% |
| Thai | 13 | 0.3% |
| Welsh | 9 | 0.2% | View All 42 Rows |
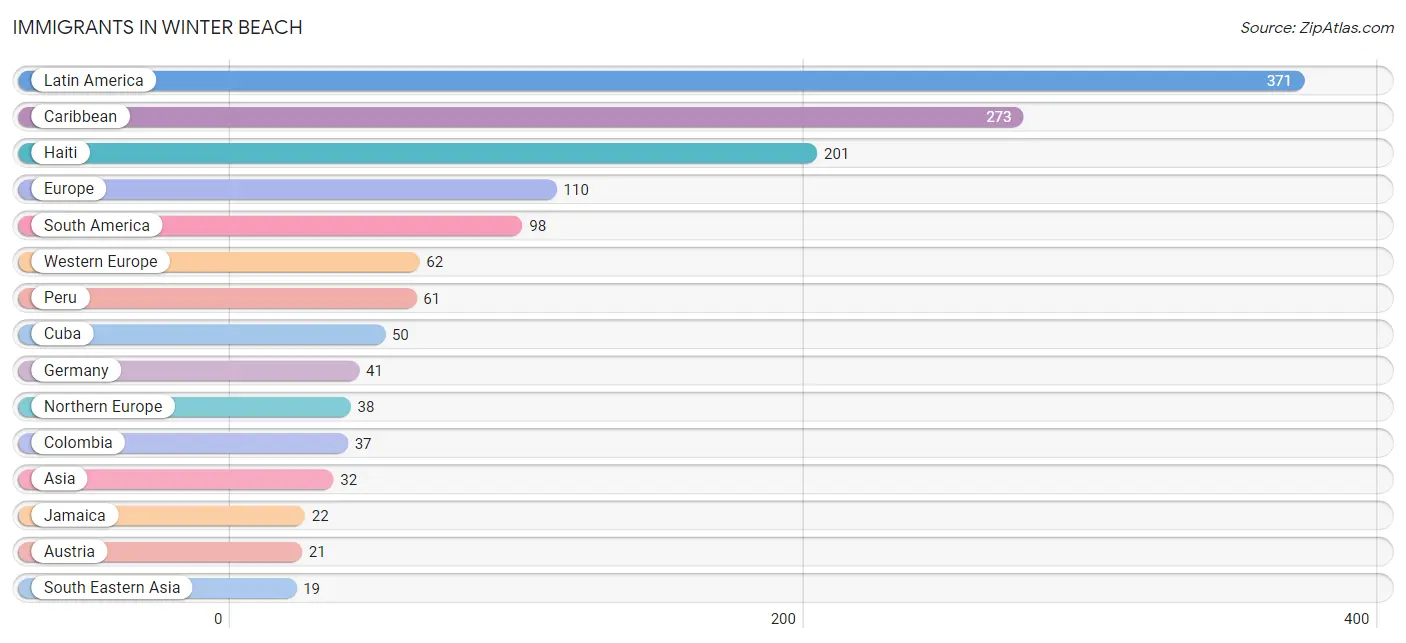
Immigrants in Winter Beach
The most numerous immigrant groups reported in Winter Beach came from Latin America (371 | 8.7%), Caribbean (273 | 6.4%), Haiti (201 | 4.7%), Europe (110 | 2.6%), and South America (98 | 2.3%), together accounting for 24.6% of all Winter Beach residents.
| Immigration Origin | # Population | % Population |
| Asia | 32 | 0.7% |
| Austria | 21 | 0.5% |
| Caribbean | 273 | 6.4% |
| Colombia | 37 | 0.9% |
| Cuba | 50 | 1.2% |
| Eastern Europe | 10 | 0.2% |
| Europe | 110 | 2.6% |
| Germany | 41 | 1.0% |
| Haiti | 201 | 4.7% |
| Hungary | 10 | 0.2% |
| India | 13 | 0.3% |
| Jamaica | 22 | 0.5% |
| Latin America | 371 | 8.7% |
| Northern Europe | 38 | 0.9% |
| Peru | 61 | 1.4% |
| South America | 98 | 2.3% |
| South Central Asia | 13 | 0.3% |
| South Eastern Asia | 19 | 0.4% |
| Vietnam | 19 | 0.4% |
| Western Europe | 62 | 1.5% | View All 20 Rows |
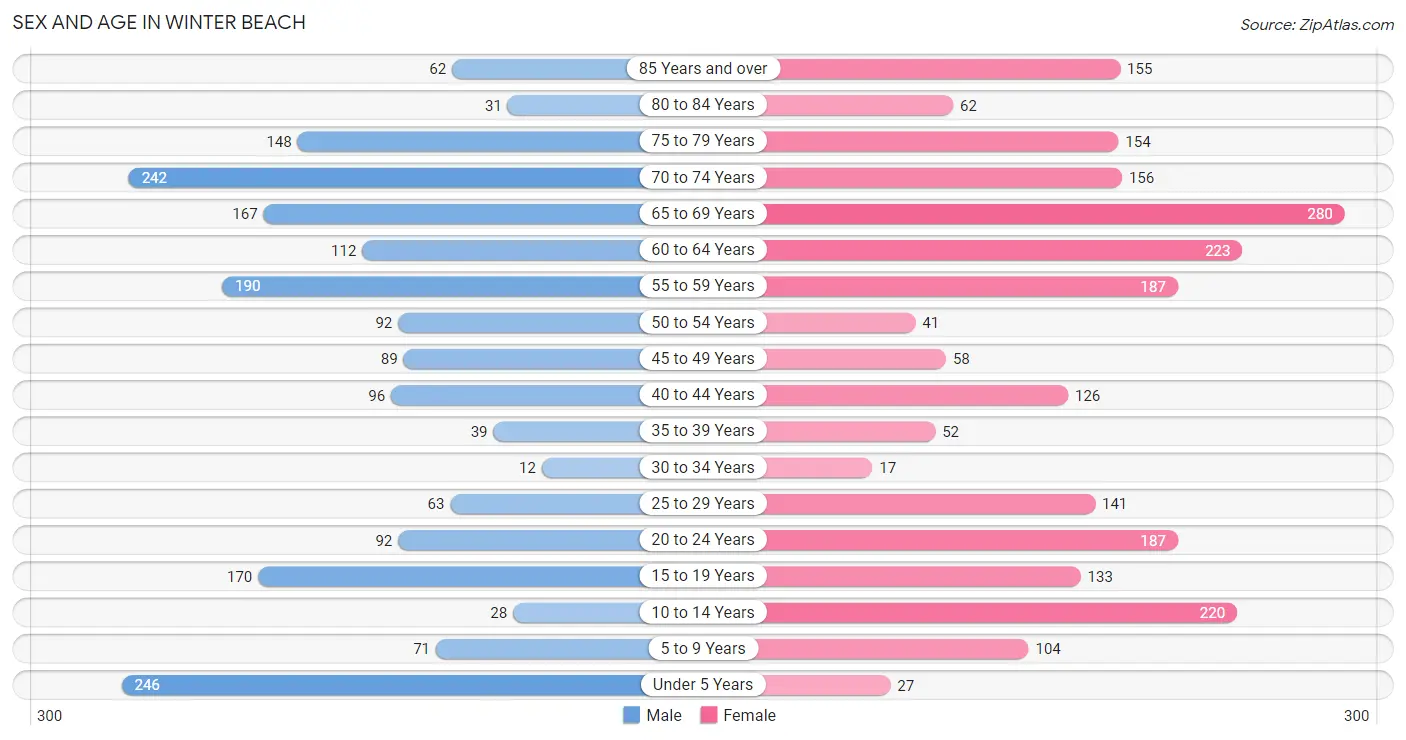
Sex and Age in Winter Beach
Sex and Age in Winter Beach
The most populous age groups in Winter Beach are Under 5 Years (246 | 12.6%) for men and 65 to 69 Years (280 | 12.0%) for women.
| Age Bracket | Male | Female |
| Under 5 Years | 246 (12.6%) | 27 (1.2%) |
| 5 to 9 Years | 71 (3.6%) | 104 (4.5%) |
| 10 to 14 Years | 28 (1.4%) | 220 (9.5%) |
| 15 to 19 Years | 170 (8.7%) | 133 (5.7%) |
| 20 to 24 Years | 92 (4.7%) | 187 (8.1%) |
| 25 to 29 Years | 63 (3.2%) | 141 (6.1%) |
| 30 to 34 Years | 12 (0.6%) | 17 (0.7%) |
| 35 to 39 Years | 39 (2.0%) | 52 (2.2%) |
| 40 to 44 Years | 96 (4.9%) | 126 (5.4%) |
| 45 to 49 Years | 89 (4.6%) | 58 (2.5%) |
| 50 to 54 Years | 92 (4.7%) | 41 (1.8%) |
| 55 to 59 Years | 190 (9.7%) | 187 (8.1%) |
| 60 to 64 Years | 112 (5.7%) | 223 (9.6%) |
| 65 to 69 Years | 167 (8.6%) | 280 (12.0%) |
| 70 to 74 Years | 242 (12.4%) | 156 (6.7%) |
| 75 to 79 Years | 148 (7.6%) | 154 (6.6%) |
| 80 to 84 Years | 31 (1.6%) | 62 (2.7%) |
| 85 Years and over | 62 (3.2%) | 155 (6.7%) |
| Total | 1,950 (100.0%) | 2,323 (100.0%) |
Families and Households in Winter Beach
Median Family Size in Winter Beach
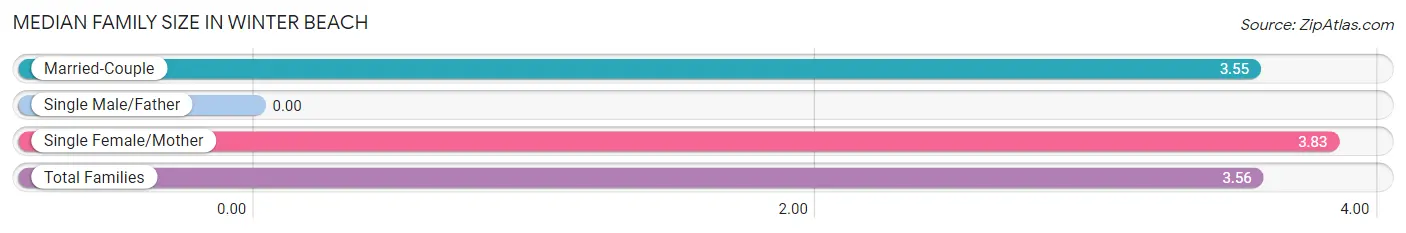
| Family Type | # Families | Family Size |
| Married-Couple | 1,043 (95.1%) | 3.55 |
| Single Male/Father | 0 (0.0%) | - |
| Single Female/Mother | 54 (4.9%) | 3.83 |
| Total Families | 1,097 (100.0%) | 3.56 |
Median Household Size in Winter Beach
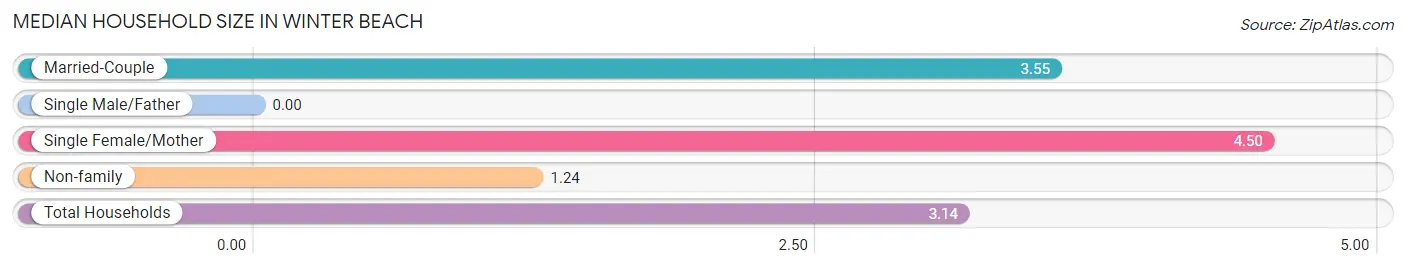
| Household Type | # Households | Household Size |
| Married-Couple | 1,043 (76.7%) | 3.55 |
| Single Male/Father | 0 (0.0%) | - |
| Single Female/Mother | 54 (4.0%) | 4.50 |
| Non-family | 263 (19.3%) | 1.24 |
| Total Households | 1,360 (100.0%) | 3.14 |
Household Size by Marriage Status in Winter Beach
Out of a total of 1,360 households in Winter Beach, 1,097 (80.7%) are family households, while 263 (19.3%) are nonfamily households. The most numerous type of family households are 2-person households, comprising 686, and the most common type of nonfamily households are 1-person households, comprising 203.
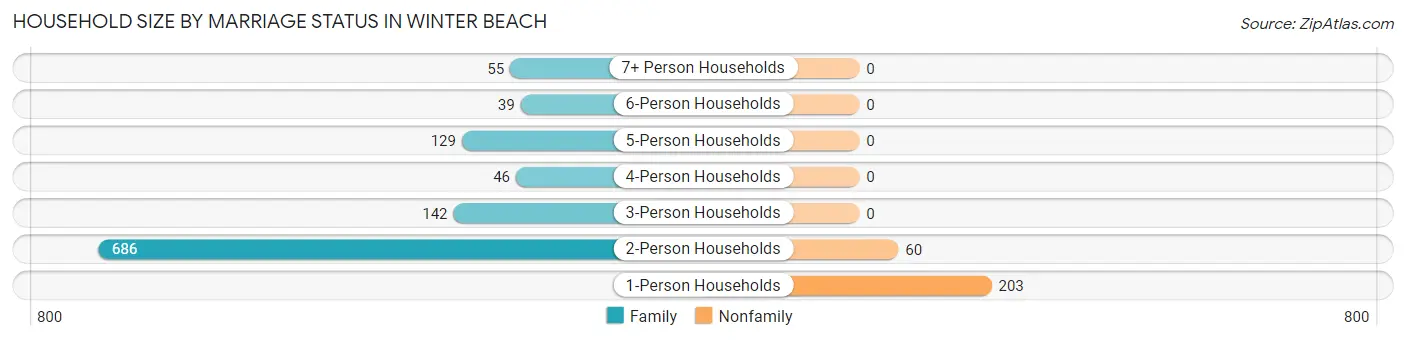
| Household Size | Family Households | Nonfamily Households |
| 1-Person Households | - | 203 (14.9%) |
| 2-Person Households | 686 (50.4%) | 60 (4.4%) |
| 3-Person Households | 142 (10.4%) | 0 (0.0%) |
| 4-Person Households | 46 (3.4%) | 0 (0.0%) |
| 5-Person Households | 129 (9.5%) | 0 (0.0%) |
| 6-Person Households | 39 (2.9%) | 0 (0.0%) |
| 7+ Person Households | 55 (4.0%) | 0 (0.0%) |
| Total | 1,097 (80.7%) | 263 (19.3%) |
Female Fertility in Winter Beach
Fertility by Age in Winter Beach
Average fertility rate in Winter Beach is 15.0 births per 1,000 women. Women in the age bracket of 20 to 34 years have the highest fertility rate with 32.0 births per 1,000 women. Women in the age bracket of 20 to 34 years acount for 100.0% of all women with births.
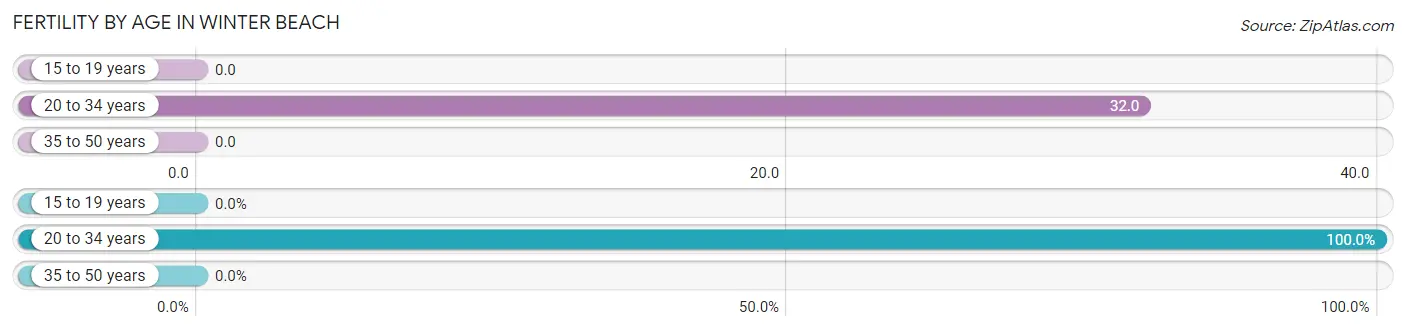
| Age Bracket | Women with Births | Births / 1,000 Women |
| 15 to 19 years | 0 (0.0%) | 0.0 |
| 20 to 34 years | 11 (100.0%) | 32.0 |
| 35 to 50 years | 0 (0.0%) | 0.0 |
| Total | 11 (100.0%) | 15.0 |
Fertility by Age by Marriage Status in Winter Beach
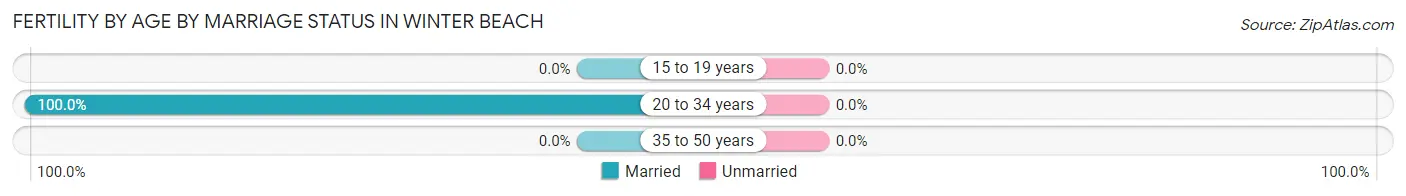
| Age Bracket | Married | Unmarried |
| 15 to 19 years | 0 (0.0%) | 0 (0.0%) |
| 20 to 34 years | 11 (100.0%) | 0 (0.0%) |
| 35 to 50 years | 0 (0.0%) | 0 (0.0%) |
| Total | 11 (100.0%) | 0 (0.0%) |
Fertility by Education in Winter Beach
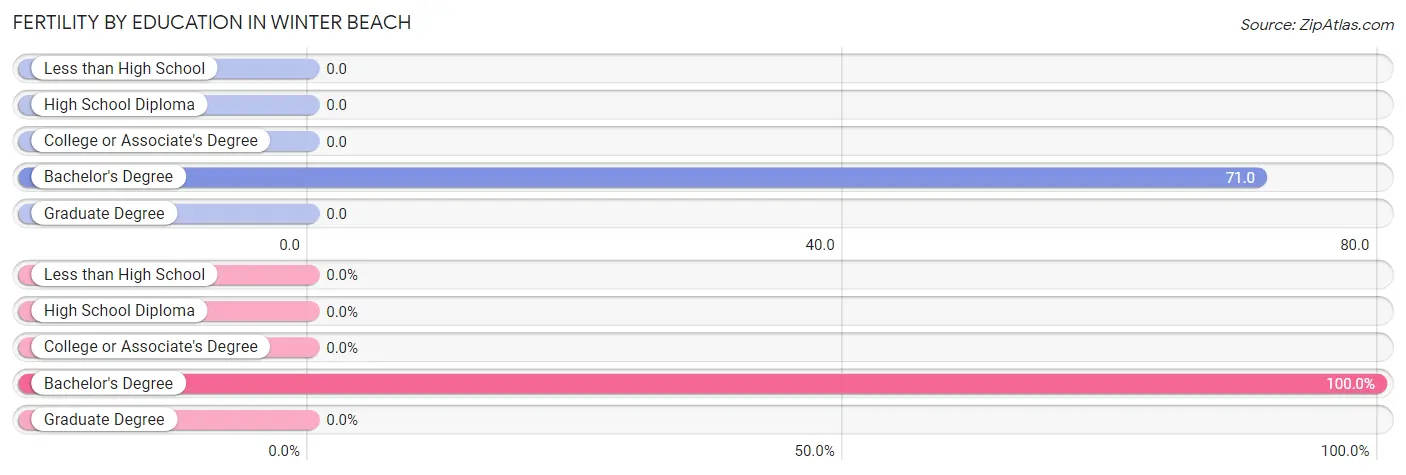
| Educational Attainment | Women with Births | Births / 1,000 Women |
| Less than High School | 0 (0.0%) | 0.0 |
| High School Diploma | 0 (0.0%) | 0.0 |
| College or Associate's Degree | 0 (0.0%) | 0.0 |
| Bachelor's Degree | 11 (100.0%) | 71.0 |
| Graduate Degree | 0 (0.0%) | 0.0 |
| Total | 11 (100.0%) | 15.0 |
Fertility by Education by Marriage Status in Winter Beach
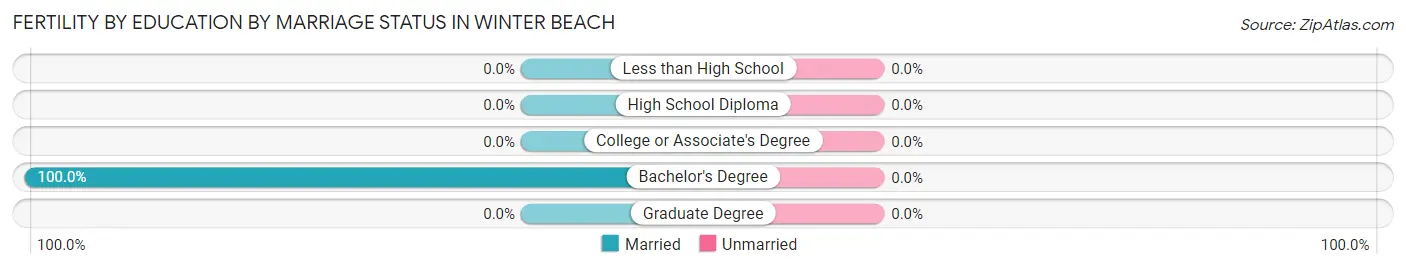
| Educational Attainment | Married | Unmarried |
| Less than High School | 0 (0.0%) | 0 (0.0%) |
| High School Diploma | 0 (0.0%) | 0 (0.0%) |
| College or Associate's Degree | 0 (0.0%) | 0 (0.0%) |
| Bachelor's Degree | 11 (100.0%) | 0 (0.0%) |
| Graduate Degree | 0 (0.0%) | 0 (0.0%) |
| Total | 11 (100.0%) | 0 (0.0%) |
Employment Characteristics in Winter Beach
Employment by Class of Employer in Winter Beach
Among the 1,161 employed individuals in Winter Beach, private company employees (781 | 67.3%), local government employees (172 | 14.8%), and not-for-profit organizations (111 | 9.6%) make up the most common classes of employment.
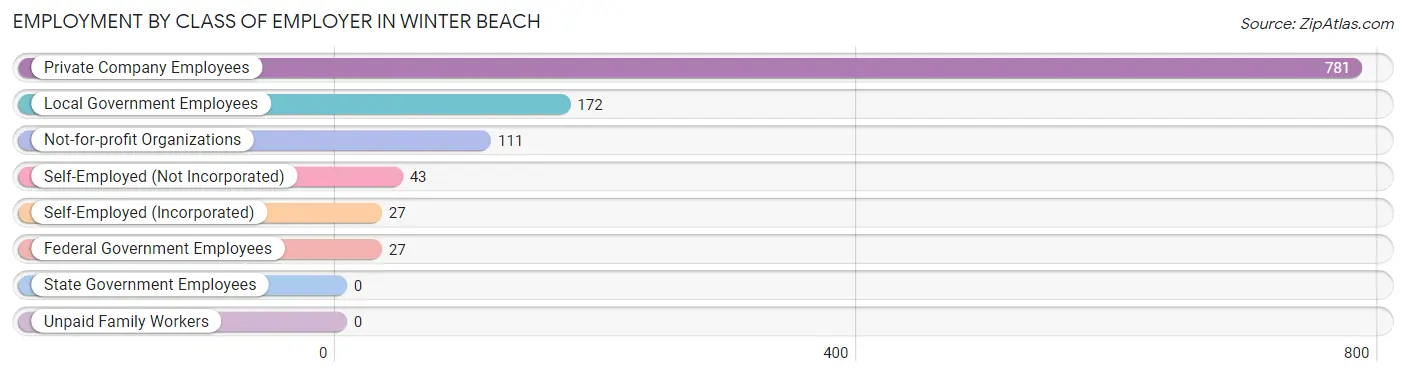
| Employer Class | # Employees | % Employees |
| Private Company Employees | 781 | 67.3% |
| Self-Employed (Incorporated) | 27 | 2.3% |
| Self-Employed (Not Incorporated) | 43 | 3.7% |
| Not-for-profit Organizations | 111 | 9.6% |
| Local Government Employees | 172 | 14.8% |
| State Government Employees | 0 | 0.0% |
| Federal Government Employees | 27 | 2.3% |
| Unpaid Family Workers | 0 | 0.0% |
| Total | 1,161 | 100.0% |
Employment Status by Age in Winter Beach
According to the labor force statistics for Winter Beach, out of the total population over 16 years of age (3,577), 35.3% or 1,263 individuals are in the labor force, with 6.8% or 86 of them unemployed. The age group with the highest labor force participation rate is 35 to 44 years, with 79.2% or 248 individuals in the labor force. Within the labor force, the 25 to 29 years age range has the highest percentage of unemployed individuals, with 32.9% or 33 of them being unemployed.
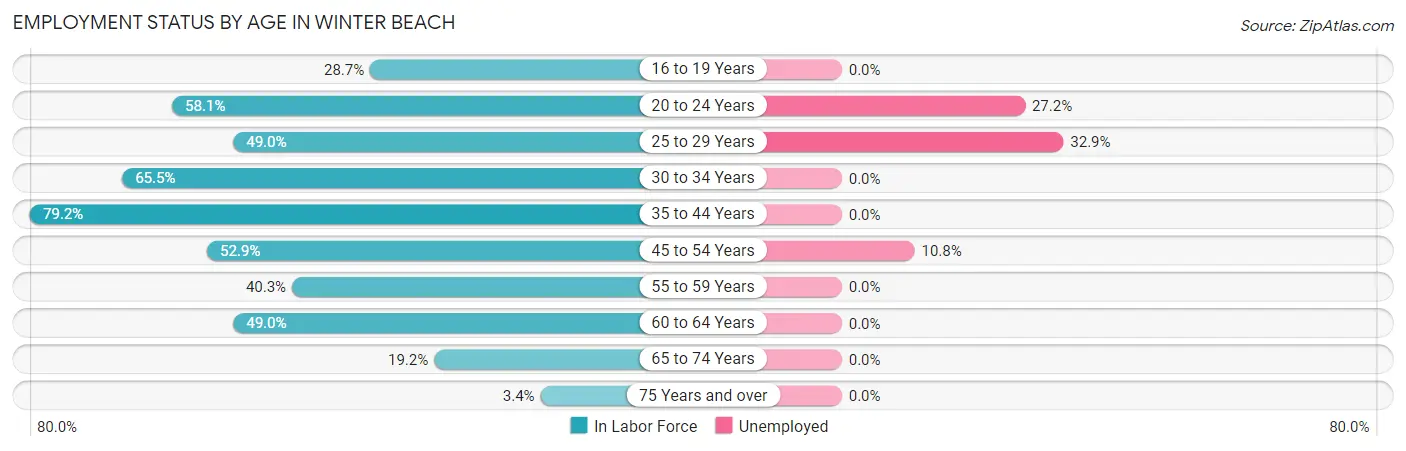
| Age Bracket | In Labor Force | Unemployed |
| 16 to 19 Years | 87 (28.7%) | 0 (0.0%) |
| 20 to 24 Years | 162 (58.1%) | 44 (27.2%) |
| 25 to 29 Years | 100 (49.0%) | 33 (32.9%) |
| 30 to 34 Years | 19 (65.5%) | 0 (0.0%) |
| 35 to 44 Years | 248 (79.2%) | 0 (0.0%) |
| 45 to 54 Years | 148 (52.9%) | 16 (10.8%) |
| 55 to 59 Years | 152 (40.3%) | 0 (0.0%) |
| 60 to 64 Years | 164 (49.0%) | 0 (0.0%) |
| 65 to 74 Years | 162 (19.2%) | 0 (0.0%) |
| 75 Years and over | 21 (3.4%) | 0 (0.0%) |
| Total | 1,263 (35.3%) | 86 (6.8%) |
Employment Status by Educational Attainment in Winter Beach
According to labor force statistics for Winter Beach, 54.0% of individuals (831) out of the total population between 25 and 64 years of age (1,538) are in the labor force, with 5.0% or 42 of them being unemployed. The group with the highest labor force participation rate are those with the educational attainment of bachelor's degree or higher, with 66.9% or 317 individuals in the labor force. Within the labor force, individuals with less than high school education have the highest percentage of unemployment, with 45.7% or 16 of them being unemployed.
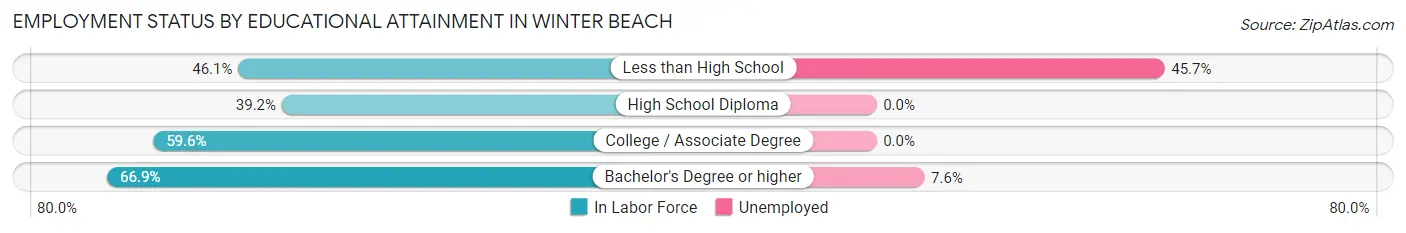
| Educational Attainment | In Labor Force | Unemployed |
| Less than High School | 35 (46.1%) | 35 (45.7%) |
| High School Diploma | 211 (39.2%) | 0 (0.0%) |
| College / Associate Degree | 268 (59.6%) | 0 (0.0%) |
| Bachelor's Degree or higher | 317 (66.9%) | 36 (7.6%) |
| Total | 831 (54.0%) | 77 (5.0%) |
Employment Occupations by Sex in Winter Beach
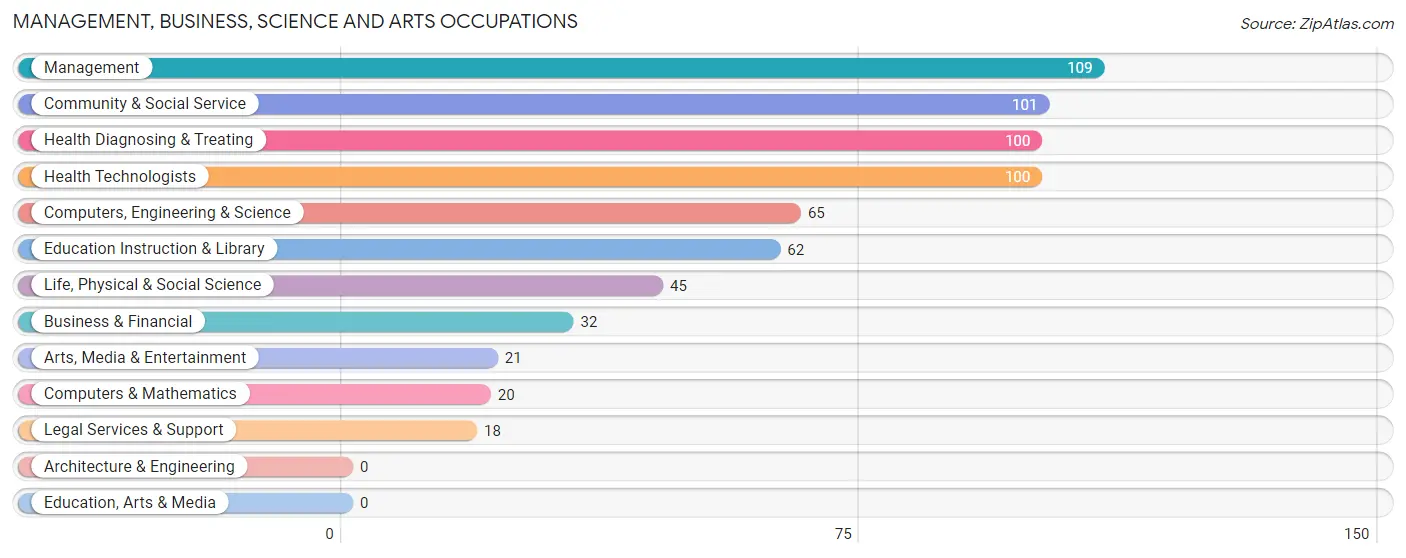
Management, Business, Science and Arts Occupations
The most common Management, Business, Science and Arts occupations in Winter Beach are Management (109 | 9.5%), Community & Social Service (101 | 8.8%), Health Diagnosing & Treating (100 | 8.7%), Health Technologists (100 | 8.7%), and Computers, Engineering & Science (65 | 5.6%).
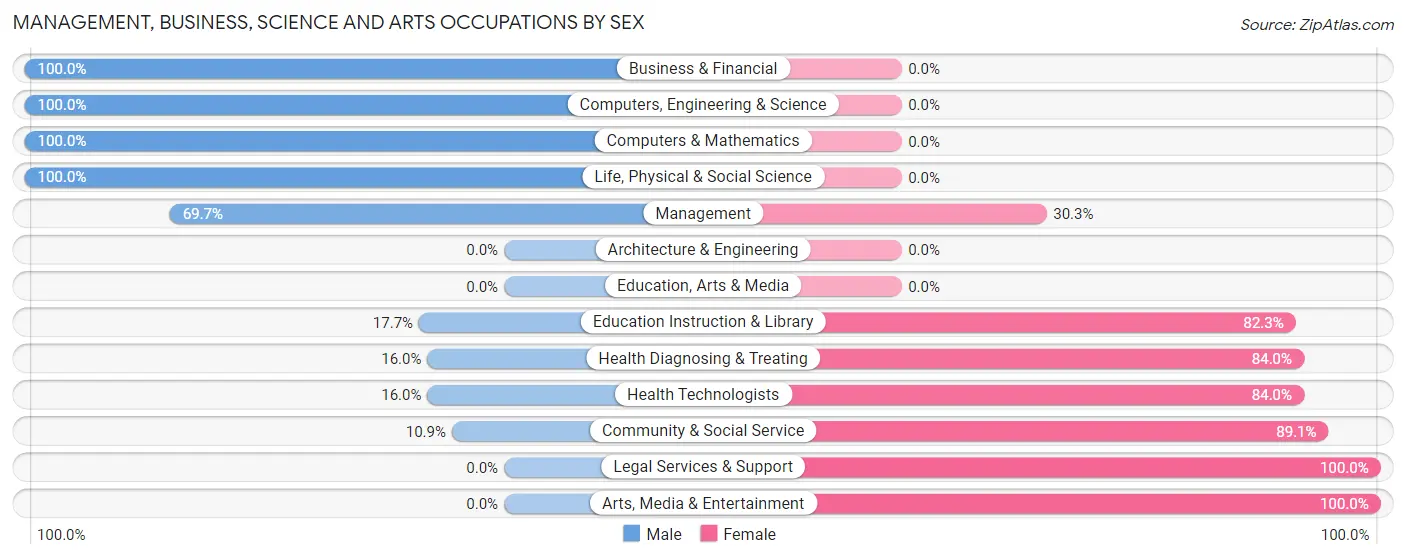
Management, Business, Science and Arts Occupations by Sex
Within the Management, Business, Science and Arts occupations in Winter Beach, the most male-oriented occupations are Business & Financial (100.0%), Computers, Engineering & Science (100.0%), and Computers & Mathematics (100.0%), while the most female-oriented occupations are Legal Services & Support (100.0%), Arts, Media & Entertainment (100.0%), and Community & Social Service (89.1%).
| Occupation | Male | Female |
| Management | 76 (69.7%) | 33 (30.3%) |
| Business & Financial | 32 (100.0%) | 0 (0.0%) |
| Computers, Engineering & Science | 65 (100.0%) | 0 (0.0%) |
| Computers & Mathematics | 20 (100.0%) | 0 (0.0%) |
| Architecture & Engineering | 0 (0.0%) | 0 (0.0%) |
| Life, Physical & Social Science | 45 (100.0%) | 0 (0.0%) |
| Community & Social Service | 11 (10.9%) | 90 (89.1%) |
| Education, Arts & Media | 0 (0.0%) | 0 (0.0%) |
| Legal Services & Support | 0 (0.0%) | 18 (100.0%) |
| Education Instruction & Library | 11 (17.7%) | 51 (82.3%) |
| Arts, Media & Entertainment | 0 (0.0%) | 21 (100.0%) |
| Health Diagnosing & Treating | 16 (16.0%) | 84 (84.0%) |
| Health Technologists | 16 (16.0%) | 84 (84.0%) |
| Total (Category) | 200 (49.1%) | 207 (50.9%) |
| Total (Overall) | 599 (52.0%) | 553 (48.0%) |
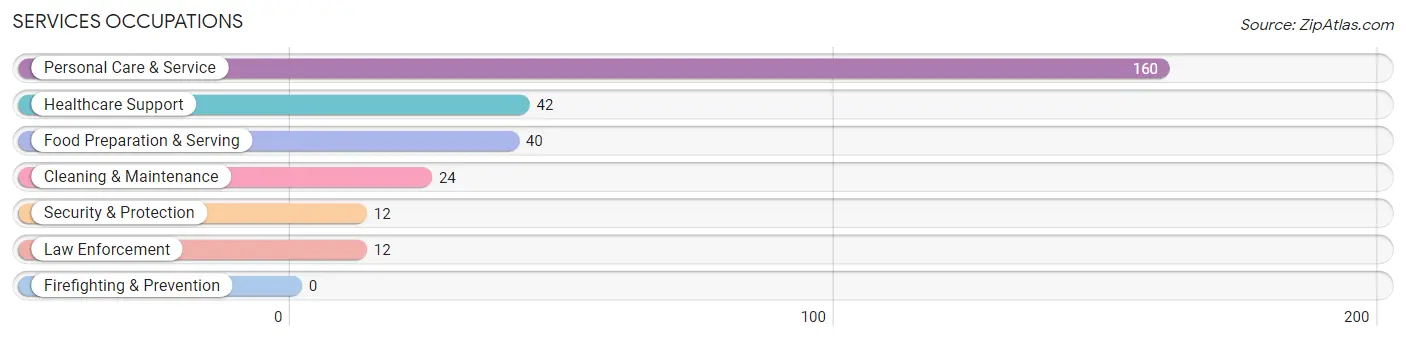
Services Occupations
The most common Services occupations in Winter Beach are Personal Care & Service (160 | 13.9%), Healthcare Support (42 | 3.6%), Food Preparation & Serving (40 | 3.5%), Cleaning & Maintenance (24 | 2.1%), and Security & Protection (12 | 1.0%).
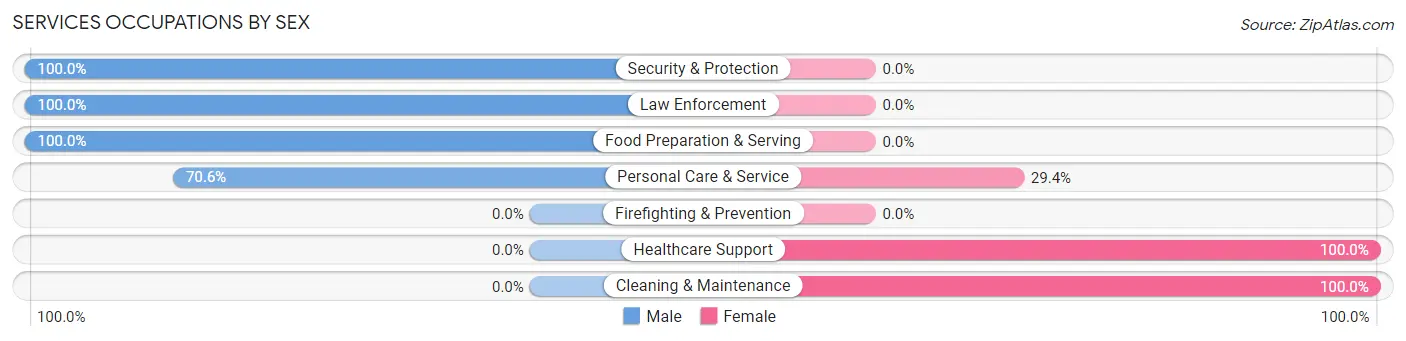
Services Occupations by Sex
Within the Services occupations in Winter Beach, the most male-oriented occupations are Security & Protection (100.0%), Law Enforcement (100.0%), and Food Preparation & Serving (100.0%), while the most female-oriented occupations are Healthcare Support (100.0%), Cleaning & Maintenance (100.0%), and Personal Care & Service (29.4%).
| Occupation | Male | Female |
| Healthcare Support | 0 (0.0%) | 42 (100.0%) |
| Security & Protection | 12 (100.0%) | 0 (0.0%) |
| Firefighting & Prevention | 0 (0.0%) | 0 (0.0%) |
| Law Enforcement | 12 (100.0%) | 0 (0.0%) |
| Food Preparation & Serving | 40 (100.0%) | 0 (0.0%) |
| Cleaning & Maintenance | 0 (0.0%) | 24 (100.0%) |
| Personal Care & Service | 113 (70.6%) | 47 (29.4%) |
| Total (Category) | 165 (59.4%) | 113 (40.6%) |
| Total (Overall) | 599 (52.0%) | 553 (48.0%) |
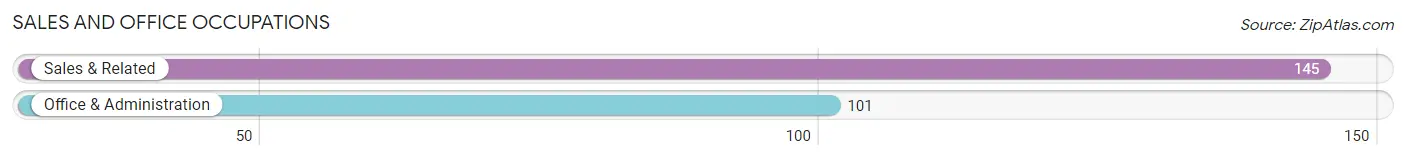
Sales and Office Occupations
The most common Sales and Office occupations in Winter Beach are Sales & Related (145 | 12.6%), and Office & Administration (101 | 8.8%).
Sales and Office Occupations by Sex
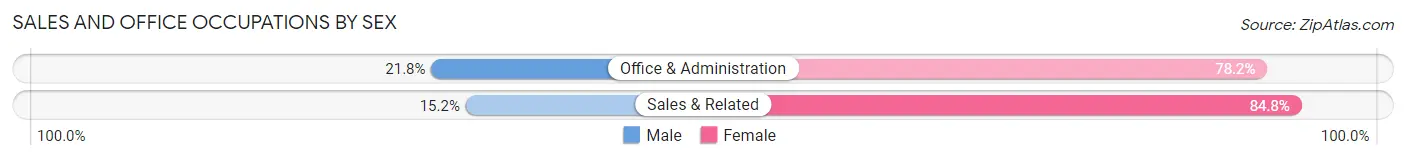
| Occupation | Male | Female |
| Sales & Related | 22 (15.2%) | 123 (84.8%) |
| Office & Administration | 22 (21.8%) | 79 (78.2%) |
| Total (Category) | 44 (17.9%) | 202 (82.1%) |
| Total (Overall) | 599 (52.0%) | 553 (48.0%) |
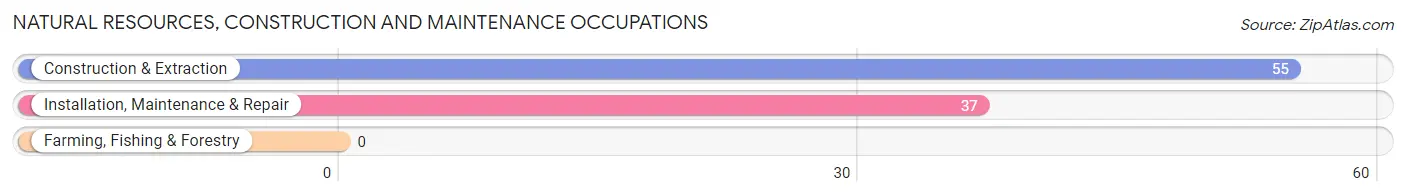
Natural Resources, Construction and Maintenance Occupations
The most common Natural Resources, Construction and Maintenance occupations in Winter Beach are Construction & Extraction (55 | 4.8%), and Installation, Maintenance & Repair (37 | 3.2%).
Natural Resources, Construction and Maintenance Occupations by Sex
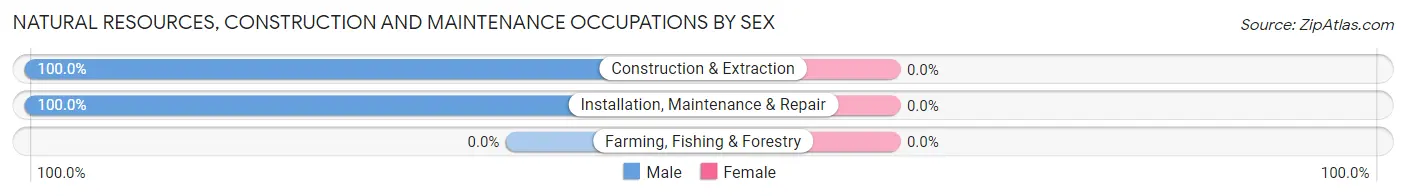
| Occupation | Male | Female |
| Farming, Fishing & Forestry | 0 (0.0%) | 0 (0.0%) |
| Construction & Extraction | 55 (100.0%) | 0 (0.0%) |
| Installation, Maintenance & Repair | 37 (100.0%) | 0 (0.0%) |
| Total (Category) | 92 (100.0%) | 0 (0.0%) |
| Total (Overall) | 599 (52.0%) | 553 (48.0%) |
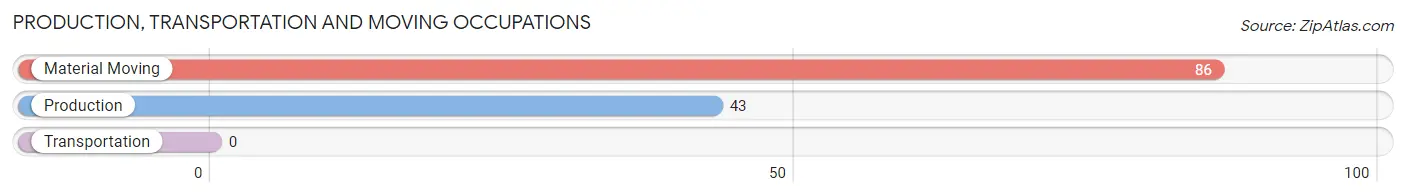
Production, Transportation and Moving Occupations
The most common Production, Transportation and Moving occupations in Winter Beach are Material Moving (86 | 7.5%), and Production (43 | 3.7%).
Production, Transportation and Moving Occupations by Sex
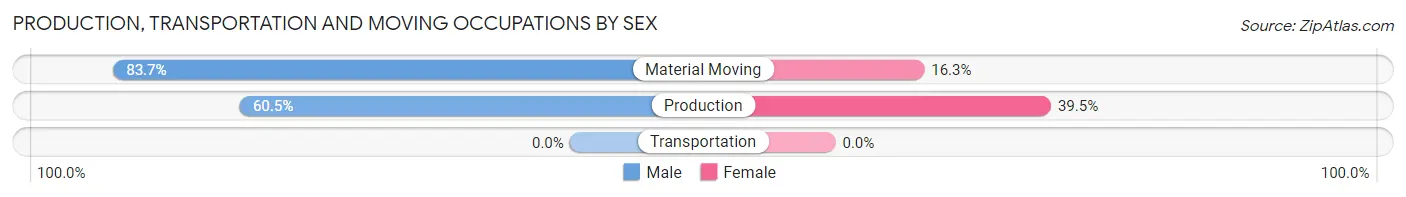
| Occupation | Male | Female |
| Production | 26 (60.5%) | 17 (39.5%) |
| Transportation | 0 (0.0%) | 0 (0.0%) |
| Material Moving | 72 (83.7%) | 14 (16.3%) |
| Total (Category) | 98 (76.0%) | 31 (24.0%) |
| Total (Overall) | 599 (52.0%) | 553 (48.0%) |
Employment Industries by Sex in Winter Beach
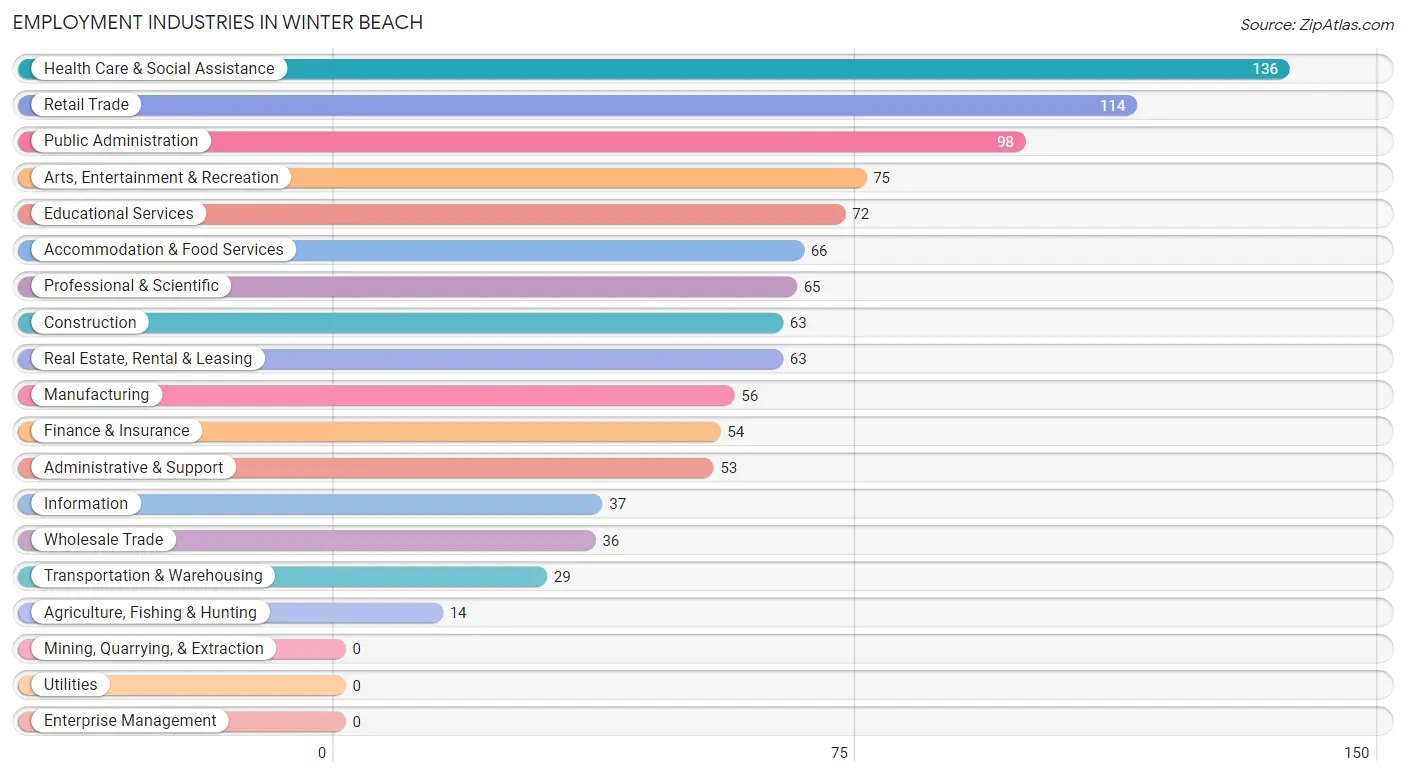
Employment Industries in Winter Beach
The major employment industries in Winter Beach include Health Care & Social Assistance (136 | 11.8%), Retail Trade (114 | 9.9%), Public Administration (98 | 8.5%), Arts, Entertainment & Recreation (75 | 6.5%), and Educational Services (72 | 6.2%).
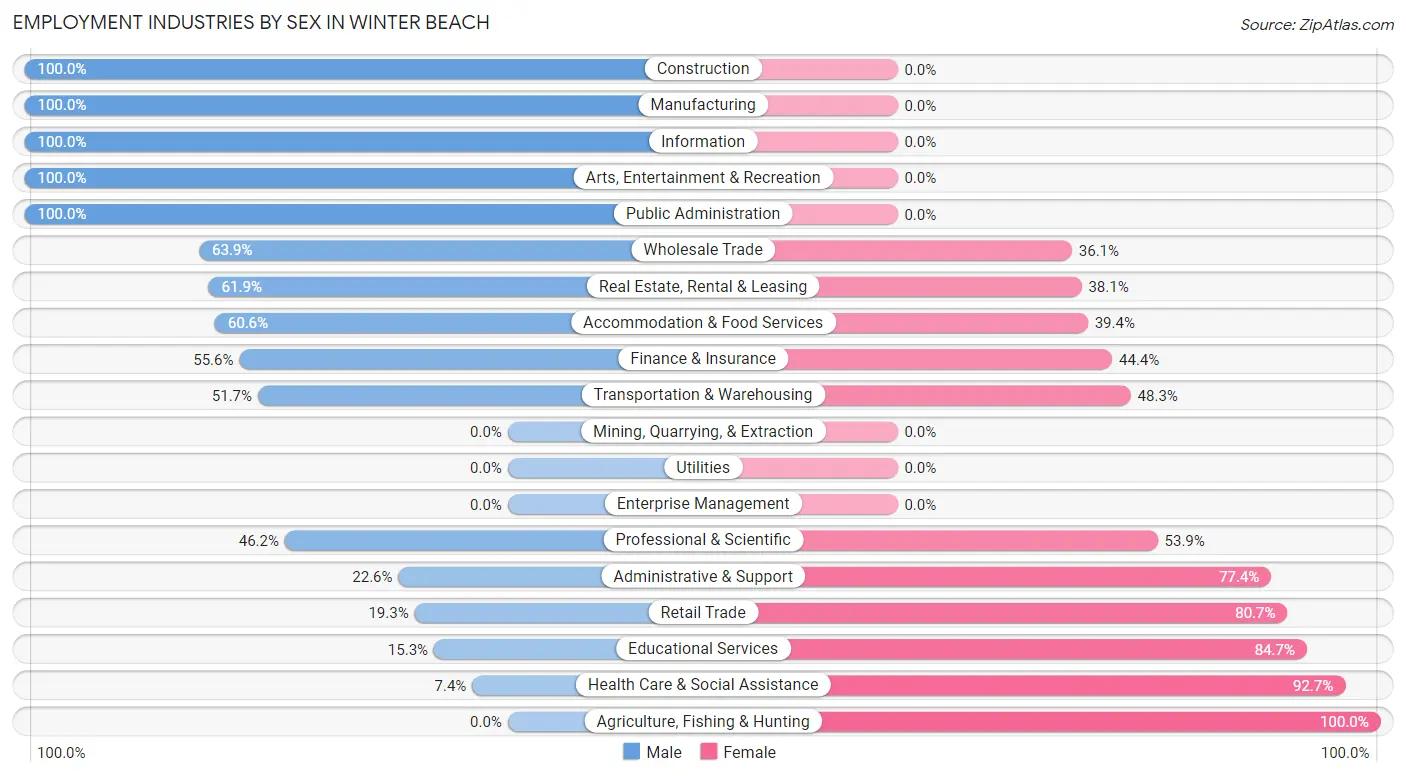
Employment Industries by Sex in Winter Beach
The Winter Beach industries that see more men than women are Construction (100.0%), Manufacturing (100.0%), and Information (100.0%), whereas the industries that tend to have a higher number of women are Agriculture, Fishing & Hunting (100.0%), Health Care & Social Assistance (92.6%), and Educational Services (84.7%).
| Industry | Male | Female |
| Agriculture, Fishing & Hunting | 0 (0.0%) | 14 (100.0%) |
| Mining, Quarrying, & Extraction | 0 (0.0%) | 0 (0.0%) |
| Construction | 63 (100.0%) | 0 (0.0%) |
| Manufacturing | 56 (100.0%) | 0 (0.0%) |
| Wholesale Trade | 23 (63.9%) | 13 (36.1%) |
| Retail Trade | 22 (19.3%) | 92 (80.7%) |
| Transportation & Warehousing | 15 (51.7%) | 14 (48.3%) |
| Utilities | 0 (0.0%) | 0 (0.0%) |
| Information | 37 (100.0%) | 0 (0.0%) |
| Finance & Insurance | 30 (55.6%) | 24 (44.4%) |
| Real Estate, Rental & Leasing | 39 (61.9%) | 24 (38.1%) |
| Professional & Scientific | 30 (46.2%) | 35 (53.8%) |
| Enterprise Management | 0 (0.0%) | 0 (0.0%) |
| Administrative & Support | 12 (22.6%) | 41 (77.4%) |
| Educational Services | 11 (15.3%) | 61 (84.7%) |
| Health Care & Social Assistance | 10 (7.3%) | 126 (92.6%) |
| Arts, Entertainment & Recreation | 75 (100.0%) | 0 (0.0%) |
| Accommodation & Food Services | 40 (60.6%) | 26 (39.4%) |
| Public Administration | 98 (100.0%) | 0 (0.0%) |
| Total | 599 (52.0%) | 553 (48.0%) |
Education in Winter Beach
School Enrollment in Winter Beach
The most common levels of schooling among the 996 students in Winter Beach are nursery / preschool (286 | 28.7%), high school (216 | 21.7%), and middle school (197 | 19.8%).
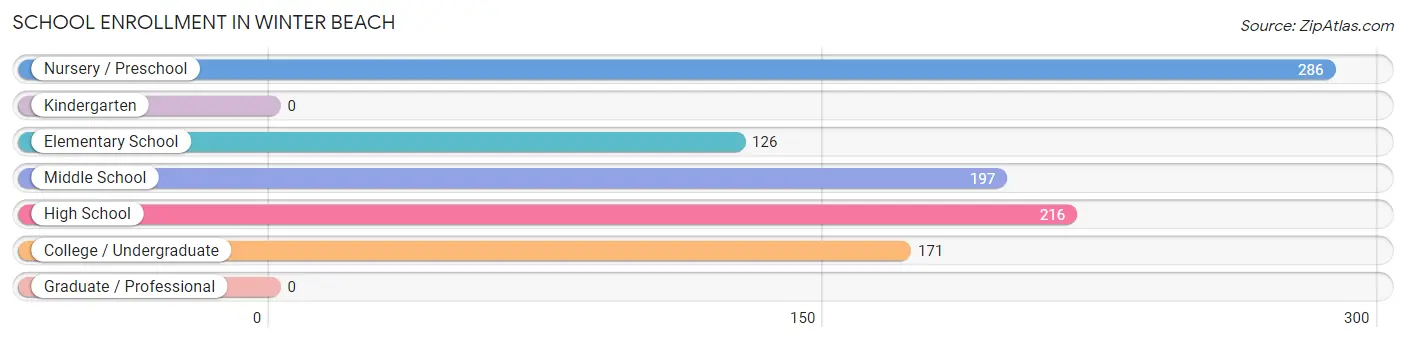
| School Level | # Students | % Students |
| Nursery / Preschool | 286 | 28.7% |
| Kindergarten | 0 | 0.0% |
| Elementary School | 126 | 12.7% |
| Middle School | 197 | 19.8% |
| High School | 216 | 21.7% |
| College / Undergraduate | 171 | 17.2% |
| Graduate / Professional | 0 | 0.0% |
| Total | 996 | 100.0% |
School Enrollment by Age by Funding Source in Winter Beach
Out of a total of 996 students who are enrolled in schools in Winter Beach, 347 (34.8%) attend a private institution, while the remaining 649 (65.2%) are enrolled in public schools. The age group of 3 to 4 year olds has the highest likelihood of being enrolled in private schools, with 237 (100.0% in the age bracket) enrolled. Conversely, the age group of 15 to 17 year olds has the lowest likelihood of being enrolled in a private school, with 146 (100.0% in the age bracket) attending a public institution.
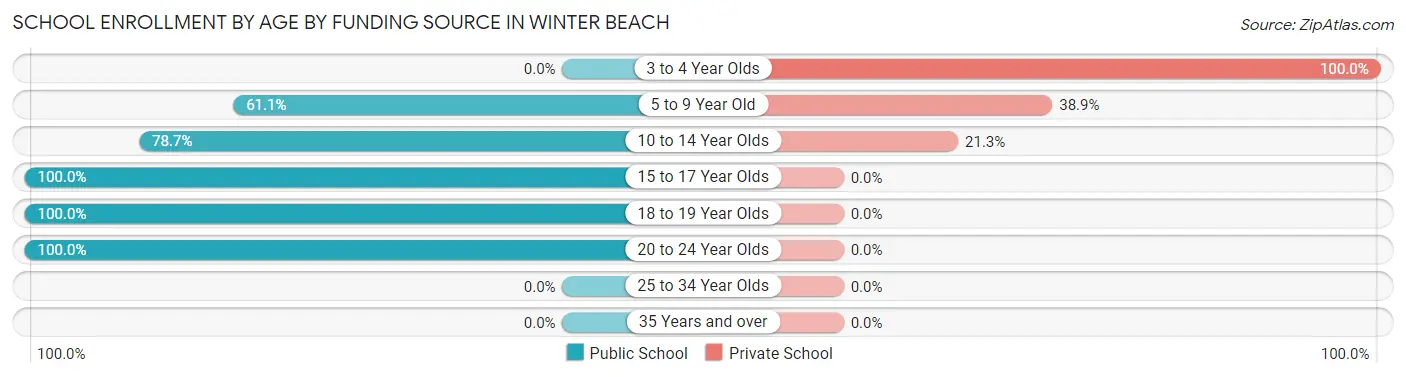
| Age Bracket | Public School | Private School |
| 3 to 4 Year Olds | 0 (0.0%) | 237 (100.0%) |
| 5 to 9 Year Old | 107 (61.1%) | 68 (38.9%) |
| 10 to 14 Year Olds | 155 (78.7%) | 42 (21.3%) |
| 15 to 17 Year Olds | 146 (100.0%) | 0 (0.0%) |
| 18 to 19 Year Olds | 109 (100.0%) | 0 (0.0%) |
| 20 to 24 Year Olds | 132 (100.0%) | 0 (0.0%) |
| 25 to 34 Year Olds | 0 (0.0%) | 0 (0.0%) |
| 35 Years and over | 0 (0.0%) | 0 (0.0%) |
| Total | 649 (65.2%) | 347 (34.8%) |
Educational Attainment by Field of Study in Winter Beach
Business (235 | 23.0%), education (161 | 15.8%), social sciences (100 | 9.8%), psychology (98 | 9.6%), and science & technology (93 | 9.1%) are the most common fields of study among 1,022 individuals in Winter Beach who have obtained a bachelor's degree or higher.
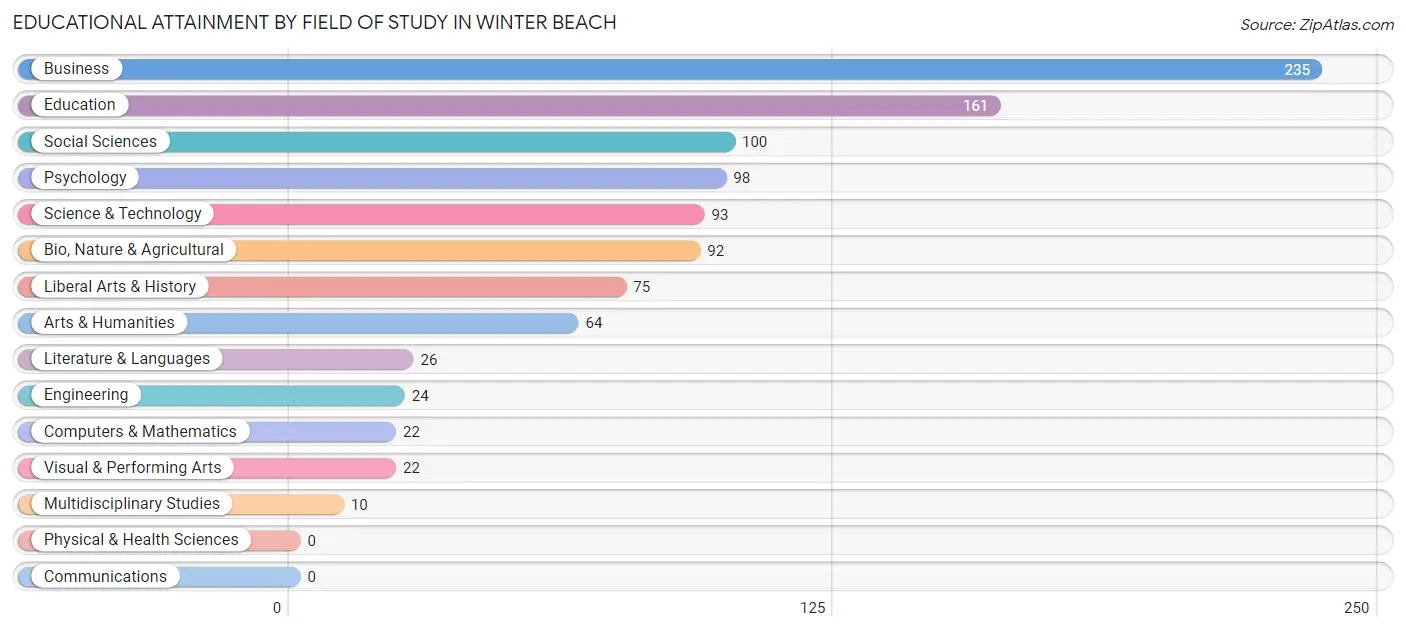
| Field of Study | # Graduates | % Graduates |
| Computers & Mathematics | 22 | 2.1% |
| Bio, Nature & Agricultural | 92 | 9.0% |
| Physical & Health Sciences | 0 | 0.0% |
| Psychology | 98 | 9.6% |
| Social Sciences | 100 | 9.8% |
| Engineering | 24 | 2.4% |
| Multidisciplinary Studies | 10 | 1.0% |
| Science & Technology | 93 | 9.1% |
| Business | 235 | 23.0% |
| Education | 161 | 15.8% |
| Literature & Languages | 26 | 2.5% |
| Liberal Arts & History | 75 | 7.3% |
| Visual & Performing Arts | 22 | 2.1% |
| Communications | 0 | 0.0% |
| Arts & Humanities | 64 | 6.3% |
| Total | 1,022 | 100.0% |
Transportation & Commute in Winter Beach
Vehicle Availability by Sex in Winter Beach
The most prevalent vehicle ownership categories in Winter Beach are males with 2 vehicles (358, accounting for 58.9%) and females with 2 vehicles (248, making up 64.7%).
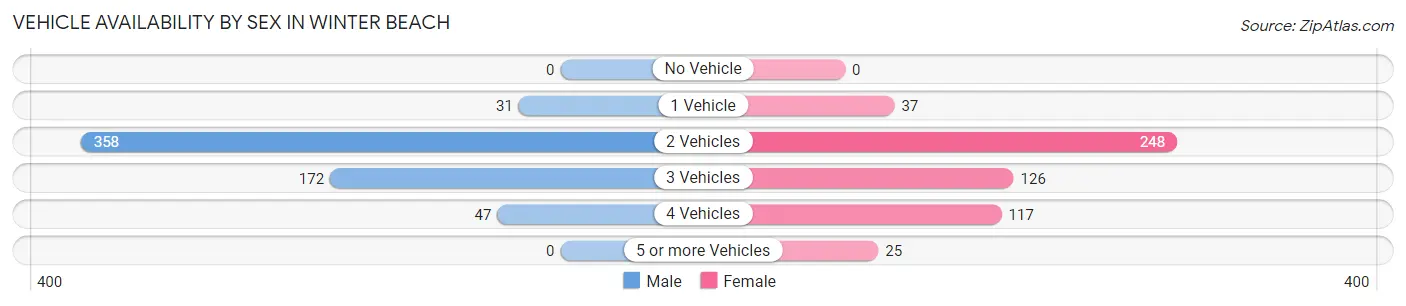
| Vehicles Available | Male | Female |
| No Vehicle | 0 (0.0%) | 0 (0.0%) |
| 1 Vehicle | 31 (5.1%) | 37 (6.7%) |
| 2 Vehicles | 358 (58.9%) | 248 (44.9%) |
| 3 Vehicles | 172 (28.3%) | 126 (22.8%) |
| 4 Vehicles | 47 (7.7%) | 117 (21.2%) |
| 5 or more Vehicles | 0 (0.0%) | 25 (4.5%) |
| Total | 608 (100.0%) | 553 (100.0%) |
Commute Time in Winter Beach
The most frequently occuring commute durations in Winter Beach are 10 to 14 minutes (302 commuters, 30.7%), 5 to 9 minutes (173 commuters, 17.6%), and 15 to 19 minutes (167 commuters, 17.0%).
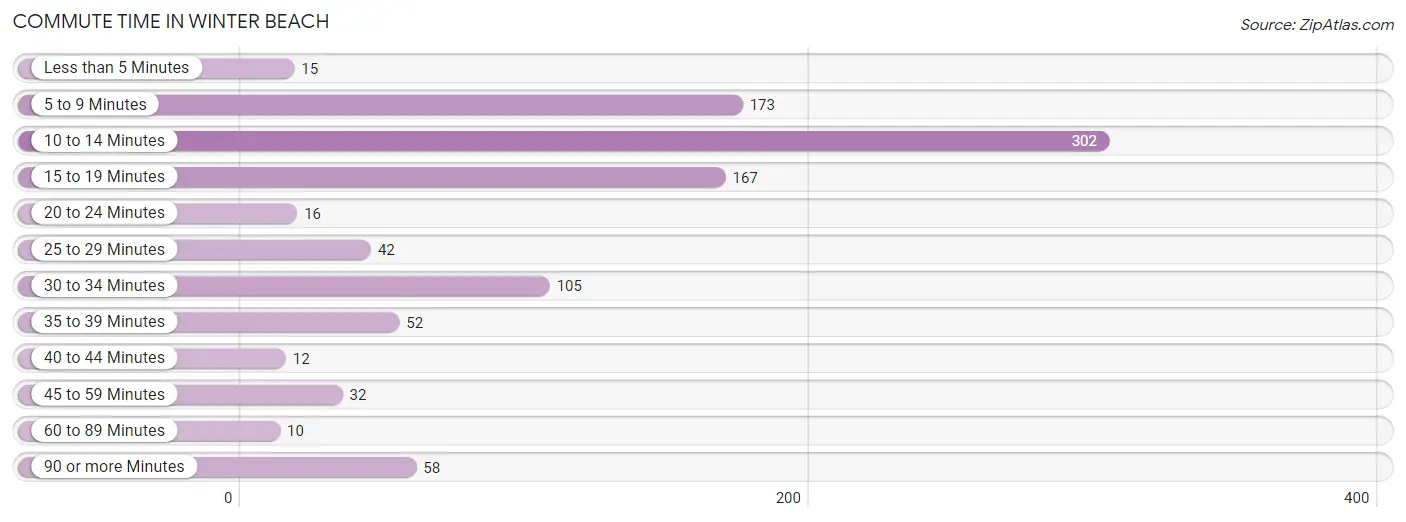
| Commute Time | # Commuters | % Commuters |
| Less than 5 Minutes | 15 | 1.5% |
| 5 to 9 Minutes | 173 | 17.6% |
| 10 to 14 Minutes | 302 | 30.7% |
| 15 to 19 Minutes | 167 | 17.0% |
| 20 to 24 Minutes | 16 | 1.6% |
| 25 to 29 Minutes | 42 | 4.3% |
| 30 to 34 Minutes | 105 | 10.7% |
| 35 to 39 Minutes | 52 | 5.3% |
| 40 to 44 Minutes | 12 | 1.2% |
| 45 to 59 Minutes | 32 | 3.3% |
| 60 to 89 Minutes | 10 | 1.0% |
| 90 or more Minutes | 58 | 5.9% |
Commute Time by Sex in Winter Beach
The most common commute times in Winter Beach are 10 to 14 minutes (155 commuters, 29.6%) for males and 10 to 14 minutes (147 commuters, 32.0%) for females.
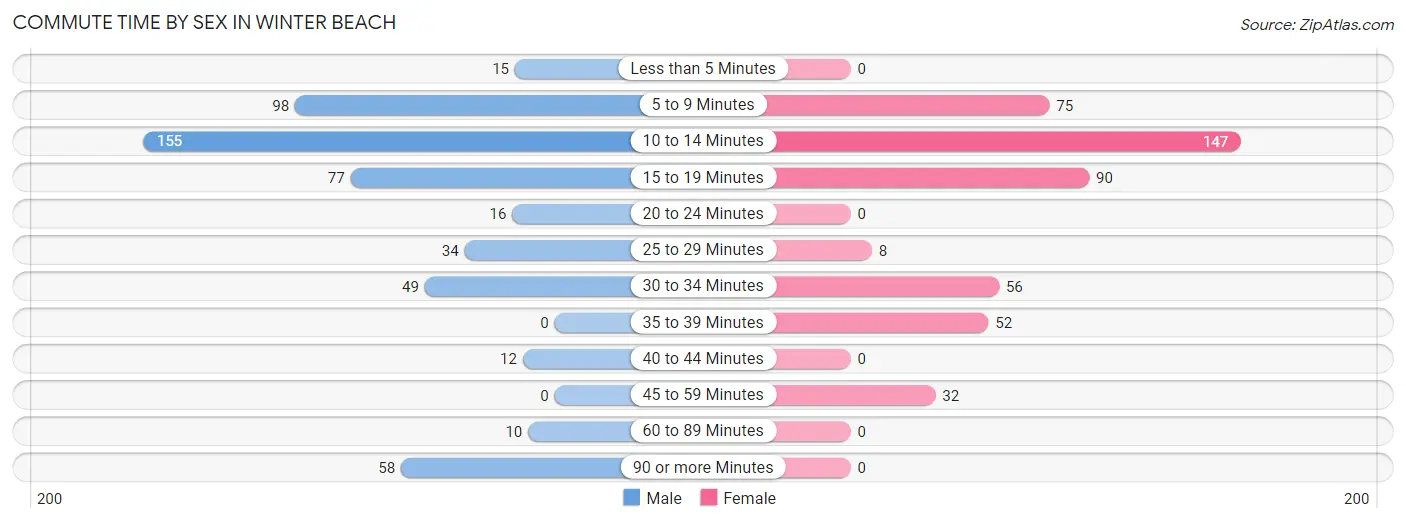
| Commute Time | Male | Female |
| Less than 5 Minutes | 15 (2.9%) | 0 (0.0%) |
| 5 to 9 Minutes | 98 (18.7%) | 75 (16.3%) |
| 10 to 14 Minutes | 155 (29.6%) | 147 (32.0%) |
| 15 to 19 Minutes | 77 (14.7%) | 90 (19.6%) |
| 20 to 24 Minutes | 16 (3.0%) | 0 (0.0%) |
| 25 to 29 Minutes | 34 (6.5%) | 8 (1.7%) |
| 30 to 34 Minutes | 49 (9.3%) | 56 (12.2%) |
| 35 to 39 Minutes | 0 (0.0%) | 52 (11.3%) |
| 40 to 44 Minutes | 12 (2.3%) | 0 (0.0%) |
| 45 to 59 Minutes | 0 (0.0%) | 32 (7.0%) |
| 60 to 89 Minutes | 10 (1.9%) | 0 (0.0%) |
| 90 or more Minutes | 58 (11.1%) | 0 (0.0%) |
Time of Departure to Work by Sex in Winter Beach
The most frequent times of departure to work in Winter Beach are 8:00 AM to 8:29 AM (117, 22.3%) for males and 9:00 AM to 9:59 AM (125, 27.2%) for females.
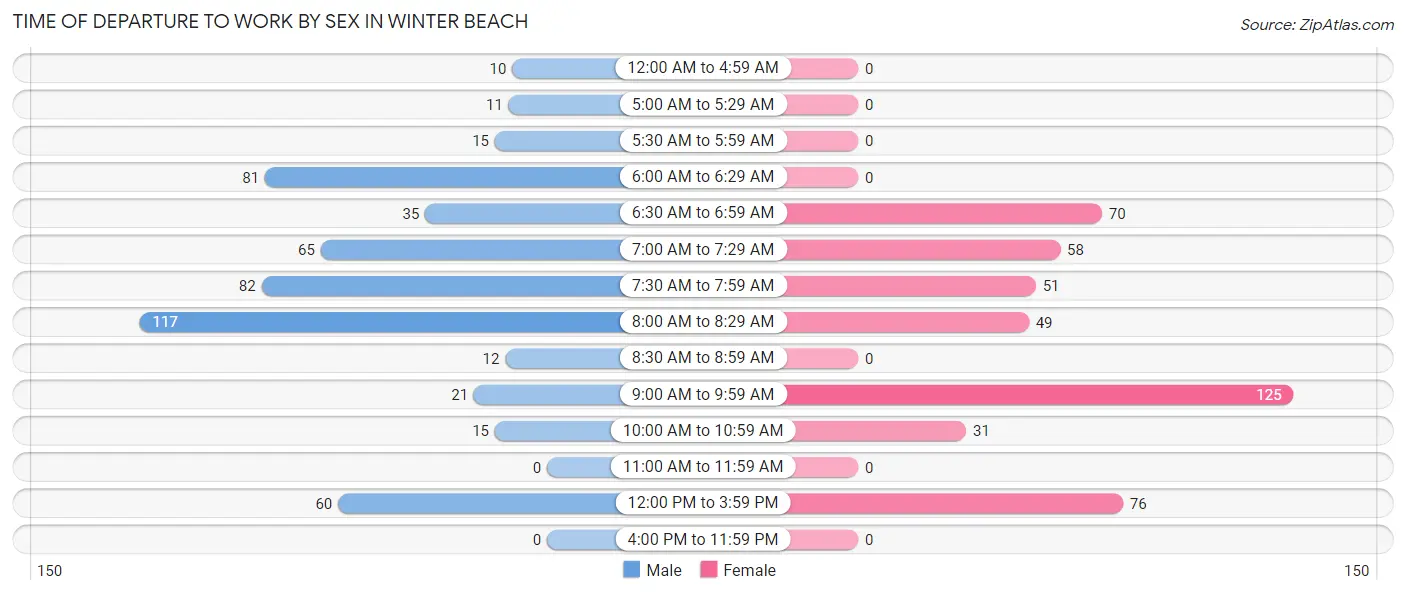
| Time of Departure | Male | Female |
| 12:00 AM to 4:59 AM | 10 (1.9%) | 0 (0.0%) |
| 5:00 AM to 5:29 AM | 11 (2.1%) | 0 (0.0%) |
| 5:30 AM to 5:59 AM | 15 (2.9%) | 0 (0.0%) |
| 6:00 AM to 6:29 AM | 81 (15.5%) | 0 (0.0%) |
| 6:30 AM to 6:59 AM | 35 (6.7%) | 70 (15.2%) |
| 7:00 AM to 7:29 AM | 65 (12.4%) | 58 (12.6%) |
| 7:30 AM to 7:59 AM | 82 (15.7%) | 51 (11.1%) |
| 8:00 AM to 8:29 AM | 117 (22.3%) | 49 (10.6%) |
| 8:30 AM to 8:59 AM | 12 (2.3%) | 0 (0.0%) |
| 9:00 AM to 9:59 AM | 21 (4.0%) | 125 (27.2%) |
| 10:00 AM to 10:59 AM | 15 (2.9%) | 31 (6.7%) |
| 11:00 AM to 11:59 AM | 0 (0.0%) | 0 (0.0%) |
| 12:00 PM to 3:59 PM | 60 (11.5%) | 76 (16.5%) |
| 4:00 PM to 11:59 PM | 0 (0.0%) | 0 (0.0%) |
| Total | 524 (100.0%) | 460 (100.0%) |
Housing Occupancy in Winter Beach
Occupancy by Ownership in Winter Beach
Of the total 1,360 dwellings in Winter Beach, owner-occupied units account for 1,268 (93.2%), while renter-occupied units make up 92 (6.8%).
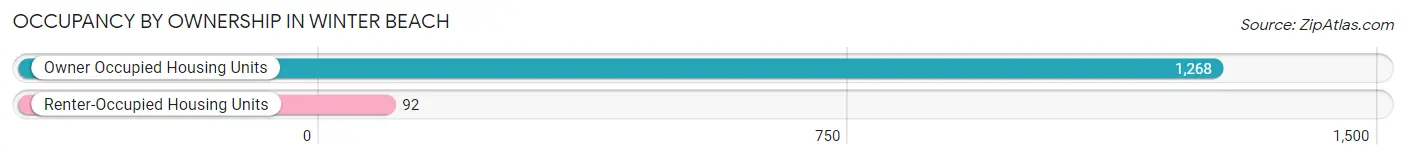
| Occupancy | # Housing Units | % Housing Units |
| Owner Occupied Housing Units | 1,268 | 93.2% |
| Renter-Occupied Housing Units | 92 | 6.8% |
| Total Occupied Housing Units | 1,360 | 100.0% |
Occupancy by Household Size in Winter Beach
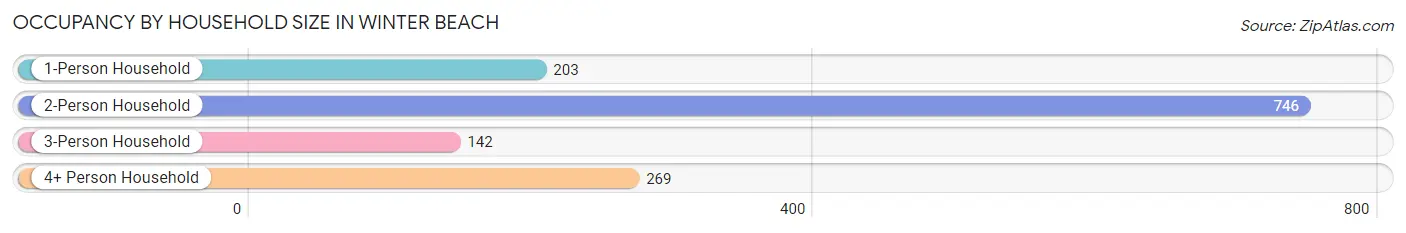
| Household Size | # Housing Units | % Housing Units |
| 1-Person Household | 203 | 14.9% |
| 2-Person Household | 746 | 54.8% |
| 3-Person Household | 142 | 10.4% |
| 4+ Person Household | 269 | 19.8% |
| Total Housing Units | 1,360 | 100.0% |
Occupancy by Ownership by Household Size in Winter Beach
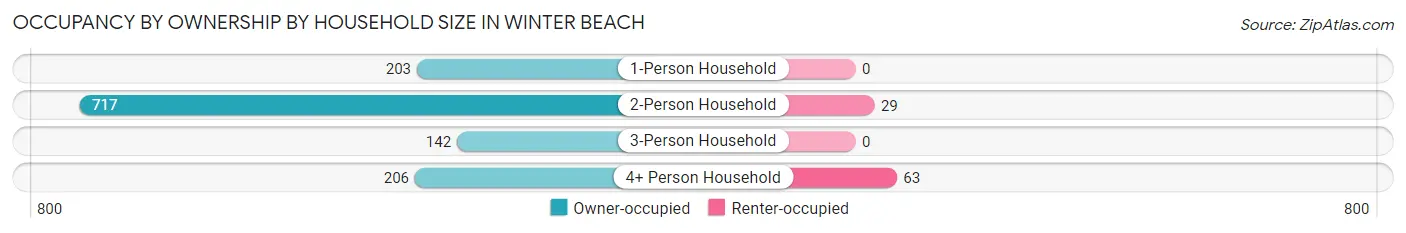
| Household Size | Owner-occupied | Renter-occupied |
| 1-Person Household | 203 (100.0%) | 0 (0.0%) |
| 2-Person Household | 717 (96.1%) | 29 (3.9%) |
| 3-Person Household | 142 (100.0%) | 0 (0.0%) |
| 4+ Person Household | 206 (76.6%) | 63 (23.4%) |
| Total Housing Units | 1,268 (93.2%) | 92 (6.8%) |
Occupancy by Educational Attainment in Winter Beach
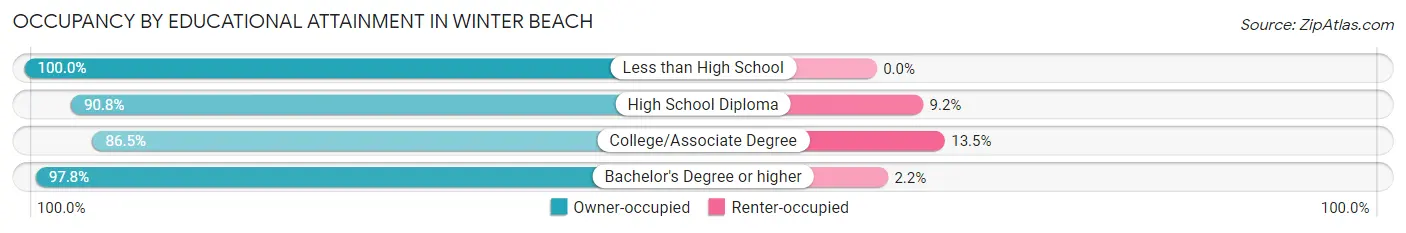
| Household Size | Owner-occupied | Renter-occupied |
| Less than High School | 56 (100.0%) | 0 (0.0%) |
| High School Diploma | 286 (90.8%) | 29 (9.2%) |
| College/Associate Degree | 314 (86.5%) | 49 (13.5%) |
| Bachelor's Degree or higher | 612 (97.8%) | 14 (2.2%) |
Occupancy by Age of Householder in Winter Beach
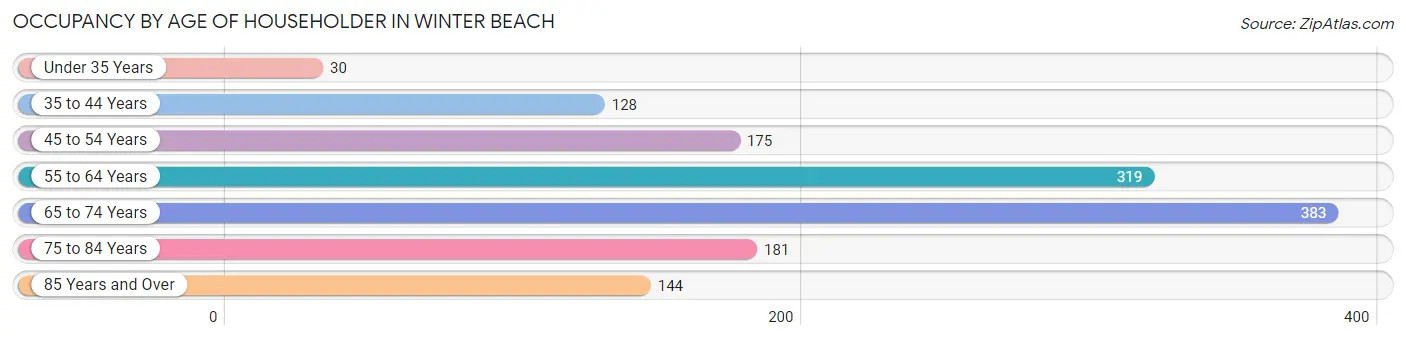
| Age Bracket | # Households | % Households |
| Under 35 Years | 30 | 2.2% |
| 35 to 44 Years | 128 | 9.4% |
| 45 to 54 Years | 175 | 12.9% |
| 55 to 64 Years | 319 | 23.5% |
| 65 to 74 Years | 383 | 28.2% |
| 75 to 84 Years | 181 | 13.3% |
| 85 Years and Over | 144 | 10.6% |
| Total | 1,360 | 100.0% |
Housing Finances in Winter Beach
Median Income by Occupancy in Winter Beach
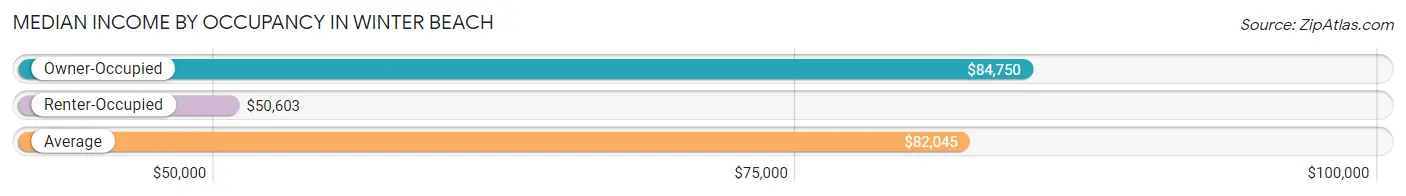
| Occupancy Type | # Households | Median Income |
| Owner-Occupied | 1,268 (93.2%) | $84,750 |
| Renter-Occupied | 92 (6.8%) | $50,603 |
| Average | 1,360 (100.0%) | $82,045 |
Occupancy by Householder Income Bracket in Winter Beach
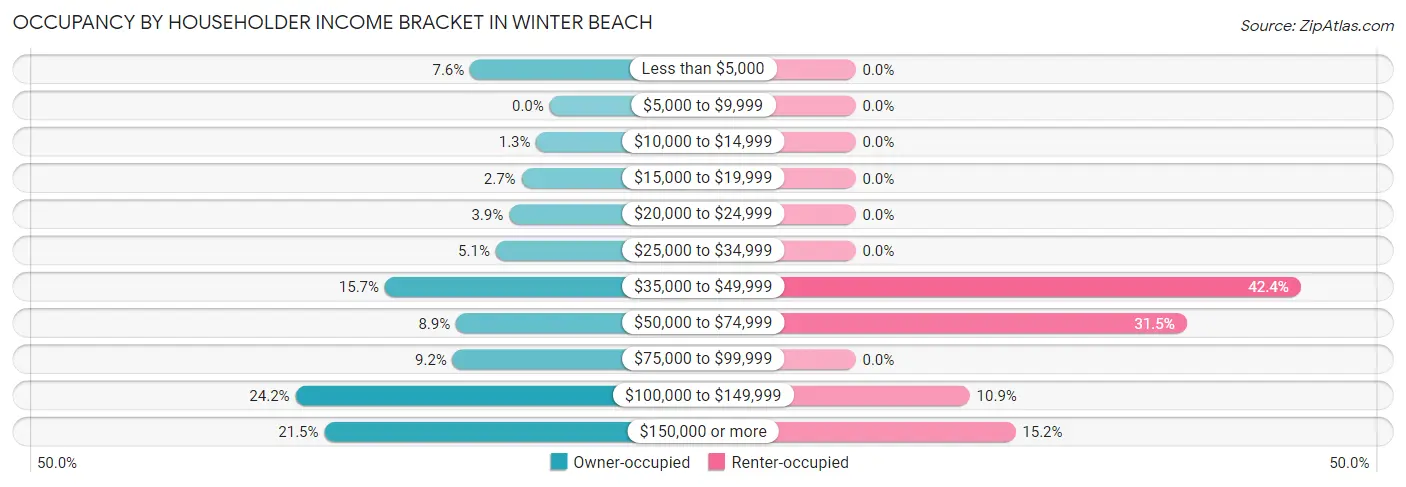
| Income Bracket | Owner-occupied | Renter-occupied |
| Less than $5,000 | 96 (7.6%) | 0 (0.0%) |
| $5,000 to $9,999 | 0 (0.0%) | 0 (0.0%) |
| $10,000 to $14,999 | 16 (1.3%) | 0 (0.0%) |
| $15,000 to $19,999 | 34 (2.7%) | 0 (0.0%) |
| $20,000 to $24,999 | 49 (3.9%) | 0 (0.0%) |
| $25,000 to $34,999 | 65 (5.1%) | 0 (0.0%) |
| $35,000 to $49,999 | 199 (15.7%) | 39 (42.4%) |
| $50,000 to $74,999 | 113 (8.9%) | 29 (31.5%) |
| $75,000 to $99,999 | 117 (9.2%) | 0 (0.0%) |
| $100,000 to $149,999 | 307 (24.2%) | 10 (10.9%) |
| $150,000 or more | 272 (21.4%) | 14 (15.2%) |
| Total | 1,268 (100.0%) | 92 (100.0%) |
Monthly Housing Cost Tiers in Winter Beach
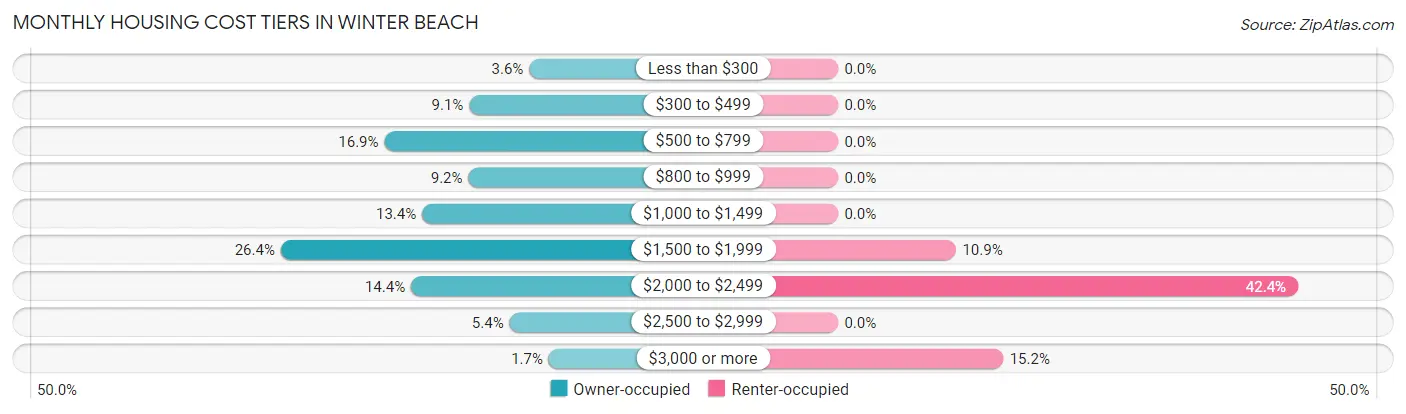
| Monthly Cost | Owner-occupied | Renter-occupied |
| Less than $300 | 45 (3.5%) | 0 (0.0%) |
| $300 to $499 | 115 (9.1%) | 0 (0.0%) |
| $500 to $799 | 214 (16.9%) | 0 (0.0%) |
| $800 to $999 | 116 (9.1%) | 0 (0.0%) |
| $1,000 to $1,499 | 170 (13.4%) | 0 (0.0%) |
| $1,500 to $1,999 | 335 (26.4%) | 10 (10.9%) |
| $2,000 to $2,499 | 183 (14.4%) | 39 (42.4%) |
| $2,500 to $2,999 | 68 (5.4%) | 0 (0.0%) |
| $3,000 or more | 22 (1.7%) | 14 (15.2%) |
| Total | 1,268 (100.0%) | 92 (100.0%) |
Physical Housing Characteristics in Winter Beach
Housing Structures in Winter Beach
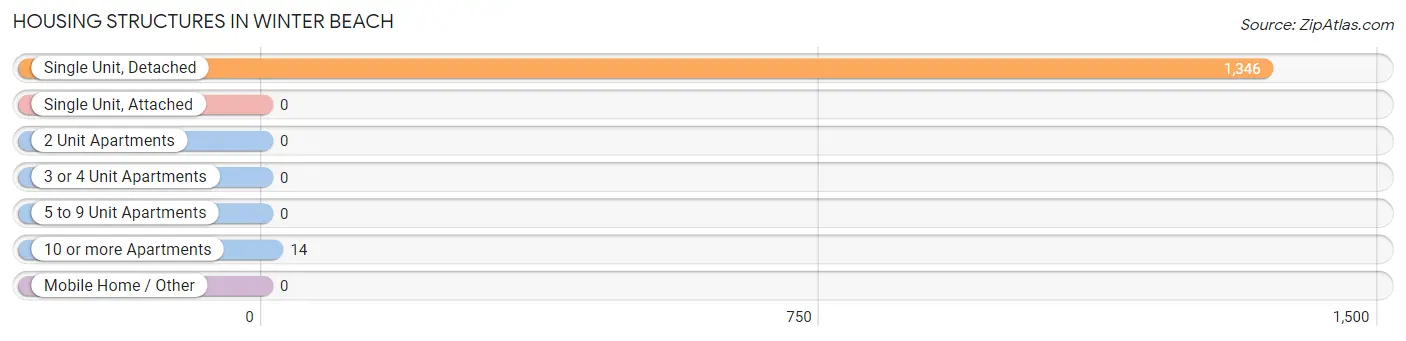
| Structure Type | # Housing Units | % Housing Units |
| Single Unit, Detached | 1,346 | 99.0% |
| Single Unit, Attached | 0 | 0.0% |
| 2 Unit Apartments | 0 | 0.0% |
| 3 or 4 Unit Apartments | 0 | 0.0% |
| 5 to 9 Unit Apartments | 0 | 0.0% |
| 10 or more Apartments | 14 | 1.0% |
| Mobile Home / Other | 0 | 0.0% |
| Total | 1,360 | 100.0% |
Housing Structures by Occupancy in Winter Beach
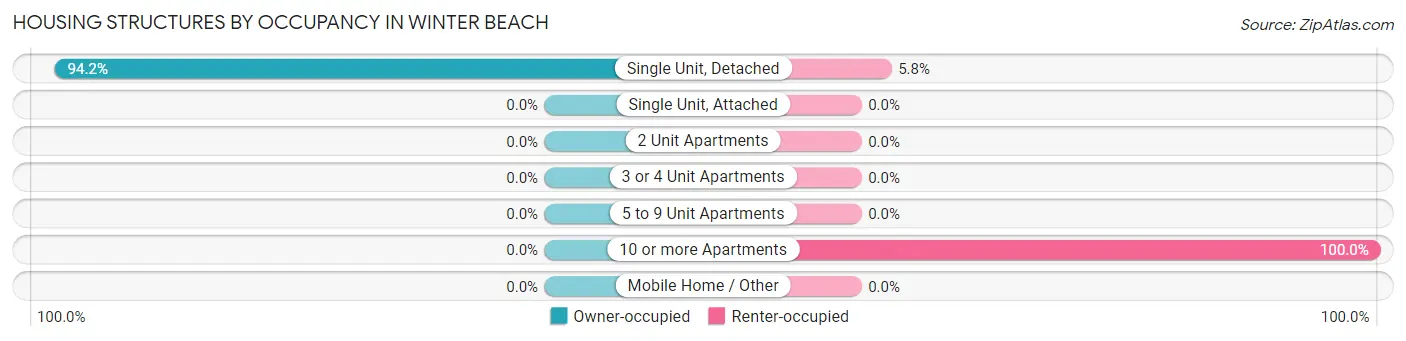
| Structure Type | Owner-occupied | Renter-occupied |
| Single Unit, Detached | 1,268 (94.2%) | 78 (5.8%) |
| Single Unit, Attached | 0 (0.0%) | 0 (0.0%) |
| 2 Unit Apartments | 0 (0.0%) | 0 (0.0%) |
| 3 or 4 Unit Apartments | 0 (0.0%) | 0 (0.0%) |
| 5 to 9 Unit Apartments | 0 (0.0%) | 0 (0.0%) |
| 10 or more Apartments | 0 (0.0%) | 14 (100.0%) |
| Mobile Home / Other | 0 (0.0%) | 0 (0.0%) |
| Total | 1,268 (93.2%) | 92 (6.8%) |
Housing Structures by Number of Rooms in Winter Beach
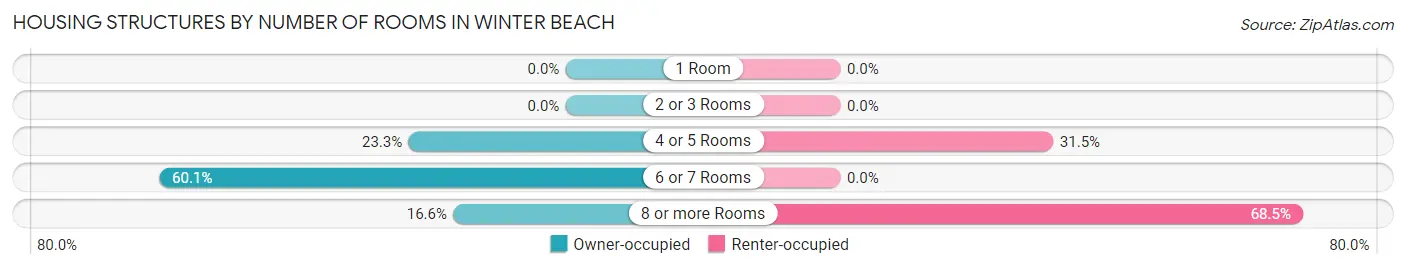
| Number of Rooms | Owner-occupied | Renter-occupied |
| 1 Room | 0 (0.0%) | 0 (0.0%) |
| 2 or 3 Rooms | 0 (0.0%) | 0 (0.0%) |
| 4 or 5 Rooms | 295 (23.3%) | 29 (31.5%) |
| 6 or 7 Rooms | 762 (60.1%) | 0 (0.0%) |
| 8 or more Rooms | 211 (16.6%) | 63 (68.5%) |
| Total | 1,268 (100.0%) | 92 (100.0%) |
Housing Structure by Heating Type in Winter Beach
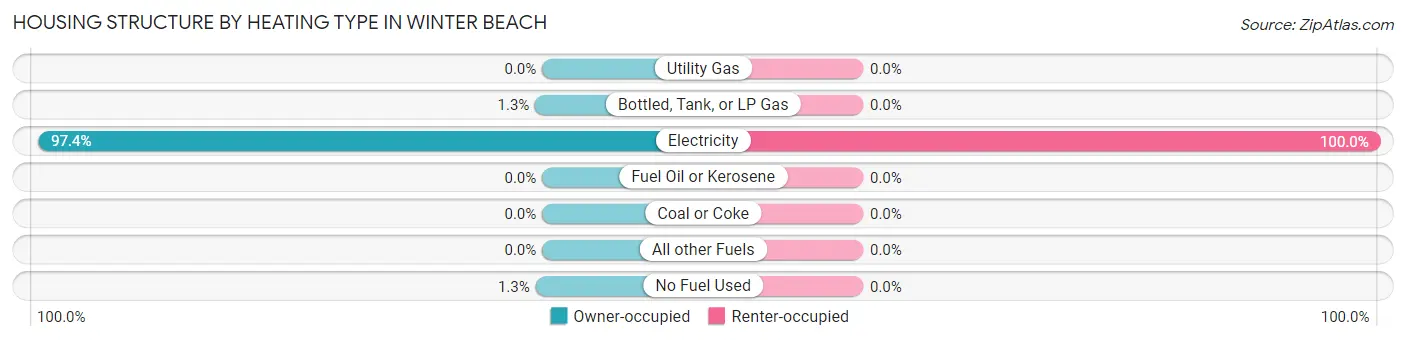
| Heating Type | Owner-occupied | Renter-occupied |
| Utility Gas | 0 (0.0%) | 0 (0.0%) |
| Bottled, Tank, or LP Gas | 17 (1.3%) | 0 (0.0%) |
| Electricity | 1,235 (97.4%) | 92 (100.0%) |
| Fuel Oil or Kerosene | 0 (0.0%) | 0 (0.0%) |
| Coal or Coke | 0 (0.0%) | 0 (0.0%) |
| All other Fuels | 0 (0.0%) | 0 (0.0%) |
| No Fuel Used | 16 (1.3%) | 0 (0.0%) |
| Total | 1,268 (100.0%) | 92 (100.0%) |
Household Vehicle Usage in Winter Beach
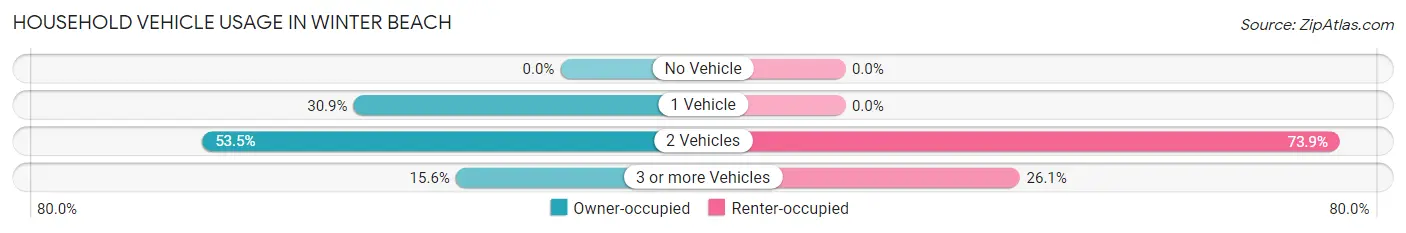
| Vehicles per Household | Owner-occupied | Renter-occupied |
| No Vehicle | 0 (0.0%) | 0 (0.0%) |
| 1 Vehicle | 392 (30.9%) | 0 (0.0%) |
| 2 Vehicles | 678 (53.5%) | 68 (73.9%) |
| 3 or more Vehicles | 198 (15.6%) | 24 (26.1%) |
| Total | 1,268 (100.0%) | 92 (100.0%) |
Real Estate & Mortgages in Winter Beach
Real Estate and Mortgage Overview in Winter Beach
| Characteristic | Without Mortgage | With Mortgage |
| Housing Units | 526 | 742 |
| Median Property Value | $417,100 | $394,700 |
| Median Household Income | $55,500 | $188 |
| Monthly Housing Costs | $673 | $22 |
| Real Estate Taxes | $3,103 | $100 |
Property Value by Mortgage Status in Winter Beach
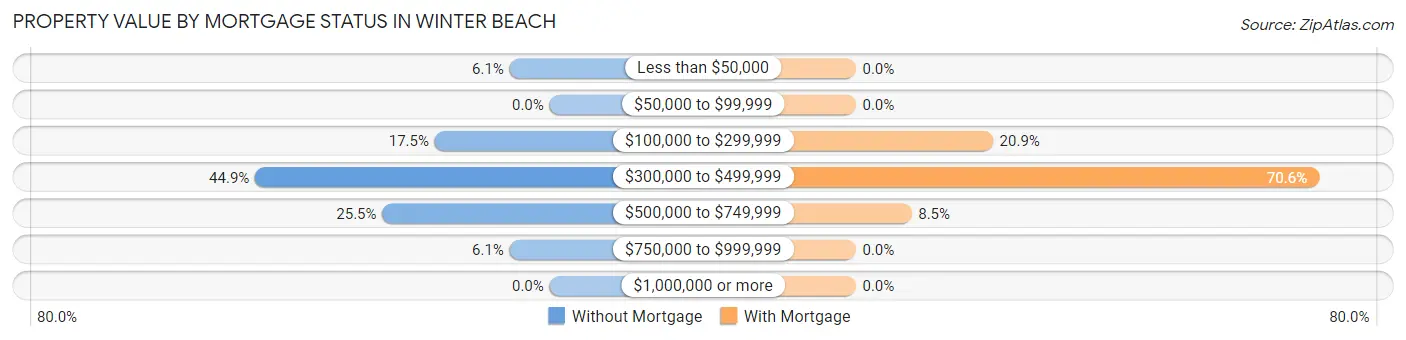
| Property Value | Without Mortgage | With Mortgage |
| Less than $50,000 | 32 (6.1%) | 0 (0.0%) |
| $50,000 to $99,999 | 0 (0.0%) | 0 (0.0%) |
| $100,000 to $299,999 | 92 (17.5%) | 155 (20.9%) |
| $300,000 to $499,999 | 236 (44.9%) | 524 (70.6%) |
| $500,000 to $749,999 | 134 (25.5%) | 63 (8.5%) |
| $750,000 to $999,999 | 32 (6.1%) | 0 (0.0%) |
| $1,000,000 or more | 0 (0.0%) | 0 (0.0%) |
| Total | 526 (100.0%) | 742 (100.0%) |
Household Income by Mortgage Status in Winter Beach
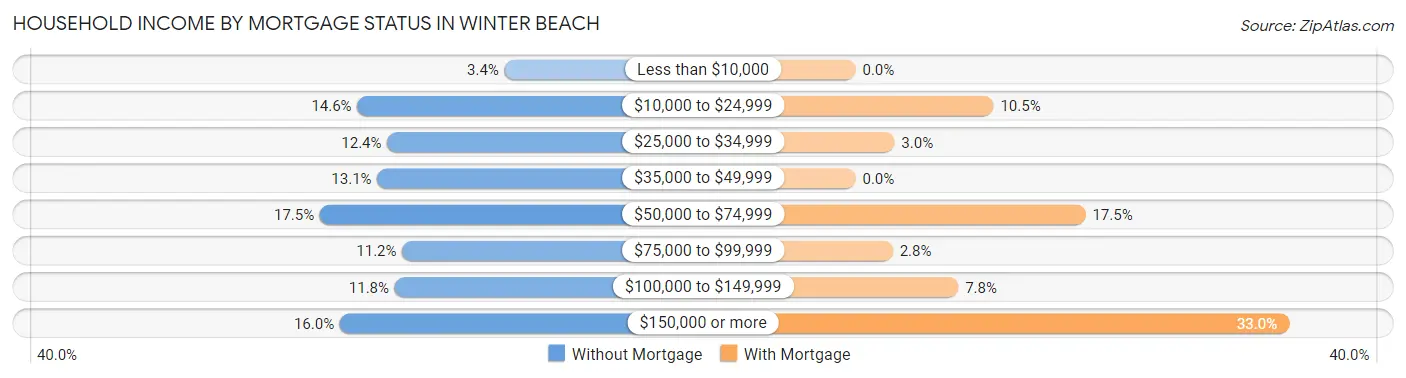
| Household Income | Without Mortgage | With Mortgage |
| Less than $10,000 | 18 (3.4%) | 0 (0.0%) |
| $10,000 to $24,999 | 77 (14.6%) | 78 (10.5%) |
| $25,000 to $34,999 | 65 (12.4%) | 22 (3.0%) |
| $35,000 to $49,999 | 69 (13.1%) | 0 (0.0%) |
| $50,000 to $74,999 | 92 (17.5%) | 130 (17.5%) |
| $75,000 to $99,999 | 59 (11.2%) | 21 (2.8%) |
| $100,000 to $149,999 | 62 (11.8%) | 58 (7.8%) |
| $150,000 or more | 84 (16.0%) | 245 (33.0%) |
| Total | 526 (100.0%) | 742 (100.0%) |
Property Value to Household Income Ratio in Winter Beach
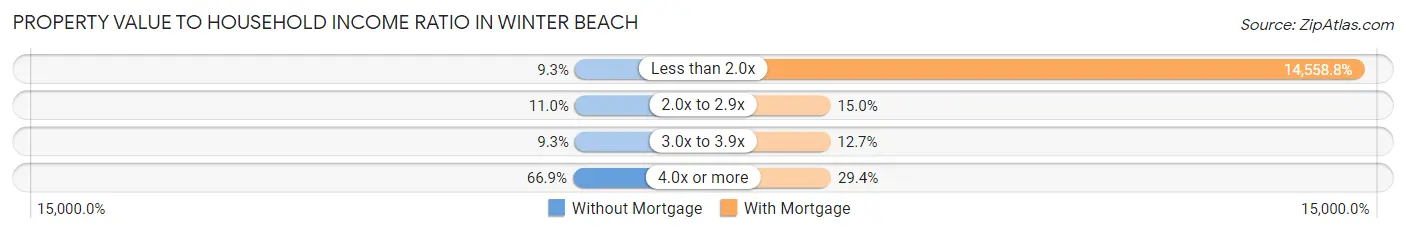
| Value-to-Income Ratio | Without Mortgage | With Mortgage |
| Less than 2.0x | 49 (9.3%) | 108,026 (14,558.8%) |
| 2.0x to 2.9x | 58 (11.0%) | 111 (15.0%) |
| 3.0x to 3.9x | 49 (9.3%) | 94 (12.7%) |
| 4.0x or more | 352 (66.9%) | 218 (29.4%) |
| Total | 526 (100.0%) | 742 (100.0%) |
Real Estate Taxes by Mortgage Status in Winter Beach
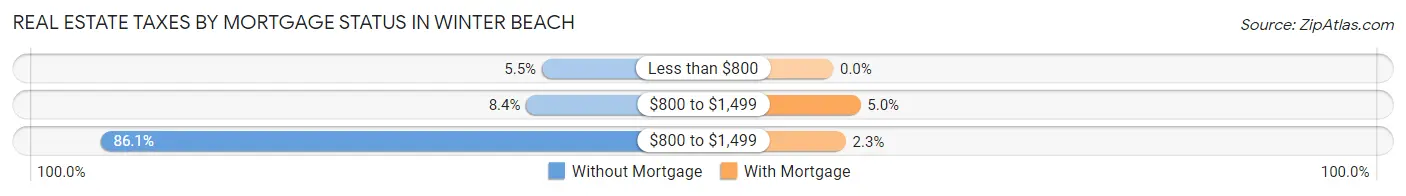
| Property Taxes | Without Mortgage | With Mortgage |
| Less than $800 | 29 (5.5%) | 0 (0.0%) |
| $800 to $1,499 | 44 (8.4%) | 37 (5.0%) |
| $800 to $1,499 | 453 (86.1%) | 17 (2.3%) |
| Total | 526 (100.0%) | 742 (100.0%) |
Health & Disability in Winter Beach
Health Insurance Coverage by Age in Winter Beach
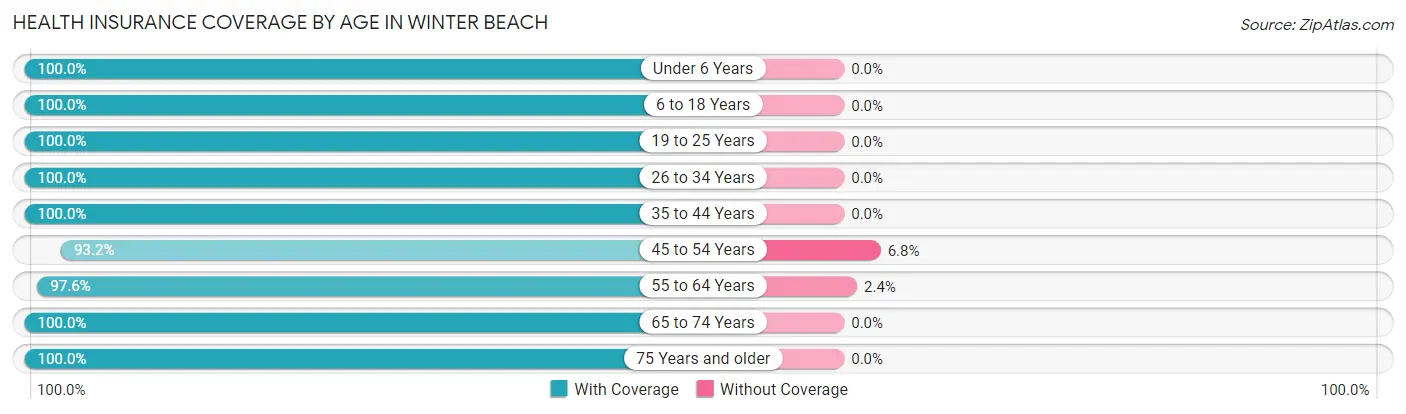
| Age Bracket | With Coverage | Without Coverage |
| Under 6 Years | 322 (100.0%) | 0 (0.0%) |
| 6 to 18 Years | 652 (100.0%) | 0 (0.0%) |
| 19 to 25 Years | 304 (100.0%) | 0 (0.0%) |
| 26 to 34 Years | 206 (100.0%) | 0 (0.0%) |
| 35 to 44 Years | 313 (100.0%) | 0 (0.0%) |
| 45 to 54 Years | 261 (93.2%) | 19 (6.8%) |
| 55 to 64 Years | 695 (97.6%) | 17 (2.4%) |
| 65 to 74 Years | 845 (100.0%) | 0 (0.0%) |
| 75 Years and older | 607 (100.0%) | 0 (0.0%) |
| Total | 4,205 (99.2%) | 36 (0.9%) |
Health Insurance Coverage by Citizenship Status in Winter Beach
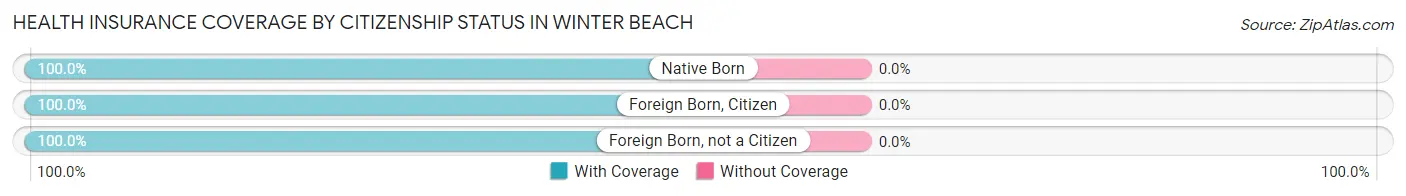
| Citizenship Status | With Coverage | Without Coverage |
| Native Born | 322 (100.0%) | 0 (0.0%) |
| Foreign Born, Citizen | 652 (100.0%) | 0 (0.0%) |
| Foreign Born, not a Citizen | 304 (100.0%) | 0 (0.0%) |
Health Insurance Coverage by Household Income in Winter Beach
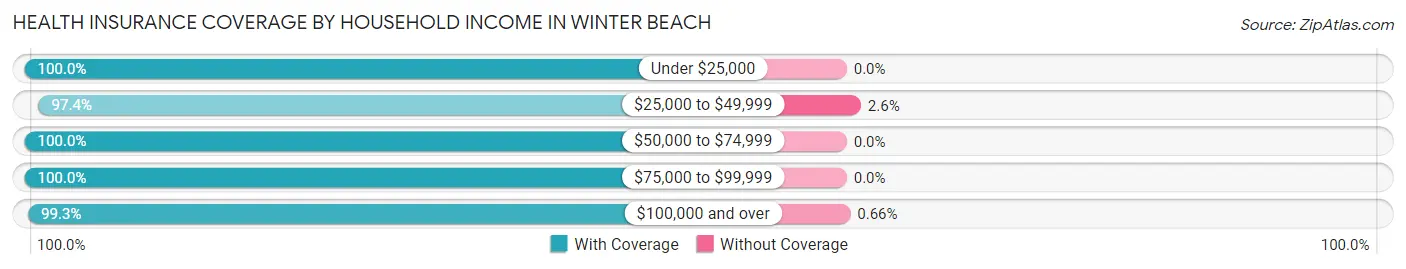
| Household Income | With Coverage | Without Coverage |
| Under $25,000 | 435 (100.0%) | 0 (0.0%) |
| $25,000 to $49,999 | 700 (97.4%) | 19 (2.6%) |
| $50,000 to $74,999 | 274 (100.0%) | 0 (0.0%) |
| $75,000 to $99,999 | 232 (100.0%) | 0 (0.0%) |
| $100,000 and over | 2,564 (99.3%) | 17 (0.7%) |
Public vs Private Health Insurance Coverage by Age in Winter Beach
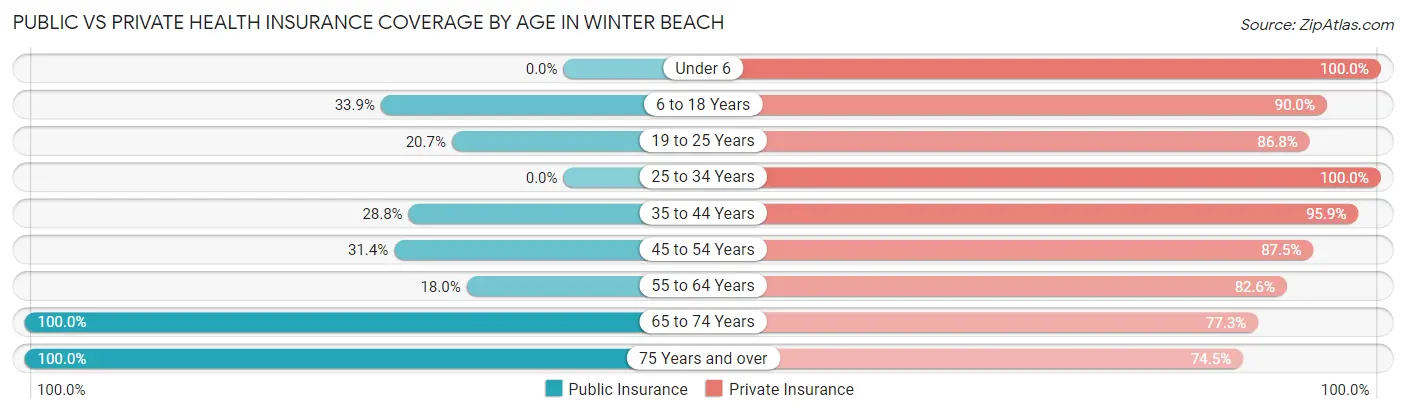
| Age Bracket | Public Insurance | Private Insurance |
| Under 6 | 0 (0.0%) | 322 (100.0%) |
| 6 to 18 Years | 221 (33.9%) | 587 (90.0%) |
| 19 to 25 Years | 63 (20.7%) | 264 (86.8%) |
| 25 to 34 Years | 0 (0.0%) | 206 (100.0%) |
| 35 to 44 Years | 90 (28.7%) | 300 (95.9%) |
| 45 to 54 Years | 88 (31.4%) | 245 (87.5%) |
| 55 to 64 Years | 128 (18.0%) | 588 (82.6%) |
| 65 to 74 Years | 845 (100.0%) | 653 (77.3%) |
| 75 Years and over | 607 (100.0%) | 452 (74.5%) |
| Total | 2,042 (48.1%) | 3,617 (85.3%) |
Disability Status by Sex by Age in Winter Beach
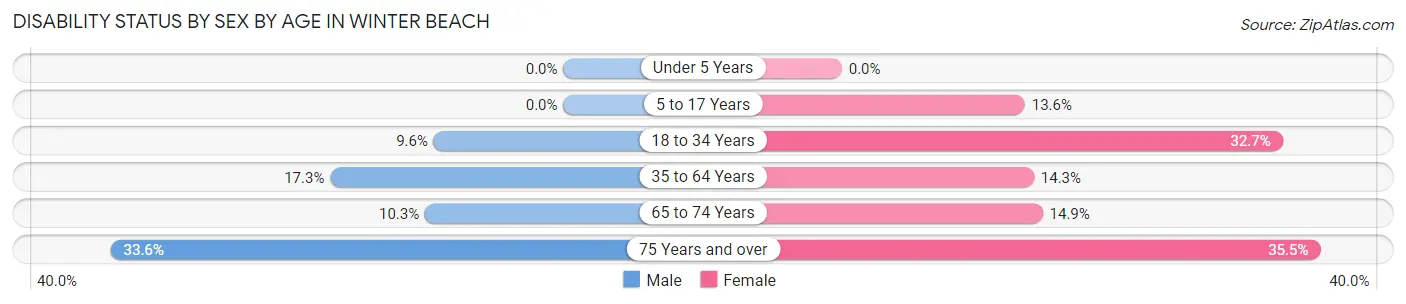
| Age Bracket | Male | Female |
| Under 5 Years | 0 (0.0%) | 0 (0.0%) |
| 5 to 17 Years | 0 (0.0%) | 50 (13.6%) |
| 18 to 34 Years | 20 (9.6%) | 142 (32.7%) |
| 35 to 64 Years | 107 (17.3%) | 98 (14.3%) |
| 65 to 74 Years | 42 (10.3%) | 65 (14.9%) |
| 75 Years and over | 81 (33.6%) | 130 (35.5%) |
Disability Class by Sex by Age in Winter Beach
Disability Class: Hearing Difficulty
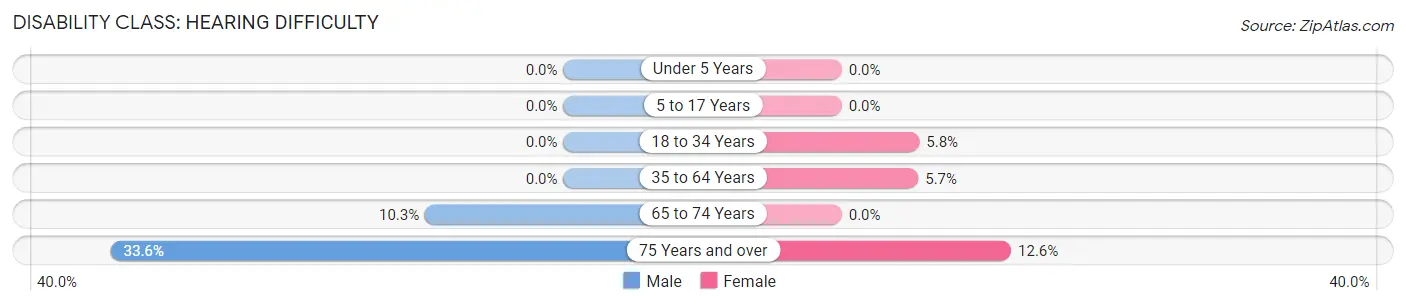
| Age Bracket | Male | Female |
| Under 5 Years | 0 (0.0%) | 0 (0.0%) |
| 5 to 17 Years | 0 (0.0%) | 0 (0.0%) |
| 18 to 34 Years | 0 (0.0%) | 25 (5.8%) |
| 35 to 64 Years | 0 (0.0%) | 39 (5.7%) |
| 65 to 74 Years | 42 (10.3%) | 0 (0.0%) |
| 75 Years and over | 81 (33.6%) | 46 (12.6%) |
Disability Class: Vision Difficulty
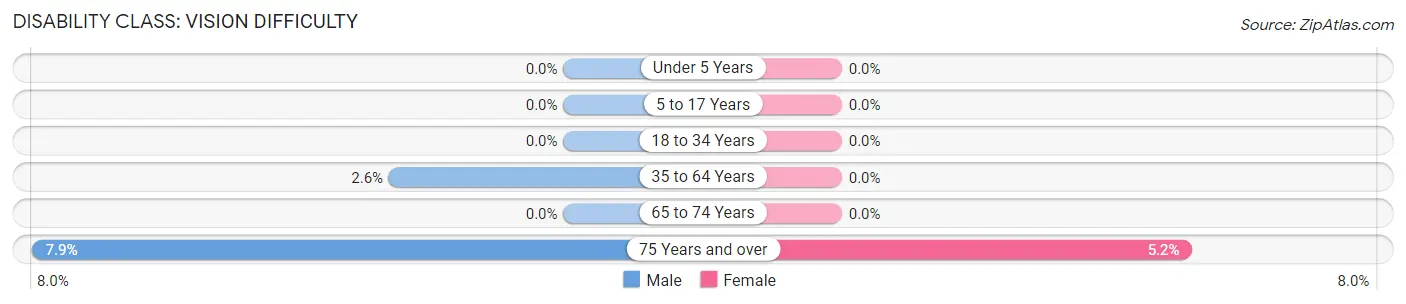
| Age Bracket | Male | Female |
| Under 5 Years | 0 (0.0%) | 0 (0.0%) |
| 5 to 17 Years | 0 (0.0%) | 0 (0.0%) |
| 18 to 34 Years | 0 (0.0%) | 0 (0.0%) |
| 35 to 64 Years | 16 (2.6%) | 0 (0.0%) |
| 65 to 74 Years | 0 (0.0%) | 0 (0.0%) |
| 75 Years and over | 19 (7.9%) | 19 (5.2%) |
Disability Class: Cognitive Difficulty
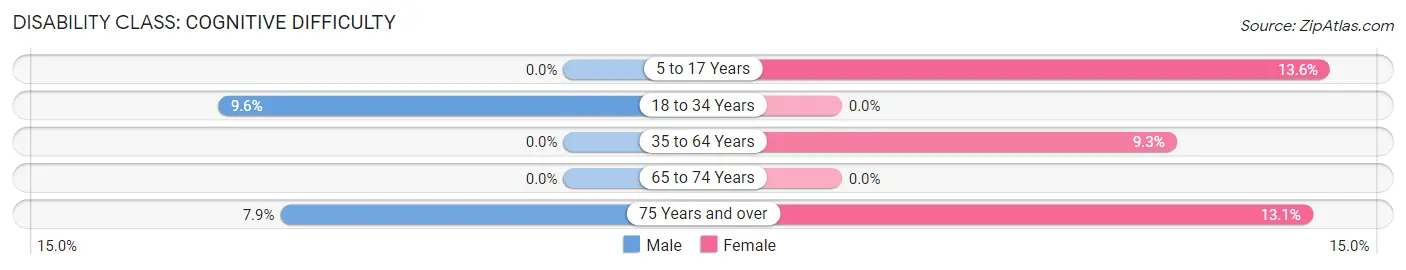
| Age Bracket | Male | Female |
| 5 to 17 Years | 0 (0.0%) | 50 (13.6%) |
| 18 to 34 Years | 20 (9.6%) | 0 (0.0%) |
| 35 to 64 Years | 0 (0.0%) | 64 (9.3%) |
| 65 to 74 Years | 0 (0.0%) | 0 (0.0%) |
| 75 Years and over | 19 (7.9%) | 48 (13.1%) |
Disability Class: Ambulatory Difficulty
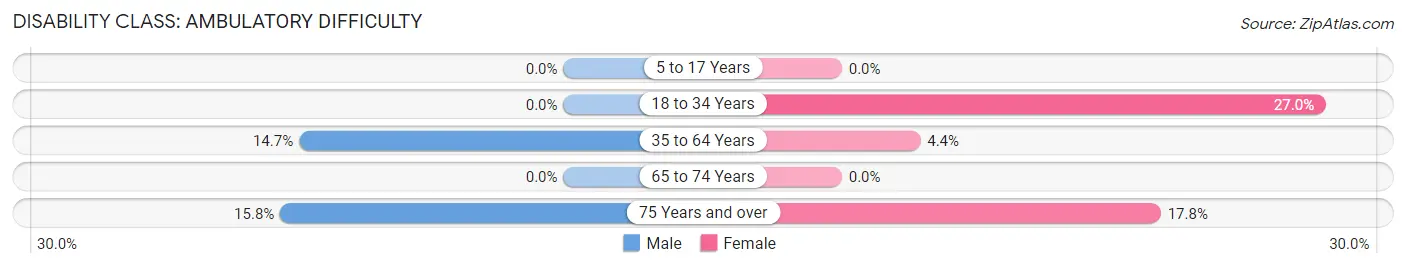
| Age Bracket | Male | Female |
| 5 to 17 Years | 0 (0.0%) | 0 (0.0%) |
| 18 to 34 Years | 0 (0.0%) | 117 (27.0%) |
| 35 to 64 Years | 91 (14.7%) | 30 (4.4%) |
| 65 to 74 Years | 0 (0.0%) | 0 (0.0%) |
| 75 Years and over | 38 (15.8%) | 65 (17.8%) |
Disability Class: Self-Care Difficulty
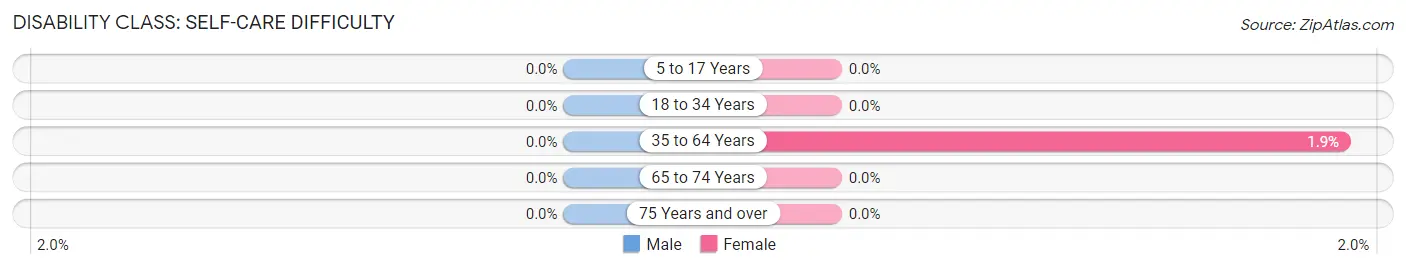
| Age Bracket | Male | Female |
| 5 to 17 Years | 0 (0.0%) | 0 (0.0%) |
| 18 to 34 Years | 0 (0.0%) | 0 (0.0%) |
| 35 to 64 Years | 0 (0.0%) | 13 (1.9%) |
| 65 to 74 Years | 0 (0.0%) | 0 (0.0%) |
| 75 Years and over | 0 (0.0%) | 0 (0.0%) |
Technology Access in Winter Beach
Computing Device Access in Winter Beach
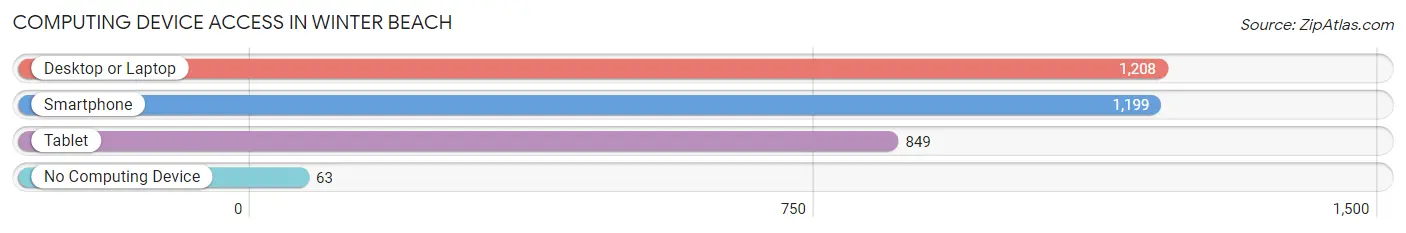
| Device Type | # Households | % Households |
| Desktop or Laptop | 1,208 | 88.8% |
| Smartphone | 1,199 | 88.2% |
| Tablet | 849 | 62.4% |
| No Computing Device | 63 | 4.6% |
| Total | 1,360 | 100.0% |
Internet Access in Winter Beach
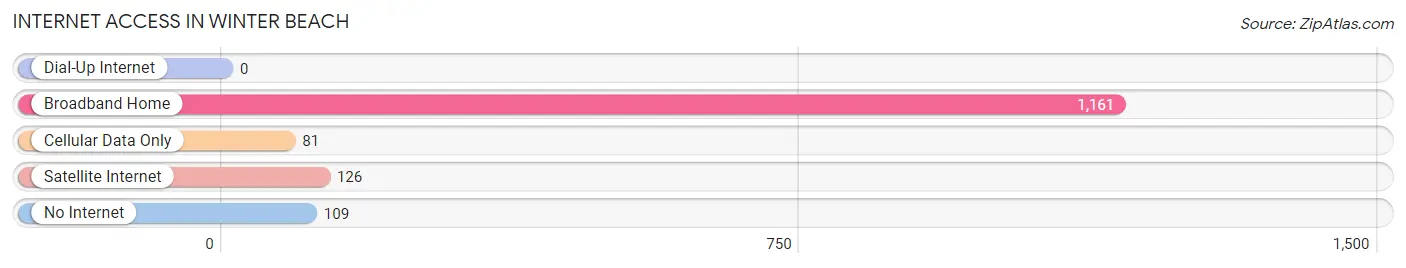
| Internet Type | # Households | % Households |
| Dial-Up Internet | 0 | 0.0% |
| Broadband Home | 1,161 | 85.4% |
| Cellular Data Only | 81 | 6.0% |
| Satellite Internet | 126 | 9.3% |
| No Internet | 109 | 8.0% |
| Total | 1,360 | 100.0% |
Winter Beach Summary
Winter Beach, FL is a small town located in Indian River County, Florida. It is situated on the east coast of the state, just south of the city of Vero Beach. The town has a population of approximately 1,500 people and is known for its beautiful beaches and laid-back atmosphere.
History
The area that is now Winter Beach was first inhabited by the Ais Indians, who were a tribe of Native Americans that lived in the area for centuries. The first European settlers arrived in the area in the late 1800s and began to develop the area for agriculture. The town was officially founded in 1891 and was named after the nearby Winter Beach, which was a popular spot for fishing and recreation.
In the early 1900s, the town began to grow and develop as a tourist destination. The town was known for its beautiful beaches and laid-back atmosphere, which attracted many visitors from around the country. The town also became a popular spot for fishing and boating.
In the 1950s, the town began to experience a population boom as more people moved to the area to take advantage of the town’s natural beauty and laid-back atmosphere. The town continued to grow and develop throughout the 20th century and today is a popular tourist destination.
Geography
Winter Beach is located in Indian River County, Florida. It is situated on the east coast of the state, just south of the city of Vero Beach. The town is bordered by the Indian River Lagoon to the east and the Atlantic Ocean to the south. The town is located on a barrier island, which is separated from the mainland by the Indian River Lagoon.
The town has a total area of 1.2 square miles, all of which is land. The town is located at an elevation of 10 feet above sea level. The town has a humid subtropical climate, with hot and humid summers and mild winters.
Economy
The economy of Winter Beach is largely based on tourism. The town is known for its beautiful beaches and laid-back atmosphere, which attract many visitors from around the country. The town also has a thriving fishing and boating industry, as well as a number of restaurants and shops.
The town also has a number of manufacturing and industrial businesses, which provide jobs for many of the town’s residents. The town is also home to a number of government offices, including the Indian River County Courthouse and the Indian River County Sheriff’s Office.
Demographics
As of the 2010 census, the population of Winter Beach was 1,500 people. The town has a population density of 1,250 people per square mile. The racial makeup of the town is 87.3% White, 8.7% African American, 0.7% Native American, 0.7% Asian, and 2.7% from other races.
The median household income in the town is $45,000, and the median family income is $50,000. The per capita income in the town is $20,000. The town has a poverty rate of 11.3%. The town has a high school graduation rate of 87.5%.
Conclusion
Winter Beach, FL is a small town located in Indian River County, Florida. It is situated on the east coast of the state, just south of the city of Vero Beach. The town has a population of approximately 1,500 people and is known for its beautiful beaches and laid-back atmosphere. The economy of the town is largely based on tourism, fishing, and boating. The town has a population that is 87.3% White, 8.7% African American, 0.7% Native American, 0.7% Asian, and 2.7% from other races. The median household income in the town is $45,000, and the median family income is $50,000. The town has a high school graduation rate of 87.5%. Winter Beach is a popular tourist destination and is known for its beautiful beaches and laid-back atmosphere.
Common Questions
What is Per Capita Income in Winter Beach?
Per Capita income in Winter Beach is $35,320.
What is the Median Family Income in Winter Beach?
Median Family Income in Winter Beach is $96,989.
What is the Median Household income in Winter Beach?
Median Household Income in Winter Beach is $82,045.
What is Income or Wage Gap in Winter Beach?
Income or Wage Gap in Winter Beach is 48.2%.
Women in Winter Beach earn 51.8 cents for every dollar earned by a man.
What is Family Income Deficit in Winter Beach?
Family Income Deficit in Winter Beach is $12,014.
Families that are below poverty line in Winter Beach earn $12,014 less on average than the poverty threshold level.
What is Inequality or Gini Index in Winter Beach?
Inequality or Gini Index in Winter Beach is 0.45.
What is the Total Population of Winter Beach?
Total Population of Winter Beach is 4,273.
What is the Total Male Population of Winter Beach?
Total Male Population of Winter Beach is 1,950.
What is the Total Female Population of Winter Beach?
Total Female Population of Winter Beach is 2,323.
What is the Ratio of Males per 100 Females in Winter Beach?
There are 83.94 Males per 100 Females in Winter Beach.
What is the Ratio of Females per 100 Males in Winter Beach?
There are 119.13 Females per 100 Males in Winter Beach.
What is the Median Population Age in Winter Beach?
Median Population Age in Winter Beach is 55.8 Years.
What is the Average Family Size in Winter Beach
Average Family Size in Winter Beach is 3.6 People.
What is the Average Household Size in Winter Beach
Average Household Size in Winter Beach is 3.1 People.
How Large is the Labor Force in Winter Beach?
There are 1,263 People in the Labor Forcein in Winter Beach.
What is the Percentage of People in the Labor Force in Winter Beach?
35.3% of People are in the Labor Force in Winter Beach.
What is the Unemployment Rate in Winter Beach?
Unemployment Rate in Winter Beach is 6.8%.