Caryville, FL Map & Demographics
Caryville Map
Caryville Overview
$17,177
PER CAPITA INCOME
$76,250
AVG FAMILY INCOME
$48,438
AVG HOUSEHOLD INCOME
11.2%
WAGE / INCOME GAP [ % ]
88.8¢/ $1
WAGE / INCOME GAP [ $ ]
0.35
INEQUALITY / GINI INDEX
269
TOTAL POPULATION
129
MALE POPULATION
140
FEMALE POPULATION
92.14
MALES / 100 FEMALES
108.53
FEMALES / 100 MALES
26.1
MEDIAN AGE
3.6
AVG FAMILY SIZE
2.9
AVG HOUSEHOLD SIZE
120
LABOR FORCE [ PEOPLE ]
58.8%
PERCENT IN LABOR FORCE
5.0%
UNEMPLOYMENT RATE
Caryville Zip Codes
Caryville Area Codes
Income in Caryville
Income Overview in Caryville
Per Capita Income in Caryville is $17,177, while median incomes of families and households are $76,250 and $48,438 respectively.
| Characteristic | Number | Measure |
| Per Capita Income | 269 | $17,177 |
| Median Family Income | 64 | $76,250 |
| Mean Family Income | 64 | $57,625 |
| Median Household Income | 93 | $48,438 |
| Mean Household Income | 93 | $48,284 |
| Income Deficit | 64 | $0 |
| Wage / Income Gap (%) | 269 | 11.19% |
| Wage / Income Gap ($) | 269 | 88.81¢ per $1 |
| Gini / Inequality Index | 269 | 0.35 |
Earnings by Sex in Caryville
Average Earnings in Caryville are $38,750, $38,242 for men and $43,060 for women, a difference of 11.2%.
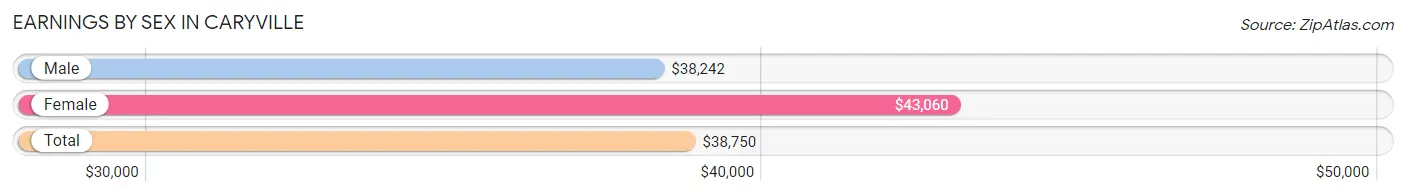
| Sex | Number | Average Earnings |
| Male | 67 (56.8%) | $38,242 |
| Female | 51 (43.2%) | $43,060 |
| Total | 118 (100.0%) | $38,750 |
Earnings by Sex by Income Bracket in Caryville
The most common earnings brackets in Caryville are $35,000 to $39,999 for men (33 | 49.2%) and $40,000 to $44,999 for women (29 | 56.9%).
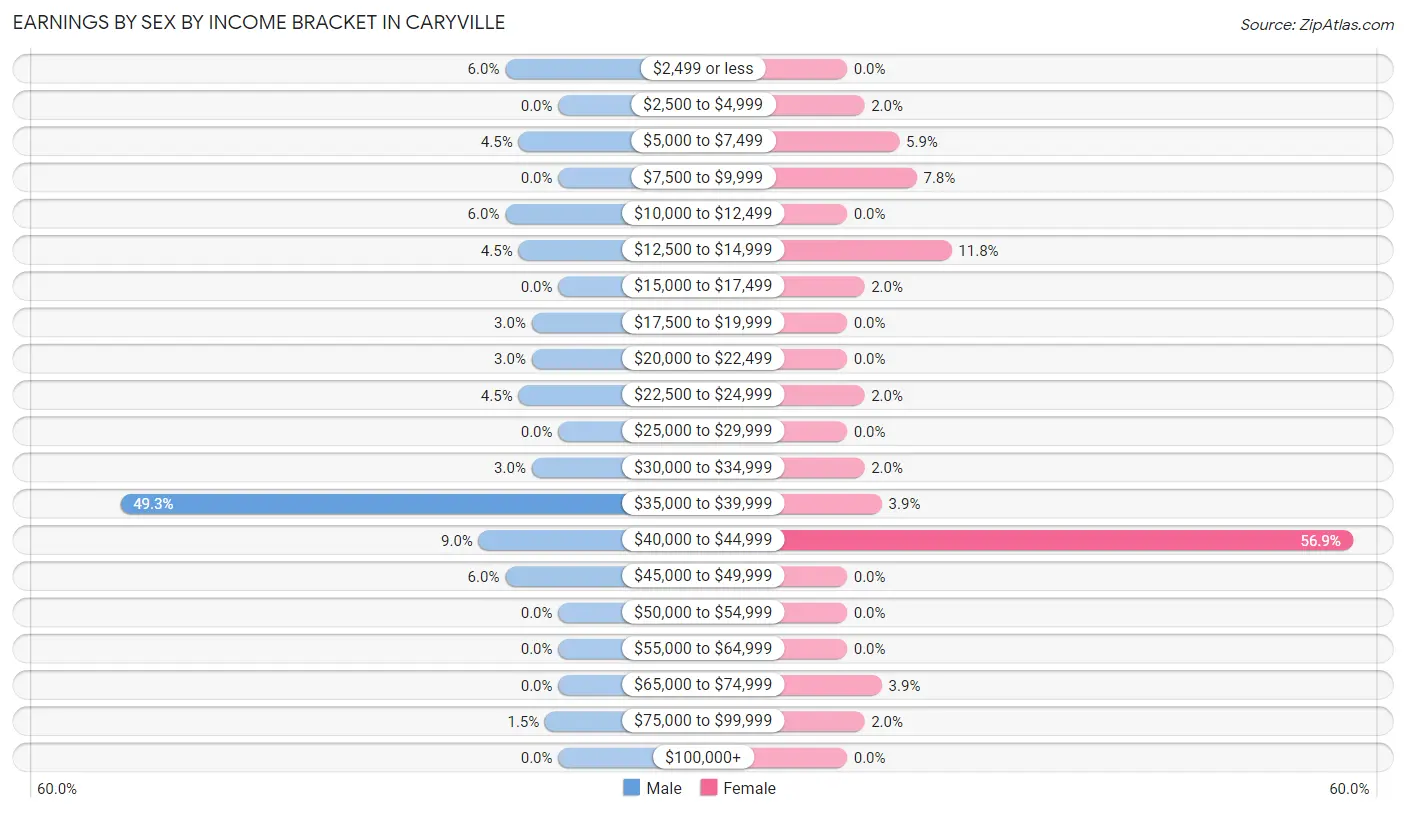
| Income | Male | Female |
| $2,499 or less | 4 (6.0%) | 0 (0.0%) |
| $2,500 to $4,999 | 0 (0.0%) | 1 (2.0%) |
| $5,000 to $7,499 | 3 (4.5%) | 3 (5.9%) |
| $7,500 to $9,999 | 0 (0.0%) | 4 (7.8%) |
| $10,000 to $12,499 | 4 (6.0%) | 0 (0.0%) |
| $12,500 to $14,999 | 3 (4.5%) | 6 (11.8%) |
| $15,000 to $17,499 | 0 (0.0%) | 1 (2.0%) |
| $17,500 to $19,999 | 2 (3.0%) | 0 (0.0%) |
| $20,000 to $22,499 | 2 (3.0%) | 0 (0.0%) |
| $22,500 to $24,999 | 3 (4.5%) | 1 (2.0%) |
| $25,000 to $29,999 | 0 (0.0%) | 0 (0.0%) |
| $30,000 to $34,999 | 2 (3.0%) | 1 (2.0%) |
| $35,000 to $39,999 | 33 (49.2%) | 2 (3.9%) |
| $40,000 to $44,999 | 6 (9.0%) | 29 (56.9%) |
| $45,000 to $49,999 | 4 (6.0%) | 0 (0.0%) |
| $50,000 to $54,999 | 0 (0.0%) | 0 (0.0%) |
| $55,000 to $64,999 | 0 (0.0%) | 0 (0.0%) |
| $65,000 to $74,999 | 0 (0.0%) | 2 (3.9%) |
| $75,000 to $99,999 | 1 (1.5%) | 1 (2.0%) |
| $100,000+ | 0 (0.0%) | 0 (0.0%) |
| Total | 67 (100.0%) | 51 (100.0%) |
Earnings by Sex by Educational Attainment in Caryville
Average earnings in Caryville are $23,333 for men and $43,103 for women, a difference of 45.9%. Men with an educational attainment of less than high school enjoy the highest average annual earnings of $44,583, while those with high school diploma education earn the least with $18,750. Women with an educational attainment of high school diploma earn the most with the average annual earnings of $43,319, while those with high school diploma education have the smallest earnings of $43,319.
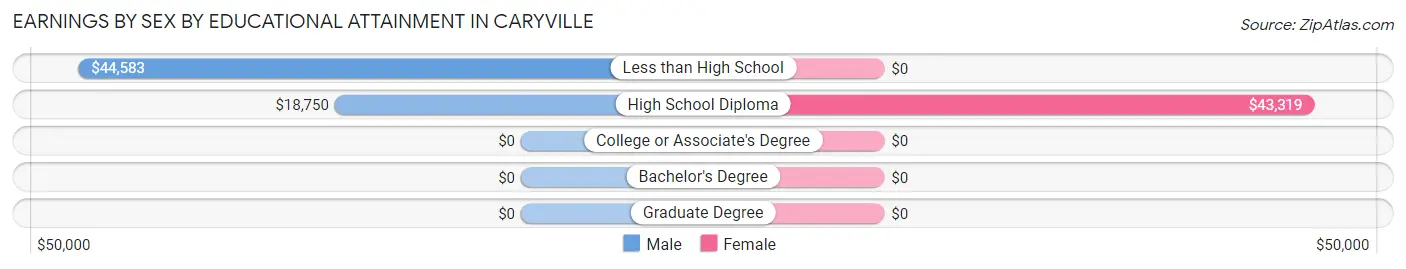
| Educational Attainment | Male Income | Female Income |
| Less than High School | $44,583 | $0 |
| High School Diploma | $18,750 | $43,319 |
| College or Associate's Degree | - | - |
| Bachelor's Degree | - | - |
| Graduate Degree | - | - |
| Total | $23,333 | $43,103 |
Family Income in Caryville
Family Income Brackets in Caryville
According to the Caryville family income data, there are 33 families falling into the $75,000 to $99,999 income range, which is the most common income bracket and makes up 51.6% of all families.
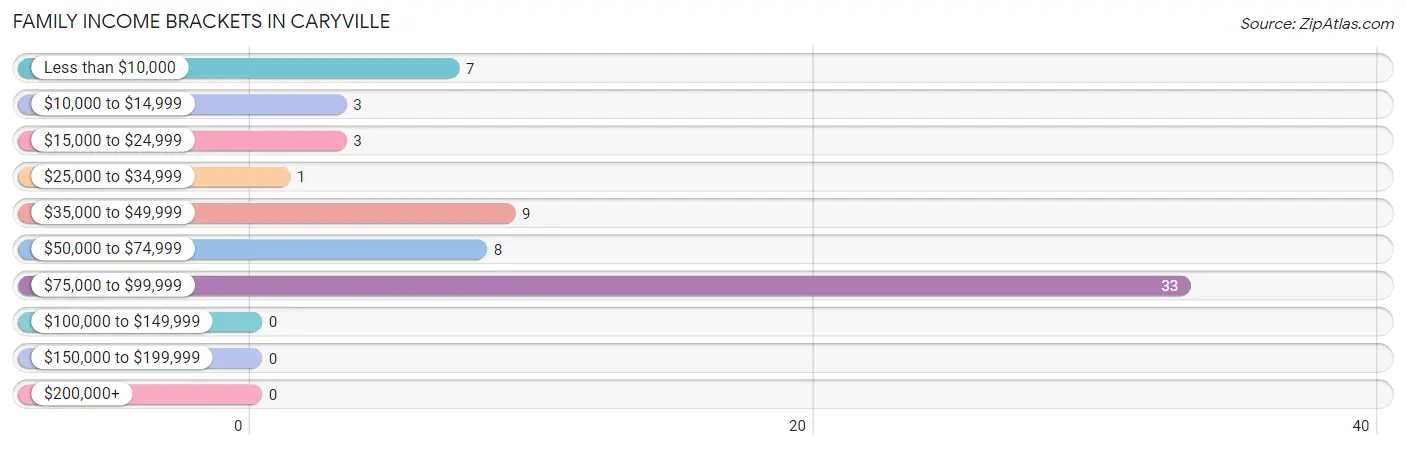
| Income Bracket | # Families | % Families |
| Less than $10,000 | 7 | 10.9% |
| $10,000 to $14,999 | 3 | 4.7% |
| $15,000 to $24,999 | 3 | 4.7% |
| $25,000 to $34,999 | 1 | 1.6% |
| $35,000 to $49,999 | 9 | 14.1% |
| $50,000 to $74,999 | 8 | 12.5% |
| $75,000 to $99,999 | 33 | 51.6% |
| $100,000 to $149,999 | 0 | 0.0% |
| $150,000 to $199,999 | 0 | 0.0% |
| $200,000+ | 0 | 0.0% |
Family Income by Famaliy Size in Caryville
4-person families (38 | 59.4%) account for the highest median family income in Caryville with $83,362 per family, while 4-person families (38 | 59.4%) have the highest median income of $20,840 per family member.
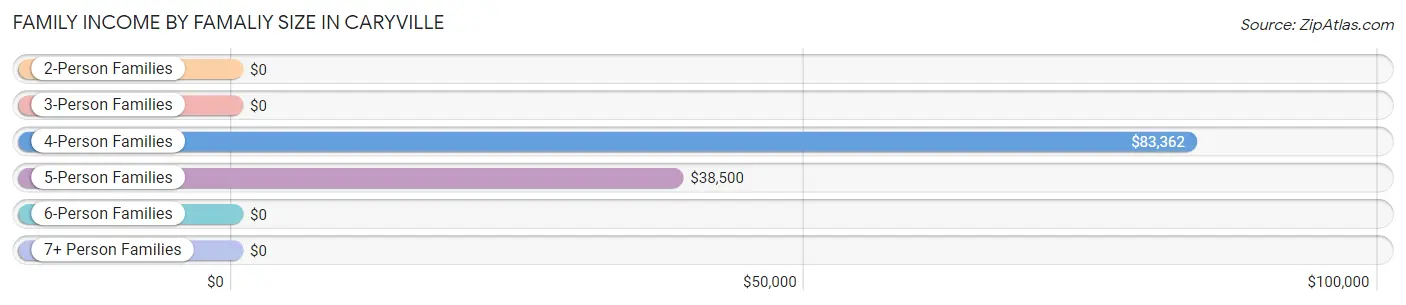
| Income Bracket | # Families | Median Income |
| 2-Person Families | 9 (14.1%) | $0 |
| 3-Person Families | 9 (14.1%) | $0 |
| 4-Person Families | 38 (59.4%) | $83,362 |
| 5-Person Families | 8 (12.5%) | $38,500 |
| 6-Person Families | 0 (0.0%) | $0 |
| 7+ Person Families | 0 (0.0%) | $0 |
| Total | 64 (100.0%) | $76,250 |
Family Income by Number of Earners in Caryville
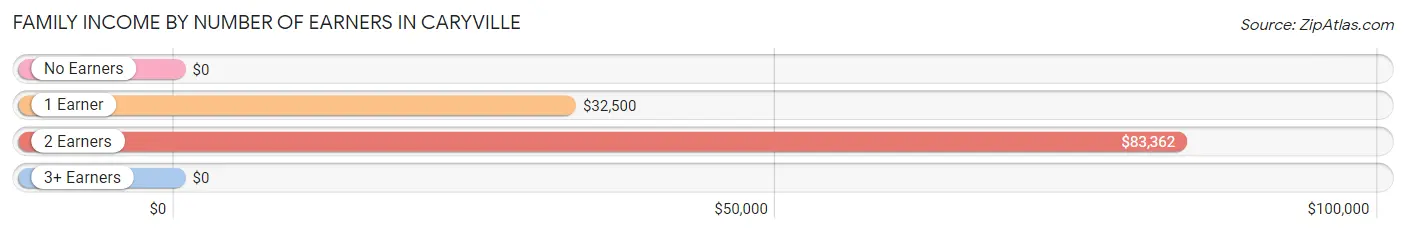
| Number of Earners | # Families | Median Income |
| No Earners | 11 (17.2%) | $0 |
| 1 Earner | 14 (21.9%) | $32,500 |
| 2 Earners | 38 (59.4%) | $83,362 |
| 3+ Earners | 1 (1.6%) | $0 |
| Total | 64 (100.0%) | $76,250 |
Household Income in Caryville
Household Income Brackets in Caryville
With 34 households falling in the category, the $75,000 to $99,999 income range is the most frequent in Caryville, accounting for 36.6% of all households.
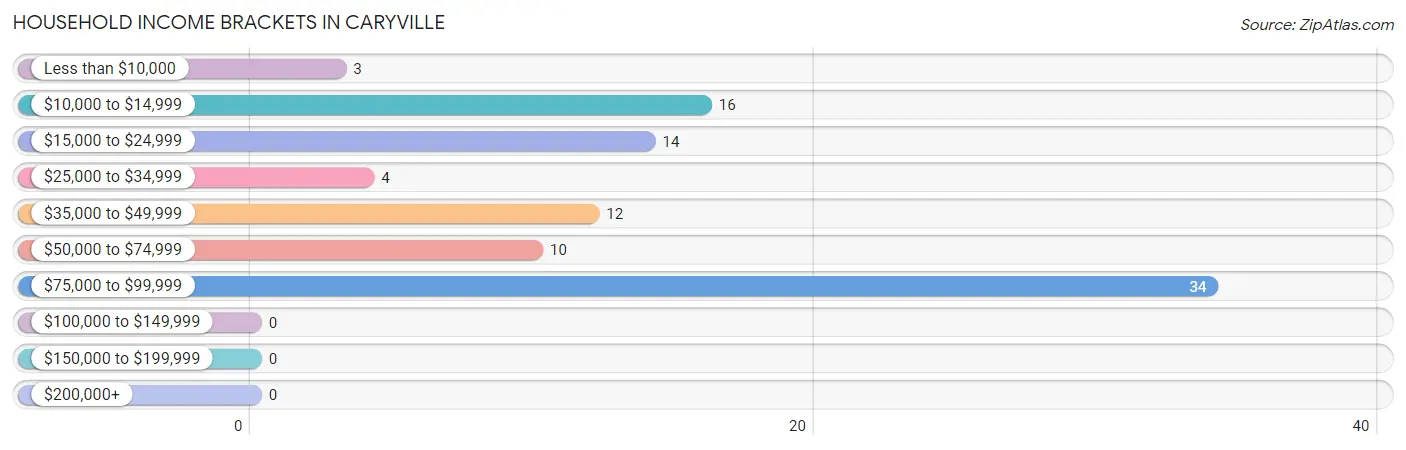
| Income Bracket | # Households | % Households |
| Less than $10,000 | 3 | 3.2% |
| $10,000 to $14,999 | 16 | 17.2% |
| $15,000 to $24,999 | 14 | 15.1% |
| $25,000 to $34,999 | 4 | 4.3% |
| $35,000 to $49,999 | 12 | 12.9% |
| $50,000 to $74,999 | 10 | 10.8% |
| $75,000 to $99,999 | 34 | 36.6% |
| $100,000 to $149,999 | 0 | 0.0% |
| $150,000 to $199,999 | 0 | 0.0% |
| $200,000+ | 0 | 0.0% |
Household Income by Householder Age in Caryville
| Income Bracket | # Households | Median Income |
| 15 to 24 Years | 0 (0.0%) | $0 |
| 25 to 44 Years | 60 (64.5%) | $0 |
| 45 to 64 Years | 18 (19.4%) | $0 |
| 65+ Years | 15 (16.1%) | $0 |
| Total | 93 (100.0%) | $48,438 |
Poverty in Caryville
Income Below Poverty by Sex and Age in Caryville
With 17.1% poverty level for males and 24.6% for females among the residents of Caryville, 55 to 64 year old males and 5 year old females are the most vulnerable to poverty, with 5 males (71.4%) and 4 females (100.0%) in their respective age groups living below the poverty level.
| Age Bracket | Male | Female |
| Under 5 Years | 0 (0.0%) | 4 (44.4%) |
| 5 Years | 0 (0.0%) | 4 (100.0%) |
| 6 to 11 Years | 3 (20.0%) | 3 (33.3%) |
| 12 to 14 Years | 2 (25.0%) | 2 (66.7%) |
| 15 Years | 0 (0.0%) | 0 (0.0%) |
| 16 and 17 Years | 0 (0.0%) | 0 (0.0%) |
| 18 to 24 Years | 1 (2.9%) | 1 (3.3%) |
| 25 to 34 Years | 5 (62.5%) | 3 (7.1%) |
| 35 to 44 Years | 0 (0.0%) | 7 (53.8%) |
| 45 to 54 Years | 4 (30.8%) | 1 (12.5%) |
| 55 to 64 Years | 5 (71.4%) | 3 (75.0%) |
| 65 to 74 Years | 2 (33.3%) | 6 (50.0%) |
| 75 Years and over | 0 (0.0%) | 0 (0.0%) |
| Total | 22 (17.1%) | 34 (24.6%) |
Income Above Poverty by Sex and Age in Caryville
According to the poverty statistics in Caryville, males aged under 5 years and females aged 16 and 17 years are the age groups that are most secure financially, with 100.0% of males and 100.0% of females in these age groups living above the poverty line.
| Age Bracket | Male | Female |
| Under 5 Years | 10 (100.0%) | 5 (55.6%) |
| 5 Years | 4 (100.0%) | 0 (0.0%) |
| 6 to 11 Years | 12 (80.0%) | 6 (66.7%) |
| 12 to 14 Years | 6 (75.0%) | 1 (33.3%) |
| 15 Years | 1 (100.0%) | 0 (0.0%) |
| 16 and 17 Years | 0 (0.0%) | 1 (100.0%) |
| 18 to 24 Years | 34 (97.1%) | 29 (96.7%) |
| 25 to 34 Years | 3 (37.5%) | 39 (92.9%) |
| 35 to 44 Years | 19 (100.0%) | 6 (46.2%) |
| 45 to 54 Years | 9 (69.2%) | 7 (87.5%) |
| 55 to 64 Years | 2 (28.6%) | 1 (25.0%) |
| 65 to 74 Years | 4 (66.7%) | 6 (50.0%) |
| 75 Years and over | 3 (100.0%) | 3 (100.0%) |
| Total | 107 (83.0%) | 104 (75.4%) |
Income Below Poverty Among Married-Couple Families in Caryville
The poverty statistics for married-couple families in Caryville show that 4.8% or 1 of the total 21 families live below the poverty line. Families with no children have the highest poverty rate of 12.5%, comprising of 1 families. On the other hand, families with 1 or 2 children have the lowest poverty rate of 0.0%, which includes 0 families.
| Children | Above Poverty | Below Poverty |
| No Children | 7 (87.5%) | 1 (12.5%) |
| 1 or 2 Children | 6 (100.0%) | 0 (0.0%) |
| 3 or 4 Children | 7 (100.0%) | 0 (0.0%) |
| 5 or more Children | 0 (0.0%) | 0 (0.0%) |
| Total | 20 (95.2%) | 1 (4.8%) |
Income Below Poverty Among Single-Parent Households in Caryville
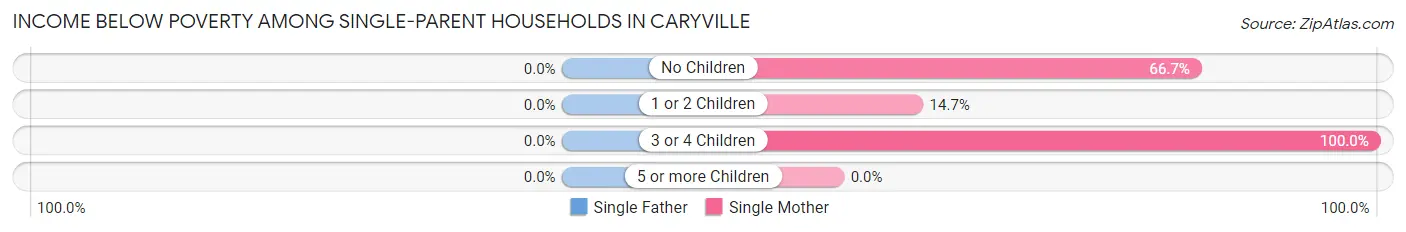
| Children | Single Father | Single Mother |
| No Children | 0 (0.0%) | 2 (66.7%) |
| 1 or 2 Children | 0 (0.0%) | 5 (14.7%) |
| 3 or 4 Children | 0 (0.0%) | 4 (100.0%) |
| 5 or more Children | 0 (0.0%) | 0 (0.0%) |
| Total | 0 (0.0%) | 11 (26.8%) |
Income Below Poverty Among Married-Couple vs Single-Parent Households in Caryville
The poverty data for Caryville shows that 1 of the married-couple family households (4.8%) and 11 of the single-parent households (25.6%) are living below the poverty level. Within the married-couple family households, those with no children have the highest poverty rate, with 1 households (12.5%) falling below the poverty line. Among the single-parent households, those with 3 or 4 children have the highest poverty rate, with 4 household (100.0%) living below poverty.
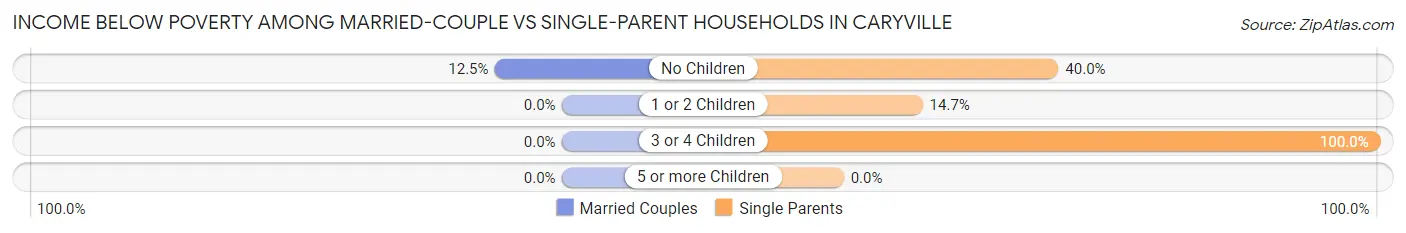
| Children | Married-Couple Families | Single-Parent Households |
| No Children | 1 (12.5%) | 2 (40.0%) |
| 1 or 2 Children | 0 (0.0%) | 5 (14.7%) |
| 3 or 4 Children | 0 (0.0%) | 4 (100.0%) |
| 5 or more Children | 0 (0.0%) | 0 (0.0%) |
| Total | 1 (4.8%) | 11 (25.6%) |
Race in Caryville
The most populous races in Caryville are White / Caucasian (236 | 87.7%), Black / African American (24 | 8.9%), and Two or more Races (6 | 2.2%).
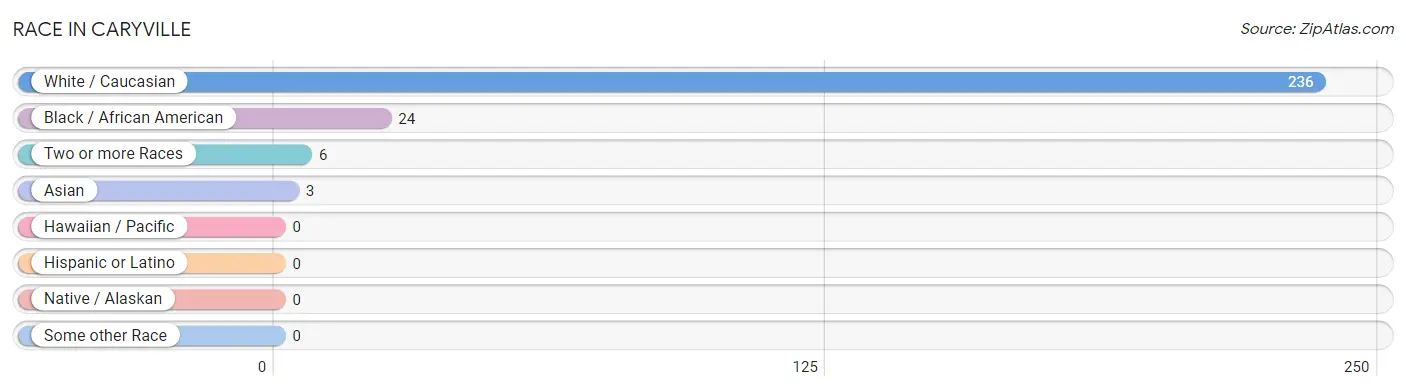
| Race | # Population | % Population |
| Asian | 3 | 1.1% |
| Black / African American | 24 | 8.9% |
| Hawaiian / Pacific | 0 | 0.0% |
| Hispanic or Latino | 0 | 0.0% |
| Native / Alaskan | 0 | 0.0% |
| White / Caucasian | 236 | 87.7% |
| Two or more Races | 6 | 2.2% |
| Some other Race | 0 | 0.0% |
| Total | 269 | 100.0% |
Ancestry in Caryville
The most populous ancestries reported in Caryville are American (24 | 8.9%), English (12 | 4.5%), Irish (10 | 3.7%), German (5 | 1.9%), and Sri Lankan (3 | 1.1%), together accounting for 20.1% of all Caryville residents.
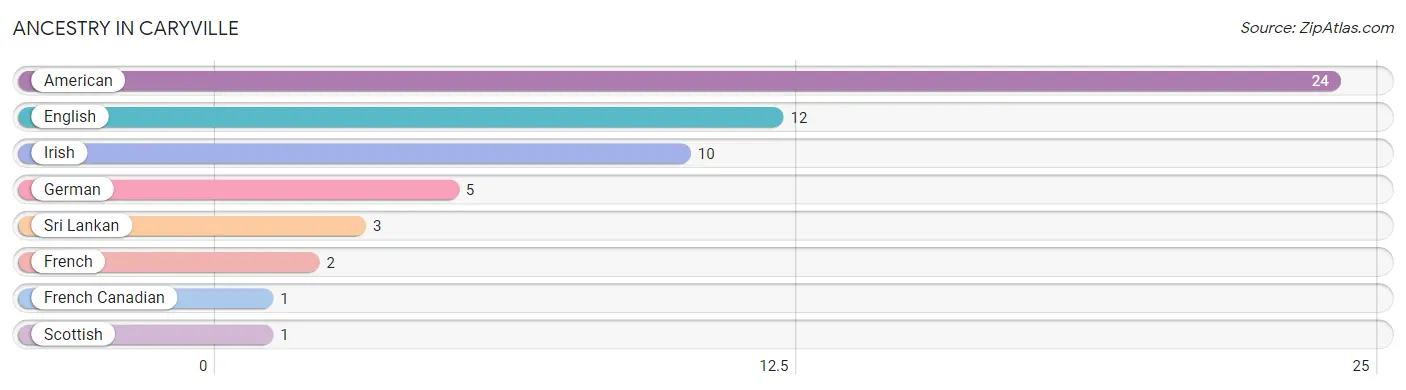
| Ancestry | # Population | % Population |
| American | 24 | 8.9% |
| English | 12 | 4.5% |
| French | 2 | 0.7% |
| French Canadian | 1 | 0.4% |
| German | 5 | 1.9% |
| Irish | 10 | 3.7% |
| Scottish | 1 | 0.4% |
| Sri Lankan | 3 | 1.1% | View All 8 Rows |
Immigrants in Caryville
The most numerous immigrant groups reported in Caryville came from Asia (3 | 1.1%), South Eastern Asia (3 | 1.1%), and Vietnam (3 | 1.1%), together accounting for 3.4% of all Caryville residents.
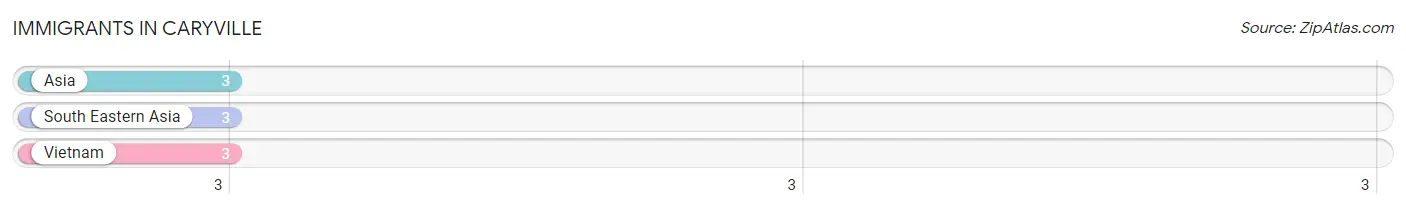
| Immigration Origin | # Population | % Population |
| Asia | 3 | 1.1% |
| South Eastern Asia | 3 | 1.1% |
| Vietnam | 3 | 1.1% | View All 3 Rows |
Sex and Age in Caryville
Sex and Age in Caryville
The most populous age groups in Caryville are 20 to 24 Years (35 | 27.1%) for men and 25 to 29 Years (33 | 23.6%) for women.
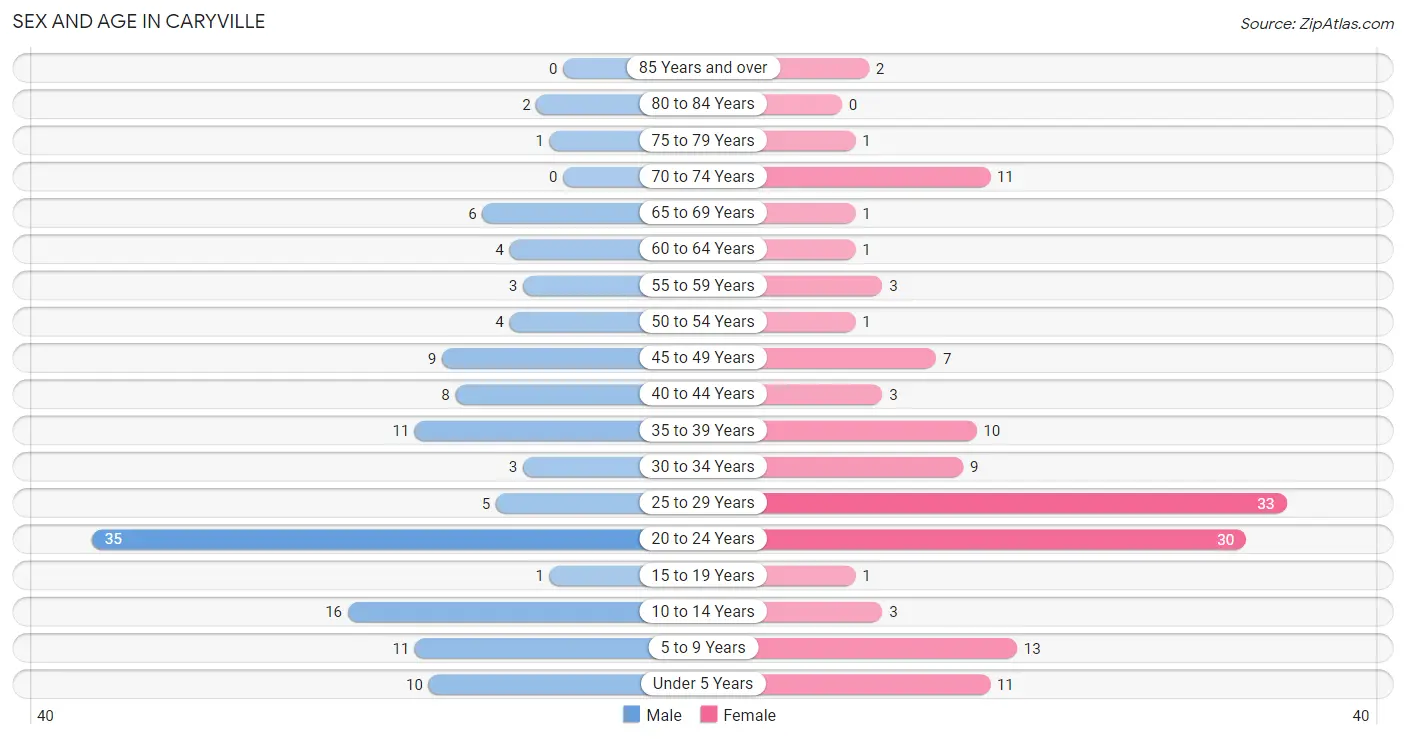
| Age Bracket | Male | Female |
| Under 5 Years | 10 (7.7%) | 11 (7.9%) |
| 5 to 9 Years | 11 (8.5%) | 13 (9.3%) |
| 10 to 14 Years | 16 (12.4%) | 3 (2.1%) |
| 15 to 19 Years | 1 (0.8%) | 1 (0.7%) |
| 20 to 24 Years | 35 (27.1%) | 30 (21.4%) |
| 25 to 29 Years | 5 (3.9%) | 33 (23.6%) |
| 30 to 34 Years | 3 (2.3%) | 9 (6.4%) |
| 35 to 39 Years | 11 (8.5%) | 10 (7.1%) |
| 40 to 44 Years | 8 (6.2%) | 3 (2.1%) |
| 45 to 49 Years | 9 (7.0%) | 7 (5.0%) |
| 50 to 54 Years | 4 (3.1%) | 1 (0.7%) |
| 55 to 59 Years | 3 (2.3%) | 3 (2.1%) |
| 60 to 64 Years | 4 (3.1%) | 1 (0.7%) |
| 65 to 69 Years | 6 (4.6%) | 1 (0.7%) |
| 70 to 74 Years | 0 (0.0%) | 11 (7.9%) |
| 75 to 79 Years | 1 (0.8%) | 1 (0.7%) |
| 80 to 84 Years | 2 (1.5%) | 0 (0.0%) |
| 85 Years and over | 0 (0.0%) | 2 (1.4%) |
| Total | 129 (100.0%) | 140 (100.0%) |
Families and Households in Caryville
Median Family Size in Caryville
The median family size in Caryville is 3.63 persons per family, with married-couple families (21 | 32.8%) accounting for the largest median family size of 4.19 persons per family. On the other hand, single male/father families (2 | 3.1%) represent the smallest median family size with 2.50 persons per family.
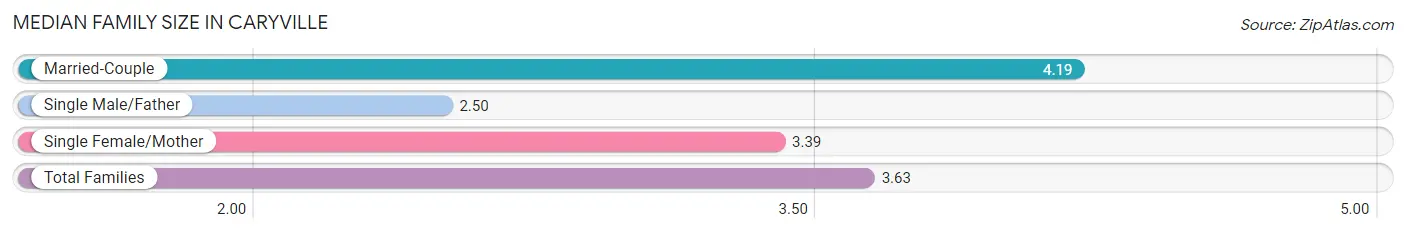
| Family Type | # Families | Family Size |
| Married-Couple | 21 (32.8%) | 4.19 |
| Single Male/Father | 2 (3.1%) | 2.50 |
| Single Female/Mother | 41 (64.1%) | 3.39 |
| Total Families | 64 (100.0%) | 3.63 |
Median Household Size in Caryville
The median household size in Caryville is 2.89 persons per household, with married-couple households (21 | 22.6%) accounting for the largest median household size of 4.29 persons per household. non-family households (29 | 31.2%) represent the smallest median household size with 1.10 persons per household.
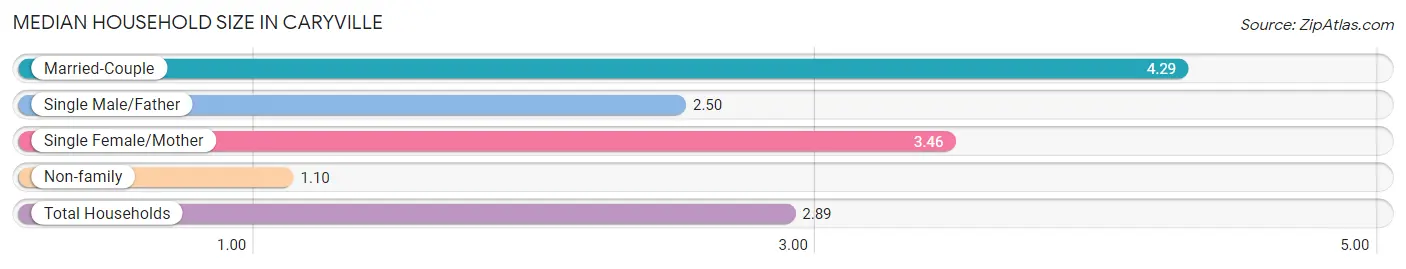
| Household Type | # Households | Household Size |
| Married-Couple | 21 (22.6%) | 4.29 |
| Single Male/Father | 2 (2.1%) | 2.50 |
| Single Female/Mother | 41 (44.1%) | 3.46 |
| Non-family | 29 (31.2%) | 1.10 |
| Total Households | 93 (100.0%) | 2.89 |
Household Size by Marriage Status in Caryville
Out of a total of 93 households in Caryville, 64 (68.8%) are family households, while 29 (31.2%) are nonfamily households. The most numerous type of family households are 4-person households, comprising 33, and the most common type of nonfamily households are 1-person households, comprising 26.
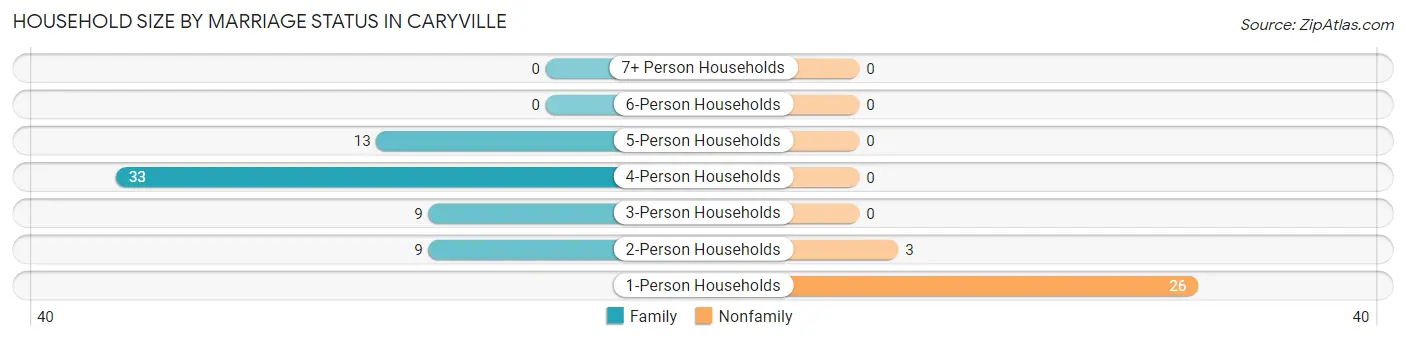
| Household Size | Family Households | Nonfamily Households |
| 1-Person Households | - | 26 (28.0%) |
| 2-Person Households | 9 (9.7%) | 3 (3.2%) |
| 3-Person Households | 9 (9.7%) | 0 (0.0%) |
| 4-Person Households | 33 (35.5%) | 0 (0.0%) |
| 5-Person Households | 13 (14.0%) | 0 (0.0%) |
| 6-Person Households | 0 (0.0%) | 0 (0.0%) |
| 7+ Person Households | 0 (0.0%) | 0 (0.0%) |
| Total | 64 (68.8%) | 29 (31.2%) |
Female Fertility in Caryville
Fertility by Age in Caryville
Average fertility rate in Caryville is 333.0 births per 1,000 women. Women in the age bracket of 20 to 34 years have the highest fertility rate with 431.0 births per 1,000 women. Women in the age bracket of 20 to 34 years acount for 100.0% of all women with births.
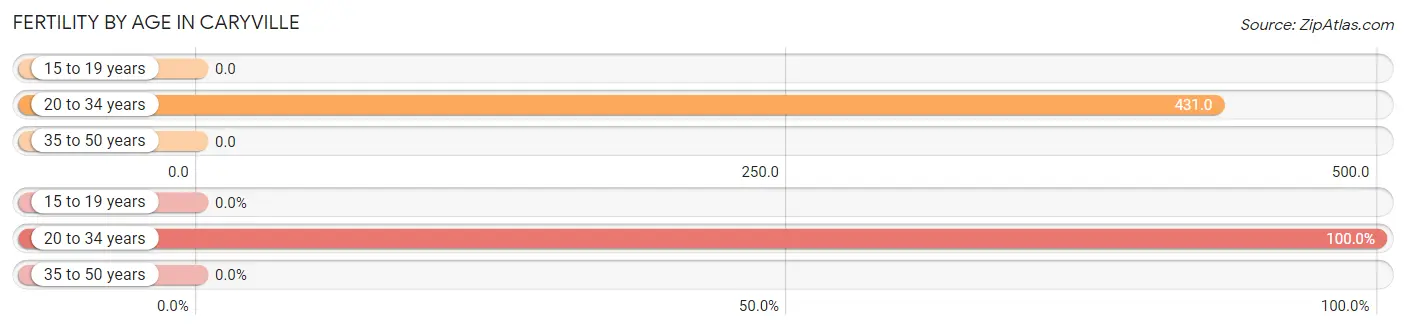
| Age Bracket | Women with Births | Births / 1,000 Women |
| 15 to 19 years | 0 (0.0%) | 0.0 |
| 20 to 34 years | 31 (100.0%) | 431.0 |
| 35 to 50 years | 0 (0.0%) | 0.0 |
| Total | 31 (100.0%) | 333.0 |
Fertility by Age by Marriage Status in Caryville
3.2% of women with births (31) in Caryville are married. The highest percentage of unmarried women with births falls into 20 to 34 years age bracket with 96.8% of them unmarried at the time of birth, while the lowest percentage of unmarried women with births belong to 20 to 34 years age bracket with 96.8% of them unmarried.
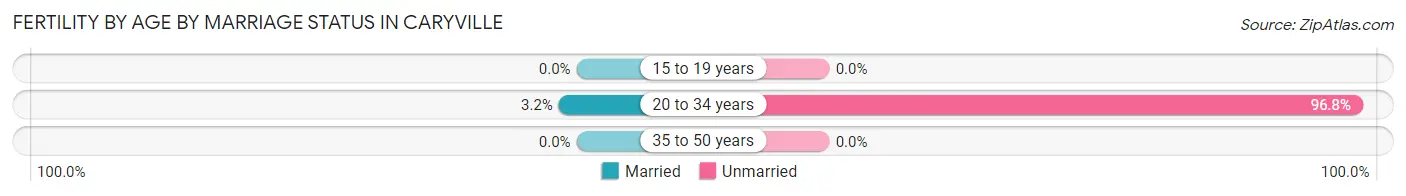
| Age Bracket | Married | Unmarried |
| 15 to 19 years | 0 (0.0%) | 0 (0.0%) |
| 20 to 34 years | 1 (3.2%) | 30 (96.8%) |
| 35 to 50 years | 0 (0.0%) | 0 (0.0%) |
| Total | 1 (3.2%) | 30 (96.8%) |
Fertility by Education in Caryville
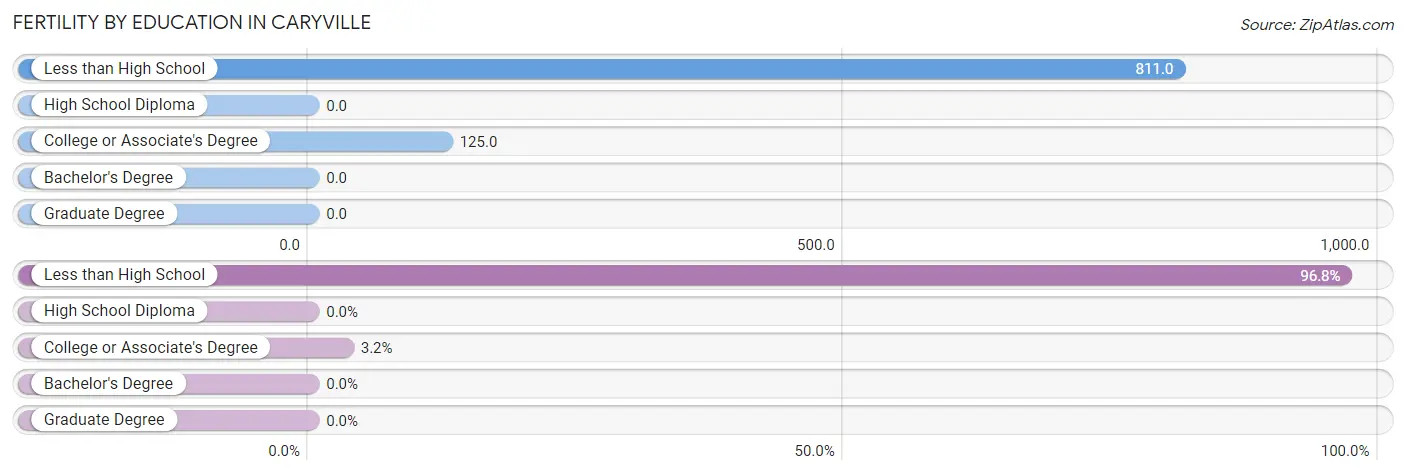
| Educational Attainment | Women with Births | Births / 1,000 Women |
| Less than High School | 30 (96.8%) | 811.0 |
| High School Diploma | 0 (0.0%) | 0.0 |
| College or Associate's Degree | 1 (3.2%) | 125.0 |
| Bachelor's Degree | 0 (0.0%) | 0.0 |
| Graduate Degree | 0 (0.0%) | 0.0 |
| Total | 31 (100.0%) | 333.0 |
Fertility by Education by Marriage Status in Caryville
96.8% of women with births in Caryville are unmarried. Women with the educational attainment of college or associate's degree are most likely to be married with 100.0% of them married at childbirth, while women with the educational attainment of less than high school are least likely to be married with 100.0% of them unmarried at childbirth.
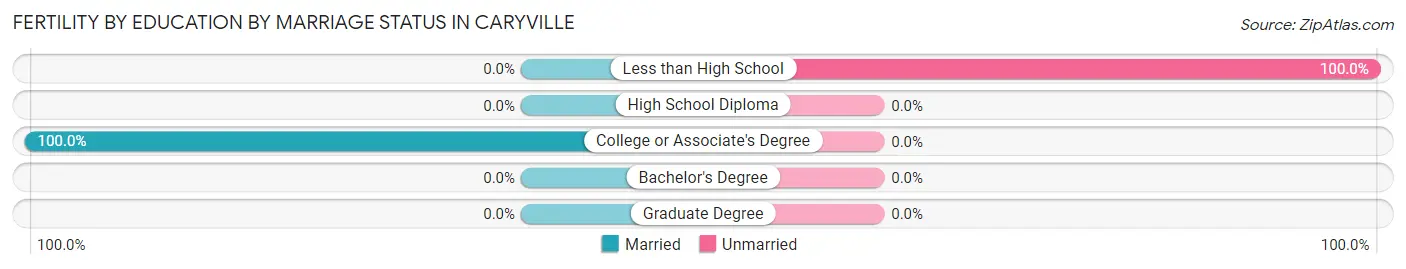
| Educational Attainment | Married | Unmarried |
| Less than High School | 0 (0.0%) | 30 (100.0%) |
| High School Diploma | 0 (0.0%) | 0 (0.0%) |
| College or Associate's Degree | 1 (100.0%) | 0 (0.0%) |
| Bachelor's Degree | 0 (0.0%) | 0 (0.0%) |
| Graduate Degree | 0 (0.0%) | 0 (0.0%) |
| Total | 1 (3.2%) | 30 (96.8%) |
Employment Characteristics in Caryville
Employment by Class of Employer in Caryville
Among the 114 employed individuals in Caryville, private company employees (86 | 75.4%), state government employees (11 | 9.7%), and self-employed (not incorporated) (7 | 6.1%) make up the most common classes of employment.
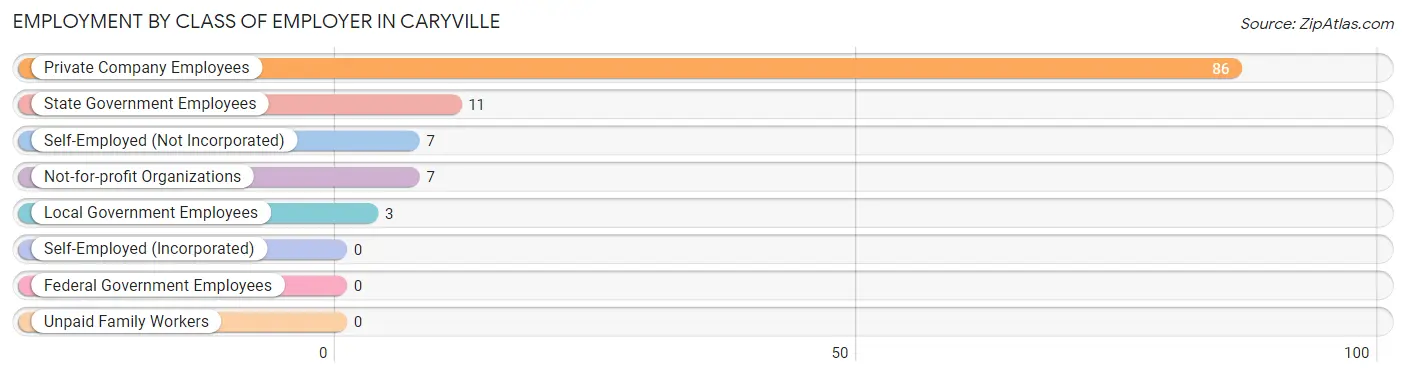
| Employer Class | # Employees | % Employees |
| Private Company Employees | 86 | 75.4% |
| Self-Employed (Incorporated) | 0 | 0.0% |
| Self-Employed (Not Incorporated) | 7 | 6.1% |
| Not-for-profit Organizations | 7 | 6.1% |
| Local Government Employees | 3 | 2.6% |
| State Government Employees | 11 | 9.7% |
| Federal Government Employees | 0 | 0.0% |
| Unpaid Family Workers | 0 | 0.0% |
| Total | 114 | 100.0% |
Employment Status by Age in Caryville
According to the labor force statistics for Caryville, out of the total population over 16 years of age (204), 58.8% or 120 individuals are in the labor force, with 5.0% or 6 of them unemployed. The age group with the highest labor force participation rate is 16 to 19 years, with 100.0% or 1 individuals in the labor force. Within the labor force, the 55 to 59 years age range has the highest percentage of unemployed individuals, with 50.0% or 2 of them being unemployed.
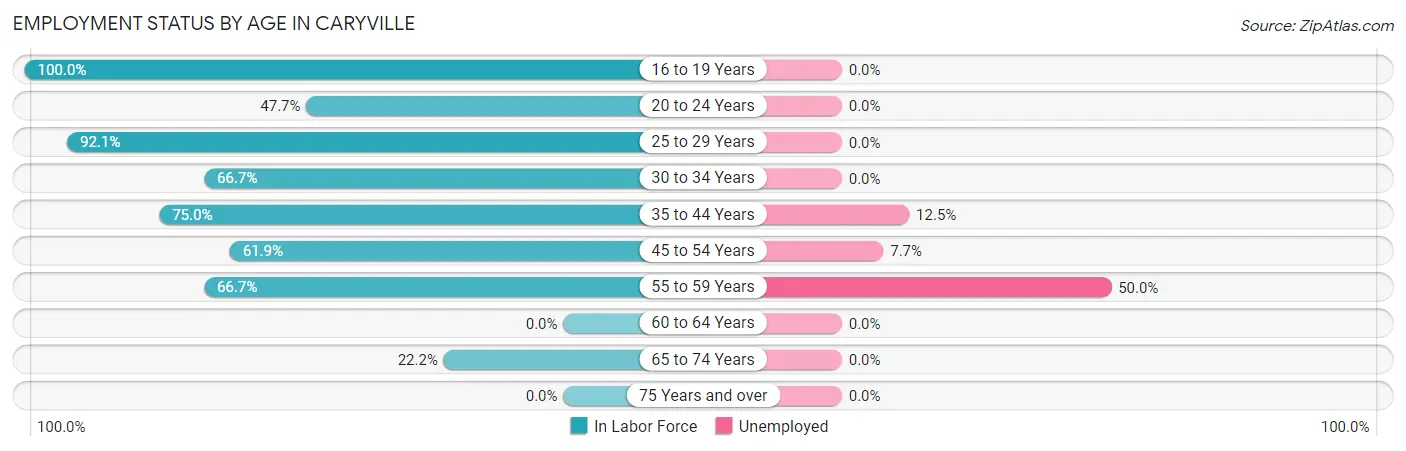
| Age Bracket | In Labor Force | Unemployed |
| 16 to 19 Years | 1 (100.0%) | 0 (0.0%) |
| 20 to 24 Years | 31 (47.7%) | 0 (0.0%) |
| 25 to 29 Years | 35 (92.1%) | 0 (0.0%) |
| 30 to 34 Years | 8 (66.7%) | 0 (0.0%) |
| 35 to 44 Years | 24 (75.0%) | 3 (12.5%) |
| 45 to 54 Years | 13 (61.9%) | 1 (7.7%) |
| 55 to 59 Years | 4 (66.7%) | 2 (50.0%) |
| 60 to 64 Years | 0 (0.0%) | 0 (0.0%) |
| 65 to 74 Years | 4 (22.2%) | 0 (0.0%) |
| 75 Years and over | 0 (0.0%) | 0 (0.0%) |
| Total | 120 (58.8%) | 6 (5.0%) |
Employment Status by Educational Attainment in Caryville
According to labor force statistics for Caryville, 73.7% of individuals (84) out of the total population between 25 and 64 years of age (114) are in the labor force, with 7.1% or 6 of them being unemployed. The group with the highest labor force participation rate are those with the educational attainment of bachelor's degree or higher, with 100.0% or 6 individuals in the labor force. Within the labor force, individuals with bachelor's degree or higher education have the highest percentage of unemployment, with 50.0% or 3 of them being unemployed.
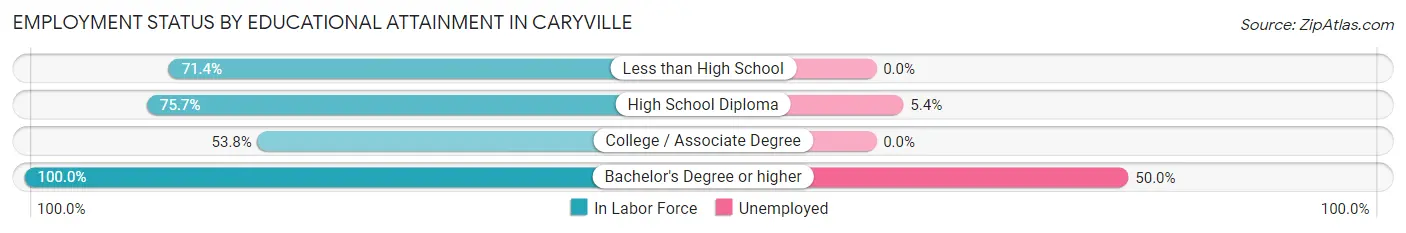
| Educational Attainment | In Labor Force | Unemployed |
| Less than High School | 15 (71.4%) | 0 (0.0%) |
| High School Diploma | 56 (75.7%) | 4 (5.4%) |
| College / Associate Degree | 7 (53.8%) | 0 (0.0%) |
| Bachelor's Degree or higher | 6 (100.0%) | 3 (50.0%) |
| Total | 84 (73.7%) | 8 (7.1%) |
Employment Occupations by Sex in Caryville
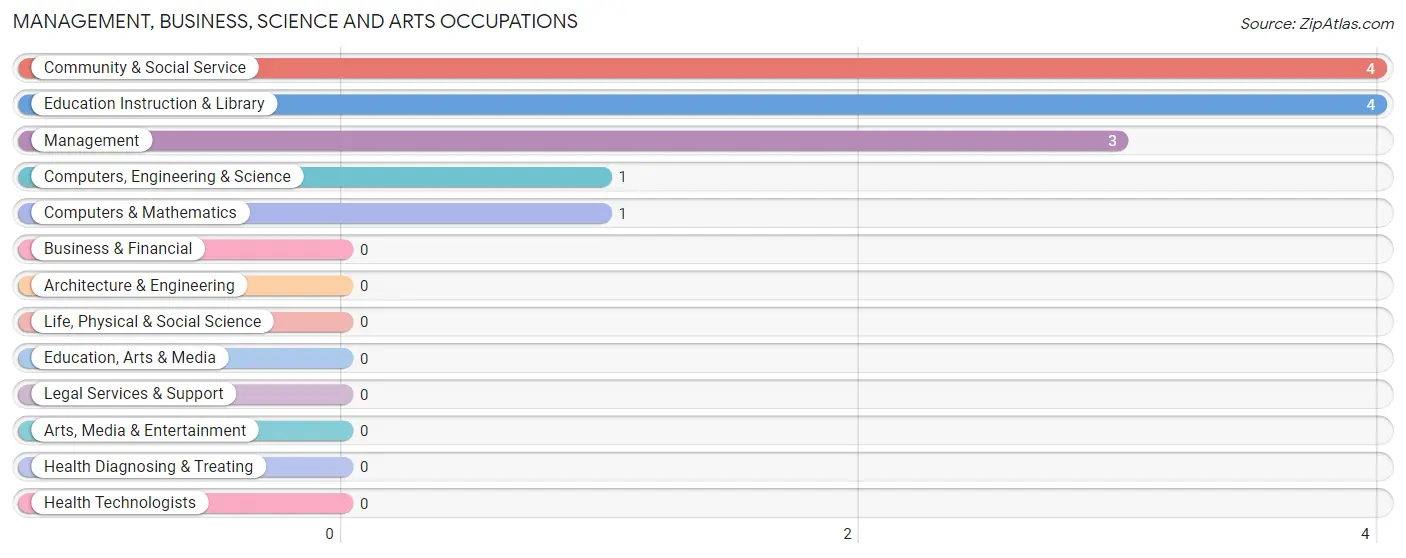
Management, Business, Science and Arts Occupations
The most common Management, Business, Science and Arts occupations in Caryville are Community & Social Service (4 | 3.5%), Education Instruction & Library (4 | 3.5%), Management (3 | 2.6%), Computers, Engineering & Science (1 | 0.9%), and Computers & Mathematics (1 | 0.9%).
Management, Business, Science and Arts Occupations by Sex
Within the Management, Business, Science and Arts occupations in Caryville, the most male-oriented occupations are Management (100.0%), Computers, Engineering & Science (100.0%), and Computers & Mathematics (100.0%), while the most female-oriented occupations are Community & Social Service (75.0%), and Education Instruction & Library (75.0%).
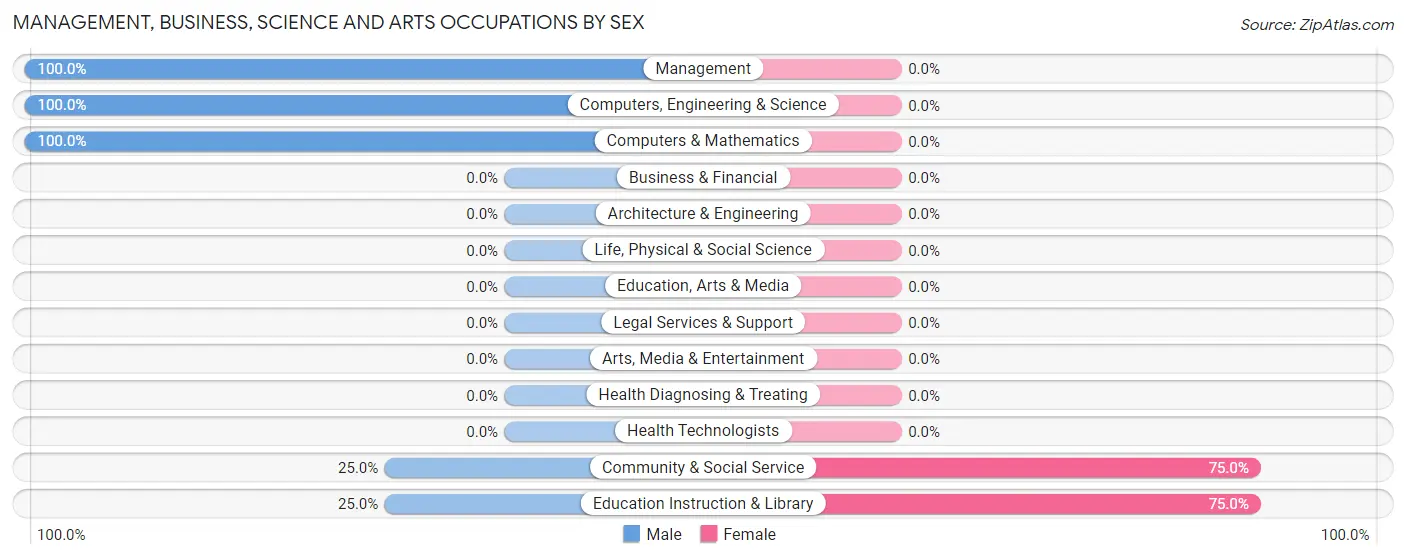
| Occupation | Male | Female |
| Management | 3 (100.0%) | 0 (0.0%) |
| Business & Financial | 0 (0.0%) | 0 (0.0%) |
| Computers, Engineering & Science | 1 (100.0%) | 0 (0.0%) |
| Computers & Mathematics | 1 (100.0%) | 0 (0.0%) |
| Architecture & Engineering | 0 (0.0%) | 0 (0.0%) |
| Life, Physical & Social Science | 0 (0.0%) | 0 (0.0%) |
| Community & Social Service | 1 (25.0%) | 3 (75.0%) |
| Education, Arts & Media | 0 (0.0%) | 0 (0.0%) |
| Legal Services & Support | 0 (0.0%) | 0 (0.0%) |
| Education Instruction & Library | 1 (25.0%) | 3 (75.0%) |
| Arts, Media & Entertainment | 0 (0.0%) | 0 (0.0%) |
| Health Diagnosing & Treating | 0 (0.0%) | 0 (0.0%) |
| Health Technologists | 0 (0.0%) | 0 (0.0%) |
| Total (Category) | 5 (62.5%) | 3 (37.5%) |
| Total (Overall) | 67 (58.8%) | 47 (41.2%) |
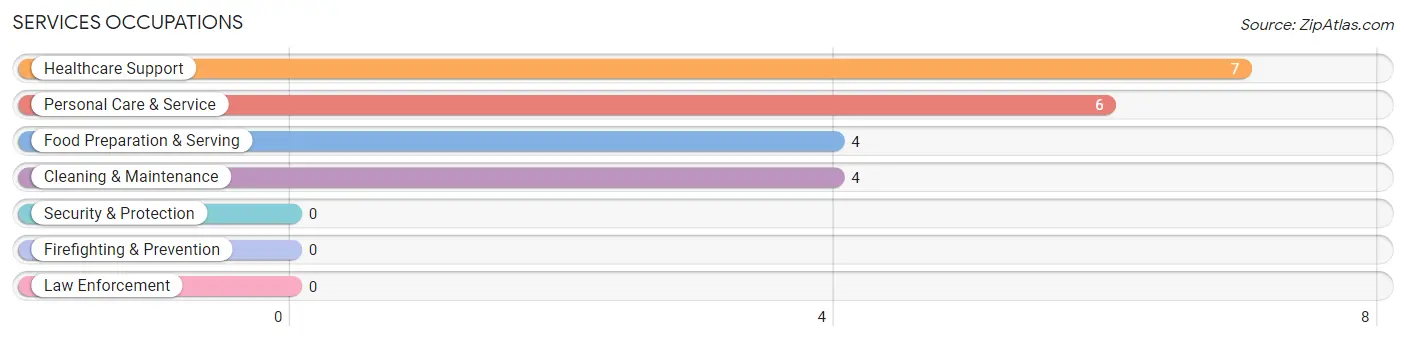
Services Occupations
The most common Services occupations in Caryville are Healthcare Support (7 | 6.1%), Personal Care & Service (6 | 5.3%), Food Preparation & Serving (4 | 3.5%), and Cleaning & Maintenance (4 | 3.5%).
Services Occupations by Sex
Within the Services occupations in Caryville, the most male-oriented occupations are Personal Care & Service (100.0%), and Food Preparation & Serving (75.0%), while the most female-oriented occupations are Healthcare Support (100.0%), Cleaning & Maintenance (100.0%), and Food Preparation & Serving (25.0%).
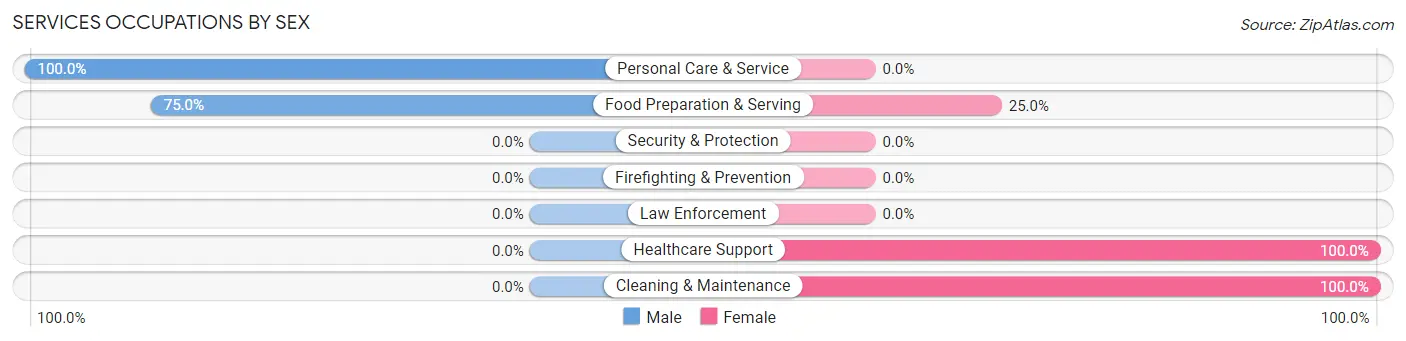
| Occupation | Male | Female |
| Healthcare Support | 0 (0.0%) | 7 (100.0%) |
| Security & Protection | 0 (0.0%) | 0 (0.0%) |
| Firefighting & Prevention | 0 (0.0%) | 0 (0.0%) |
| Law Enforcement | 0 (0.0%) | 0 (0.0%) |
| Food Preparation & Serving | 3 (75.0%) | 1 (25.0%) |
| Cleaning & Maintenance | 0 (0.0%) | 4 (100.0%) |
| Personal Care & Service | 6 (100.0%) | 0 (0.0%) |
| Total (Category) | 9 (42.9%) | 12 (57.1%) |
| Total (Overall) | 67 (58.8%) | 47 (41.2%) |
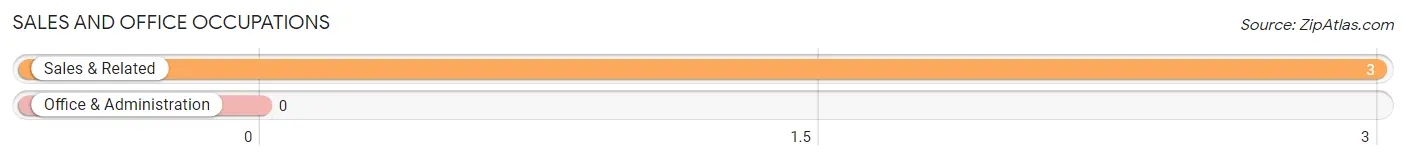
Sales and Office Occupations
The most common Sales and Office occupations in Caryville are , and Sales & Related (3 | 2.6%).
Sales and Office Occupations by Sex
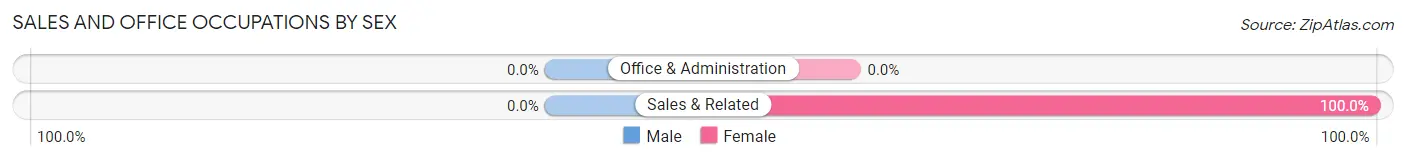
| Occupation | Male | Female |
| Sales & Related | 0 (0.0%) | 3 (100.0%) |
| Office & Administration | 0 (0.0%) | 0 (0.0%) |
| Total (Category) | 0 (0.0%) | 3 (100.0%) |
| Total (Overall) | 67 (58.8%) | 47 (41.2%) |
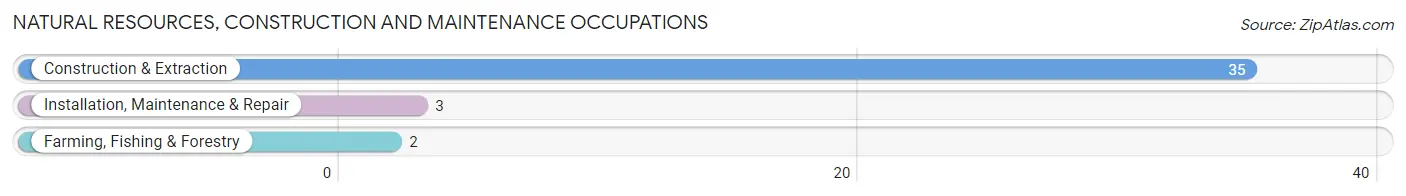
Natural Resources, Construction and Maintenance Occupations
The most common Natural Resources, Construction and Maintenance occupations in Caryville are Construction & Extraction (35 | 30.7%), Installation, Maintenance & Repair (3 | 2.6%), and Farming, Fishing & Forestry (2 | 1.8%).
Natural Resources, Construction and Maintenance Occupations by Sex
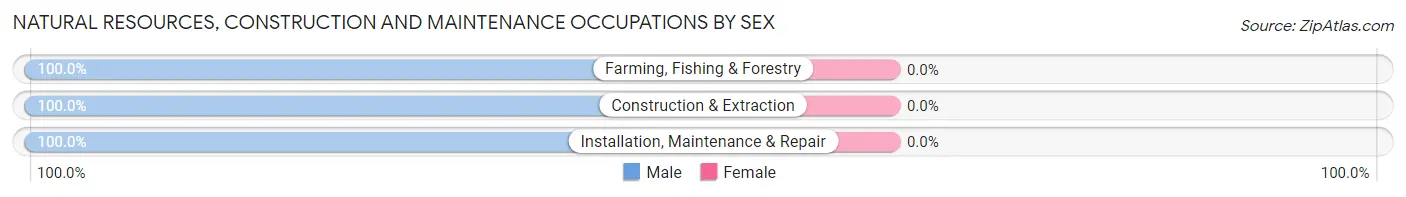
| Occupation | Male | Female |
| Farming, Fishing & Forestry | 2 (100.0%) | 0 (0.0%) |
| Construction & Extraction | 35 (100.0%) | 0 (0.0%) |
| Installation, Maintenance & Repair | 3 (100.0%) | 0 (0.0%) |
| Total (Category) | 40 (100.0%) | 0 (0.0%) |
| Total (Overall) | 67 (58.8%) | 47 (41.2%) |
Production, Transportation and Moving Occupations
The most common Production, Transportation and Moving occupations in Caryville are Material Moving (33 | 28.9%), Transportation (7 | 6.1%), and Production (2 | 1.8%).
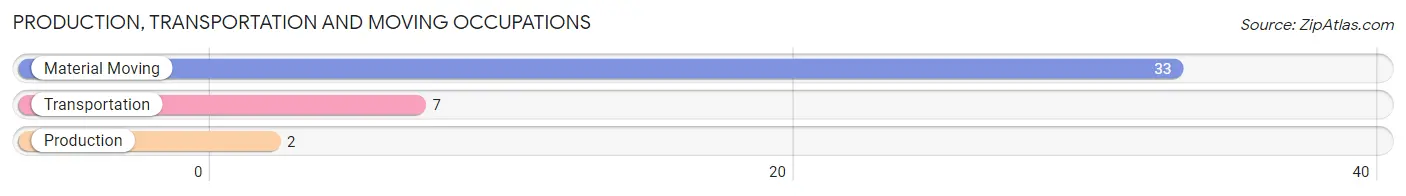
Production, Transportation and Moving Occupations by Sex

| Occupation | Male | Female |
| Production | 2 (100.0%) | 0 (0.0%) |
| Transportation | 7 (100.0%) | 0 (0.0%) |
| Material Moving | 4 (12.1%) | 29 (87.9%) |
| Total (Category) | 13 (30.9%) | 29 (69.1%) |
| Total (Overall) | 67 (58.8%) | 47 (41.2%) |
Employment Industries by Sex in Caryville
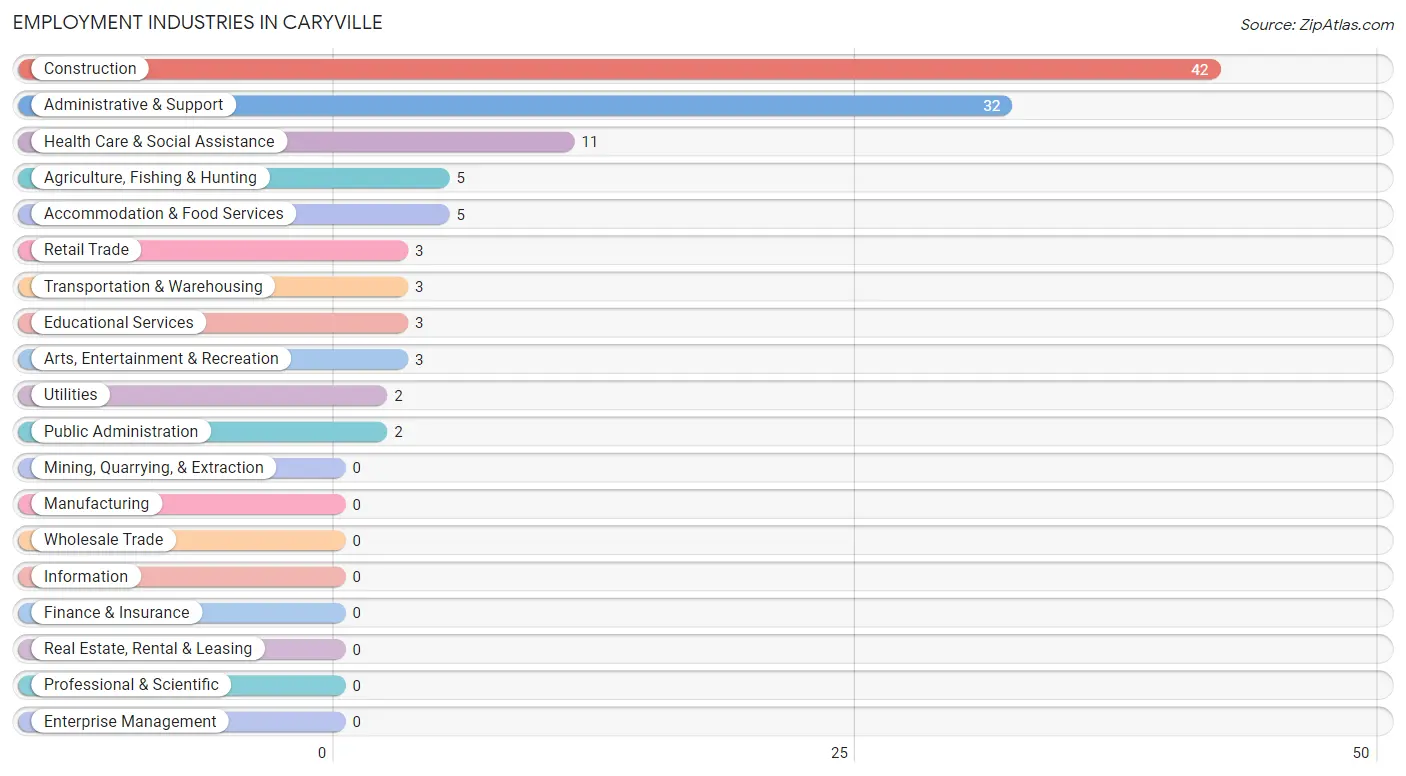
Employment Industries in Caryville
The major employment industries in Caryville include Construction (42 | 36.8%), Administrative & Support (32 | 28.1%), Health Care & Social Assistance (11 | 9.7%), Agriculture, Fishing & Hunting (5 | 4.4%), and Accommodation & Food Services (5 | 4.4%).
Employment Industries by Sex in Caryville
The Caryville industries that see more men than women are Agriculture, Fishing & Hunting (100.0%), Construction (100.0%), and Transportation & Warehousing (100.0%), whereas the industries that tend to have a higher number of women are Retail Trade (100.0%), Administrative & Support (100.0%), and Educational Services (100.0%).
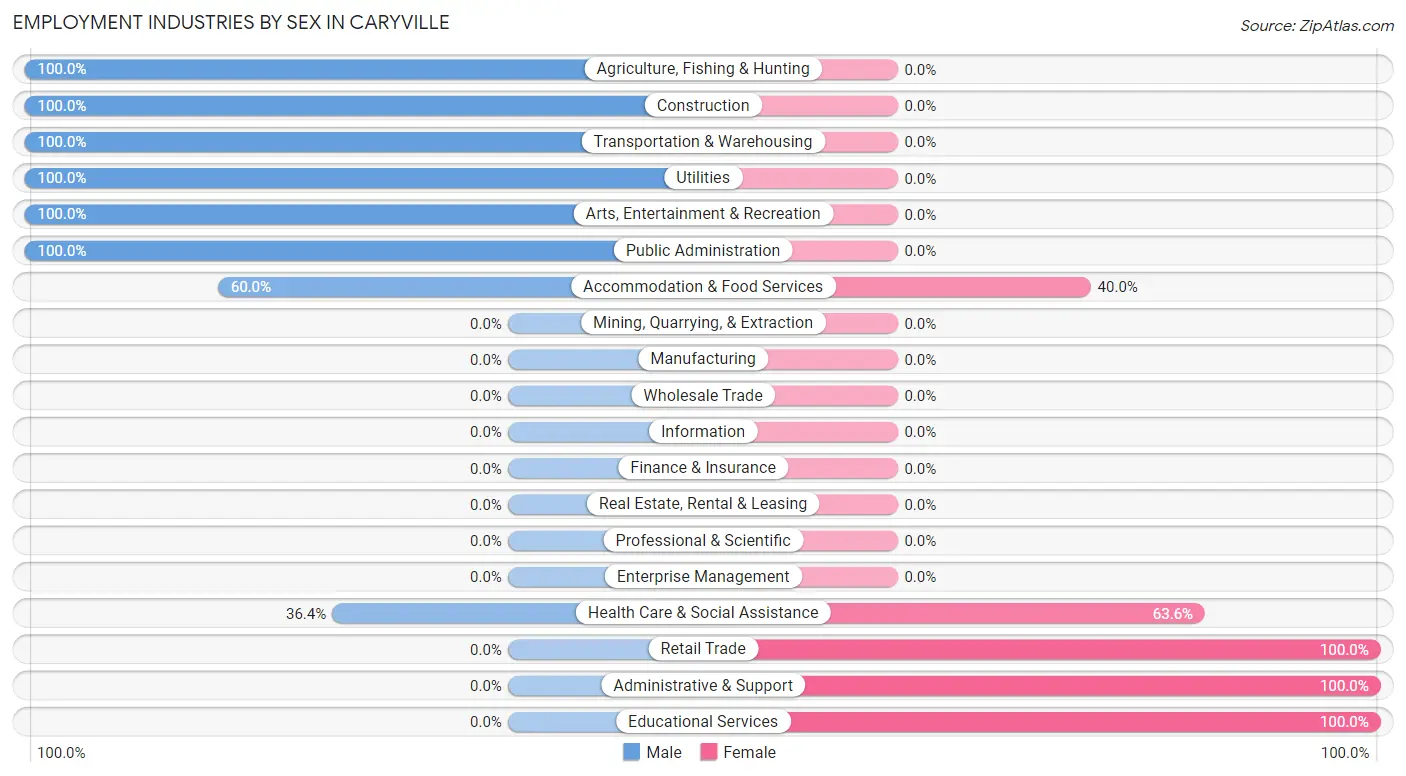
| Industry | Male | Female |
| Agriculture, Fishing & Hunting | 5 (100.0%) | 0 (0.0%) |
| Mining, Quarrying, & Extraction | 0 (0.0%) | 0 (0.0%) |
| Construction | 42 (100.0%) | 0 (0.0%) |
| Manufacturing | 0 (0.0%) | 0 (0.0%) |
| Wholesale Trade | 0 (0.0%) | 0 (0.0%) |
| Retail Trade | 0 (0.0%) | 3 (100.0%) |
| Transportation & Warehousing | 3 (100.0%) | 0 (0.0%) |
| Utilities | 2 (100.0%) | 0 (0.0%) |
| Information | 0 (0.0%) | 0 (0.0%) |
| Finance & Insurance | 0 (0.0%) | 0 (0.0%) |
| Real Estate, Rental & Leasing | 0 (0.0%) | 0 (0.0%) |
| Professional & Scientific | 0 (0.0%) | 0 (0.0%) |
| Enterprise Management | 0 (0.0%) | 0 (0.0%) |
| Administrative & Support | 0 (0.0%) | 32 (100.0%) |
| Educational Services | 0 (0.0%) | 3 (100.0%) |
| Health Care & Social Assistance | 4 (36.4%) | 7 (63.6%) |
| Arts, Entertainment & Recreation | 3 (100.0%) | 0 (0.0%) |
| Accommodation & Food Services | 3 (60.0%) | 2 (40.0%) |
| Public Administration | 2 (100.0%) | 0 (0.0%) |
| Total | 67 (58.8%) | 47 (41.2%) |
Education in Caryville
School Enrollment in Caryville
The most common levels of schooling among the 48 students in Caryville are elementary school (20 | 41.7%), middle school (15 | 31.2%), and kindergarten (8 | 16.7%).
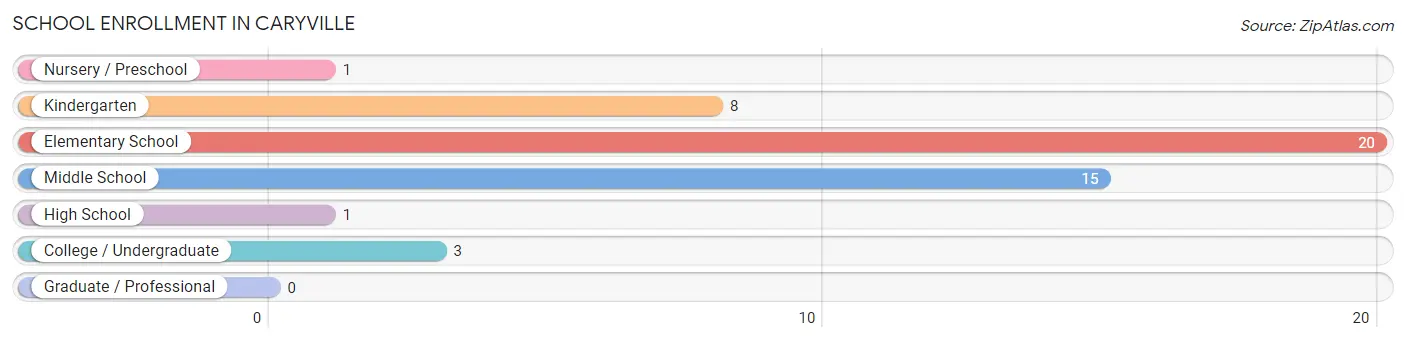
| School Level | # Students | % Students |
| Nursery / Preschool | 1 | 2.1% |
| Kindergarten | 8 | 16.7% |
| Elementary School | 20 | 41.7% |
| Middle School | 15 | 31.2% |
| High School | 1 | 2.1% |
| College / Undergraduate | 3 | 6.2% |
| Graduate / Professional | 0 | 0.0% |
| Total | 48 | 100.0% |
School Enrollment by Age by Funding Source in Caryville
Out of a total of 48 students who are enrolled in schools in Caryville, 4 (8.3%) attend a private institution, while the remaining 44 (91.7%) are enrolled in public schools. The age group of 10 to 14 year olds has the highest likelihood of being enrolled in private schools, with 3 (15.8% in the age bracket) enrolled. Conversely, the age group of 15 to 17 year olds has the lowest likelihood of being enrolled in a private school, with 2 (100.0% in the age bracket) attending a public institution.
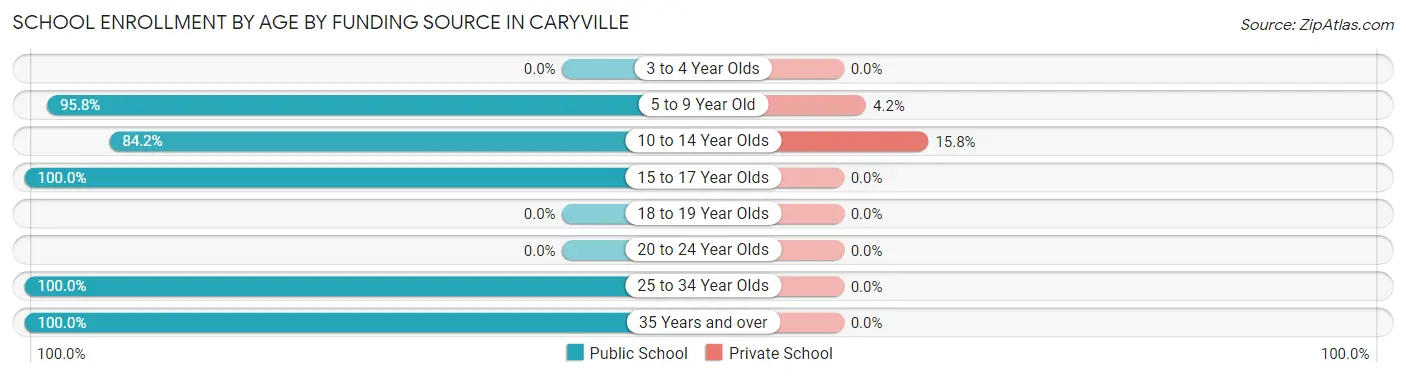
| Age Bracket | Public School | Private School |
| 3 to 4 Year Olds | 0 (0.0%) | 0 (0.0%) |
| 5 to 9 Year Old | 23 (95.8%) | 1 (4.2%) |
| 10 to 14 Year Olds | 16 (84.2%) | 3 (15.8%) |
| 15 to 17 Year Olds | 2 (100.0%) | 0 (0.0%) |
| 18 to 19 Year Olds | 0 (0.0%) | 0 (0.0%) |
| 20 to 24 Year Olds | 0 (0.0%) | 0 (0.0%) |
| 25 to 34 Year Olds | 2 (100.0%) | 0 (0.0%) |
| 35 Years and over | 1 (100.0%) | 0 (0.0%) |
| Total | 44 (91.7%) | 4 (8.3%) |
Educational Attainment by Field of Study in Caryville
Business (6 | 75.0%), and education (2 | 25.0%) are the most common fields of study among 8 individuals in Caryville who have obtained a bachelor's degree or higher.
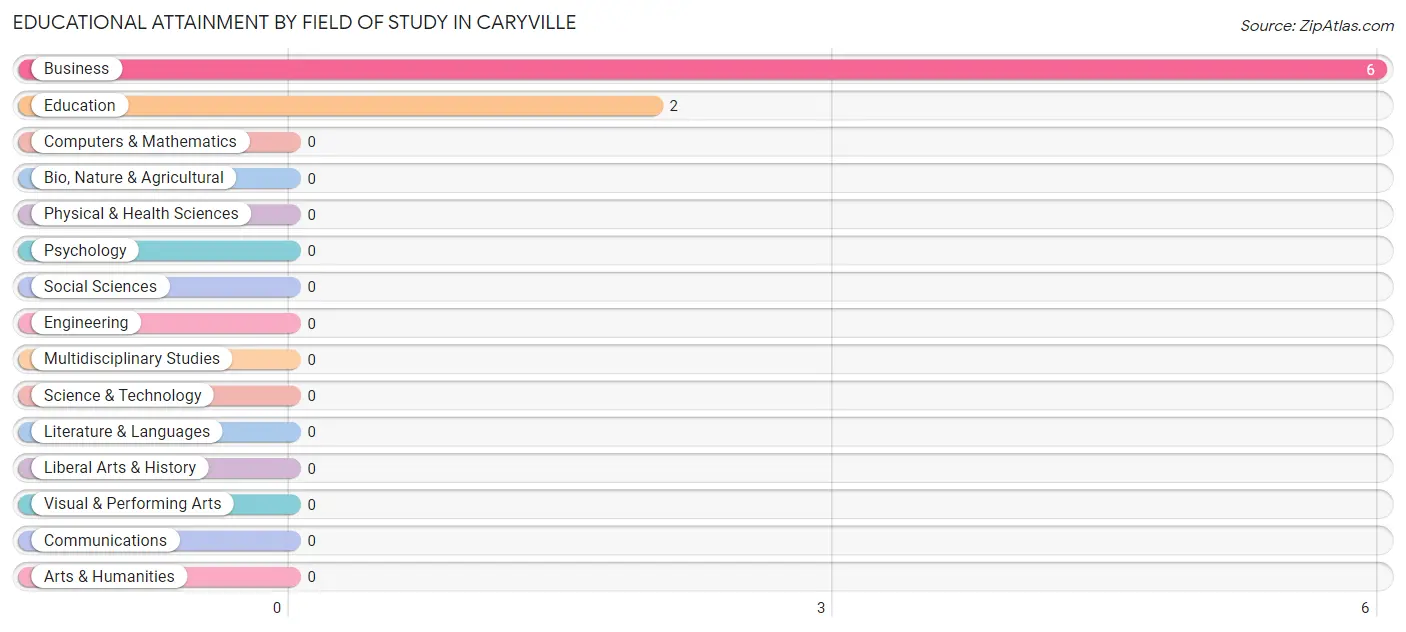
| Field of Study | # Graduates | % Graduates |
| Computers & Mathematics | 0 | 0.0% |
| Bio, Nature & Agricultural | 0 | 0.0% |
| Physical & Health Sciences | 0 | 0.0% |
| Psychology | 0 | 0.0% |
| Social Sciences | 0 | 0.0% |
| Engineering | 0 | 0.0% |
| Multidisciplinary Studies | 0 | 0.0% |
| Science & Technology | 0 | 0.0% |
| Business | 6 | 75.0% |
| Education | 2 | 25.0% |
| Literature & Languages | 0 | 0.0% |
| Liberal Arts & History | 0 | 0.0% |
| Visual & Performing Arts | 0 | 0.0% |
| Communications | 0 | 0.0% |
| Arts & Humanities | 0 | 0.0% |
| Total | 8 | 100.0% |
Transportation & Commute in Caryville
Vehicle Availability by Sex in Caryville
The most prevalent vehicle ownership categories in Caryville are males with 1 vehicle (33, accounting for 49.2%) and females with 1 vehicle (32, making up 70.2%).
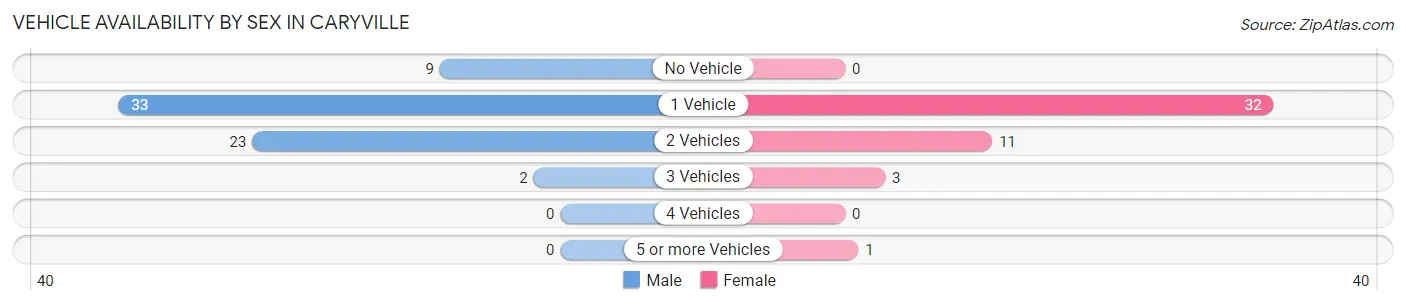
| Vehicles Available | Male | Female |
| No Vehicle | 9 (13.4%) | 0 (0.0%) |
| 1 Vehicle | 33 (49.2%) | 32 (68.1%) |
| 2 Vehicles | 23 (34.3%) | 11 (23.4%) |
| 3 Vehicles | 2 (3.0%) | 3 (6.4%) |
| 4 Vehicles | 0 (0.0%) | 0 (0.0%) |
| 5 or more Vehicles | 0 (0.0%) | 1 (2.1%) |
| Total | 67 (100.0%) | 47 (100.0%) |
Commute Time in Caryville
The most frequently occuring commute durations in Caryville are 60 to 89 minutes (62 commuters, 54.4%), 20 to 24 minutes (14 commuters, 12.3%), and 30 to 34 minutes (14 commuters, 12.3%).
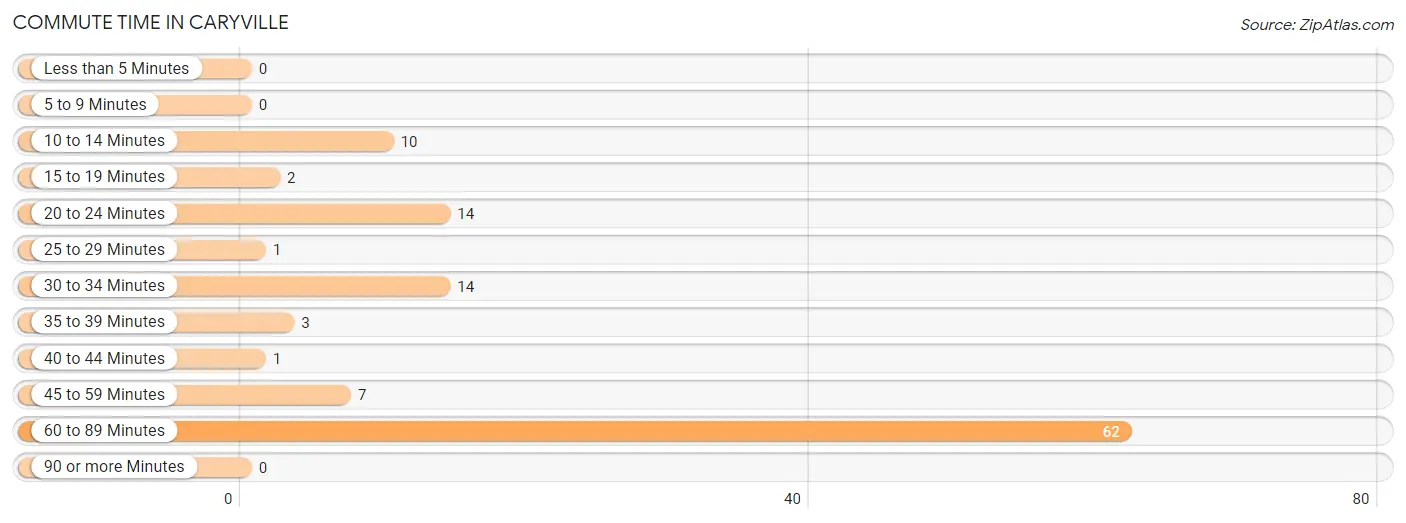
| Commute Time | # Commuters | % Commuters |
| Less than 5 Minutes | 0 | 0.0% |
| 5 to 9 Minutes | 0 | 0.0% |
| 10 to 14 Minutes | 10 | 8.8% |
| 15 to 19 Minutes | 2 | 1.8% |
| 20 to 24 Minutes | 14 | 12.3% |
| 25 to 29 Minutes | 1 | 0.9% |
| 30 to 34 Minutes | 14 | 12.3% |
| 35 to 39 Minutes | 3 | 2.6% |
| 40 to 44 Minutes | 1 | 0.9% |
| 45 to 59 Minutes | 7 | 6.1% |
| 60 to 89 Minutes | 62 | 54.4% |
| 90 or more Minutes | 0 | 0.0% |
Commute Time by Sex in Caryville
The most common commute times in Caryville are 60 to 89 minutes (33 commuters, 49.2%) for males and 60 to 89 minutes (29 commuters, 61.7%) for females.
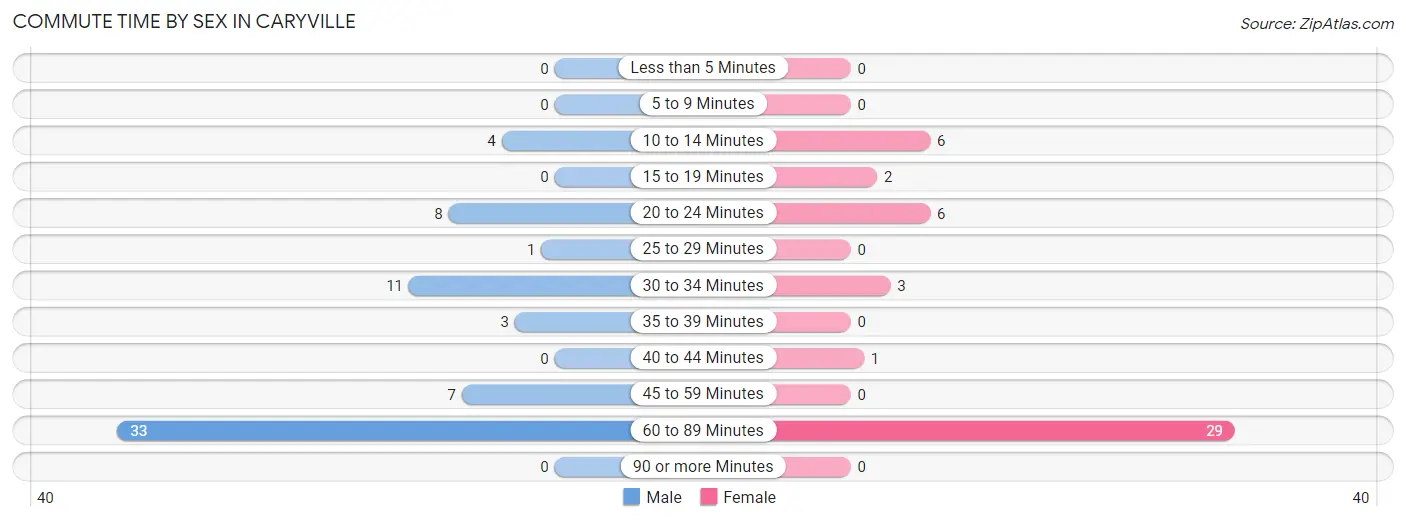
| Commute Time | Male | Female |
| Less than 5 Minutes | 0 (0.0%) | 0 (0.0%) |
| 5 to 9 Minutes | 0 (0.0%) | 0 (0.0%) |
| 10 to 14 Minutes | 4 (6.0%) | 6 (12.8%) |
| 15 to 19 Minutes | 0 (0.0%) | 2 (4.3%) |
| 20 to 24 Minutes | 8 (11.9%) | 6 (12.8%) |
| 25 to 29 Minutes | 1 (1.5%) | 0 (0.0%) |
| 30 to 34 Minutes | 11 (16.4%) | 3 (6.4%) |
| 35 to 39 Minutes | 3 (4.5%) | 0 (0.0%) |
| 40 to 44 Minutes | 0 (0.0%) | 1 (2.1%) |
| 45 to 59 Minutes | 7 (10.4%) | 0 (0.0%) |
| 60 to 89 Minutes | 33 (49.2%) | 29 (61.7%) |
| 90 or more Minutes | 0 (0.0%) | 0 (0.0%) |
Time of Departure to Work by Sex in Caryville
The most frequent times of departure to work in Caryville are 5:30 AM to 5:59 AM (33, 49.2%) for males and 6:30 AM to 6:59 AM (36, 76.6%) for females.
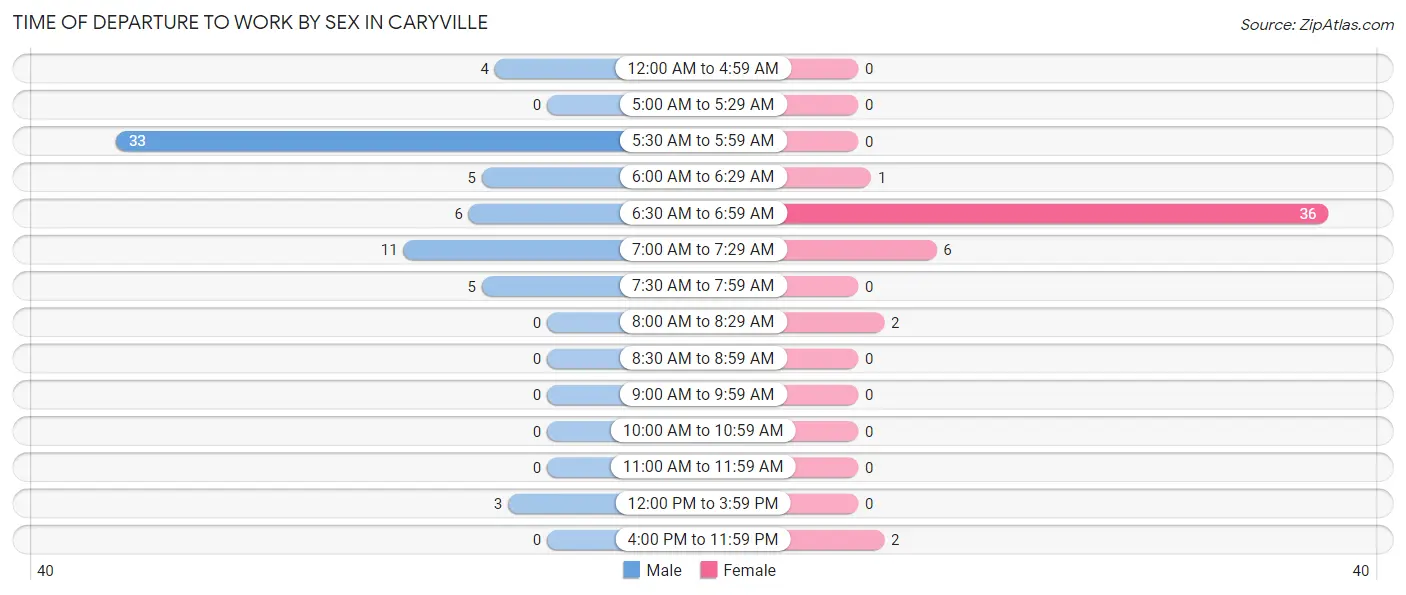
| Time of Departure | Male | Female |
| 12:00 AM to 4:59 AM | 4 (6.0%) | 0 (0.0%) |
| 5:00 AM to 5:29 AM | 0 (0.0%) | 0 (0.0%) |
| 5:30 AM to 5:59 AM | 33 (49.2%) | 0 (0.0%) |
| 6:00 AM to 6:29 AM | 5 (7.5%) | 1 (2.1%) |
| 6:30 AM to 6:59 AM | 6 (9.0%) | 36 (76.6%) |
| 7:00 AM to 7:29 AM | 11 (16.4%) | 6 (12.8%) |
| 7:30 AM to 7:59 AM | 5 (7.5%) | 0 (0.0%) |
| 8:00 AM to 8:29 AM | 0 (0.0%) | 2 (4.3%) |
| 8:30 AM to 8:59 AM | 0 (0.0%) | 0 (0.0%) |
| 9:00 AM to 9:59 AM | 0 (0.0%) | 0 (0.0%) |
| 10:00 AM to 10:59 AM | 0 (0.0%) | 0 (0.0%) |
| 11:00 AM to 11:59 AM | 0 (0.0%) | 0 (0.0%) |
| 12:00 PM to 3:59 PM | 3 (4.5%) | 0 (0.0%) |
| 4:00 PM to 11:59 PM | 0 (0.0%) | 2 (4.3%) |
| Total | 67 (100.0%) | 47 (100.0%) |
Housing Occupancy in Caryville
Occupancy by Ownership in Caryville
Of the total 93 dwellings in Caryville, owner-occupied units account for 41 (44.1%), while renter-occupied units make up 52 (55.9%).
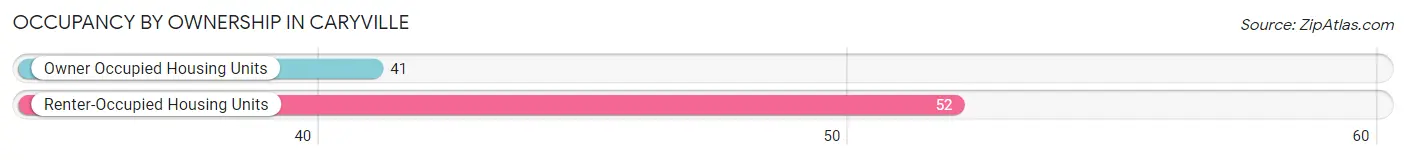
| Occupancy | # Housing Units | % Housing Units |
| Owner Occupied Housing Units | 41 | 44.1% |
| Renter-Occupied Housing Units | 52 | 55.9% |
| Total Occupied Housing Units | 93 | 100.0% |
Occupancy by Household Size in Caryville
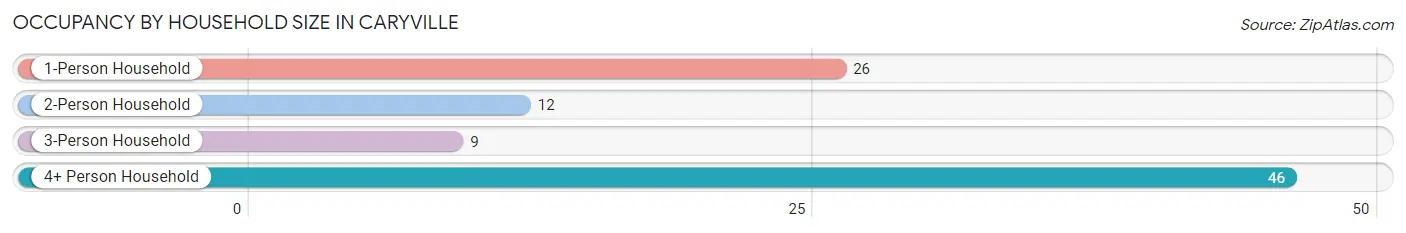
| Household Size | # Housing Units | % Housing Units |
| 1-Person Household | 26 | 28.0% |
| 2-Person Household | 12 | 12.9% |
| 3-Person Household | 9 | 9.7% |
| 4+ Person Household | 46 | 49.5% |
| Total Housing Units | 93 | 100.0% |
Occupancy by Ownership by Household Size in Caryville
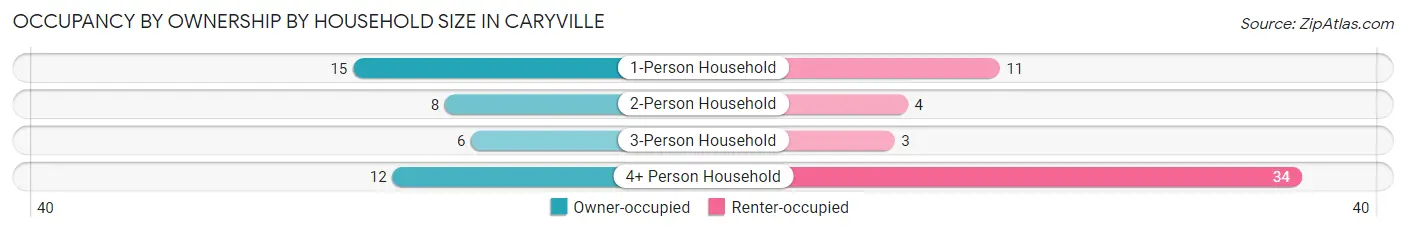
| Household Size | Owner-occupied | Renter-occupied |
| 1-Person Household | 15 (57.7%) | 11 (42.3%) |
| 2-Person Household | 8 (66.7%) | 4 (33.3%) |
| 3-Person Household | 6 (66.7%) | 3 (33.3%) |
| 4+ Person Household | 12 (26.1%) | 34 (73.9%) |
| Total Housing Units | 41 (44.1%) | 52 (55.9%) |
Occupancy by Educational Attainment in Caryville
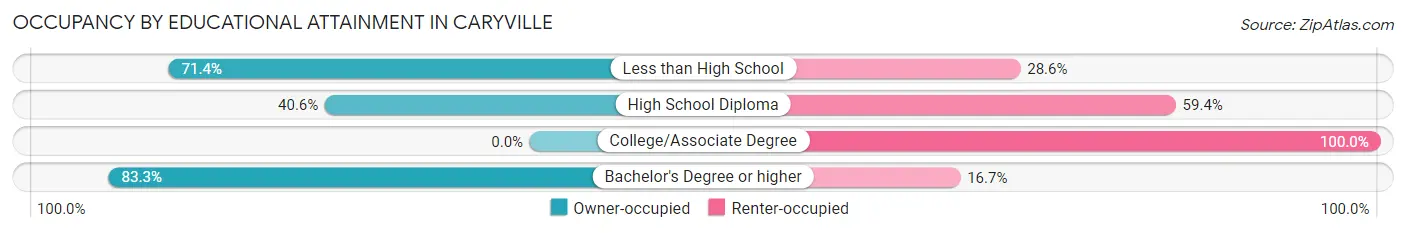
| Household Size | Owner-occupied | Renter-occupied |
| Less than High School | 10 (71.4%) | 4 (28.6%) |
| High School Diploma | 26 (40.6%) | 38 (59.4%) |
| College/Associate Degree | 0 (0.0%) | 9 (100.0%) |
| Bachelor's Degree or higher | 5 (83.3%) | 1 (16.7%) |
Occupancy by Age of Householder in Caryville
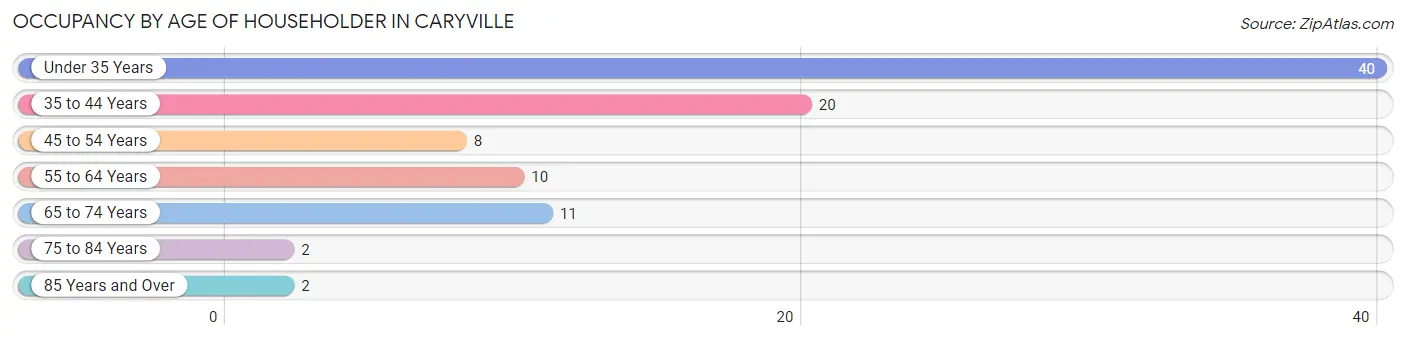
| Age Bracket | # Households | % Households |
| Under 35 Years | 40 | 43.0% |
| 35 to 44 Years | 20 | 21.5% |
| 45 to 54 Years | 8 | 8.6% |
| 55 to 64 Years | 10 | 10.7% |
| 65 to 74 Years | 11 | 11.8% |
| 75 to 84 Years | 2 | 2.1% |
| 85 Years and Over | 2 | 2.1% |
| Total | 93 | 100.0% |
Housing Finances in Caryville
Median Income by Occupancy in Caryville
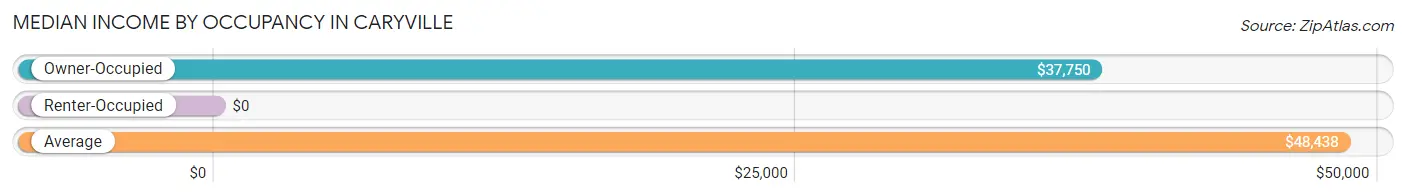
| Occupancy Type | # Households | Median Income |
| Owner-Occupied | 41 (44.1%) | $37,750 |
| Renter-Occupied | 52 (55.9%) | $0 |
| Average | 93 (100.0%) | $48,438 |
Occupancy by Householder Income Bracket in Caryville
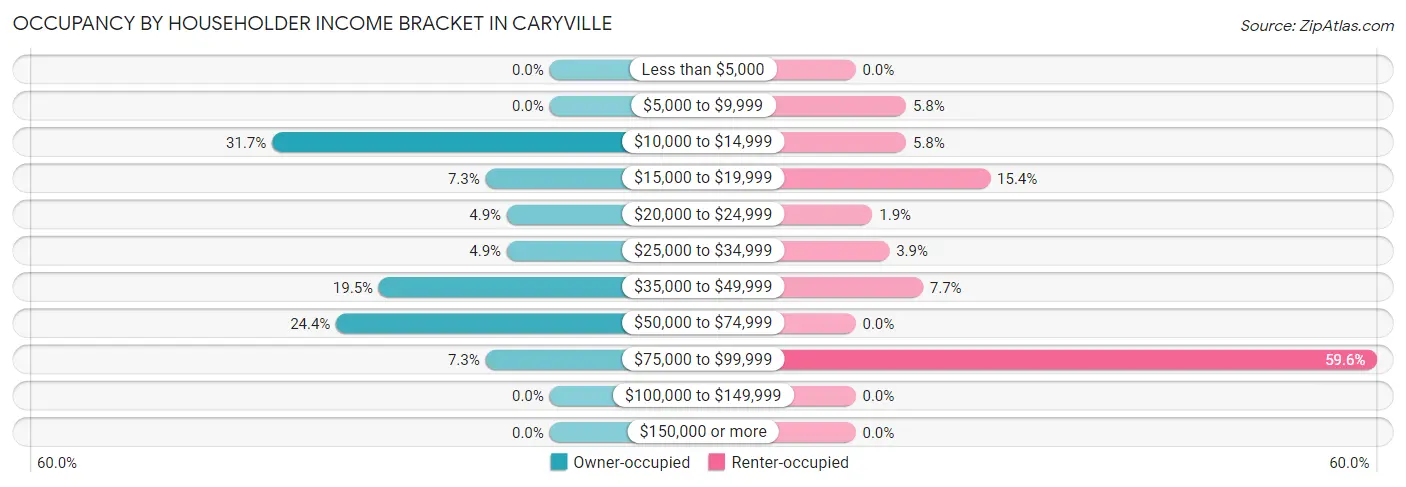
| Income Bracket | Owner-occupied | Renter-occupied |
| Less than $5,000 | 0 (0.0%) | 0 (0.0%) |
| $5,000 to $9,999 | 0 (0.0%) | 3 (5.8%) |
| $10,000 to $14,999 | 13 (31.7%) | 3 (5.8%) |
| $15,000 to $19,999 | 3 (7.3%) | 8 (15.4%) |
| $20,000 to $24,999 | 2 (4.9%) | 1 (1.9%) |
| $25,000 to $34,999 | 2 (4.9%) | 2 (3.8%) |
| $35,000 to $49,999 | 8 (19.5%) | 4 (7.7%) |
| $50,000 to $74,999 | 10 (24.4%) | 0 (0.0%) |
| $75,000 to $99,999 | 3 (7.3%) | 31 (59.6%) |
| $100,000 to $149,999 | 0 (0.0%) | 0 (0.0%) |
| $150,000 or more | 0 (0.0%) | 0 (0.0%) |
| Total | 41 (100.0%) | 52 (100.0%) |
Monthly Housing Cost Tiers in Caryville
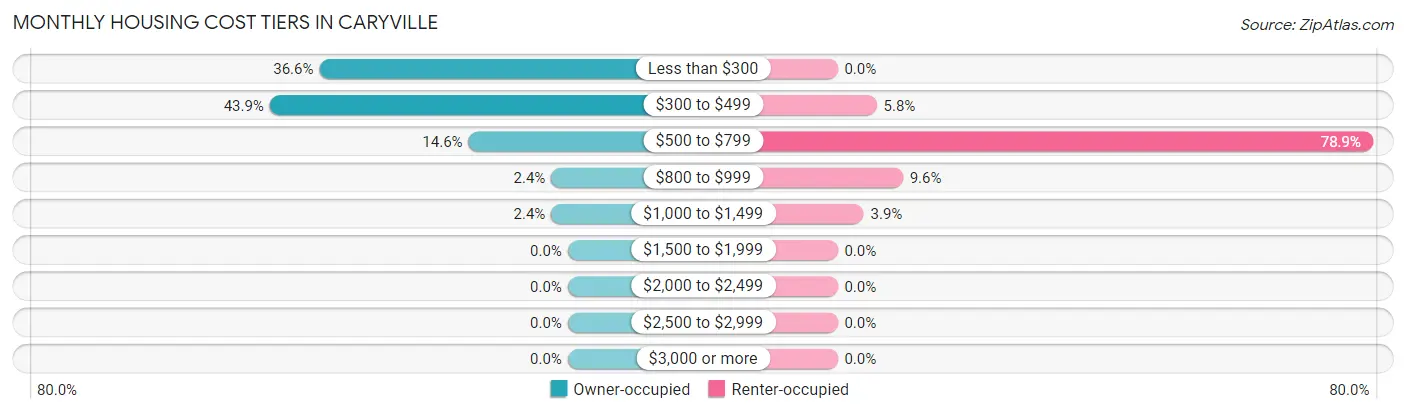
| Monthly Cost | Owner-occupied | Renter-occupied |
| Less than $300 | 15 (36.6%) | 0 (0.0%) |
| $300 to $499 | 18 (43.9%) | 3 (5.8%) |
| $500 to $799 | 6 (14.6%) | 41 (78.8%) |
| $800 to $999 | 1 (2.4%) | 5 (9.6%) |
| $1,000 to $1,499 | 1 (2.4%) | 2 (3.8%) |
| $1,500 to $1,999 | 0 (0.0%) | 0 (0.0%) |
| $2,000 to $2,499 | 0 (0.0%) | 0 (0.0%) |
| $2,500 to $2,999 | 0 (0.0%) | 0 (0.0%) |
| $3,000 or more | 0 (0.0%) | 0 (0.0%) |
| Total | 41 (100.0%) | 52 (100.0%) |
Physical Housing Characteristics in Caryville
Housing Structures in Caryville
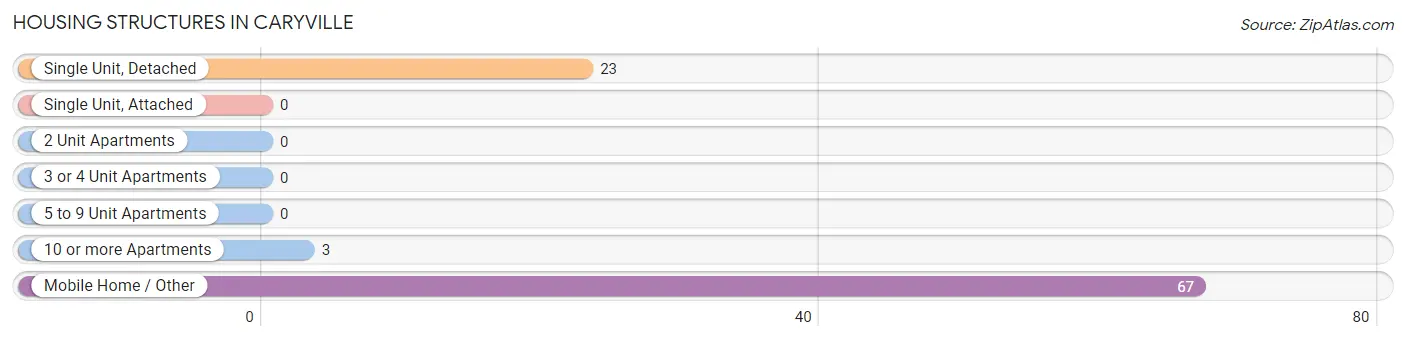
| Structure Type | # Housing Units | % Housing Units |
| Single Unit, Detached | 23 | 24.7% |
| Single Unit, Attached | 0 | 0.0% |
| 2 Unit Apartments | 0 | 0.0% |
| 3 or 4 Unit Apartments | 0 | 0.0% |
| 5 to 9 Unit Apartments | 0 | 0.0% |
| 10 or more Apartments | 3 | 3.2% |
| Mobile Home / Other | 67 | 72.0% |
| Total | 93 | 100.0% |
Housing Structures by Occupancy in Caryville
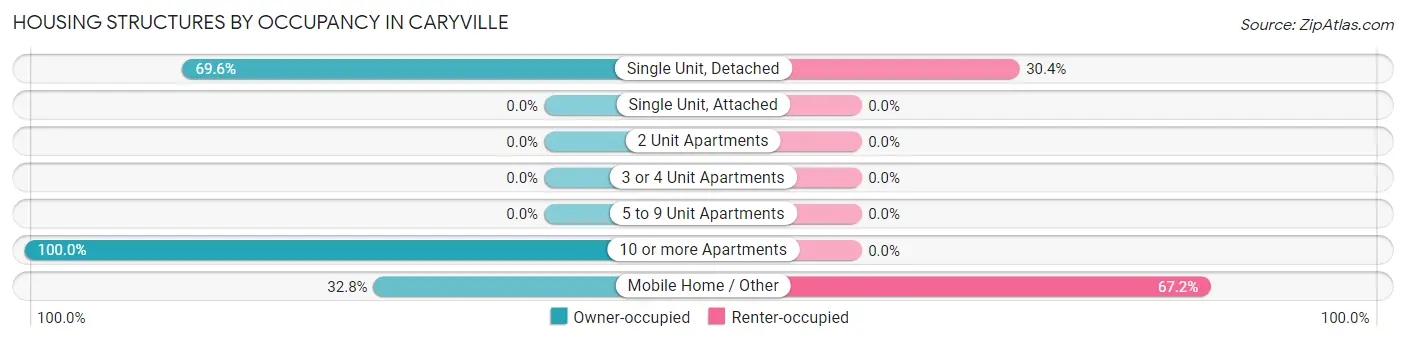
| Structure Type | Owner-occupied | Renter-occupied |
| Single Unit, Detached | 16 (69.6%) | 7 (30.4%) |
| Single Unit, Attached | 0 (0.0%) | 0 (0.0%) |
| 2 Unit Apartments | 0 (0.0%) | 0 (0.0%) |
| 3 or 4 Unit Apartments | 0 (0.0%) | 0 (0.0%) |
| 5 to 9 Unit Apartments | 0 (0.0%) | 0 (0.0%) |
| 10 or more Apartments | 3 (100.0%) | 0 (0.0%) |
| Mobile Home / Other | 22 (32.8%) | 45 (67.2%) |
| Total | 41 (44.1%) | 52 (55.9%) |
Housing Structures by Number of Rooms in Caryville
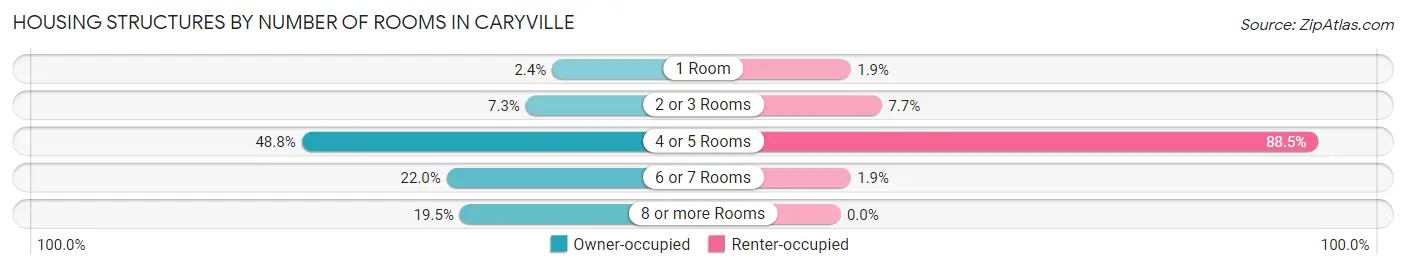
| Number of Rooms | Owner-occupied | Renter-occupied |
| 1 Room | 1 (2.4%) | 1 (1.9%) |
| 2 or 3 Rooms | 3 (7.3%) | 4 (7.7%) |
| 4 or 5 Rooms | 20 (48.8%) | 46 (88.5%) |
| 6 or 7 Rooms | 9 (22.0%) | 1 (1.9%) |
| 8 or more Rooms | 8 (19.5%) | 0 (0.0%) |
| Total | 41 (100.0%) | 52 (100.0%) |
Housing Structure by Heating Type in Caryville
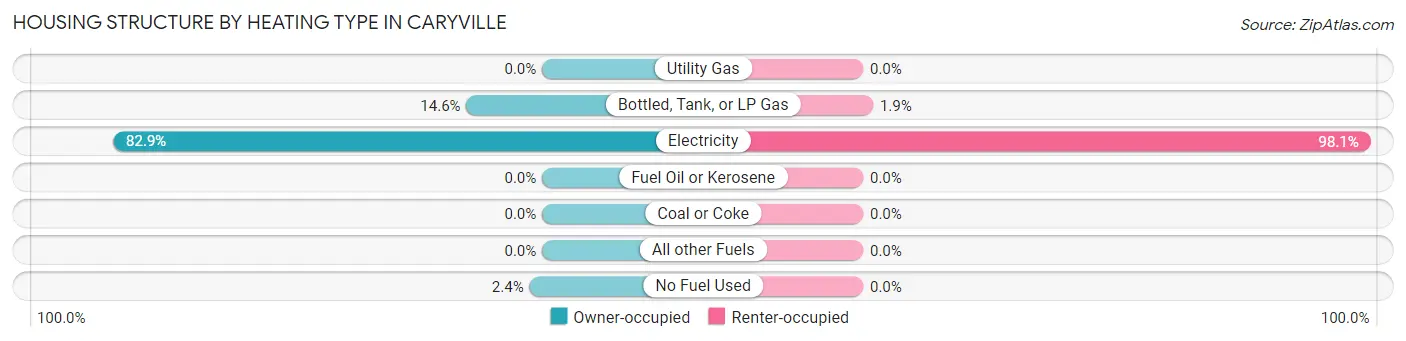
| Heating Type | Owner-occupied | Renter-occupied |
| Utility Gas | 0 (0.0%) | 0 (0.0%) |
| Bottled, Tank, or LP Gas | 6 (14.6%) | 1 (1.9%) |
| Electricity | 34 (82.9%) | 51 (98.1%) |
| Fuel Oil or Kerosene | 0 (0.0%) | 0 (0.0%) |
| Coal or Coke | 0 (0.0%) | 0 (0.0%) |
| All other Fuels | 0 (0.0%) | 0 (0.0%) |
| No Fuel Used | 1 (2.4%) | 0 (0.0%) |
| Total | 41 (100.0%) | 52 (100.0%) |
Household Vehicle Usage in Caryville
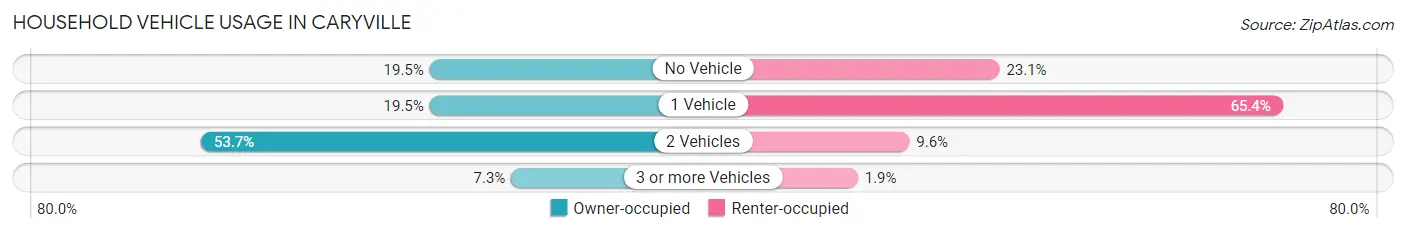
| Vehicles per Household | Owner-occupied | Renter-occupied |
| No Vehicle | 8 (19.5%) | 12 (23.1%) |
| 1 Vehicle | 8 (19.5%) | 34 (65.4%) |
| 2 Vehicles | 22 (53.7%) | 5 (9.6%) |
| 3 or more Vehicles | 3 (7.3%) | 1 (1.9%) |
| Total | 41 (100.0%) | 52 (100.0%) |
Real Estate & Mortgages in Caryville
Real Estate and Mortgage Overview in Caryville
| Characteristic | Without Mortgage | With Mortgage |
| Housing Units | 37 | 4 |
| Median Property Value | - | - |
| Median Household Income | - | - |
| Monthly Housing Costs | $363 | $0 |
| Real Estate Taxes | $429 | $0 |
Property Value by Mortgage Status in Caryville
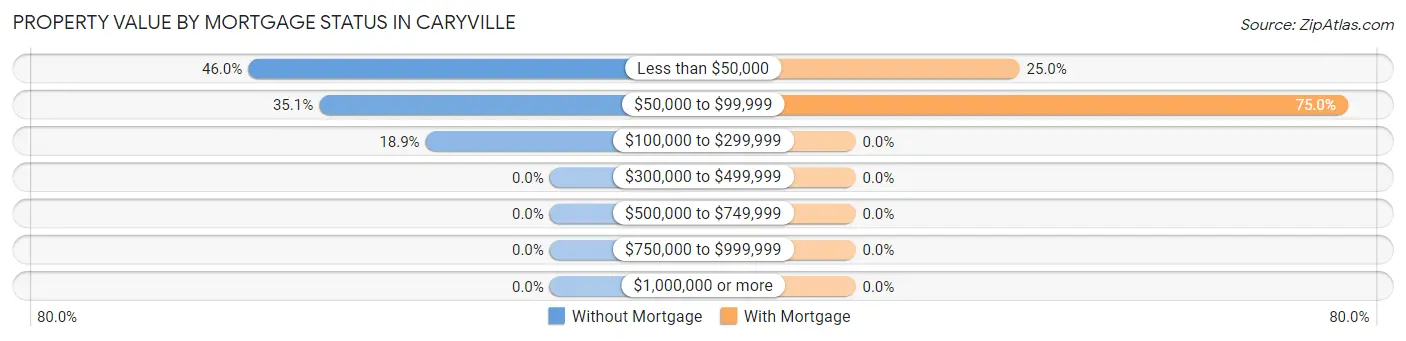
| Property Value | Without Mortgage | With Mortgage |
| Less than $50,000 | 17 (46.0%) | 1 (25.0%) |
| $50,000 to $99,999 | 13 (35.1%) | 3 (75.0%) |
| $100,000 to $299,999 | 7 (18.9%) | 0 (0.0%) |
| $300,000 to $499,999 | 0 (0.0%) | 0 (0.0%) |
| $500,000 to $749,999 | 0 (0.0%) | 0 (0.0%) |
| $750,000 to $999,999 | 0 (0.0%) | 0 (0.0%) |
| $1,000,000 or more | 0 (0.0%) | 0 (0.0%) |
| Total | 37 (100.0%) | 4 (100.0%) |
Household Income by Mortgage Status in Caryville
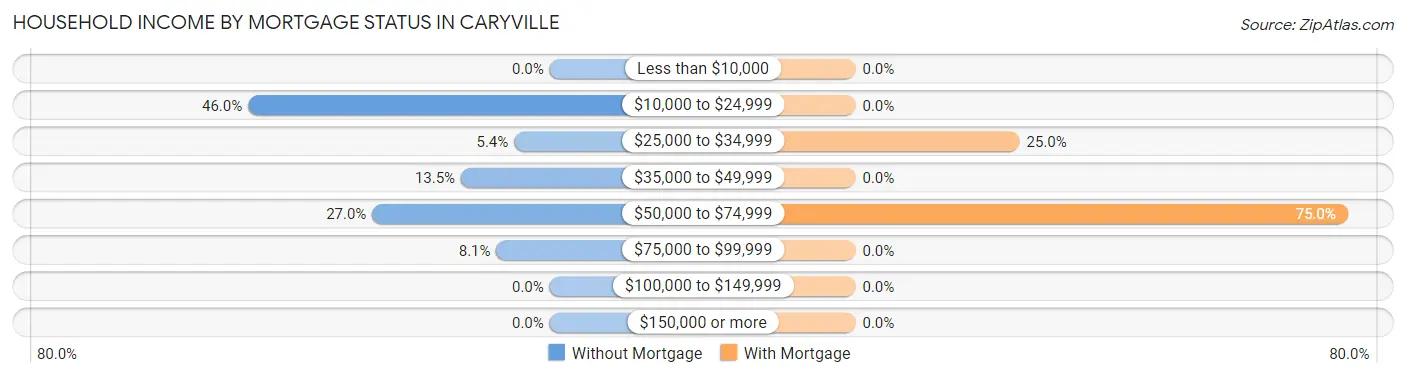
| Household Income | Without Mortgage | With Mortgage |
| Less than $10,000 | 0 (0.0%) | 0 (0.0%) |
| $10,000 to $24,999 | 17 (46.0%) | 0 (0.0%) |
| $25,000 to $34,999 | 2 (5.4%) | 1 (25.0%) |
| $35,000 to $49,999 | 5 (13.5%) | 0 (0.0%) |
| $50,000 to $74,999 | 10 (27.0%) | 3 (75.0%) |
| $75,000 to $99,999 | 3 (8.1%) | 0 (0.0%) |
| $100,000 to $149,999 | 0 (0.0%) | 0 (0.0%) |
| $150,000 or more | 0 (0.0%) | 0 (0.0%) |
| Total | 37 (100.0%) | 4 (100.0%) |
Property Value to Household Income Ratio in Caryville
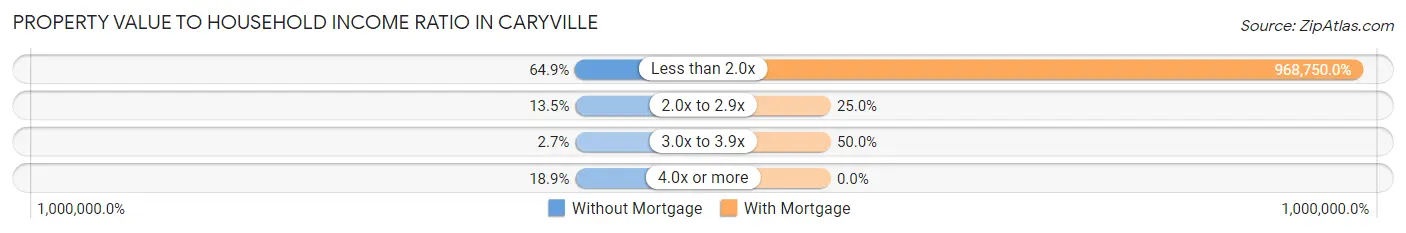
| Value-to-Income Ratio | Without Mortgage | With Mortgage |
| Less than 2.0x | 24 (64.9%) | 38,750 (968,750.0%) |
| 2.0x to 2.9x | 5 (13.5%) | 1 (25.0%) |
| 3.0x to 3.9x | 1 (2.7%) | 2 (50.0%) |
| 4.0x or more | 7 (18.9%) | 0 (0.0%) |
| Total | 37 (100.0%) | 4 (100.0%) |
Real Estate Taxes by Mortgage Status in Caryville
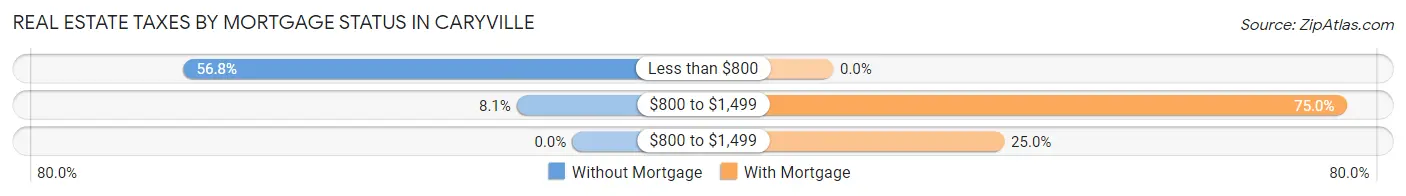
| Property Taxes | Without Mortgage | With Mortgage |
| Less than $800 | 21 (56.8%) | 0 (0.0%) |
| $800 to $1,499 | 3 (8.1%) | 3 (75.0%) |
| $800 to $1,499 | 0 (0.0%) | 1 (25.0%) |
| Total | 37 (100.0%) | 4 (100.0%) |
Health & Disability in Caryville
Health Insurance Coverage by Age in Caryville
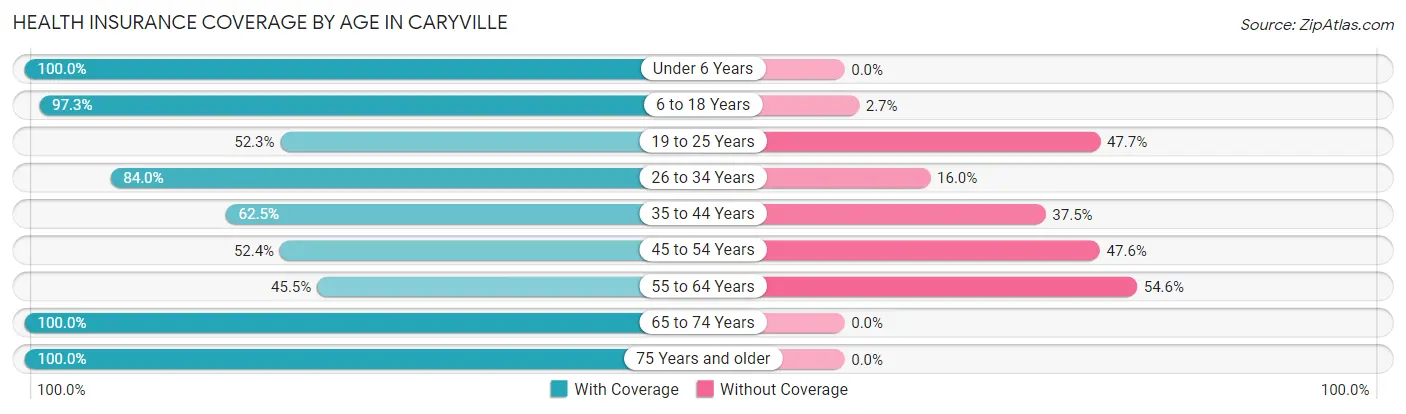
| Age Bracket | With Coverage | Without Coverage |
| Under 6 Years | 29 (100.0%) | 0 (0.0%) |
| 6 to 18 Years | 36 (97.3%) | 1 (2.7%) |
| 19 to 25 Years | 34 (52.3%) | 31 (47.7%) |
| 26 to 34 Years | 42 (84.0%) | 8 (16.0%) |
| 35 to 44 Years | 20 (62.5%) | 12 (37.5%) |
| 45 to 54 Years | 11 (52.4%) | 10 (47.6%) |
| 55 to 64 Years | 5 (45.5%) | 6 (54.5%) |
| 65 to 74 Years | 18 (100.0%) | 0 (0.0%) |
| 75 Years and older | 6 (100.0%) | 0 (0.0%) |
| Total | 201 (74.7%) | 68 (25.3%) |
Health Insurance Coverage by Citizenship Status in Caryville
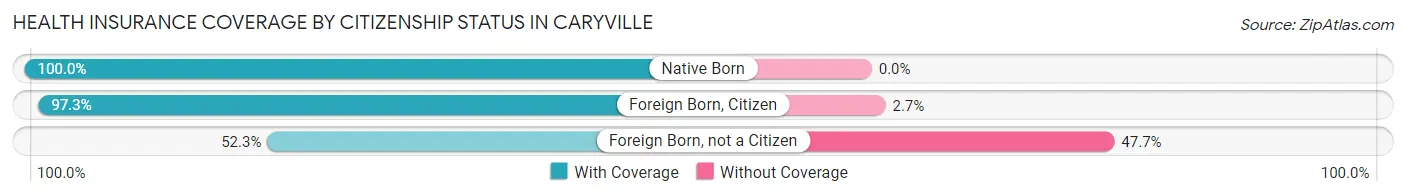
| Citizenship Status | With Coverage | Without Coverage |
| Native Born | 29 (100.0%) | 0 (0.0%) |
| Foreign Born, Citizen | 36 (97.3%) | 1 (2.7%) |
| Foreign Born, not a Citizen | 34 (52.3%) | 31 (47.7%) |
Health Insurance Coverage by Household Income in Caryville
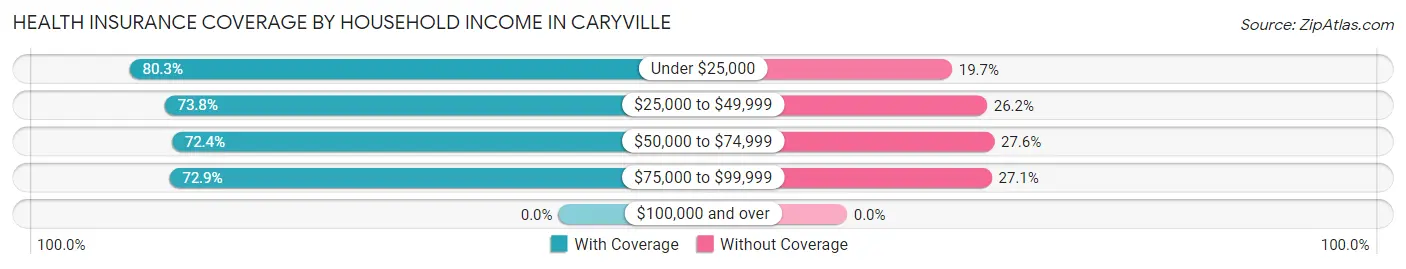
| Household Income | With Coverage | Without Coverage |
| Under $25,000 | 49 (80.3%) | 12 (19.7%) |
| $25,000 to $49,999 | 45 (73.8%) | 16 (26.2%) |
| $50,000 to $74,999 | 21 (72.4%) | 8 (27.6%) |
| $75,000 to $99,999 | 86 (72.9%) | 32 (27.1%) |
| $100,000 and over | 0 (0.0%) | 0 (0.0%) |
Public vs Private Health Insurance Coverage by Age in Caryville
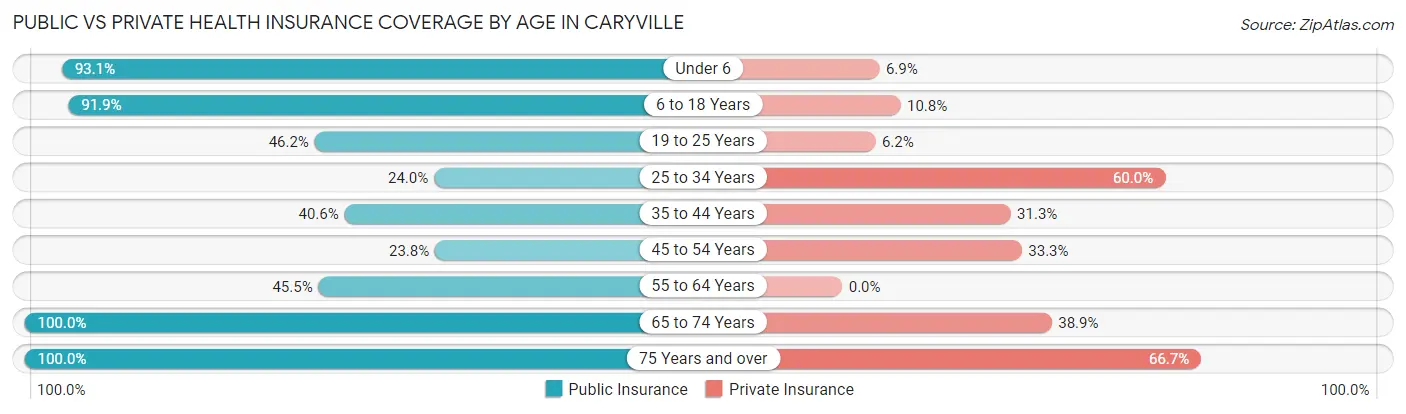
| Age Bracket | Public Insurance | Private Insurance |
| Under 6 | 27 (93.1%) | 2 (6.9%) |
| 6 to 18 Years | 34 (91.9%) | 4 (10.8%) |
| 19 to 25 Years | 30 (46.2%) | 4 (6.1%) |
| 25 to 34 Years | 12 (24.0%) | 30 (60.0%) |
| 35 to 44 Years | 13 (40.6%) | 10 (31.2%) |
| 45 to 54 Years | 5 (23.8%) | 7 (33.3%) |
| 55 to 64 Years | 5 (45.5%) | 0 (0.0%) |
| 65 to 74 Years | 18 (100.0%) | 7 (38.9%) |
| 75 Years and over | 6 (100.0%) | 4 (66.7%) |
| Total | 150 (55.8%) | 68 (25.3%) |
Disability Status by Sex by Age in Caryville
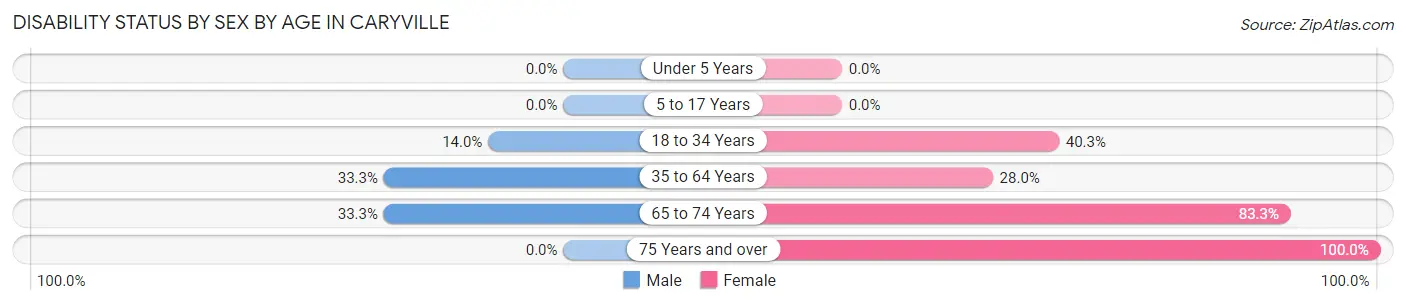
| Age Bracket | Male | Female |
| Under 5 Years | 0 (0.0%) | 0 (0.0%) |
| 5 to 17 Years | 0 (0.0%) | 0 (0.0%) |
| 18 to 34 Years | 6 (14.0%) | 29 (40.3%) |
| 35 to 64 Years | 13 (33.3%) | 7 (28.0%) |
| 65 to 74 Years | 2 (33.3%) | 10 (83.3%) |
| 75 Years and over | 0 (0.0%) | 3 (100.0%) |
Disability Class by Sex by Age in Caryville
Disability Class: Hearing Difficulty
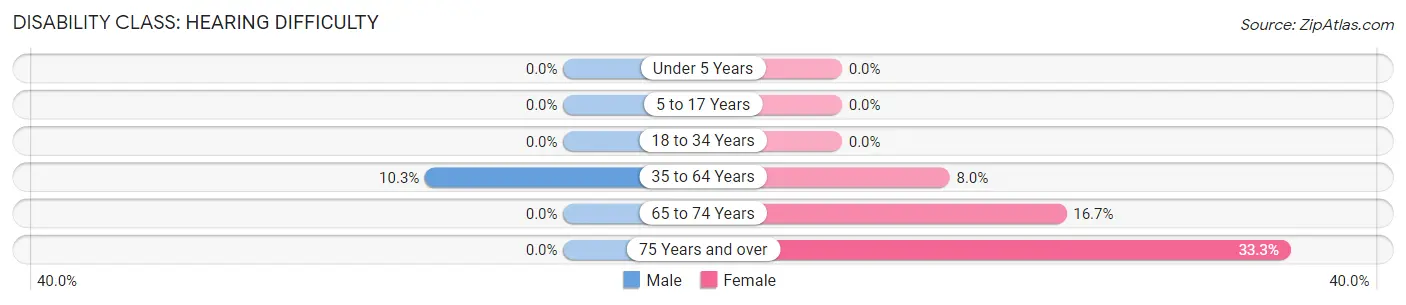
| Age Bracket | Male | Female |
| Under 5 Years | 0 (0.0%) | 0 (0.0%) |
| 5 to 17 Years | 0 (0.0%) | 0 (0.0%) |
| 18 to 34 Years | 0 (0.0%) | 0 (0.0%) |
| 35 to 64 Years | 4 (10.3%) | 2 (8.0%) |
| 65 to 74 Years | 0 (0.0%) | 2 (16.7%) |
| 75 Years and over | 0 (0.0%) | 1 (33.3%) |
Disability Class: Vision Difficulty
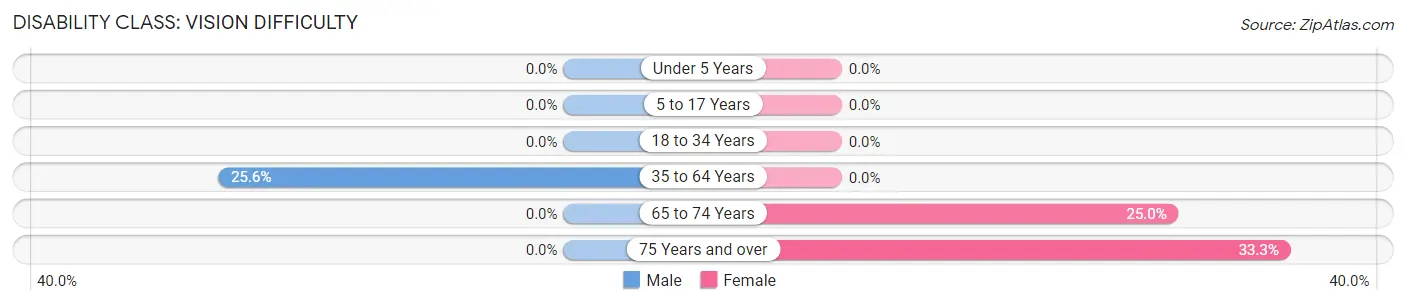
| Age Bracket | Male | Female |
| Under 5 Years | 0 (0.0%) | 0 (0.0%) |
| 5 to 17 Years | 0 (0.0%) | 0 (0.0%) |
| 18 to 34 Years | 0 (0.0%) | 0 (0.0%) |
| 35 to 64 Years | 10 (25.6%) | 0 (0.0%) |
| 65 to 74 Years | 0 (0.0%) | 3 (25.0%) |
| 75 Years and over | 0 (0.0%) | 1 (33.3%) |
Disability Class: Cognitive Difficulty
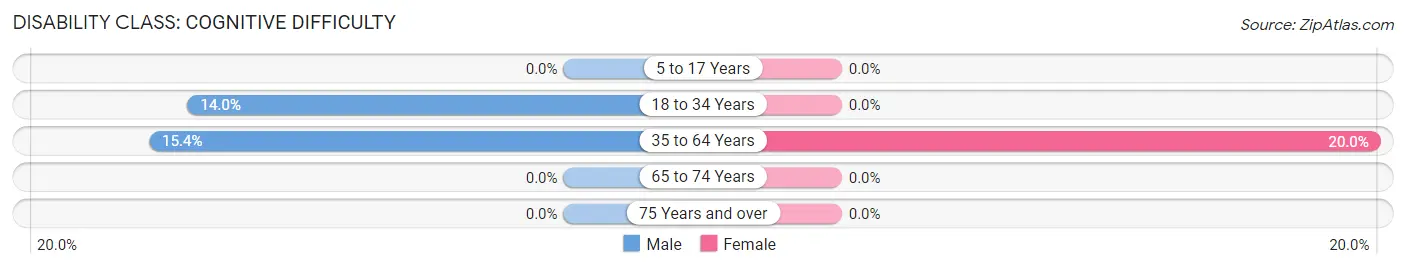
| Age Bracket | Male | Female |
| 5 to 17 Years | 0 (0.0%) | 0 (0.0%) |
| 18 to 34 Years | 6 (14.0%) | 0 (0.0%) |
| 35 to 64 Years | 6 (15.4%) | 5 (20.0%) |
| 65 to 74 Years | 0 (0.0%) | 0 (0.0%) |
| 75 Years and over | 0 (0.0%) | 0 (0.0%) |
Disability Class: Ambulatory Difficulty
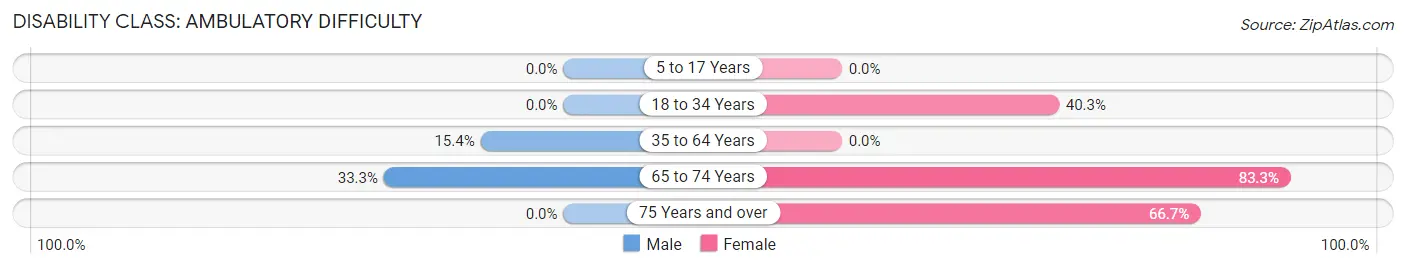
| Age Bracket | Male | Female |
| 5 to 17 Years | 0 (0.0%) | 0 (0.0%) |
| 18 to 34 Years | 0 (0.0%) | 29 (40.3%) |
| 35 to 64 Years | 6 (15.4%) | 0 (0.0%) |
| 65 to 74 Years | 2 (33.3%) | 10 (83.3%) |
| 75 Years and over | 0 (0.0%) | 2 (66.7%) |
Disability Class: Self-Care Difficulty
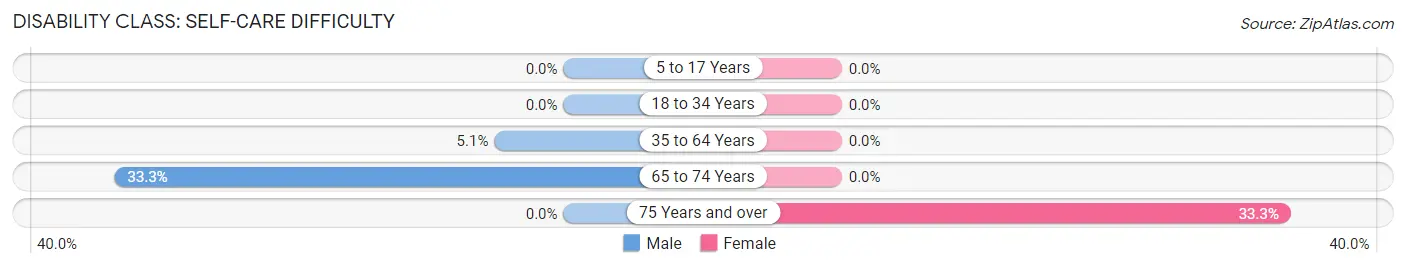
| Age Bracket | Male | Female |
| 5 to 17 Years | 0 (0.0%) | 0 (0.0%) |
| 18 to 34 Years | 0 (0.0%) | 0 (0.0%) |
| 35 to 64 Years | 2 (5.1%) | 0 (0.0%) |
| 65 to 74 Years | 2 (33.3%) | 0 (0.0%) |
| 75 Years and over | 0 (0.0%) | 1 (33.3%) |
Technology Access in Caryville
Computing Device Access in Caryville
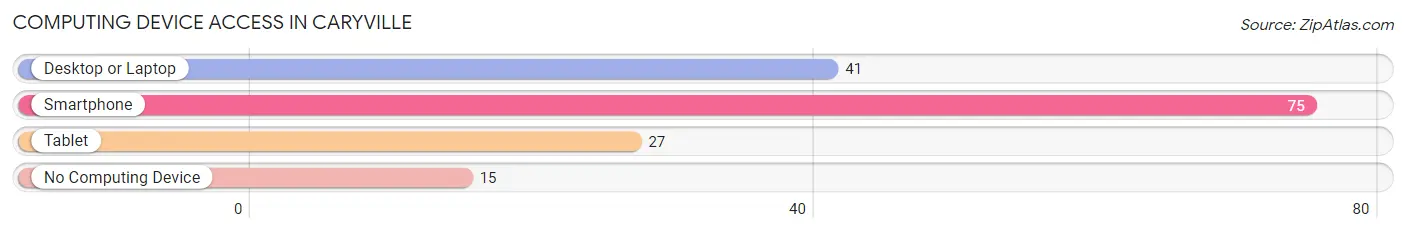
| Device Type | # Households | % Households |
| Desktop or Laptop | 41 | 44.1% |
| Smartphone | 75 | 80.6% |
| Tablet | 27 | 29.0% |
| No Computing Device | 15 | 16.1% |
| Total | 93 | 100.0% |
Internet Access in Caryville
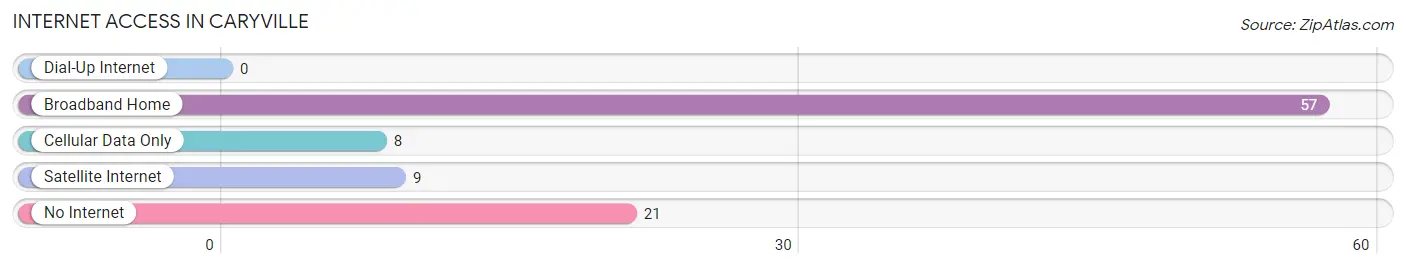
| Internet Type | # Households | % Households |
| Dial-Up Internet | 0 | 0.0% |
| Broadband Home | 57 | 61.3% |
| Cellular Data Only | 8 | 8.6% |
| Satellite Internet | 9 | 9.7% |
| No Internet | 21 | 22.6% |
| Total | 93 | 100.0% |
Caryville Summary
Caryville is a small town located in the panhandle of Florida, in Washington County. It is situated on the banks of the Choctawhatchee River, and is bordered by the towns of Bonifay, Chipley, and Ponce de Leon. The town has a population of 1,717 people, according to the 2010 census.
History
Caryville was founded in 1882 by William Cary, a former Confederate soldier. He named the town after himself, and it was incorporated in 1885. The town was originally a farming community, and the main crops were cotton, corn, and peanuts. In the early 1900s, the town began to grow, and a post office was established in 1906.
In the 1920s, the town began to develop into a tourist destination, and the first hotel was built in 1925. The town was also home to a number of sawmills, and the timber industry was a major source of income for the town.
Geography
Caryville is located in the panhandle of Florida, in Washington County. It is situated on the banks of the Choctawhatchee River, and is bordered by the towns of Bonifay, Chipley, and Ponce de Leon. The town has a total area of 2.2 square miles, all of which is land.
The town is located in a humid subtropical climate zone, and has hot, humid summers and mild winters. The average temperature in the summer is around 90 degrees Fahrenheit, and the average temperature in the winter is around 60 degrees Fahrenheit.
Economy
The economy of Caryville is largely based on agriculture and tourism. The town is home to a number of farms, and the main crops are cotton, corn, and peanuts. The timber industry is also a major source of income for the town, and there are a number of sawmills in the area.
The town is also a popular tourist destination, and there are a number of hotels and restaurants in the area. The town is home to a number of festivals and events throughout the year, including the annual Choctawhatchee River Festival.
Demographics
According to the 2010 census, the population of Caryville was 1,717 people. The racial makeup of the town was 94.3% White, 3.2% African American, 0.3% Native American, 0.2% Asian, 0.1% Pacific Islander, 0.7% from other races, and 1.4% from two or more races. Hispanic or Latino of any race were 2.2% of the population.
The median income for a household in the town was $30,938, and the median income for a family was $37,500. The per capita income for the town was $15,945. About 17.2% of the population was below the poverty line.
Common Questions
What is Per Capita Income in Caryville?
Per Capita income in Caryville is $17,177.
What is the Median Family Income in Caryville?
Median Family Income in Caryville is $76,250.
What is the Median Household income in Caryville?
Median Household Income in Caryville is $48,438.
What is Income or Wage Gap in Caryville?
Income or Wage Gap in Caryville is 11.2%.
Women in Caryville earn 88.8 cents for every dollar earned by a man.
What is Inequality or Gini Index in Caryville?
Inequality or Gini Index in Caryville is 0.35.
What is the Total Population of Caryville?
Total Population of Caryville is 269.
What is the Total Male Population of Caryville?
Total Male Population of Caryville is 129.
What is the Total Female Population of Caryville?
Total Female Population of Caryville is 140.
What is the Ratio of Males per 100 Females in Caryville?
There are 92.14 Males per 100 Females in Caryville.
What is the Ratio of Females per 100 Males in Caryville?
There are 108.53 Females per 100 Males in Caryville.
What is the Median Population Age in Caryville?
Median Population Age in Caryville is 26.1 Years.
What is the Average Family Size in Caryville
Average Family Size in Caryville is 3.6 People.
What is the Average Household Size in Caryville
Average Household Size in Caryville is 2.9 People.
How Large is the Labor Force in Caryville?
There are 120 People in the Labor Forcein in Caryville.
What is the Percentage of People in the Labor Force in Caryville?
58.8% of People are in the Labor Force in Caryville.
What is the Unemployment Rate in Caryville?
Unemployment Rate in Caryville is 5.0%.