Mulat, FL Map & Demographics
Mulat Map
Mulat Overview
$63,164
PER CAPITA INCOME
$141,685
AVG FAMILY INCOME
$141,685
AVG HOUSEHOLD INCOME
0.27
INEQUALITY / GINI INDEX
174
TOTAL POPULATION
89
MALE POPULATION
85
FEMALE POPULATION
104.71
MALES / 100 FEMALES
95.51
FEMALES / 100 MALES
32.5
MEDIAN AGE
2.2
AVG FAMILY SIZE
2.2
AVG HOUSEHOLD SIZE
109
LABOR FORCE [ PEOPLE ]
75.2%
PERCENT IN LABOR FORCE
Income in Mulat
Income Overview in Mulat
Per Capita Income in Mulat is $63,164, while median incomes of families and households are $141,685 and $141,685 respectively.
| Characteristic | Number | Measure |
| Per Capita Income | 174 | $63,164 |
| Median Family Income | 75 | $141,685 |
| Mean Family Income | 75 | $148,916 |
| Median Household Income | 75 | $141,685 |
| Mean Household Income | 75 | $148,916 |
| Income Deficit | 75 | $0 |
| Wage / Income Gap (%) | 174 | 0.00% |
| Wage / Income Gap ($) | 174 | 100.00¢ per $1 |
| Gini / Inequality Index | 174 | 0.27 |
Earnings by Sex in Mulat
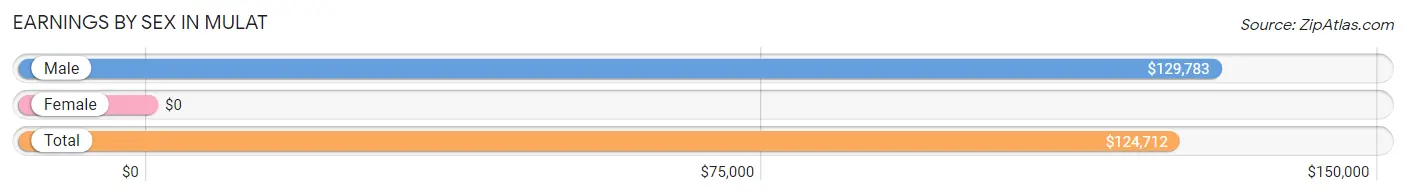
| Sex | Number | Average Earnings |
| Male | 64 (58.7%) | $129,783 |
| Female | 45 (41.3%) | $0 |
| Total | 109 (100.0%) | $124,712 |
Earnings by Sex by Income Bracket in Mulat
The most common earnings brackets in Mulat are $100,000+ for men (53 | 82.8%) and $10,000 to $12,499 for women (20 | 44.4%).
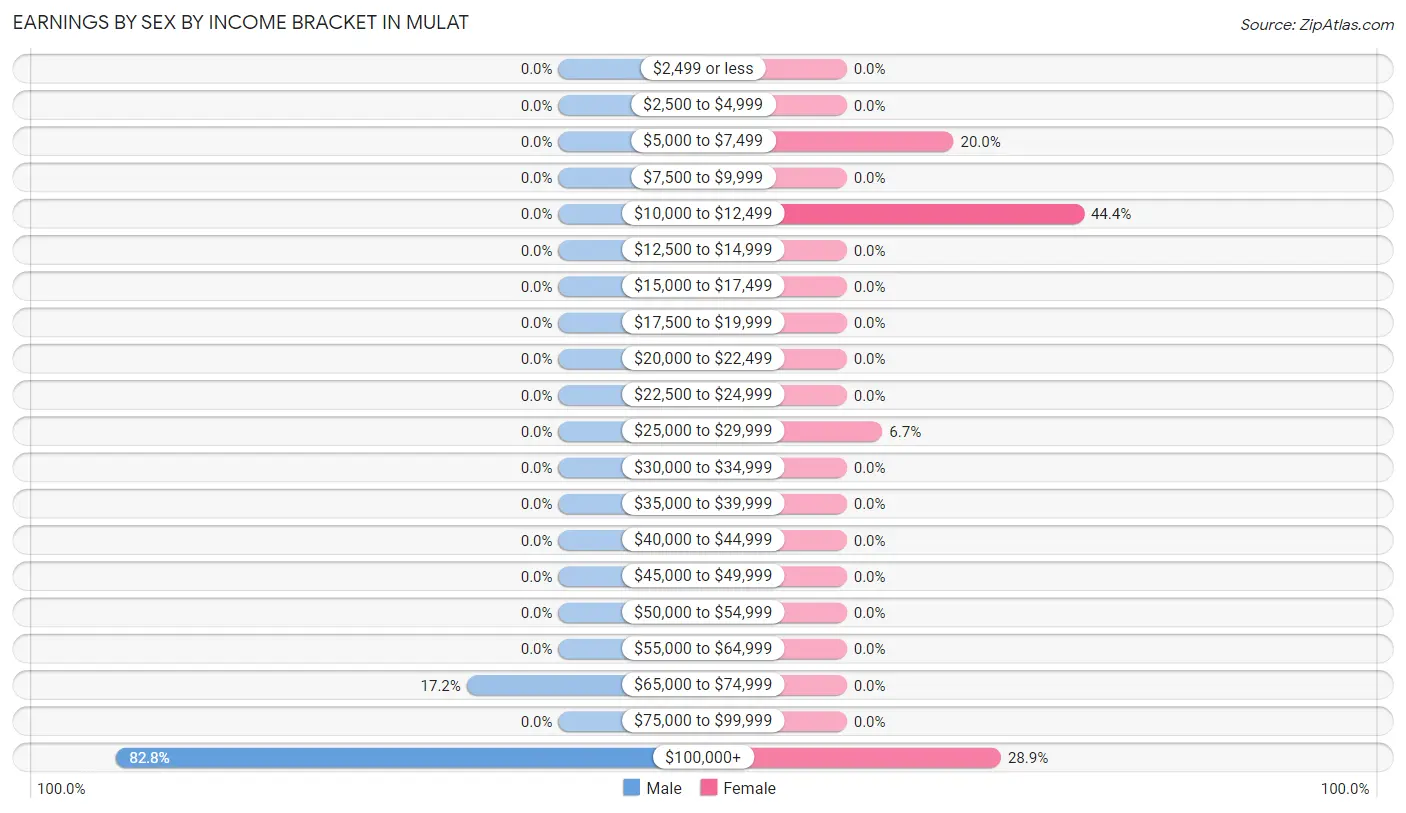
| Income | Male | Female |
| $2,499 or less | 0 (0.0%) | 0 (0.0%) |
| $2,500 to $4,999 | 0 (0.0%) | 0 (0.0%) |
| $5,000 to $7,499 | 0 (0.0%) | 9 (20.0%) |
| $7,500 to $9,999 | 0 (0.0%) | 0 (0.0%) |
| $10,000 to $12,499 | 0 (0.0%) | 20 (44.4%) |
| $12,500 to $14,999 | 0 (0.0%) | 0 (0.0%) |
| $15,000 to $17,499 | 0 (0.0%) | 0 (0.0%) |
| $17,500 to $19,999 | 0 (0.0%) | 0 (0.0%) |
| $20,000 to $22,499 | 0 (0.0%) | 0 (0.0%) |
| $22,500 to $24,999 | 0 (0.0%) | 0 (0.0%) |
| $25,000 to $29,999 | 0 (0.0%) | 3 (6.7%) |
| $30,000 to $34,999 | 0 (0.0%) | 0 (0.0%) |
| $35,000 to $39,999 | 0 (0.0%) | 0 (0.0%) |
| $40,000 to $44,999 | 0 (0.0%) | 0 (0.0%) |
| $45,000 to $49,999 | 0 (0.0%) | 0 (0.0%) |
| $50,000 to $54,999 | 0 (0.0%) | 0 (0.0%) |
| $55,000 to $64,999 | 0 (0.0%) | 0 (0.0%) |
| $65,000 to $74,999 | 11 (17.2%) | 0 (0.0%) |
| $75,000 to $99,999 | 0 (0.0%) | 0 (0.0%) |
| $100,000+ | 53 (82.8%) | 13 (28.9%) |
| Total | 64 (100.0%) | 45 (100.0%) |
Earnings by Sex by Educational Attainment in Mulat
| Educational Attainment | Male Income | Female Income |
| Less than High School | - | - |
| High School Diploma | - | - |
| College or Associate's Degree | - | - |
| Bachelor's Degree | - | - |
| Graduate Degree | - | - |
| Total | $129,783 | $0 |
Family Income in Mulat
Family Income Brackets in Mulat
According to the Mulat family income data, there are 23 families falling into the $100,000 to $149,999 income range, which is the most common income bracket and makes up 30.7% of all families.
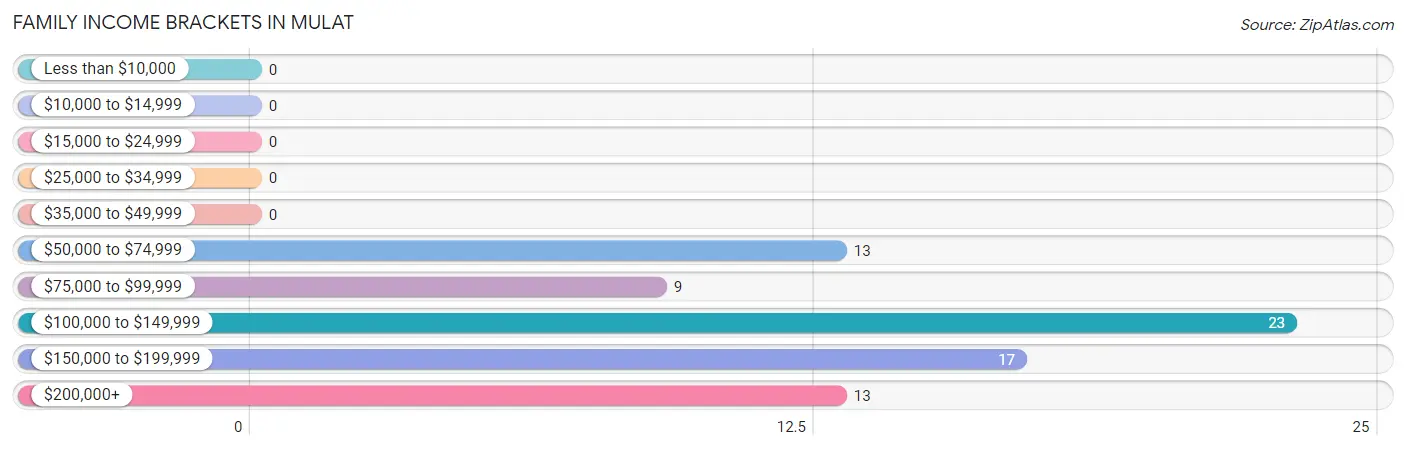
| Income Bracket | # Families | % Families |
| Less than $10,000 | 0 | 0.0% |
| $10,000 to $14,999 | 0 | 0.0% |
| $15,000 to $24,999 | 0 | 0.0% |
| $25,000 to $34,999 | 0 | 0.0% |
| $35,000 to $49,999 | 0 | 0.0% |
| $50,000 to $74,999 | 13 | 17.3% |
| $75,000 to $99,999 | 9 | 12.0% |
| $100,000 to $149,999 | 23 | 30.7% |
| $150,000 to $199,999 | 17 | 22.7% |
| $200,000+ | 13 | 17.3% |
Family Income by Famaliy Size in Mulat
2-person families (66 | 88.0%) account for the highest median family income in Mulat with $142,174 per family, while 2-person families (66 | 88.0%) have the highest median income of $71,087 per family member.
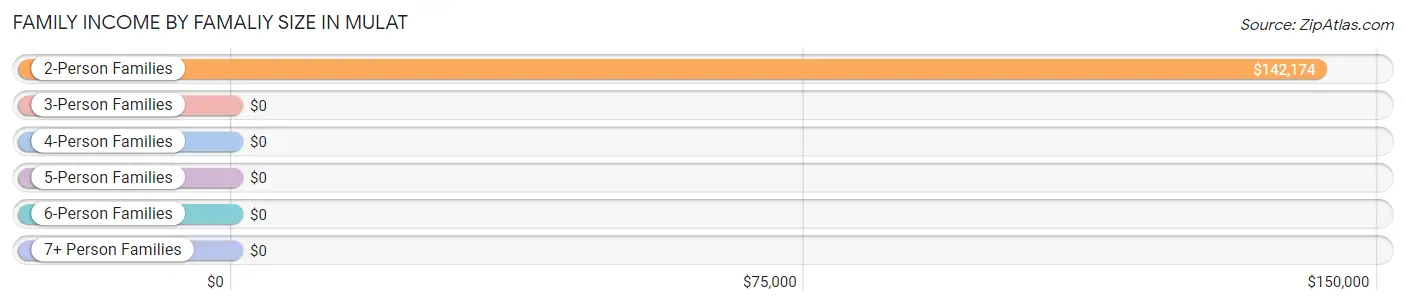
| Income Bracket | # Families | Median Income |
| 2-Person Families | 66 (88.0%) | $142,174 |
| 3-Person Families | 0 (0.0%) | $0 |
| 4-Person Families | 0 (0.0%) | $0 |
| 5-Person Families | 9 (12.0%) | $0 |
| 6-Person Families | 0 (0.0%) | $0 |
| 7+ Person Families | 0 (0.0%) | $0 |
| Total | 75 (100.0%) | $141,685 |
Family Income by Number of Earners in Mulat
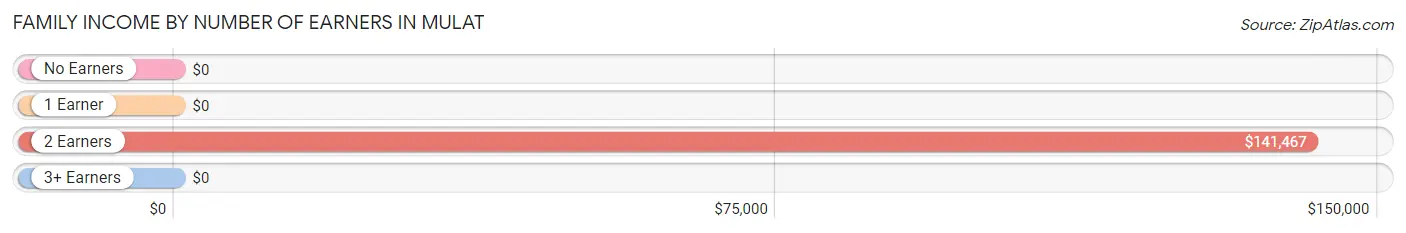
| Number of Earners | # Families | Median Income |
| No Earners | 0 (0.0%) | $0 |
| 1 Earner | 30 (40.0%) | $0 |
| 2 Earners | 45 (60.0%) | $141,467 |
| 3+ Earners | 0 (0.0%) | $0 |
| Total | 75 (100.0%) | $141,685 |
Household Income in Mulat
Household Income Brackets in Mulat
With 23 households falling in the category, the $100,000 to $149,999 income range is the most frequent in Mulat, accounting for 30.7% of all households.
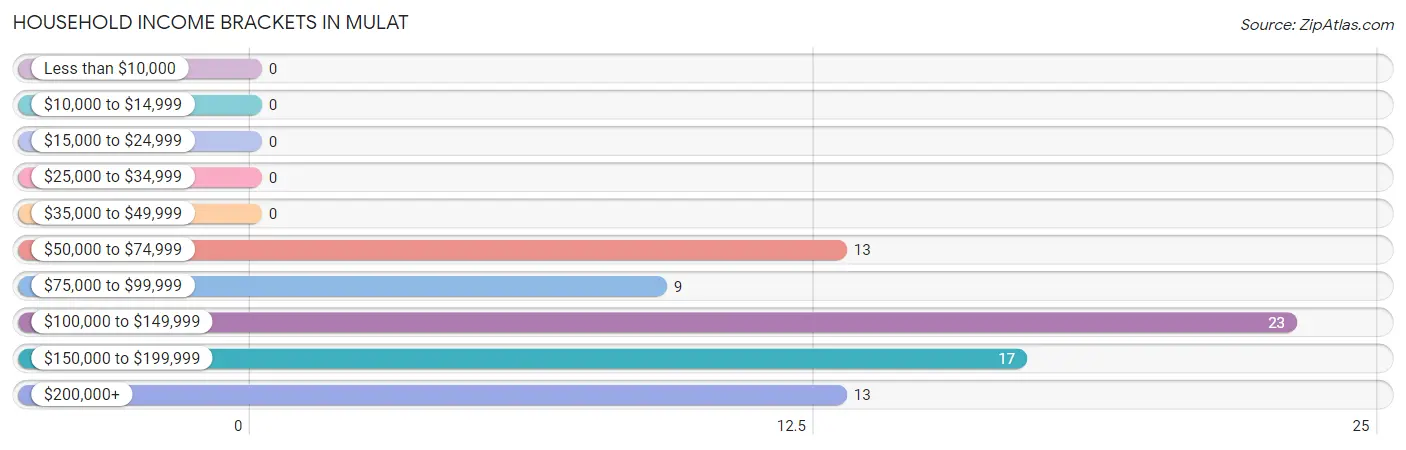
| Income Bracket | # Households | % Households |
| Less than $10,000 | 0 | 0.0% |
| $10,000 to $14,999 | 0 | 0.0% |
| $15,000 to $24,999 | 0 | 0.0% |
| $25,000 to $34,999 | 0 | 0.0% |
| $35,000 to $49,999 | 0 | 0.0% |
| $50,000 to $74,999 | 13 | 17.3% |
| $75,000 to $99,999 | 9 | 12.0% |
| $100,000 to $149,999 | 23 | 30.7% |
| $150,000 to $199,999 | 17 | 22.7% |
| $200,000+ | 13 | 17.3% |
Household Income by Householder Age in Mulat
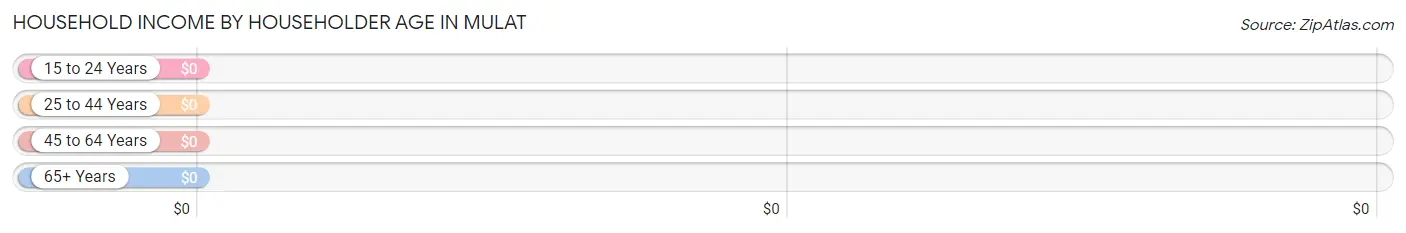
| Income Bracket | # Households | Median Income |
| 15 to 24 Years | 0 (0.0%) | $0 |
| 25 to 44 Years | 32 (42.7%) | $0 |
| 45 to 64 Years | 30 (40.0%) | $0 |
| 65+ Years | 13 (17.3%) | $0 |
| Total | 75 (100.0%) | $141,685 |
Poverty in Mulat
Income Below Poverty by Sex and Age in Mulat
| Age Bracket | Male | Female |
| Under 5 Years | 0 (0.0%) | 0 (0.0%) |
| 5 Years | 0 (0.0%) | 0 (0.0%) |
| 6 to 11 Years | 0 (0.0%) | 0 (0.0%) |
| 12 to 14 Years | 0 (0.0%) | 0 (0.0%) |
| 15 Years | 0 (0.0%) | 0 (0.0%) |
| 16 and 17 Years | 0 (0.0%) | 0 (0.0%) |
| 18 to 24 Years | 0 (0.0%) | 0 (0.0%) |
| 25 to 34 Years | 0 (0.0%) | 0 (0.0%) |
| 35 to 44 Years | 0 (0.0%) | 0 (0.0%) |
| 45 to 54 Years | 0 (0.0%) | 0 (0.0%) |
| 55 to 64 Years | 0 (0.0%) | 0 (0.0%) |
| 65 to 74 Years | 0 (0.0%) | 0 (0.0%) |
| 75 Years and over | 0 (0.0%) | 0 (0.0%) |
| Total | 0 (0.0%) | 0 (0.0%) |
Income Above Poverty by Sex and Age in Mulat
According to the poverty statistics in Mulat, males aged under 5 years and females aged 6 to 11 years are the age groups that are most secure financially, with 100.0% of males and 100.0% of females in these age groups living above the poverty line.
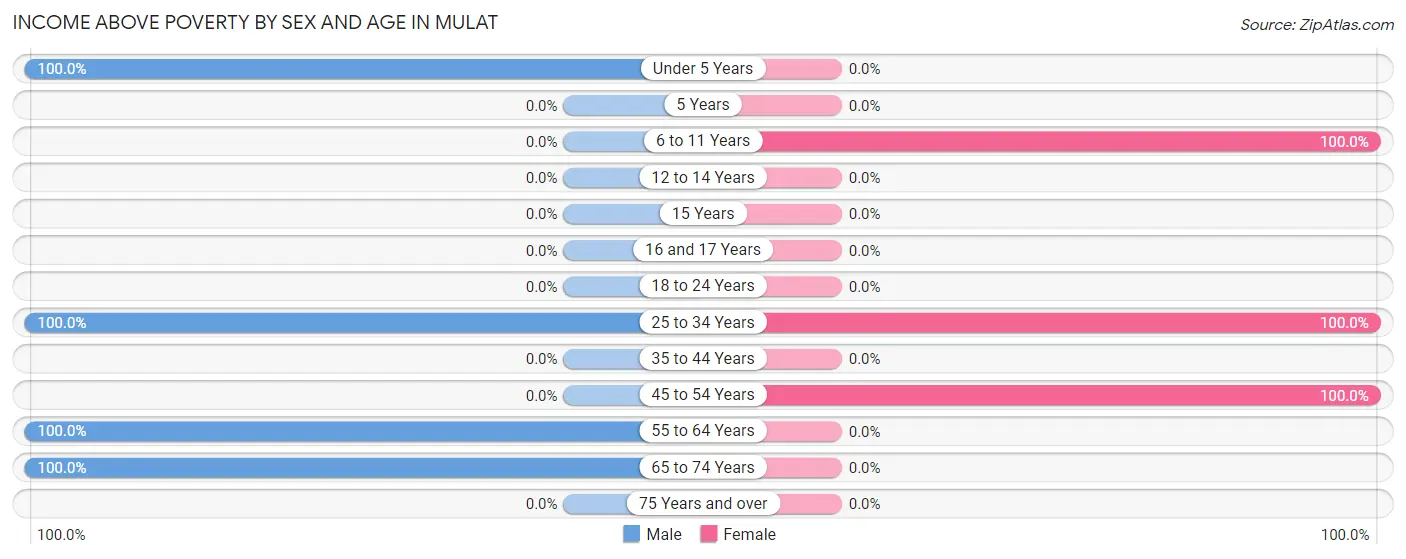
| Age Bracket | Male | Female |
| Under 5 Years | 9 (100.0%) | 0 (0.0%) |
| 5 Years | 0 (0.0%) | 0 (0.0%) |
| 6 to 11 Years | 0 (0.0%) | 16 (100.0%) |
| 12 to 14 Years | 0 (0.0%) | 0 (0.0%) |
| 15 Years | 0 (0.0%) | 0 (0.0%) |
| 16 and 17 Years | 0 (0.0%) | 0 (0.0%) |
| 18 to 24 Years | 0 (0.0%) | 0 (0.0%) |
| 25 to 34 Years | 34 (100.0%) | 29 (100.0%) |
| 35 to 44 Years | 0 (0.0%) | 0 (0.0%) |
| 45 to 54 Years | 0 (0.0%) | 38 (100.0%) |
| 55 to 64 Years | 30 (100.0%) | 0 (0.0%) |
| 65 to 74 Years | 13 (100.0%) | 0 (0.0%) |
| 75 Years and over | 0 (0.0%) | 0 (0.0%) |
| Total | 86 (100.0%) | 83 (100.0%) |
Income Below Poverty Among Married-Couple Families in Mulat
| Children | Above Poverty | Below Poverty |
| No Children | 66 (100.0%) | 0 (0.0%) |
| 1 or 2 Children | 0 (0.0%) | 0 (0.0%) |
| 3 or 4 Children | 9 (100.0%) | 0 (0.0%) |
| 5 or more Children | 0 (0.0%) | 0 (0.0%) |
| Total | 75 (100.0%) | 0 (0.0%) |
Income Below Poverty Among Single-Parent Households in Mulat
| Children | Single Father | Single Mother |
| No Children | 0 (0.0%) | 0 (0.0%) |
| 1 or 2 Children | 0 (0.0%) | 0 (0.0%) |
| 3 or 4 Children | 0 (0.0%) | 0 (0.0%) |
| 5 or more Children | 0 (0.0%) | 0 (0.0%) |
| Total | 0 (0.0%) | 0 (0.0%) |
Income Below Poverty Among Married-Couple vs Single-Parent Households in Mulat
| Children | Married-Couple Families | Single-Parent Households |
| No Children | 0 (0.0%) | 0 (0.0%) |
| 1 or 2 Children | 0 (0.0%) | 0 (0.0%) |
| 3 or 4 Children | 0 (0.0%) | 0 (0.0%) |
| 5 or more Children | 0 (0.0%) | 0 (0.0%) |
| Total | 0 (0.0%) | 0 (0.0%) |
Race in Mulat
The most populous races in Mulat are White / Caucasian (168 | 96.6%), Asian (3 | 1.7%), and Black / African American (3 | 1.7%).
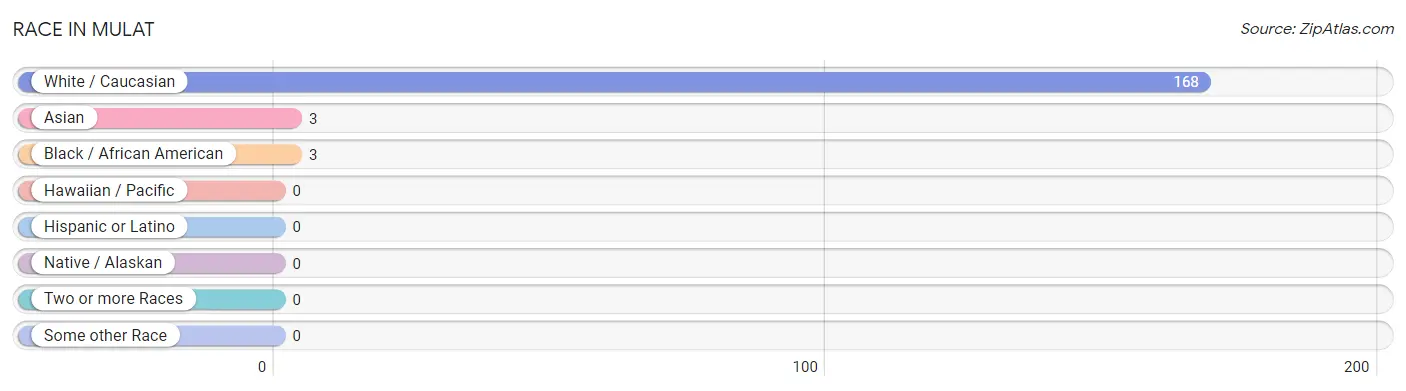
| Race | # Population | % Population |
| Asian | 3 | 1.7% |
| Black / African American | 3 | 1.7% |
| Hawaiian / Pacific | 0 | 0.0% |
| Hispanic or Latino | 0 | 0.0% |
| Native / Alaskan | 0 | 0.0% |
| White / Caucasian | 168 | 96.6% |
| Two or more Races | 0 | 0.0% |
| Some other Race | 0 | 0.0% |
| Total | 174 | 100.0% |
Ancestry in Mulat
The most populous ancestries reported in Mulat are English (56 | 32.2%), Irish (53 | 30.5%), Scottish (20 | 11.5%), French Canadian (13 | 7.5%), and Portuguese (13 | 7.5%), together accounting for 89.1% of all Mulat residents.
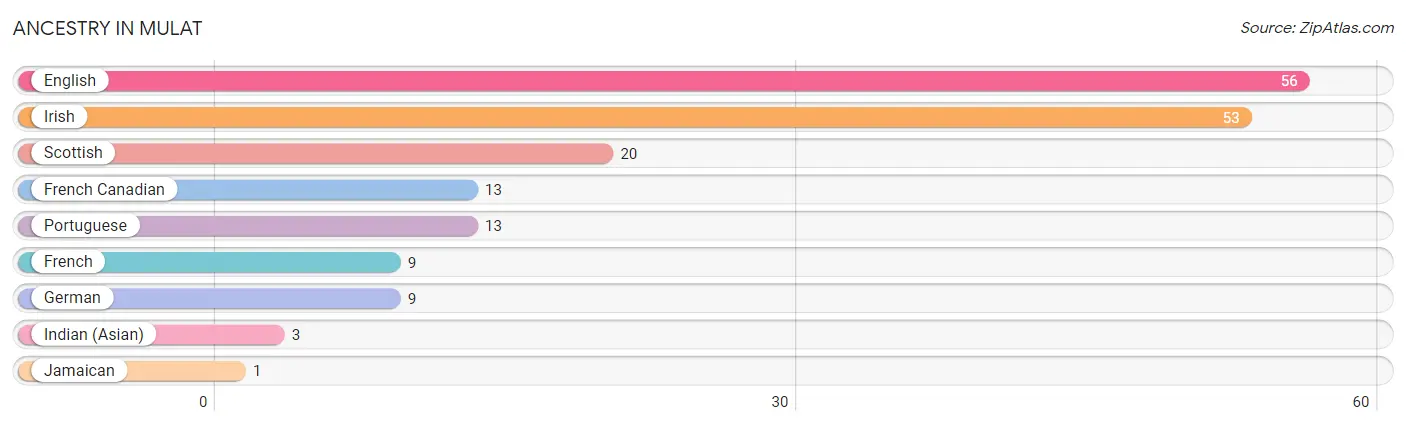
| Ancestry | # Population | % Population |
| English | 56 | 32.2% |
| French | 9 | 5.2% |
| French Canadian | 13 | 7.5% |
| German | 9 | 5.2% |
| Indian (Asian) | 3 | 1.7% |
| Irish | 53 | 30.5% |
| Jamaican | 1 | 0.6% |
| Portuguese | 13 | 7.5% |
| Scottish | 20 | 11.5% | View All 9 Rows |
Immigrants in Mulat
The most numerous immigrant groups reported in Mulat came from Asia (3 | 1.7%), South Eastern Asia (3 | 1.7%), Thailand (3 | 1.7%), Caribbean (1 | 0.6%), and Jamaica (1 | 0.6%), together accounting for 6.3% of all Mulat residents.
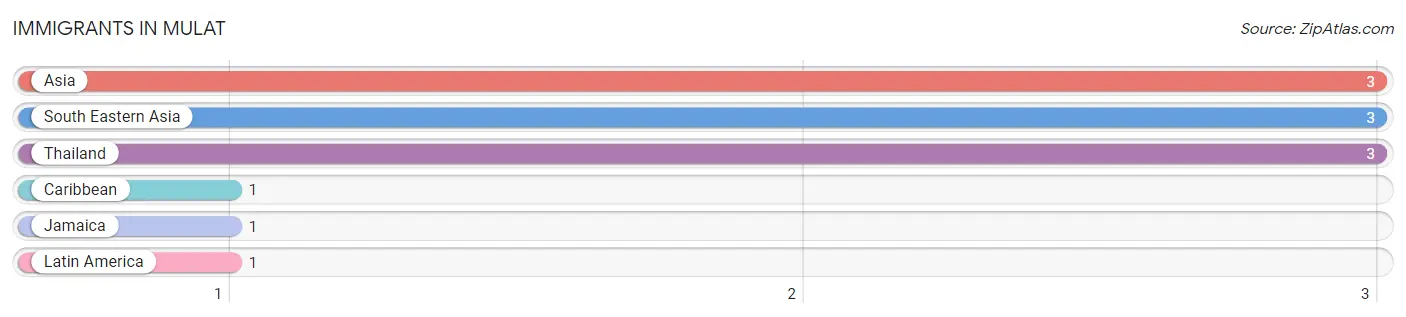
| Immigration Origin | # Population | % Population |
| Asia | 3 | 1.7% |
| Caribbean | 1 | 0.6% |
| Jamaica | 1 | 0.6% |
| Latin America | 1 | 0.6% |
| South Eastern Asia | 3 | 1.7% |
| Thailand | 3 | 1.7% | View All 6 Rows |
Sex and Age in Mulat
Sex and Age in Mulat
The most populous age groups in Mulat are 30 to 34 Years (34 | 38.2%) for men and 50 to 54 Years (38 | 44.7%) for women.
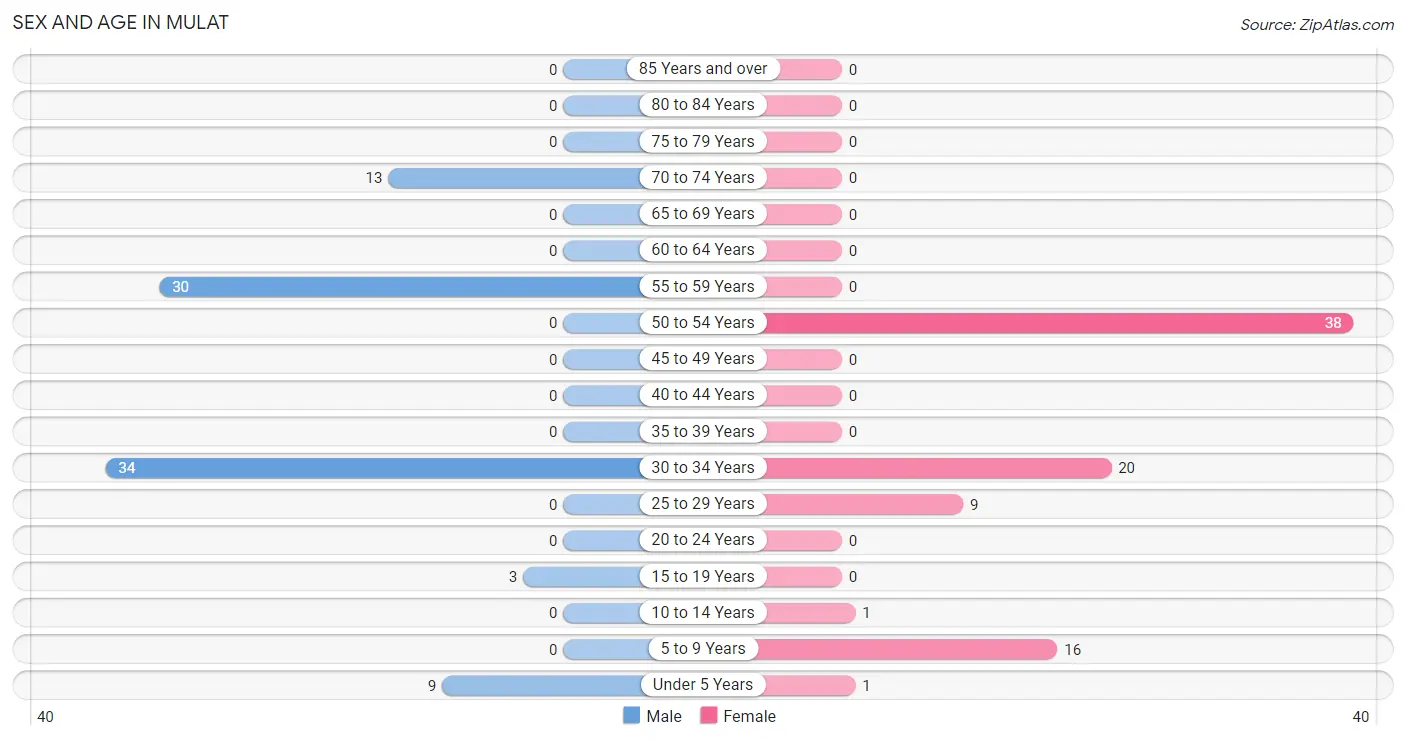
| Age Bracket | Male | Female |
| Under 5 Years | 9 (10.1%) | 1 (1.2%) |
| 5 to 9 Years | 0 (0.0%) | 16 (18.8%) |
| 10 to 14 Years | 0 (0.0%) | 1 (1.2%) |
| 15 to 19 Years | 3 (3.4%) | 0 (0.0%) |
| 20 to 24 Years | 0 (0.0%) | 0 (0.0%) |
| 25 to 29 Years | 0 (0.0%) | 9 (10.6%) |
| 30 to 34 Years | 34 (38.2%) | 20 (23.5%) |
| 35 to 39 Years | 0 (0.0%) | 0 (0.0%) |
| 40 to 44 Years | 0 (0.0%) | 0 (0.0%) |
| 45 to 49 Years | 0 (0.0%) | 0 (0.0%) |
| 50 to 54 Years | 0 (0.0%) | 38 (44.7%) |
| 55 to 59 Years | 30 (33.7%) | 0 (0.0%) |
| 60 to 64 Years | 0 (0.0%) | 0 (0.0%) |
| 65 to 69 Years | 0 (0.0%) | 0 (0.0%) |
| 70 to 74 Years | 13 (14.6%) | 0 (0.0%) |
| 75 to 79 Years | 0 (0.0%) | 0 (0.0%) |
| 80 to 84 Years | 0 (0.0%) | 0 (0.0%) |
| 85 Years and over | 0 (0.0%) | 0 (0.0%) |
| Total | 89 (100.0%) | 85 (100.0%) |
Families and Households in Mulat
Median Family Size in Mulat
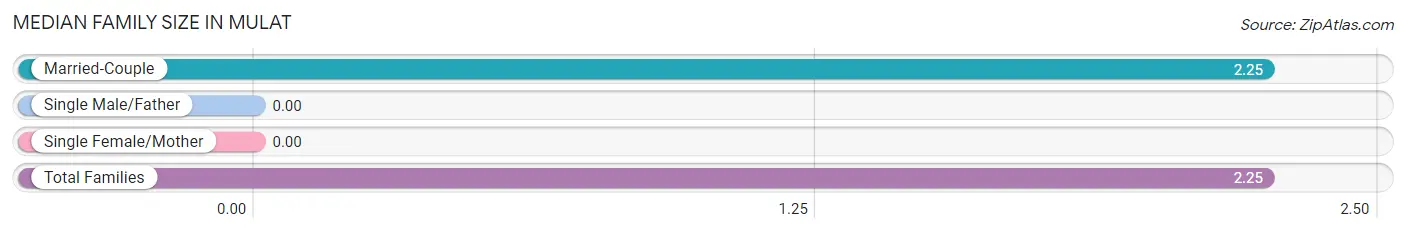
| Family Type | # Families | Family Size |
| Married-Couple | 75 (100.0%) | 2.25 |
| Single Male/Father | 0 (0.0%) | - |
| Single Female/Mother | 0 (0.0%) | - |
| Total Families | 75 (100.0%) | 2.25 |
Median Household Size in Mulat
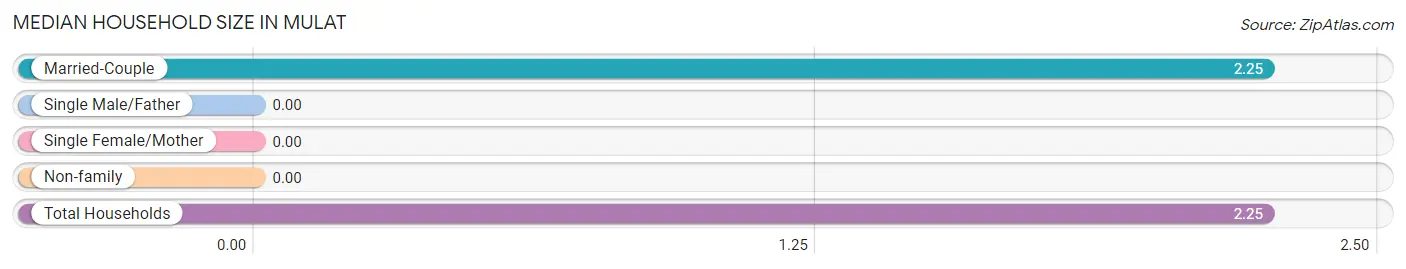
| Household Type | # Households | Household Size |
| Married-Couple | 75 (100.0%) | 2.25 |
| Single Male/Father | 0 (0.0%) | - |
| Single Female/Mother | 0 (0.0%) | - |
| Non-family | 0 (0.0%) | - |
| Total Households | 75 (100.0%) | 2.25 |
Household Size by Marriage Status in Mulat
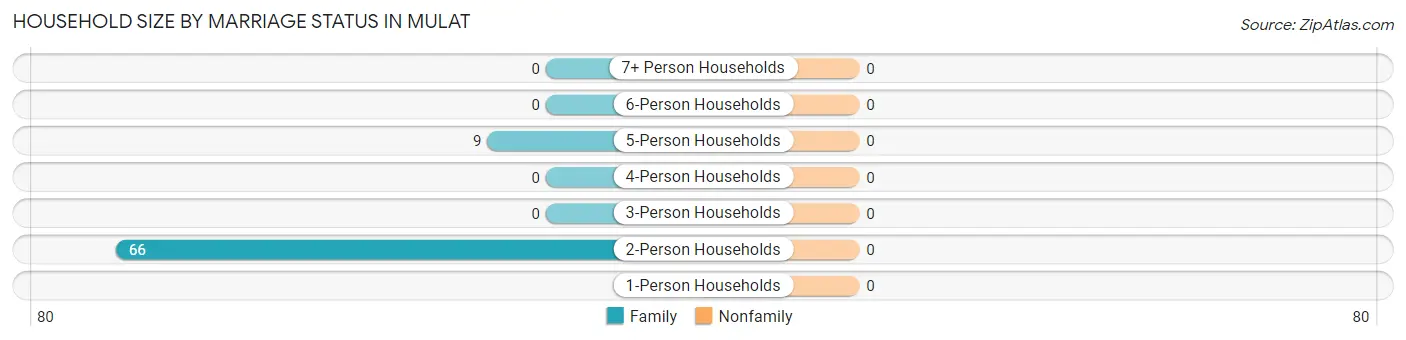
| Household Size | Family Households | Nonfamily Households |
| 1-Person Households | - | 0 (0.0%) |
| 2-Person Households | 66 (88.0%) | 0 (0.0%) |
| 3-Person Households | 0 (0.0%) | 0 (0.0%) |
| 4-Person Households | 0 (0.0%) | 0 (0.0%) |
| 5-Person Households | 9 (12.0%) | 0 (0.0%) |
| 6-Person Households | 0 (0.0%) | 0 (0.0%) |
| 7+ Person Households | 0 (0.0%) | 0 (0.0%) |
| Total | 75 (100.0%) | 0 (0.0%) |
Female Fertility in Mulat
Fertility by Age in Mulat
| Age Bracket | Women with Births | Births / 1,000 Women |
| 15 to 19 years | 0 (0.0%) | 0.0 |
| 20 to 34 years | 0 (0.0%) | 0.0 |
| 35 to 50 years | 0 (0.0%) | 0.0 |
| Total | 0 (0.0%) | 0.0 |
Fertility by Age by Marriage Status in Mulat
| Age Bracket | Married | Unmarried |
| 15 to 19 years | 0 (0.0%) | 0 (0.0%) |
| 20 to 34 years | 0 (0.0%) | 0 (0.0%) |
| 35 to 50 years | 0 (0.0%) | 0 (0.0%) |
| Total | 0 (0.0%) | 0 (0.0%) |
Fertility by Education in Mulat
| Educational Attainment | Women with Births | Births / 1,000 Women |
| Less than High School | 0 (0.0%) | 0.0 |
| High School Diploma | 0 (0.0%) | 0.0 |
| College or Associate's Degree | 0 (0.0%) | 0.0 |
| Bachelor's Degree | 0 (0.0%) | 0.0 |
| Graduate Degree | 0 (0.0%) | 0.0 |
| Total | 0 (0.0%) | 0.0 |
Fertility by Education by Marriage Status in Mulat
| Educational Attainment | Married | Unmarried |
| Less than High School | 0 (0.0%) | 0 (0.0%) |
| High School Diploma | 0 (0.0%) | 0 (0.0%) |
| College or Associate's Degree | 0 (0.0%) | 0 (0.0%) |
| Bachelor's Degree | 0 (0.0%) | 0 (0.0%) |
| Graduate Degree | 0 (0.0%) | 0 (0.0%) |
| Total | 0 (0.0%) | 0 (0.0%) |
Employment Characteristics in Mulat
Employment by Class of Employer in Mulat
Among the 109 employed individuals in Mulat, private company employees (87 | 79.8%), state government employees (13 | 11.9%), and local government employees (9 | 8.3%) make up the most common classes of employment.
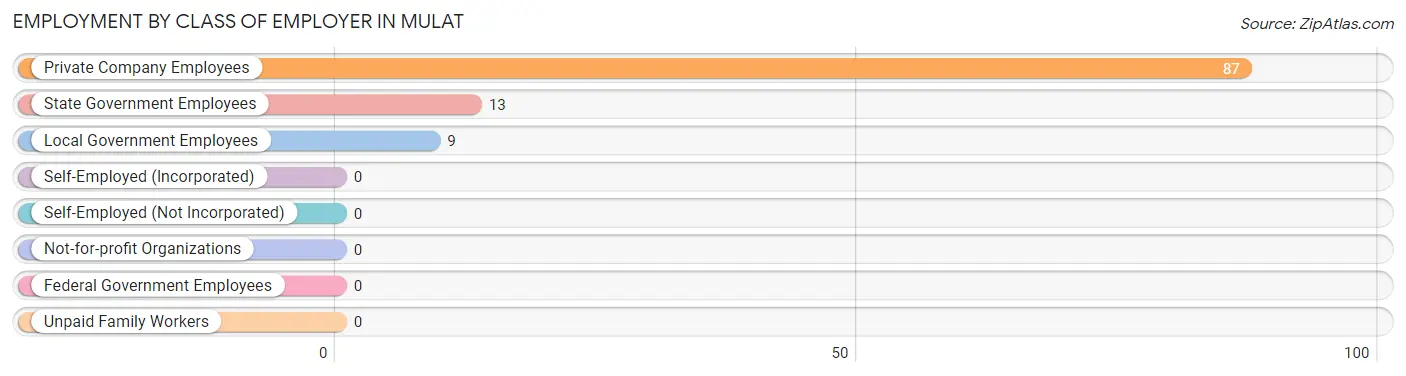
| Employer Class | # Employees | % Employees |
| Private Company Employees | 87 | 79.8% |
| Self-Employed (Incorporated) | 0 | 0.0% |
| Self-Employed (Not Incorporated) | 0 | 0.0% |
| Not-for-profit Organizations | 0 | 0.0% |
| Local Government Employees | 9 | 8.3% |
| State Government Employees | 13 | 11.9% |
| Federal Government Employees | 0 | 0.0% |
| Unpaid Family Workers | 0 | 0.0% |
| Total | 109 | 100.0% |
Employment Status by Age in Mulat
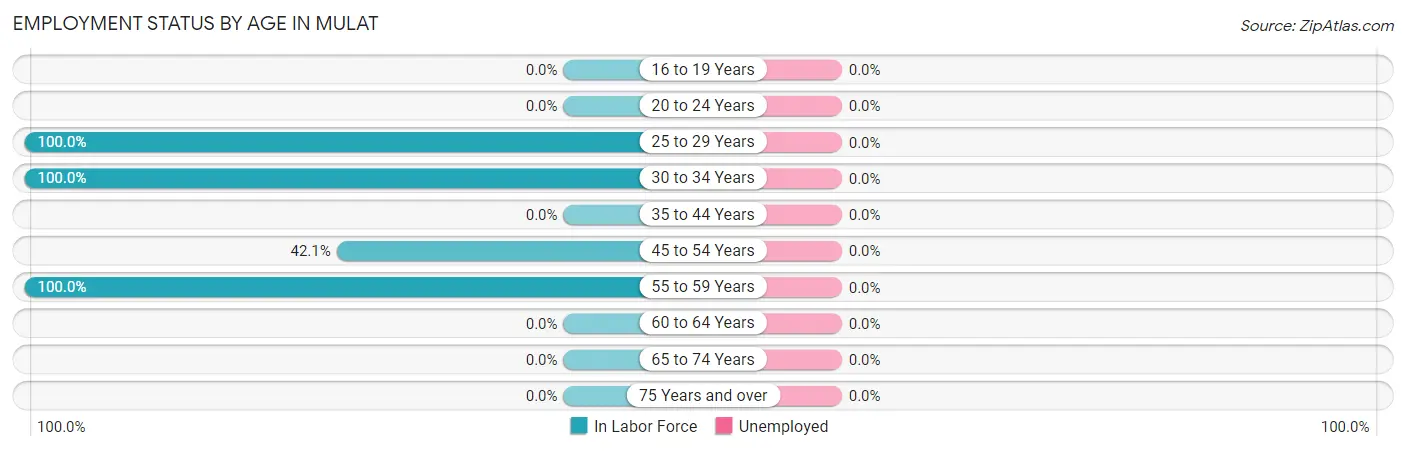
| Age Bracket | In Labor Force | Unemployed |
| 16 to 19 Years | 0 (0.0%) | 0 (0.0%) |
| 20 to 24 Years | 0 (0.0%) | 0 (0.0%) |
| 25 to 29 Years | 9 (100.0%) | 0 (0.0%) |
| 30 to 34 Years | 54 (100.0%) | 0 (0.0%) |
| 35 to 44 Years | 0 (0.0%) | 0 (0.0%) |
| 45 to 54 Years | 16 (42.1%) | 0 (0.0%) |
| 55 to 59 Years | 30 (100.0%) | 0 (0.0%) |
| 60 to 64 Years | 0 (0.0%) | 0 (0.0%) |
| 65 to 74 Years | 0 (0.0%) | 0 (0.0%) |
| 75 Years and over | 0 (0.0%) | 0 (0.0%) |
| Total | 109 (75.2%) | 0 (0.0%) |
Employment Status by Educational Attainment in Mulat
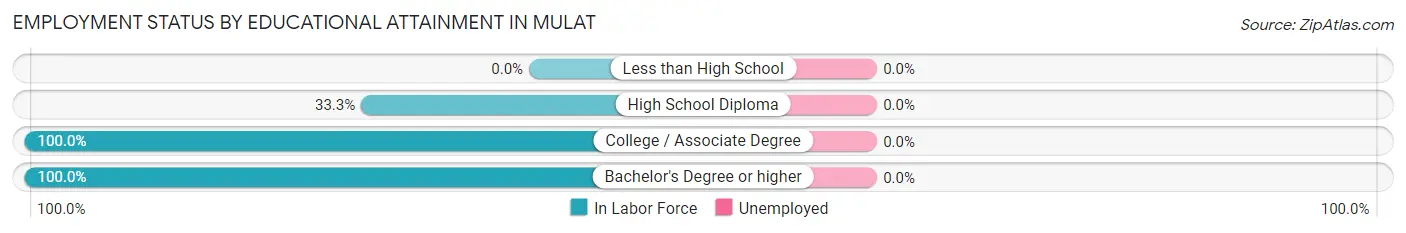
| Educational Attainment | In Labor Force | Unemployed |
| Less than High School | 0 (0.0%) | 0 (0.0%) |
| High School Diploma | 11 (33.3%) | 0 (0.0%) |
| College / Associate Degree | 9 (100.0%) | 0 (0.0%) |
| Bachelor's Degree or higher | 89 (100.0%) | 0 (0.0%) |
| Total | 109 (83.2%) | 0 (0.0%) |
Employment Occupations by Sex in Mulat
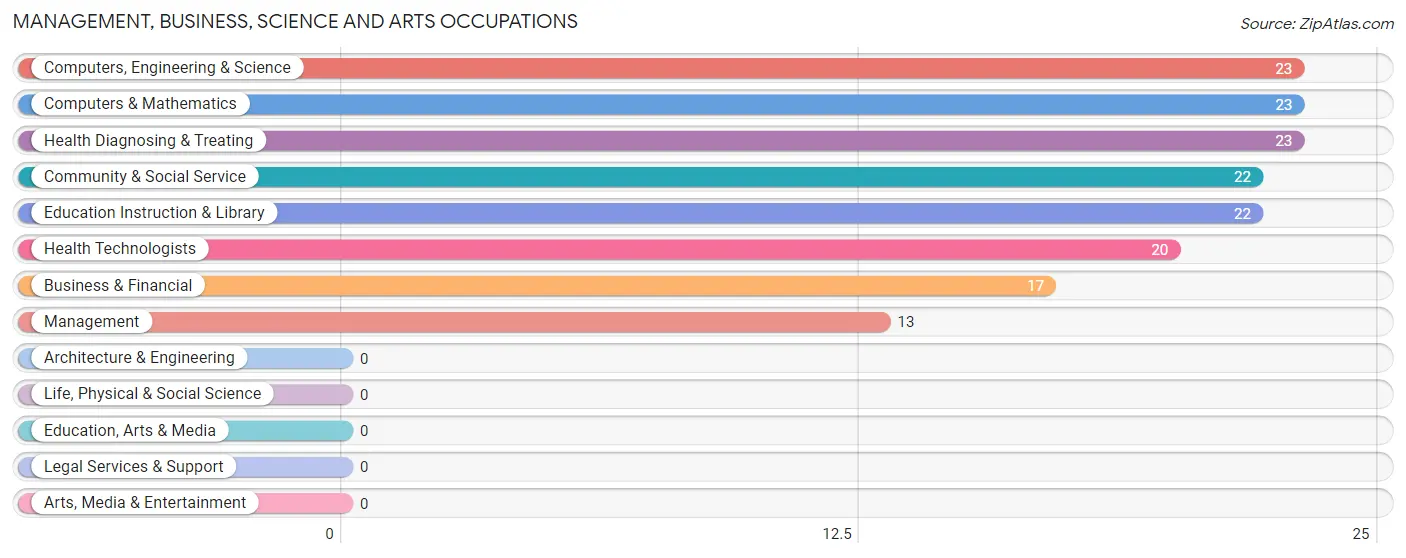
Management, Business, Science and Arts Occupations
The most common Management, Business, Science and Arts occupations in Mulat are Computers, Engineering & Science (23 | 21.1%), Computers & Mathematics (23 | 21.1%), Health Diagnosing & Treating (23 | 21.1%), Community & Social Service (22 | 20.2%), and Education Instruction & Library (22 | 20.2%).
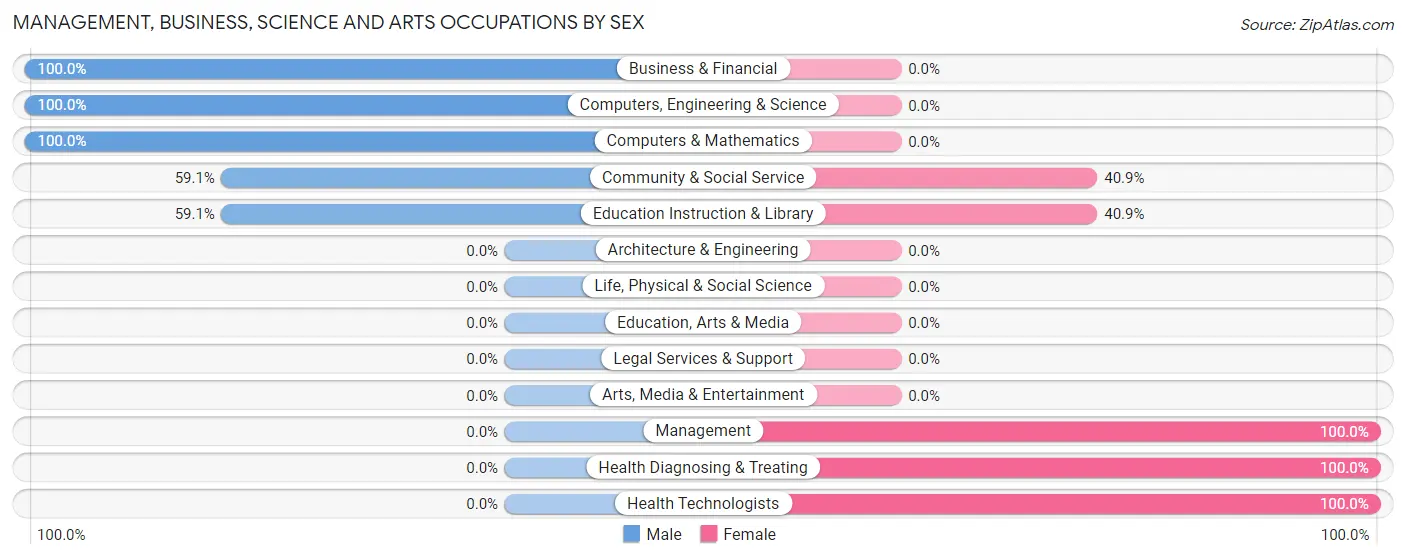
Management, Business, Science and Arts Occupations by Sex
Within the Management, Business, Science and Arts occupations in Mulat, the most male-oriented occupations are Business & Financial (100.0%), Computers, Engineering & Science (100.0%), and Computers & Mathematics (100.0%), while the most female-oriented occupations are Management (100.0%), Health Diagnosing & Treating (100.0%), and Health Technologists (100.0%).
| Occupation | Male | Female |
| Management | 0 (0.0%) | 13 (100.0%) |
| Business & Financial | 17 (100.0%) | 0 (0.0%) |
| Computers, Engineering & Science | 23 (100.0%) | 0 (0.0%) |
| Computers & Mathematics | 23 (100.0%) | 0 (0.0%) |
| Architecture & Engineering | 0 (0.0%) | 0 (0.0%) |
| Life, Physical & Social Science | 0 (0.0%) | 0 (0.0%) |
| Community & Social Service | 13 (59.1%) | 9 (40.9%) |
| Education, Arts & Media | 0 (0.0%) | 0 (0.0%) |
| Legal Services & Support | 0 (0.0%) | 0 (0.0%) |
| Education Instruction & Library | 13 (59.1%) | 9 (40.9%) |
| Arts, Media & Entertainment | 0 (0.0%) | 0 (0.0%) |
| Health Diagnosing & Treating | 0 (0.0%) | 23 (100.0%) |
| Health Technologists | 0 (0.0%) | 20 (100.0%) |
| Total (Category) | 53 (54.1%) | 45 (45.9%) |
| Total (Overall) | 64 (58.7%) | 45 (41.3%) |
Services Occupations
Services Occupations by Sex
| Occupation | Male | Female |
| Healthcare Support | 0 (0.0%) | 0 (0.0%) |
| Security & Protection | 0 (0.0%) | 0 (0.0%) |
| Firefighting & Prevention | 0 (0.0%) | 0 (0.0%) |
| Law Enforcement | 0 (0.0%) | 0 (0.0%) |
| Food Preparation & Serving | 0 (0.0%) | 0 (0.0%) |
| Cleaning & Maintenance | 0 (0.0%) | 0 (0.0%) |
| Personal Care & Service | 0 (0.0%) | 0 (0.0%) |
| Total (Category) | 0 (0.0%) | 0 (0.0%) |
| Total (Overall) | 64 (58.7%) | 45 (41.3%) |
Sales and Office Occupations
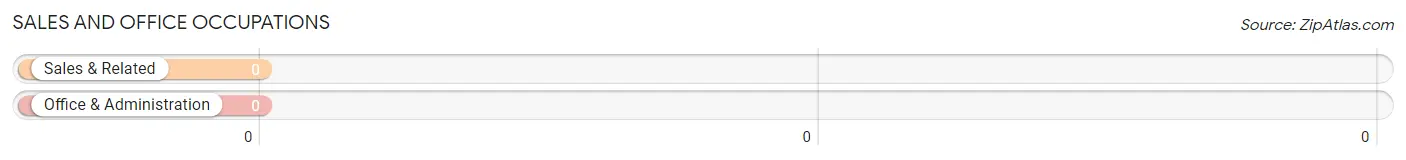
Sales and Office Occupations by Sex
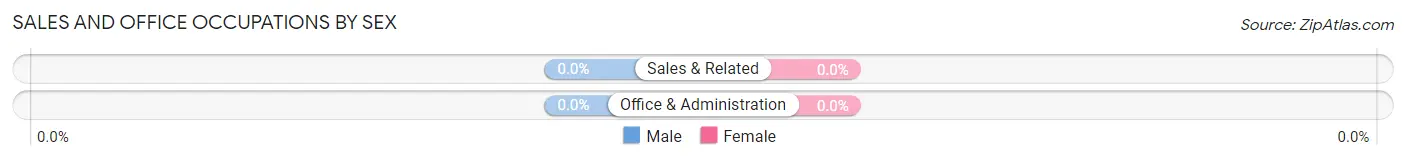
| Occupation | Male | Female |
| Sales & Related | 0 (0.0%) | 0 (0.0%) |
| Office & Administration | 0 (0.0%) | 0 (0.0%) |
| Total (Category) | 0 (0.0%) | 0 (0.0%) |
| Total (Overall) | 64 (58.7%) | 45 (41.3%) |
Natural Resources, Construction and Maintenance Occupations
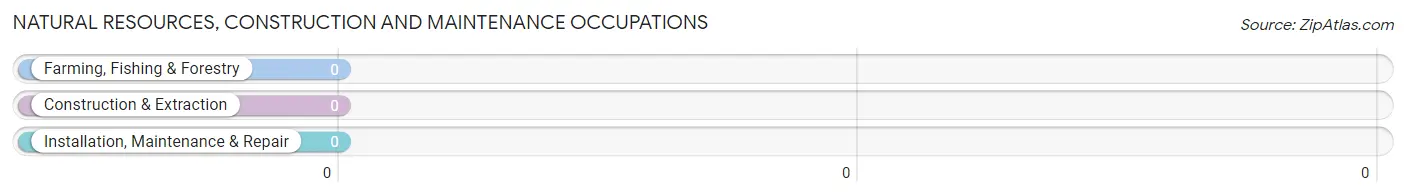
Natural Resources, Construction and Maintenance Occupations by Sex
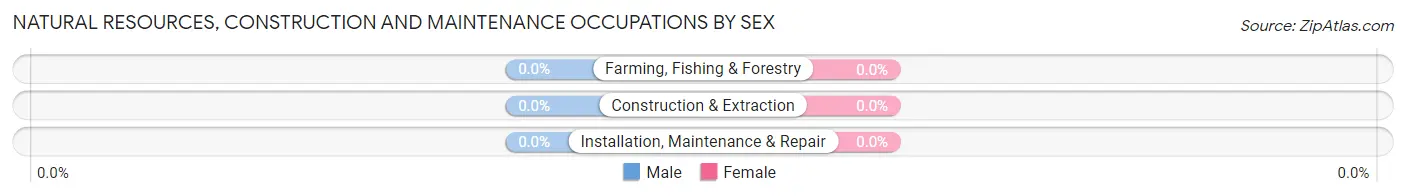
| Occupation | Male | Female |
| Farming, Fishing & Forestry | 0 (0.0%) | 0 (0.0%) |
| Construction & Extraction | 0 (0.0%) | 0 (0.0%) |
| Installation, Maintenance & Repair | 0 (0.0%) | 0 (0.0%) |
| Total (Category) | 0 (0.0%) | 0 (0.0%) |
| Total (Overall) | 64 (58.7%) | 45 (41.3%) |
Production, Transportation and Moving Occupations
The most common Production, Transportation and Moving occupations in Mulat are , and Material Moving (11 | 10.1%).
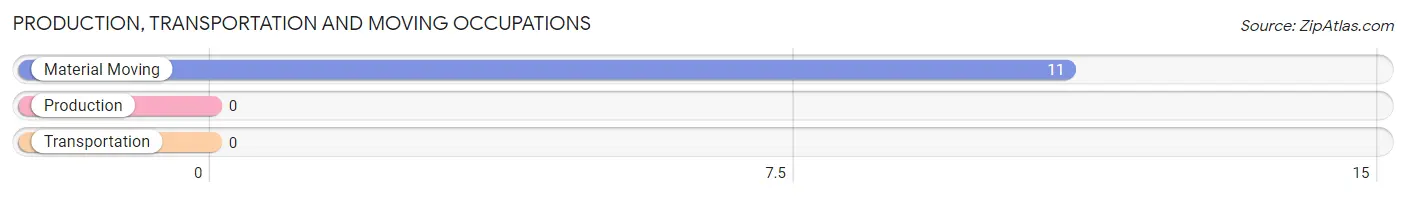
Production, Transportation and Moving Occupations by Sex
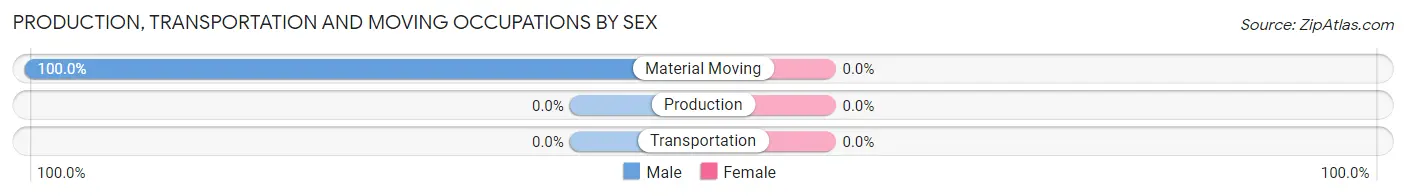
| Occupation | Male | Female |
| Production | 0 (0.0%) | 0 (0.0%) |
| Transportation | 0 (0.0%) | 0 (0.0%) |
| Material Moving | 11 (100.0%) | 0 (0.0%) |
| Total (Category) | 11 (100.0%) | 0 (0.0%) |
| Total (Overall) | 64 (58.7%) | 45 (41.3%) |
Employment Industries by Sex in Mulat
Employment Industries in Mulat
The major employment industries in Mulat include Professional & Scientific (23 | 21.1%), Health Care & Social Assistance (23 | 21.1%), Educational Services (22 | 20.2%), Finance & Insurance (17 | 15.6%), and Administrative & Support (13 | 11.9%).
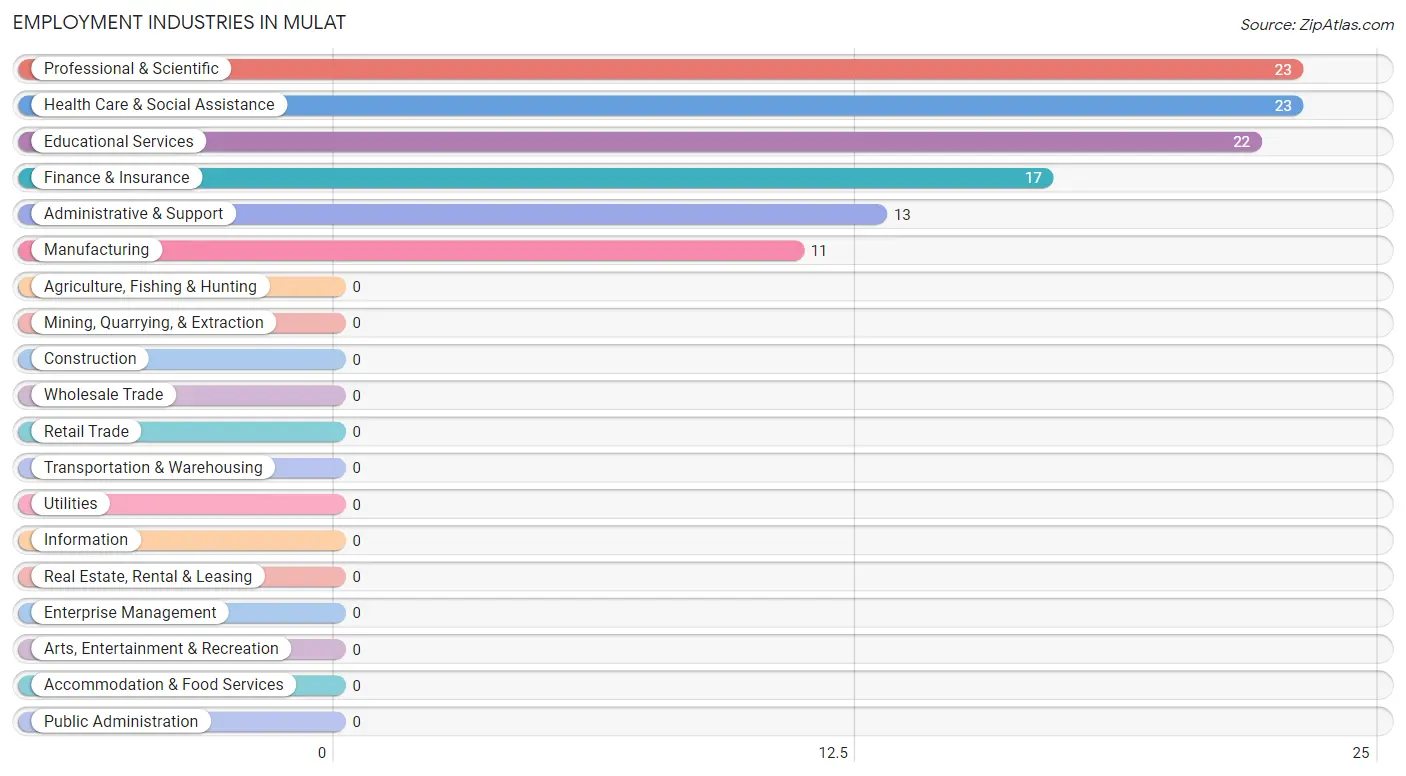
Employment Industries by Sex in Mulat
The Mulat industries that see more men than women are Manufacturing (100.0%), Finance & Insurance (100.0%), and Professional & Scientific (100.0%), whereas the industries that tend to have a higher number of women are Administrative & Support (100.0%), Health Care & Social Assistance (100.0%), and Educational Services (40.9%).
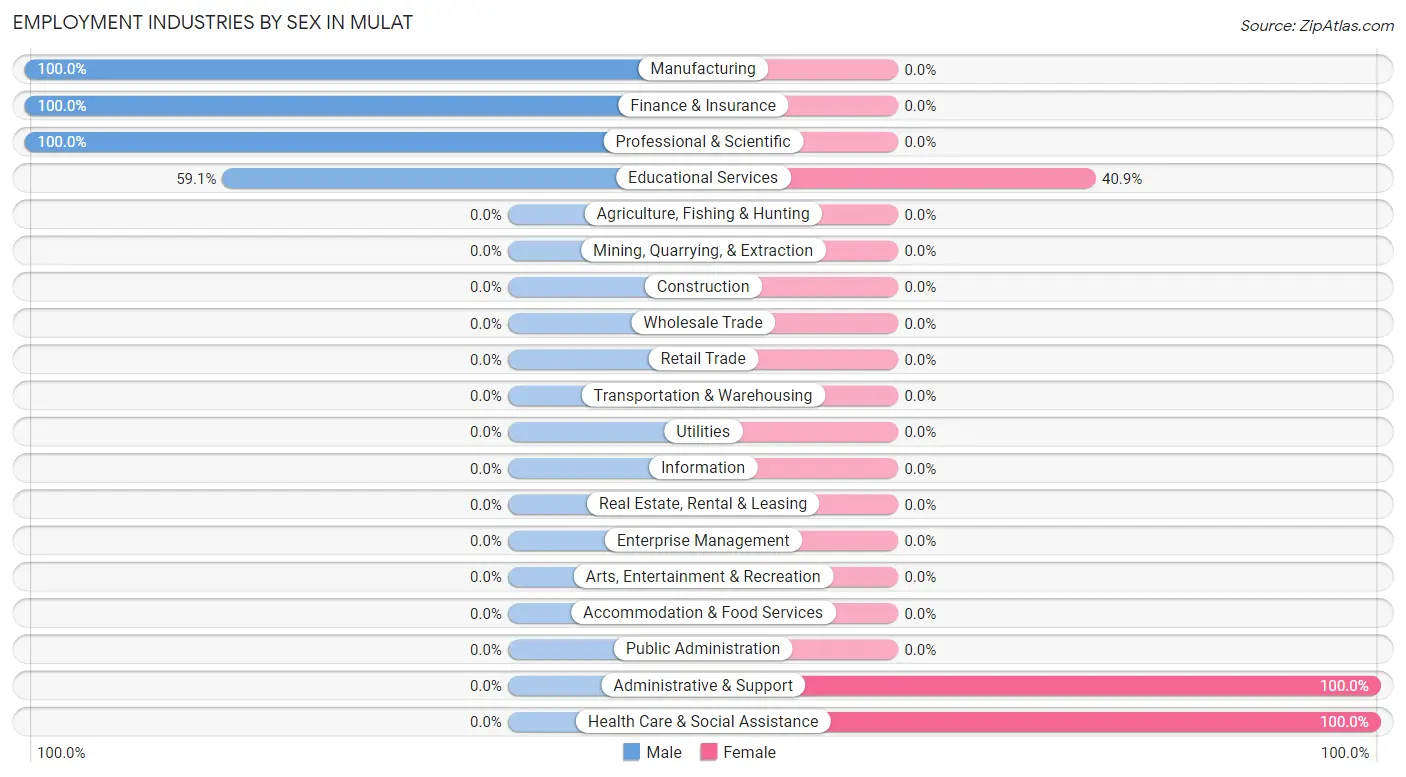
| Industry | Male | Female |
| Agriculture, Fishing & Hunting | 0 (0.0%) | 0 (0.0%) |
| Mining, Quarrying, & Extraction | 0 (0.0%) | 0 (0.0%) |
| Construction | 0 (0.0%) | 0 (0.0%) |
| Manufacturing | 11 (100.0%) | 0 (0.0%) |
| Wholesale Trade | 0 (0.0%) | 0 (0.0%) |
| Retail Trade | 0 (0.0%) | 0 (0.0%) |
| Transportation & Warehousing | 0 (0.0%) | 0 (0.0%) |
| Utilities | 0 (0.0%) | 0 (0.0%) |
| Information | 0 (0.0%) | 0 (0.0%) |
| Finance & Insurance | 17 (100.0%) | 0 (0.0%) |
| Real Estate, Rental & Leasing | 0 (0.0%) | 0 (0.0%) |
| Professional & Scientific | 23 (100.0%) | 0 (0.0%) |
| Enterprise Management | 0 (0.0%) | 0 (0.0%) |
| Administrative & Support | 0 (0.0%) | 13 (100.0%) |
| Educational Services | 13 (59.1%) | 9 (40.9%) |
| Health Care & Social Assistance | 0 (0.0%) | 23 (100.0%) |
| Arts, Entertainment & Recreation | 0 (0.0%) | 0 (0.0%) |
| Accommodation & Food Services | 0 (0.0%) | 0 (0.0%) |
| Public Administration | 0 (0.0%) | 0 (0.0%) |
| Total | 64 (58.7%) | 45 (41.3%) |
Education in Mulat
School Enrollment in Mulat
The most common levels of schooling among the 29 students in Mulat are elementary school (16 | 55.2%), college / undergraduate (9 | 31.0%), and high school (2 | 6.9%).
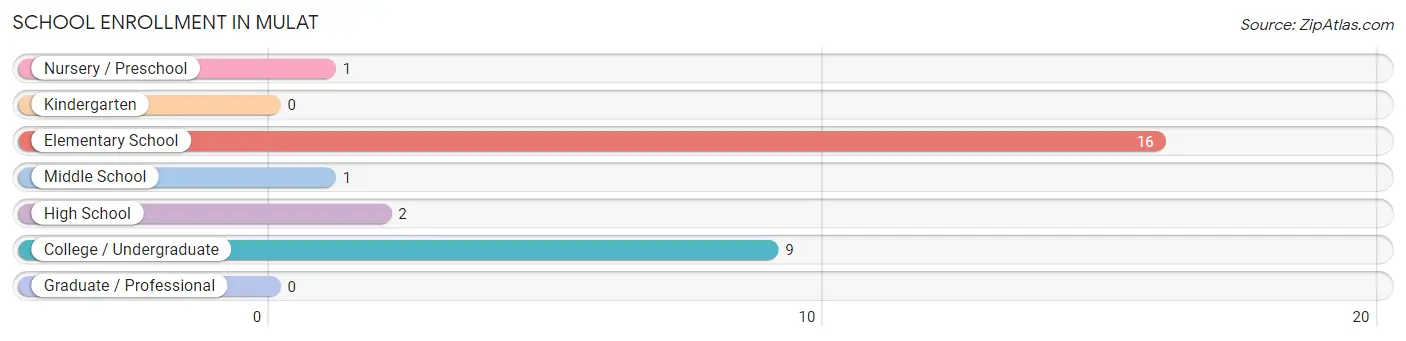
| School Level | # Students | % Students |
| Nursery / Preschool | 1 | 3.5% |
| Kindergarten | 0 | 0.0% |
| Elementary School | 16 | 55.2% |
| Middle School | 1 | 3.5% |
| High School | 2 | 6.9% |
| College / Undergraduate | 9 | 31.0% |
| Graduate / Professional | 0 | 0.0% |
| Total | 29 | 100.0% |
School Enrollment by Age by Funding Source in Mulat
Out of a total of 29 students who are enrolled in schools in Mulat, 9 (31.0%) attend a private institution, while the remaining 20 (69.0%) are enrolled in public schools. The age group of 3 to 4 year olds has the highest likelihood of being enrolled in private schools, with 1 (100.0% in the age bracket) enrolled. Conversely, the age group of 10 to 14 year olds has the lowest likelihood of being enrolled in a private school, with 1 (100.0% in the age bracket) attending a public institution.
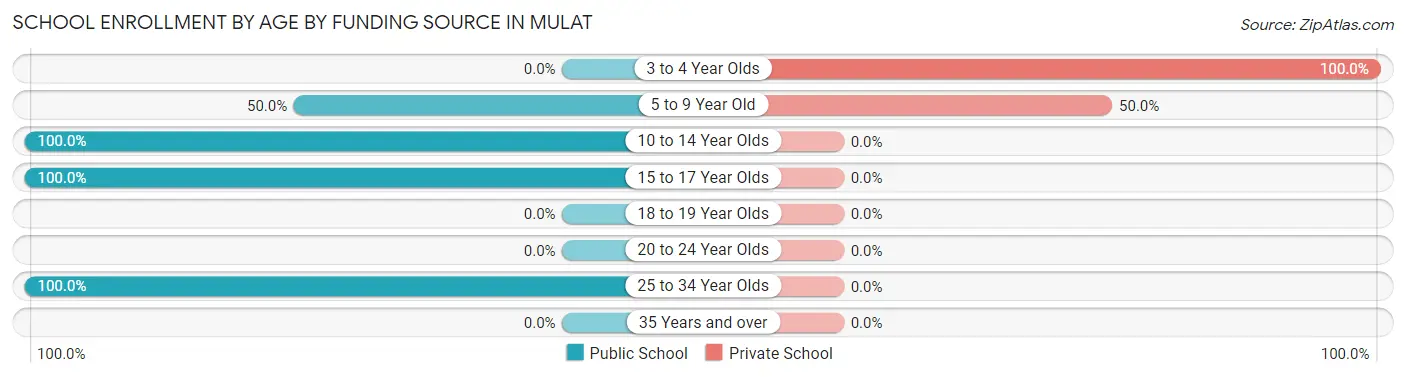
| Age Bracket | Public School | Private School |
| 3 to 4 Year Olds | 0 (0.0%) | 1 (100.0%) |
| 5 to 9 Year Old | 8 (50.0%) | 8 (50.0%) |
| 10 to 14 Year Olds | 1 (100.0%) | 0 (0.0%) |
| 15 to 17 Year Olds | 2 (100.0%) | 0 (0.0%) |
| 18 to 19 Year Olds | 0 (0.0%) | 0 (0.0%) |
| 20 to 24 Year Olds | 0 (0.0%) | 0 (0.0%) |
| 25 to 34 Year Olds | 9 (100.0%) | 0 (0.0%) |
| 35 Years and over | 0 (0.0%) | 0 (0.0%) |
| Total | 20 (69.0%) | 9 (31.0%) |
Educational Attainment by Field of Study in Mulat
Computers & mathematics (23 | 25.8%), bio, nature & agricultural (20 | 22.5%), literature & languages (20 | 22.5%), psychology (13 | 14.6%), and science & technology (13 | 14.6%) are the most common fields of study among 89 individuals in Mulat who have obtained a bachelor's degree or higher.
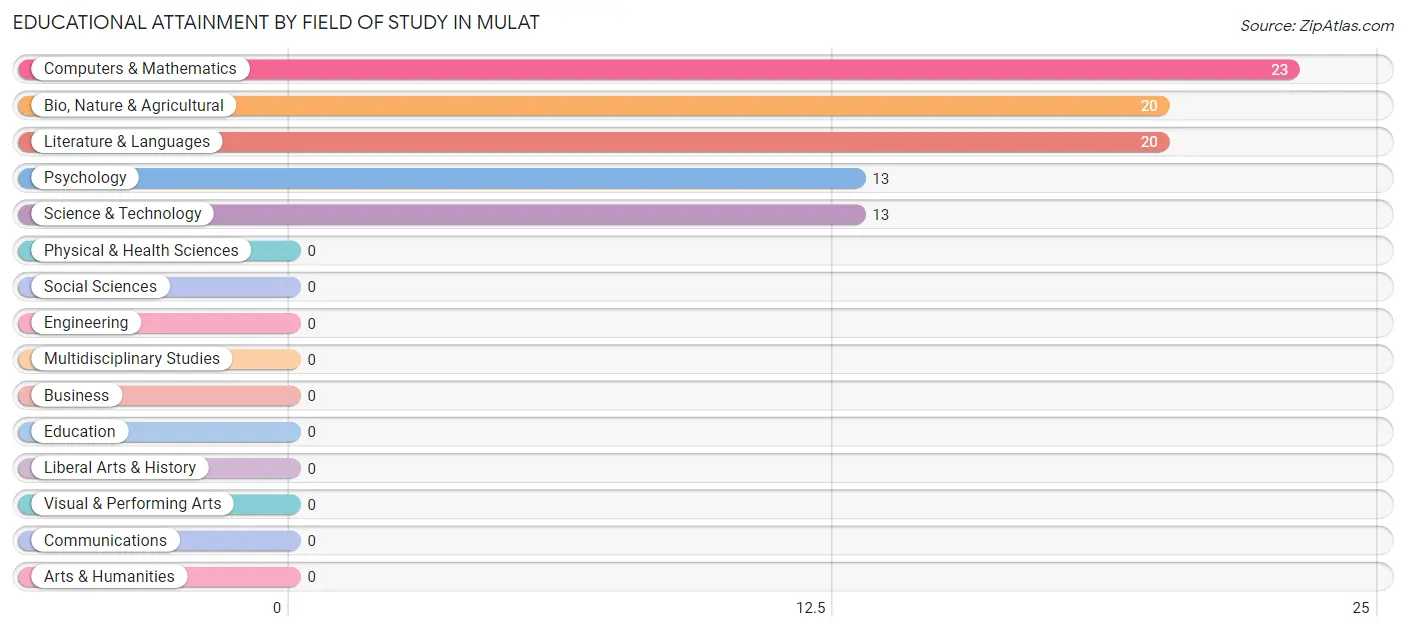
| Field of Study | # Graduates | % Graduates |
| Computers & Mathematics | 23 | 25.8% |
| Bio, Nature & Agricultural | 20 | 22.5% |
| Physical & Health Sciences | 0 | 0.0% |
| Psychology | 13 | 14.6% |
| Social Sciences | 0 | 0.0% |
| Engineering | 0 | 0.0% |
| Multidisciplinary Studies | 0 | 0.0% |
| Science & Technology | 13 | 14.6% |
| Business | 0 | 0.0% |
| Education | 0 | 0.0% |
| Literature & Languages | 20 | 22.5% |
| Liberal Arts & History | 0 | 0.0% |
| Visual & Performing Arts | 0 | 0.0% |
| Communications | 0 | 0.0% |
| Arts & Humanities | 0 | 0.0% |
| Total | 89 | 100.0% |
Transportation & Commute in Mulat
Vehicle Availability by Sex in Mulat
The most prevalent vehicle ownership categories in Mulat are males with 2 vehicles (64, accounting for 100.0%) and females with 2 vehicles (45, making up 142.2%).
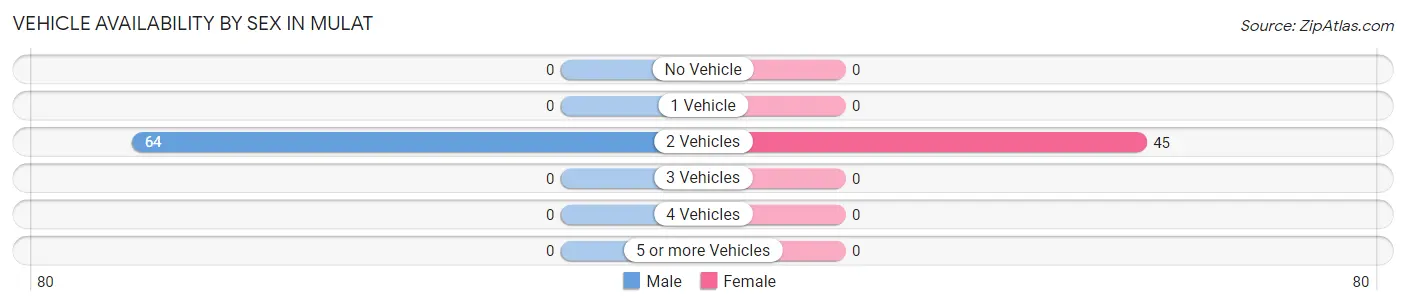
| Vehicles Available | Male | Female |
| No Vehicle | 0 (0.0%) | 0 (0.0%) |
| 1 Vehicle | 0 (0.0%) | 0 (0.0%) |
| 2 Vehicles | 64 (100.0%) | 45 (100.0%) |
| 3 Vehicles | 0 (0.0%) | 0 (0.0%) |
| 4 Vehicles | 0 (0.0%) | 0 (0.0%) |
| 5 or more Vehicles | 0 (0.0%) | 0 (0.0%) |
| Total | 64 (100.0%) | 45 (100.0%) |
Commute Time in Mulat
The most frequently occuring commute durations in Mulat are 25 to 29 minutes (20 commuters, 46.5%), 40 to 44 minutes (11 commuters, 25.6%), and 30 to 34 minutes (9 commuters, 20.9%).
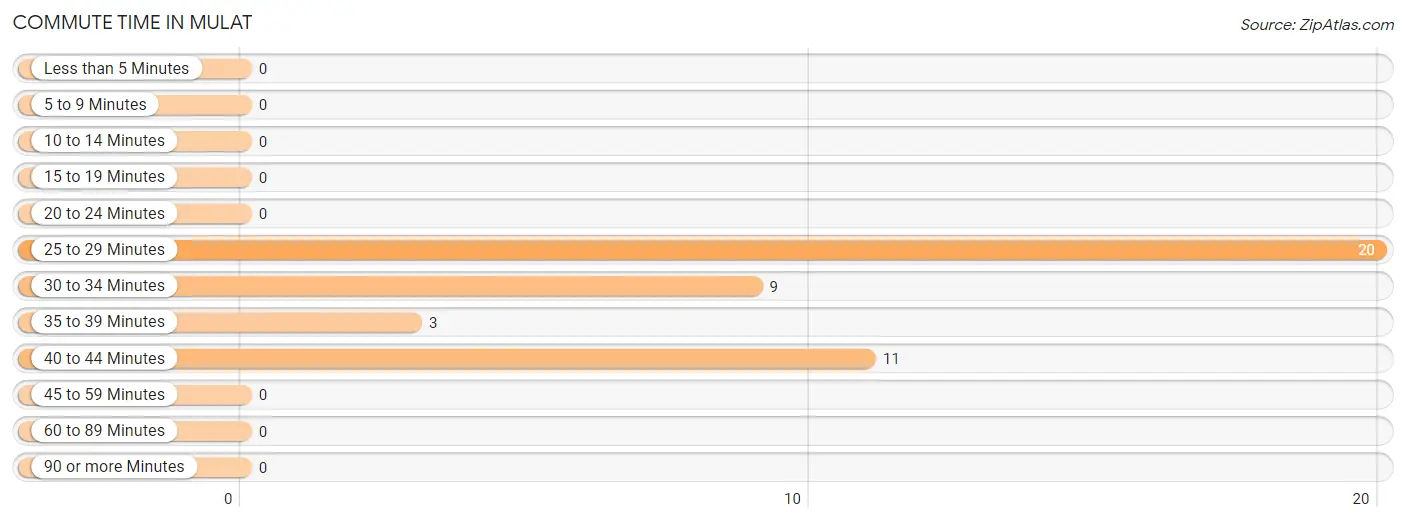
| Commute Time | # Commuters | % Commuters |
| Less than 5 Minutes | 0 | 0.0% |
| 5 to 9 Minutes | 0 | 0.0% |
| 10 to 14 Minutes | 0 | 0.0% |
| 15 to 19 Minutes | 0 | 0.0% |
| 20 to 24 Minutes | 0 | 0.0% |
| 25 to 29 Minutes | 20 | 46.5% |
| 30 to 34 Minutes | 9 | 20.9% |
| 35 to 39 Minutes | 3 | 7.0% |
| 40 to 44 Minutes | 11 | 25.6% |
| 45 to 59 Minutes | 0 | 0.0% |
| 60 to 89 Minutes | 0 | 0.0% |
| 90 or more Minutes | 0 | 0.0% |
Commute Time by Sex in Mulat
The most common commute times in Mulat are 40 to 44 minutes (11 commuters, 100.0%) for males and 25 to 29 minutes (20 commuters, 62.5%) for females.
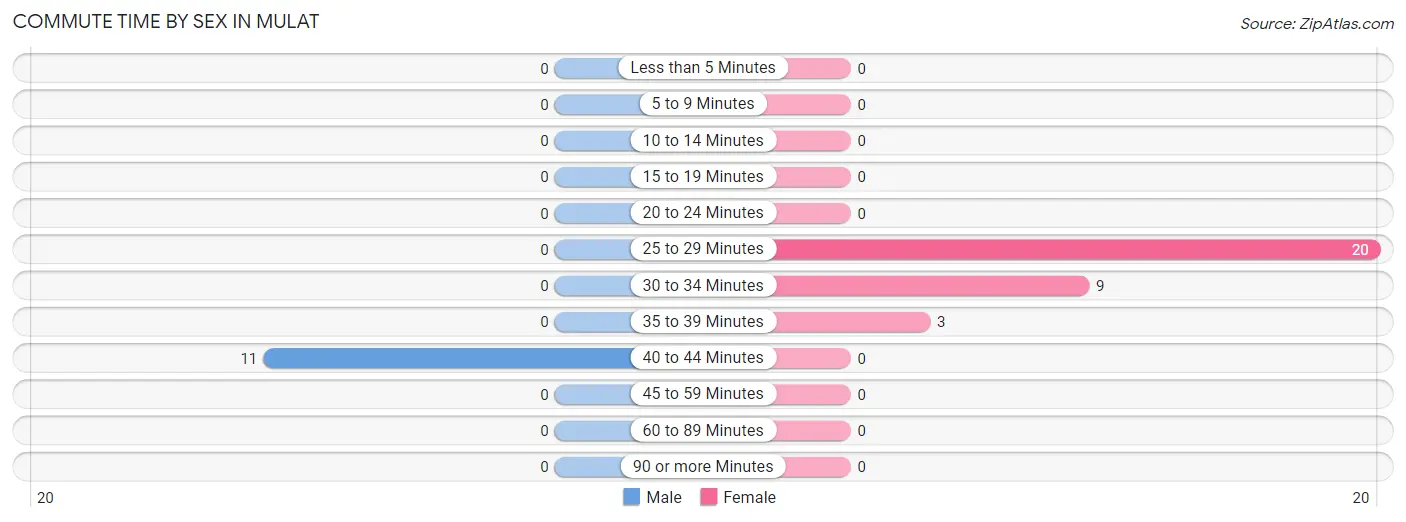
| Commute Time | Male | Female |
| Less than 5 Minutes | 0 (0.0%) | 0 (0.0%) |
| 5 to 9 Minutes | 0 (0.0%) | 0 (0.0%) |
| 10 to 14 Minutes | 0 (0.0%) | 0 (0.0%) |
| 15 to 19 Minutes | 0 (0.0%) | 0 (0.0%) |
| 20 to 24 Minutes | 0 (0.0%) | 0 (0.0%) |
| 25 to 29 Minutes | 0 (0.0%) | 20 (62.5%) |
| 30 to 34 Minutes | 0 (0.0%) | 9 (28.1%) |
| 35 to 39 Minutes | 0 (0.0%) | 3 (9.4%) |
| 40 to 44 Minutes | 11 (100.0%) | 0 (0.0%) |
| 45 to 59 Minutes | 0 (0.0%) | 0 (0.0%) |
| 60 to 89 Minutes | 0 (0.0%) | 0 (0.0%) |
| 90 or more Minutes | 0 (0.0%) | 0 (0.0%) |
Time of Departure to Work by Sex in Mulat
The most frequent times of departure to work in Mulat are 12:00 AM to 4:59 AM (11, 100.0%) for males and 8:00 AM to 8:29 AM (20, 62.5%) for females.
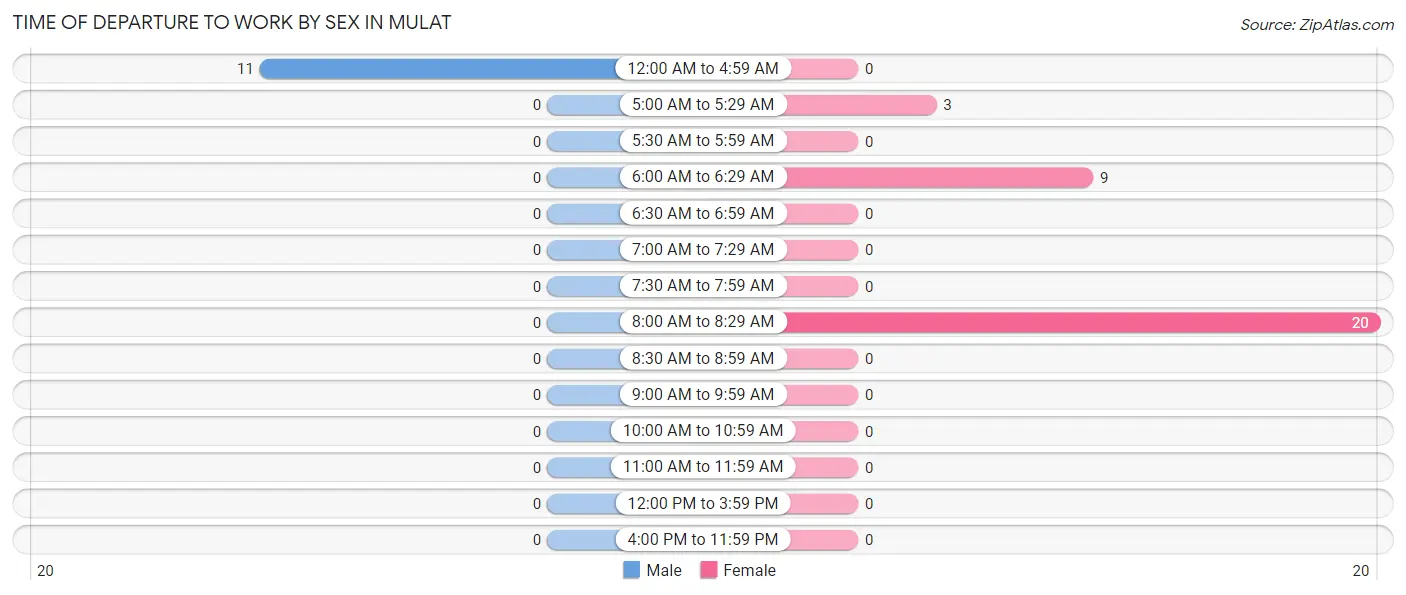
| Time of Departure | Male | Female |
| 12:00 AM to 4:59 AM | 11 (100.0%) | 0 (0.0%) |
| 5:00 AM to 5:29 AM | 0 (0.0%) | 3 (9.4%) |
| 5:30 AM to 5:59 AM | 0 (0.0%) | 0 (0.0%) |
| 6:00 AM to 6:29 AM | 0 (0.0%) | 9 (28.1%) |
| 6:30 AM to 6:59 AM | 0 (0.0%) | 0 (0.0%) |
| 7:00 AM to 7:29 AM | 0 (0.0%) | 0 (0.0%) |
| 7:30 AM to 7:59 AM | 0 (0.0%) | 0 (0.0%) |
| 8:00 AM to 8:29 AM | 0 (0.0%) | 20 (62.5%) |
| 8:30 AM to 8:59 AM | 0 (0.0%) | 0 (0.0%) |
| 9:00 AM to 9:59 AM | 0 (0.0%) | 0 (0.0%) |
| 10:00 AM to 10:59 AM | 0 (0.0%) | 0 (0.0%) |
| 11:00 AM to 11:59 AM | 0 (0.0%) | 0 (0.0%) |
| 12:00 PM to 3:59 PM | 0 (0.0%) | 0 (0.0%) |
| 4:00 PM to 11:59 PM | 0 (0.0%) | 0 (0.0%) |
| Total | 11 (100.0%) | 32 (100.0%) |
Housing Occupancy in Mulat
Occupancy by Ownership in Mulat
Of the total 75 dwellings in Mulat, owner-occupied units account for 66 (88.0%), while renter-occupied units make up 9 (12.0%).
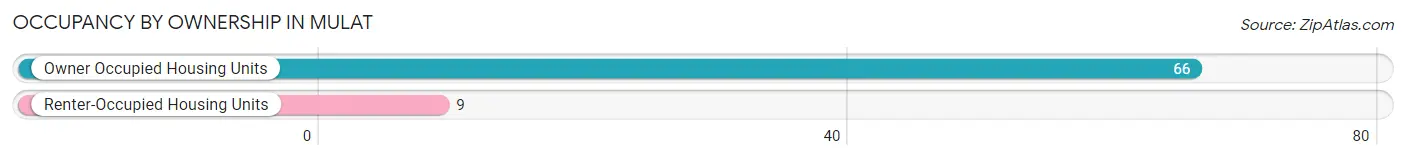
| Occupancy | # Housing Units | % Housing Units |
| Owner Occupied Housing Units | 66 | 88.0% |
| Renter-Occupied Housing Units | 9 | 12.0% |
| Total Occupied Housing Units | 75 | 100.0% |
Occupancy by Household Size in Mulat
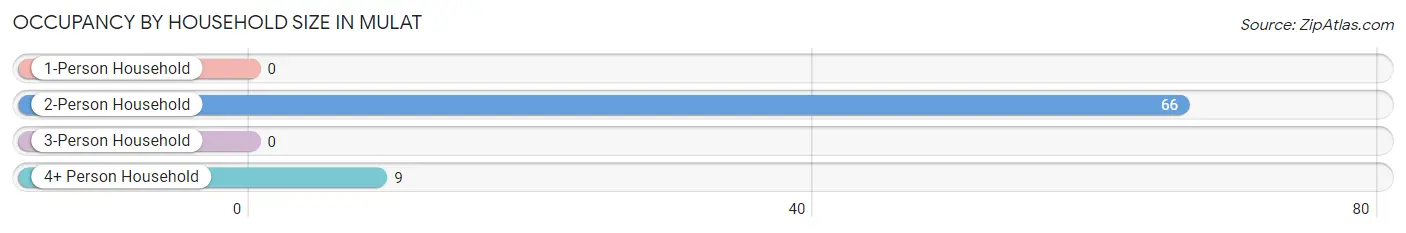
| Household Size | # Housing Units | % Housing Units |
| 1-Person Household | 0 | 0.0% |
| 2-Person Household | 66 | 88.0% |
| 3-Person Household | 0 | 0.0% |
| 4+ Person Household | 9 | 12.0% |
| Total Housing Units | 75 | 100.0% |
Occupancy by Ownership by Household Size in Mulat
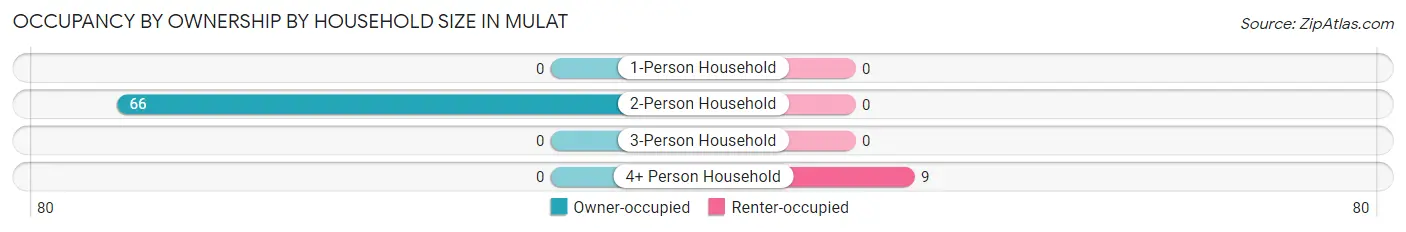
| Household Size | Owner-occupied | Renter-occupied |
| 1-Person Household | 0 (0.0%) | 0 (0.0%) |
| 2-Person Household | 66 (100.0%) | 0 (0.0%) |
| 3-Person Household | 0 (0.0%) | 0 (0.0%) |
| 4+ Person Household | 0 (0.0%) | 9 (100.0%) |
| Total Housing Units | 66 (88.0%) | 9 (12.0%) |
Occupancy by Educational Attainment in Mulat
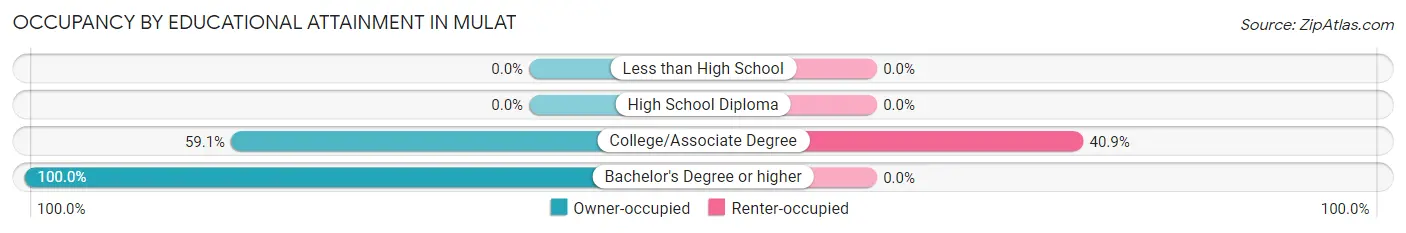
| Household Size | Owner-occupied | Renter-occupied |
| Less than High School | 0 (0.0%) | 0 (0.0%) |
| High School Diploma | 0 (0.0%) | 0 (0.0%) |
| College/Associate Degree | 13 (59.1%) | 9 (40.9%) |
| Bachelor's Degree or higher | 53 (100.0%) | 0 (0.0%) |
Occupancy by Age of Householder in Mulat
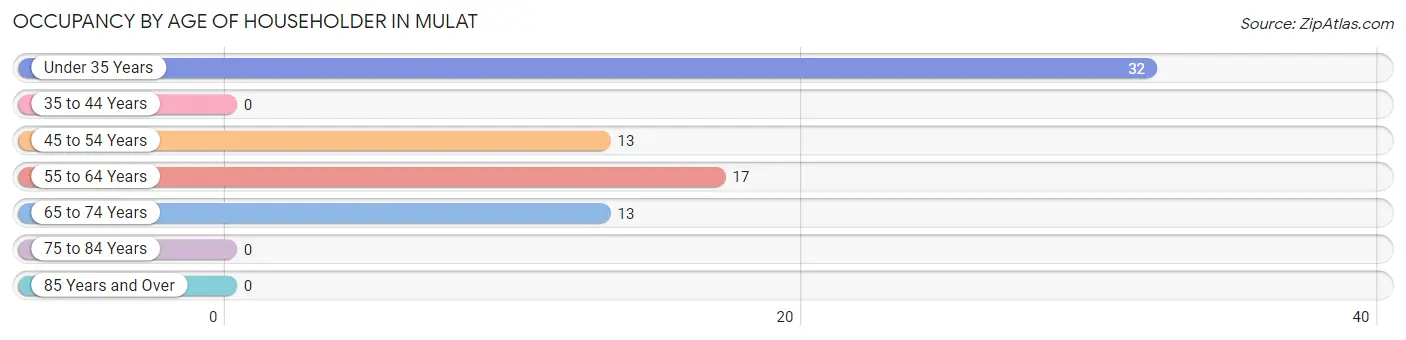
| Age Bracket | # Households | % Households |
| Under 35 Years | 32 | 42.7% |
| 35 to 44 Years | 0 | 0.0% |
| 45 to 54 Years | 13 | 17.3% |
| 55 to 64 Years | 17 | 22.7% |
| 65 to 74 Years | 13 | 17.3% |
| 75 to 84 Years | 0 | 0.0% |
| 85 Years and Over | 0 | 0.0% |
| Total | 75 | 100.0% |
Housing Finances in Mulat
Median Income by Occupancy in Mulat
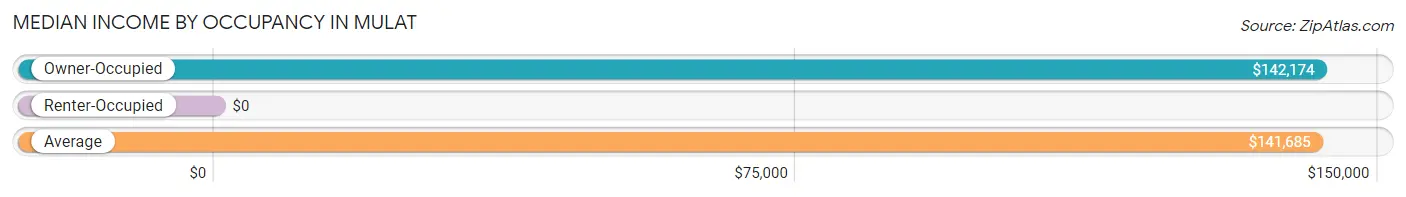
| Occupancy Type | # Households | Median Income |
| Owner-Occupied | 66 (88.0%) | $142,174 |
| Renter-Occupied | 9 (12.0%) | $0 |
| Average | 75 (100.0%) | $141,685 |
Occupancy by Householder Income Bracket in Mulat
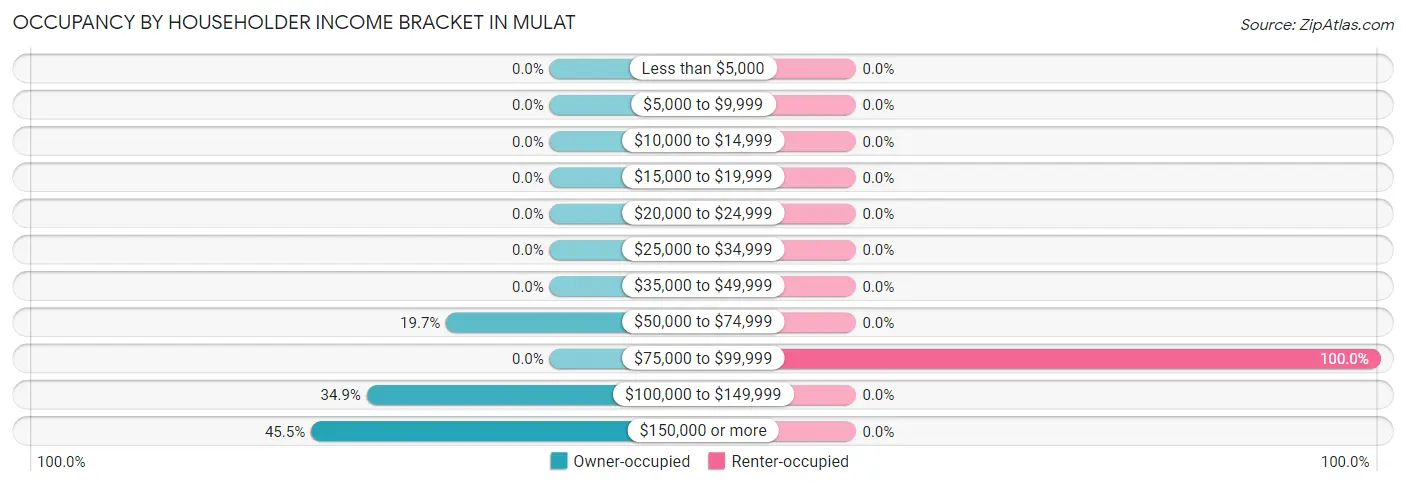
| Income Bracket | Owner-occupied | Renter-occupied |
| Less than $5,000 | 0 (0.0%) | 0 (0.0%) |
| $5,000 to $9,999 | 0 (0.0%) | 0 (0.0%) |
| $10,000 to $14,999 | 0 (0.0%) | 0 (0.0%) |
| $15,000 to $19,999 | 0 (0.0%) | 0 (0.0%) |
| $20,000 to $24,999 | 0 (0.0%) | 0 (0.0%) |
| $25,000 to $34,999 | 0 (0.0%) | 0 (0.0%) |
| $35,000 to $49,999 | 0 (0.0%) | 0 (0.0%) |
| $50,000 to $74,999 | 13 (19.7%) | 0 (0.0%) |
| $75,000 to $99,999 | 0 (0.0%) | 9 (100.0%) |
| $100,000 to $149,999 | 23 (34.8%) | 0 (0.0%) |
| $150,000 or more | 30 (45.5%) | 0 (0.0%) |
| Total | 66 (100.0%) | 9 (100.0%) |
Monthly Housing Cost Tiers in Mulat
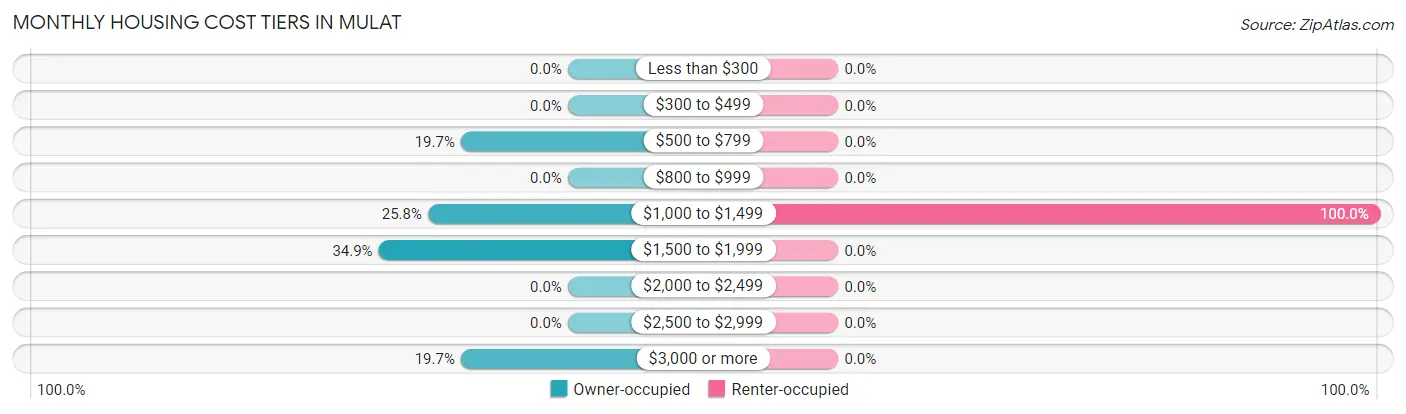
| Monthly Cost | Owner-occupied | Renter-occupied |
| Less than $300 | 0 (0.0%) | 0 (0.0%) |
| $300 to $499 | 0 (0.0%) | 0 (0.0%) |
| $500 to $799 | 13 (19.7%) | 0 (0.0%) |
| $800 to $999 | 0 (0.0%) | 0 (0.0%) |
| $1,000 to $1,499 | 17 (25.8%) | 9 (100.0%) |
| $1,500 to $1,999 | 23 (34.8%) | 0 (0.0%) |
| $2,000 to $2,499 | 0 (0.0%) | 0 (0.0%) |
| $2,500 to $2,999 | 0 (0.0%) | 0 (0.0%) |
| $3,000 or more | 13 (19.7%) | 0 (0.0%) |
| Total | 66 (100.0%) | 9 (100.0%) |
Physical Housing Characteristics in Mulat
Housing Structures in Mulat
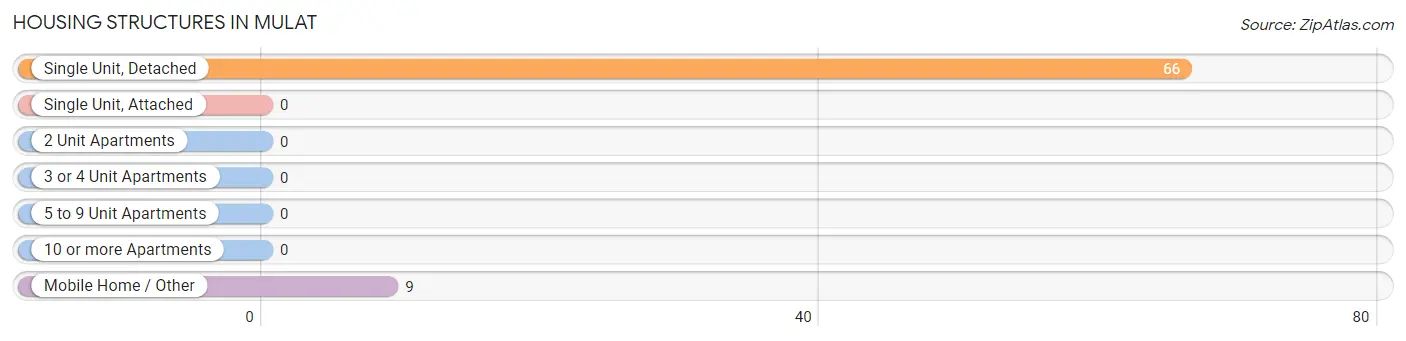
| Structure Type | # Housing Units | % Housing Units |
| Single Unit, Detached | 66 | 88.0% |
| Single Unit, Attached | 0 | 0.0% |
| 2 Unit Apartments | 0 | 0.0% |
| 3 or 4 Unit Apartments | 0 | 0.0% |
| 5 to 9 Unit Apartments | 0 | 0.0% |
| 10 or more Apartments | 0 | 0.0% |
| Mobile Home / Other | 9 | 12.0% |
| Total | 75 | 100.0% |
Housing Structures by Occupancy in Mulat
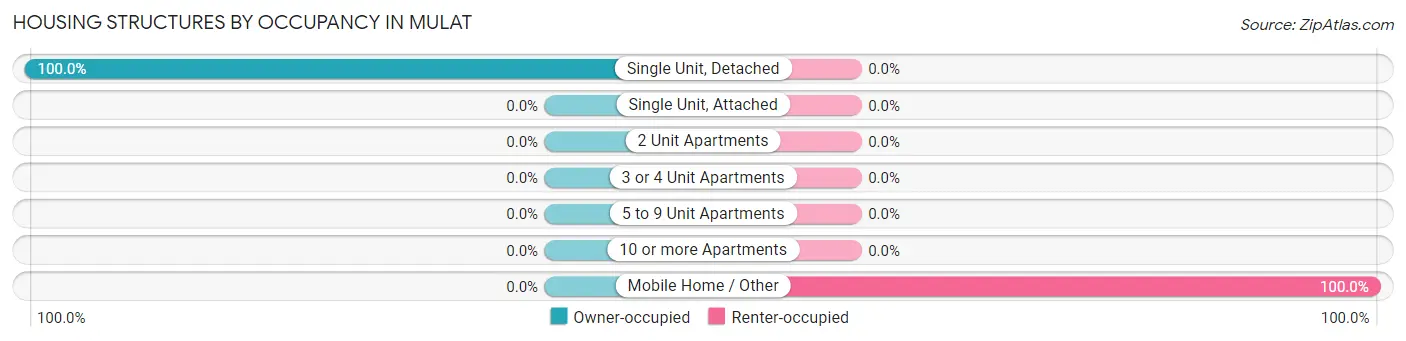
| Structure Type | Owner-occupied | Renter-occupied |
| Single Unit, Detached | 66 (100.0%) | 0 (0.0%) |
| Single Unit, Attached | 0 (0.0%) | 0 (0.0%) |
| 2 Unit Apartments | 0 (0.0%) | 0 (0.0%) |
| 3 or 4 Unit Apartments | 0 (0.0%) | 0 (0.0%) |
| 5 to 9 Unit Apartments | 0 (0.0%) | 0 (0.0%) |
| 10 or more Apartments | 0 (0.0%) | 0 (0.0%) |
| Mobile Home / Other | 0 (0.0%) | 9 (100.0%) |
| Total | 66 (88.0%) | 9 (12.0%) |
Housing Structures by Number of Rooms in Mulat
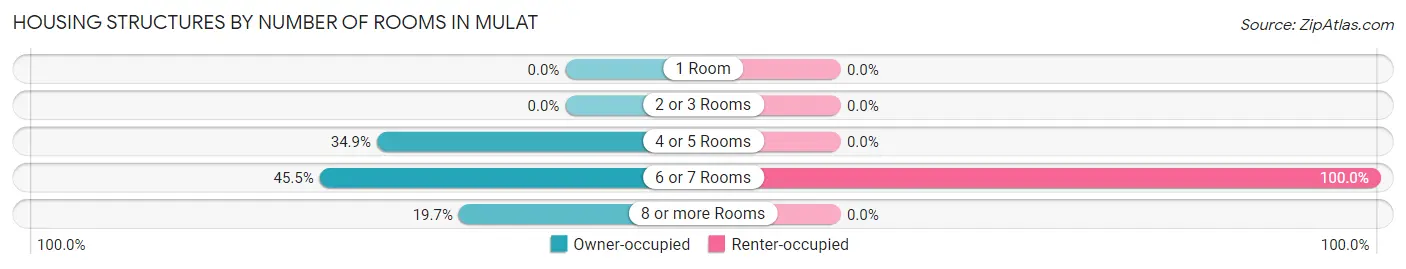
| Number of Rooms | Owner-occupied | Renter-occupied |
| 1 Room | 0 (0.0%) | 0 (0.0%) |
| 2 or 3 Rooms | 0 (0.0%) | 0 (0.0%) |
| 4 or 5 Rooms | 23 (34.8%) | 0 (0.0%) |
| 6 or 7 Rooms | 30 (45.5%) | 9 (100.0%) |
| 8 or more Rooms | 13 (19.7%) | 0 (0.0%) |
| Total | 66 (100.0%) | 9 (100.0%) |
Housing Structure by Heating Type in Mulat
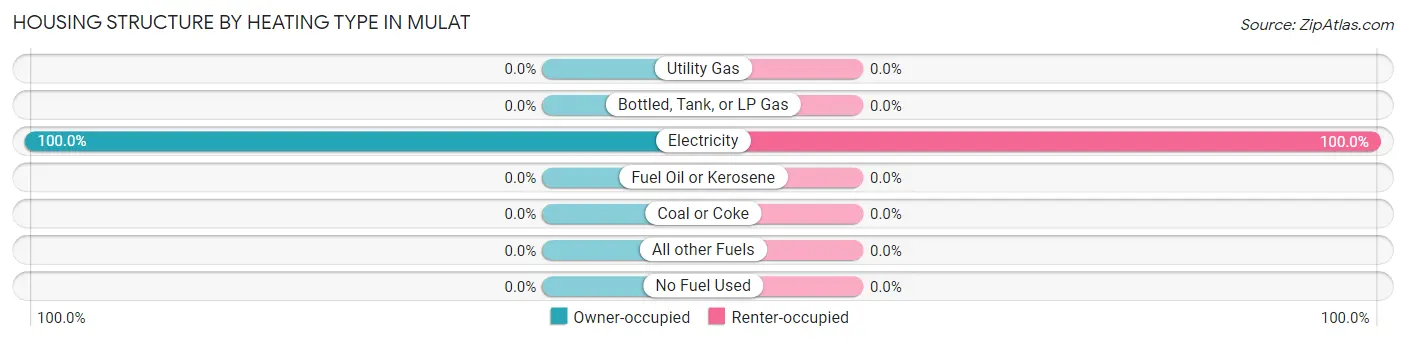
| Heating Type | Owner-occupied | Renter-occupied |
| Utility Gas | 0 (0.0%) | 0 (0.0%) |
| Bottled, Tank, or LP Gas | 0 (0.0%) | 0 (0.0%) |
| Electricity | 66 (100.0%) | 9 (100.0%) |
| Fuel Oil or Kerosene | 0 (0.0%) | 0 (0.0%) |
| Coal or Coke | 0 (0.0%) | 0 (0.0%) |
| All other Fuels | 0 (0.0%) | 0 (0.0%) |
| No Fuel Used | 0 (0.0%) | 0 (0.0%) |
| Total | 66 (100.0%) | 9 (100.0%) |
Household Vehicle Usage in Mulat
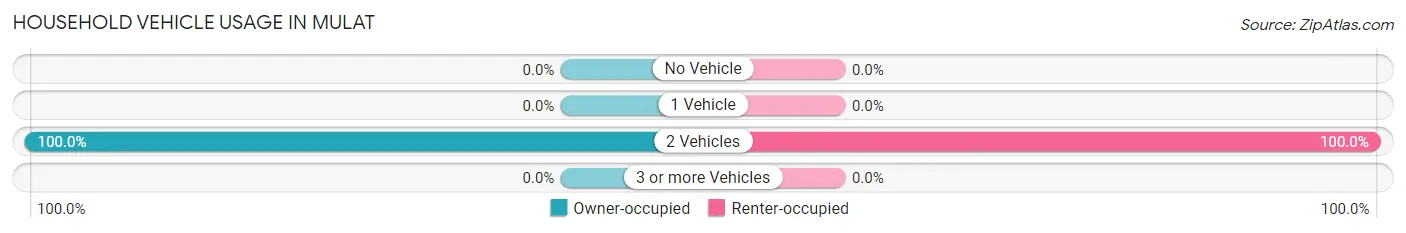
| Vehicles per Household | Owner-occupied | Renter-occupied |
| No Vehicle | 0 (0.0%) | 0 (0.0%) |
| 1 Vehicle | 0 (0.0%) | 0 (0.0%) |
| 2 Vehicles | 66 (100.0%) | 9 (100.0%) |
| 3 or more Vehicles | 0 (0.0%) | 0 (0.0%) |
| Total | 66 (100.0%) | 9 (100.0%) |
Real Estate & Mortgages in Mulat
Real Estate and Mortgage Overview in Mulat
| Characteristic | Without Mortgage | With Mortgage |
| Housing Units | 13 | 53 |
| Median Property Value | - | - |
| Median Household Income | - | - |
| Monthly Housing Costs | - | - |
| Real Estate Taxes | - | - |
Property Value by Mortgage Status in Mulat
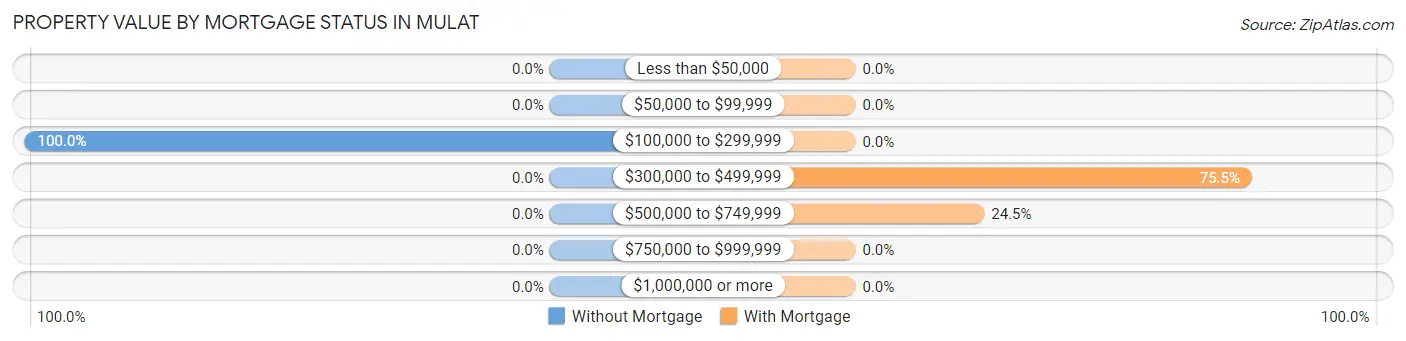
| Property Value | Without Mortgage | With Mortgage |
| Less than $50,000 | 0 (0.0%) | 0 (0.0%) |
| $50,000 to $99,999 | 0 (0.0%) | 0 (0.0%) |
| $100,000 to $299,999 | 13 (100.0%) | 0 (0.0%) |
| $300,000 to $499,999 | 0 (0.0%) | 40 (75.5%) |
| $500,000 to $749,999 | 0 (0.0%) | 13 (24.5%) |
| $750,000 to $999,999 | 0 (0.0%) | 0 (0.0%) |
| $1,000,000 or more | 0 (0.0%) | 0 (0.0%) |
| Total | 13 (100.0%) | 53 (100.0%) |
Household Income by Mortgage Status in Mulat
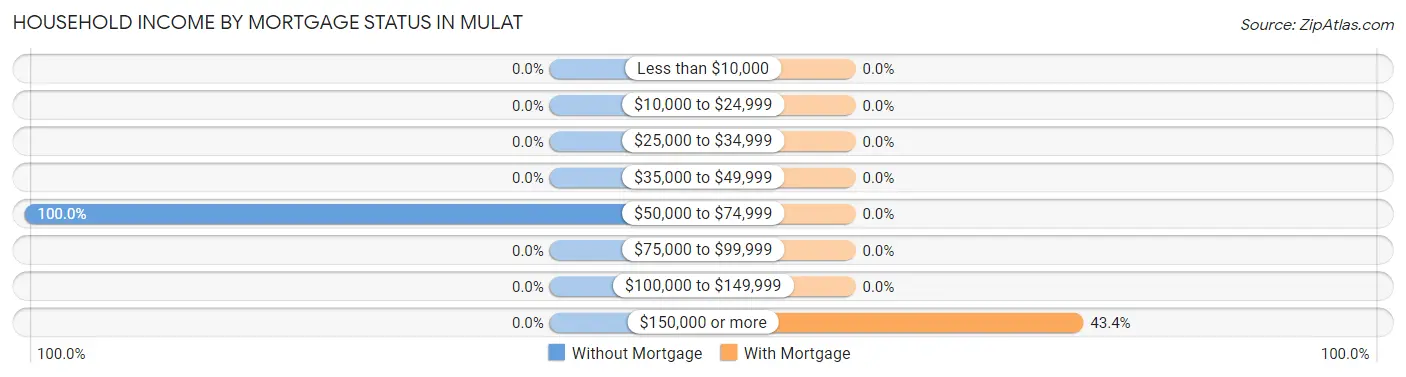
| Household Income | Without Mortgage | With Mortgage |
| Less than $10,000 | 0 (0.0%) | 0 (0.0%) |
| $10,000 to $24,999 | 0 (0.0%) | 0 (0.0%) |
| $25,000 to $34,999 | 0 (0.0%) | 0 (0.0%) |
| $35,000 to $49,999 | 0 (0.0%) | 0 (0.0%) |
| $50,000 to $74,999 | 13 (100.0%) | 0 (0.0%) |
| $75,000 to $99,999 | 0 (0.0%) | 0 (0.0%) |
| $100,000 to $149,999 | 0 (0.0%) | 0 (0.0%) |
| $150,000 or more | 0 (0.0%) | 23 (43.4%) |
| Total | 13 (100.0%) | 53 (100.0%) |
Property Value to Household Income Ratio in Mulat
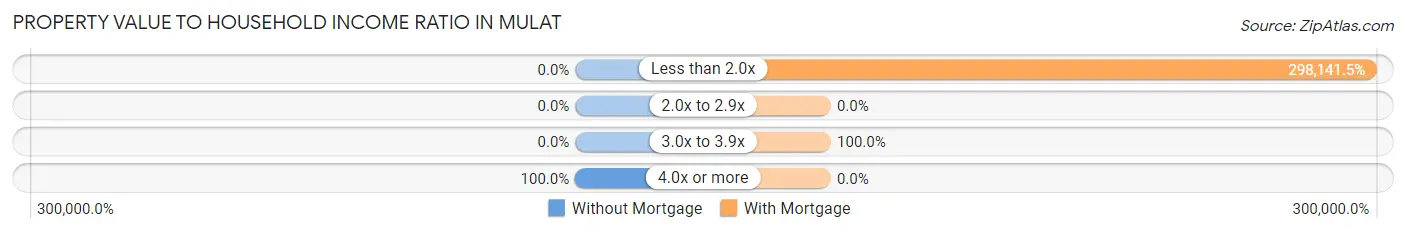
| Value-to-Income Ratio | Without Mortgage | With Mortgage |
| Less than 2.0x | 0 (0.0%) | 158,015 (298,141.5%) |
| 2.0x to 2.9x | 0 (0.0%) | 0 (0.0%) |
| 3.0x to 3.9x | 0 (0.0%) | 53 (100.0%) |
| 4.0x or more | 13 (100.0%) | 0 (0.0%) |
| Total | 13 (100.0%) | 53 (100.0%) |
Real Estate Taxes by Mortgage Status in Mulat
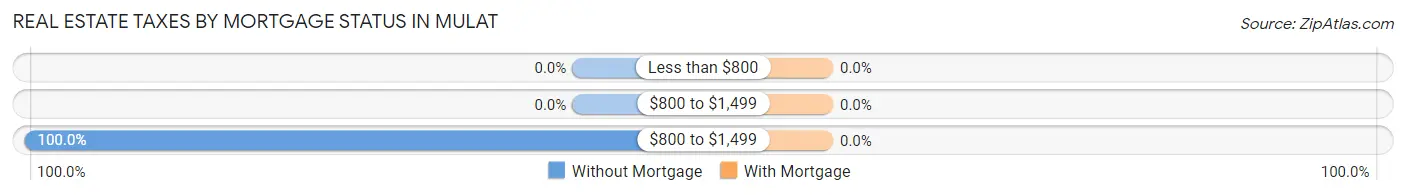
| Property Taxes | Without Mortgage | With Mortgage |
| Less than $800 | 0 (0.0%) | 0 (0.0%) |
| $800 to $1,499 | 0 (0.0%) | 0 (0.0%) |
| $800 to $1,499 | 13 (100.0%) | 0 (0.0%) |
| Total | 13 (100.0%) | 53 (100.0%) |
Health & Disability in Mulat
Health Insurance Coverage by Age in Mulat
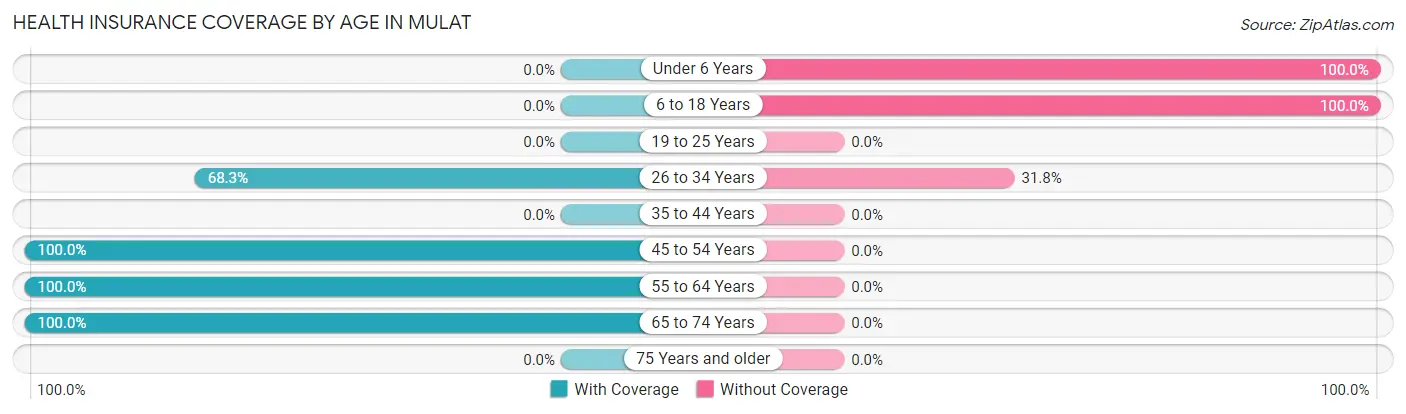
| Age Bracket | With Coverage | Without Coverage |
| Under 6 Years | 0 (0.0%) | 9 (100.0%) |
| 6 to 18 Years | 0 (0.0%) | 16 (100.0%) |
| 19 to 25 Years | 0 (0.0%) | 0 (0.0%) |
| 26 to 34 Years | 43 (68.2%) | 20 (31.8%) |
| 35 to 44 Years | 0 (0.0%) | 0 (0.0%) |
| 45 to 54 Years | 38 (100.0%) | 0 (0.0%) |
| 55 to 64 Years | 30 (100.0%) | 0 (0.0%) |
| 65 to 74 Years | 13 (100.0%) | 0 (0.0%) |
| 75 Years and older | 0 (0.0%) | 0 (0.0%) |
| Total | 124 (73.4%) | 45 (26.6%) |
Health Insurance Coverage by Citizenship Status in Mulat
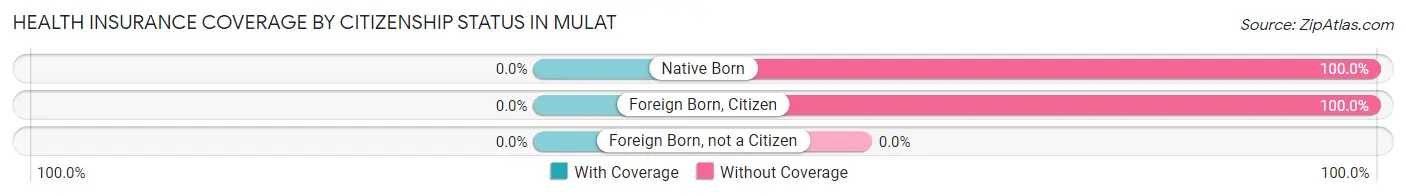
| Citizenship Status | With Coverage | Without Coverage |
| Native Born | 0 (0.0%) | 9 (100.0%) |
| Foreign Born, Citizen | 0 (0.0%) | 16 (100.0%) |
| Foreign Born, not a Citizen | 0 (0.0%) | 0 (0.0%) |
Health Insurance Coverage by Household Income in Mulat
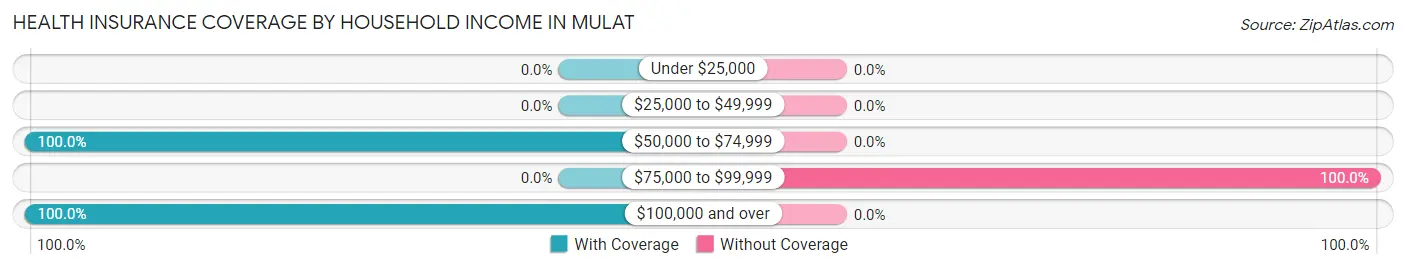
| Household Income | With Coverage | Without Coverage |
| Under $25,000 | 0 (0.0%) | 0 (0.0%) |
| $25,000 to $49,999 | 0 (0.0%) | 0 (0.0%) |
| $50,000 to $74,999 | 16 (100.0%) | 0 (0.0%) |
| $75,000 to $99,999 | 0 (0.0%) | 45 (100.0%) |
| $100,000 and over | 108 (100.0%) | 0 (0.0%) |
Public vs Private Health Insurance Coverage by Age in Mulat
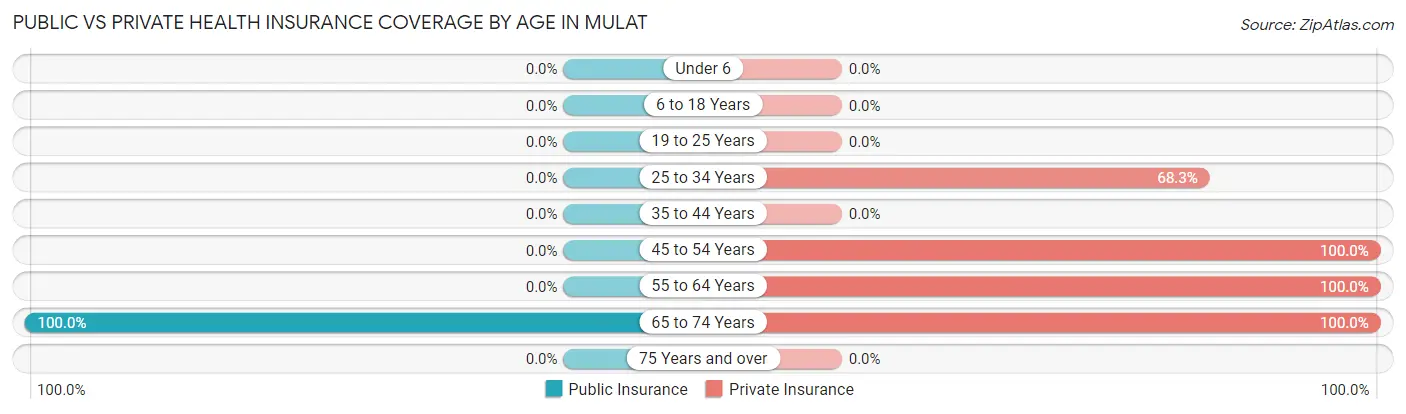
| Age Bracket | Public Insurance | Private Insurance |
| Under 6 | 0 (0.0%) | 0 (0.0%) |
| 6 to 18 Years | 0 (0.0%) | 0 (0.0%) |
| 19 to 25 Years | 0 (0.0%) | 0 (0.0%) |
| 25 to 34 Years | 0 (0.0%) | 43 (68.2%) |
| 35 to 44 Years | 0 (0.0%) | 0 (0.0%) |
| 45 to 54 Years | 0 (0.0%) | 38 (100.0%) |
| 55 to 64 Years | 0 (0.0%) | 30 (100.0%) |
| 65 to 74 Years | 13 (100.0%) | 13 (100.0%) |
| 75 Years and over | 0 (0.0%) | 0 (0.0%) |
| Total | 13 (7.7%) | 124 (73.4%) |
Disability Status by Sex by Age in Mulat
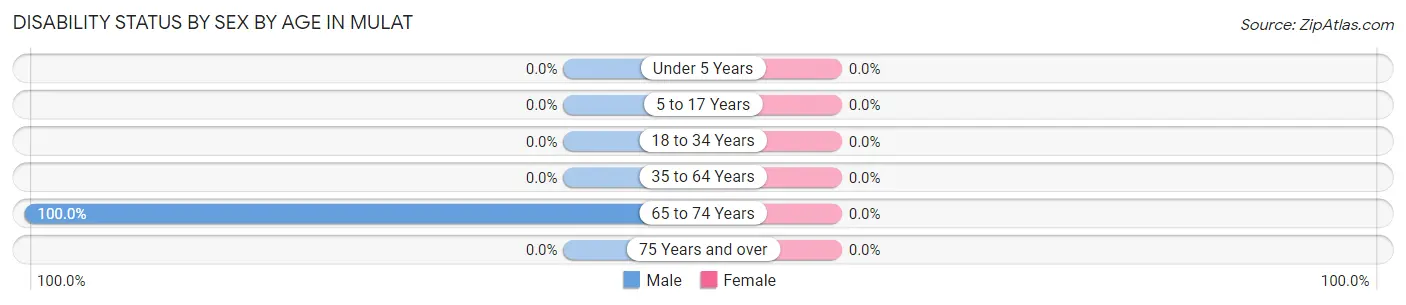
| Age Bracket | Male | Female |
| Under 5 Years | 0 (0.0%) | 0 (0.0%) |
| 5 to 17 Years | 0 (0.0%) | 0 (0.0%) |
| 18 to 34 Years | 0 (0.0%) | 0 (0.0%) |
| 35 to 64 Years | 0 (0.0%) | 0 (0.0%) |
| 65 to 74 Years | 13 (100.0%) | 0 (0.0%) |
| 75 Years and over | 0 (0.0%) | 0 (0.0%) |
Disability Class by Sex by Age in Mulat
Disability Class: Hearing Difficulty
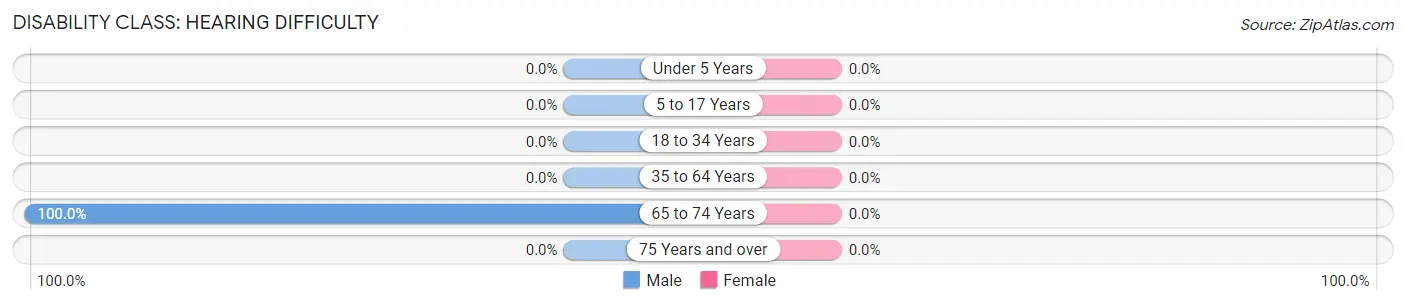
| Age Bracket | Male | Female |
| Under 5 Years | 0 (0.0%) | 0 (0.0%) |
| 5 to 17 Years | 0 (0.0%) | 0 (0.0%) |
| 18 to 34 Years | 0 (0.0%) | 0 (0.0%) |
| 35 to 64 Years | 0 (0.0%) | 0 (0.0%) |
| 65 to 74 Years | 13 (100.0%) | 0 (0.0%) |
| 75 Years and over | 0 (0.0%) | 0 (0.0%) |
Disability Class: Vision Difficulty
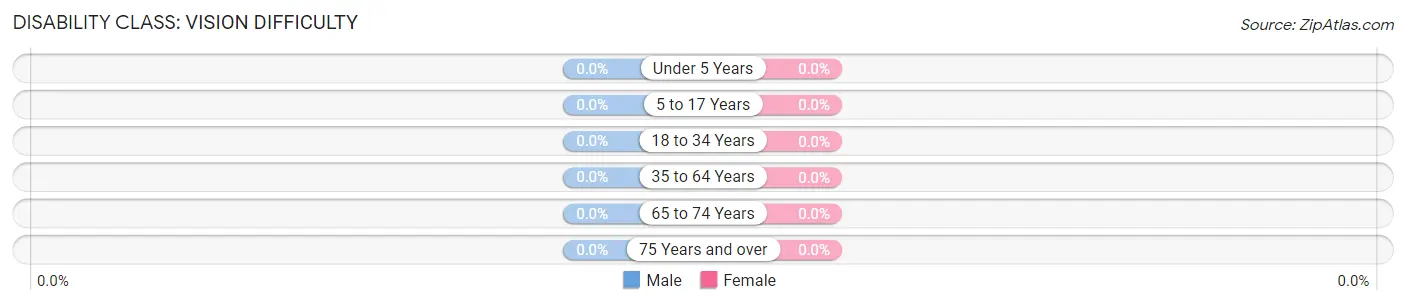
| Age Bracket | Male | Female |
| Under 5 Years | 0 (0.0%) | 0 (0.0%) |
| 5 to 17 Years | 0 (0.0%) | 0 (0.0%) |
| 18 to 34 Years | 0 (0.0%) | 0 (0.0%) |
| 35 to 64 Years | 0 (0.0%) | 0 (0.0%) |
| 65 to 74 Years | 0 (0.0%) | 0 (0.0%) |
| 75 Years and over | 0 (0.0%) | 0 (0.0%) |
Disability Class: Cognitive Difficulty

| Age Bracket | Male | Female |
| 5 to 17 Years | 0 (0.0%) | 0 (0.0%) |
| 18 to 34 Years | 0 (0.0%) | 0 (0.0%) |
| 35 to 64 Years | 0 (0.0%) | 0 (0.0%) |
| 65 to 74 Years | 0 (0.0%) | 0 (0.0%) |
| 75 Years and over | 0 (0.0%) | 0 (0.0%) |
Disability Class: Ambulatory Difficulty
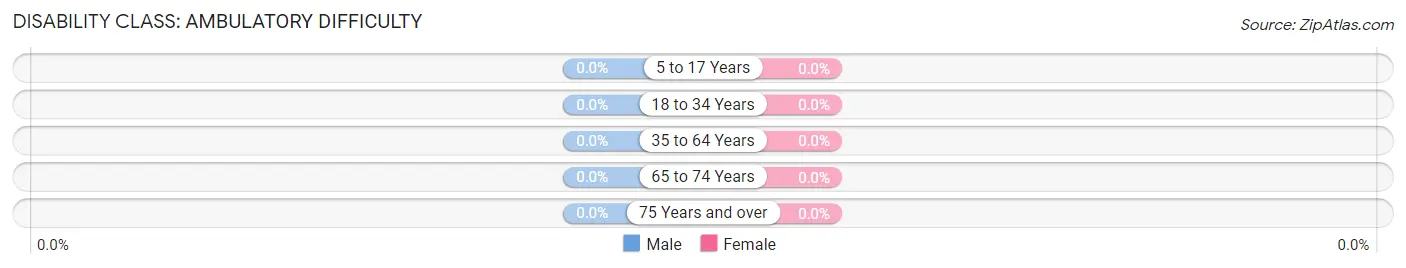
| Age Bracket | Male | Female |
| 5 to 17 Years | 0 (0.0%) | 0 (0.0%) |
| 18 to 34 Years | 0 (0.0%) | 0 (0.0%) |
| 35 to 64 Years | 0 (0.0%) | 0 (0.0%) |
| 65 to 74 Years | 0 (0.0%) | 0 (0.0%) |
| 75 Years and over | 0 (0.0%) | 0 (0.0%) |
Disability Class: Self-Care Difficulty
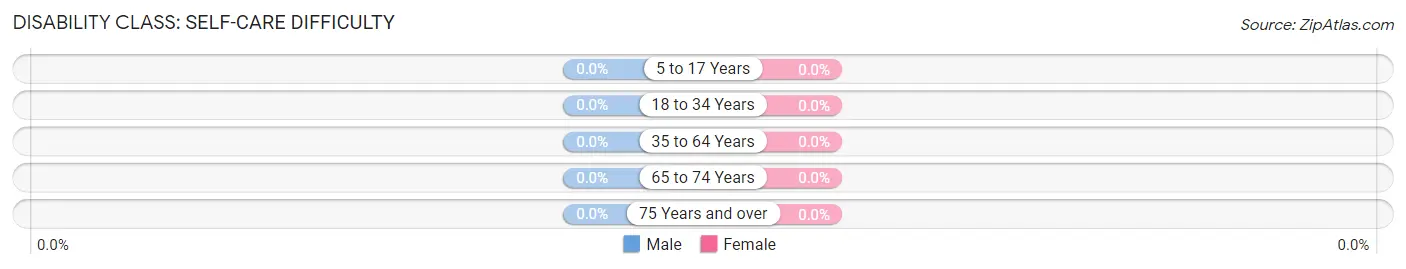
| Age Bracket | Male | Female |
| 5 to 17 Years | 0 (0.0%) | 0 (0.0%) |
| 18 to 34 Years | 0 (0.0%) | 0 (0.0%) |
| 35 to 64 Years | 0 (0.0%) | 0 (0.0%) |
| 65 to 74 Years | 0 (0.0%) | 0 (0.0%) |
| 75 Years and over | 0 (0.0%) | 0 (0.0%) |
Technology Access in Mulat
Computing Device Access in Mulat
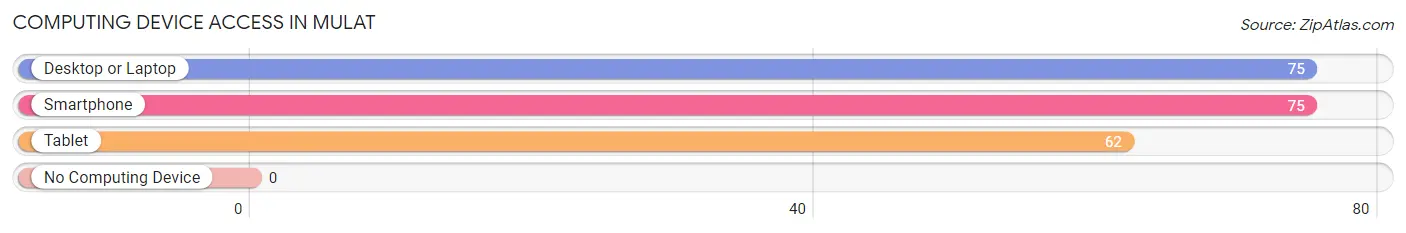
| Device Type | # Households | % Households |
| Desktop or Laptop | 75 | 100.0% |
| Smartphone | 75 | 100.0% |
| Tablet | 62 | 82.7% |
| No Computing Device | 0 | 0.0% |
| Total | 75 | 100.0% |
Internet Access in Mulat
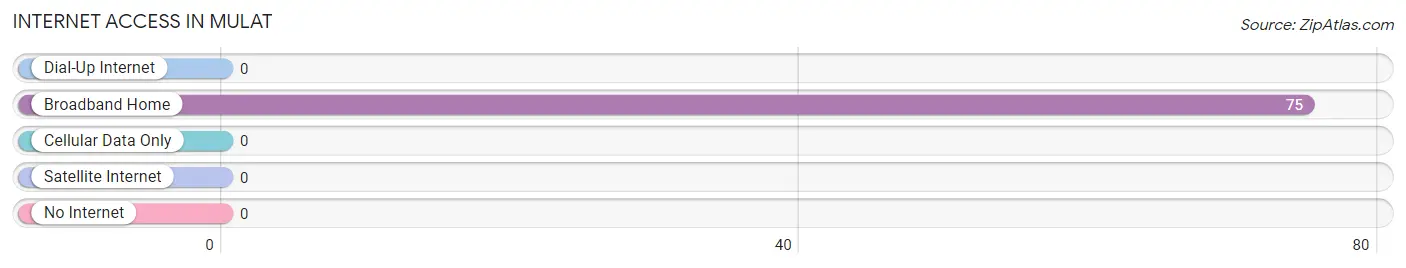
| Internet Type | # Households | % Households |
| Dial-Up Internet | 0 | 0.0% |
| Broadband Home | 75 | 100.0% |
| Cellular Data Only | 0 | 0.0% |
| Satellite Internet | 0 | 0.0% |
| No Internet | 0 | 0.0% |
| Total | 75 | 100.0% |
Mulat Summary
Mulat is an unincorporated community located in Escambia County, Florida, United States. It is situated along the Escambia River, approximately 10 miles north of Pensacola. The community is part of the Pensacola–Ferry Pass–Brent Metropolitan Statistical Area.
Geography
Mulat is located at 30°37'45" North, 87°17'45" West (30.629167, -87.295833). The elevation is approximately 30 feet (9 m) above sea level.
The community is located in the northern part of Escambia County, approximately 10 miles north of Pensacola. It is situated along the Escambia River, which forms the western boundary of the community. The community is bordered to the north by the Escambia River State Forest, to the east by the Escambia River, to the south by the Escambia River Wildlife Management Area, and to the west by the Escambia River.
History
Mulat was first settled in the early 1800s by settlers from the Creek Nation. The community was named after the Creek word for “blackberry”, which was abundant in the area.
In 1821, the United States acquired Florida from Spain and the area became part of the Territory of Florida. In 1845, Florida became the 27th state of the United States.
In the late 1800s, the area was home to a large lumber mill, which provided employment for many of the residents. The mill was destroyed by a fire in the early 1900s and the area began to decline.
In the early 1900s, the area was home to a large turpentine still, which provided employment for many of the residents. The still was destroyed by a fire in the late 1900s and the area began to decline.
In the mid-1900s, the area was home to a large sawmill, which provided employment for many of the residents. The sawmill was destroyed by a fire in the late 1900s and the area began to decline.
In the late 1900s, the area was home to a large paper mill, which provided employment for many of the residents. The paper mill was destroyed by a fire in the early 2000s and the area began to decline.
Economy
Mulat is a rural community with a population of approximately 500 people. The economy of the area is largely based on agriculture and forestry. The area is home to several farms, which produce a variety of crops, including corn, soybeans, cotton, and peanuts. The area is also home to several timber companies, which harvest timber from the surrounding forests.
The area is also home to several small businesses, including convenience stores, restaurants, and gas stations.
Demographics
As of the 2010 census, the population of Mulat was 498. The racial makeup of the community was 97.2% White, 0.6% African American, 0.2% Native American, 0.2% Asian, 0.2% from other races, and 1.8% from two or more races. Hispanic or Latino of any race were 1.2% of the population.
The median household income in Mulat was $37,500, and the median family income was $41,250. The per capita income for the community was $17,818. About 11.2% of families and 13.2% of the population were below the poverty line, including 17.2% of those under age 18 and 8.2% of those age 65 or over.
Common Questions
What is Per Capita Income in Mulat?
Per Capita income in Mulat is $63,164.
What is the Median Family Income in Mulat?
Median Family Income in Mulat is $141,685.
What is the Median Household income in Mulat?
Median Household Income in Mulat is $141,685.
What is Inequality or Gini Index in Mulat?
Inequality or Gini Index in Mulat is 0.27.
What is the Total Population of Mulat?
Total Population of Mulat is 174.
What is the Total Male Population of Mulat?
Total Male Population of Mulat is 89.
What is the Total Female Population of Mulat?
Total Female Population of Mulat is 85.
What is the Ratio of Males per 100 Females in Mulat?
There are 104.71 Males per 100 Females in Mulat.
What is the Ratio of Females per 100 Males in Mulat?
There are 95.51 Females per 100 Males in Mulat.
What is the Median Population Age in Mulat?
Median Population Age in Mulat is 32.5 Years.
What is the Average Family Size in Mulat
Average Family Size in Mulat is 2.2 People.
What is the Average Household Size in Mulat
Average Household Size in Mulat is 2.2 People.
How Large is the Labor Force in Mulat?
There are 109 People in the Labor Forcein in Mulat.
What is the Percentage of People in the Labor Force in Mulat?
75.2% of People are in the Labor Force in Mulat.