Macclenny, FL Map & Demographics
Macclenny Map
Macclenny Overview
$31,159
PER CAPITA INCOME
$74,792
AVG FAMILY INCOME
$62,134
AVG HOUSEHOLD INCOME
24.3%
WAGE / INCOME GAP [ % ]
75.7¢/ $1
WAGE / INCOME GAP [ $ ]
0.45
INEQUALITY / GINI INDEX
7,354
TOTAL POPULATION
3,711
MALE POPULATION
3,643
FEMALE POPULATION
101.87
MALES / 100 FEMALES
98.17
FEMALES / 100 MALES
37.5
MEDIAN AGE
3.3
AVG FAMILY SIZE
2.8
AVG HOUSEHOLD SIZE
3,521
LABOR FORCE [ PEOPLE ]
60.5%
PERCENT IN LABOR FORCE
4.2%
UNEMPLOYMENT RATE
Macclenny Zip Codes
Macclenny Area Codes
Income in Macclenny
Income Overview in Macclenny
Per Capita Income in Macclenny is $31,159, while median incomes of families and households are $74,792 and $62,134 respectively.
| Characteristic | Number | Measure |
| Per Capita Income | 7,354 | $31,159 |
| Median Family Income | 1,801 | $74,792 |
| Mean Family Income | 1,801 | $98,457 |
| Median Household Income | 2,417 | $62,134 |
| Mean Household Income | 2,417 | $85,399 |
| Income Deficit | 1,801 | $0 |
| Wage / Income Gap (%) | 7,354 | 24.30% |
| Wage / Income Gap ($) | 7,354 | 75.70¢ per $1 |
| Gini / Inequality Index | 7,354 | 0.45 |
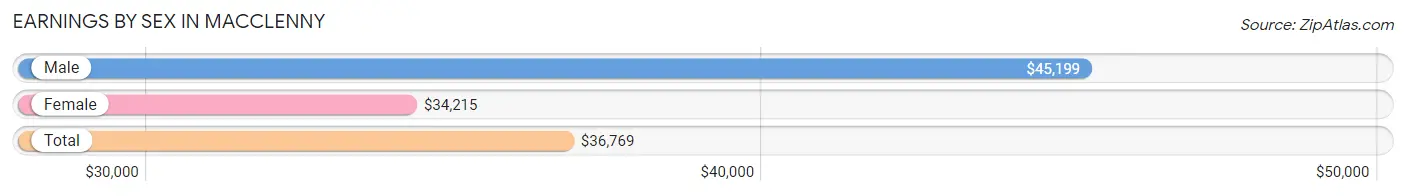
Earnings by Sex in Macclenny
Average Earnings in Macclenny are $36,769, $45,199 for men and $34,215 for women, a difference of 24.3%.
| Sex | Number | Average Earnings |
| Male | 1,816 (49.6%) | $45,199 |
| Female | 1,842 (50.4%) | $34,215 |
| Total | 3,658 (100.0%) | $36,769 |
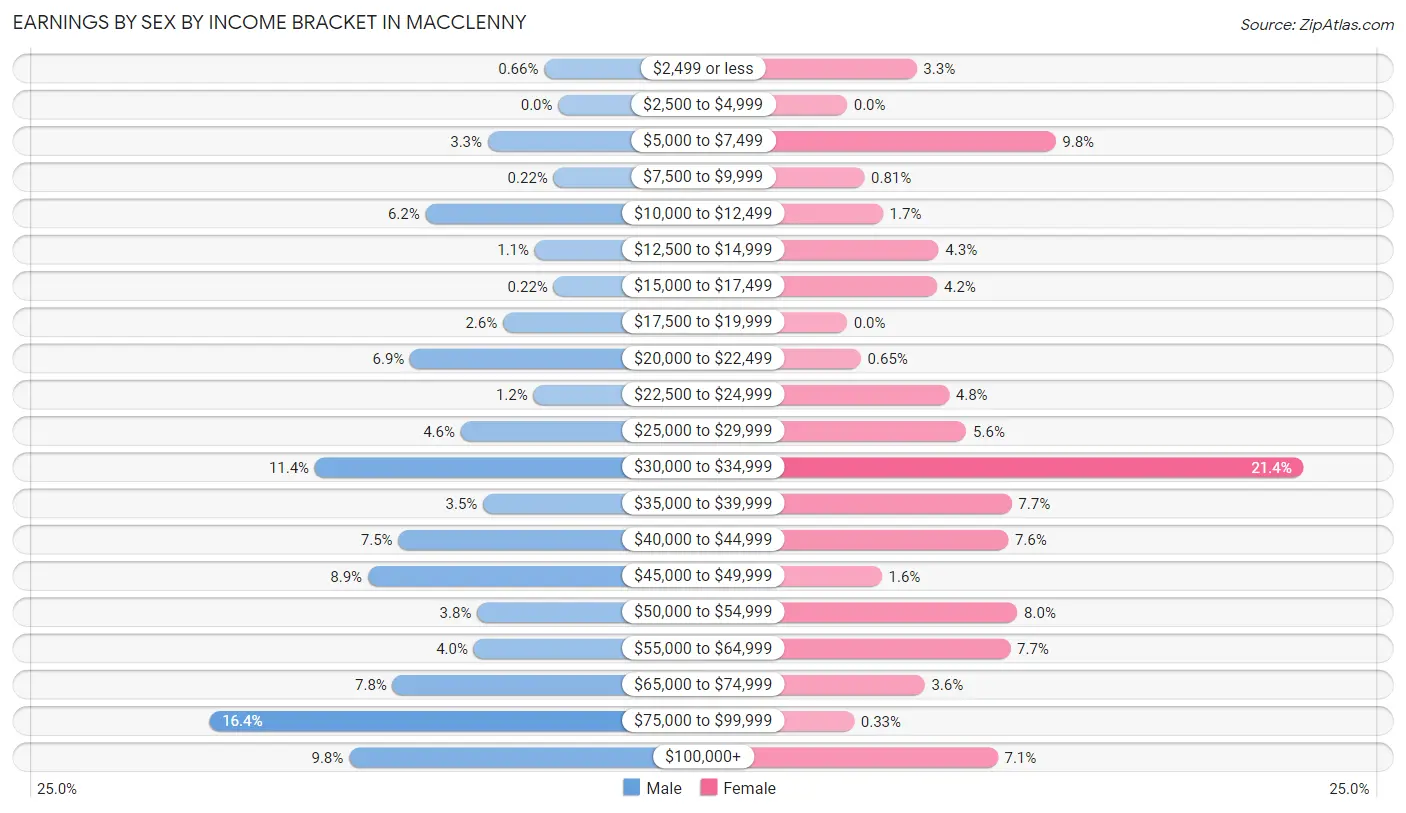
Earnings by Sex by Income Bracket in Macclenny
The most common earnings brackets in Macclenny are $75,000 to $99,999 for men (297 | 16.4%) and $30,000 to $34,999 for women (394 | 21.4%).
| Income | Male | Female |
| $2,499 or less | 12 (0.7%) | 60 (3.3%) |
| $2,500 to $4,999 | 0 (0.0%) | 0 (0.0%) |
| $5,000 to $7,499 | 60 (3.3%) | 180 (9.8%) |
| $7,500 to $9,999 | 4 (0.2%) | 15 (0.8%) |
| $10,000 to $12,499 | 113 (6.2%) | 31 (1.7%) |
| $12,500 to $14,999 | 20 (1.1%) | 79 (4.3%) |
| $15,000 to $17,499 | 4 (0.2%) | 78 (4.2%) |
| $17,500 to $19,999 | 47 (2.6%) | 0 (0.0%) |
| $20,000 to $22,499 | 126 (6.9%) | 12 (0.6%) |
| $22,500 to $24,999 | 21 (1.2%) | 88 (4.8%) |
| $25,000 to $29,999 | 83 (4.6%) | 103 (5.6%) |
| $30,000 to $34,999 | 207 (11.4%) | 394 (21.4%) |
| $35,000 to $39,999 | 64 (3.5%) | 142 (7.7%) |
| $40,000 to $44,999 | 136 (7.5%) | 139 (7.5%) |
| $45,000 to $49,999 | 162 (8.9%) | 30 (1.6%) |
| $50,000 to $54,999 | 69 (3.8%) | 147 (8.0%) |
| $55,000 to $64,999 | 72 (4.0%) | 141 (7.6%) |
| $65,000 to $74,999 | 141 (7.8%) | 67 (3.6%) |
| $75,000 to $99,999 | 297 (16.4%) | 6 (0.3%) |
| $100,000+ | 178 (9.8%) | 130 (7.1%) |
| Total | 1,816 (100.0%) | 1,842 (100.0%) |
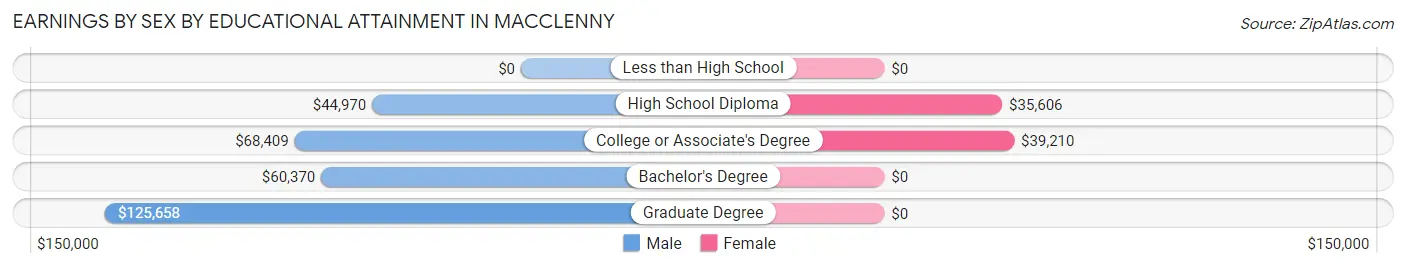
Earnings by Sex by Educational Attainment in Macclenny
Average earnings in Macclenny are $57,593 for men and $39,589 for women, a difference of 31.3%. Men with an educational attainment of graduate degree enjoy the highest average annual earnings of $125,658, while those with high school diploma education earn the least with $44,970. Women with an educational attainment of college or associate's degree earn the most with the average annual earnings of $39,210, while those with high school diploma education have the smallest earnings of $35,606.
| Educational Attainment | Male Income | Female Income |
| Less than High School | - | - |
| High School Diploma | $44,970 | $35,606 |
| College or Associate's Degree | $68,409 | $39,210 |
| Bachelor's Degree | $60,370 | $0 |
| Graduate Degree | $125,658 | $0 |
| Total | $57,593 | $39,589 |
Family Income in Macclenny
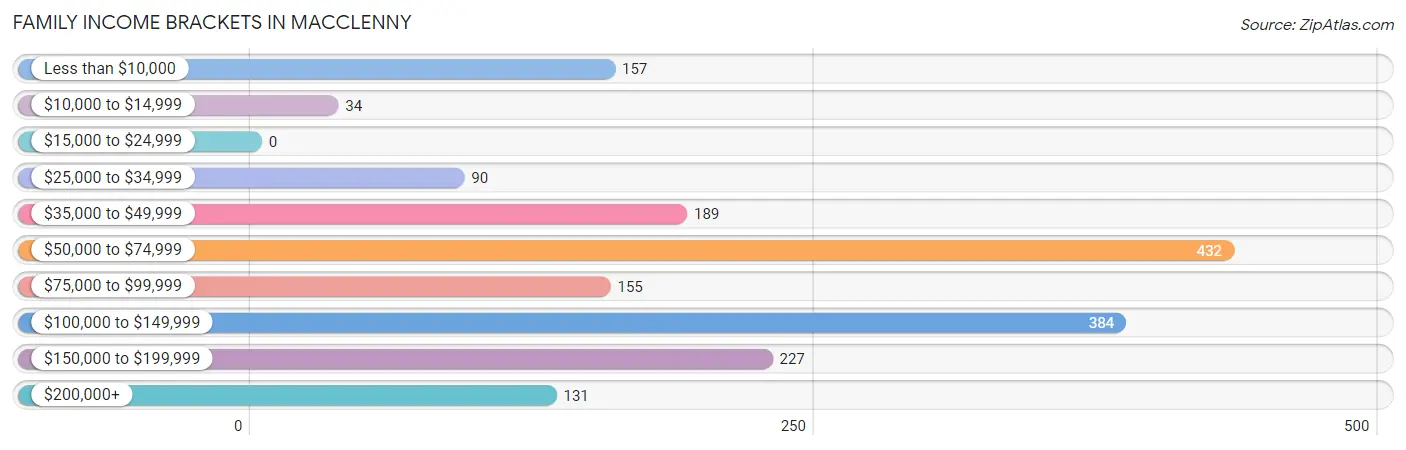
Family Income Brackets in Macclenny
According to the Macclenny family income data, there are 432 families falling into the $50,000 to $74,999 income range, which is the most common income bracket and makes up 24.0% of all families.
| Income Bracket | # Families | % Families |
| Less than $10,000 | 157 | 8.7% |
| $10,000 to $14,999 | 34 | 1.9% |
| $15,000 to $24,999 | 0 | 0.0% |
| $25,000 to $34,999 | 90 | 5.0% |
| $35,000 to $49,999 | 189 | 10.5% |
| $50,000 to $74,999 | 432 | 24.0% |
| $75,000 to $99,999 | 155 | 8.6% |
| $100,000 to $149,999 | 384 | 21.3% |
| $150,000 to $199,999 | 227 | 12.6% |
| $200,000+ | 131 | 7.3% |
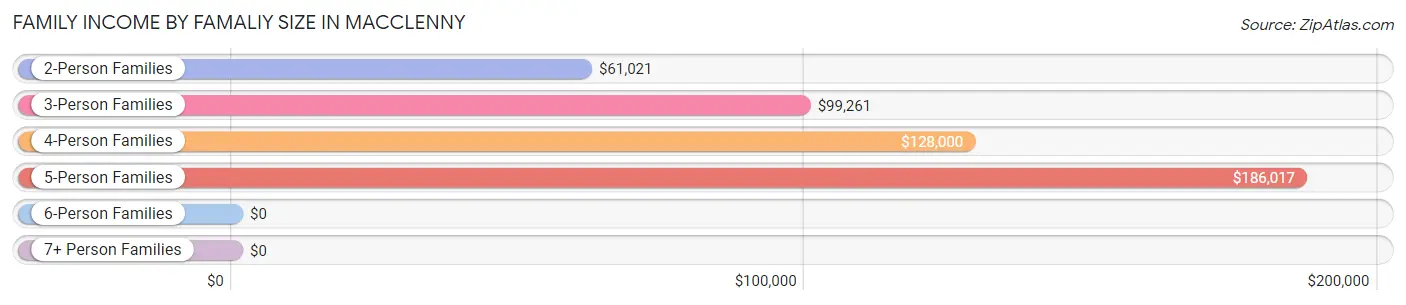
Family Income by Famaliy Size in Macclenny
5-person families (204 | 11.3%) account for the highest median family income in Macclenny with $186,017 per family, while 5-person families (204 | 11.3%) have the highest median income of $37,203 per family member.
| Income Bracket | # Families | Median Income |
| 2-Person Families | 840 (46.6%) | $61,021 |
| 3-Person Families | 541 (30.0%) | $99,261 |
| 4-Person Families | 162 (9.0%) | $128,000 |
| 5-Person Families | 204 (11.3%) | $186,017 |
| 6-Person Families | 54 (3.0%) | $0 |
| 7+ Person Families | 0 (0.0%) | $0 |
| Total | 1,801 (100.0%) | $74,792 |
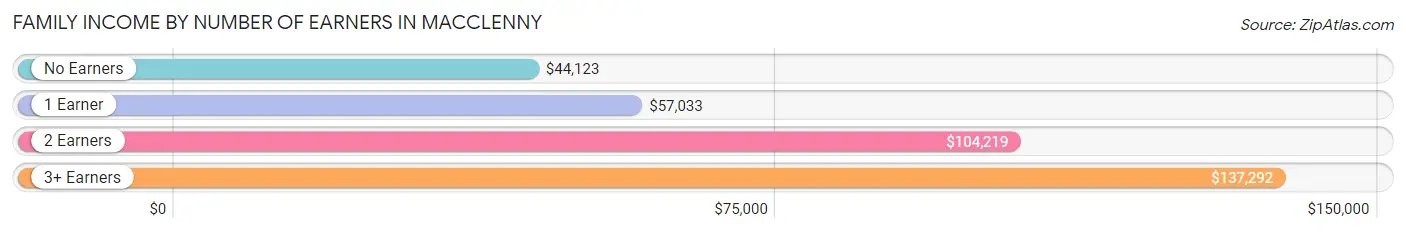
Family Income by Number of Earners in Macclenny
The median family income in Macclenny is $74,792, with families comprising 3+ earners (243) having the highest median family income of $137,292, while families with no earners (334) have the lowest median family income of $44,123, accounting for 13.5% and 18.5% of families, respectively.
| Number of Earners | # Families | Median Income |
| No Earners | 334 (18.5%) | $44,123 |
| 1 Earner | 508 (28.2%) | $57,033 |
| 2 Earners | 716 (39.8%) | $104,219 |
| 3+ Earners | 243 (13.5%) | $137,292 |
| Total | 1,801 (100.0%) | $74,792 |
Household Income in Macclenny
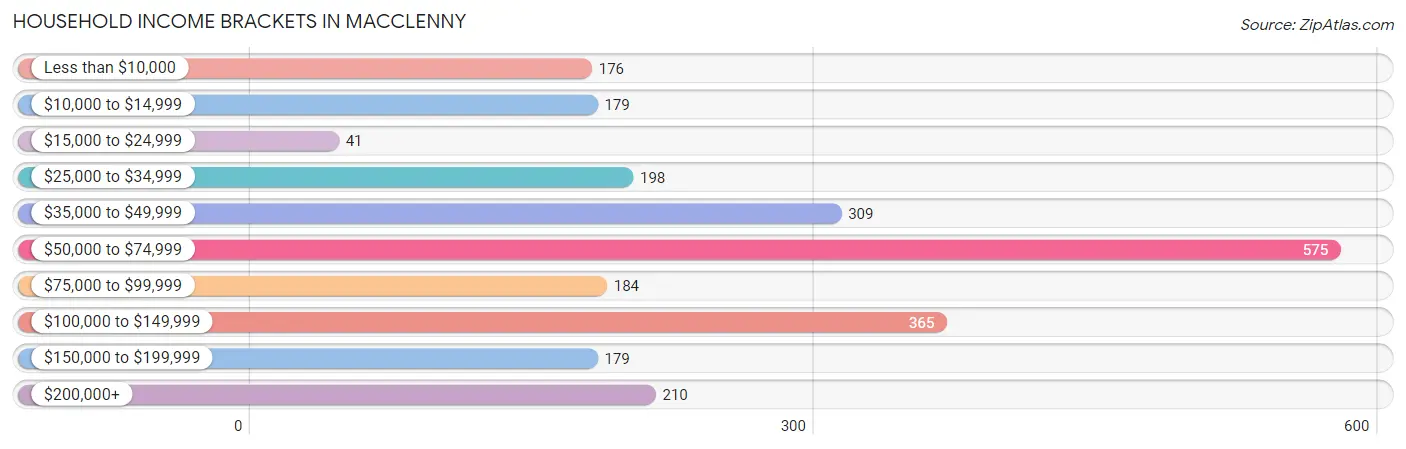
Household Income Brackets in Macclenny
With 575 households falling in the category, the $50,000 to $74,999 income range is the most frequent in Macclenny, accounting for 23.8% of all households. In contrast, only 41 households (1.7%) fall into the $15,000 to $24,999 income bracket, making it the least populous group.
| Income Bracket | # Households | % Households |
| Less than $10,000 | 176 | 7.3% |
| $10,000 to $14,999 | 179 | 7.4% |
| $15,000 to $24,999 | 41 | 1.7% |
| $25,000 to $34,999 | 198 | 8.2% |
| $35,000 to $49,999 | 309 | 12.8% |
| $50,000 to $74,999 | 575 | 23.8% |
| $75,000 to $99,999 | 184 | 7.6% |
| $100,000 to $149,999 | 365 | 15.1% |
| $150,000 to $199,999 | 179 | 7.4% |
| $200,000+ | 210 | 8.7% |
Household Income by Householder Age in Macclenny
The median household income in Macclenny is $62,134, with the highest median household income of $73,750 found in the 45 to 64 years age bracket for the primary householder. A total of 898 households (37.1%) fall into this category.
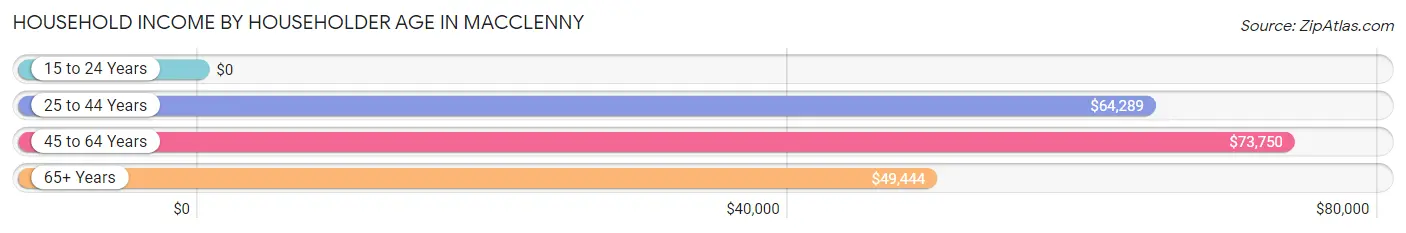
| Income Bracket | # Households | Median Income |
| 15 to 24 Years | 0 (0.0%) | $0 |
| 25 to 44 Years | 887 (36.7%) | $64,289 |
| 45 to 64 Years | 898 (37.1%) | $73,750 |
| 65+ Years | 632 (26.2%) | $49,444 |
| Total | 2,417 (100.0%) | $62,134 |
Poverty in Macclenny
Income Below Poverty by Sex and Age in Macclenny
With 8.6% poverty level for males and 13.2% for females among the residents of Macclenny, 16 and 17 year old males and 45 to 54 year old females are the most vulnerable to poverty, with 27 males (67.5%) and 139 females (29.1%) in their respective age groups living below the poverty level.
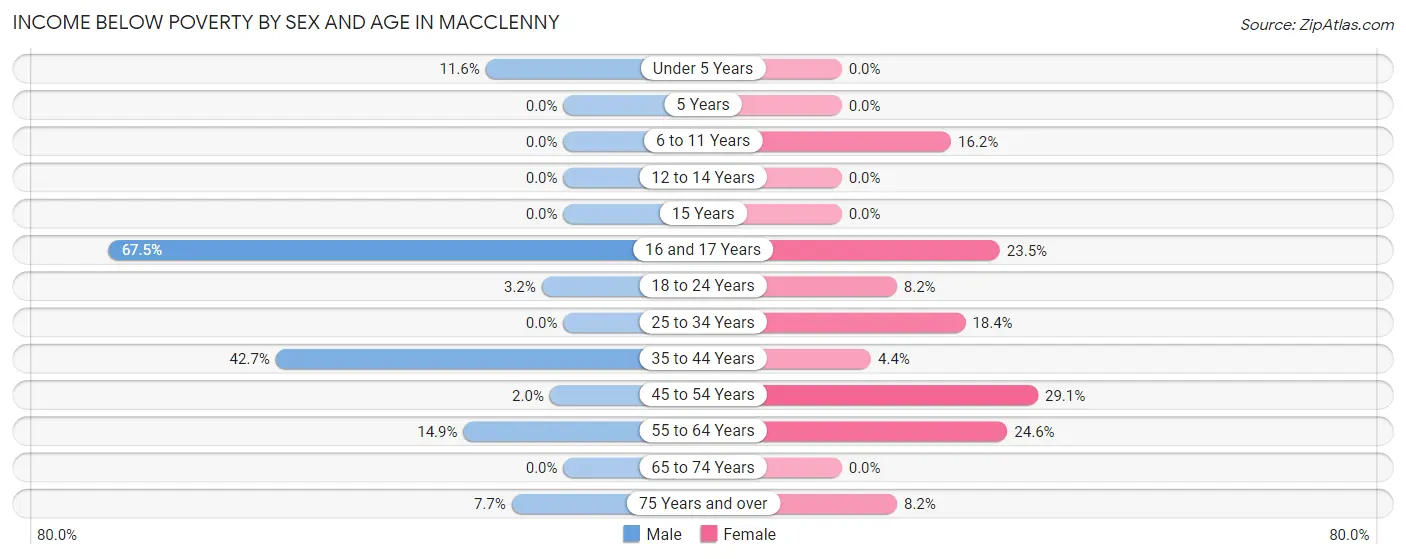
| Age Bracket | Male | Female |
| Under 5 Years | 40 (11.6%) | 0 (0.0%) |
| 5 Years | 0 (0.0%) | 0 (0.0%) |
| 6 to 11 Years | 0 (0.0%) | 49 (16.2%) |
| 12 to 14 Years | 0 (0.0%) | 0 (0.0%) |
| 15 Years | 0 (0.0%) | 0 (0.0%) |
| 16 and 17 Years | 27 (67.5%) | 27 (23.5%) |
| 18 to 24 Years | 14 (3.2%) | 37 (8.2%) |
| 25 to 34 Years | 0 (0.0%) | 74 (18.4%) |
| 35 to 44 Years | 129 (42.7%) | 18 (4.3%) |
| 45 to 54 Years | 12 (2.0%) | 139 (29.1%) |
| 55 to 64 Years | 55 (14.9%) | 90 (24.6%) |
| 65 to 74 Years | 0 (0.0%) | 0 (0.0%) |
| 75 Years and over | 8 (7.7%) | 21 (8.2%) |
| Total | 285 (8.6%) | 455 (13.2%) |
Income Above Poverty by Sex and Age in Macclenny
According to the poverty statistics in Macclenny, males aged 6 to 11 years and females aged under 5 years are the age groups that are most secure financially, with 100.0% of males and 100.0% of females in these age groups living above the poverty line.
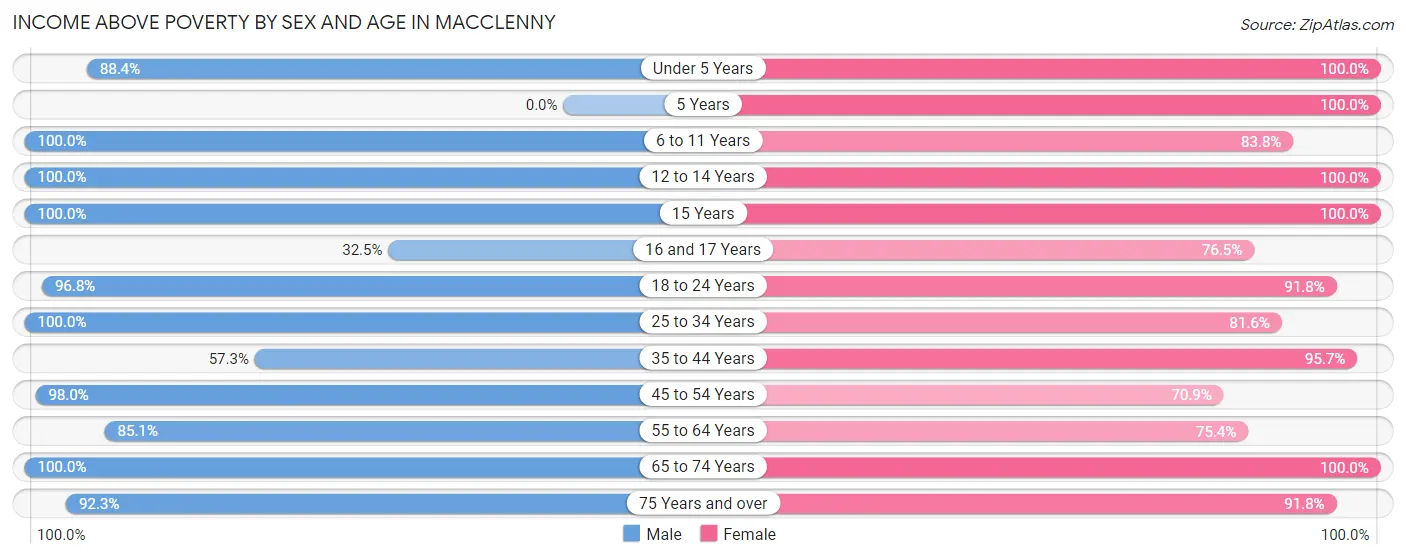
| Age Bracket | Male | Female |
| Under 5 Years | 306 (88.4%) | 136 (100.0%) |
| 5 Years | 0 (0.0%) | 63 (100.0%) |
| 6 to 11 Years | 116 (100.0%) | 253 (83.8%) |
| 12 to 14 Years | 307 (100.0%) | 176 (100.0%) |
| 15 Years | 17 (100.0%) | 50 (100.0%) |
| 16 and 17 Years | 13 (32.5%) | 88 (76.5%) |
| 18 to 24 Years | 419 (96.8%) | 416 (91.8%) |
| 25 to 34 Years | 410 (100.0%) | 329 (81.6%) |
| 35 to 44 Years | 173 (57.3%) | 396 (95.7%) |
| 45 to 54 Years | 582 (98.0%) | 338 (70.9%) |
| 55 to 64 Years | 315 (85.1%) | 276 (75.4%) |
| 65 to 74 Years | 292 (100.0%) | 235 (100.0%) |
| 75 Years and over | 96 (92.3%) | 235 (91.8%) |
| Total | 3,046 (91.4%) | 2,991 (86.8%) |
Income Below Poverty Among Married-Couple Families in Macclenny
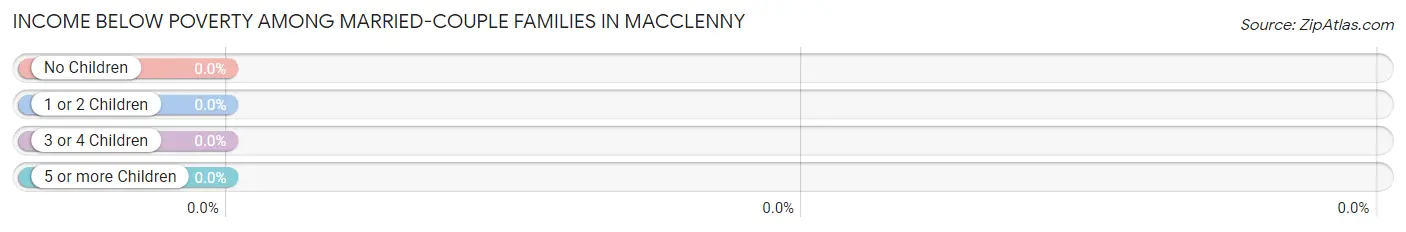
| Children | Above Poverty | Below Poverty |
| No Children | 575 (100.0%) | 0 (0.0%) |
| 1 or 2 Children | 441 (100.0%) | 0 (0.0%) |
| 3 or 4 Children | 78 (100.0%) | 0 (0.0%) |
| 5 or more Children | 0 (0.0%) | 0 (0.0%) |
| Total | 1,094 (100.0%) | 0 (0.0%) |
Income Below Poverty Among Single-Parent Households in Macclenny
According to the poverty data in Macclenny, 45.1% or 82 single-father households and 26.7% or 140 single-mother households are living below the poverty line. Among single-father households, those with no children have the highest poverty rate, with 82 households (80.4%) experiencing poverty. Likewise, among single-mother households, those with 3 or 4 children have the highest poverty rate, with 31 households (100.0%) falling below the poverty line.
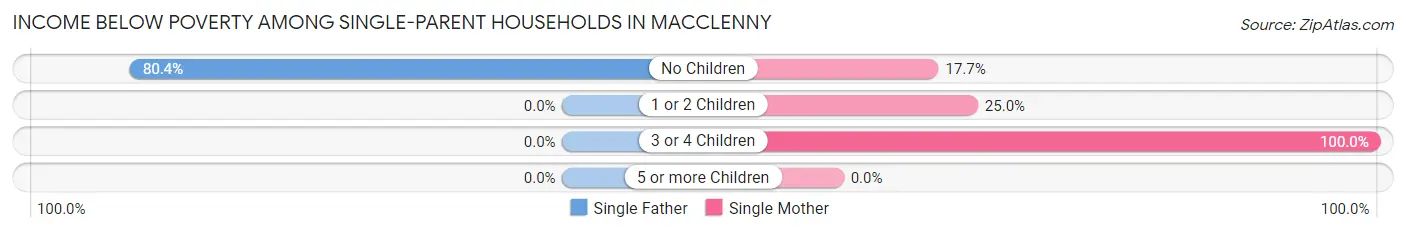
| Children | Single Father | Single Mother |
| No Children | 82 (80.4%) | 35 (17.7%) |
| 1 or 2 Children | 0 (0.0%) | 74 (25.0%) |
| 3 or 4 Children | 0 (0.0%) | 31 (100.0%) |
| 5 or more Children | 0 (0.0%) | 0 (0.0%) |
| Total | 82 (45.1%) | 140 (26.7%) |
Income Below Poverty Among Married-Couple vs Single-Parent Households in Macclenny
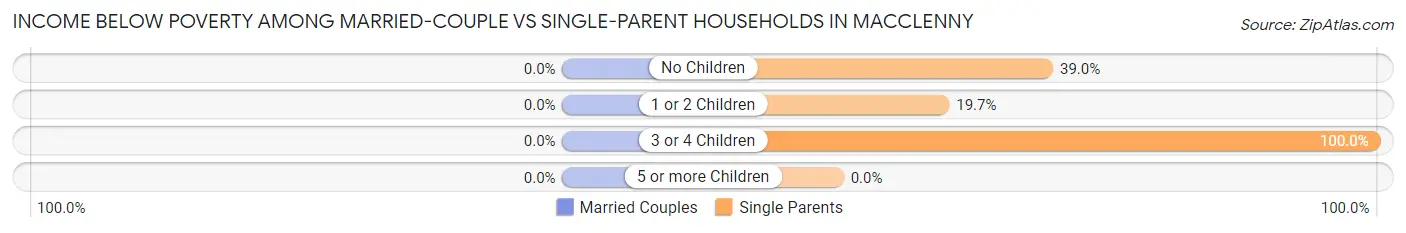
| Children | Married-Couple Families | Single-Parent Households |
| No Children | 0 (0.0%) | 117 (39.0%) |
| 1 or 2 Children | 0 (0.0%) | 74 (19.7%) |
| 3 or 4 Children | 0 (0.0%) | 31 (100.0%) |
| 5 or more Children | 0 (0.0%) | 0 (0.0%) |
| Total | 0 (0.0%) | 222 (31.4%) |
Race in Macclenny
The most populous races in Macclenny are White / Caucasian (5,057 | 68.8%), Black / African American (1,484 | 20.2%), and Two or more Races (682 | 9.3%).
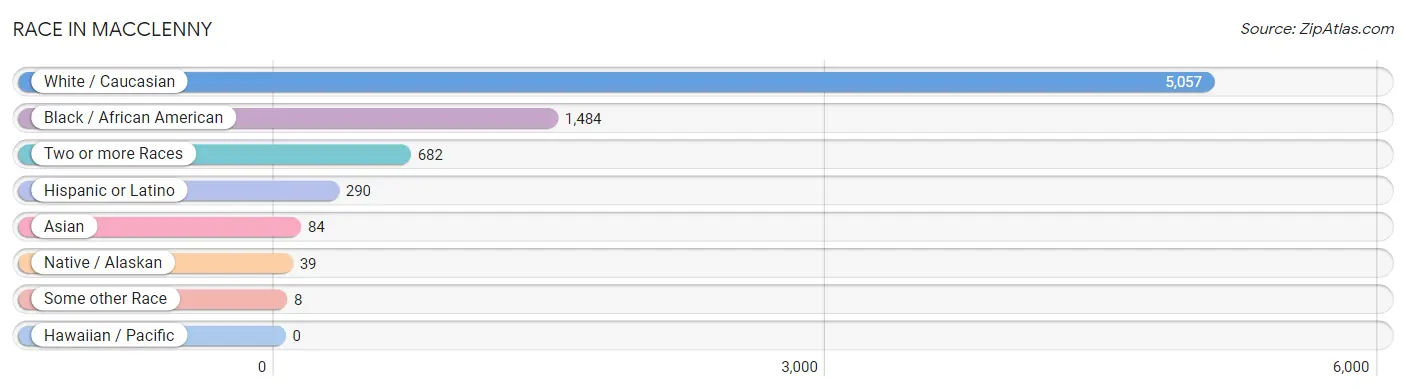
| Race | # Population | % Population |
| Asian | 84 | 1.1% |
| Black / African American | 1,484 | 20.2% |
| Hawaiian / Pacific | 0 | 0.0% |
| Hispanic or Latino | 290 | 3.9% |
| Native / Alaskan | 39 | 0.5% |
| White / Caucasian | 5,057 | 68.8% |
| Two or more Races | 682 | 9.3% |
| Some other Race | 8 | 0.1% |
| Total | 7,354 | 100.0% |
Ancestry in Macclenny
The most populous ancestries reported in Macclenny are American (1,063 | 14.4%), German (920 | 12.5%), Irish (792 | 10.8%), English (337 | 4.6%), and Cherokee (233 | 3.2%), together accounting for 45.5% of all Macclenny residents.

| Ancestry | # Population | % Population |
| African | 86 | 1.2% |
| American | 1,063 | 14.4% |
| Arab | 20 | 0.3% |
| Blackfeet | 37 | 0.5% |
| Brazilian | 9 | 0.1% |
| British | 34 | 0.5% |
| Central American | 80 | 1.1% |
| Cherokee | 233 | 3.2% |
| Choctaw | 5 | 0.1% |
| Colombian | 11 | 0.2% |
| Cuban | 12 | 0.2% |
| Dutch | 133 | 1.8% |
| Eastern European | 5 | 0.1% |
| English | 337 | 4.6% |
| European | 48 | 0.6% |
| Finnish | 28 | 0.4% |
| French | 54 | 0.7% |
| German | 920 | 12.5% |
| Greek | 191 | 2.6% |
| Haitian | 3 | 0.0% |
| Honduran | 22 | 0.3% |
| Indian (Asian) | 12 | 0.2% |
| Irish | 792 | 10.8% |
| Italian | 67 | 0.9% |
| Jamaican | 11 | 0.2% |
| Lithuanian | 6 | 0.1% |
| Mexican | 13 | 0.2% |
| Norwegian | 13 | 0.2% |
| Polish | 66 | 0.9% |
| Puerto Rican | 128 | 1.7% |
| Salvadoran | 58 | 0.8% |
| Scandinavian | 17 | 0.2% |
| Scotch-Irish | 68 | 0.9% |
| Scottish | 116 | 1.6% |
| Seminole | 39 | 0.5% |
| South American | 23 | 0.3% |
| Spanish | 34 | 0.5% |
| Subsaharan African | 86 | 1.2% |
| Swedish | 5 | 0.1% |
| Syrian | 20 | 0.3% |
| Thai | 102 | 1.4% |
| Venezuelan | 12 | 0.2% |
| Welsh | 26 | 0.4% |
| West Indian | 5 | 0.1% | View All 44 Rows |
Immigrants in Macclenny
The most numerous immigrant groups reported in Macclenny came from Latin America (131 | 1.8%), Central America (77 | 1.1%), El Salvador (42 | 0.6%), Asia (32 | 0.4%), and India (32 | 0.4%), together accounting for 4.3% of all Macclenny residents.
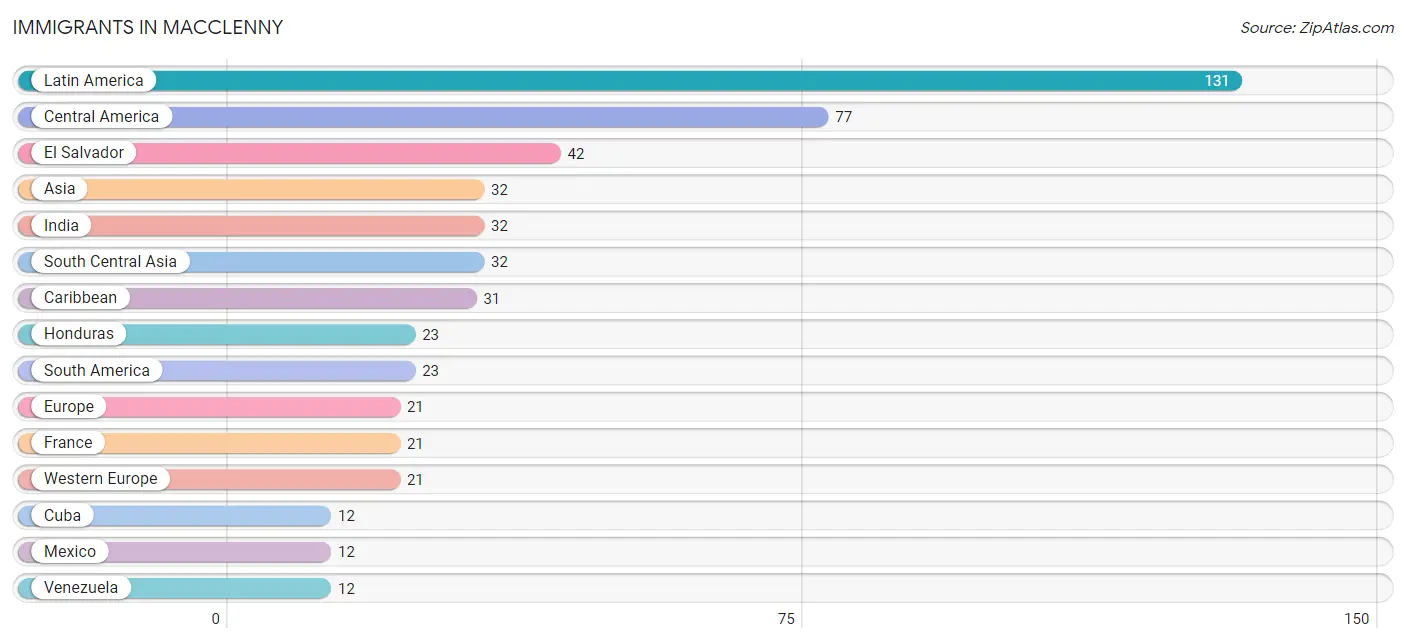
| Immigration Origin | # Population | % Population |
| Asia | 32 | 0.4% |
| Caribbean | 31 | 0.4% |
| Central America | 77 | 1.1% |
| Colombia | 11 | 0.2% |
| Cuba | 12 | 0.2% |
| El Salvador | 42 | 0.6% |
| Europe | 21 | 0.3% |
| France | 21 | 0.3% |
| Honduras | 23 | 0.3% |
| India | 32 | 0.4% |
| Jamaica | 8 | 0.1% |
| Latin America | 131 | 1.8% |
| Mexico | 12 | 0.2% |
| South America | 23 | 0.3% |
| South Central Asia | 32 | 0.4% |
| Trinidad and Tobago | 11 | 0.2% |
| Venezuela | 12 | 0.2% |
| Western Europe | 21 | 0.3% | View All 18 Rows |
Sex and Age in Macclenny
Sex and Age in Macclenny
The most populous age groups in Macclenny are 45 to 49 Years (399 | 10.7%) for men and 20 to 24 Years (437 | 12.0%) for women.
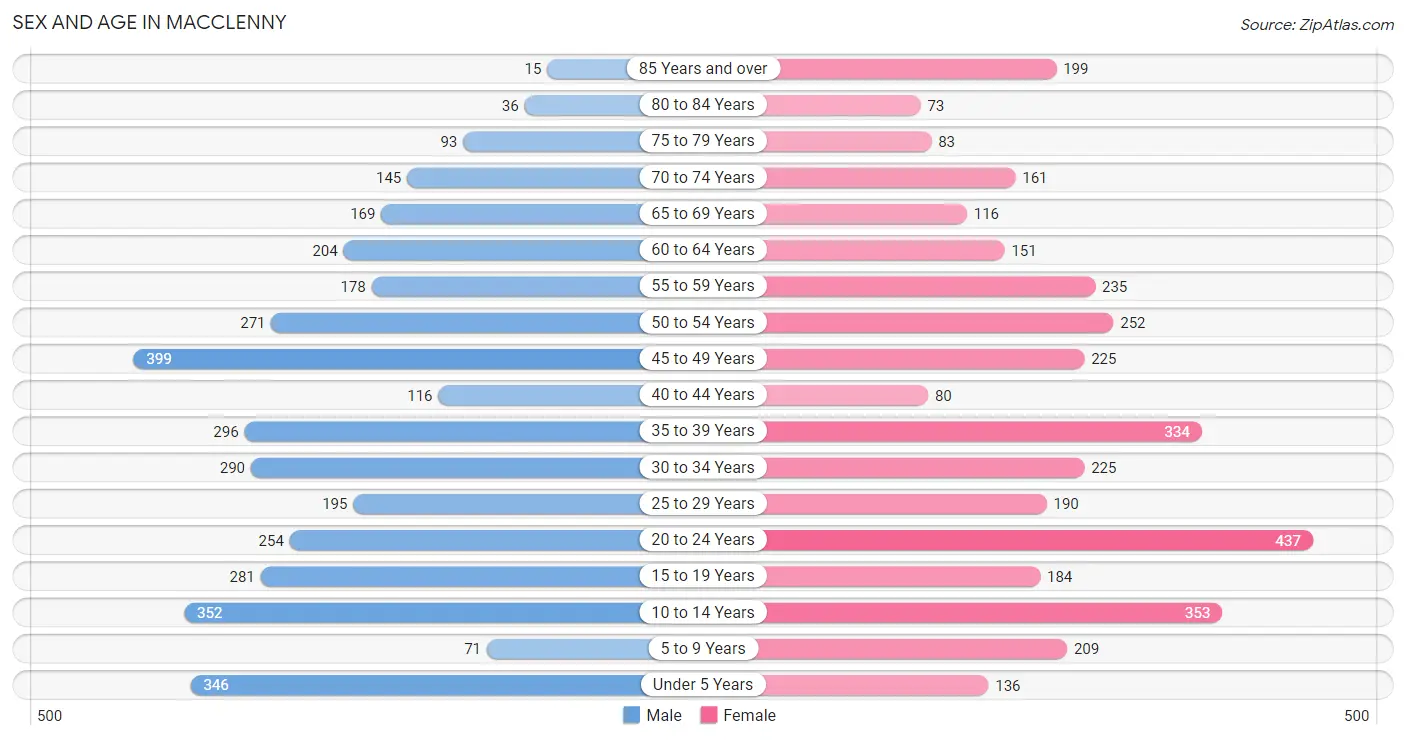
| Age Bracket | Male | Female |
| Under 5 Years | 346 (9.3%) | 136 (3.7%) |
| 5 to 9 Years | 71 (1.9%) | 209 (5.7%) |
| 10 to 14 Years | 352 (9.5%) | 353 (9.7%) |
| 15 to 19 Years | 281 (7.6%) | 184 (5.1%) |
| 20 to 24 Years | 254 (6.8%) | 437 (12.0%) |
| 25 to 29 Years | 195 (5.2%) | 190 (5.2%) |
| 30 to 34 Years | 290 (7.8%) | 225 (6.2%) |
| 35 to 39 Years | 296 (8.0%) | 334 (9.2%) |
| 40 to 44 Years | 116 (3.1%) | 80 (2.2%) |
| 45 to 49 Years | 399 (10.7%) | 225 (6.2%) |
| 50 to 54 Years | 271 (7.3%) | 252 (6.9%) |
| 55 to 59 Years | 178 (4.8%) | 235 (6.5%) |
| 60 to 64 Years | 204 (5.5%) | 151 (4.1%) |
| 65 to 69 Years | 169 (4.5%) | 116 (3.2%) |
| 70 to 74 Years | 145 (3.9%) | 161 (4.4%) |
| 75 to 79 Years | 93 (2.5%) | 83 (2.3%) |
| 80 to 84 Years | 36 (1.0%) | 73 (2.0%) |
| 85 Years and over | 15 (0.4%) | 199 (5.5%) |
| Total | 3,711 (100.0%) | 3,643 (100.0%) |
Families and Households in Macclenny
Median Family Size in Macclenny
The median family size in Macclenny is 3.26 persons per family, with married-couple families (1,094 | 60.7%) accounting for the largest median family size of 3.66 persons per family. On the other hand, single male/father families (182 | 10.1%) represent the smallest median family size with 2.30 persons per family.
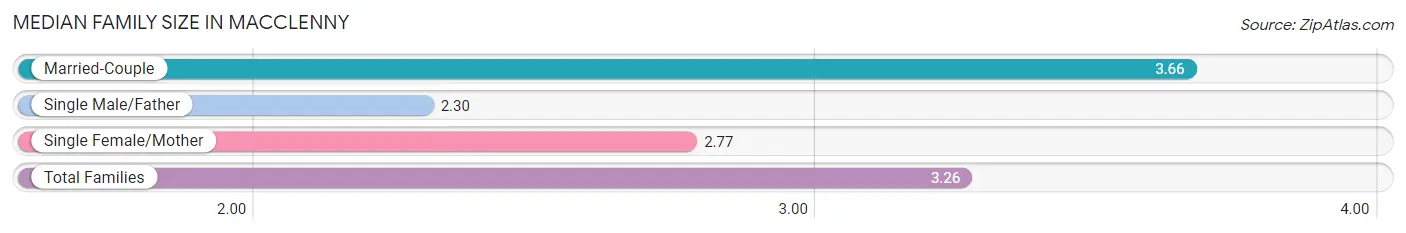
| Family Type | # Families | Family Size |
| Married-Couple | 1,094 (60.7%) | 3.66 |
| Single Male/Father | 182 (10.1%) | 2.30 |
| Single Female/Mother | 525 (29.1%) | 2.77 |
| Total Families | 1,801 (100.0%) | 3.26 |
Median Household Size in Macclenny
The median household size in Macclenny is 2.81 persons per household, with married-couple households (1,094 | 45.3%) accounting for the largest median household size of 3.73 persons per household. non-family households (616 | 25.5%) represent the smallest median household size with 1.24 persons per household.
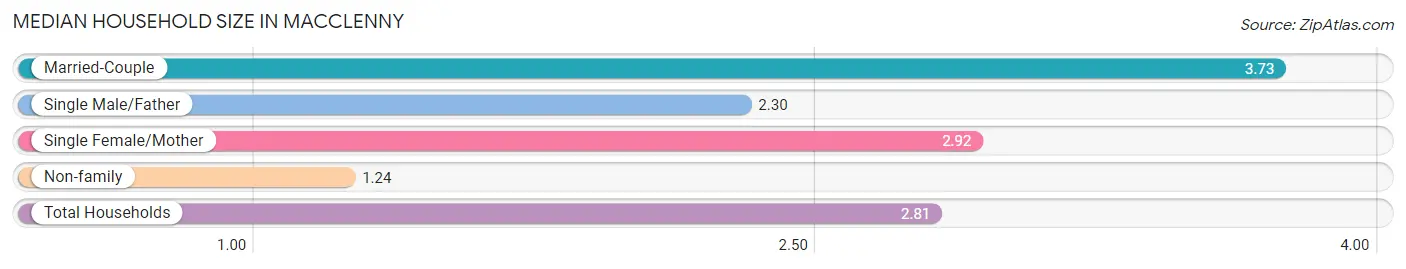
| Household Type | # Households | Household Size |
| Married-Couple | 1,094 (45.3%) | 3.73 |
| Single Male/Father | 182 (7.5%) | 2.30 |
| Single Female/Mother | 525 (21.7%) | 2.92 |
| Non-family | 616 (25.5%) | 1.24 |
| Total Households | 2,417 (100.0%) | 2.81 |
Household Size by Marriage Status in Macclenny
Out of a total of 2,417 households in Macclenny, 1,801 (74.5%) are family households, while 616 (25.5%) are nonfamily households. The most numerous type of family households are 2-person households, comprising 769, and the most common type of nonfamily households are 1-person households, comprising 441.
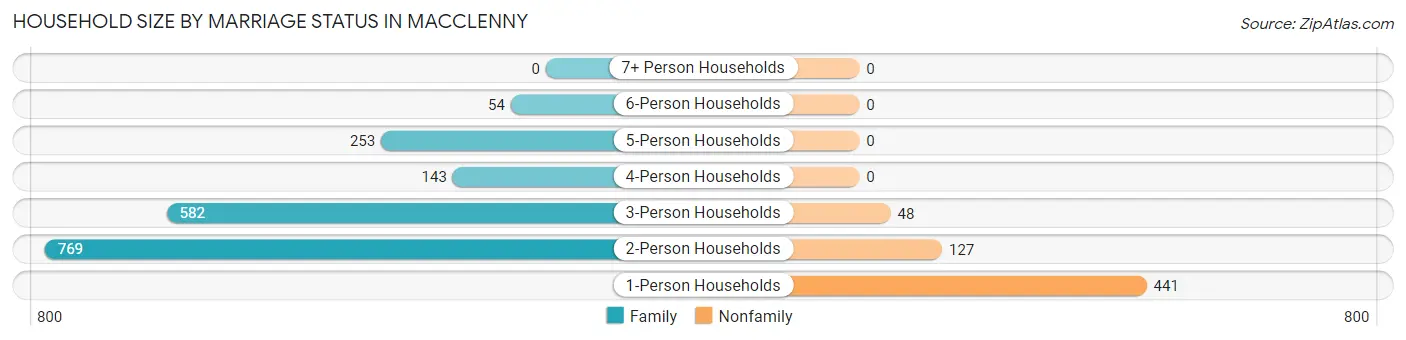
| Household Size | Family Households | Nonfamily Households |
| 1-Person Households | - | 441 (18.2%) |
| 2-Person Households | 769 (31.8%) | 127 (5.2%) |
| 3-Person Households | 582 (24.1%) | 48 (2.0%) |
| 4-Person Households | 143 (5.9%) | 0 (0.0%) |
| 5-Person Households | 253 (10.5%) | 0 (0.0%) |
| 6-Person Households | 54 (2.2%) | 0 (0.0%) |
| 7+ Person Households | 0 (0.0%) | 0 (0.0%) |
| Total | 1,801 (74.5%) | 616 (25.5%) |
Female Fertility in Macclenny
Fertility by Age in Macclenny
Average fertility rate in Macclenny is 73.0 births per 1,000 women. Women in the age bracket of 20 to 34 years have the highest fertility rate with 148.0 births per 1,000 women. Women in the age bracket of 20 to 34 years acount for 100.0% of all women with births.
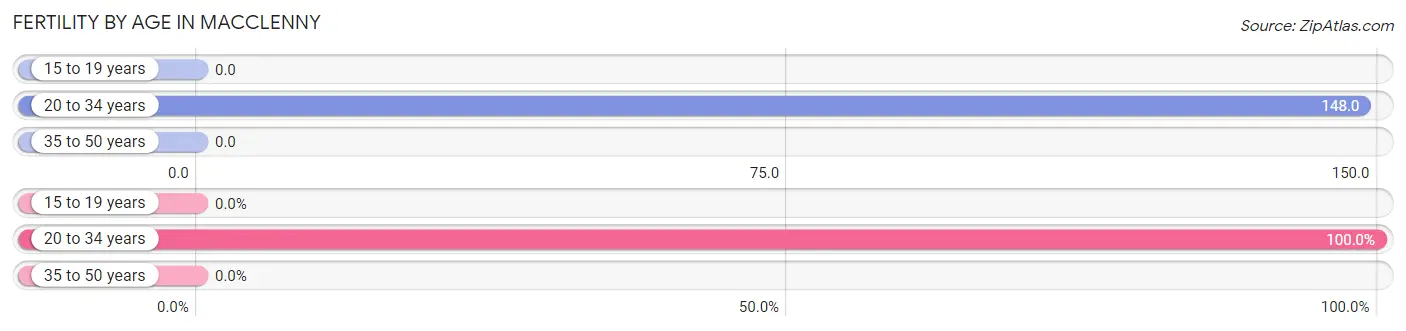
| Age Bracket | Women with Births | Births / 1,000 Women |
| 15 to 19 years | 0 (0.0%) | 0.0 |
| 20 to 34 years | 126 (100.0%) | 148.0 |
| 35 to 50 years | 0 (0.0%) | 0.0 |
| Total | 126 (100.0%) | 73.0 |
Fertility by Age by Marriage Status in Macclenny
93.7% of women with births (126) in Macclenny are married. The highest percentage of unmarried women with births falls into 20 to 34 years age bracket with 6.4% of them unmarried at the time of birth, while the lowest percentage of unmarried women with births belong to 20 to 34 years age bracket with 6.4% of them unmarried.
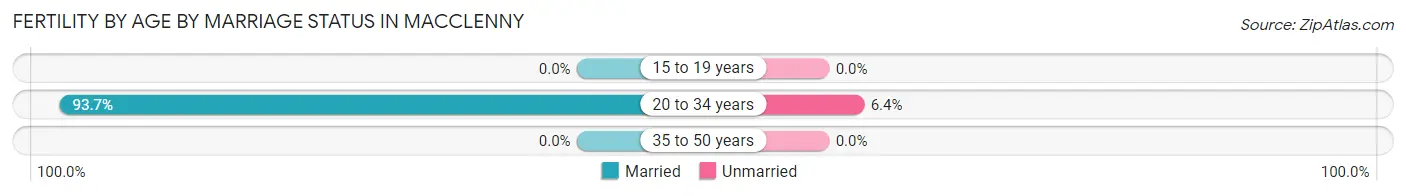
| Age Bracket | Married | Unmarried |
| 15 to 19 years | 0 (0.0%) | 0 (0.0%) |
| 20 to 34 years | 118 (93.6%) | 8 (6.4%) |
| 35 to 50 years | 0 (0.0%) | 0 (0.0%) |
| Total | 118 (93.6%) | 8 (6.4%) |
Fertility by Education in Macclenny
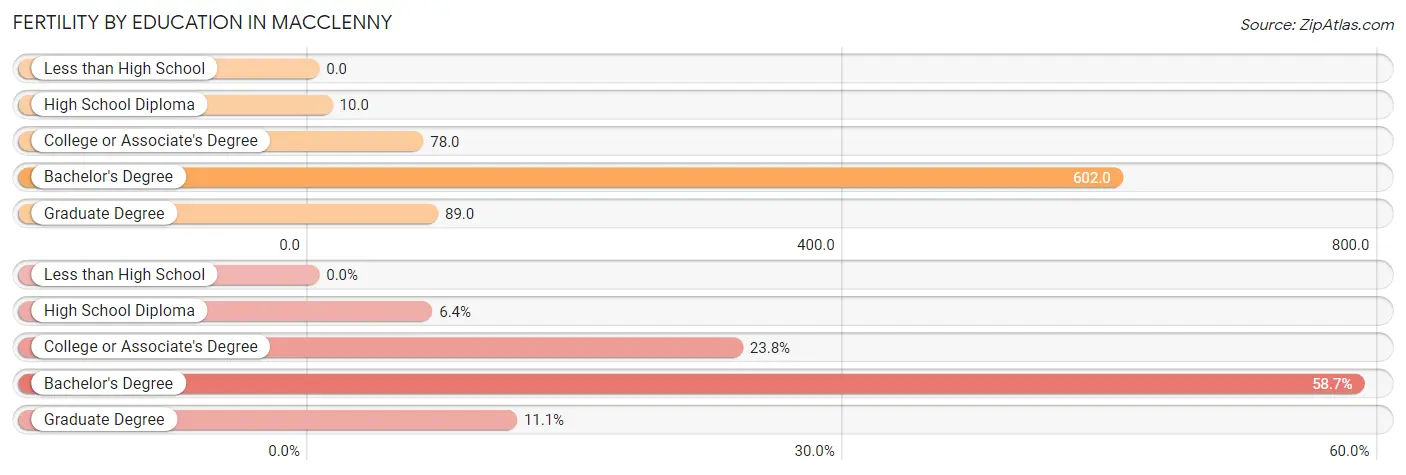
| Educational Attainment | Women with Births | Births / 1,000 Women |
| Less than High School | 0 (0.0%) | 0.0 |
| High School Diploma | 8 (6.4%) | 10.0 |
| College or Associate's Degree | 30 (23.8%) | 78.0 |
| Bachelor's Degree | 74 (58.7%) | 602.0 |
| Graduate Degree | 14 (11.1%) | 89.0 |
| Total | 126 (100.0%) | 73.0 |
Fertility by Education by Marriage Status in Macclenny
6.4% of women with births in Macclenny are unmarried. Women with the educational attainment of college or associate's degree are most likely to be married with 100.0% of them married at childbirth, while women with the educational attainment of high school diploma are least likely to be married with 100.0% of them unmarried at childbirth.
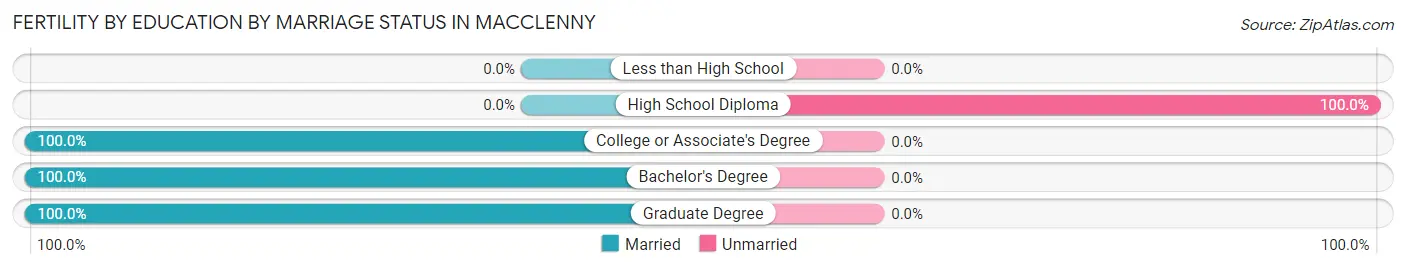
| Educational Attainment | Married | Unmarried |
| Less than High School | 0 (0.0%) | 0 (0.0%) |
| High School Diploma | 0 (0.0%) | 8 (100.0%) |
| College or Associate's Degree | 30 (100.0%) | 0 (0.0%) |
| Bachelor's Degree | 74 (100.0%) | 0 (0.0%) |
| Graduate Degree | 14 (100.0%) | 0 (0.0%) |
| Total | 118 (93.6%) | 8 (6.4%) |
Employment Characteristics in Macclenny
Employment by Class of Employer in Macclenny
Among the 3,101 employed individuals in Macclenny, private company employees (1,963 | 63.3%), self-employed (not incorporated) (381 | 12.3%), and local government employees (243 | 7.8%) make up the most common classes of employment.
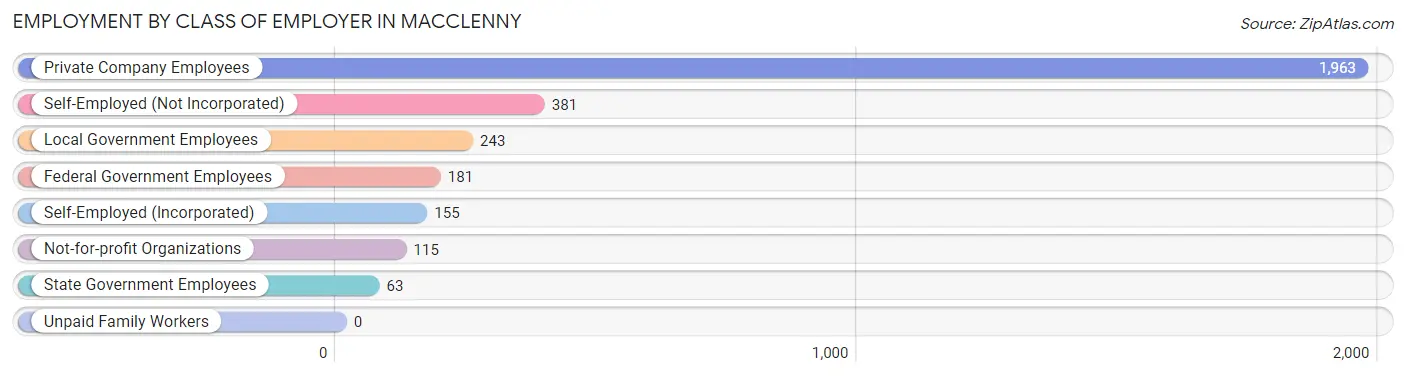
| Employer Class | # Employees | % Employees |
| Private Company Employees | 1,963 | 63.3% |
| Self-Employed (Incorporated) | 155 | 5.0% |
| Self-Employed (Not Incorporated) | 381 | 12.3% |
| Not-for-profit Organizations | 115 | 3.7% |
| Local Government Employees | 243 | 7.8% |
| State Government Employees | 63 | 2.0% |
| Federal Government Employees | 181 | 5.8% |
| Unpaid Family Workers | 0 | 0.0% |
| Total | 3,101 | 100.0% |
Employment Status by Age in Macclenny
According to the labor force statistics for Macclenny, out of the total population over 16 years of age (5,820), 60.5% or 3,521 individuals are in the labor force, with 4.2% or 148 of them unemployed. The age group with the highest labor force participation rate is 16 to 19 years, with 88.4% or 352 individuals in the labor force. Within the labor force, the 25 to 29 years age range has the highest percentage of unemployed individuals, with 26.3% or 83 of them being unemployed.
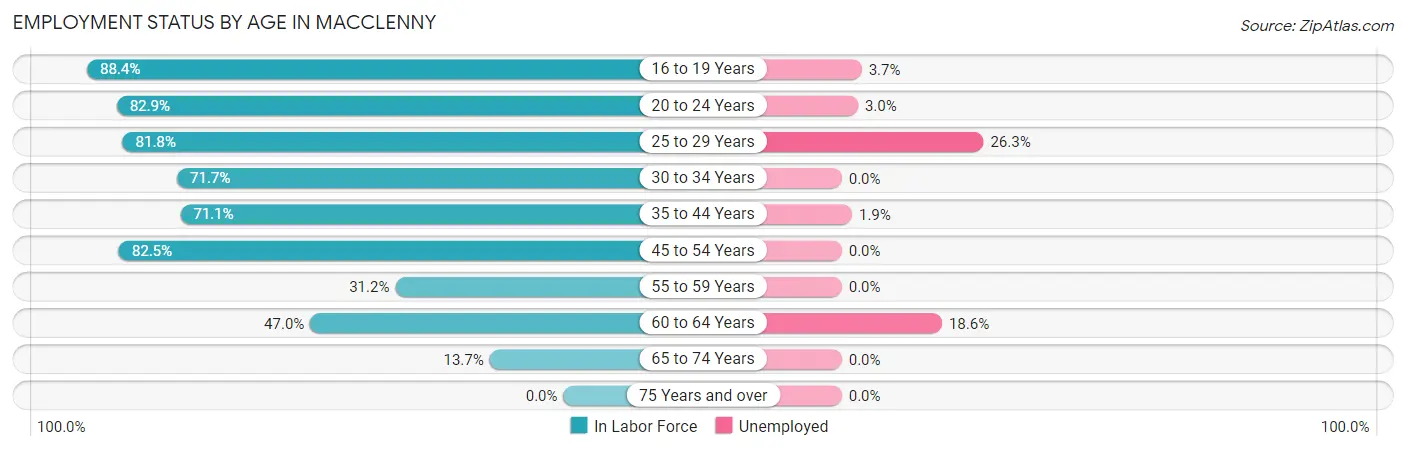
| Age Bracket | In Labor Force | Unemployed |
| 16 to 19 Years | 352 (88.4%) | 13 (3.7%) |
| 20 to 24 Years | 573 (82.9%) | 17 (3.0%) |
| 25 to 29 Years | 315 (81.8%) | 83 (26.3%) |
| 30 to 34 Years | 369 (71.7%) | 0 (0.0%) |
| 35 to 44 Years | 587 (71.1%) | 11 (1.9%) |
| 45 to 54 Years | 946 (82.5%) | 0 (0.0%) |
| 55 to 59 Years | 129 (31.2%) | 0 (0.0%) |
| 60 to 64 Years | 167 (47.0%) | 31 (18.6%) |
| 65 to 74 Years | 81 (13.7%) | 0 (0.0%) |
| 75 Years and over | 0 (0.0%) | 0 (0.0%) |
| Total | 3,521 (60.5%) | 148 (4.2%) |
Employment Status by Educational Attainment in Macclenny
According to labor force statistics for Macclenny, 69.0% of individuals (2,512) out of the total population between 25 and 64 years of age (3,641) are in the labor force, with 4.7% or 118 of them being unemployed. The group with the highest labor force participation rate are those with the educational attainment of bachelor's degree or higher, with 98.7% or 670 individuals in the labor force. Within the labor force, individuals with high school diploma education have the highest percentage of unemployment, with 8.8% or 74 of them being unemployed.
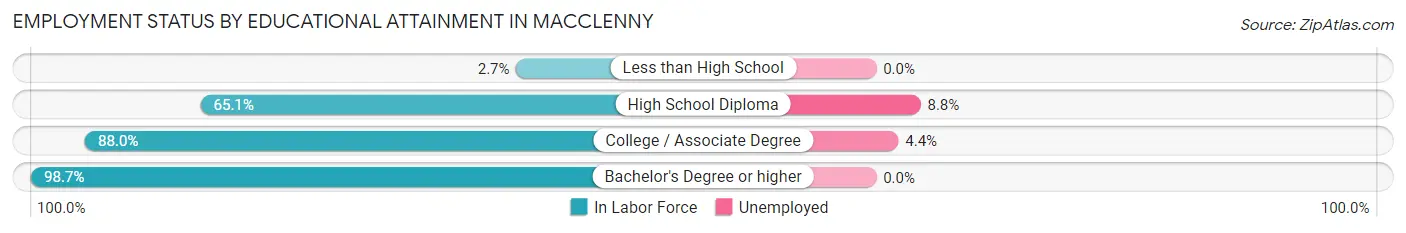
| Educational Attainment | In Labor Force | Unemployed |
| Less than High School | 15 (2.7%) | 0 (0.0%) |
| High School Diploma | 839 (65.1%) | 113 (8.8%) |
| College / Associate Degree | 989 (88.0%) | 49 (4.4%) |
| Bachelor's Degree or higher | 670 (98.7%) | 0 (0.0%) |
| Total | 2,512 (69.0%) | 171 (4.7%) |
Employment Occupations by Sex in Macclenny
Management, Business, Science and Arts Occupations
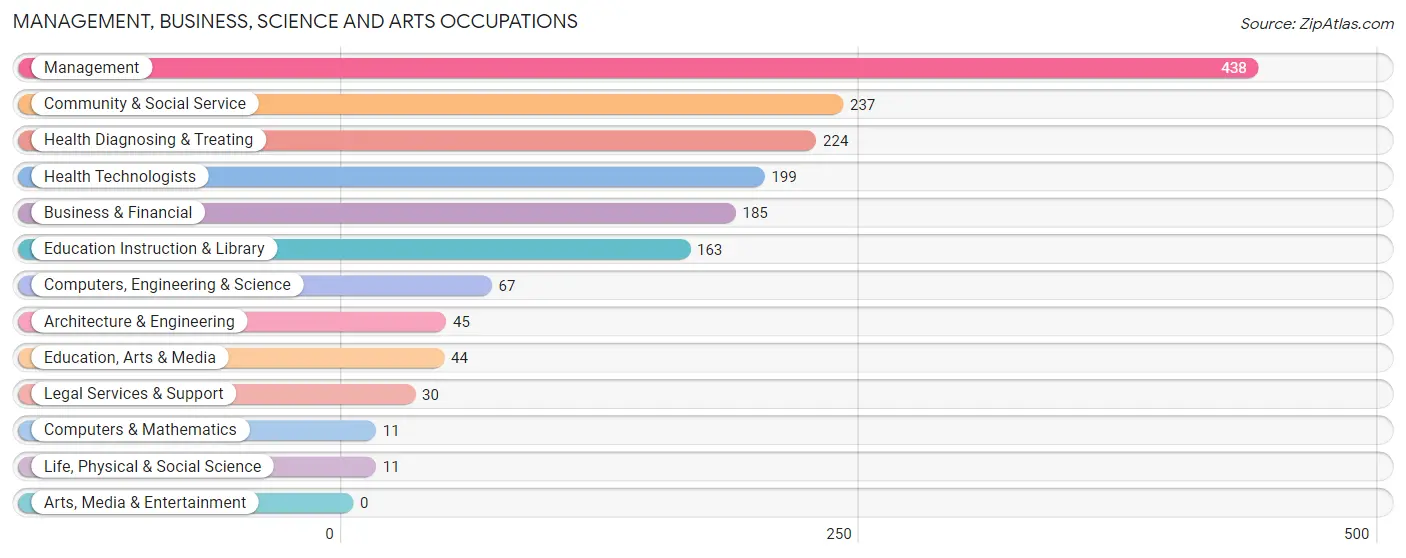
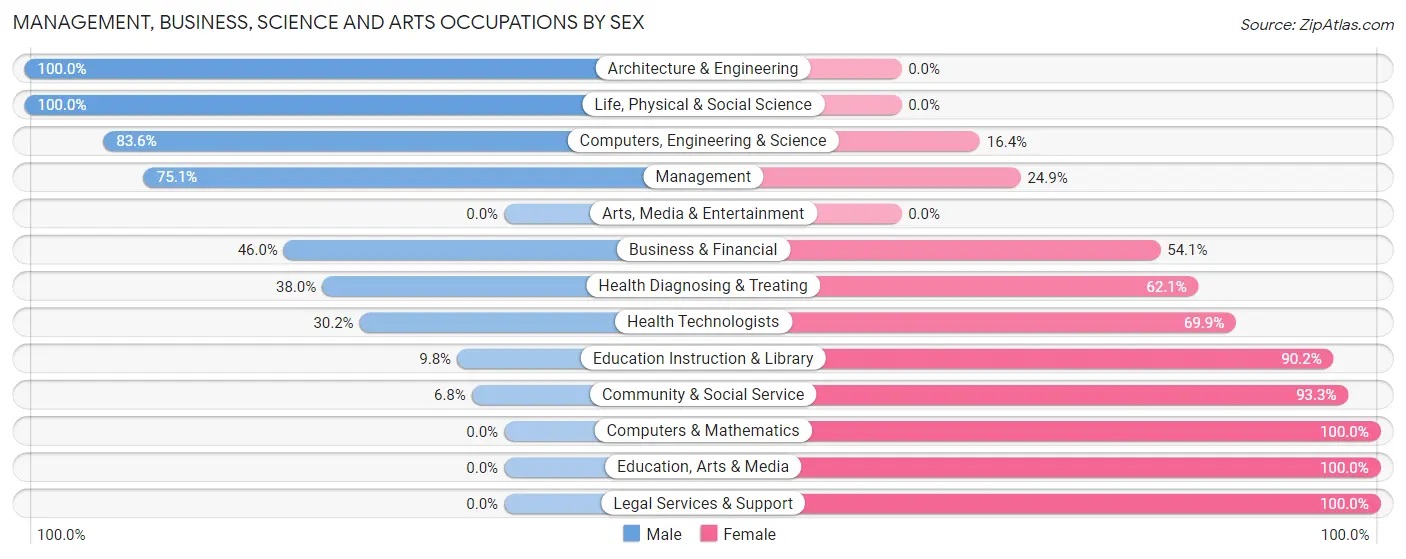
The most common Management, Business, Science and Arts occupations in Macclenny are Management (438 | 13.2%), Community & Social Service (237 | 7.2%), Health Diagnosing & Treating (224 | 6.8%), Health Technologists (199 | 6.0%), and Business & Financial (185 | 5.6%).
Management, Business, Science and Arts Occupations by Sex
Within the Management, Business, Science and Arts occupations in Macclenny, the most male-oriented occupations are Architecture & Engineering (100.0%), Life, Physical & Social Science (100.0%), and Computers, Engineering & Science (83.6%), while the most female-oriented occupations are Computers & Mathematics (100.0%), Education, Arts & Media (100.0%), and Legal Services & Support (100.0%).
| Occupation | Male | Female |
| Management | 329 (75.1%) | 109 (24.9%) |
| Business & Financial | 85 (46.0%) | 100 (54.0%) |
| Computers, Engineering & Science | 56 (83.6%) | 11 (16.4%) |
| Computers & Mathematics | 0 (0.0%) | 11 (100.0%) |
| Architecture & Engineering | 45 (100.0%) | 0 (0.0%) |
| Life, Physical & Social Science | 11 (100.0%) | 0 (0.0%) |
| Community & Social Service | 16 (6.8%) | 221 (93.2%) |
| Education, Arts & Media | 0 (0.0%) | 44 (100.0%) |
| Legal Services & Support | 0 (0.0%) | 30 (100.0%) |
| Education Instruction & Library | 16 (9.8%) | 147 (90.2%) |
| Arts, Media & Entertainment | 0 (0.0%) | 0 (0.0%) |
| Health Diagnosing & Treating | 85 (38.0%) | 139 (62.1%) |
| Health Technologists | 60 (30.1%) | 139 (69.9%) |
| Total (Category) | 571 (49.6%) | 580 (50.4%) |
| Total (Overall) | 1,563 (47.2%) | 1,746 (52.8%) |
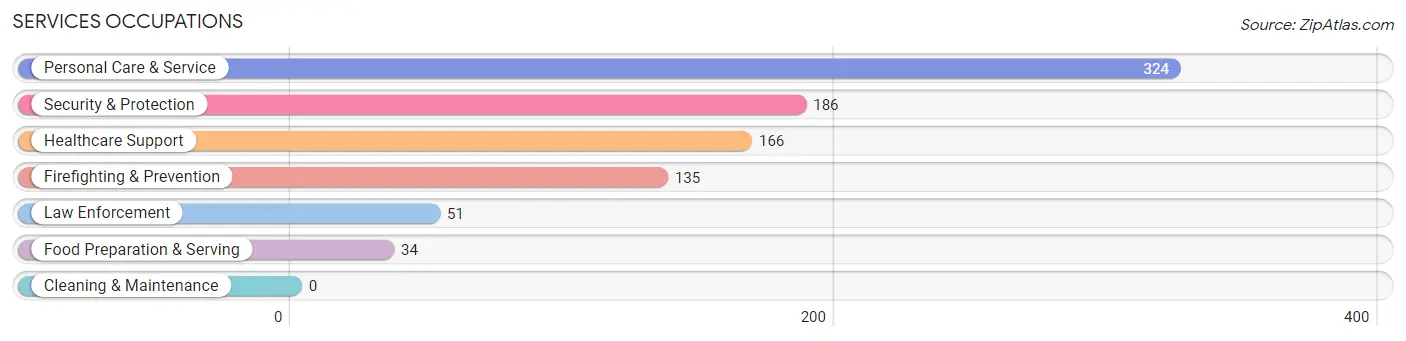
Services Occupations
The most common Services occupations in Macclenny are Personal Care & Service (324 | 9.8%), Security & Protection (186 | 5.6%), Healthcare Support (166 | 5.0%), Firefighting & Prevention (135 | 4.1%), and Law Enforcement (51 | 1.5%).
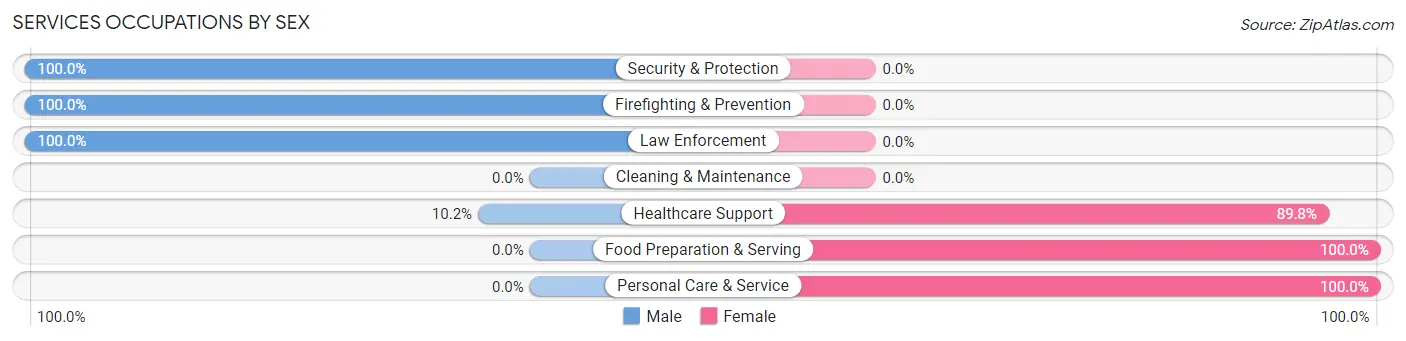
Services Occupations by Sex
Within the Services occupations in Macclenny, the most male-oriented occupations are Security & Protection (100.0%), Firefighting & Prevention (100.0%), and Law Enforcement (100.0%), while the most female-oriented occupations are Food Preparation & Serving (100.0%), Personal Care & Service (100.0%), and Healthcare Support (89.8%).
| Occupation | Male | Female |
| Healthcare Support | 17 (10.2%) | 149 (89.8%) |
| Security & Protection | 186 (100.0%) | 0 (0.0%) |
| Firefighting & Prevention | 135 (100.0%) | 0 (0.0%) |
| Law Enforcement | 51 (100.0%) | 0 (0.0%) |
| Food Preparation & Serving | 0 (0.0%) | 34 (100.0%) |
| Cleaning & Maintenance | 0 (0.0%) | 0 (0.0%) |
| Personal Care & Service | 0 (0.0%) | 324 (100.0%) |
| Total (Category) | 203 (28.6%) | 507 (71.4%) |
| Total (Overall) | 1,563 (47.2%) | 1,746 (52.8%) |
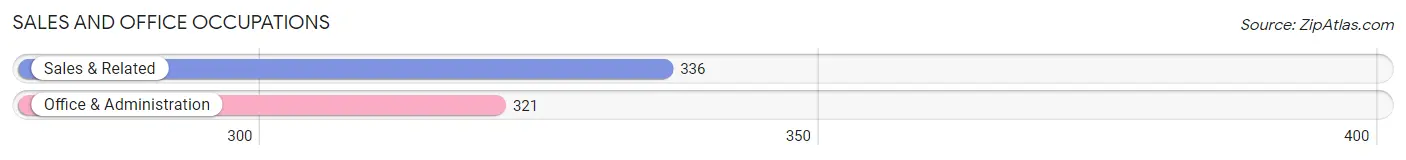
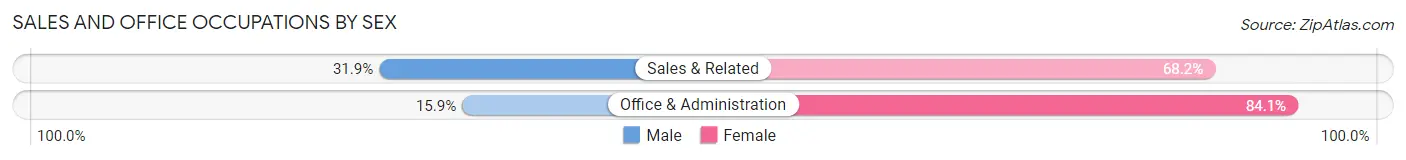
Sales and Office Occupations
The most common Sales and Office occupations in Macclenny are Sales & Related (336 | 10.2%), and Office & Administration (321 | 9.7%).
Sales and Office Occupations by Sex
| Occupation | Male | Female |
| Sales & Related | 107 (31.9%) | 229 (68.1%) |
| Office & Administration | 51 (15.9%) | 270 (84.1%) |
| Total (Category) | 158 (24.0%) | 499 (75.9%) |
| Total (Overall) | 1,563 (47.2%) | 1,746 (52.8%) |
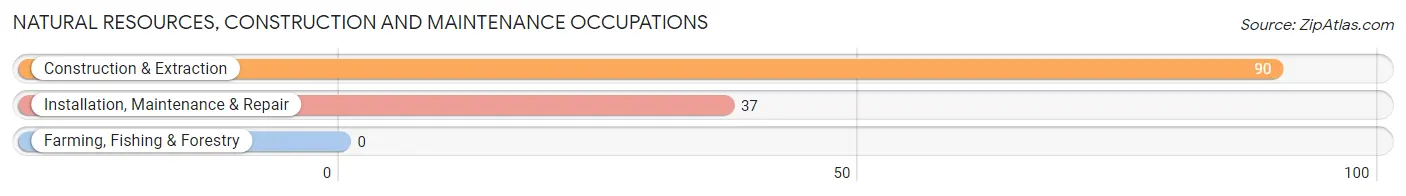
Natural Resources, Construction and Maintenance Occupations
The most common Natural Resources, Construction and Maintenance occupations in Macclenny are Construction & Extraction (90 | 2.7%), and Installation, Maintenance & Repair (37 | 1.1%).
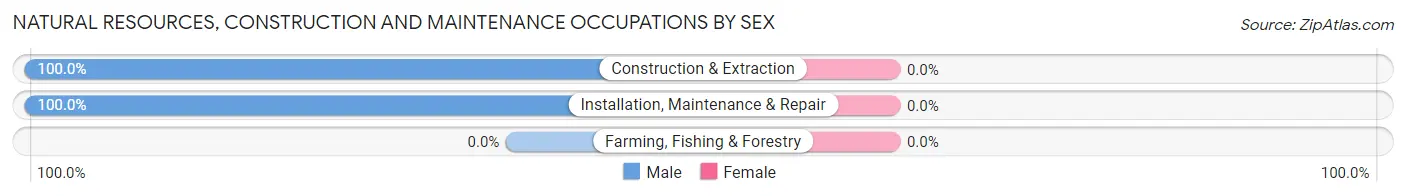
Natural Resources, Construction and Maintenance Occupations by Sex
| Occupation | Male | Female |
| Farming, Fishing & Forestry | 0 (0.0%) | 0 (0.0%) |
| Construction & Extraction | 90 (100.0%) | 0 (0.0%) |
| Installation, Maintenance & Repair | 37 (100.0%) | 0 (0.0%) |
| Total (Category) | 127 (100.0%) | 0 (0.0%) |
| Total (Overall) | 1,563 (47.2%) | 1,746 (52.8%) |
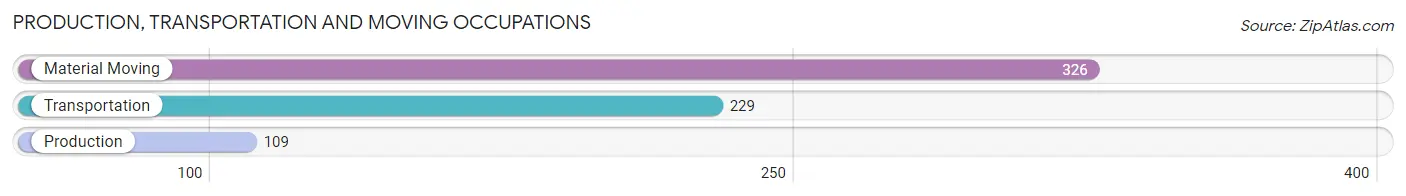
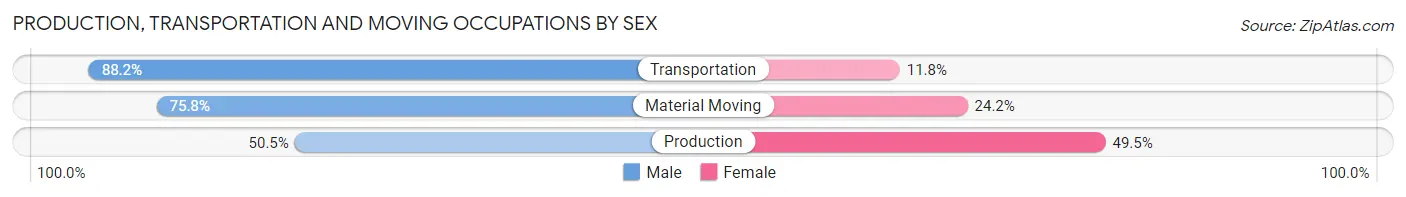
Production, Transportation and Moving Occupations
The most common Production, Transportation and Moving occupations in Macclenny are Material Moving (326 | 9.9%), Transportation (229 | 6.9%), and Production (109 | 3.3%).
Production, Transportation and Moving Occupations by Sex
| Occupation | Male | Female |
| Production | 55 (50.5%) | 54 (49.5%) |
| Transportation | 202 (88.2%) | 27 (11.8%) |
| Material Moving | 247 (75.8%) | 79 (24.2%) |
| Total (Category) | 504 (75.9%) | 160 (24.1%) |
| Total (Overall) | 1,563 (47.2%) | 1,746 (52.8%) |
Employment Industries by Sex in Macclenny
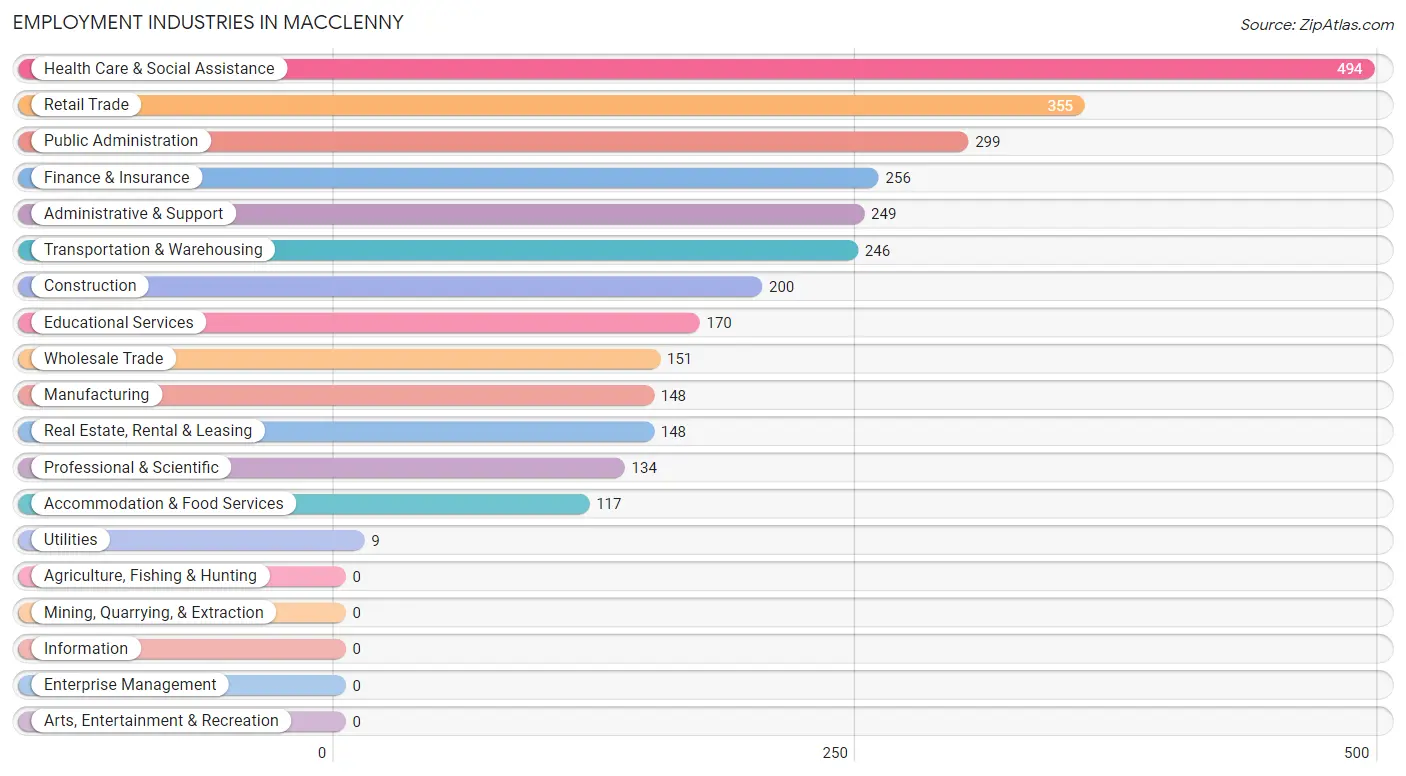
Employment Industries in Macclenny
The major employment industries in Macclenny include Health Care & Social Assistance (494 | 14.9%), Retail Trade (355 | 10.7%), Public Administration (299 | 9.0%), Finance & Insurance (256 | 7.7%), and Administrative & Support (249 | 7.5%).
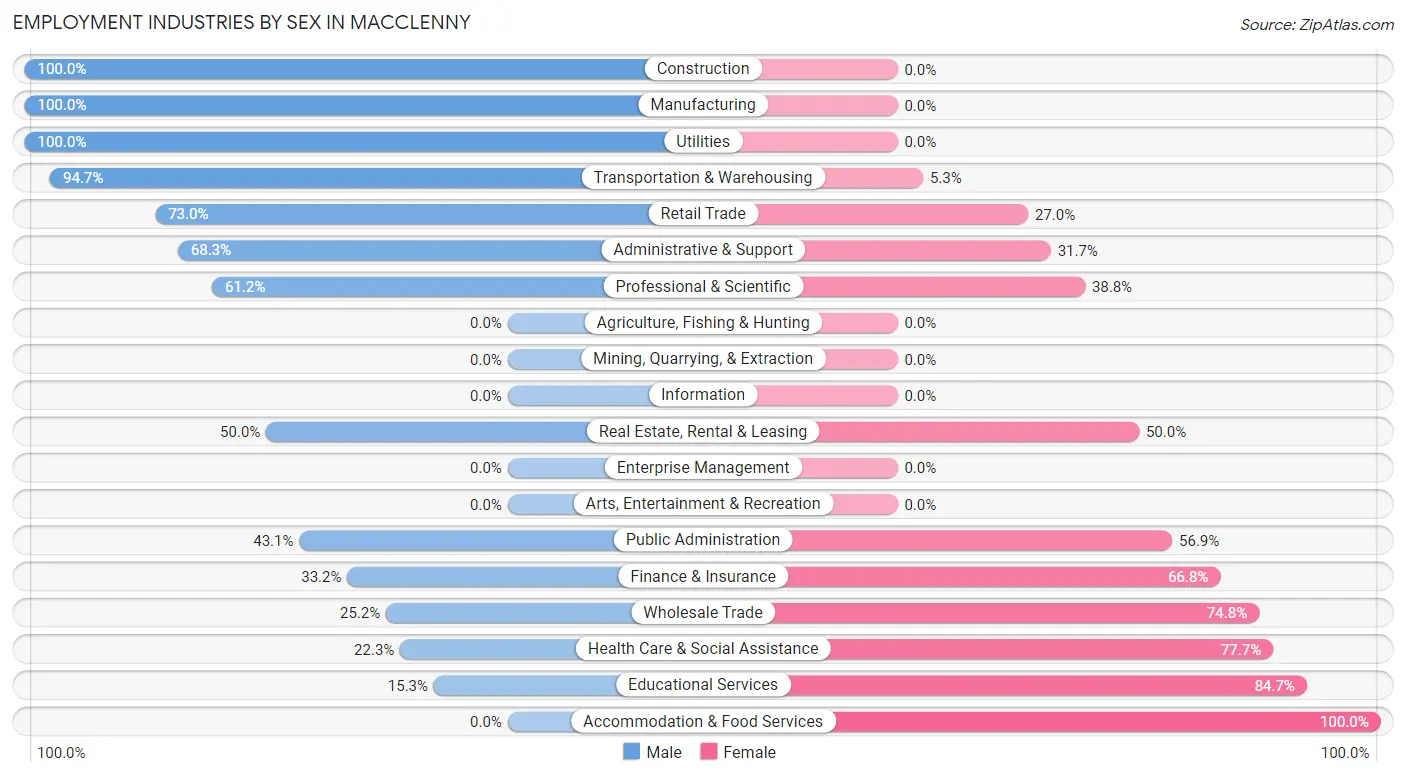
Employment Industries by Sex in Macclenny
The Macclenny industries that see more men than women are Construction (100.0%), Manufacturing (100.0%), and Utilities (100.0%), whereas the industries that tend to have a higher number of women are Accommodation & Food Services (100.0%), Educational Services (84.7%), and Health Care & Social Assistance (77.7%).
| Industry | Male | Female |
| Agriculture, Fishing & Hunting | 0 (0.0%) | 0 (0.0%) |
| Mining, Quarrying, & Extraction | 0 (0.0%) | 0 (0.0%) |
| Construction | 200 (100.0%) | 0 (0.0%) |
| Manufacturing | 148 (100.0%) | 0 (0.0%) |
| Wholesale Trade | 38 (25.2%) | 113 (74.8%) |
| Retail Trade | 259 (73.0%) | 96 (27.0%) |
| Transportation & Warehousing | 233 (94.7%) | 13 (5.3%) |
| Utilities | 9 (100.0%) | 0 (0.0%) |
| Information | 0 (0.0%) | 0 (0.0%) |
| Finance & Insurance | 85 (33.2%) | 171 (66.8%) |
| Real Estate, Rental & Leasing | 74 (50.0%) | 74 (50.0%) |
| Professional & Scientific | 82 (61.2%) | 52 (38.8%) |
| Enterprise Management | 0 (0.0%) | 0 (0.0%) |
| Administrative & Support | 170 (68.3%) | 79 (31.7%) |
| Educational Services | 26 (15.3%) | 144 (84.7%) |
| Health Care & Social Assistance | 110 (22.3%) | 384 (77.7%) |
| Arts, Entertainment & Recreation | 0 (0.0%) | 0 (0.0%) |
| Accommodation & Food Services | 0 (0.0%) | 117 (100.0%) |
| Public Administration | 129 (43.1%) | 170 (56.9%) |
| Total | 1,563 (47.2%) | 1,746 (52.8%) |
Education in Macclenny
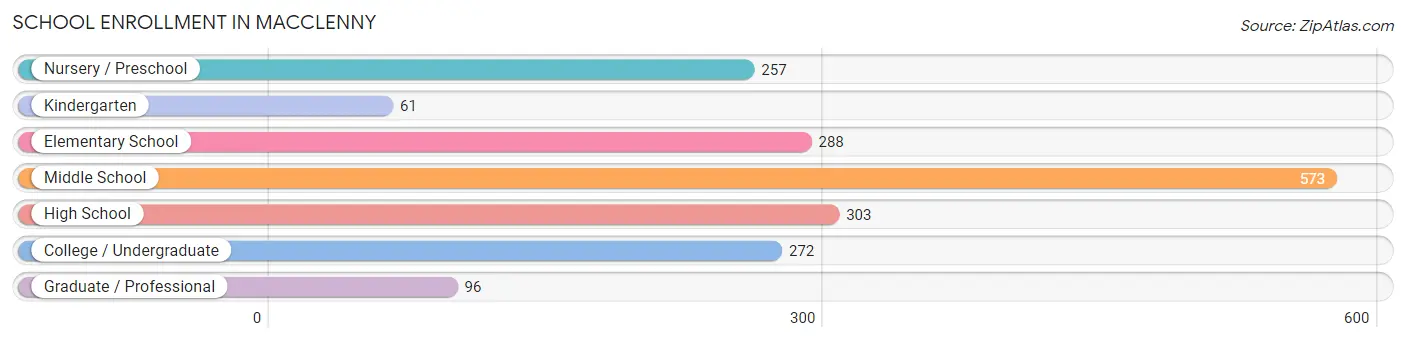
School Enrollment in Macclenny
The most common levels of schooling among the 1,850 students in Macclenny are middle school (573 | 31.0%), high school (303 | 16.4%), and elementary school (288 | 15.6%).
| School Level | # Students | % Students |
| Nursery / Preschool | 257 | 13.9% |
| Kindergarten | 61 | 3.3% |
| Elementary School | 288 | 15.6% |
| Middle School | 573 | 31.0% |
| High School | 303 | 16.4% |
| College / Undergraduate | 272 | 14.7% |
| Graduate / Professional | 96 | 5.2% |
| Total | 1,850 | 100.0% |
School Enrollment by Age by Funding Source in Macclenny
Out of a total of 1,850 students who are enrolled in schools in Macclenny, 168 (9.1%) attend a private institution, while the remaining 1,682 (90.9%) are enrolled in public schools. The age group of 25 to 34 year olds has the highest likelihood of being enrolled in private schools, with 79 (56.8% in the age bracket) enrolled. Conversely, the age group of 5 to 9 year old has the lowest likelihood of being enrolled in a private school, with 280 (100.0% in the age bracket) attending a public institution.
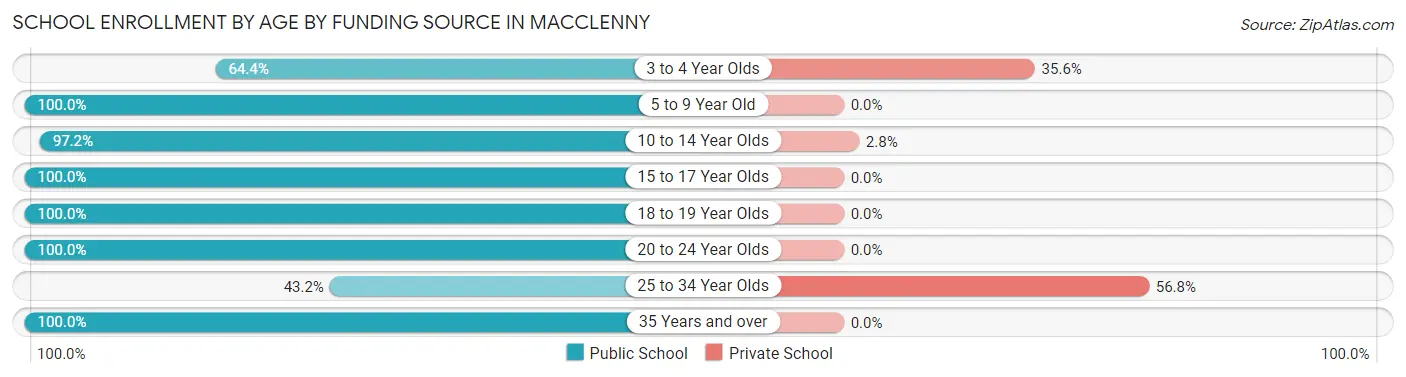
| Age Bracket | Public School | Private School |
| 3 to 4 Year Olds | 125 (64.4%) | 69 (35.6%) |
| 5 to 9 Year Old | 280 (100.0%) | 0 (0.0%) |
| 10 to 14 Year Olds | 685 (97.2%) | 20 (2.8%) |
| 15 to 17 Year Olds | 222 (100.0%) | 0 (0.0%) |
| 18 to 19 Year Olds | 135 (100.0%) | 0 (0.0%) |
| 20 to 24 Year Olds | 143 (100.0%) | 0 (0.0%) |
| 25 to 34 Year Olds | 60 (43.2%) | 79 (56.8%) |
| 35 Years and over | 32 (100.0%) | 0 (0.0%) |
| Total | 1,682 (90.9%) | 168 (9.1%) |
Educational Attainment by Field of Study in Macclenny
Education (202 | 24.7%), business (154 | 18.9%), science & technology (125 | 15.3%), engineering (81 | 9.9%), and bio, nature & agricultural (65 | 8.0%) are the most common fields of study among 817 individuals in Macclenny who have obtained a bachelor's degree or higher.
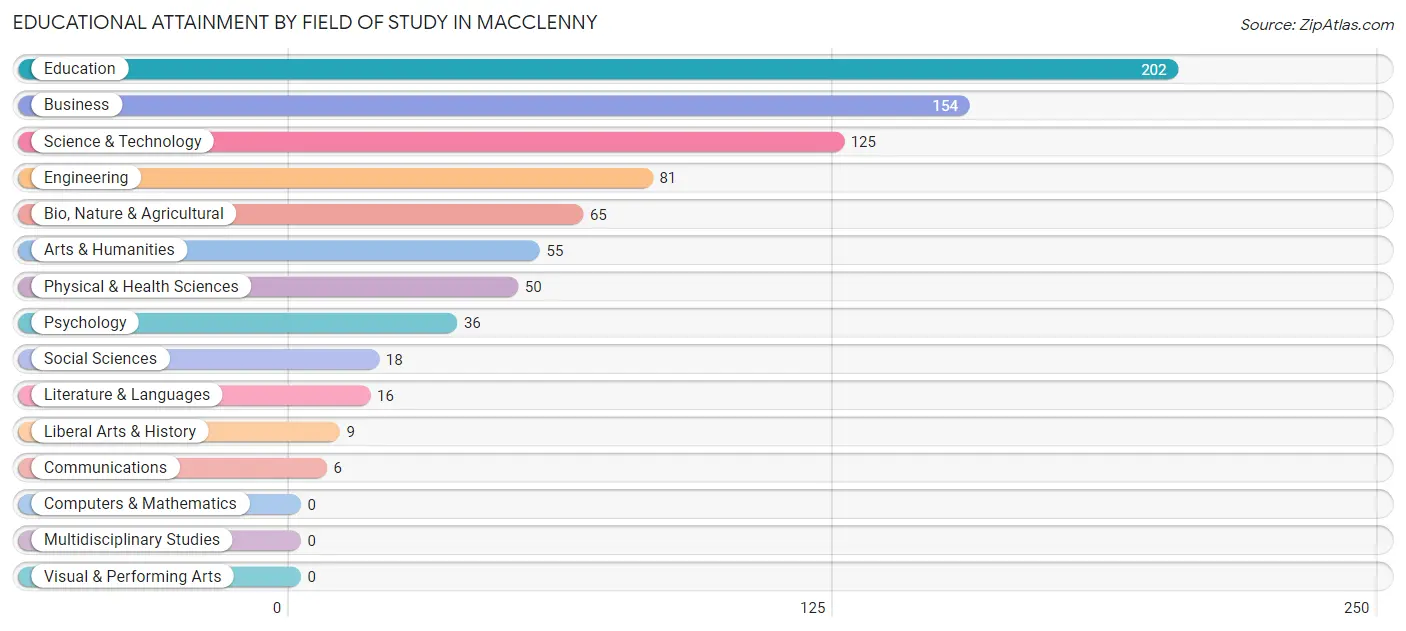
| Field of Study | # Graduates | % Graduates |
| Computers & Mathematics | 0 | 0.0% |
| Bio, Nature & Agricultural | 65 | 8.0% |
| Physical & Health Sciences | 50 | 6.1% |
| Psychology | 36 | 4.4% |
| Social Sciences | 18 | 2.2% |
| Engineering | 81 | 9.9% |
| Multidisciplinary Studies | 0 | 0.0% |
| Science & Technology | 125 | 15.3% |
| Business | 154 | 18.9% |
| Education | 202 | 24.7% |
| Literature & Languages | 16 | 2.0% |
| Liberal Arts & History | 9 | 1.1% |
| Visual & Performing Arts | 0 | 0.0% |
| Communications | 6 | 0.7% |
| Arts & Humanities | 55 | 6.7% |
| Total | 817 | 100.0% |
Transportation & Commute in Macclenny
Vehicle Availability by Sex in Macclenny
The most prevalent vehicle ownership categories in Macclenny are males with 2 vehicles (659, accounting for 40.5%) and females with 2 vehicles (327, making up 44.7%).
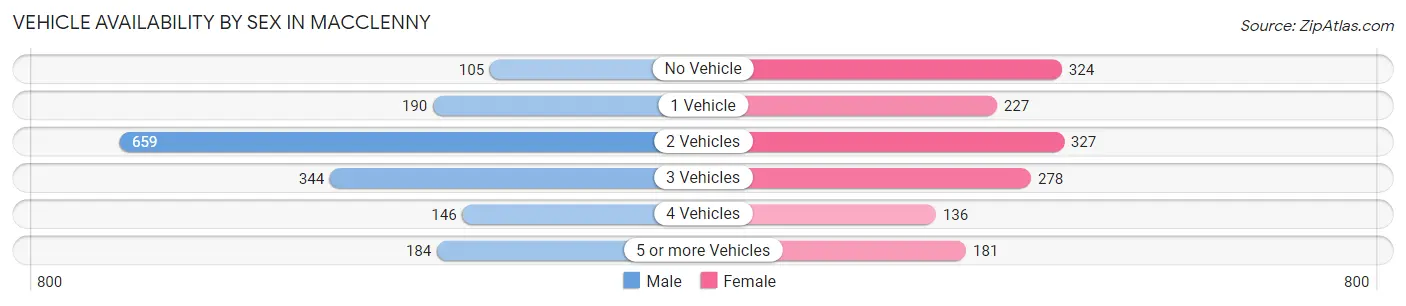
| Vehicles Available | Male | Female |
| No Vehicle | 105 (6.5%) | 324 (22.0%) |
| 1 Vehicle | 190 (11.7%) | 227 (15.4%) |
| 2 Vehicles | 659 (40.5%) | 327 (22.2%) |
| 3 Vehicles | 344 (21.1%) | 278 (18.9%) |
| 4 Vehicles | 146 (9.0%) | 136 (9.2%) |
| 5 or more Vehicles | 184 (11.3%) | 181 (12.3%) |
| Total | 1,628 (100.0%) | 1,473 (100.0%) |
Commute Time in Macclenny
The most frequently occuring commute durations in Macclenny are 30 to 34 minutes (547 commuters, 19.0%), 10 to 14 minutes (446 commuters, 15.5%), and 5 to 9 minutes (361 commuters, 12.5%).
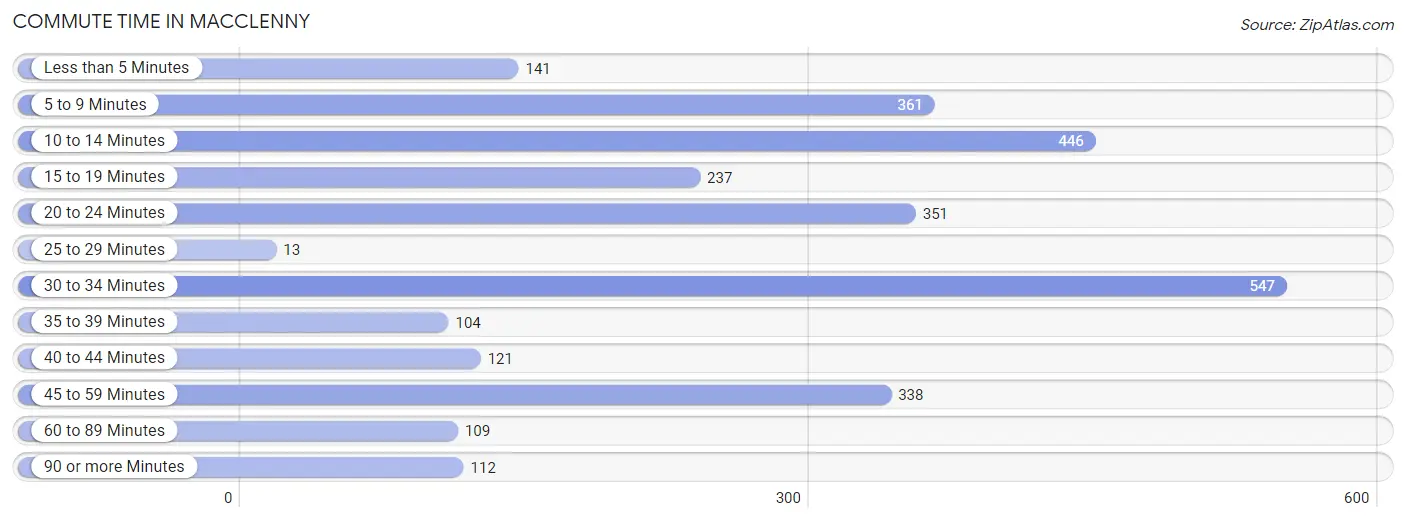
| Commute Time | # Commuters | % Commuters |
| Less than 5 Minutes | 141 | 4.9% |
| 5 to 9 Minutes | 361 | 12.5% |
| 10 to 14 Minutes | 446 | 15.5% |
| 15 to 19 Minutes | 237 | 8.2% |
| 20 to 24 Minutes | 351 | 12.2% |
| 25 to 29 Minutes | 13 | 0.4% |
| 30 to 34 Minutes | 547 | 19.0% |
| 35 to 39 Minutes | 104 | 3.6% |
| 40 to 44 Minutes | 121 | 4.2% |
| 45 to 59 Minutes | 338 | 11.7% |
| 60 to 89 Minutes | 109 | 3.8% |
| 90 or more Minutes | 112 | 3.9% |
Commute Time by Sex in Macclenny
The most common commute times in Macclenny are 10 to 14 minutes (360 commuters, 23.4%) for males and 20 to 24 minutes (351 commuters, 26.2%) for females.
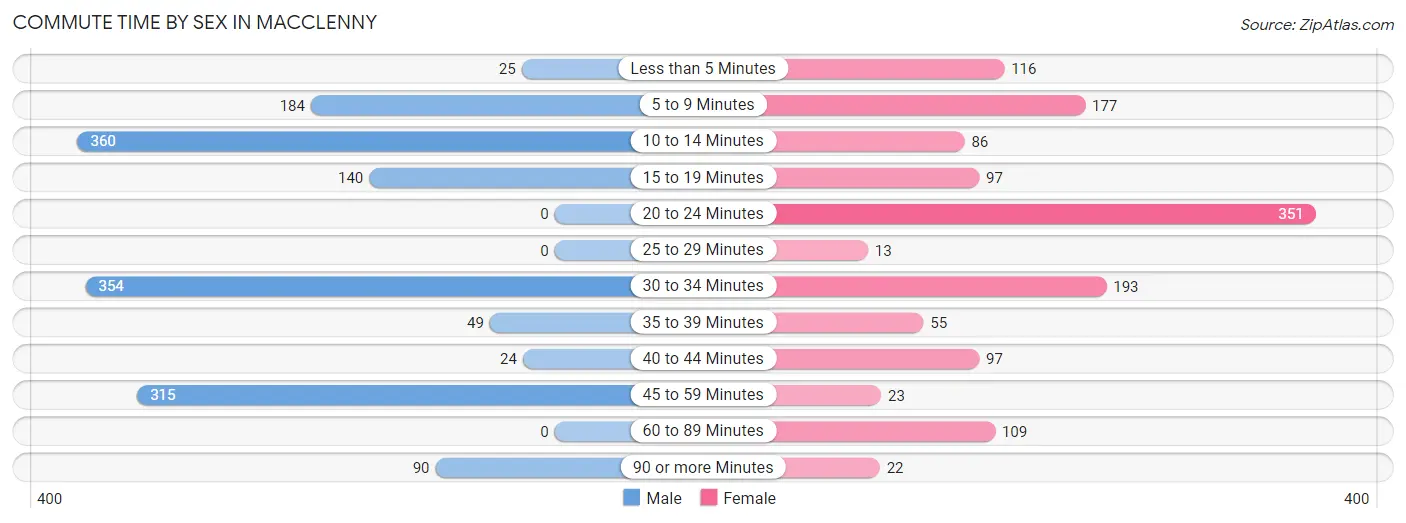
| Commute Time | Male | Female |
| Less than 5 Minutes | 25 (1.6%) | 116 (8.7%) |
| 5 to 9 Minutes | 184 (11.9%) | 177 (13.2%) |
| 10 to 14 Minutes | 360 (23.4%) | 86 (6.4%) |
| 15 to 19 Minutes | 140 (9.1%) | 97 (7.2%) |
| 20 to 24 Minutes | 0 (0.0%) | 351 (26.2%) |
| 25 to 29 Minutes | 0 (0.0%) | 13 (1.0%) |
| 30 to 34 Minutes | 354 (23.0%) | 193 (14.4%) |
| 35 to 39 Minutes | 49 (3.2%) | 55 (4.1%) |
| 40 to 44 Minutes | 24 (1.6%) | 97 (7.2%) |
| 45 to 59 Minutes | 315 (20.4%) | 23 (1.7%) |
| 60 to 89 Minutes | 0 (0.0%) | 109 (8.1%) |
| 90 or more Minutes | 90 (5.8%) | 22 (1.6%) |
Time of Departure to Work by Sex in Macclenny
The most frequent times of departure to work in Macclenny are 6:00 AM to 6:29 AM (242, 15.7%) for males and 6:30 AM to 6:59 AM (402, 30.0%) for females.
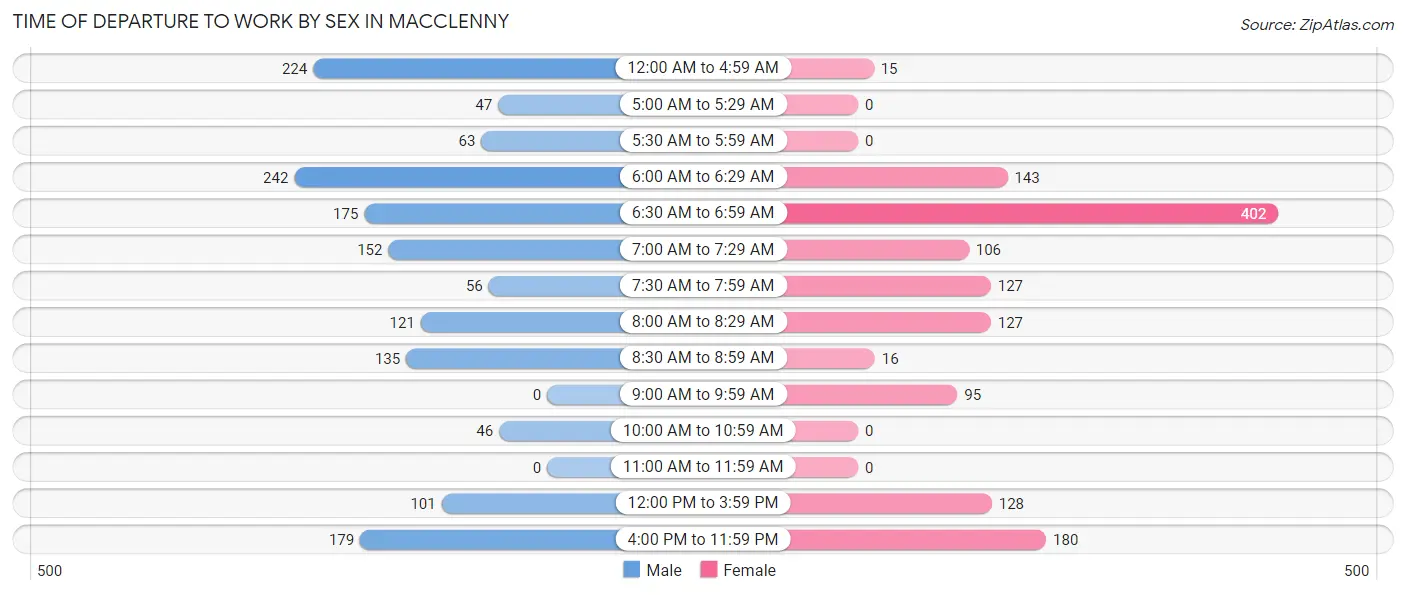
| Time of Departure | Male | Female |
| 12:00 AM to 4:59 AM | 224 (14.5%) | 15 (1.1%) |
| 5:00 AM to 5:29 AM | 47 (3.0%) | 0 (0.0%) |
| 5:30 AM to 5:59 AM | 63 (4.1%) | 0 (0.0%) |
| 6:00 AM to 6:29 AM | 242 (15.7%) | 143 (10.7%) |
| 6:30 AM to 6:59 AM | 175 (11.4%) | 402 (30.0%) |
| 7:00 AM to 7:29 AM | 152 (9.9%) | 106 (7.9%) |
| 7:30 AM to 7:59 AM | 56 (3.6%) | 127 (9.5%) |
| 8:00 AM to 8:29 AM | 121 (7.9%) | 127 (9.5%) |
| 8:30 AM to 8:59 AM | 135 (8.8%) | 16 (1.2%) |
| 9:00 AM to 9:59 AM | 0 (0.0%) | 95 (7.1%) |
| 10:00 AM to 10:59 AM | 46 (3.0%) | 0 (0.0%) |
| 11:00 AM to 11:59 AM | 0 (0.0%) | 0 (0.0%) |
| 12:00 PM to 3:59 PM | 101 (6.6%) | 128 (9.6%) |
| 4:00 PM to 11:59 PM | 179 (11.6%) | 180 (13.4%) |
| Total | 1,541 (100.0%) | 1,339 (100.0%) |
Housing Occupancy in Macclenny
Occupancy by Ownership in Macclenny
Of the total 2,417 dwellings in Macclenny, owner-occupied units account for 1,534 (63.5%), while renter-occupied units make up 883 (36.5%).
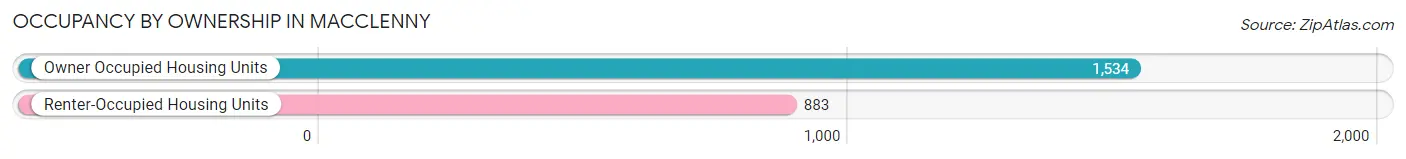
| Occupancy | # Housing Units | % Housing Units |
| Owner Occupied Housing Units | 1,534 | 63.5% |
| Renter-Occupied Housing Units | 883 | 36.5% |
| Total Occupied Housing Units | 2,417 | 100.0% |
Occupancy by Household Size in Macclenny
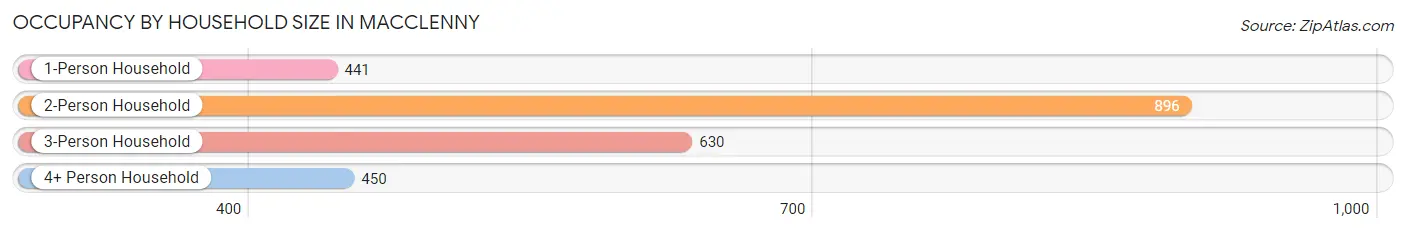
| Household Size | # Housing Units | % Housing Units |
| 1-Person Household | 441 | 18.2% |
| 2-Person Household | 896 | 37.1% |
| 3-Person Household | 630 | 26.1% |
| 4+ Person Household | 450 | 18.6% |
| Total Housing Units | 2,417 | 100.0% |
Occupancy by Ownership by Household Size in Macclenny
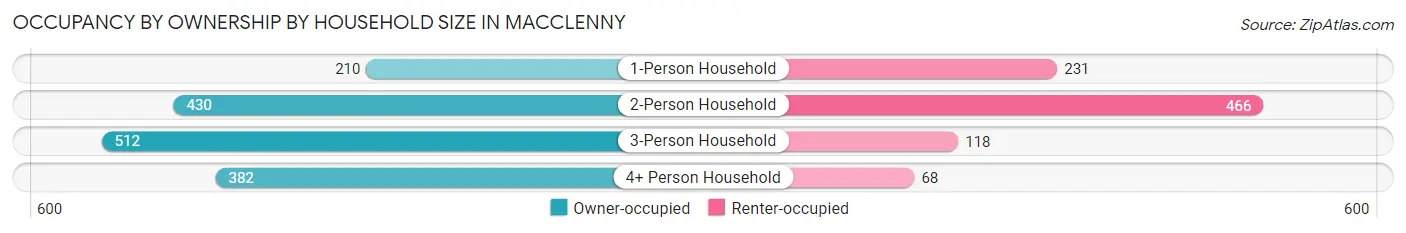
| Household Size | Owner-occupied | Renter-occupied |
| 1-Person Household | 210 (47.6%) | 231 (52.4%) |
| 2-Person Household | 430 (48.0%) | 466 (52.0%) |
| 3-Person Household | 512 (81.3%) | 118 (18.7%) |
| 4+ Person Household | 382 (84.9%) | 68 (15.1%) |
| Total Housing Units | 1,534 (63.5%) | 883 (36.5%) |
Occupancy by Educational Attainment in Macclenny
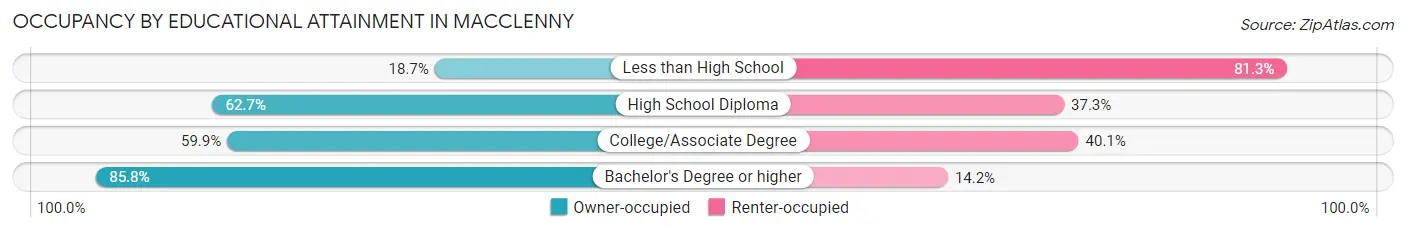
| Household Size | Owner-occupied | Renter-occupied |
| Less than High School | 29 (18.7%) | 126 (81.3%) |
| High School Diploma | 591 (62.7%) | 351 (37.3%) |
| College/Associate Degree | 504 (59.9%) | 338 (40.1%) |
| Bachelor's Degree or higher | 410 (85.8%) | 68 (14.2%) |
Occupancy by Age of Householder in Macclenny
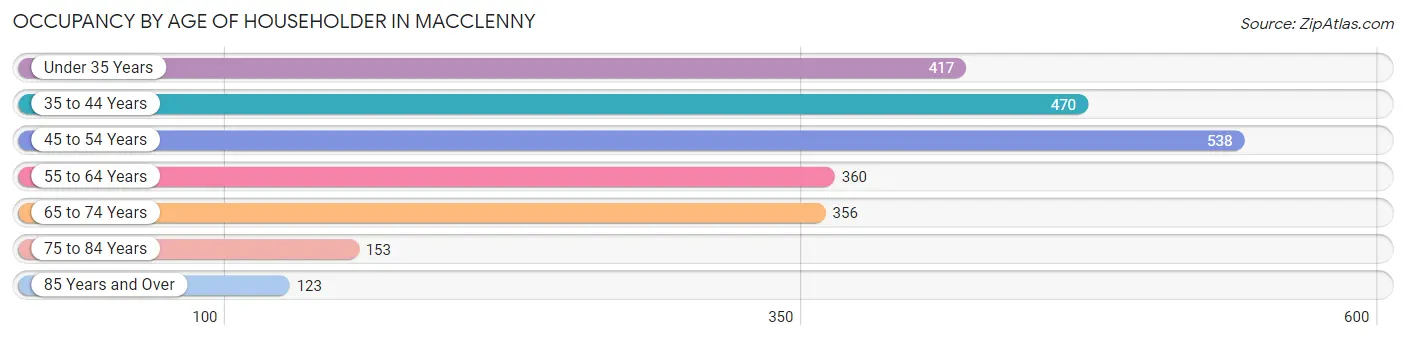
| Age Bracket | # Households | % Households |
| Under 35 Years | 417 | 17.2% |
| 35 to 44 Years | 470 | 19.5% |
| 45 to 54 Years | 538 | 22.3% |
| 55 to 64 Years | 360 | 14.9% |
| 65 to 74 Years | 356 | 14.7% |
| 75 to 84 Years | 153 | 6.3% |
| 85 Years and Over | 123 | 5.1% |
| Total | 2,417 | 100.0% |
Housing Finances in Macclenny
Median Income by Occupancy in Macclenny
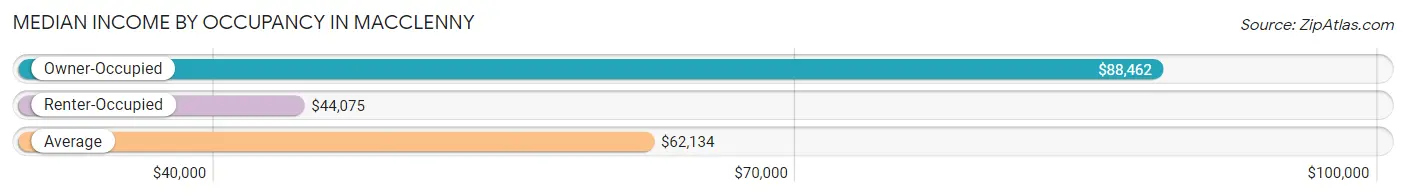
| Occupancy Type | # Households | Median Income |
| Owner-Occupied | 1,534 (63.5%) | $88,462 |
| Renter-Occupied | 883 (36.5%) | $44,075 |
| Average | 2,417 (100.0%) | $62,134 |
Occupancy by Householder Income Bracket in Macclenny
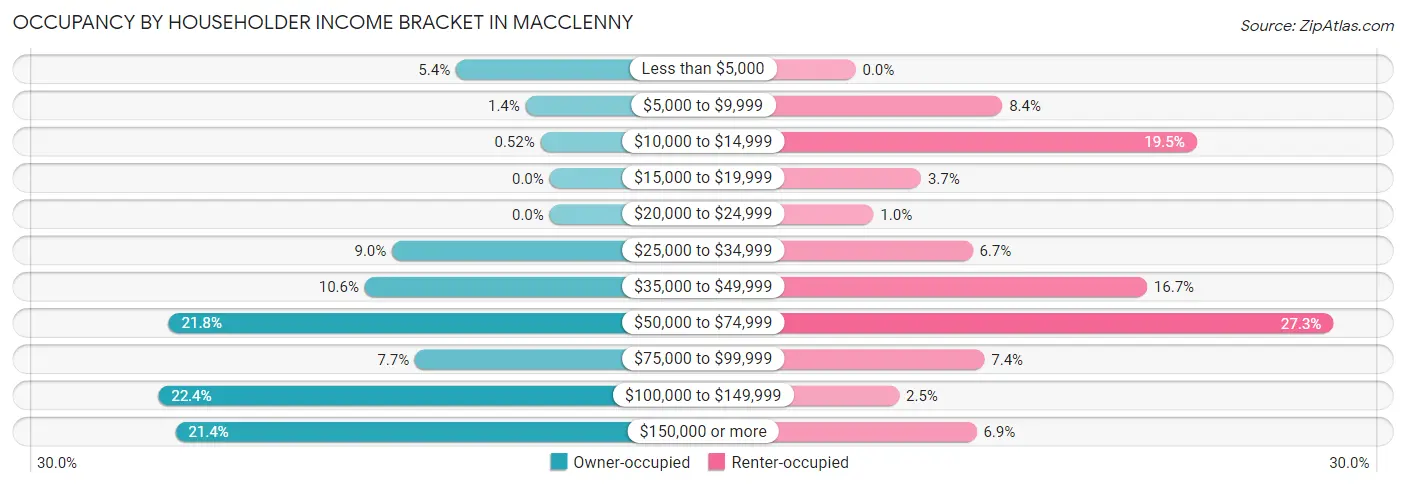
| Income Bracket | Owner-occupied | Renter-occupied |
| Less than $5,000 | 82 (5.3%) | 0 (0.0%) |
| $5,000 to $9,999 | 21 (1.4%) | 74 (8.4%) |
| $10,000 to $14,999 | 8 (0.5%) | 172 (19.5%) |
| $15,000 to $19,999 | 0 (0.0%) | 33 (3.7%) |
| $20,000 to $24,999 | 0 (0.0%) | 9 (1.0%) |
| $25,000 to $34,999 | 138 (9.0%) | 59 (6.7%) |
| $35,000 to $49,999 | 162 (10.6%) | 147 (16.7%) |
| $50,000 to $74,999 | 334 (21.8%) | 241 (27.3%) |
| $75,000 to $99,999 | 118 (7.7%) | 65 (7.4%) |
| $100,000 to $149,999 | 343 (22.4%) | 22 (2.5%) |
| $150,000 or more | 328 (21.4%) | 61 (6.9%) |
| Total | 1,534 (100.0%) | 883 (100.0%) |
Monthly Housing Cost Tiers in Macclenny
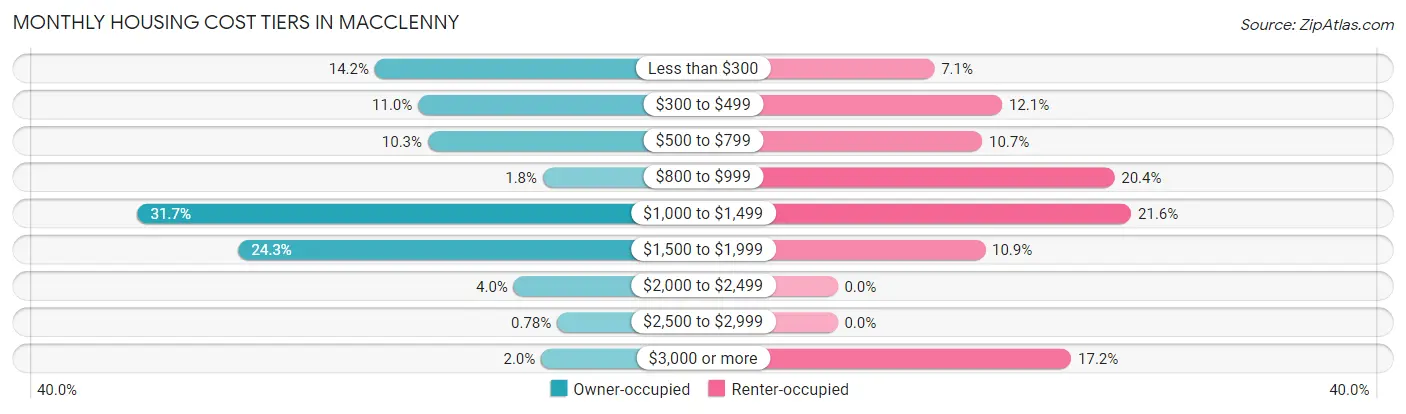
| Monthly Cost | Owner-occupied | Renter-occupied |
| Less than $300 | 218 (14.2%) | 63 (7.1%) |
| $300 to $499 | 169 (11.0%) | 107 (12.1%) |
| $500 to $799 | 158 (10.3%) | 94 (10.6%) |
| $800 to $999 | 28 (1.8%) | 180 (20.4%) |
| $1,000 to $1,499 | 486 (31.7%) | 191 (21.6%) |
| $1,500 to $1,999 | 372 (24.2%) | 96 (10.9%) |
| $2,000 to $2,499 | 61 (4.0%) | 0 (0.0%) |
| $2,500 to $2,999 | 12 (0.8%) | 0 (0.0%) |
| $3,000 or more | 30 (2.0%) | 152 (17.2%) |
| Total | 1,534 (100.0%) | 883 (100.0%) |
Physical Housing Characteristics in Macclenny
Housing Structures in Macclenny
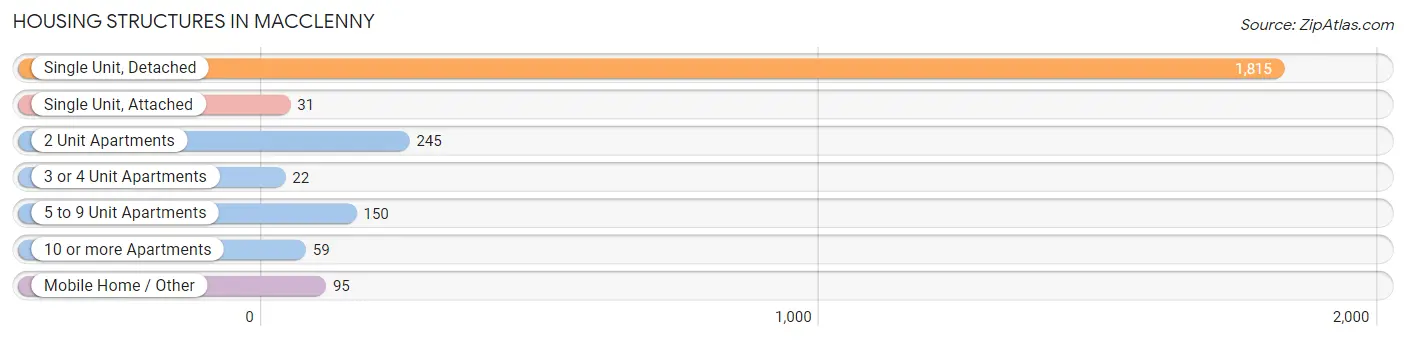
| Structure Type | # Housing Units | % Housing Units |
| Single Unit, Detached | 1,815 | 75.1% |
| Single Unit, Attached | 31 | 1.3% |
| 2 Unit Apartments | 245 | 10.1% |
| 3 or 4 Unit Apartments | 22 | 0.9% |
| 5 to 9 Unit Apartments | 150 | 6.2% |
| 10 or more Apartments | 59 | 2.4% |
| Mobile Home / Other | 95 | 3.9% |
| Total | 2,417 | 100.0% |
Housing Structures by Occupancy in Macclenny
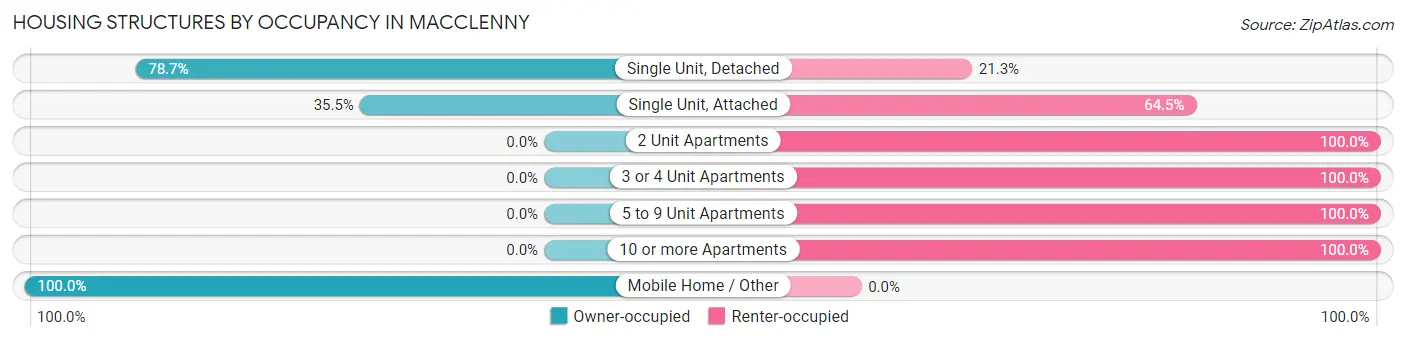
| Structure Type | Owner-occupied | Renter-occupied |
| Single Unit, Detached | 1,428 (78.7%) | 387 (21.3%) |
| Single Unit, Attached | 11 (35.5%) | 20 (64.5%) |
| 2 Unit Apartments | 0 (0.0%) | 245 (100.0%) |
| 3 or 4 Unit Apartments | 0 (0.0%) | 22 (100.0%) |
| 5 to 9 Unit Apartments | 0 (0.0%) | 150 (100.0%) |
| 10 or more Apartments | 0 (0.0%) | 59 (100.0%) |
| Mobile Home / Other | 95 (100.0%) | 0 (0.0%) |
| Total | 1,534 (63.5%) | 883 (36.5%) |
Housing Structures by Number of Rooms in Macclenny
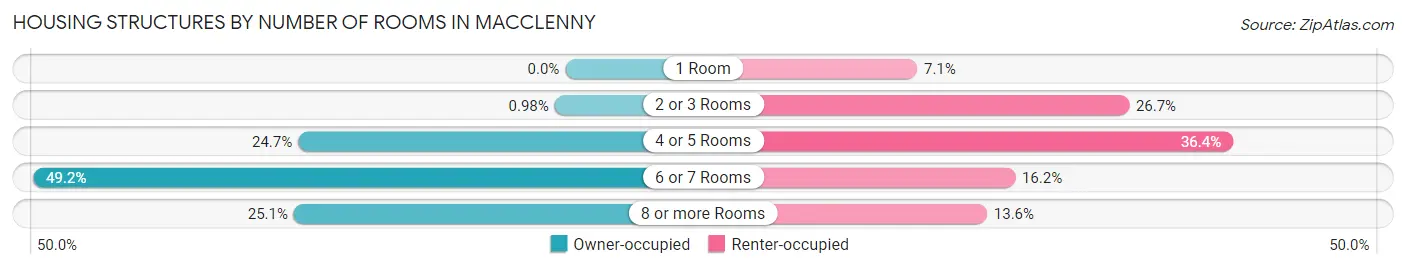
| Number of Rooms | Owner-occupied | Renter-occupied |
| 1 Room | 0 (0.0%) | 63 (7.1%) |
| 2 or 3 Rooms | 15 (1.0%) | 236 (26.7%) |
| 4 or 5 Rooms | 379 (24.7%) | 321 (36.3%) |
| 6 or 7 Rooms | 755 (49.2%) | 143 (16.2%) |
| 8 or more Rooms | 385 (25.1%) | 120 (13.6%) |
| Total | 1,534 (100.0%) | 883 (100.0%) |
Housing Structure by Heating Type in Macclenny
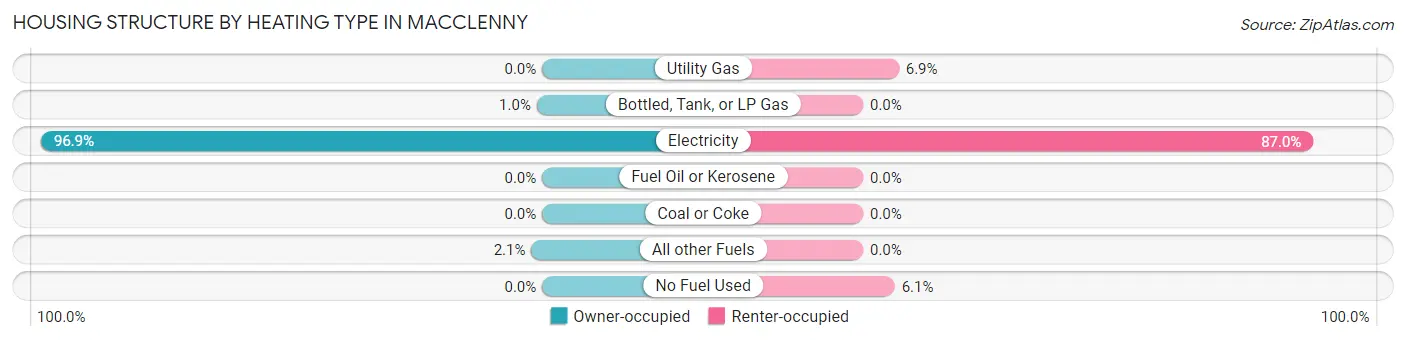
| Heating Type | Owner-occupied | Renter-occupied |
| Utility Gas | 0 (0.0%) | 61 (6.9%) |
| Bottled, Tank, or LP Gas | 16 (1.0%) | 0 (0.0%) |
| Electricity | 1,486 (96.9%) | 768 (87.0%) |
| Fuel Oil or Kerosene | 0 (0.0%) | 0 (0.0%) |
| Coal or Coke | 0 (0.0%) | 0 (0.0%) |
| All other Fuels | 32 (2.1%) | 0 (0.0%) |
| No Fuel Used | 0 (0.0%) | 54 (6.1%) |
| Total | 1,534 (100.0%) | 883 (100.0%) |
Household Vehicle Usage in Macclenny
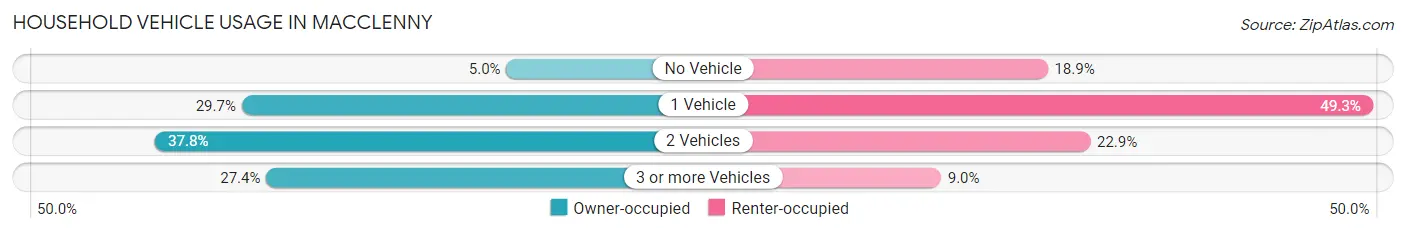
| Vehicles per Household | Owner-occupied | Renter-occupied |
| No Vehicle | 77 (5.0%) | 167 (18.9%) |
| 1 Vehicle | 456 (29.7%) | 435 (49.3%) |
| 2 Vehicles | 580 (37.8%) | 202 (22.9%) |
| 3 or more Vehicles | 421 (27.4%) | 79 (8.9%) |
| Total | 1,534 (100.0%) | 883 (100.0%) |
Real Estate & Mortgages in Macclenny
Real Estate and Mortgage Overview in Macclenny
| Characteristic | Without Mortgage | With Mortgage |
| Housing Units | 510 | 1,024 |
| Median Property Value | $143,000 | $231,000 |
| Median Household Income | $49,632 | $292 |
| Monthly Housing Costs | $315 | $30 |
| Real Estate Taxes | $473 | $26 |
Property Value by Mortgage Status in Macclenny
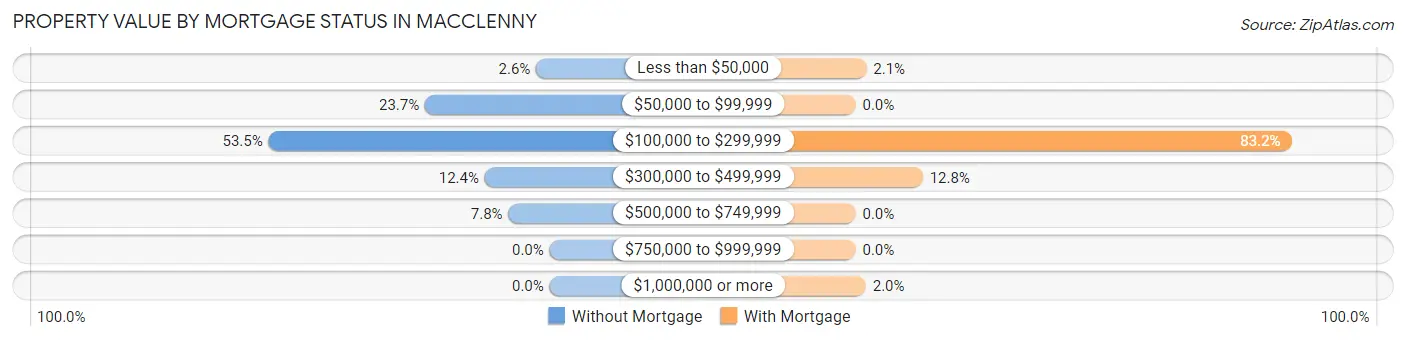
| Property Value | Without Mortgage | With Mortgage |
| Less than $50,000 | 13 (2.5%) | 21 (2.1%) |
| $50,000 to $99,999 | 121 (23.7%) | 0 (0.0%) |
| $100,000 to $299,999 | 273 (53.5%) | 852 (83.2%) |
| $300,000 to $499,999 | 63 (12.3%) | 131 (12.8%) |
| $500,000 to $749,999 | 40 (7.8%) | 0 (0.0%) |
| $750,000 to $999,999 | 0 (0.0%) | 0 (0.0%) |
| $1,000,000 or more | 0 (0.0%) | 20 (1.9%) |
| Total | 510 (100.0%) | 1,024 (100.0%) |
Household Income by Mortgage Status in Macclenny
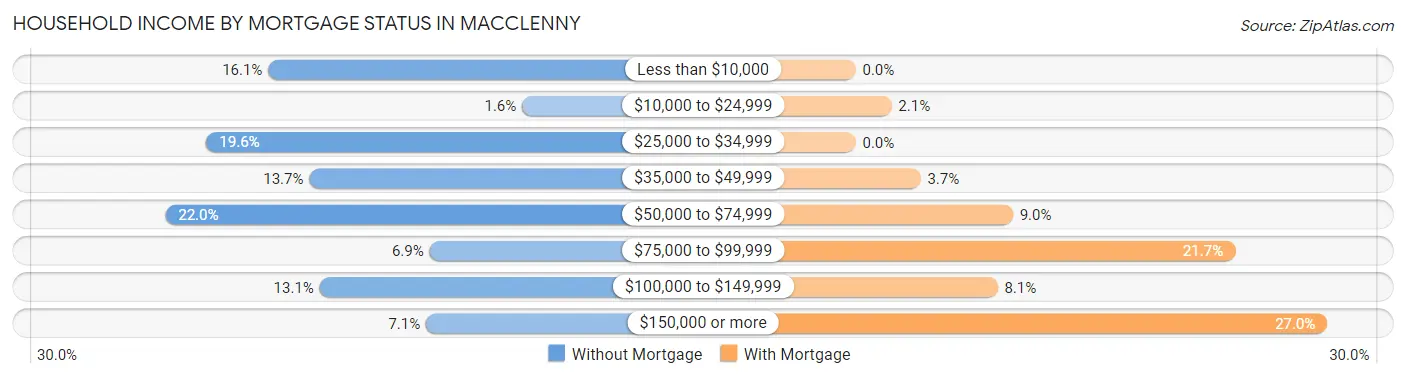
| Household Income | Without Mortgage | With Mortgage |
| Less than $10,000 | 82 (16.1%) | 0 (0.0%) |
| $10,000 to $24,999 | 8 (1.6%) | 21 (2.1%) |
| $25,000 to $34,999 | 100 (19.6%) | 0 (0.0%) |
| $35,000 to $49,999 | 70 (13.7%) | 38 (3.7%) |
| $50,000 to $74,999 | 112 (22.0%) | 92 (9.0%) |
| $75,000 to $99,999 | 35 (6.9%) | 222 (21.7%) |
| $100,000 to $149,999 | 67 (13.1%) | 83 (8.1%) |
| $150,000 or more | 36 (7.1%) | 276 (27.0%) |
| Total | 510 (100.0%) | 1,024 (100.0%) |
Property Value to Household Income Ratio in Macclenny
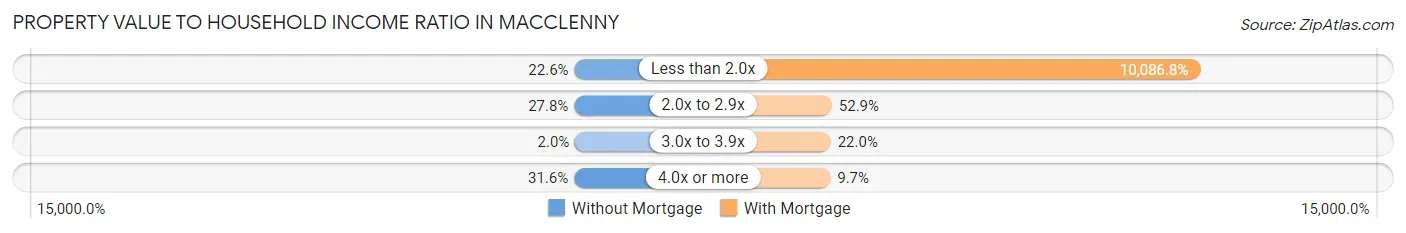
| Value-to-Income Ratio | Without Mortgage | With Mortgage |
| Less than 2.0x | 115 (22.6%) | 103,289 (10,086.8%) |
| 2.0x to 2.9x | 142 (27.8%) | 542 (52.9%) |
| 3.0x to 3.9x | 10 (2.0%) | 225 (22.0%) |
| 4.0x or more | 161 (31.6%) | 99 (9.7%) |
| Total | 510 (100.0%) | 1,024 (100.0%) |
Real Estate Taxes by Mortgage Status in Macclenny
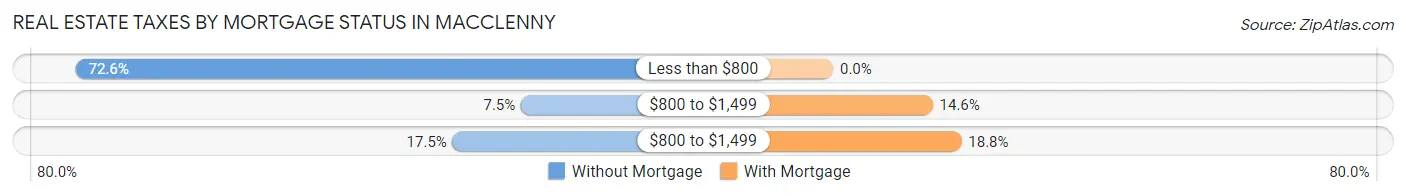
| Property Taxes | Without Mortgage | With Mortgage |
| Less than $800 | 370 (72.6%) | 0 (0.0%) |
| $800 to $1,499 | 38 (7.4%) | 149 (14.5%) |
| $800 to $1,499 | 89 (17.4%) | 192 (18.8%) |
| Total | 510 (100.0%) | 1,024 (100.0%) |
Health & Disability in Macclenny
Health Insurance Coverage by Age in Macclenny
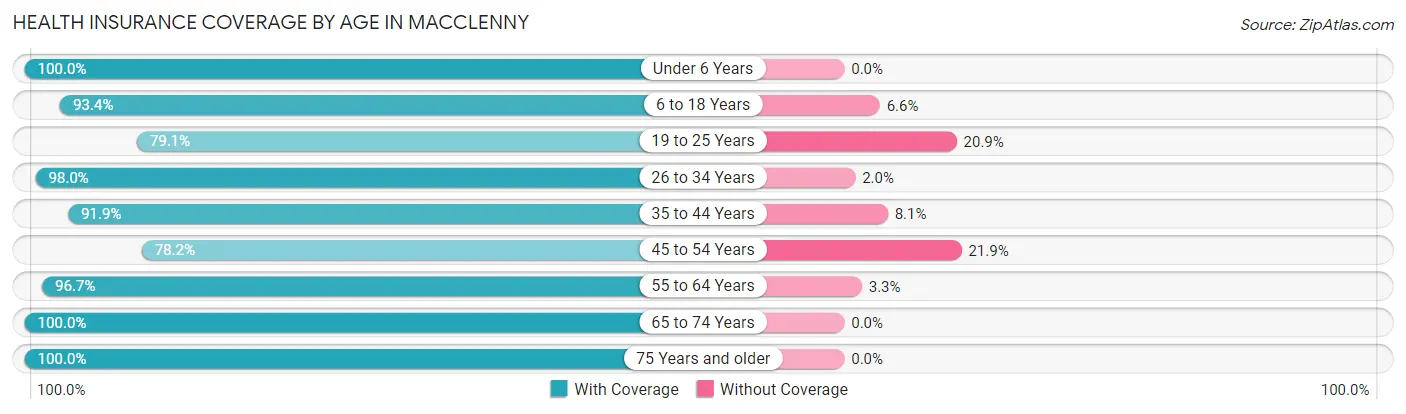
| Age Bracket | With Coverage | Without Coverage |
| Under 6 Years | 545 (100.0%) | 0 (0.0%) |
| 6 to 18 Years | 1,144 (93.4%) | 81 (6.6%) |
| 19 to 25 Years | 721 (79.1%) | 191 (20.9%) |
| 26 to 34 Years | 628 (98.0%) | 13 (2.0%) |
| 35 to 44 Years | 658 (91.9%) | 58 (8.1%) |
| 45 to 54 Years | 837 (78.1%) | 234 (21.8%) |
| 55 to 64 Years | 712 (96.7%) | 24 (3.3%) |
| 65 to 74 Years | 527 (100.0%) | 0 (0.0%) |
| 75 Years and older | 360 (100.0%) | 0 (0.0%) |
| Total | 6,132 (91.1%) | 601 (8.9%) |
Health Insurance Coverage by Citizenship Status in Macclenny

| Citizenship Status | With Coverage | Without Coverage |
| Native Born | 545 (100.0%) | 0 (0.0%) |
| Foreign Born, Citizen | 1,144 (93.4%) | 81 (6.6%) |
| Foreign Born, not a Citizen | 721 (79.1%) | 191 (20.9%) |
Health Insurance Coverage by Household Income in Macclenny
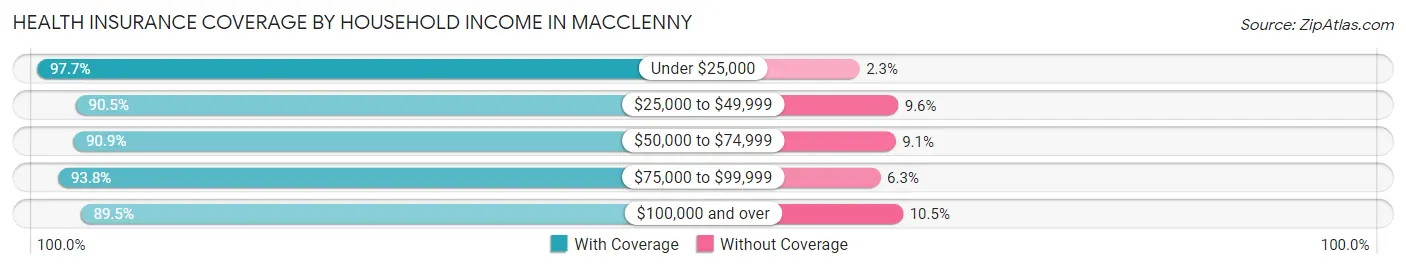
| Household Income | With Coverage | Without Coverage |
| Under $25,000 | 503 (97.7%) | 12 (2.3%) |
| $25,000 to $49,999 | 1,203 (90.4%) | 127 (9.6%) |
| $50,000 to $74,999 | 1,414 (90.9%) | 141 (9.1%) |
| $75,000 to $99,999 | 630 (93.8%) | 42 (6.2%) |
| $100,000 and over | 2,382 (89.5%) | 279 (10.5%) |
Public vs Private Health Insurance Coverage by Age in Macclenny
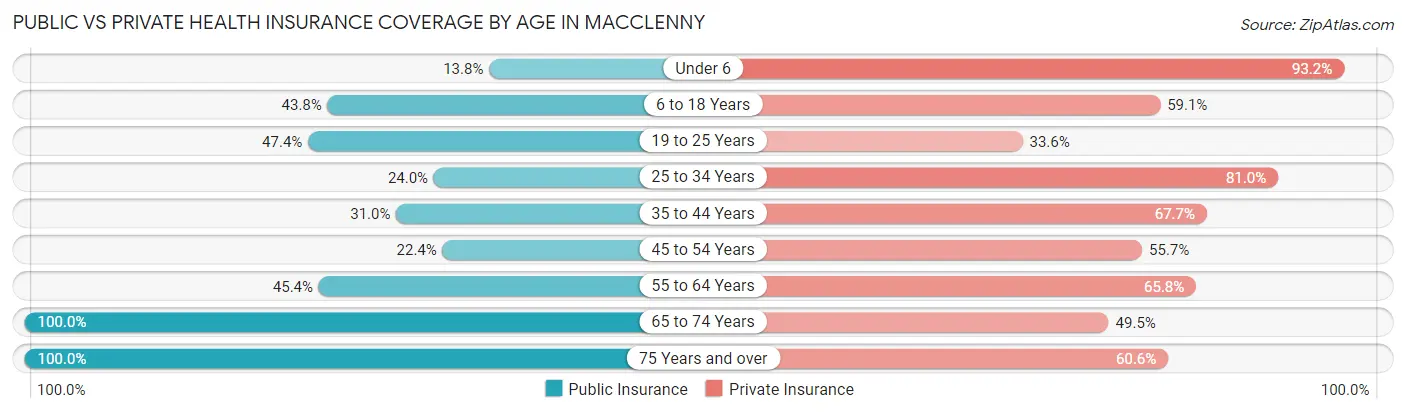
| Age Bracket | Public Insurance | Private Insurance |
| Under 6 | 75 (13.8%) | 508 (93.2%) |
| 6 to 18 Years | 536 (43.8%) | 724 (59.1%) |
| 19 to 25 Years | 432 (47.4%) | 306 (33.6%) |
| 25 to 34 Years | 154 (24.0%) | 519 (81.0%) |
| 35 to 44 Years | 222 (31.0%) | 485 (67.7%) |
| 45 to 54 Years | 240 (22.4%) | 597 (55.7%) |
| 55 to 64 Years | 334 (45.4%) | 484 (65.8%) |
| 65 to 74 Years | 527 (100.0%) | 261 (49.5%) |
| 75 Years and over | 360 (100.0%) | 218 (60.6%) |
| Total | 2,880 (42.8%) | 4,102 (60.9%) |
Disability Status by Sex by Age in Macclenny
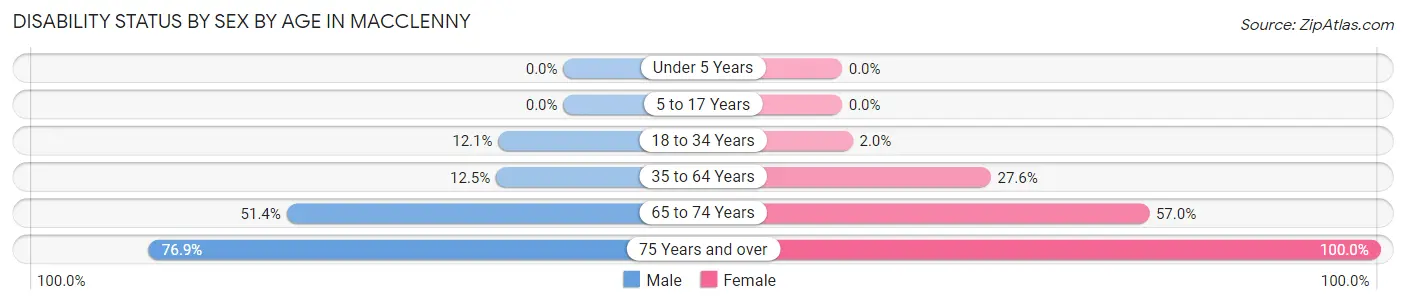
| Age Bracket | Male | Female |
| Under 5 Years | 0 (0.0%) | 0 (0.0%) |
| 5 to 17 Years | 0 (0.0%) | 0 (0.0%) |
| 18 to 34 Years | 94 (12.1%) | 17 (2.0%) |
| 35 to 64 Years | 158 (12.5%) | 347 (27.6%) |
| 65 to 74 Years | 150 (51.4%) | 134 (57.0%) |
| 75 Years and over | 80 (76.9%) | 256 (100.0%) |
Disability Class by Sex by Age in Macclenny
Disability Class: Hearing Difficulty
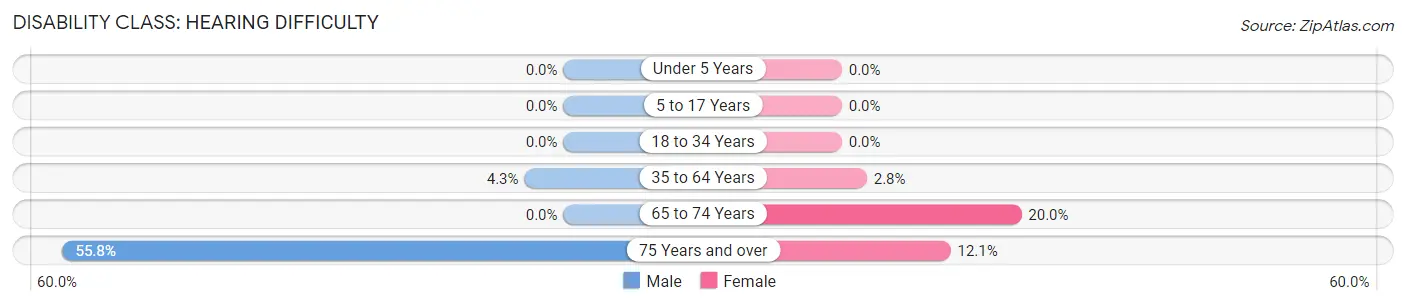
| Age Bracket | Male | Female |
| Under 5 Years | 0 (0.0%) | 0 (0.0%) |
| 5 to 17 Years | 0 (0.0%) | 0 (0.0%) |
| 18 to 34 Years | 0 (0.0%) | 0 (0.0%) |
| 35 to 64 Years | 55 (4.3%) | 35 (2.8%) |
| 65 to 74 Years | 0 (0.0%) | 47 (20.0%) |
| 75 Years and over | 58 (55.8%) | 31 (12.1%) |
Disability Class: Vision Difficulty
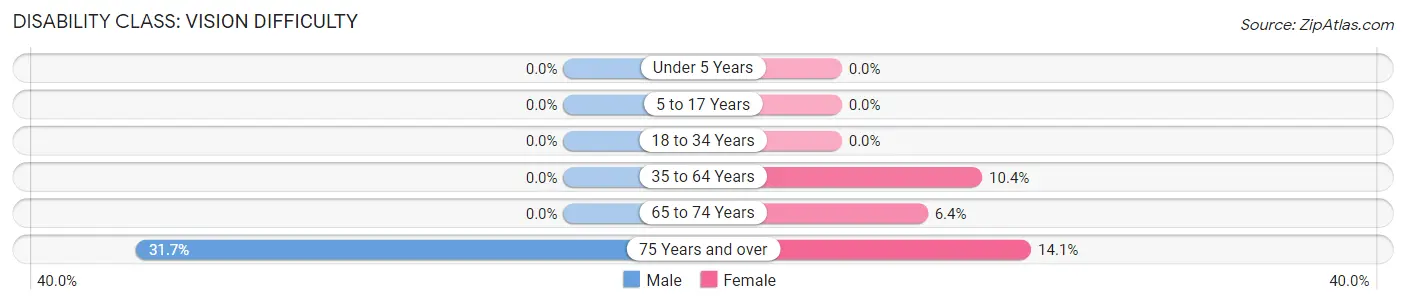
| Age Bracket | Male | Female |
| Under 5 Years | 0 (0.0%) | 0 (0.0%) |
| 5 to 17 Years | 0 (0.0%) | 0 (0.0%) |
| 18 to 34 Years | 0 (0.0%) | 0 (0.0%) |
| 35 to 64 Years | 0 (0.0%) | 131 (10.4%) |
| 65 to 74 Years | 0 (0.0%) | 15 (6.4%) |
| 75 Years and over | 33 (31.7%) | 36 (14.1%) |
Disability Class: Cognitive Difficulty
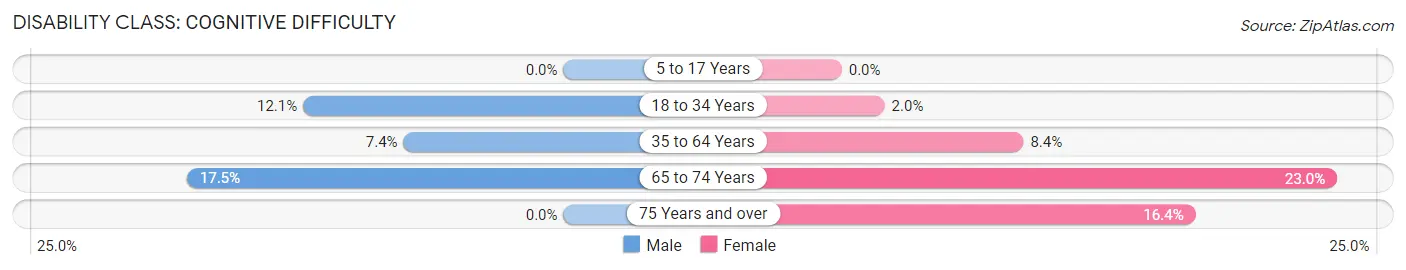
| Age Bracket | Male | Female |
| 5 to 17 Years | 0 (0.0%) | 0 (0.0%) |
| 18 to 34 Years | 94 (12.1%) | 17 (2.0%) |
| 35 to 64 Years | 94 (7.4%) | 106 (8.4%) |
| 65 to 74 Years | 51 (17.5%) | 54 (23.0%) |
| 75 Years and over | 0 (0.0%) | 42 (16.4%) |
Disability Class: Ambulatory Difficulty
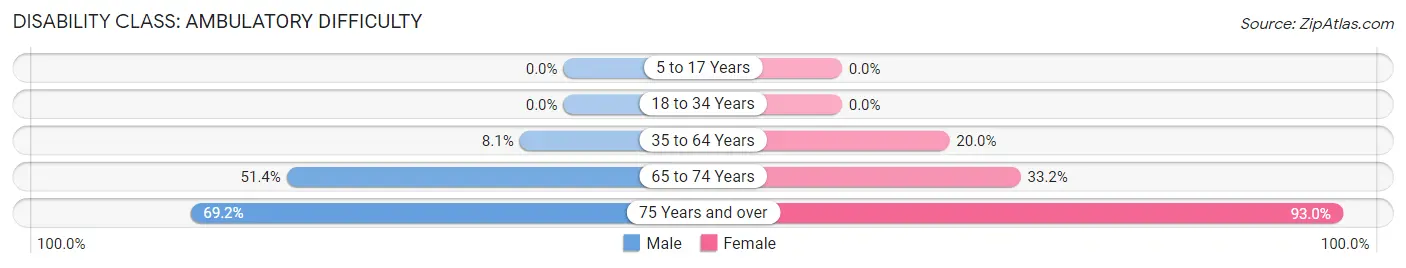
| Age Bracket | Male | Female |
| 5 to 17 Years | 0 (0.0%) | 0 (0.0%) |
| 18 to 34 Years | 0 (0.0%) | 0 (0.0%) |
| 35 to 64 Years | 103 (8.1%) | 251 (20.0%) |
| 65 to 74 Years | 150 (51.4%) | 78 (33.2%) |
| 75 Years and over | 72 (69.2%) | 238 (93.0%) |
Disability Class: Self-Care Difficulty
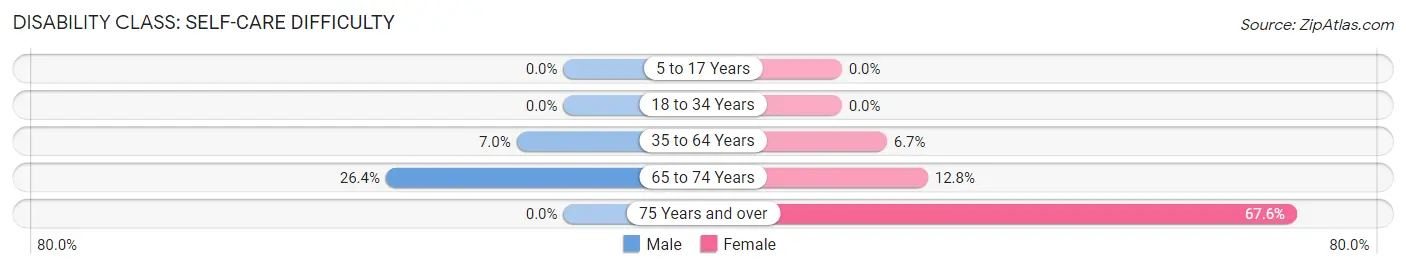
| Age Bracket | Male | Female |
| 5 to 17 Years | 0 (0.0%) | 0 (0.0%) |
| 18 to 34 Years | 0 (0.0%) | 0 (0.0%) |
| 35 to 64 Years | 88 (7.0%) | 84 (6.7%) |
| 65 to 74 Years | 77 (26.4%) | 30 (12.8%) |
| 75 Years and over | 0 (0.0%) | 173 (67.6%) |
Technology Access in Macclenny
Computing Device Access in Macclenny
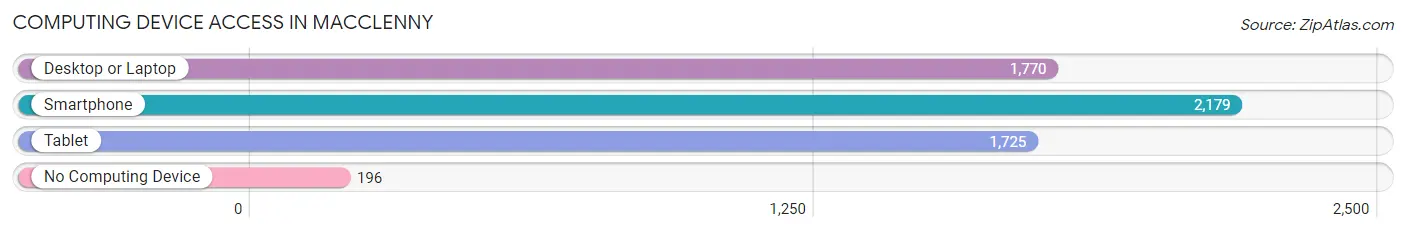
| Device Type | # Households | % Households |
| Desktop or Laptop | 1,770 | 73.2% |
| Smartphone | 2,179 | 90.1% |
| Tablet | 1,725 | 71.4% |
| No Computing Device | 196 | 8.1% |
| Total | 2,417 | 100.0% |
Internet Access in Macclenny
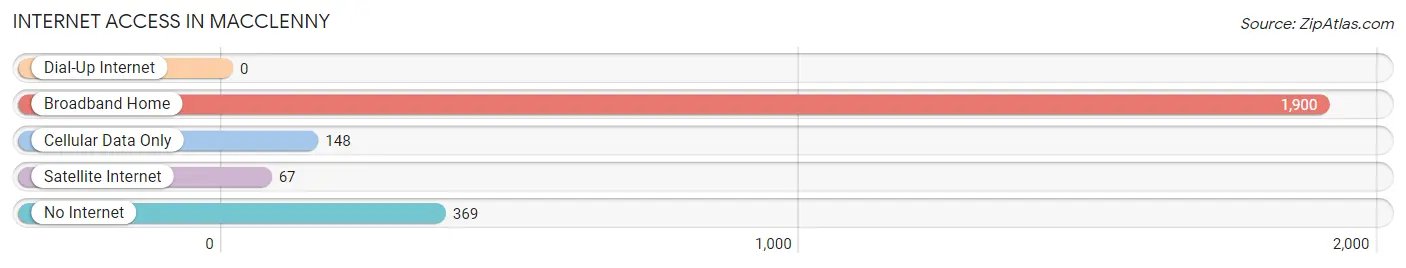
| Internet Type | # Households | % Households |
| Dial-Up Internet | 0 | 0.0% |
| Broadband Home | 1,900 | 78.6% |
| Cellular Data Only | 148 | 6.1% |
| Satellite Internet | 67 | 2.8% |
| No Internet | 369 | 15.3% |
| Total | 2,417 | 100.0% |
Macclenny Summary
Macclenny, Florida is a small town located in Baker County, in the northeastern part of the state. It is situated on the St. Marys River, about 25 miles west of Jacksonville. The town was founded in 1883 and was named after a local family, the Macclennys. The population of Macclenny was estimated to be 2,845 in 2020.
Geography
Macclenny is located in the northeastern part of Florida, in Baker County. It is situated on the St. Marys River, about 25 miles west of Jacksonville. The town is surrounded by forests and wetlands, and is home to a variety of wildlife. The climate in Macclenny is humid subtropical, with hot summers and mild winters.
Economy
Macclenny’s economy is largely based on agriculture and forestry. The town is home to several farms, as well as a number of timber companies. The town is also home to several small businesses, including restaurants, retail stores, and service providers.
Demographics
As of 2020, the population of Macclenny was estimated to be 2,845. The racial makeup of the town was 79.2% White, 16.2% African American, 0.7% Native American, 0.7% Asian, 0.1% Pacific Islander, and 2.1% from other races. The median household income in Macclenny was $37,941 in 2019.
History
Macclenny was founded in 1883 by a local family, the Macclennys. The town was originally a small farming community, but it grew rapidly in the early 20th century due to the timber industry. The town was incorporated in 1925, and the population continued to grow throughout the 20th century. In the late 20th century, Macclenny began to attract new businesses and industries, and the population continued to grow.
Today, Macclenny is a small town with a population of just over 2,800. The town is home to a variety of businesses and industries, and it is a popular destination for tourists and outdoor enthusiasts. Macclenny is also home to a number of historic sites, including the Macclenny Historic District, which is listed on the National Register of Historic Places.
Common Questions
What is Per Capita Income in Macclenny?
Per Capita income in Macclenny is $31,159.
What is the Median Family Income in Macclenny?
Median Family Income in Macclenny is $74,792.
What is the Median Household income in Macclenny?
Median Household Income in Macclenny is $62,134.
What is Income or Wage Gap in Macclenny?
Income or Wage Gap in Macclenny is 24.3%.
Women in Macclenny earn 75.7 cents for every dollar earned by a man.
What is Inequality or Gini Index in Macclenny?
Inequality or Gini Index in Macclenny is 0.45.
What is the Total Population of Macclenny?
Total Population of Macclenny is 7,354.
What is the Total Male Population of Macclenny?
Total Male Population of Macclenny is 3,711.
What is the Total Female Population of Macclenny?
Total Female Population of Macclenny is 3,643.
What is the Ratio of Males per 100 Females in Macclenny?
There are 101.87 Males per 100 Females in Macclenny.
What is the Ratio of Females per 100 Males in Macclenny?
There are 98.17 Females per 100 Males in Macclenny.
What is the Median Population Age in Macclenny?
Median Population Age in Macclenny is 37.5 Years.
What is the Average Family Size in Macclenny
Average Family Size in Macclenny is 3.3 People.
What is the Average Household Size in Macclenny
Average Household Size in Macclenny is 2.8 People.
How Large is the Labor Force in Macclenny?
There are 3,521 People in the Labor Forcein in Macclenny.
What is the Percentage of People in the Labor Force in Macclenny?
60.5% of People are in the Labor Force in Macclenny.
What is the Unemployment Rate in Macclenny?
Unemployment Rate in Macclenny is 4.2%.