Taft, FL Map & Demographics
Taft Map
Taft Overview
$21,939
PER CAPITA INCOME
$36,824
AVG FAMILY INCOME
$40,536
AVG HOUSEHOLD INCOME
57.1%
WAGE / INCOME GAP [ % ]
42.9¢/ $1
WAGE / INCOME GAP [ $ ]
0.36
INEQUALITY / GINI INDEX
1,604
TOTAL POPULATION
919
MALE POPULATION
685
FEMALE POPULATION
134.16
MALES / 100 FEMALES
74.54
FEMALES / 100 MALES
50.1
MEDIAN AGE
3.0
AVG FAMILY SIZE
2.5
AVG HOUSEHOLD SIZE
725
LABOR FORCE [ PEOPLE ]
54.6%
PERCENT IN LABOR FORCE
1.8%
UNEMPLOYMENT RATE
Income in Taft
Income Overview in Taft
Per Capita Income in Taft is $21,939, while median incomes of families and households are $36,824 and $40,536 respectively.
| Characteristic | Number | Measure |
| Per Capita Income | 1,604 | $21,939 |
| Median Family Income | 356 | $36,824 |
| Mean Family Income | 356 | $47,640 |
| Median Household Income | 644 | $40,536 |
| Mean Household Income | 644 | $51,207 |
| Income Deficit | 356 | $0 |
| Wage / Income Gap (%) | 1,604 | 57.05% |
| Wage / Income Gap ($) | 1,604 | 42.95¢ per $1 |
| Gini / Inequality Index | 1,604 | 0.36 |
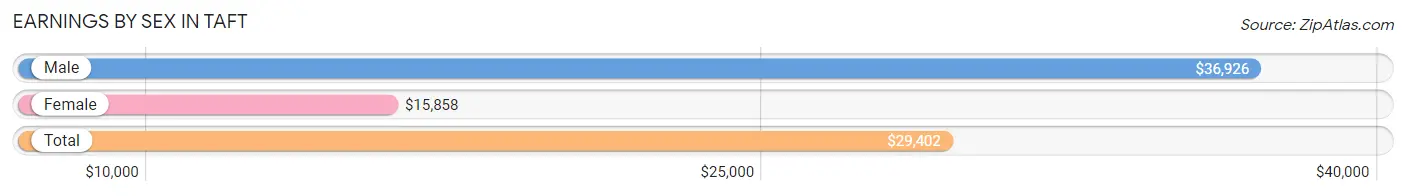
Earnings by Sex in Taft
Average Earnings in Taft are $29,402, $36,926 for men and $15,858 for women, a difference of 57.1%.
| Sex | Number | Average Earnings |
| Male | 467 (61.3%) | $36,926 |
| Female | 295 (38.7%) | $15,858 |
| Total | 762 (100.0%) | $29,402 |
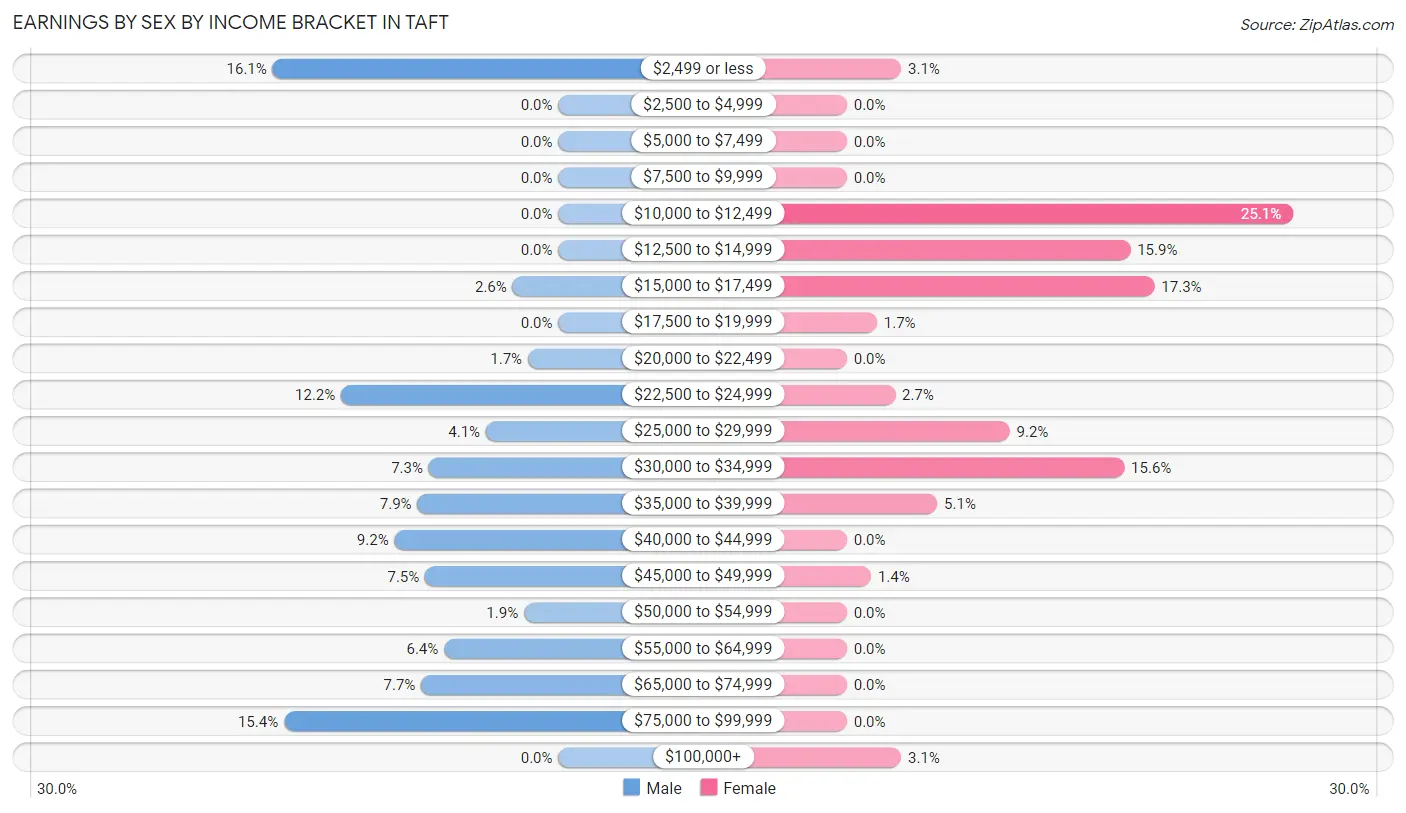
Earnings by Sex by Income Bracket in Taft
The most common earnings brackets in Taft are $2,499 or less for men (75 | 16.1%) and $10,000 to $12,499 for women (74 | 25.1%).
| Income | Male | Female |
| $2,499 or less | 75 (16.1%) | 9 (3.0%) |
| $2,500 to $4,999 | 0 (0.0%) | 0 (0.0%) |
| $5,000 to $7,499 | 0 (0.0%) | 0 (0.0%) |
| $7,500 to $9,999 | 0 (0.0%) | 0 (0.0%) |
| $10,000 to $12,499 | 0 (0.0%) | 74 (25.1%) |
| $12,500 to $14,999 | 0 (0.0%) | 47 (15.9%) |
| $15,000 to $17,499 | 12 (2.6%) | 51 (17.3%) |
| $17,500 to $19,999 | 0 (0.0%) | 5 (1.7%) |
| $20,000 to $22,499 | 8 (1.7%) | 0 (0.0%) |
| $22,500 to $24,999 | 57 (12.2%) | 8 (2.7%) |
| $25,000 to $29,999 | 19 (4.1%) | 27 (9.1%) |
| $30,000 to $34,999 | 34 (7.3%) | 46 (15.6%) |
| $35,000 to $39,999 | 37 (7.9%) | 15 (5.1%) |
| $40,000 to $44,999 | 43 (9.2%) | 0 (0.0%) |
| $45,000 to $49,999 | 35 (7.5%) | 4 (1.4%) |
| $50,000 to $54,999 | 9 (1.9%) | 0 (0.0%) |
| $55,000 to $64,999 | 30 (6.4%) | 0 (0.0%) |
| $65,000 to $74,999 | 36 (7.7%) | 0 (0.0%) |
| $75,000 to $99,999 | 72 (15.4%) | 0 (0.0%) |
| $100,000+ | 0 (0.0%) | 9 (3.0%) |
| Total | 467 (100.0%) | 295 (100.0%) |
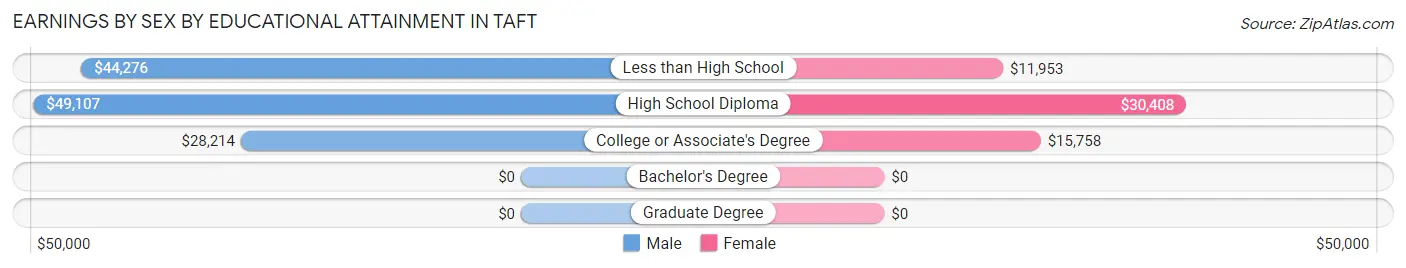
Earnings by Sex by Educational Attainment in Taft
Average earnings in Taft are $37,162 for men and $17,059 for women, a difference of 54.1%. Men with an educational attainment of high school diploma enjoy the highest average annual earnings of $49,107, while those with college or associate's degree education earn the least with $28,214. Women with an educational attainment of high school diploma earn the most with the average annual earnings of $30,408, while those with less than high school education have the smallest earnings of $11,953.
| Educational Attainment | Male Income | Female Income |
| Less than High School | $44,276 | $11,953 |
| High School Diploma | $49,107 | $30,408 |
| College or Associate's Degree | $28,214 | $15,758 |
| Bachelor's Degree | - | - |
| Graduate Degree | - | - |
| Total | $37,162 | $17,059 |
Family Income in Taft
Family Income Brackets in Taft
According to the Taft family income data, there are 91 families falling into the $35,000 to $49,999 income range, which is the most common income bracket and makes up 25.6% of all families.
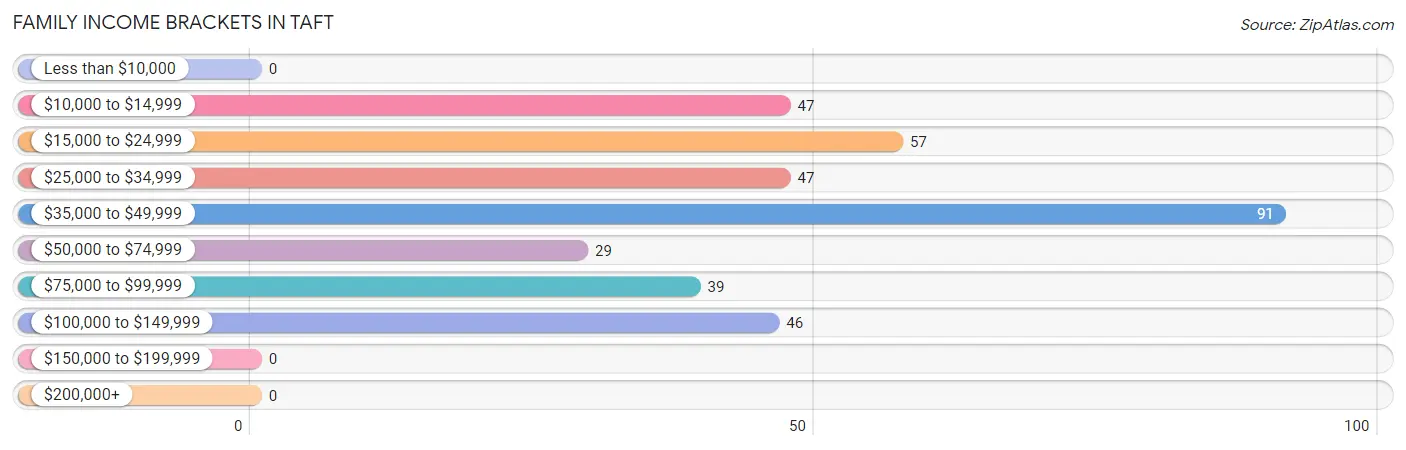
| Income Bracket | # Families | % Families |
| Less than $10,000 | 0 | 0.0% |
| $10,000 to $14,999 | 47 | 13.2% |
| $15,000 to $24,999 | 57 | 16.0% |
| $25,000 to $34,999 | 47 | 13.2% |
| $35,000 to $49,999 | 91 | 25.6% |
| $50,000 to $74,999 | 29 | 8.1% |
| $75,000 to $99,999 | 39 | 11.0% |
| $100,000 to $149,999 | 46 | 12.9% |
| $150,000 to $199,999 | 0 | 0.0% |
| $200,000+ | 0 | 0.0% |
Family Income by Famaliy Size in Taft
3-person families (57 | 16.0%) account for the highest median family income in Taft with $48,906 per family, while 3-person families (57 | 16.0%) have the highest median income of $16,302 per family member.
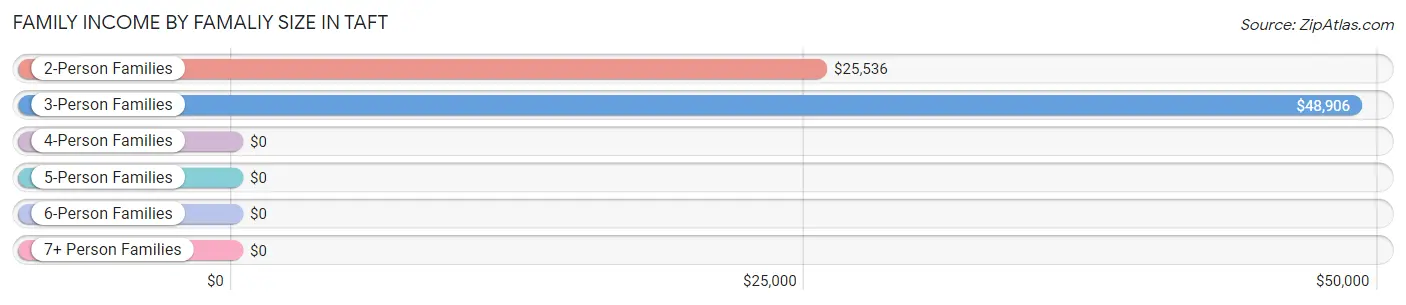
| Income Bracket | # Families | Median Income |
| 2-Person Families | 199 (55.9%) | $25,536 |
| 3-Person Families | 57 (16.0%) | $48,906 |
| 4-Person Families | 87 (24.4%) | $0 |
| 5-Person Families | 0 (0.0%) | $0 |
| 6-Person Families | 13 (3.6%) | $0 |
| 7+ Person Families | 0 (0.0%) | $0 |
| Total | 356 (100.0%) | $36,824 |
Family Income by Number of Earners in Taft
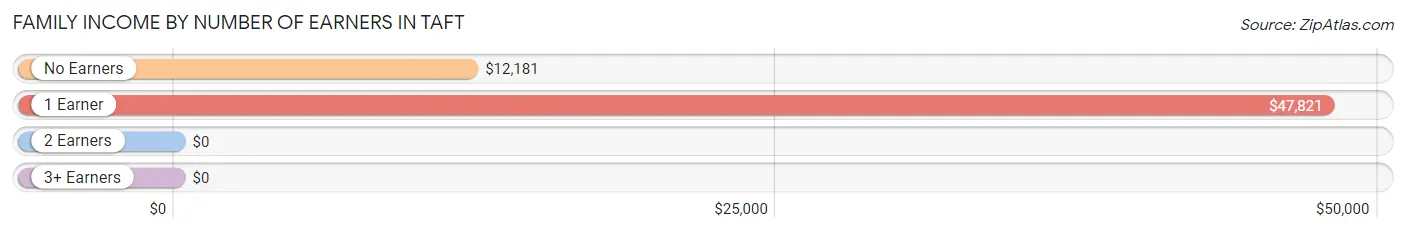
| Number of Earners | # Families | Median Income |
| No Earners | 82 (23.0%) | $12,181 |
| 1 Earner | 159 (44.7%) | $47,821 |
| 2 Earners | 102 (28.6%) | $0 |
| 3+ Earners | 13 (3.6%) | $0 |
| Total | 356 (100.0%) | $36,824 |
Household Income in Taft
Household Income Brackets in Taft
With 150 households falling in the category, the $35,000 to $49,999 income range is the most frequent in Taft, accounting for 23.3% of all households.
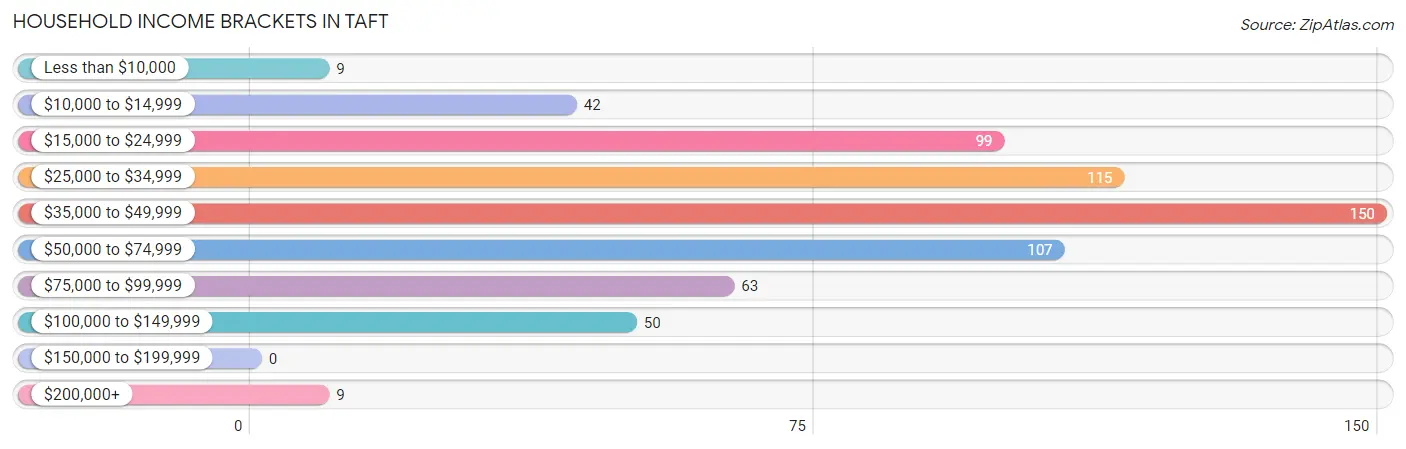
| Income Bracket | # Households | % Households |
| Less than $10,000 | 9 | 1.4% |
| $10,000 to $14,999 | 42 | 6.5% |
| $15,000 to $24,999 | 99 | 15.4% |
| $25,000 to $34,999 | 115 | 17.9% |
| $35,000 to $49,999 | 150 | 23.3% |
| $50,000 to $74,999 | 107 | 16.6% |
| $75,000 to $99,999 | 63 | 9.8% |
| $100,000 to $149,999 | 50 | 7.8% |
| $150,000 to $199,999 | 0 | 0.0% |
| $200,000+ | 9 | 1.4% |
Household Income by Householder Age in Taft
The median household income in Taft is $40,536, with the highest median household income of $49,477 found in the 25 to 44 years age bracket for the primary householder. A total of 194 households (30.1%) fall into this category.
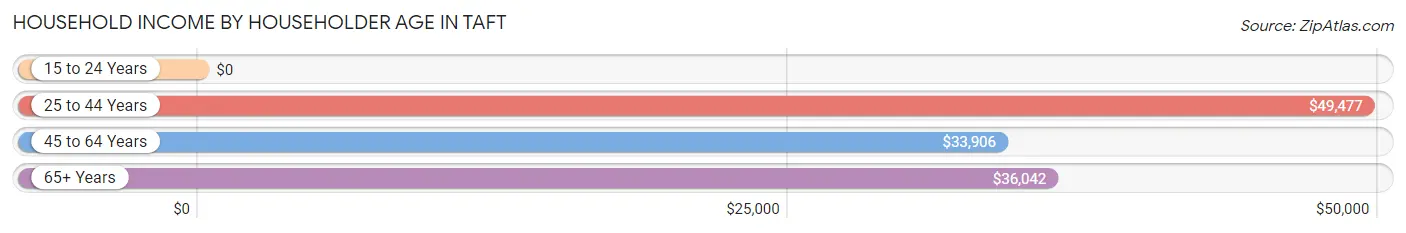
| Income Bracket | # Households | Median Income |
| 15 to 24 Years | 0 (0.0%) | $0 |
| 25 to 44 Years | 194 (30.1%) | $49,477 |
| 45 to 64 Years | 255 (39.6%) | $33,906 |
| 65+ Years | 195 (30.3%) | $36,042 |
| Total | 644 (100.0%) | $40,536 |
Poverty in Taft
Income Below Poverty by Sex and Age in Taft
With 13.7% poverty level for males and 16.2% for females among the residents of Taft, 18 to 24 year old males and 35 to 44 year old females are the most vulnerable to poverty, with 7 males (100.0%) and 31 females (28.2%) in their respective age groups living below the poverty level.
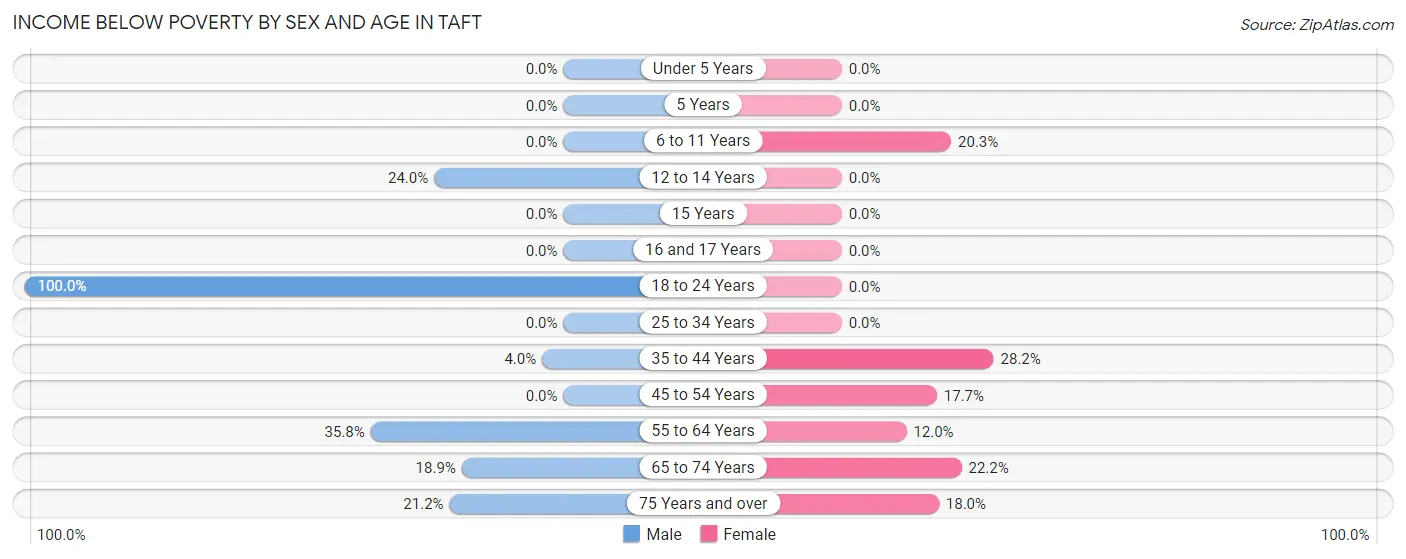
| Age Bracket | Male | Female |
| Under 5 Years | 0 (0.0%) | 0 (0.0%) |
| 5 Years | 0 (0.0%) | 0 (0.0%) |
| 6 to 11 Years | 0 (0.0%) | 14 (20.3%) |
| 12 to 14 Years | 6 (24.0%) | 0 (0.0%) |
| 15 Years | 0 (0.0%) | 0 (0.0%) |
| 16 and 17 Years | 0 (0.0%) | 0 (0.0%) |
| 18 to 24 Years | 7 (100.0%) | 0 (0.0%) |
| 25 to 34 Years | 0 (0.0%) | 0 (0.0%) |
| 35 to 44 Years | 7 (4.0%) | 31 (28.2%) |
| 45 to 54 Years | 0 (0.0%) | 15 (17.6%) |
| 55 to 64 Years | 68 (35.8%) | 15 (12.0%) |
| 65 to 74 Years | 27 (18.9%) | 16 (22.2%) |
| 75 Years and over | 11 (21.1%) | 20 (18.0%) |
| Total | 126 (13.7%) | 111 (16.2%) |
Income Above Poverty by Sex and Age in Taft
According to the poverty statistics in Taft, males aged under 5 years and females aged 12 to 14 years are the age groups that are most secure financially, with 100.0% of males and 100.0% of females in these age groups living above the poverty line.
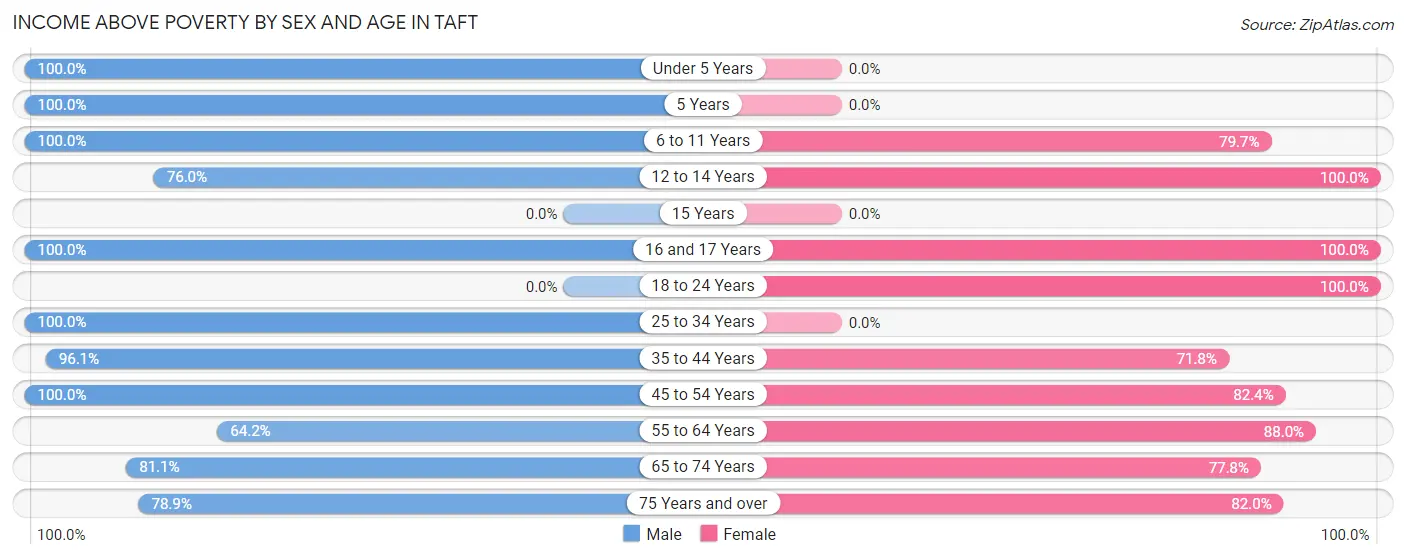
| Age Bracket | Male | Female |
| Under 5 Years | 8 (100.0%) | 0 (0.0%) |
| 5 Years | 60 (100.0%) | 0 (0.0%) |
| 6 to 11 Years | 74 (100.0%) | 55 (79.7%) |
| 12 to 14 Years | 19 (76.0%) | 41 (100.0%) |
| 15 Years | 0 (0.0%) | 0 (0.0%) |
| 16 and 17 Years | 34 (100.0%) | 23 (100.0%) |
| 18 to 24 Years | 0 (0.0%) | 49 (100.0%) |
| 25 to 34 Years | 99 (100.0%) | 0 (0.0%) |
| 35 to 44 Years | 170 (96.1%) | 79 (71.8%) |
| 45 to 54 Years | 50 (100.0%) | 70 (82.4%) |
| 55 to 64 Years | 122 (64.2%) | 110 (88.0%) |
| 65 to 74 Years | 116 (81.1%) | 56 (77.8%) |
| 75 Years and over | 41 (78.8%) | 91 (82.0%) |
| Total | 793 (86.3%) | 574 (83.8%) |
Income Below Poverty Among Married-Couple Families in Taft
The poverty statistics for married-couple families in Taft show that 10.7% or 14 of the total 131 families live below the poverty line. Families with no children have the highest poverty rate of 24.1%, comprising of 14 families. On the other hand, families with 1 or 2 children have the lowest poverty rate of 0.0%, which includes 0 families.
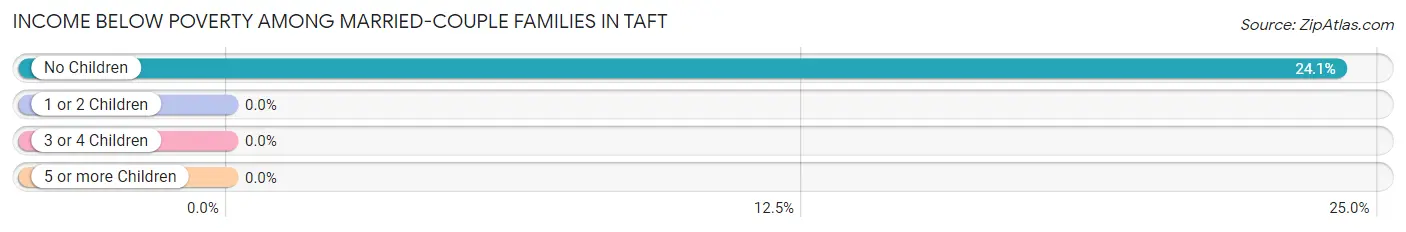
| Children | Above Poverty | Below Poverty |
| No Children | 44 (75.9%) | 14 (24.1%) |
| 1 or 2 Children | 73 (100.0%) | 0 (0.0%) |
| 3 or 4 Children | 0 (0.0%) | 0 (0.0%) |
| 5 or more Children | 0 (0.0%) | 0 (0.0%) |
| Total | 117 (89.3%) | 14 (10.7%) |
Income Below Poverty Among Single-Parent Households in Taft
According to the poverty data in Taft, 26.0% or 41 single-father households and 9.0% or 6 single-mother households are living below the poverty line. Among single-father households, those with no children have the highest poverty rate, with 41 households (38.7%) experiencing poverty. Likewise, among single-mother households, those with 3 or 4 children have the highest poverty rate, with 6 households (100.0%) falling below the poverty line.
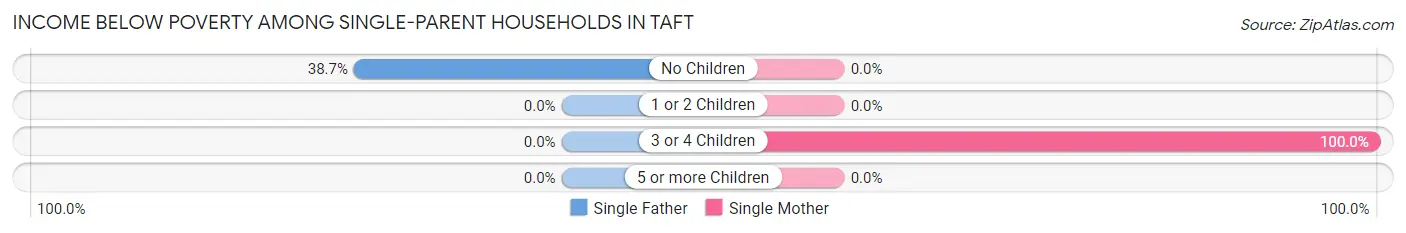
| Children | Single Father | Single Mother |
| No Children | 41 (38.7%) | 0 (0.0%) |
| 1 or 2 Children | 0 (0.0%) | 0 (0.0%) |
| 3 or 4 Children | 0 (0.0%) | 6 (100.0%) |
| 5 or more Children | 0 (0.0%) | 0 (0.0%) |
| Total | 41 (26.0%) | 6 (9.0%) |
Income Below Poverty Among Married-Couple vs Single-Parent Households in Taft
The poverty data for Taft shows that 14 of the married-couple family households (10.7%) and 47 of the single-parent households (20.9%) are living below the poverty level. Within the married-couple family households, those with no children have the highest poverty rate, with 14 households (24.1%) falling below the poverty line. Among the single-parent households, those with no children have the highest poverty rate, with 41 household (26.6%) living below poverty.
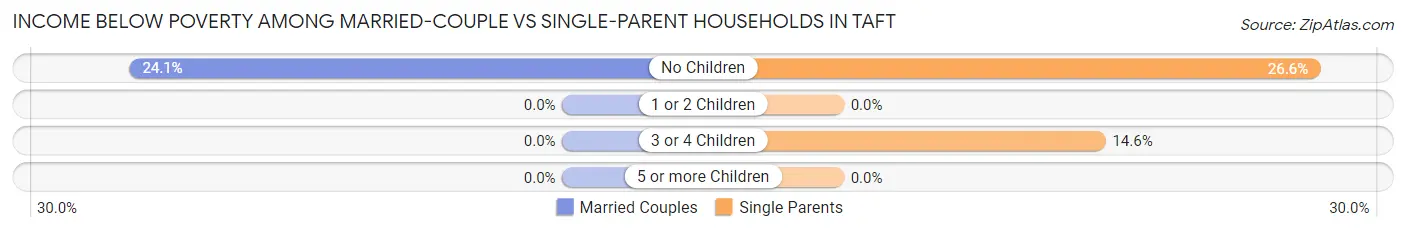
| Children | Married-Couple Families | Single-Parent Households |
| No Children | 14 (24.1%) | 41 (26.6%) |
| 1 or 2 Children | 0 (0.0%) | 0 (0.0%) |
| 3 or 4 Children | 0 (0.0%) | 6 (14.6%) |
| 5 or more Children | 0 (0.0%) | 0 (0.0%) |
| Total | 14 (10.7%) | 47 (20.9%) |
Race in Taft
The most populous races in Taft are Hispanic or Latino (868 | 54.1%), White / Caucasian (719 | 44.8%), and Two or more Races (376 | 23.4%).
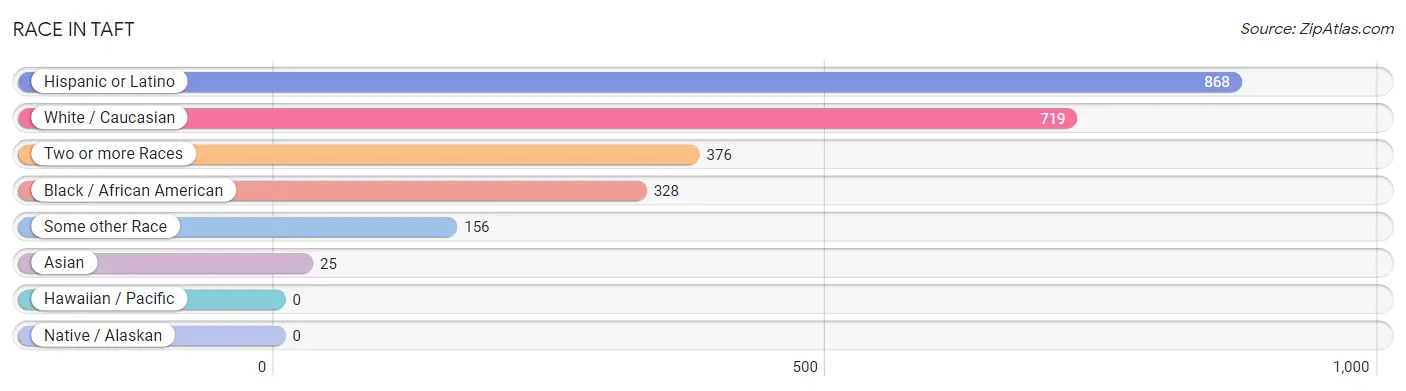
| Race | # Population | % Population |
| Asian | 25 | 1.6% |
| Black / African American | 328 | 20.4% |
| Hawaiian / Pacific | 0 | 0.0% |
| Hispanic or Latino | 868 | 54.1% |
| Native / Alaskan | 0 | 0.0% |
| White / Caucasian | 719 | 44.8% |
| Two or more Races | 376 | 23.4% |
| Some other Race | 156 | 9.7% |
| Total | 1,604 | 100.0% |
Ancestry in Taft
The most populous ancestries reported in Taft are Puerto Rican (426 | 26.6%), Haitian (166 | 10.3%), American (164 | 10.2%), Mexican (162 | 10.1%), and Central American (122 | 7.6%), together accounting for 64.8% of all Taft residents.
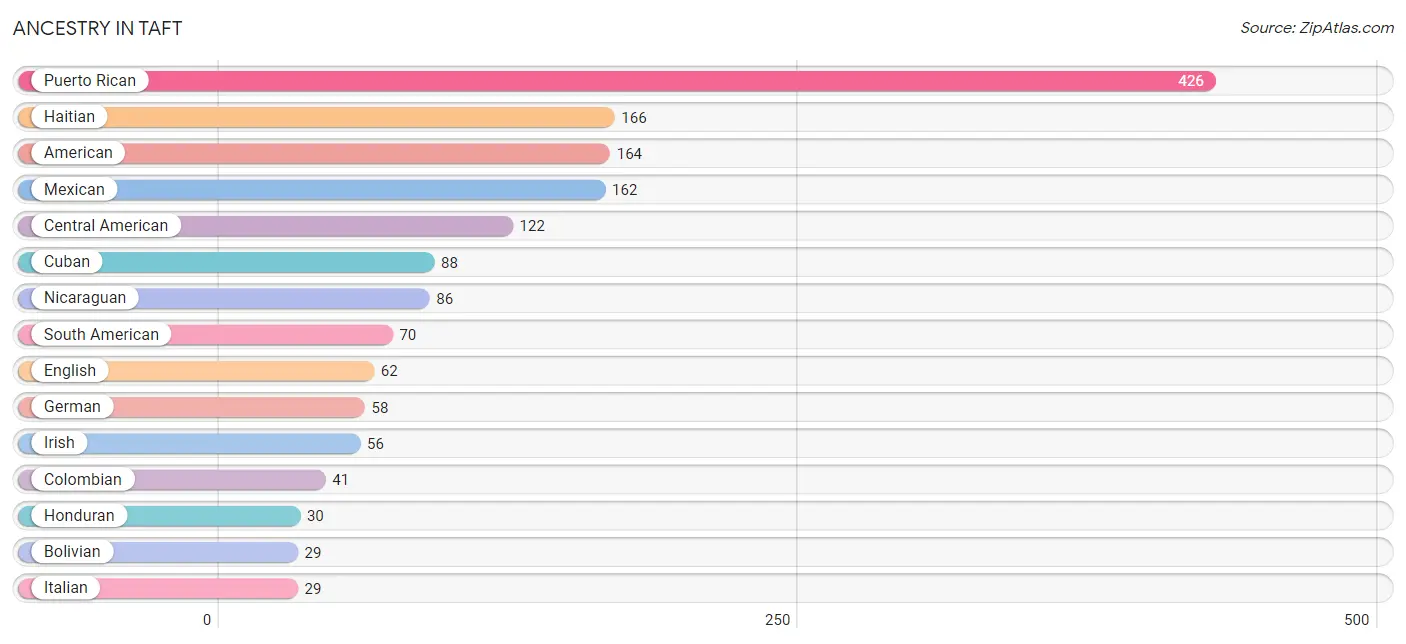
| Ancestry | # Population | % Population |
| American | 164 | 10.2% |
| Arab | 10 | 0.6% |
| Bolivian | 29 | 1.8% |
| Brazilian | 9 | 0.6% |
| British | 14 | 0.9% |
| Central American | 122 | 7.6% |
| Colombian | 41 | 2.6% |
| Cuban | 88 | 5.5% |
| Dutch | 7 | 0.4% |
| English | 62 | 3.9% |
| German | 58 | 3.6% |
| Haitian | 166 | 10.3% |
| Honduran | 30 | 1.9% |
| Irish | 56 | 3.5% |
| Italian | 29 | 1.8% |
| Lebanese | 10 | 0.6% |
| Mexican | 162 | 10.1% |
| Nicaraguan | 86 | 5.4% |
| Pennsylvania German | 6 | 0.4% |
| Puerto Rican | 426 | 26.6% |
| Salvadoran | 6 | 0.4% |
| Scotch-Irish | 19 | 1.2% |
| Scottish | 6 | 0.4% |
| Serbian | 14 | 0.9% |
| South American | 70 | 4.4% |
| Sri Lankan | 25 | 1.6% | View All 26 Rows |
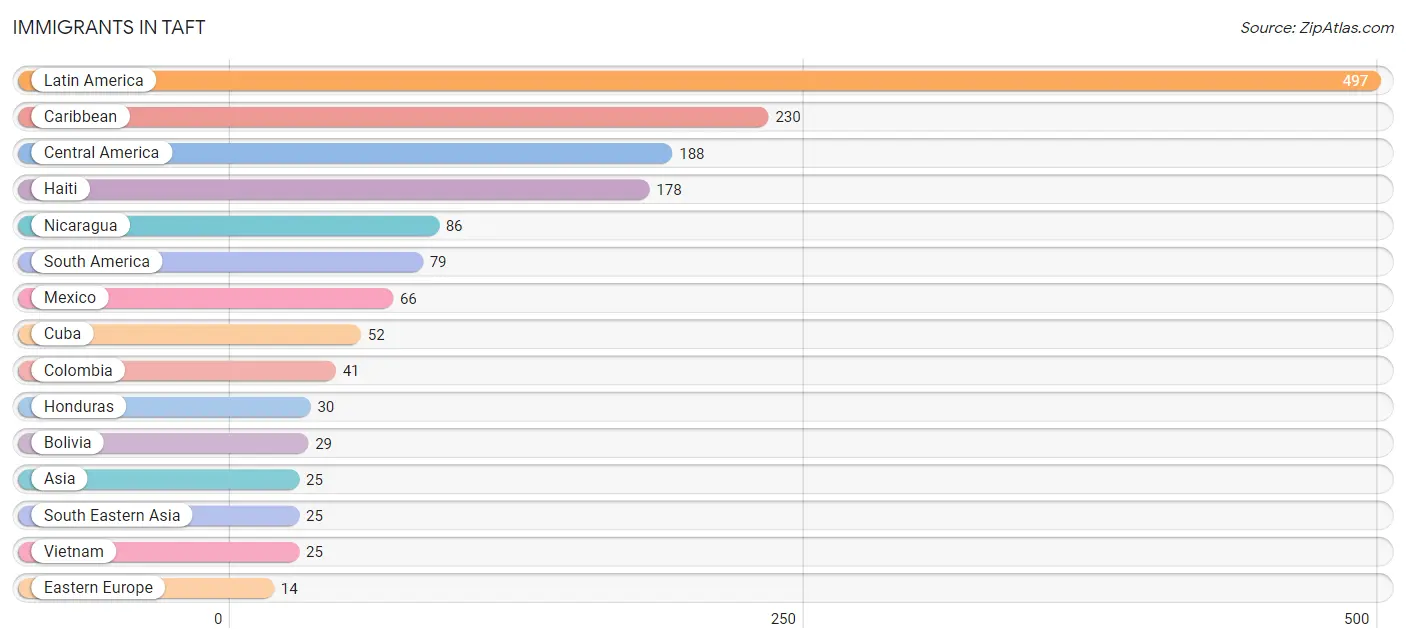
Immigrants in Taft
The most numerous immigrant groups reported in Taft came from Latin America (497 | 31.0%), Caribbean (230 | 14.3%), Central America (188 | 11.7%), Haiti (178 | 11.1%), and Nicaragua (86 | 5.4%), together accounting for 73.5% of all Taft residents.
| Immigration Origin | # Population | % Population |
| Asia | 25 | 1.6% |
| Bolivia | 29 | 1.8% |
| Brazil | 9 | 0.6% |
| Caribbean | 230 | 14.3% |
| Central America | 188 | 11.7% |
| Colombia | 41 | 2.6% |
| Cuba | 52 | 3.2% |
| Eastern Europe | 14 | 0.9% |
| El Salvador | 6 | 0.4% |
| Europe | 14 | 0.9% |
| Haiti | 178 | 11.1% |
| Honduras | 30 | 1.9% |
| Latin America | 497 | 31.0% |
| Mexico | 66 | 4.1% |
| Nicaragua | 86 | 5.4% |
| Serbia | 14 | 0.9% |
| South America | 79 | 4.9% |
| South Eastern Asia | 25 | 1.6% |
| Vietnam | 25 | 1.6% | View All 19 Rows |
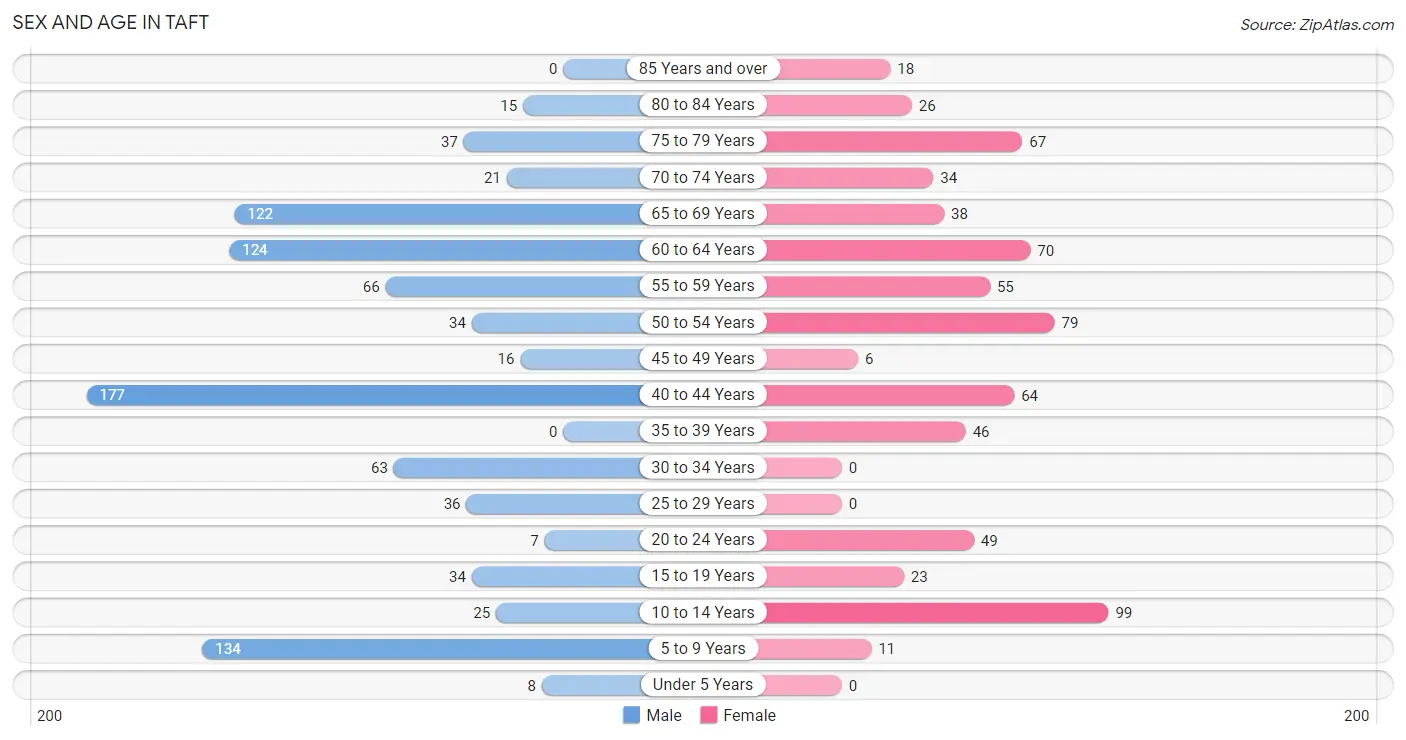
Sex and Age in Taft
Sex and Age in Taft
The most populous age groups in Taft are 40 to 44 Years (177 | 19.3%) for men and 10 to 14 Years (99 | 14.4%) for women.
| Age Bracket | Male | Female |
| Under 5 Years | 8 (0.9%) | 0 (0.0%) |
| 5 to 9 Years | 134 (14.6%) | 11 (1.6%) |
| 10 to 14 Years | 25 (2.7%) | 99 (14.4%) |
| 15 to 19 Years | 34 (3.7%) | 23 (3.4%) |
| 20 to 24 Years | 7 (0.8%) | 49 (7.1%) |
| 25 to 29 Years | 36 (3.9%) | 0 (0.0%) |
| 30 to 34 Years | 63 (6.9%) | 0 (0.0%) |
| 35 to 39 Years | 0 (0.0%) | 46 (6.7%) |
| 40 to 44 Years | 177 (19.3%) | 64 (9.3%) |
| 45 to 49 Years | 16 (1.7%) | 6 (0.9%) |
| 50 to 54 Years | 34 (3.7%) | 79 (11.5%) |
| 55 to 59 Years | 66 (7.2%) | 55 (8.0%) |
| 60 to 64 Years | 124 (13.5%) | 70 (10.2%) |
| 65 to 69 Years | 122 (13.3%) | 38 (5.6%) |
| 70 to 74 Years | 21 (2.3%) | 34 (5.0%) |
| 75 to 79 Years | 37 (4.0%) | 67 (9.8%) |
| 80 to 84 Years | 15 (1.6%) | 26 (3.8%) |
| 85 Years and over | 0 (0.0%) | 18 (2.6%) |
| Total | 919 (100.0%) | 685 (100.0%) |
Families and Households in Taft
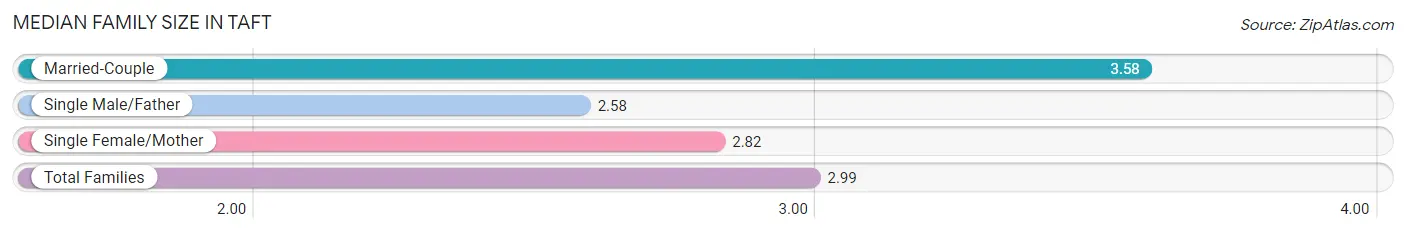
Median Family Size in Taft
The median family size in Taft is 2.99 persons per family, with married-couple families (131 | 36.8%) accounting for the largest median family size of 3.58 persons per family. On the other hand, single male/father families (158 | 44.4%) represent the smallest median family size with 2.58 persons per family.
| Family Type | # Families | Family Size |
| Married-Couple | 131 (36.8%) | 3.58 |
| Single Male/Father | 158 (44.4%) | 2.58 |
| Single Female/Mother | 67 (18.8%) | 2.82 |
| Total Families | 356 (100.0%) | 2.99 |
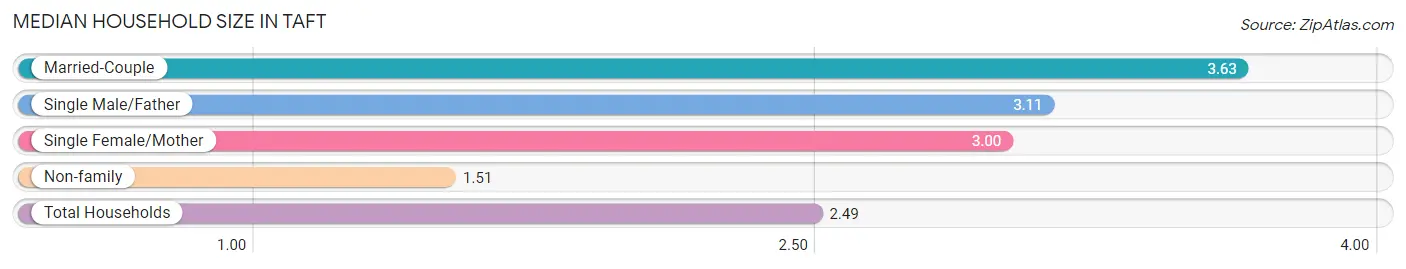
Median Household Size in Taft
The median household size in Taft is 2.49 persons per household, with married-couple households (131 | 20.3%) accounting for the largest median household size of 3.63 persons per household. non-family households (288 | 44.7%) represent the smallest median household size with 1.51 persons per household.
| Household Type | # Households | Household Size |
| Married-Couple | 131 (20.3%) | 3.63 |
| Single Male/Father | 158 (24.5%) | 3.11 |
| Single Female/Mother | 67 (10.4%) | 3.00 |
| Non-family | 288 (44.7%) | 1.51 |
| Total Households | 644 (100.0%) | 2.49 |
Household Size by Marriage Status in Taft
Out of a total of 644 households in Taft, 356 (55.3%) are family households, while 288 (44.7%) are nonfamily households. The most numerous type of family households are 2-person households, comprising 158, and the most common type of nonfamily households are 1-person households, comprising 205.
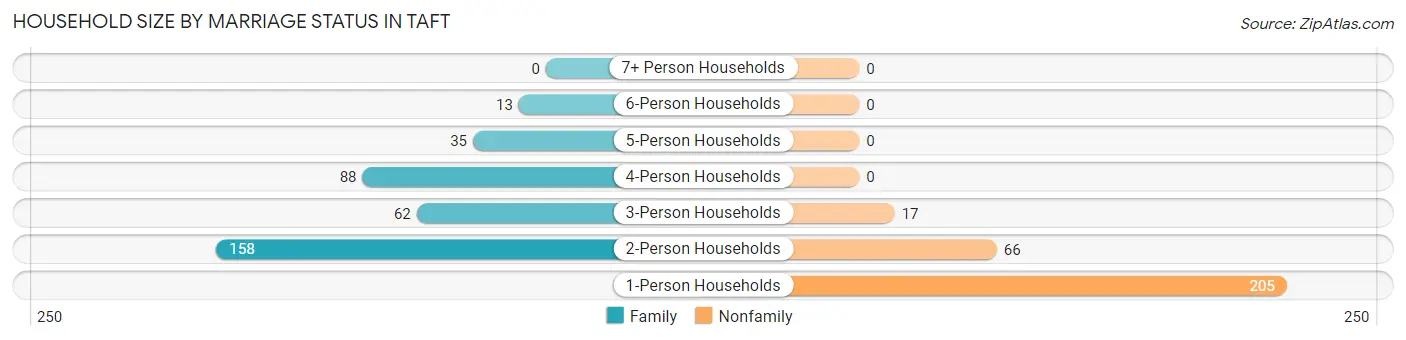
| Household Size | Family Households | Nonfamily Households |
| 1-Person Households | - | 205 (31.8%) |
| 2-Person Households | 158 (24.5%) | 66 (10.2%) |
| 3-Person Households | 62 (9.6%) | 17 (2.6%) |
| 4-Person Households | 88 (13.7%) | 0 (0.0%) |
| 5-Person Households | 35 (5.4%) | 0 (0.0%) |
| 6-Person Households | 13 (2.0%) | 0 (0.0%) |
| 7+ Person Households | 0 (0.0%) | 0 (0.0%) |
| Total | 356 (55.3%) | 288 (44.7%) |
Female Fertility in Taft
Fertility by Age in Taft
Average fertility rate in Taft is 138.0 births per 1,000 women. Women in the age bracket of 35 to 50 years have the highest fertility rate with 203.0 births per 1,000 women. Women in the age bracket of 35 to 50 years acount for 100.0% of all women with births.
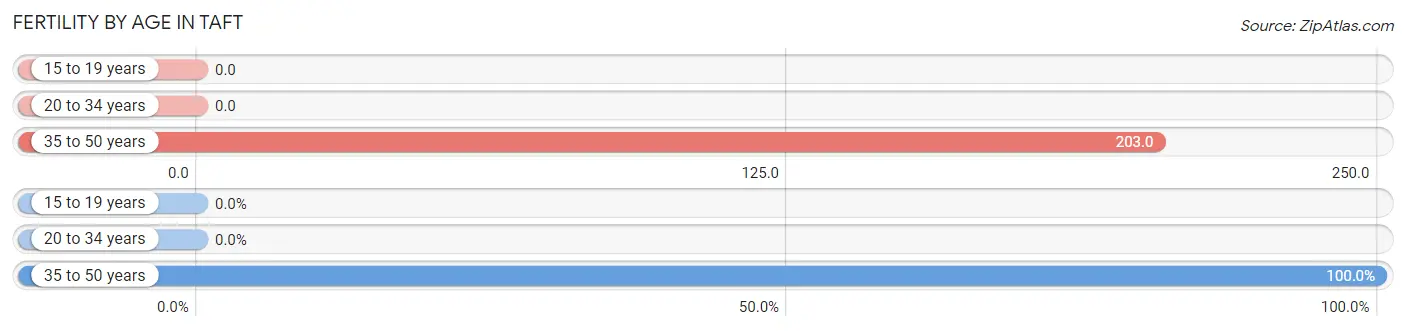
| Age Bracket | Women with Births | Births / 1,000 Women |
| 15 to 19 years | 0 (0.0%) | 0.0 |
| 20 to 34 years | 0 (0.0%) | 0.0 |
| 35 to 50 years | 31 (100.0%) | 203.0 |
| Total | 31 (100.0%) | 138.0 |
Fertility by Age by Marriage Status in Taft
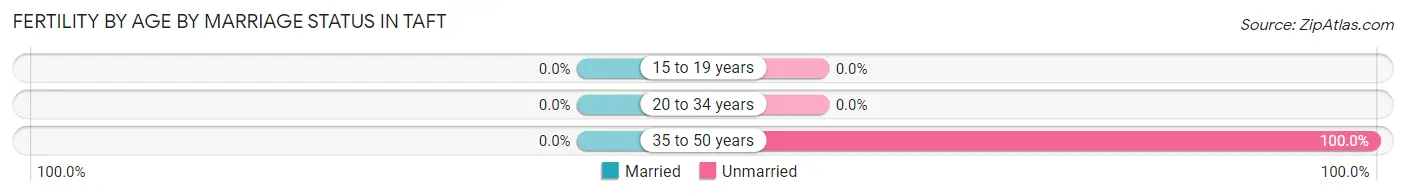
| Age Bracket | Married | Unmarried |
| 15 to 19 years | 0 (0.0%) | 0 (0.0%) |
| 20 to 34 years | 0 (0.0%) | 0 (0.0%) |
| 35 to 50 years | 0 (0.0%) | 31 (100.0%) |
| Total | 0 (0.0%) | 31 (100.0%) |
Fertility by Education in Taft
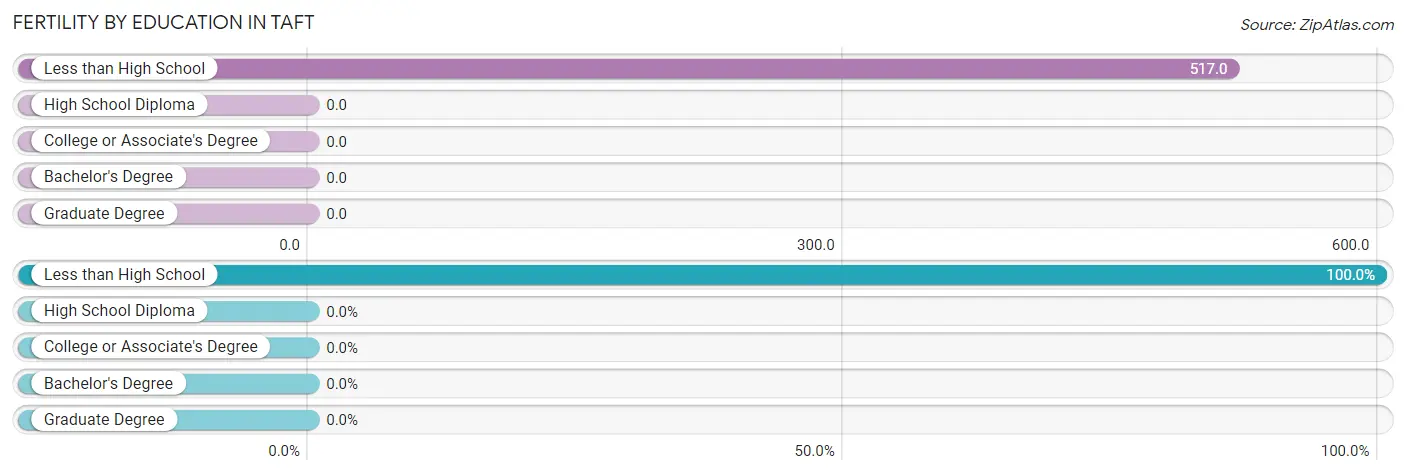
| Educational Attainment | Women with Births | Births / 1,000 Women |
| Less than High School | 31 (100.0%) | 517.0 |
| High School Diploma | 0 (0.0%) | 0.0 |
| College or Associate's Degree | 0 (0.0%) | 0.0 |
| Bachelor's Degree | 0 (0.0%) | 0.0 |
| Graduate Degree | 0 (0.0%) | 0.0 |
| Total | 31 (100.0%) | 138.0 |
Fertility by Education by Marriage Status in Taft
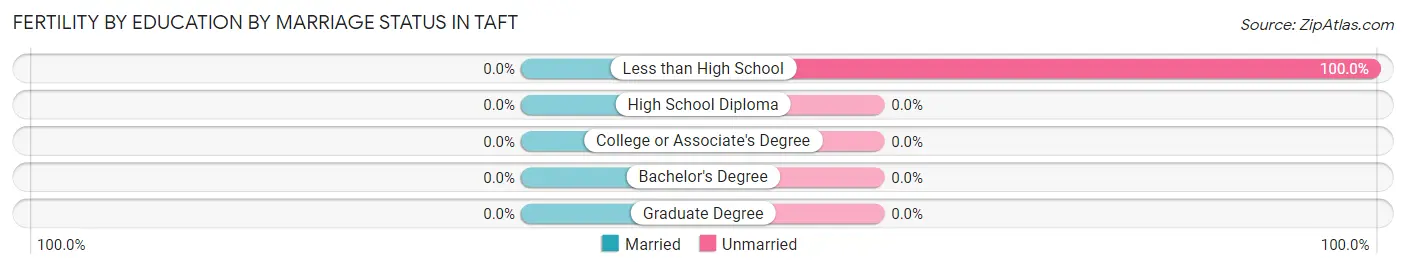
| Educational Attainment | Married | Unmarried |
| Less than High School | 0 (0.0%) | 31 (100.0%) |
| High School Diploma | 0 (0.0%) | 0 (0.0%) |
| College or Associate's Degree | 0 (0.0%) | 0 (0.0%) |
| Bachelor's Degree | 0 (0.0%) | 0 (0.0%) |
| Graduate Degree | 0 (0.0%) | 0 (0.0%) |
| Total | 0 (0.0%) | 31 (100.0%) |
Employment Characteristics in Taft
Employment by Class of Employer in Taft
Among the 694 employed individuals in Taft, private company employees (476 | 68.6%), not-for-profit organizations (114 | 16.4%), and self-employed (not incorporated) (50 | 7.2%) make up the most common classes of employment.
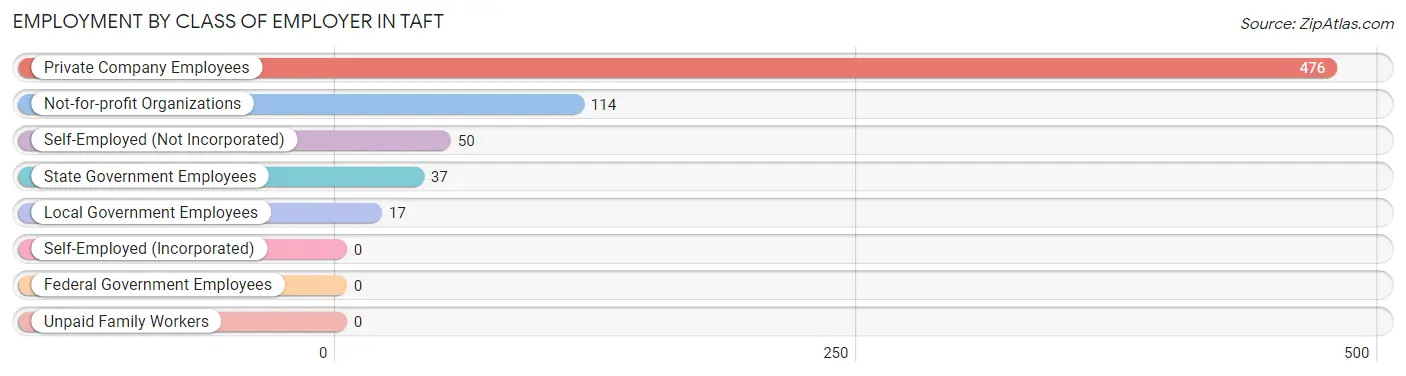
| Employer Class | # Employees | % Employees |
| Private Company Employees | 476 | 68.6% |
| Self-Employed (Incorporated) | 0 | 0.0% |
| Self-Employed (Not Incorporated) | 50 | 7.2% |
| Not-for-profit Organizations | 114 | 16.4% |
| Local Government Employees | 17 | 2.5% |
| State Government Employees | 37 | 5.3% |
| Federal Government Employees | 0 | 0.0% |
| Unpaid Family Workers | 0 | 0.0% |
| Total | 694 | 100.0% |
Employment Status by Age in Taft
According to the labor force statistics for Taft, out of the total population over 16 years of age (1,327), 54.6% or 725 individuals are in the labor force, with 1.8% or 13 of them unemployed. The age group with the highest labor force participation rate is 20 to 24 years, with 100.0% or 56 individuals in the labor force. Within the labor force, the 25 to 29 years age range has the highest percentage of unemployed individuals, with 25.0% or 9 of them being unemployed.
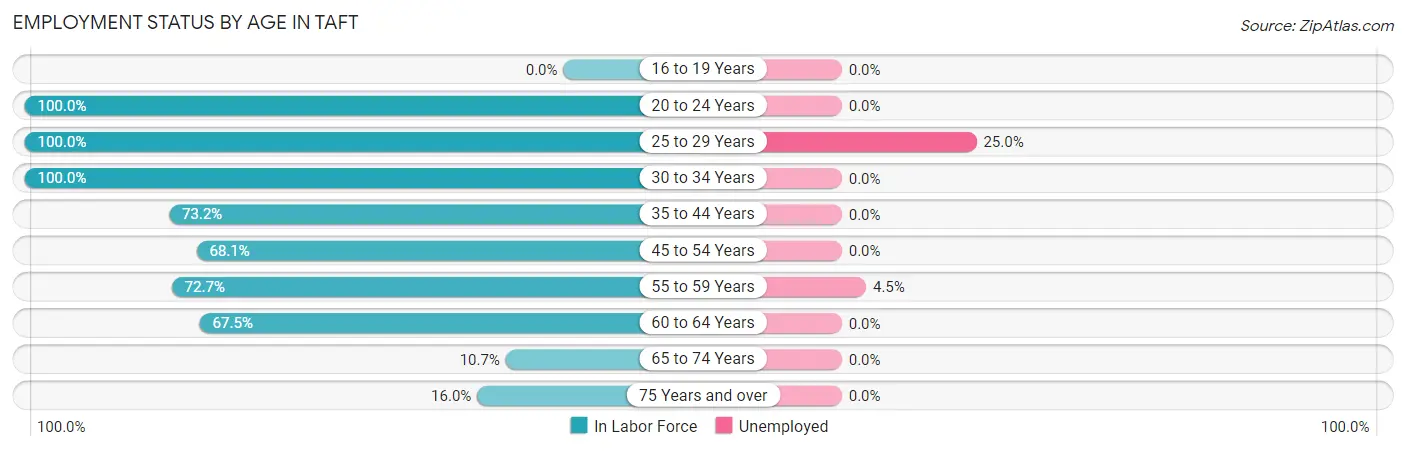
| Age Bracket | In Labor Force | Unemployed |
| 16 to 19 Years | 0 (0.0%) | 0 (0.0%) |
| 20 to 24 Years | 56 (100.0%) | 0 (0.0%) |
| 25 to 29 Years | 36 (100.0%) | 9 (25.0%) |
| 30 to 34 Years | 63 (100.0%) | 0 (0.0%) |
| 35 to 44 Years | 210 (73.2%) | 0 (0.0%) |
| 45 to 54 Years | 92 (68.1%) | 0 (0.0%) |
| 55 to 59 Years | 88 (72.7%) | 4 (4.5%) |
| 60 to 64 Years | 131 (67.5%) | 0 (0.0%) |
| 65 to 74 Years | 23 (10.7%) | 0 (0.0%) |
| 75 Years and over | 26 (16.0%) | 0 (0.0%) |
| Total | 725 (54.6%) | 13 (1.8%) |
Employment Status by Educational Attainment in Taft
According to labor force statistics for Taft, 74.2% of individuals (620) out of the total population between 25 and 64 years of age (836) are in the labor force, with 2.1% or 13 of them being unemployed. The group with the highest labor force participation rate are those with the educational attainment of bachelor's degree or higher, with 87.2% or 68 individuals in the labor force. Within the labor force, individuals with high school diploma education have the highest percentage of unemployment, with 5.7% or 13 of them being unemployed.
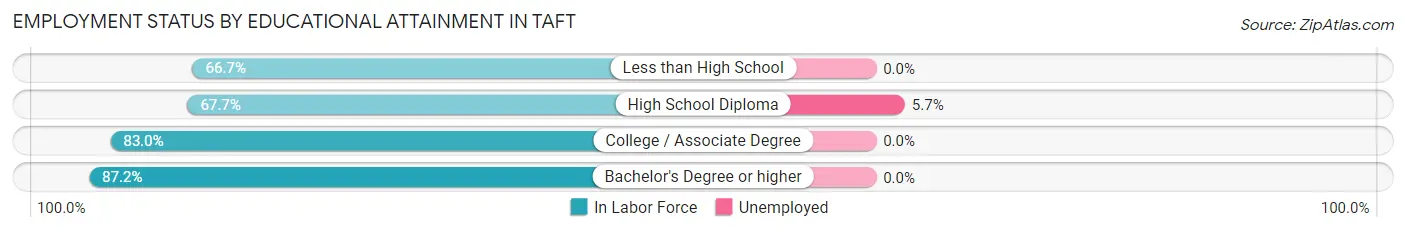
| Educational Attainment | In Labor Force | Unemployed |
| Less than High School | 104 (66.7%) | 0 (0.0%) |
| High School Diploma | 228 (67.7%) | 19 (5.7%) |
| College / Associate Degree | 220 (83.0%) | 0 (0.0%) |
| Bachelor's Degree or higher | 68 (87.2%) | 0 (0.0%) |
| Total | 620 (74.2%) | 18 (2.1%) |
Employment Occupations by Sex in Taft
Management, Business, Science and Arts Occupations
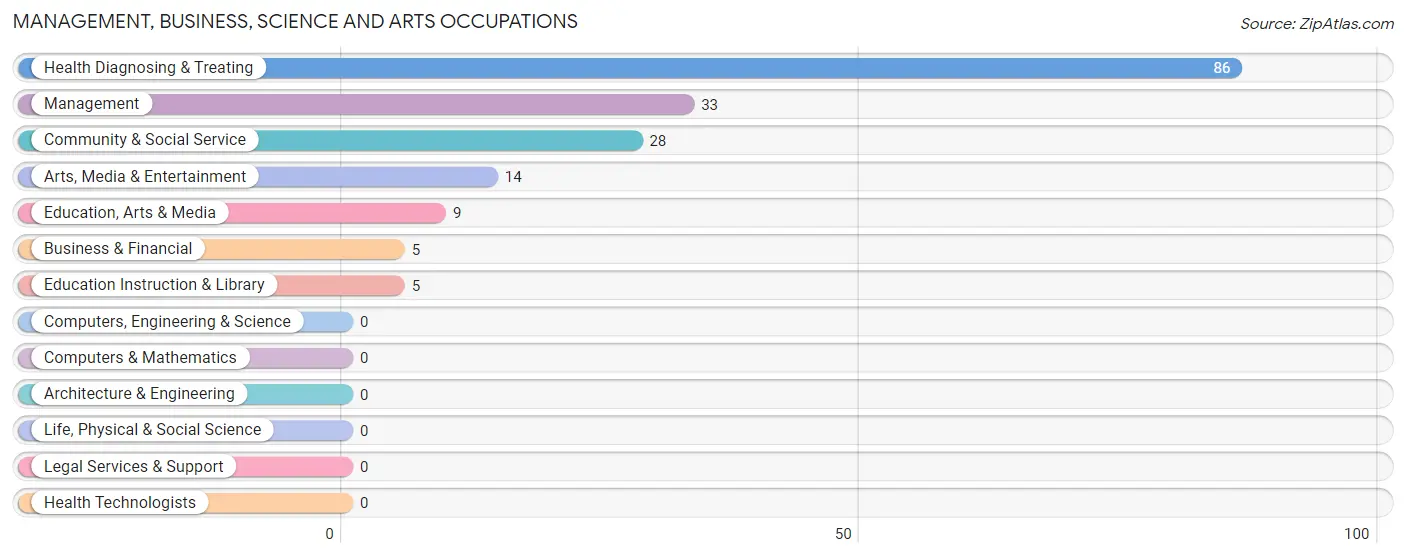
The most common Management, Business, Science and Arts occupations in Taft are Health Diagnosing & Treating (86 | 12.1%), Management (33 | 4.6%), Community & Social Service (28 | 3.9%), Arts, Media & Entertainment (14 | 2.0%), and Education, Arts & Media (9 | 1.3%).
Management, Business, Science and Arts Occupations by Sex
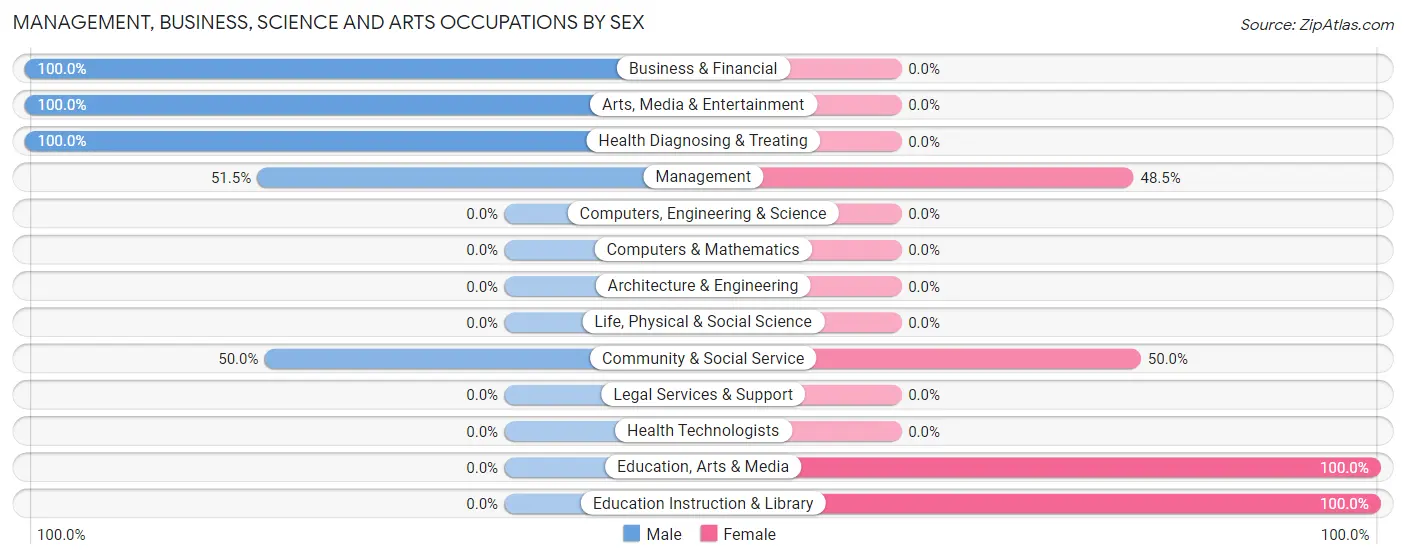
Within the Management, Business, Science and Arts occupations in Taft, the most male-oriented occupations are Business & Financial (100.0%), Arts, Media & Entertainment (100.0%), and Health Diagnosing & Treating (100.0%), while the most female-oriented occupations are Education, Arts & Media (100.0%), Education Instruction & Library (100.0%), and Community & Social Service (50.0%).
| Occupation | Male | Female |
| Management | 17 (51.5%) | 16 (48.5%) |
| Business & Financial | 5 (100.0%) | 0 (0.0%) |
| Computers, Engineering & Science | 0 (0.0%) | 0 (0.0%) |
| Computers & Mathematics | 0 (0.0%) | 0 (0.0%) |
| Architecture & Engineering | 0 (0.0%) | 0 (0.0%) |
| Life, Physical & Social Science | 0 (0.0%) | 0 (0.0%) |
| Community & Social Service | 14 (50.0%) | 14 (50.0%) |
| Education, Arts & Media | 0 (0.0%) | 9 (100.0%) |
| Legal Services & Support | 0 (0.0%) | 0 (0.0%) |
| Education Instruction & Library | 0 (0.0%) | 5 (100.0%) |
| Arts, Media & Entertainment | 14 (100.0%) | 0 (0.0%) |
| Health Diagnosing & Treating | 86 (100.0%) | 0 (0.0%) |
| Health Technologists | 0 (0.0%) | 0 (0.0%) |
| Total (Category) | 122 (80.3%) | 30 (19.7%) |
| Total (Overall) | 417 (58.6%) | 295 (41.4%) |
Services Occupations
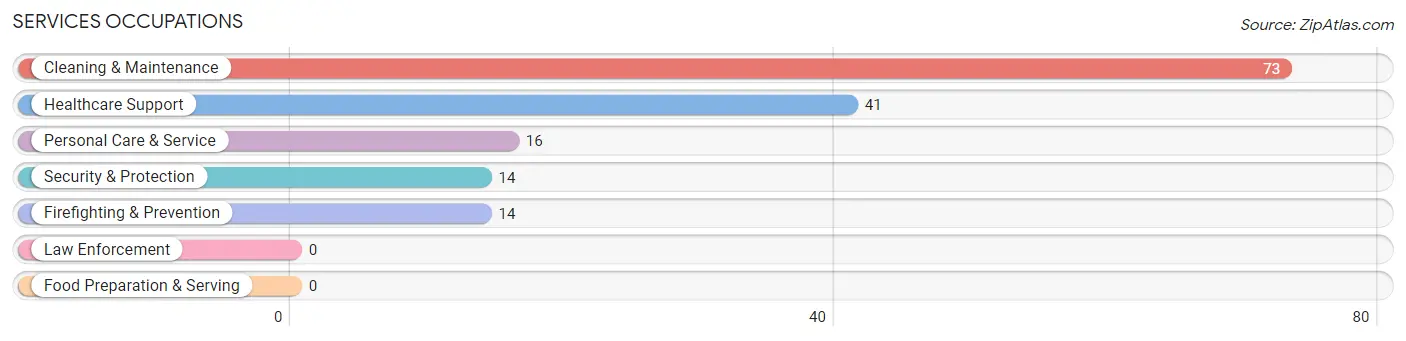
The most common Services occupations in Taft are Cleaning & Maintenance (73 | 10.2%), Healthcare Support (41 | 5.8%), Personal Care & Service (16 | 2.2%), Security & Protection (14 | 2.0%), and Firefighting & Prevention (14 | 2.0%).
Services Occupations by Sex
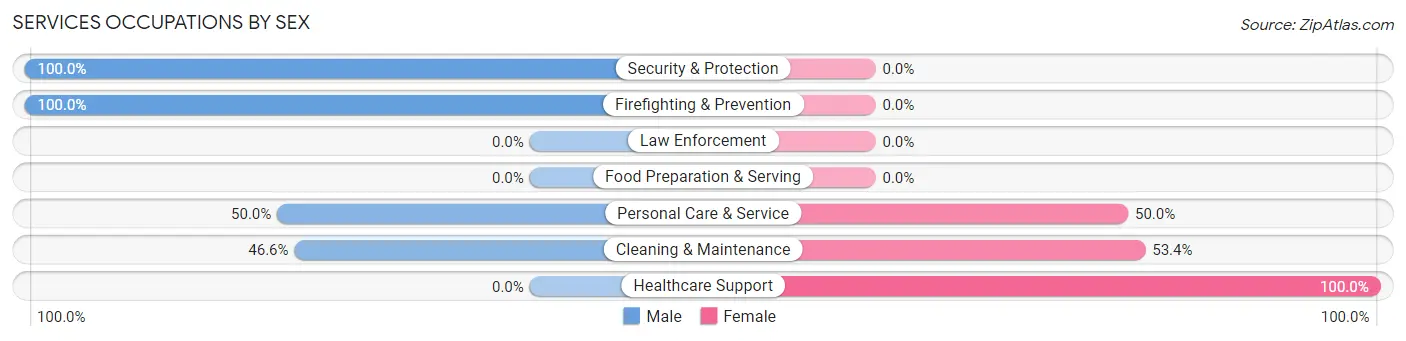
Within the Services occupations in Taft, the most male-oriented occupations are Security & Protection (100.0%), Firefighting & Prevention (100.0%), and Personal Care & Service (50.0%), while the most female-oriented occupations are Healthcare Support (100.0%), Cleaning & Maintenance (53.4%), and Personal Care & Service (50.0%).
| Occupation | Male | Female |
| Healthcare Support | 0 (0.0%) | 41 (100.0%) |
| Security & Protection | 14 (100.0%) | 0 (0.0%) |
| Firefighting & Prevention | 14 (100.0%) | 0 (0.0%) |
| Law Enforcement | 0 (0.0%) | 0 (0.0%) |
| Food Preparation & Serving | 0 (0.0%) | 0 (0.0%) |
| Cleaning & Maintenance | 34 (46.6%) | 39 (53.4%) |
| Personal Care & Service | 8 (50.0%) | 8 (50.0%) |
| Total (Category) | 56 (38.9%) | 88 (61.1%) |
| Total (Overall) | 417 (58.6%) | 295 (41.4%) |
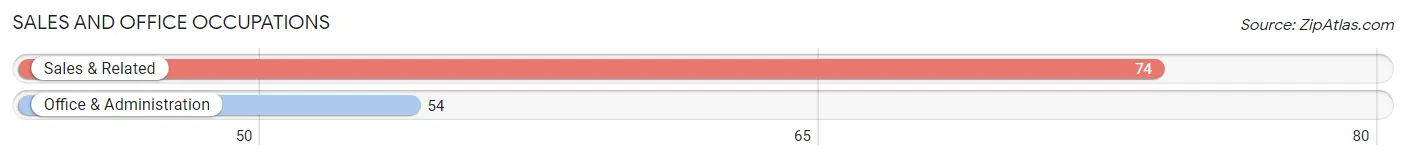
Sales and Office Occupations
The most common Sales and Office occupations in Taft are Sales & Related (74 | 10.4%), and Office & Administration (54 | 7.6%).
Sales and Office Occupations by Sex
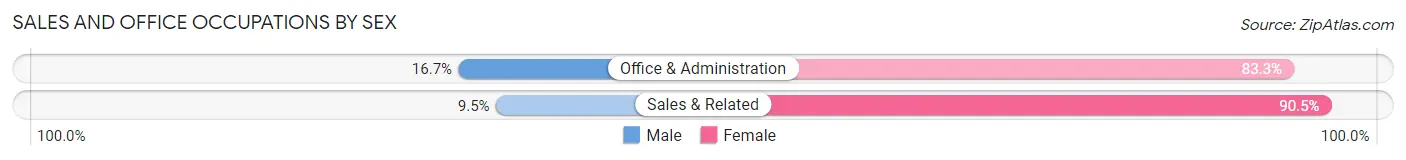
| Occupation | Male | Female |
| Sales & Related | 7 (9.5%) | 67 (90.5%) |
| Office & Administration | 9 (16.7%) | 45 (83.3%) |
| Total (Category) | 16 (12.5%) | 112 (87.5%) |
| Total (Overall) | 417 (58.6%) | 295 (41.4%) |
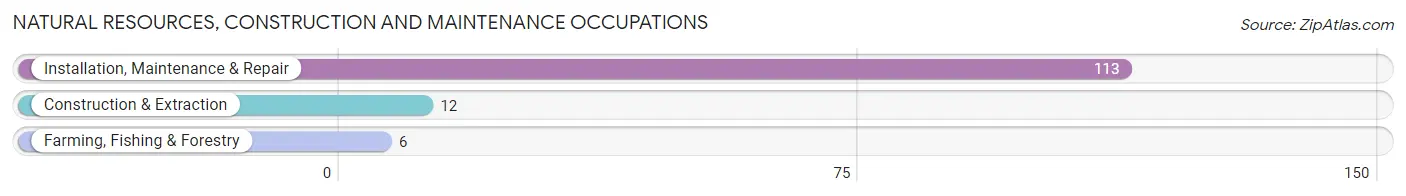
Natural Resources, Construction and Maintenance Occupations
The most common Natural Resources, Construction and Maintenance occupations in Taft are Installation, Maintenance & Repair (113 | 15.9%), Construction & Extraction (12 | 1.7%), and Farming, Fishing & Forestry (6 | 0.8%).
Natural Resources, Construction and Maintenance Occupations by Sex

| Occupation | Male | Female |
| Farming, Fishing & Forestry | 0 (0.0%) | 6 (100.0%) |
| Construction & Extraction | 12 (100.0%) | 0 (0.0%) |
| Installation, Maintenance & Repair | 113 (100.0%) | 0 (0.0%) |
| Total (Category) | 125 (95.4%) | 6 (4.6%) |
| Total (Overall) | 417 (58.6%) | 295 (41.4%) |
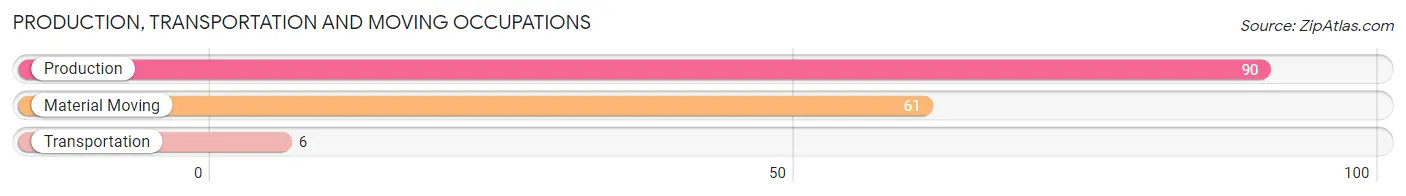
Production, Transportation and Moving Occupations
The most common Production, Transportation and Moving occupations in Taft are Production (90 | 12.6%), Material Moving (61 | 8.6%), and Transportation (6 | 0.8%).
Production, Transportation and Moving Occupations by Sex
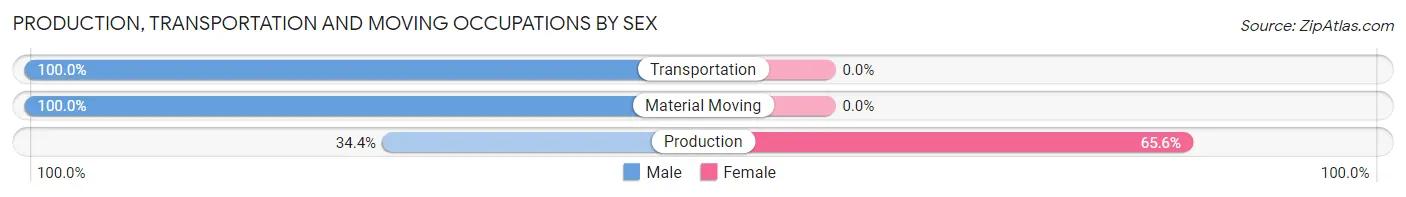
| Occupation | Male | Female |
| Production | 31 (34.4%) | 59 (65.6%) |
| Transportation | 6 (100.0%) | 0 (0.0%) |
| Material Moving | 61 (100.0%) | 0 (0.0%) |
| Total (Category) | 98 (62.4%) | 59 (37.6%) |
| Total (Overall) | 417 (58.6%) | 295 (41.4%) |
Employment Industries by Sex in Taft
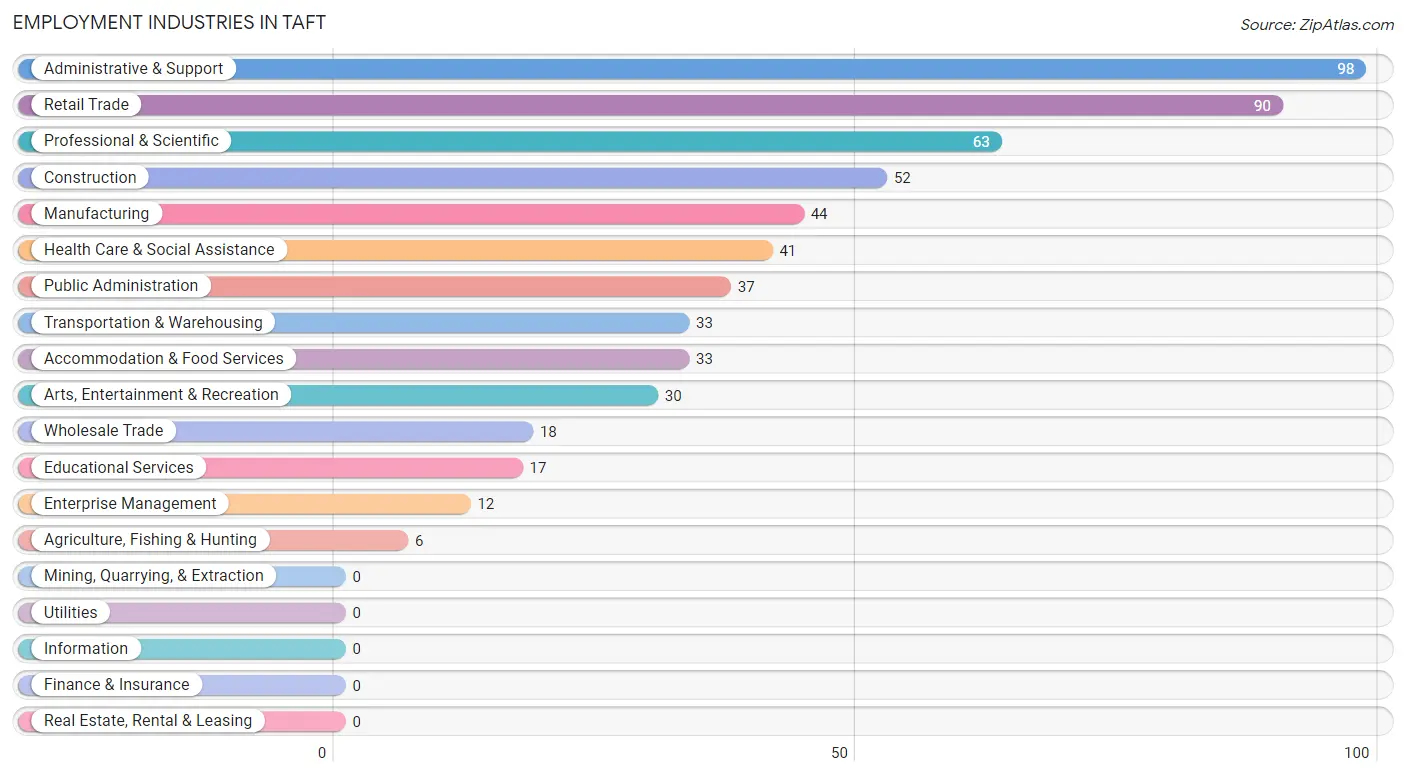
Employment Industries in Taft
The major employment industries in Taft include Administrative & Support (98 | 13.8%), Retail Trade (90 | 12.6%), Professional & Scientific (63 | 8.8%), Construction (52 | 7.3%), and Manufacturing (44 | 6.2%).
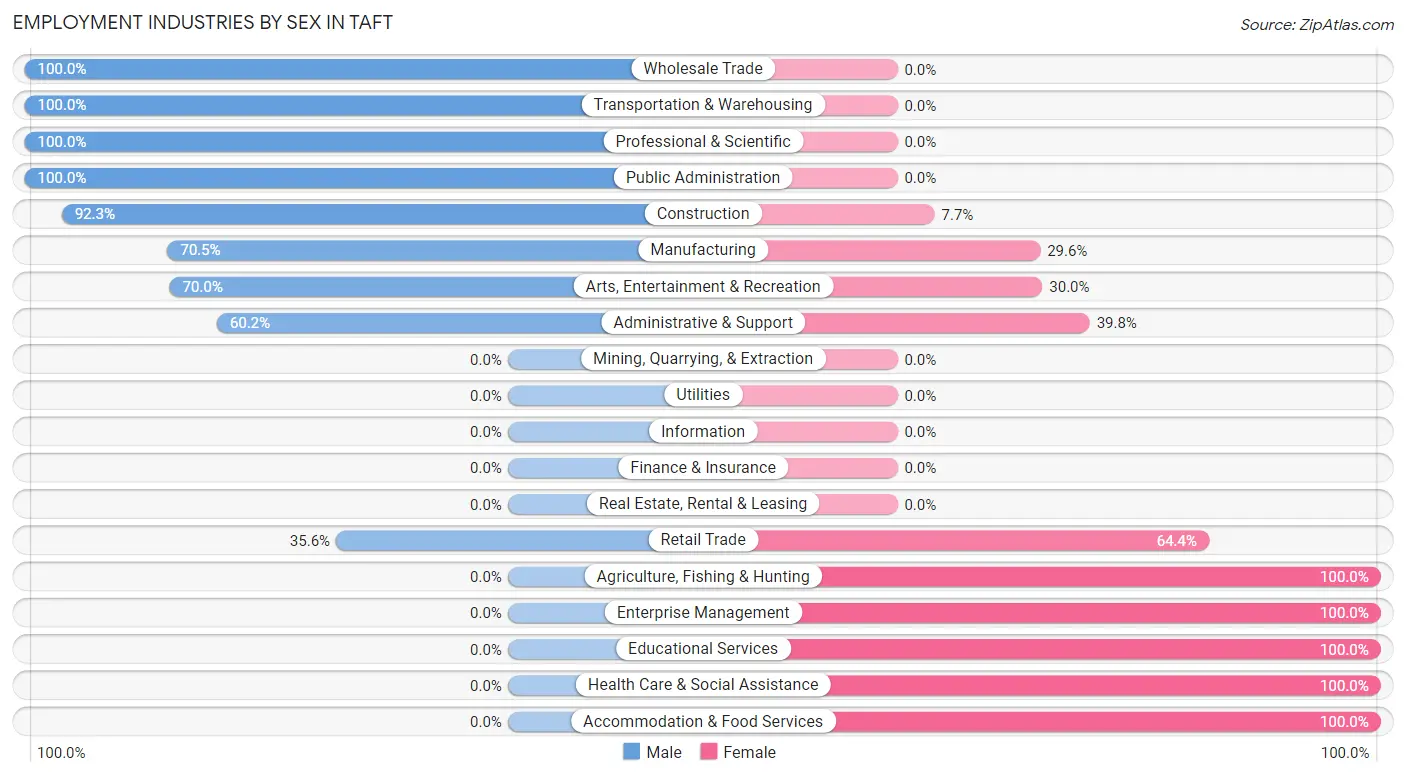
Employment Industries by Sex in Taft
The Taft industries that see more men than women are Wholesale Trade (100.0%), Transportation & Warehousing (100.0%), and Professional & Scientific (100.0%), whereas the industries that tend to have a higher number of women are Agriculture, Fishing & Hunting (100.0%), Enterprise Management (100.0%), and Educational Services (100.0%).
| Industry | Male | Female |
| Agriculture, Fishing & Hunting | 0 (0.0%) | 6 (100.0%) |
| Mining, Quarrying, & Extraction | 0 (0.0%) | 0 (0.0%) |
| Construction | 48 (92.3%) | 4 (7.7%) |
| Manufacturing | 31 (70.5%) | 13 (29.5%) |
| Wholesale Trade | 18 (100.0%) | 0 (0.0%) |
| Retail Trade | 32 (35.6%) | 58 (64.4%) |
| Transportation & Warehousing | 33 (100.0%) | 0 (0.0%) |
| Utilities | 0 (0.0%) | 0 (0.0%) |
| Information | 0 (0.0%) | 0 (0.0%) |
| Finance & Insurance | 0 (0.0%) | 0 (0.0%) |
| Real Estate, Rental & Leasing | 0 (0.0%) | 0 (0.0%) |
| Professional & Scientific | 63 (100.0%) | 0 (0.0%) |
| Enterprise Management | 0 (0.0%) | 12 (100.0%) |
| Administrative & Support | 59 (60.2%) | 39 (39.8%) |
| Educational Services | 0 (0.0%) | 17 (100.0%) |
| Health Care & Social Assistance | 0 (0.0%) | 41 (100.0%) |
| Arts, Entertainment & Recreation | 21 (70.0%) | 9 (30.0%) |
| Accommodation & Food Services | 0 (0.0%) | 33 (100.0%) |
| Public Administration | 37 (100.0%) | 0 (0.0%) |
| Total | 417 (58.6%) | 295 (41.4%) |
Education in Taft
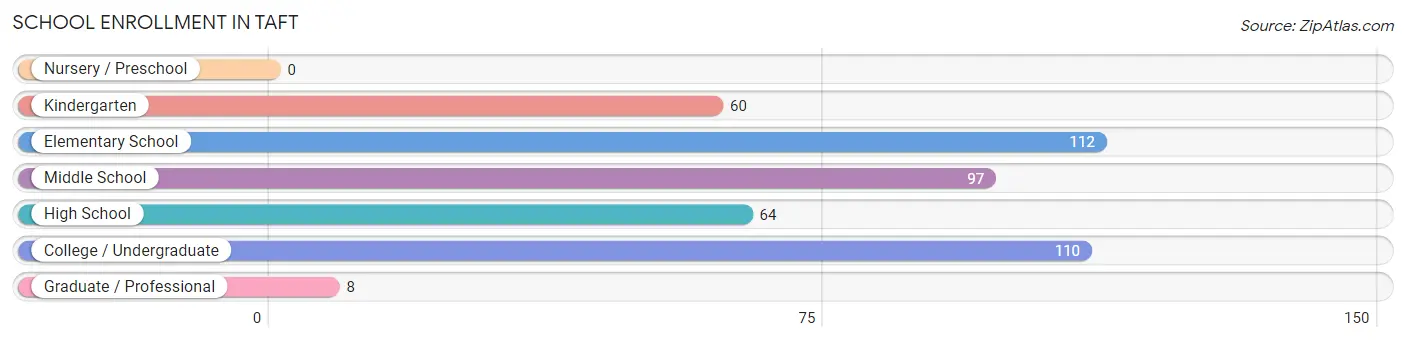
School Enrollment in Taft
The most common levels of schooling among the 451 students in Taft are elementary school (112 | 24.8%), college / undergraduate (110 | 24.4%), and middle school (97 | 21.5%).
| School Level | # Students | % Students |
| Nursery / Preschool | 0 | 0.0% |
| Kindergarten | 60 | 13.3% |
| Elementary School | 112 | 24.8% |
| Middle School | 97 | 21.5% |
| High School | 64 | 14.2% |
| College / Undergraduate | 110 | 24.4% |
| Graduate / Professional | 8 | 1.8% |
| Total | 451 | 100.0% |
School Enrollment by Age by Funding Source in Taft
Out of a total of 451 students who are enrolled in schools in Taft, 210 (46.6%) attend a private institution, while the remaining 241 (53.4%) are enrolled in public schools. The age group of 20 to 24 year olds has the highest likelihood of being enrolled in private schools, with 56 (100.0% in the age bracket) enrolled. Conversely, the age group of 10 to 14 year olds has the lowest likelihood of being enrolled in a private school, with 124 (100.0% in the age bracket) attending a public institution.
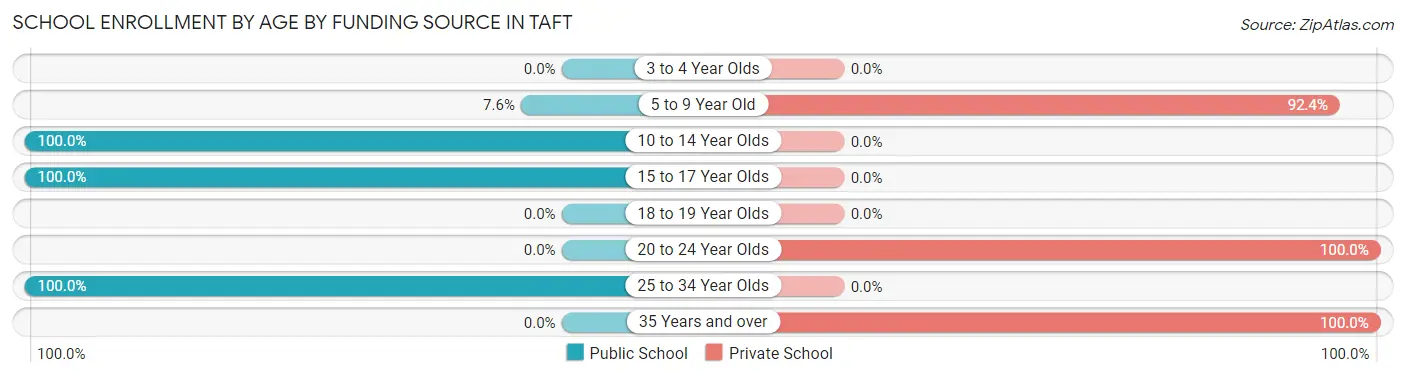
| Age Bracket | Public School | Private School |
| 3 to 4 Year Olds | 0 (0.0%) | 0 (0.0%) |
| 5 to 9 Year Old | 11 (7.6%) | 134 (92.4%) |
| 10 to 14 Year Olds | 124 (100.0%) | 0 (0.0%) |
| 15 to 17 Year Olds | 57 (100.0%) | 0 (0.0%) |
| 18 to 19 Year Olds | 0 (0.0%) | 0 (0.0%) |
| 20 to 24 Year Olds | 0 (0.0%) | 56 (100.0%) |
| 25 to 34 Year Olds | 49 (100.0%) | 0 (0.0%) |
| 35 Years and over | 0 (0.0%) | 20 (100.0%) |
| Total | 241 (53.4%) | 210 (46.6%) |
Educational Attainment by Field of Study in Taft
Social sciences (58 | 42.3%), engineering (34 | 24.8%), education (28 | 20.4%), business (12 | 8.8%), and arts & humanities (5 | 3.6%) are the most common fields of study among 137 individuals in Taft who have obtained a bachelor's degree or higher.
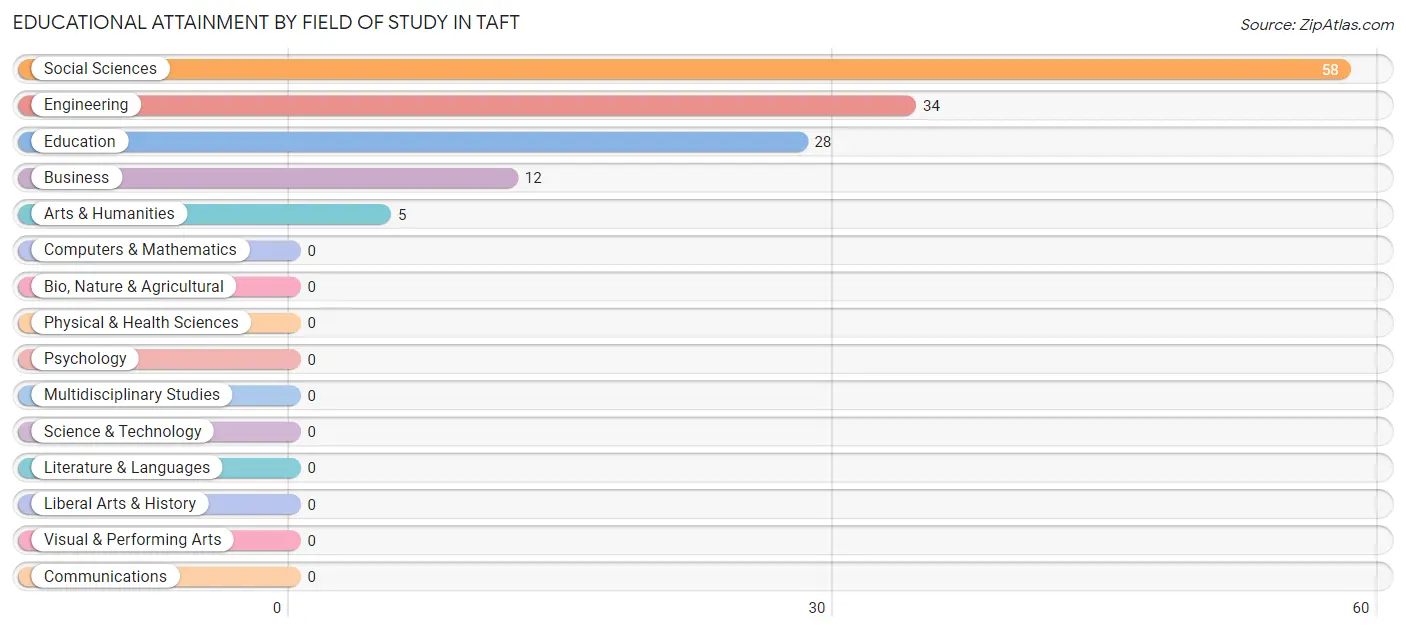
| Field of Study | # Graduates | % Graduates |
| Computers & Mathematics | 0 | 0.0% |
| Bio, Nature & Agricultural | 0 | 0.0% |
| Physical & Health Sciences | 0 | 0.0% |
| Psychology | 0 | 0.0% |
| Social Sciences | 58 | 42.3% |
| Engineering | 34 | 24.8% |
| Multidisciplinary Studies | 0 | 0.0% |
| Science & Technology | 0 | 0.0% |
| Business | 12 | 8.8% |
| Education | 28 | 20.4% |
| Literature & Languages | 0 | 0.0% |
| Liberal Arts & History | 0 | 0.0% |
| Visual & Performing Arts | 0 | 0.0% |
| Communications | 0 | 0.0% |
| Arts & Humanities | 5 | 3.6% |
| Total | 137 | 100.0% |
Transportation & Commute in Taft
Vehicle Availability by Sex in Taft
The most prevalent vehicle ownership categories in Taft are males with 2 vehicles (231, accounting for 56.6%) and females with 2 vehicles (213, making up 80.8%).
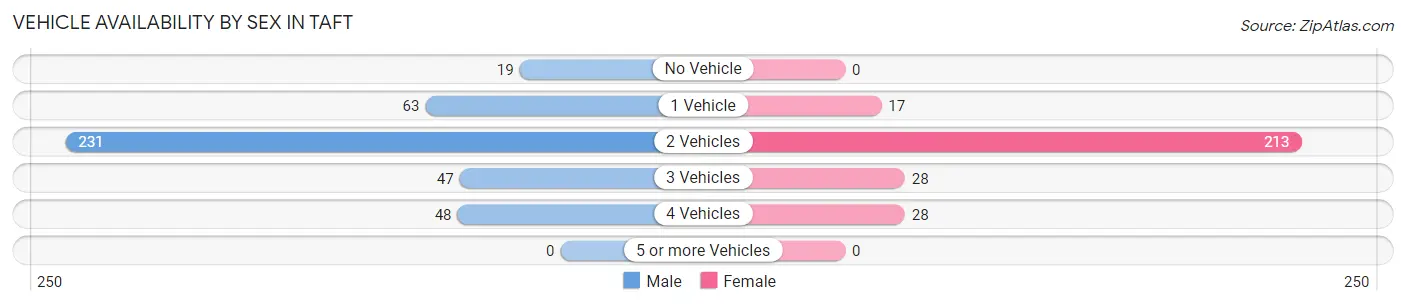
| Vehicles Available | Male | Female |
| No Vehicle | 19 (4.7%) | 0 (0.0%) |
| 1 Vehicle | 63 (15.4%) | 17 (5.9%) |
| 2 Vehicles | 231 (56.6%) | 213 (74.5%) |
| 3 Vehicles | 47 (11.5%) | 28 (9.8%) |
| 4 Vehicles | 48 (11.8%) | 28 (9.8%) |
| 5 or more Vehicles | 0 (0.0%) | 0 (0.0%) |
| Total | 408 (100.0%) | 286 (100.0%) |
Commute Time in Taft
The most frequently occuring commute durations in Taft are 30 to 34 minutes (217 commuters, 31.3%), 25 to 29 minutes (145 commuters, 20.9%), and 10 to 14 minutes (112 commuters, 16.1%).
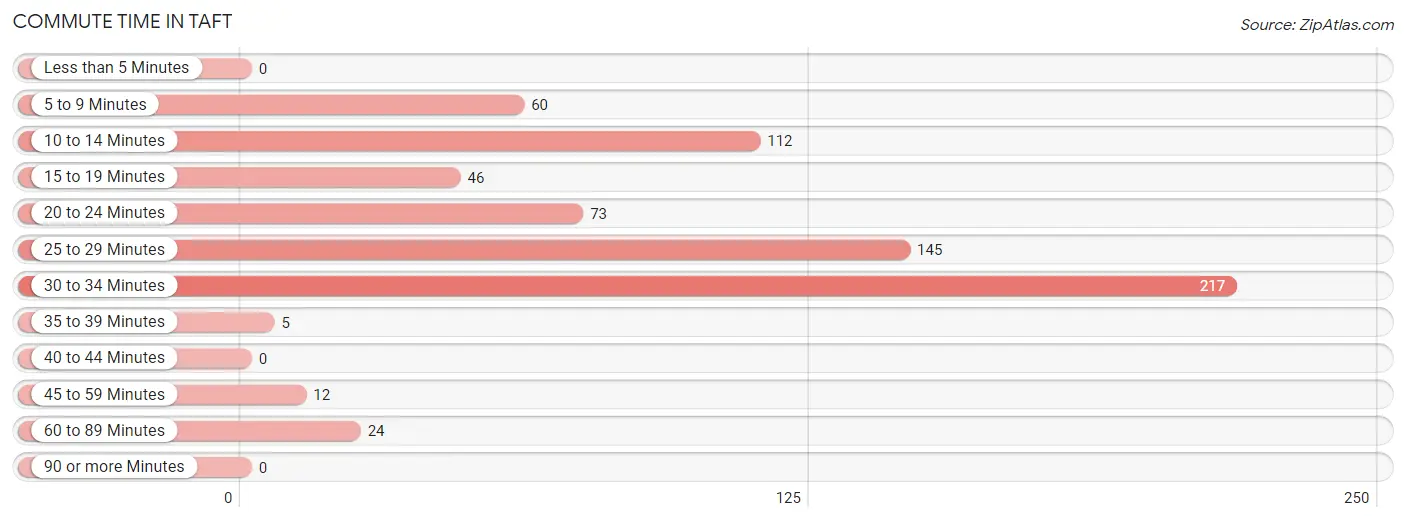
| Commute Time | # Commuters | % Commuters |
| Less than 5 Minutes | 0 | 0.0% |
| 5 to 9 Minutes | 60 | 8.6% |
| 10 to 14 Minutes | 112 | 16.1% |
| 15 to 19 Minutes | 46 | 6.6% |
| 20 to 24 Minutes | 73 | 10.5% |
| 25 to 29 Minutes | 145 | 20.9% |
| 30 to 34 Minutes | 217 | 31.3% |
| 35 to 39 Minutes | 5 | 0.7% |
| 40 to 44 Minutes | 0 | 0.0% |
| 45 to 59 Minutes | 12 | 1.7% |
| 60 to 89 Minutes | 24 | 3.5% |
| 90 or more Minutes | 0 | 0.0% |
Commute Time by Sex in Taft
The most common commute times in Taft are 30 to 34 minutes (120 commuters, 29.4%) for males and 30 to 34 minutes (97 commuters, 33.9%) for females.
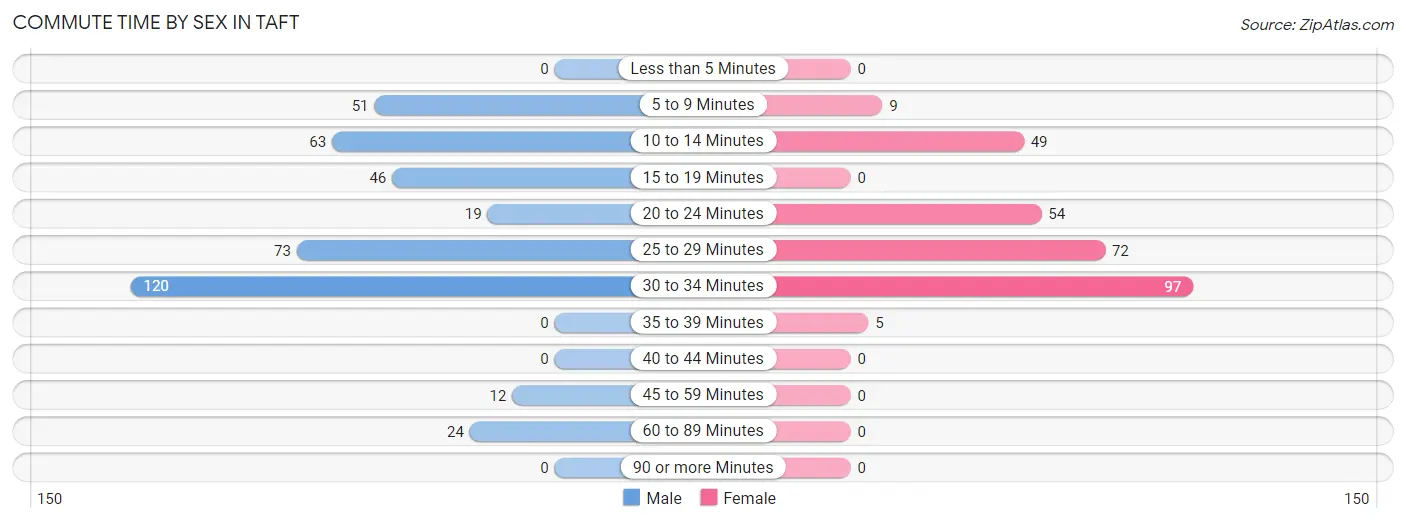
| Commute Time | Male | Female |
| Less than 5 Minutes | 0 (0.0%) | 0 (0.0%) |
| 5 to 9 Minutes | 51 (12.5%) | 9 (3.2%) |
| 10 to 14 Minutes | 63 (15.4%) | 49 (17.1%) |
| 15 to 19 Minutes | 46 (11.3%) | 0 (0.0%) |
| 20 to 24 Minutes | 19 (4.7%) | 54 (18.9%) |
| 25 to 29 Minutes | 73 (17.9%) | 72 (25.2%) |
| 30 to 34 Minutes | 120 (29.4%) | 97 (33.9%) |
| 35 to 39 Minutes | 0 (0.0%) | 5 (1.8%) |
| 40 to 44 Minutes | 0 (0.0%) | 0 (0.0%) |
| 45 to 59 Minutes | 12 (2.9%) | 0 (0.0%) |
| 60 to 89 Minutes | 24 (5.9%) | 0 (0.0%) |
| 90 or more Minutes | 0 (0.0%) | 0 (0.0%) |
Time of Departure to Work by Sex in Taft
The most frequent times of departure to work in Taft are 5:00 AM to 5:29 AM (85, 20.8%) for males and 7:30 AM to 7:59 AM (72, 25.2%) for females.
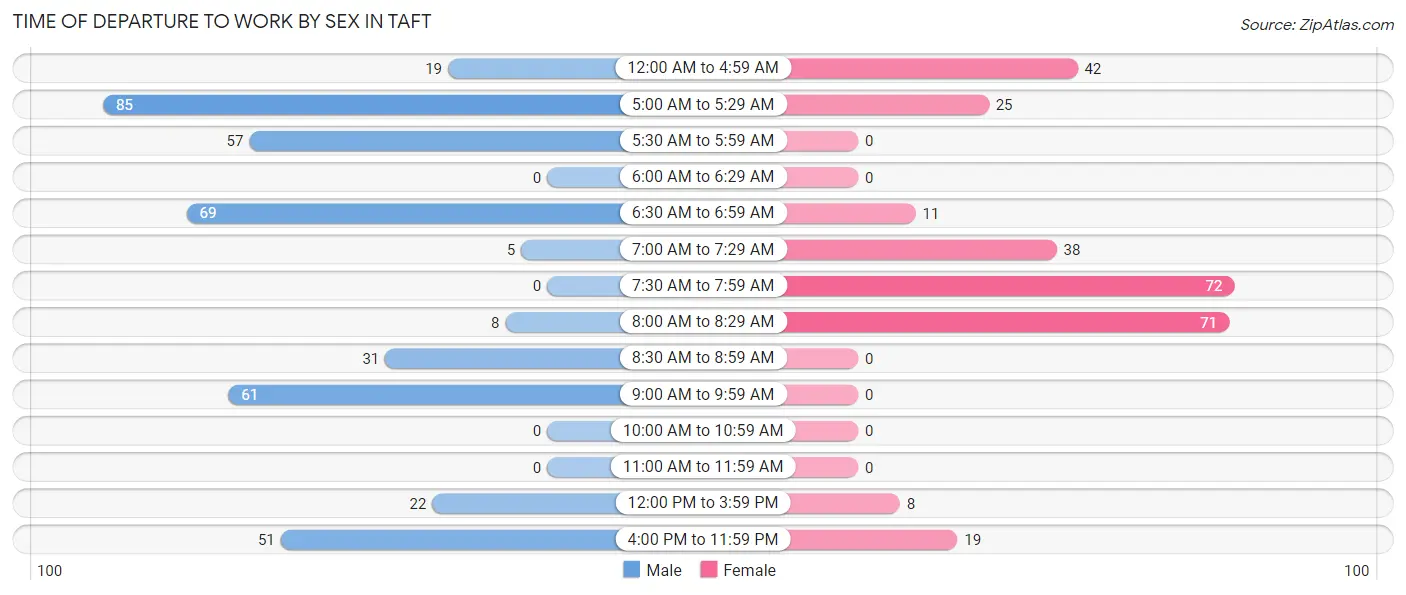
| Time of Departure | Male | Female |
| 12:00 AM to 4:59 AM | 19 (4.7%) | 42 (14.7%) |
| 5:00 AM to 5:29 AM | 85 (20.8%) | 25 (8.7%) |
| 5:30 AM to 5:59 AM | 57 (14.0%) | 0 (0.0%) |
| 6:00 AM to 6:29 AM | 0 (0.0%) | 0 (0.0%) |
| 6:30 AM to 6:59 AM | 69 (16.9%) | 11 (3.8%) |
| 7:00 AM to 7:29 AM | 5 (1.2%) | 38 (13.3%) |
| 7:30 AM to 7:59 AM | 0 (0.0%) | 72 (25.2%) |
| 8:00 AM to 8:29 AM | 8 (2.0%) | 71 (24.8%) |
| 8:30 AM to 8:59 AM | 31 (7.6%) | 0 (0.0%) |
| 9:00 AM to 9:59 AM | 61 (14.9%) | 0 (0.0%) |
| 10:00 AM to 10:59 AM | 0 (0.0%) | 0 (0.0%) |
| 11:00 AM to 11:59 AM | 0 (0.0%) | 0 (0.0%) |
| 12:00 PM to 3:59 PM | 22 (5.4%) | 8 (2.8%) |
| 4:00 PM to 11:59 PM | 51 (12.5%) | 19 (6.6%) |
| Total | 408 (100.0%) | 286 (100.0%) |
Housing Occupancy in Taft
Occupancy by Ownership in Taft
Of the total 644 dwellings in Taft, owner-occupied units account for 493 (76.5%), while renter-occupied units make up 151 (23.4%).
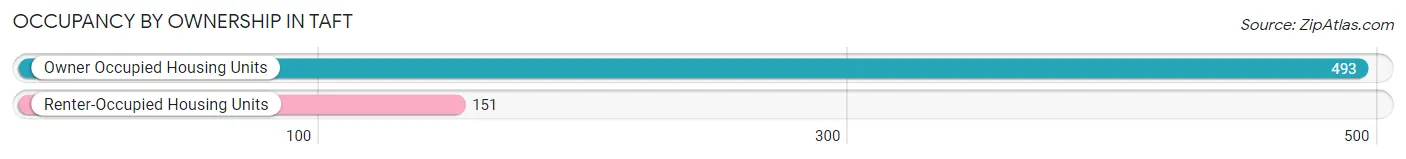
| Occupancy | # Housing Units | % Housing Units |
| Owner Occupied Housing Units | 493 | 76.5% |
| Renter-Occupied Housing Units | 151 | 23.4% |
| Total Occupied Housing Units | 644 | 100.0% |
Occupancy by Household Size in Taft
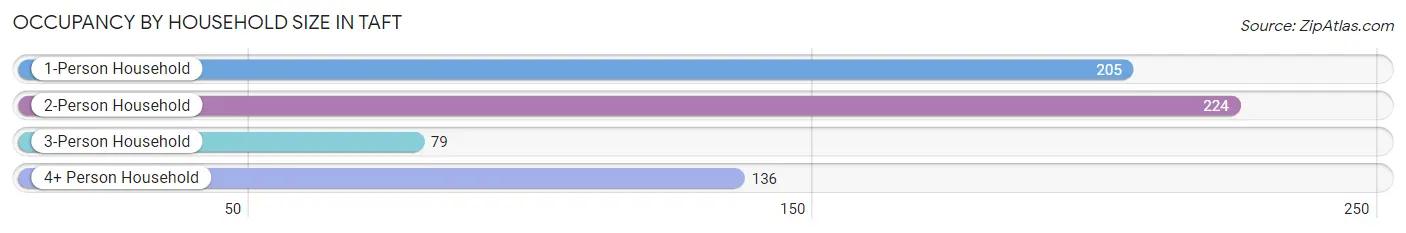
| Household Size | # Housing Units | % Housing Units |
| 1-Person Household | 205 | 31.8% |
| 2-Person Household | 224 | 34.8% |
| 3-Person Household | 79 | 12.3% |
| 4+ Person Household | 136 | 21.1% |
| Total Housing Units | 644 | 100.0% |
Occupancy by Ownership by Household Size in Taft
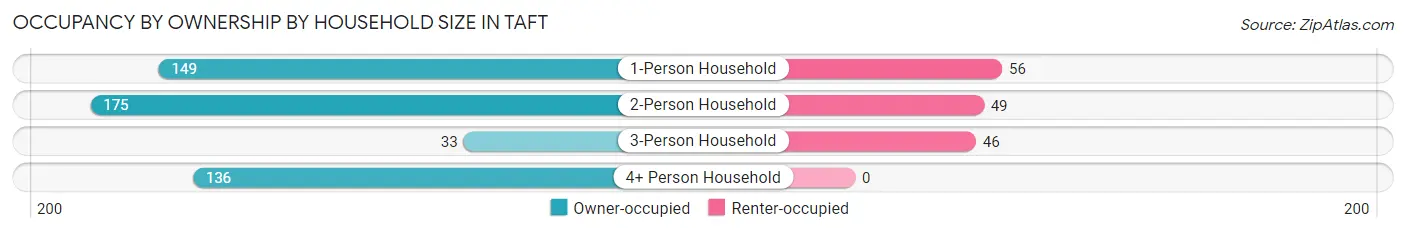
| Household Size | Owner-occupied | Renter-occupied |
| 1-Person Household | 149 (72.7%) | 56 (27.3%) |
| 2-Person Household | 175 (78.1%) | 49 (21.9%) |
| 3-Person Household | 33 (41.8%) | 46 (58.2%) |
| 4+ Person Household | 136 (100.0%) | 0 (0.0%) |
| Total Housing Units | 493 (76.5%) | 151 (23.4%) |
Occupancy by Educational Attainment in Taft
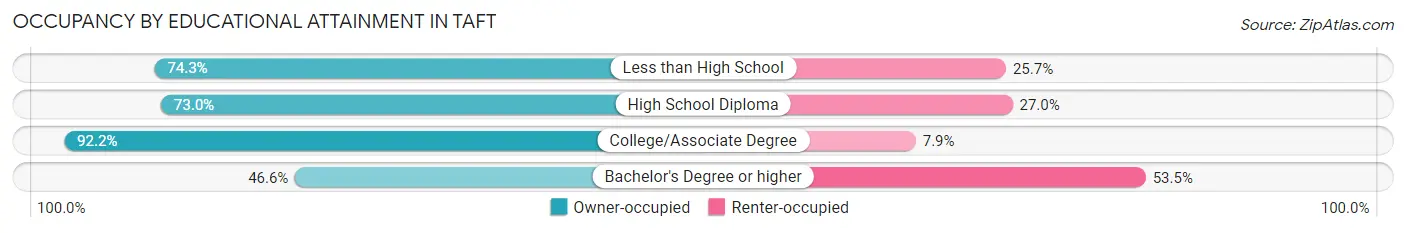
| Household Size | Owner-occupied | Renter-occupied |
| Less than High School | 101 (74.3%) | 35 (25.7%) |
| High School Diploma | 189 (73.0%) | 70 (27.0%) |
| College/Associate Degree | 176 (92.1%) | 15 (7.9%) |
| Bachelor's Degree or higher | 27 (46.6%) | 31 (53.4%) |
Occupancy by Age of Householder in Taft
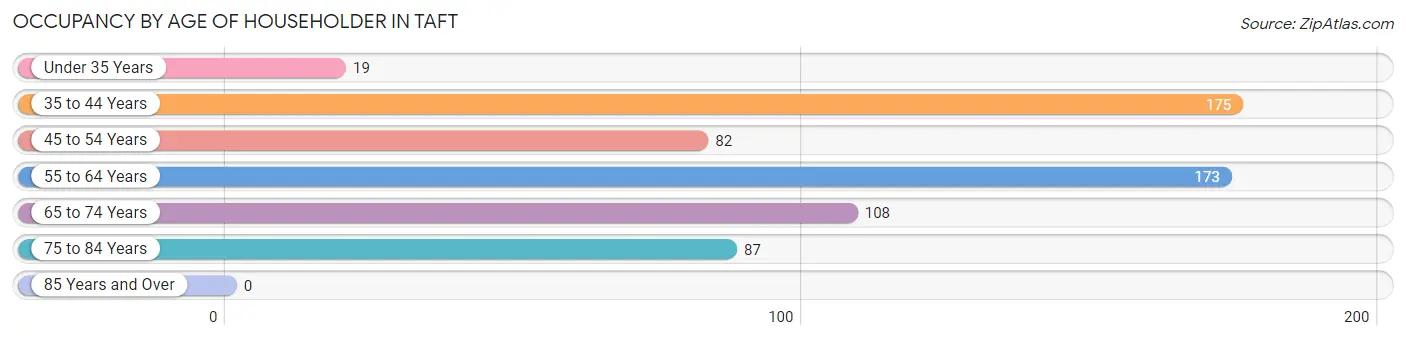
| Age Bracket | # Households | % Households |
| Under 35 Years | 19 | 2.9% |
| 35 to 44 Years | 175 | 27.2% |
| 45 to 54 Years | 82 | 12.7% |
| 55 to 64 Years | 173 | 26.9% |
| 65 to 74 Years | 108 | 16.8% |
| 75 to 84 Years | 87 | 13.5% |
| 85 Years and Over | 0 | 0.0% |
| Total | 644 | 100.0% |
Housing Finances in Taft
Median Income by Occupancy in Taft
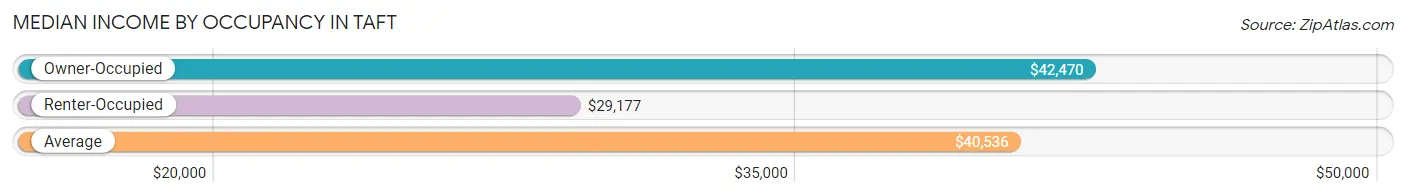
| Occupancy Type | # Households | Median Income |
| Owner-Occupied | 493 (76.5%) | $42,470 |
| Renter-Occupied | 151 (23.4%) | $29,177 |
| Average | 644 (100.0%) | $40,536 |
Occupancy by Householder Income Bracket in Taft
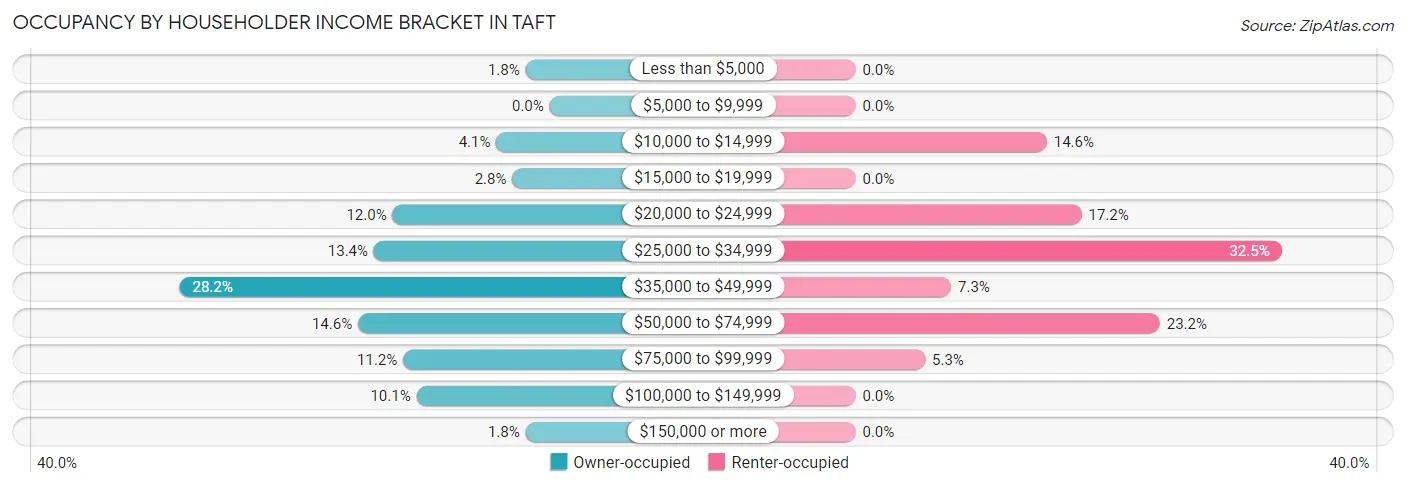
| Income Bracket | Owner-occupied | Renter-occupied |
| Less than $5,000 | 9 (1.8%) | 0 (0.0%) |
| $5,000 to $9,999 | 0 (0.0%) | 0 (0.0%) |
| $10,000 to $14,999 | 20 (4.1%) | 22 (14.6%) |
| $15,000 to $19,999 | 14 (2.8%) | 0 (0.0%) |
| $20,000 to $24,999 | 59 (12.0%) | 26 (17.2%) |
| $25,000 to $34,999 | 66 (13.4%) | 49 (32.5%) |
| $35,000 to $49,999 | 139 (28.2%) | 11 (7.3%) |
| $50,000 to $74,999 | 72 (14.6%) | 35 (23.2%) |
| $75,000 to $99,999 | 55 (11.2%) | 8 (5.3%) |
| $100,000 to $149,999 | 50 (10.1%) | 0 (0.0%) |
| $150,000 or more | 9 (1.8%) | 0 (0.0%) |
| Total | 493 (100.0%) | 151 (100.0%) |
Monthly Housing Cost Tiers in Taft
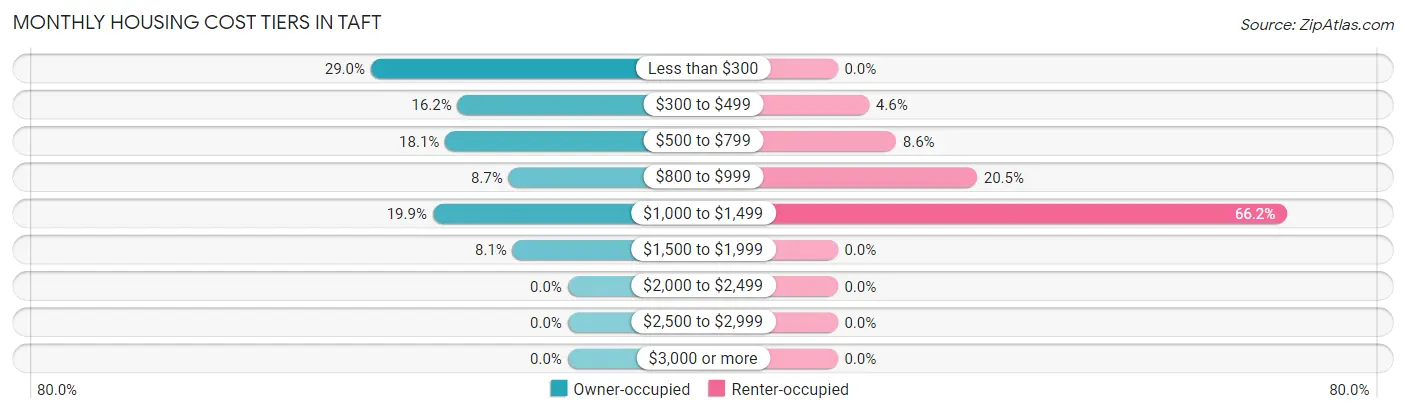
| Monthly Cost | Owner-occupied | Renter-occupied |
| Less than $300 | 143 (29.0%) | 0 (0.0%) |
| $300 to $499 | 80 (16.2%) | 7 (4.6%) |
| $500 to $799 | 89 (18.0%) | 13 (8.6%) |
| $800 to $999 | 43 (8.7%) | 31 (20.5%) |
| $1,000 to $1,499 | 98 (19.9%) | 100 (66.2%) |
| $1,500 to $1,999 | 40 (8.1%) | 0 (0.0%) |
| $2,000 to $2,499 | 0 (0.0%) | 0 (0.0%) |
| $2,500 to $2,999 | 0 (0.0%) | 0 (0.0%) |
| $3,000 or more | 0 (0.0%) | 0 (0.0%) |
| Total | 493 (100.0%) | 151 (100.0%) |
Physical Housing Characteristics in Taft
Housing Structures in Taft
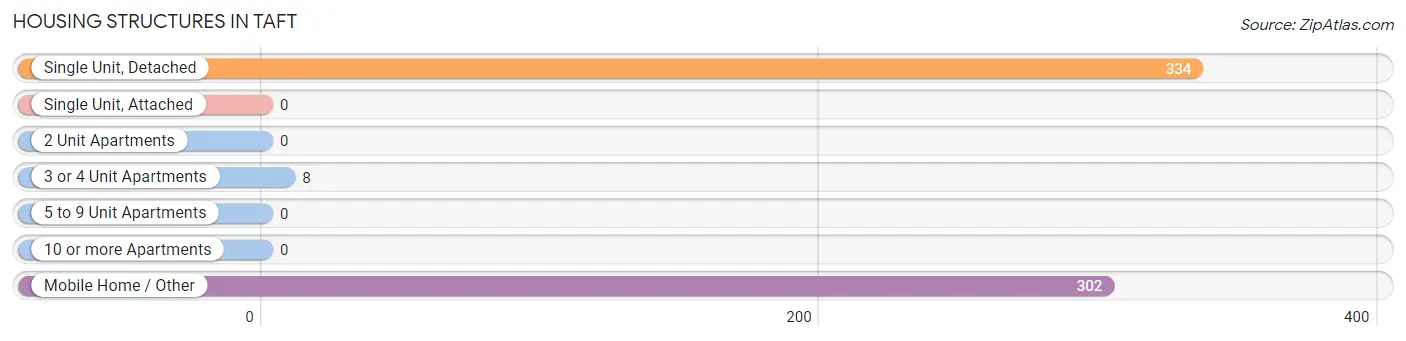
| Structure Type | # Housing Units | % Housing Units |
| Single Unit, Detached | 334 | 51.9% |
| Single Unit, Attached | 0 | 0.0% |
| 2 Unit Apartments | 0 | 0.0% |
| 3 or 4 Unit Apartments | 8 | 1.2% |
| 5 to 9 Unit Apartments | 0 | 0.0% |
| 10 or more Apartments | 0 | 0.0% |
| Mobile Home / Other | 302 | 46.9% |
| Total | 644 | 100.0% |
Housing Structures by Occupancy in Taft
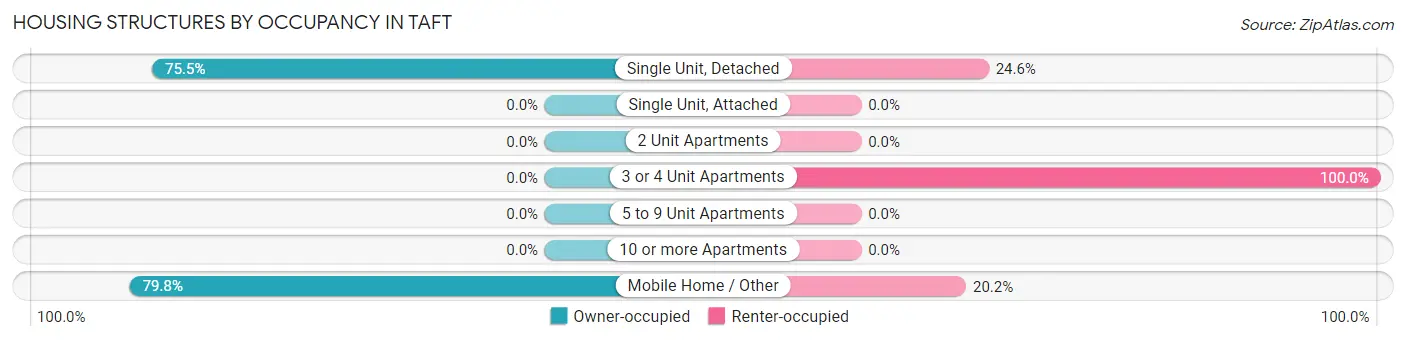
| Structure Type | Owner-occupied | Renter-occupied |
| Single Unit, Detached | 252 (75.4%) | 82 (24.5%) |
| Single Unit, Attached | 0 (0.0%) | 0 (0.0%) |
| 2 Unit Apartments | 0 (0.0%) | 0 (0.0%) |
| 3 or 4 Unit Apartments | 0 (0.0%) | 8 (100.0%) |
| 5 to 9 Unit Apartments | 0 (0.0%) | 0 (0.0%) |
| 10 or more Apartments | 0 (0.0%) | 0 (0.0%) |
| Mobile Home / Other | 241 (79.8%) | 61 (20.2%) |
| Total | 493 (76.5%) | 151 (23.4%) |
Housing Structures by Number of Rooms in Taft
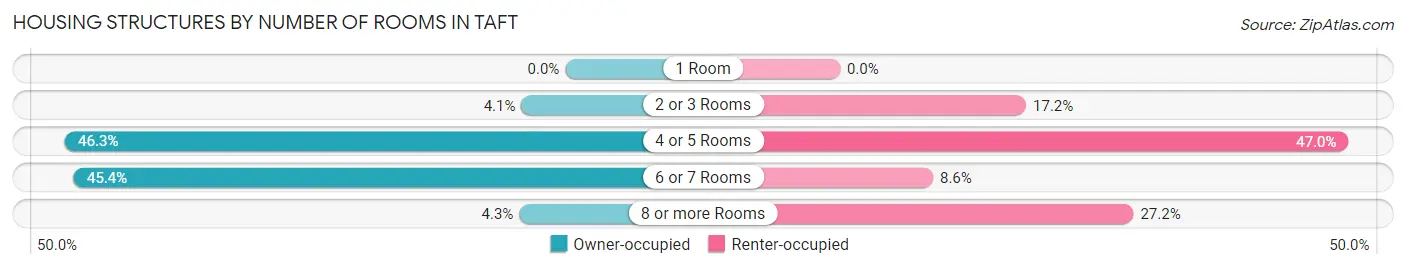
| Number of Rooms | Owner-occupied | Renter-occupied |
| 1 Room | 0 (0.0%) | 0 (0.0%) |
| 2 or 3 Rooms | 20 (4.1%) | 26 (17.2%) |
| 4 or 5 Rooms | 228 (46.3%) | 71 (47.0%) |
| 6 or 7 Rooms | 224 (45.4%) | 13 (8.6%) |
| 8 or more Rooms | 21 (4.3%) | 41 (27.2%) |
| Total | 493 (100.0%) | 151 (100.0%) |
Housing Structure by Heating Type in Taft
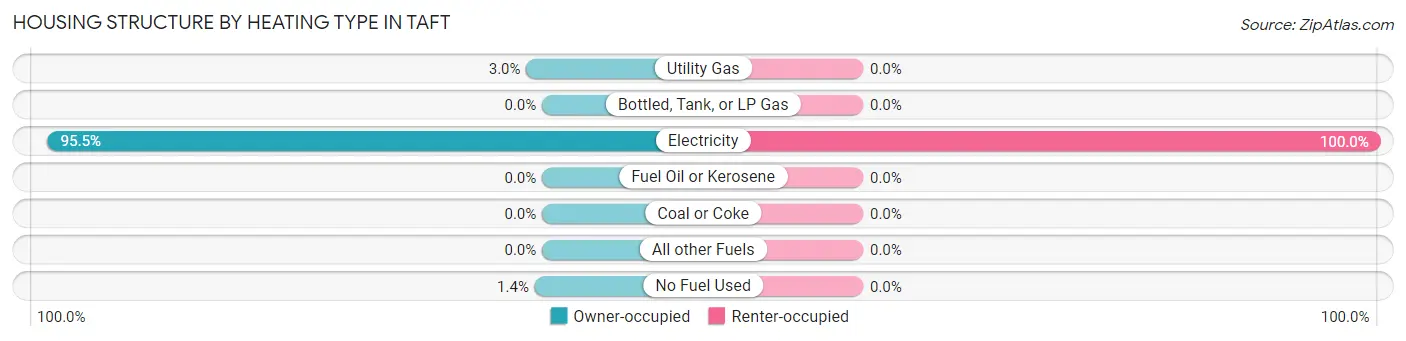
| Heating Type | Owner-occupied | Renter-occupied |
| Utility Gas | 15 (3.0%) | 0 (0.0%) |
| Bottled, Tank, or LP Gas | 0 (0.0%) | 0 (0.0%) |
| Electricity | 471 (95.5%) | 151 (100.0%) |
| Fuel Oil or Kerosene | 0 (0.0%) | 0 (0.0%) |
| Coal or Coke | 0 (0.0%) | 0 (0.0%) |
| All other Fuels | 0 (0.0%) | 0 (0.0%) |
| No Fuel Used | 7 (1.4%) | 0 (0.0%) |
| Total | 493 (100.0%) | 151 (100.0%) |
Household Vehicle Usage in Taft
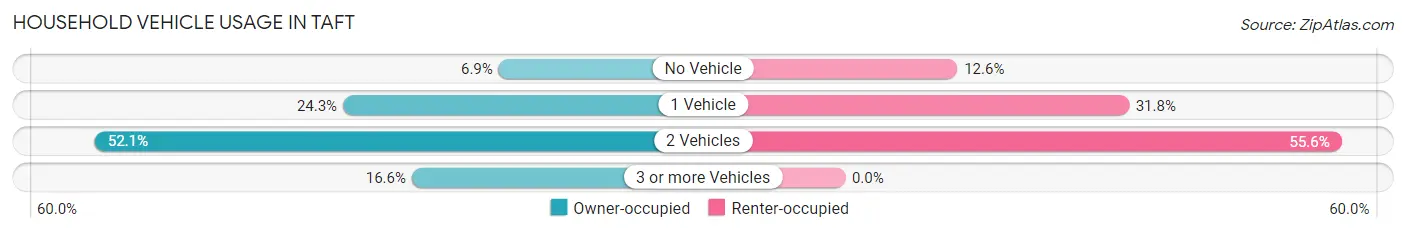
| Vehicles per Household | Owner-occupied | Renter-occupied |
| No Vehicle | 34 (6.9%) | 19 (12.6%) |
| 1 Vehicle | 120 (24.3%) | 48 (31.8%) |
| 2 Vehicles | 257 (52.1%) | 84 (55.6%) |
| 3 or more Vehicles | 82 (16.6%) | 0 (0.0%) |
| Total | 493 (100.0%) | 151 (100.0%) |
Real Estate & Mortgages in Taft
Real Estate and Mortgage Overview in Taft
| Characteristic | Without Mortgage | With Mortgage |
| Housing Units | 292 | 201 |
| Median Property Value | $100,000 | $195,400 |
| Median Household Income | $41,806 | $9 |
| Monthly Housing Costs | $307 | $0 |
| Real Estate Taxes | $838 | $13 |
Property Value by Mortgage Status in Taft
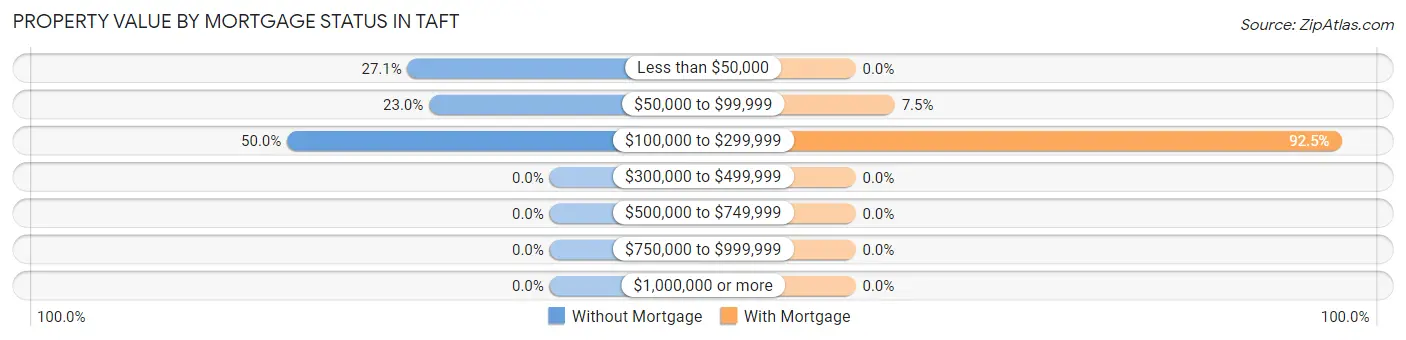
| Property Value | Without Mortgage | With Mortgage |
| Less than $50,000 | 79 (27.1%) | 0 (0.0%) |
| $50,000 to $99,999 | 67 (23.0%) | 15 (7.5%) |
| $100,000 to $299,999 | 146 (50.0%) | 186 (92.5%) |
| $300,000 to $499,999 | 0 (0.0%) | 0 (0.0%) |
| $500,000 to $749,999 | 0 (0.0%) | 0 (0.0%) |
| $750,000 to $999,999 | 0 (0.0%) | 0 (0.0%) |
| $1,000,000 or more | 0 (0.0%) | 0 (0.0%) |
| Total | 292 (100.0%) | 201 (100.0%) |
Household Income by Mortgage Status in Taft
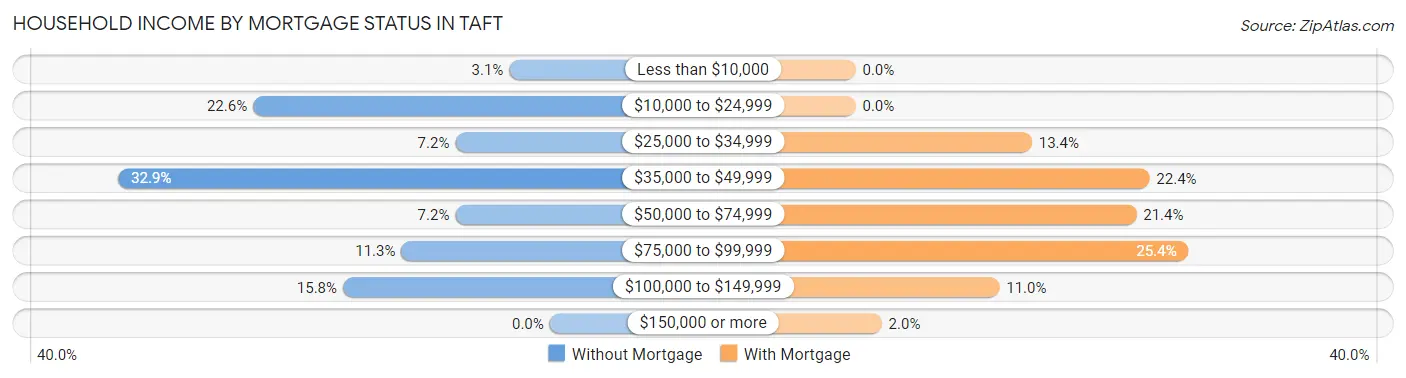
| Household Income | Without Mortgage | With Mortgage |
| Less than $10,000 | 9 (3.1%) | 0 (0.0%) |
| $10,000 to $24,999 | 66 (22.6%) | 0 (0.0%) |
| $25,000 to $34,999 | 21 (7.2%) | 27 (13.4%) |
| $35,000 to $49,999 | 96 (32.9%) | 45 (22.4%) |
| $50,000 to $74,999 | 21 (7.2%) | 43 (21.4%) |
| $75,000 to $99,999 | 33 (11.3%) | 51 (25.4%) |
| $100,000 to $149,999 | 46 (15.8%) | 22 (11.0%) |
| $150,000 or more | 0 (0.0%) | 4 (2.0%) |
| Total | 292 (100.0%) | 201 (100.0%) |
Property Value to Household Income Ratio in Taft
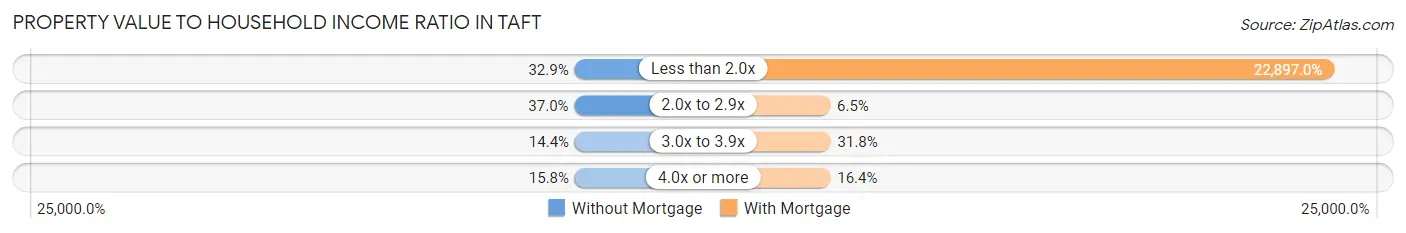
| Value-to-Income Ratio | Without Mortgage | With Mortgage |
| Less than 2.0x | 96 (32.9%) | 46,023 (22,897.0%) |
| 2.0x to 2.9x | 108 (37.0%) | 13 (6.5%) |
| 3.0x to 3.9x | 42 (14.4%) | 64 (31.8%) |
| 4.0x or more | 46 (15.8%) | 33 (16.4%) |
| Total | 292 (100.0%) | 201 (100.0%) |
Real Estate Taxes by Mortgage Status in Taft
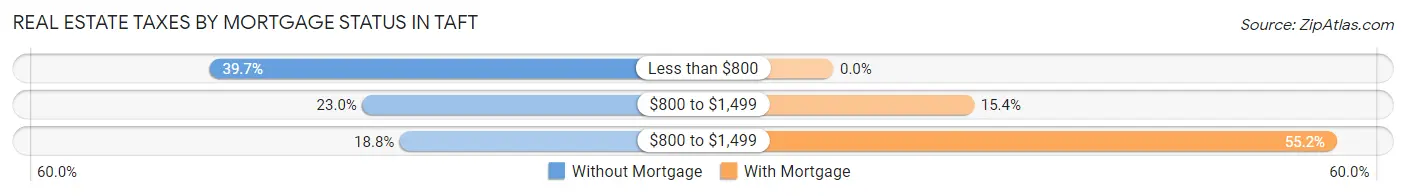
| Property Taxes | Without Mortgage | With Mortgage |
| Less than $800 | 116 (39.7%) | 0 (0.0%) |
| $800 to $1,499 | 67 (23.0%) | 31 (15.4%) |
| $800 to $1,499 | 55 (18.8%) | 111 (55.2%) |
| Total | 292 (100.0%) | 201 (100.0%) |
Health & Disability in Taft
Health Insurance Coverage by Age in Taft
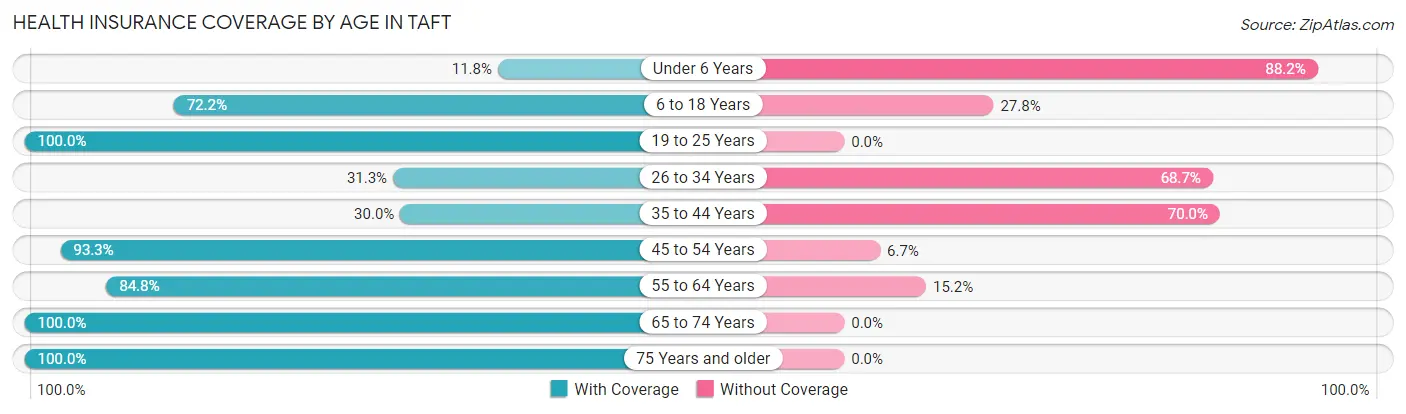
| Age Bracket | With Coverage | Without Coverage |
| Under 6 Years | 8 (11.8%) | 60 (88.2%) |
| 6 to 18 Years | 192 (72.2%) | 74 (27.8%) |
| 19 to 25 Years | 56 (100.0%) | 0 (0.0%) |
| 26 to 34 Years | 31 (31.3%) | 68 (68.7%) |
| 35 to 44 Years | 86 (30.0%) | 201 (70.0%) |
| 45 to 54 Years | 126 (93.3%) | 9 (6.7%) |
| 55 to 64 Years | 267 (84.8%) | 48 (15.2%) |
| 65 to 74 Years | 215 (100.0%) | 0 (0.0%) |
| 75 Years and older | 163 (100.0%) | 0 (0.0%) |
| Total | 1,144 (71.3%) | 460 (28.7%) |
Health Insurance Coverage by Citizenship Status in Taft
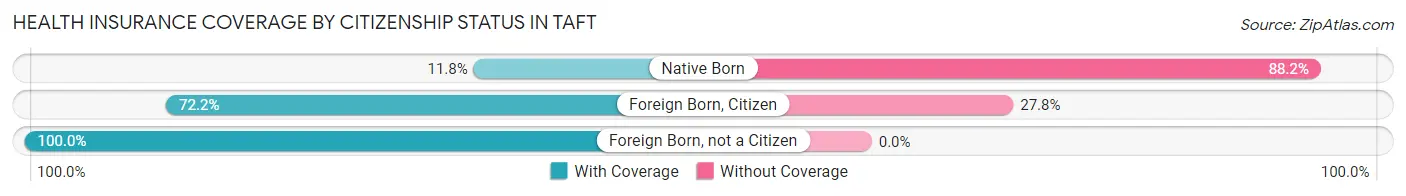
| Citizenship Status | With Coverage | Without Coverage |
| Native Born | 8 (11.8%) | 60 (88.2%) |
| Foreign Born, Citizen | 192 (72.2%) | 74 (27.8%) |
| Foreign Born, not a Citizen | 56 (100.0%) | 0 (0.0%) |
Health Insurance Coverage by Household Income in Taft
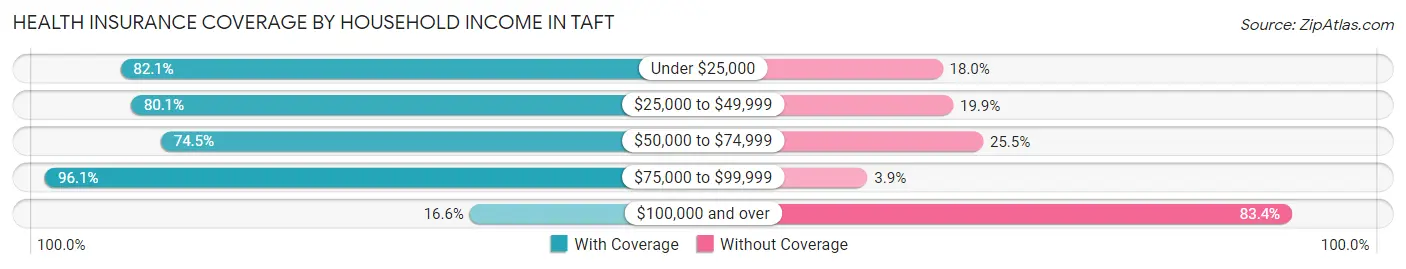
| Household Income | With Coverage | Without Coverage |
| Under $25,000 | 192 (82.1%) | 42 (17.9%) |
| $25,000 to $49,999 | 543 (80.1%) | 135 (19.9%) |
| $50,000 to $74,999 | 140 (74.5%) | 48 (25.5%) |
| $75,000 to $99,999 | 224 (96.1%) | 9 (3.9%) |
| $100,000 and over | 45 (16.6%) | 226 (83.4%) |
Public vs Private Health Insurance Coverage by Age in Taft
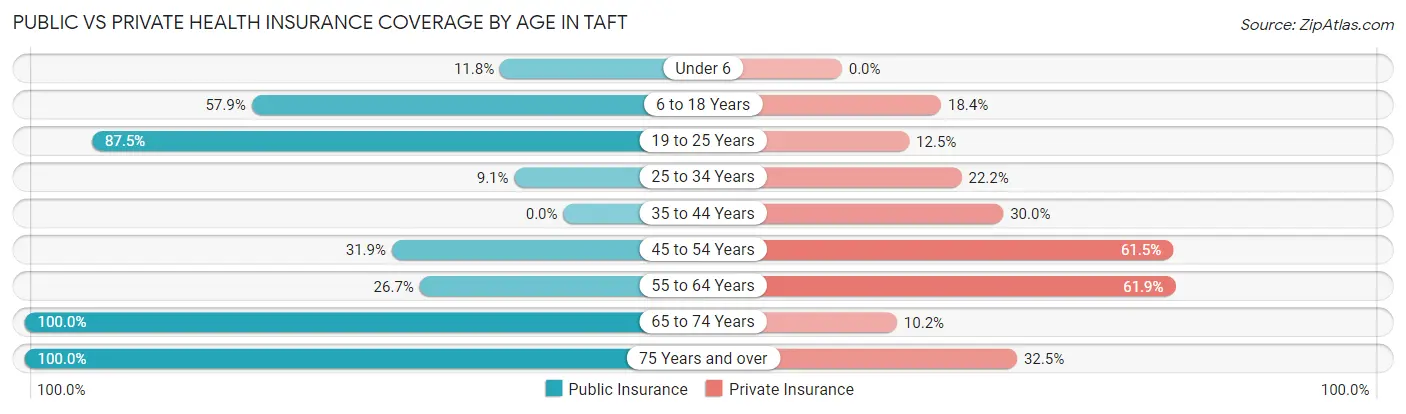
| Age Bracket | Public Insurance | Private Insurance |
| Under 6 | 8 (11.8%) | 0 (0.0%) |
| 6 to 18 Years | 154 (57.9%) | 49 (18.4%) |
| 19 to 25 Years | 49 (87.5%) | 7 (12.5%) |
| 25 to 34 Years | 9 (9.1%) | 22 (22.2%) |
| 35 to 44 Years | 0 (0.0%) | 86 (30.0%) |
| 45 to 54 Years | 43 (31.9%) | 83 (61.5%) |
| 55 to 64 Years | 84 (26.7%) | 195 (61.9%) |
| 65 to 74 Years | 215 (100.0%) | 22 (10.2%) |
| 75 Years and over | 163 (100.0%) | 53 (32.5%) |
| Total | 725 (45.2%) | 517 (32.2%) |
Disability Status by Sex by Age in Taft
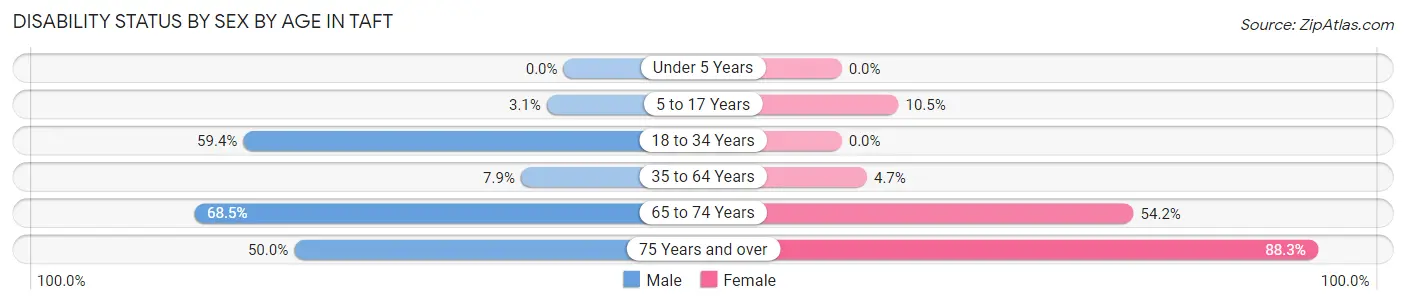
| Age Bracket | Male | Female |
| Under 5 Years | 0 (0.0%) | 0 (0.0%) |
| 5 to 17 Years | 6 (3.1%) | 14 (10.5%) |
| 18 to 34 Years | 63 (59.4%) | 0 (0.0%) |
| 35 to 64 Years | 33 (7.9%) | 15 (4.7%) |
| 65 to 74 Years | 98 (68.5%) | 39 (54.2%) |
| 75 Years and over | 26 (50.0%) | 98 (88.3%) |
Disability Class by Sex by Age in Taft
Disability Class: Hearing Difficulty
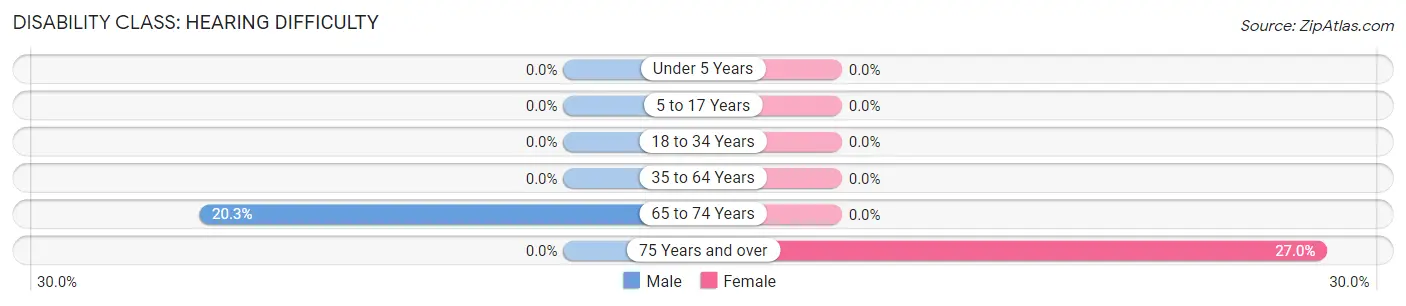
| Age Bracket | Male | Female |
| Under 5 Years | 0 (0.0%) | 0 (0.0%) |
| 5 to 17 Years | 0 (0.0%) | 0 (0.0%) |
| 18 to 34 Years | 0 (0.0%) | 0 (0.0%) |
| 35 to 64 Years | 0 (0.0%) | 0 (0.0%) |
| 65 to 74 Years | 29 (20.3%) | 0 (0.0%) |
| 75 Years and over | 0 (0.0%) | 30 (27.0%) |
Disability Class: Vision Difficulty
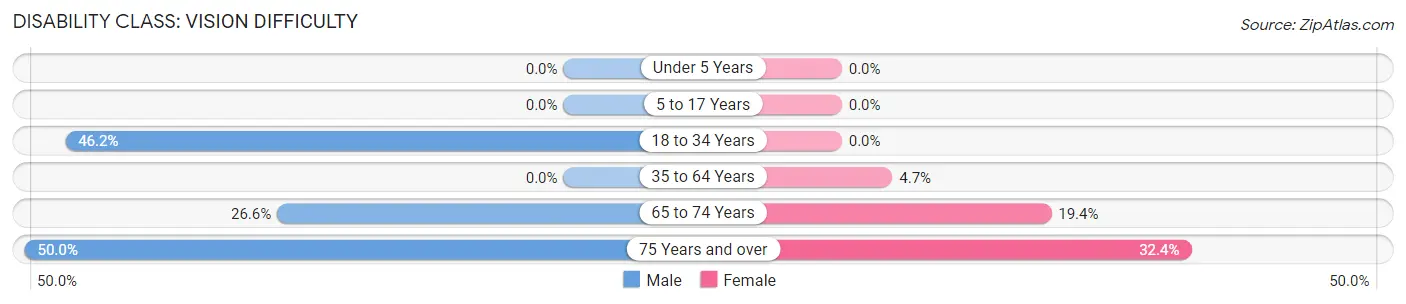
| Age Bracket | Male | Female |
| Under 5 Years | 0 (0.0%) | 0 (0.0%) |
| 5 to 17 Years | 0 (0.0%) | 0 (0.0%) |
| 18 to 34 Years | 49 (46.2%) | 0 (0.0%) |
| 35 to 64 Years | 0 (0.0%) | 15 (4.7%) |
| 65 to 74 Years | 38 (26.6%) | 14 (19.4%) |
| 75 Years and over | 26 (50.0%) | 36 (32.4%) |
Disability Class: Cognitive Difficulty
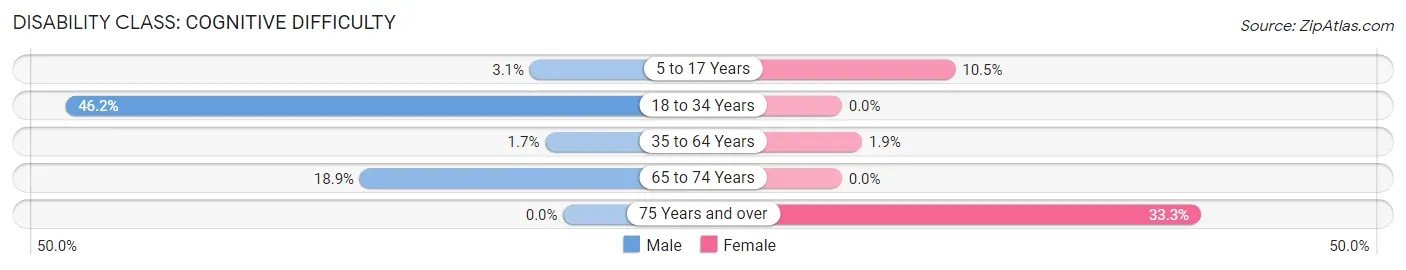
| Age Bracket | Male | Female |
| 5 to 17 Years | 6 (3.1%) | 14 (10.5%) |
| 18 to 34 Years | 49 (46.2%) | 0 (0.0%) |
| 35 to 64 Years | 7 (1.7%) | 6 (1.9%) |
| 65 to 74 Years | 27 (18.9%) | 0 (0.0%) |
| 75 Years and over | 0 (0.0%) | 37 (33.3%) |
Disability Class: Ambulatory Difficulty
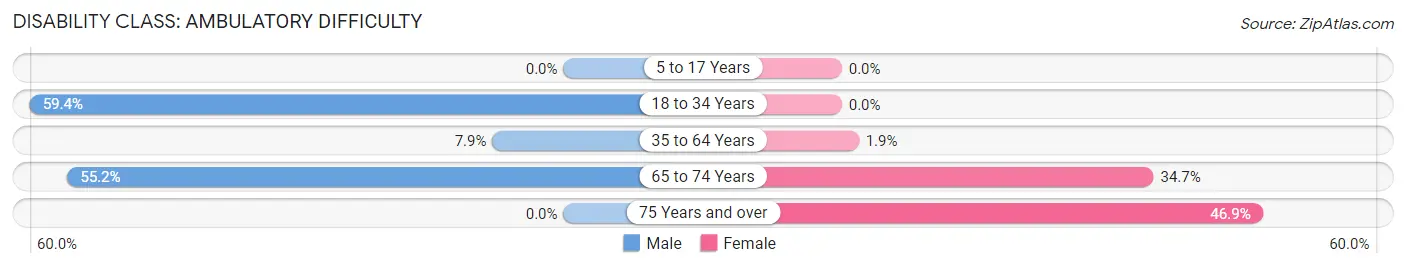
| Age Bracket | Male | Female |
| 5 to 17 Years | 0 (0.0%) | 0 (0.0%) |
| 18 to 34 Years | 63 (59.4%) | 0 (0.0%) |
| 35 to 64 Years | 33 (7.9%) | 6 (1.9%) |
| 65 to 74 Years | 79 (55.2%) | 25 (34.7%) |
| 75 Years and over | 0 (0.0%) | 52 (46.9%) |
Disability Class: Self-Care Difficulty
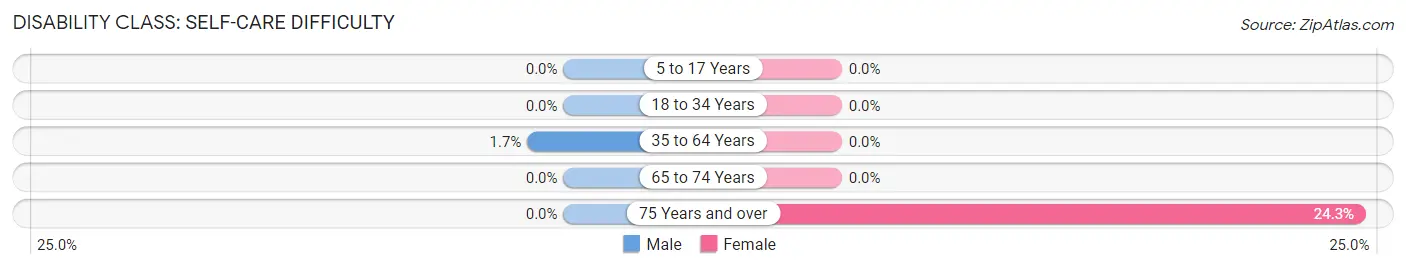
| Age Bracket | Male | Female |
| 5 to 17 Years | 0 (0.0%) | 0 (0.0%) |
| 18 to 34 Years | 0 (0.0%) | 0 (0.0%) |
| 35 to 64 Years | 7 (1.7%) | 0 (0.0%) |
| 65 to 74 Years | 0 (0.0%) | 0 (0.0%) |
| 75 Years and over | 0 (0.0%) | 27 (24.3%) |
Technology Access in Taft
Computing Device Access in Taft
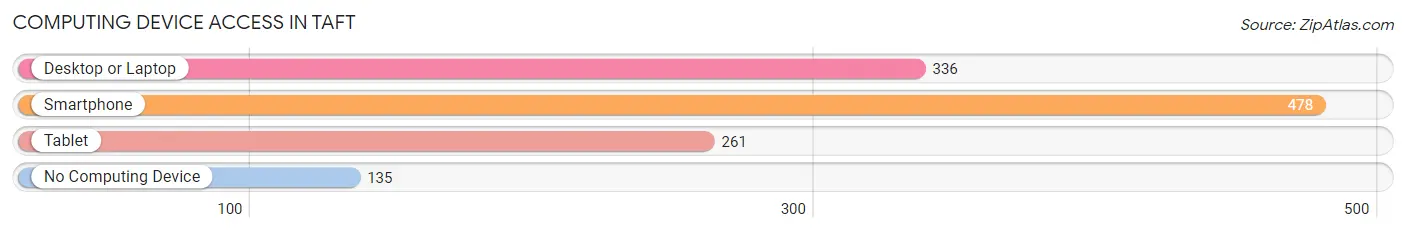
| Device Type | # Households | % Households |
| Desktop or Laptop | 336 | 52.2% |
| Smartphone | 478 | 74.2% |
| Tablet | 261 | 40.5% |
| No Computing Device | 135 | 21.0% |
| Total | 644 | 100.0% |
Internet Access in Taft
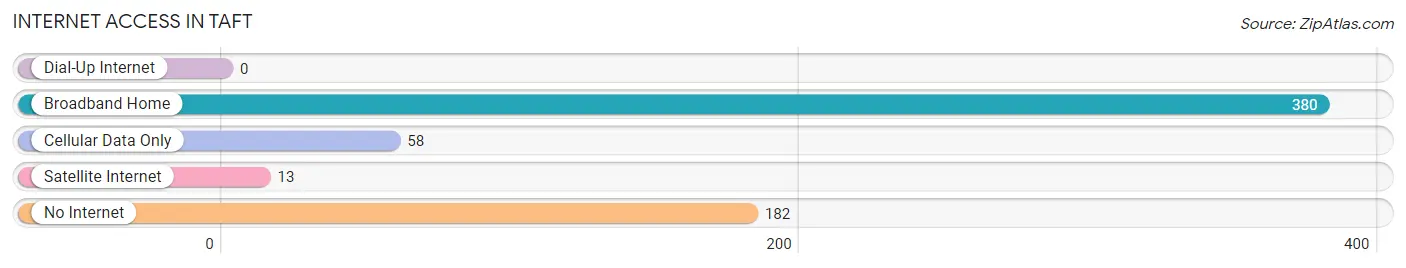
| Internet Type | # Households | % Households |
| Dial-Up Internet | 0 | 0.0% |
| Broadband Home | 380 | 59.0% |
| Cellular Data Only | 58 | 9.0% |
| Satellite Internet | 13 | 2.0% |
| No Internet | 182 | 28.3% |
| Total | 644 | 100.0% |
Taft Summary
Taft is a small unincorporated community located in the western part of Pasco County, Florida. It is situated on the banks of the Anclote River, about 25 miles north of Tampa. The population of Taft was estimated to be around 1,000 in 2020.
History
Taft was first settled in the late 1800s by a group of settlers from Georgia. The settlement was originally called “Taftville” after the first settler, William Taft. The settlement was later renamed “Taft” in honor of the Taft family.
In the early 1900s, Taft was a thriving agricultural community. The main crops grown in the area were oranges, grapefruit, and tangerines. The town also had a sawmill and a turpentine still.
In the 1920s, Taft began to experience a population boom due to the construction of the Anclote River Bridge. This bridge connected Taft to the rest of Pasco County and allowed for easier access to Tampa.
In the 1950s, Taft experienced a decline in population due to the construction of the Cross-Florida Barge Canal. This canal diverted the Anclote River away from Taft, causing the town to become isolated.
Geography
Taft is located in western Pasco County, Florida. It is situated on the banks of the Anclote River, about 25 miles north of Tampa. The town is surrounded by the Anclote River State Park and the Anclote River Wildlife Management Area.
The terrain of Taft is mostly flat, with some rolling hills. The soil is sandy and the climate is humid subtropical. The average temperature in Taft is around 70 degrees Fahrenheit.
Economy
Taft’s economy is largely based on agriculture. The main crops grown in the area are oranges, grapefruit, and tangerines. The town also has a sawmill and a turpentine still.
In recent years, Taft has become a popular destination for tourists. The town is home to several popular attractions, including the Anclote River State Park and the Anclote River Wildlife Management Area.
Demographics
As of 2020, the population of Taft was estimated to be around 1,000. The racial makeup of the town is predominantly white (90.2%), followed by Hispanic or Latino (7.2%), and African American (2.6%).
The median household income in Taft is $41,250, and the median home value is $117,000. The town has a poverty rate of 16.2%.
Conclusion
Taft is a small unincorporated community located in the western part of Pasco County, Florida. It is situated on the banks of the Anclote River, about 25 miles north of Tampa. The population of Taft was estimated to be around 1,000 in 2020. The town’s economy is largely based on agriculture, and it has become a popular destination for tourists in recent years. The racial makeup of the town is predominantly white, followed by Hispanic or Latino and African American. The median household income in Taft is $41,250, and the median home value is $117,000.
Common Questions
What is Per Capita Income in Taft?
Per Capita income in Taft is $21,939.
What is the Median Family Income in Taft?
Median Family Income in Taft is $36,824.
What is the Median Household income in Taft?
Median Household Income in Taft is $40,536.
What is Income or Wage Gap in Taft?
Income or Wage Gap in Taft is 57.1%.
Women in Taft earn 42.9 cents for every dollar earned by a man.
What is Inequality or Gini Index in Taft?
Inequality or Gini Index in Taft is 0.36.
What is the Total Population of Taft?
Total Population of Taft is 1,604.
What is the Total Male Population of Taft?
Total Male Population of Taft is 919.
What is the Total Female Population of Taft?
Total Female Population of Taft is 685.
What is the Ratio of Males per 100 Females in Taft?
There are 134.16 Males per 100 Females in Taft.
What is the Ratio of Females per 100 Males in Taft?
There are 74.54 Females per 100 Males in Taft.
What is the Median Population Age in Taft?
Median Population Age in Taft is 50.1 Years.
What is the Average Family Size in Taft
Average Family Size in Taft is 3.0 People.
What is the Average Household Size in Taft
Average Household Size in Taft is 2.5 People.
How Large is the Labor Force in Taft?
There are 725 People in the Labor Forcein in Taft.
What is the Percentage of People in the Labor Force in Taft?
54.6% of People are in the Labor Force in Taft.
What is the Unemployment Rate in Taft?
Unemployment Rate in Taft is 1.8%.