Wewahitchka, FL Map & Demographics
Wewahitchka Map
Wewahitchka Overview
$23,631
PER CAPITA INCOME
$48,750
AVG FAMILY INCOME
$43,287
AVG HOUSEHOLD INCOME
50.0%
WAGE / INCOME GAP [ % ]
50.0¢/ $1
WAGE / INCOME GAP [ $ ]
0.41
INEQUALITY / GINI INDEX
1,668
TOTAL POPULATION
788
MALE POPULATION
880
FEMALE POPULATION
89.55
MALES / 100 FEMALES
111.68
FEMALES / 100 MALES
36.3
MEDIAN AGE
3.0
AVG FAMILY SIZE
2.3
AVG HOUSEHOLD SIZE
796
LABOR FORCE [ PEOPLE ]
60.8%
PERCENT IN LABOR FORCE
3.4%
UNEMPLOYMENT RATE
Wewahitchka Area Codes
Income in Wewahitchka
Income Overview in Wewahitchka
Per Capita Income in Wewahitchka is $23,631, while median incomes of families and households are $48,750 and $43,287 respectively.
| Characteristic | Number | Measure |
| Per Capita Income | 1,668 | $23,631 |
| Median Family Income | 437 | $48,750 |
| Mean Family Income | 437 | $63,816 |
| Median Household Income | 739 | $43,287 |
| Mean Household Income | 739 | $53,627 |
| Income Deficit | 437 | $0 |
| Wage / Income Gap (%) | 1,668 | 50.00% |
| Wage / Income Gap ($) | 1,668 | 50.00¢ per $1 |
| Gini / Inequality Index | 1,668 | 0.41 |
Earnings by Sex in Wewahitchka
Average Earnings in Wewahitchka are $33,953, $43,023 for men and $21,513 for women, a difference of 50.0%.
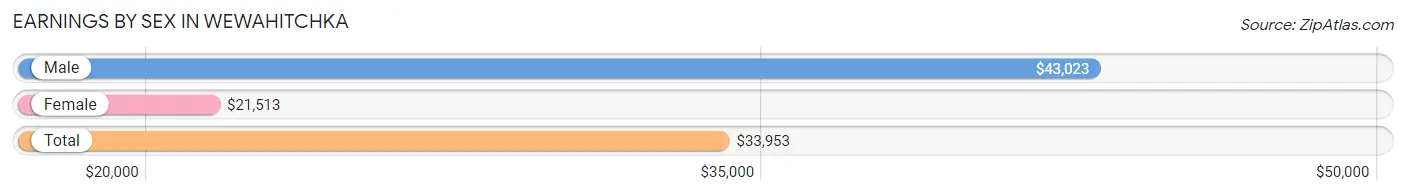
| Sex | Number | Average Earnings |
| Male | 383 (45.5%) | $43,023 |
| Female | 459 (54.5%) | $21,513 |
| Total | 842 (100.0%) | $33,953 |
Earnings by Sex by Income Bracket in Wewahitchka
The most common earnings brackets in Wewahitchka are $40,000 to $44,999 for men (74 | 19.3%) and $40,000 to $44,999 for women (57 | 12.4%).
| Income | Male | Female |
| $2,499 or less | 9 (2.4%) | 51 (11.1%) |
| $2,500 to $4,999 | 0 (0.0%) | 15 (3.3%) |
| $5,000 to $7,499 | 0 (0.0%) | 39 (8.5%) |
| $7,500 to $9,999 | 0 (0.0%) | 7 (1.5%) |
| $10,000 to $12,499 | 4 (1.0%) | 50 (10.9%) |
| $12,500 to $14,999 | 17 (4.4%) | 16 (3.5%) |
| $15,000 to $17,499 | 15 (3.9%) | 16 (3.5%) |
| $17,500 to $19,999 | 0 (0.0%) | 24 (5.2%) |
| $20,000 to $22,499 | 0 (0.0%) | 19 (4.1%) |
| $22,500 to $24,999 | 25 (6.5%) | 21 (4.6%) |
| $25,000 to $29,999 | 41 (10.7%) | 23 (5.0%) |
| $30,000 to $34,999 | 30 (7.8%) | 17 (3.7%) |
| $35,000 to $39,999 | 20 (5.2%) | 22 (4.8%) |
| $40,000 to $44,999 | 74 (19.3%) | 57 (12.4%) |
| $45,000 to $49,999 | 41 (10.7%) | 43 (9.4%) |
| $50,000 to $54,999 | 14 (3.7%) | 21 (4.6%) |
| $55,000 to $64,999 | 33 (8.6%) | 9 (2.0%) |
| $65,000 to $74,999 | 26 (6.8%) | 5 (1.1%) |
| $75,000 to $99,999 | 34 (8.9%) | 0 (0.0%) |
| $100,000+ | 0 (0.0%) | 4 (0.9%) |
| Total | 383 (100.0%) | 459 (100.0%) |
Earnings by Sex by Educational Attainment in Wewahitchka
Average earnings in Wewahitchka are $42,875 for men and $25,652 for women, a difference of 40.2%. Men with an educational attainment of bachelor's degree enjoy the highest average annual earnings of $91,875, while those with high school diploma education earn the least with $34,167. Women with an educational attainment of bachelor's degree earn the most with the average annual earnings of $43,563, while those with less than high school education have the smallest earnings of $9,643.
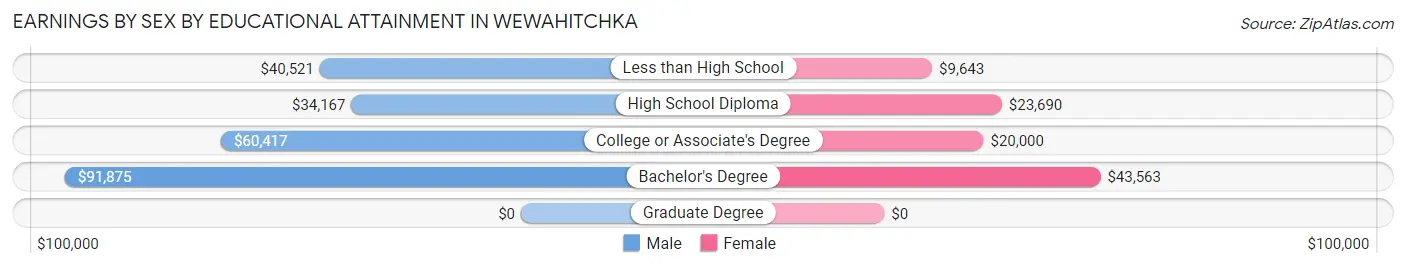
| Educational Attainment | Male Income | Female Income |
| Less than High School | $40,521 | $9,643 |
| High School Diploma | $34,167 | $23,690 |
| College or Associate's Degree | $60,417 | $20,000 |
| Bachelor's Degree | $91,875 | $43,563 |
| Graduate Degree | - | - |
| Total | $42,875 | $25,652 |
Family Income in Wewahitchka
Family Income Brackets in Wewahitchka
According to the Wewahitchka family income data, there are 81 families falling into the $15,000 to $24,999 income range, which is the most common income bracket and makes up 18.5% of all families. Conversely, the $150,000 to $199,999 income bracket is the least frequent group with only 4 families (0.9%) belonging to this category.
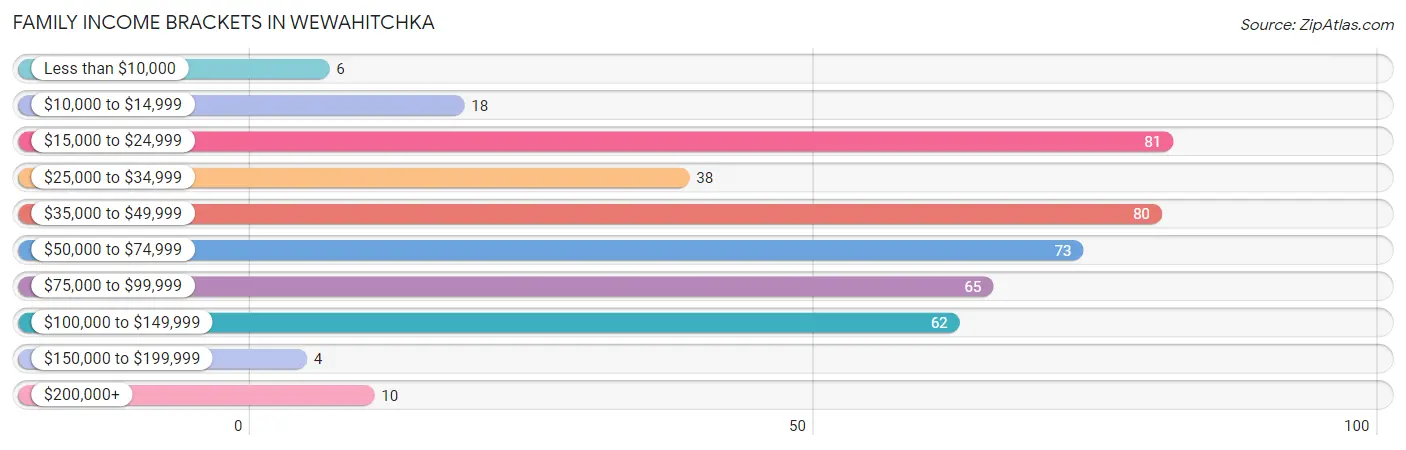
| Income Bracket | # Families | % Families |
| Less than $10,000 | 6 | 1.4% |
| $10,000 to $14,999 | 18 | 4.1% |
| $15,000 to $24,999 | 81 | 18.5% |
| $25,000 to $34,999 | 38 | 8.7% |
| $35,000 to $49,999 | 80 | 18.3% |
| $50,000 to $74,999 | 73 | 16.7% |
| $75,000 to $99,999 | 65 | 14.9% |
| $100,000 to $149,999 | 62 | 14.2% |
| $150,000 to $199,999 | 4 | 0.9% |
| $200,000+ | 10 | 2.3% |
Family Income by Famaliy Size in Wewahitchka
3-person families (122 | 27.9%) account for the highest median family income in Wewahitchka with $103,056 per family, while 3-person families (122 | 27.9%) have the highest median income of $34,352 per family member.
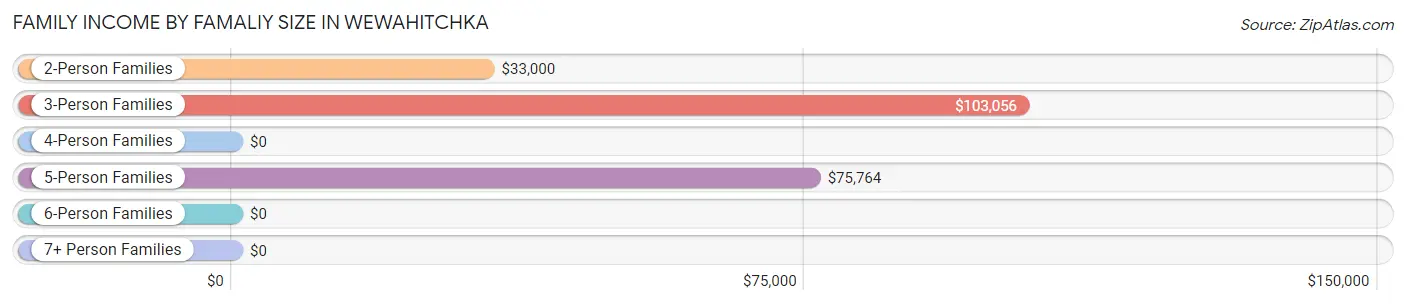
| Income Bracket | # Families | Median Income |
| 2-Person Families | 166 (38.0%) | $33,000 |
| 3-Person Families | 122 (27.9%) | $103,056 |
| 4-Person Families | 87 (19.9%) | $0 |
| 5-Person Families | 41 (9.4%) | $75,764 |
| 6-Person Families | 6 (1.4%) | $0 |
| 7+ Person Families | 15 (3.4%) | $0 |
| Total | 437 (100.0%) | $48,750 |
Family Income by Number of Earners in Wewahitchka
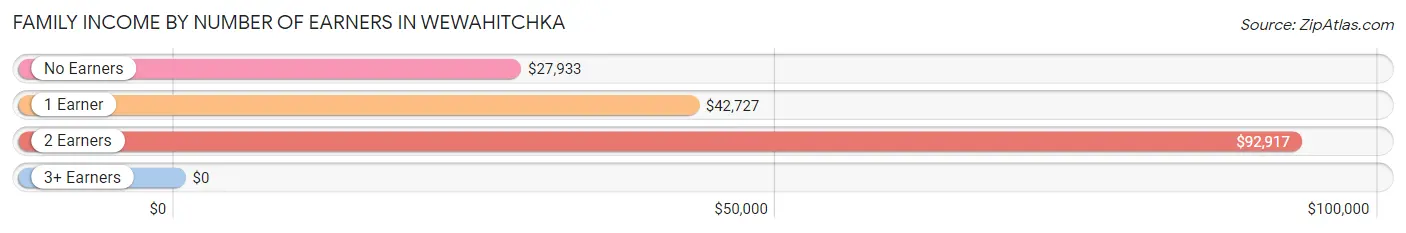
| Number of Earners | # Families | Median Income |
| No Earners | 95 (21.7%) | $27,933 |
| 1 Earner | 108 (24.7%) | $42,727 |
| 2 Earners | 203 (46.5%) | $92,917 |
| 3+ Earners | 31 (7.1%) | $0 |
| Total | 437 (100.0%) | $48,750 |
Household Income in Wewahitchka
Household Income Brackets in Wewahitchka
With 138 households falling in the category, the $15,000 to $24,999 income range is the most frequent in Wewahitchka, accounting for 18.7% of all households. In contrast, only 9 households (1.2%) fall into the $150,000 to $199,999 income bracket, making it the least populous group.
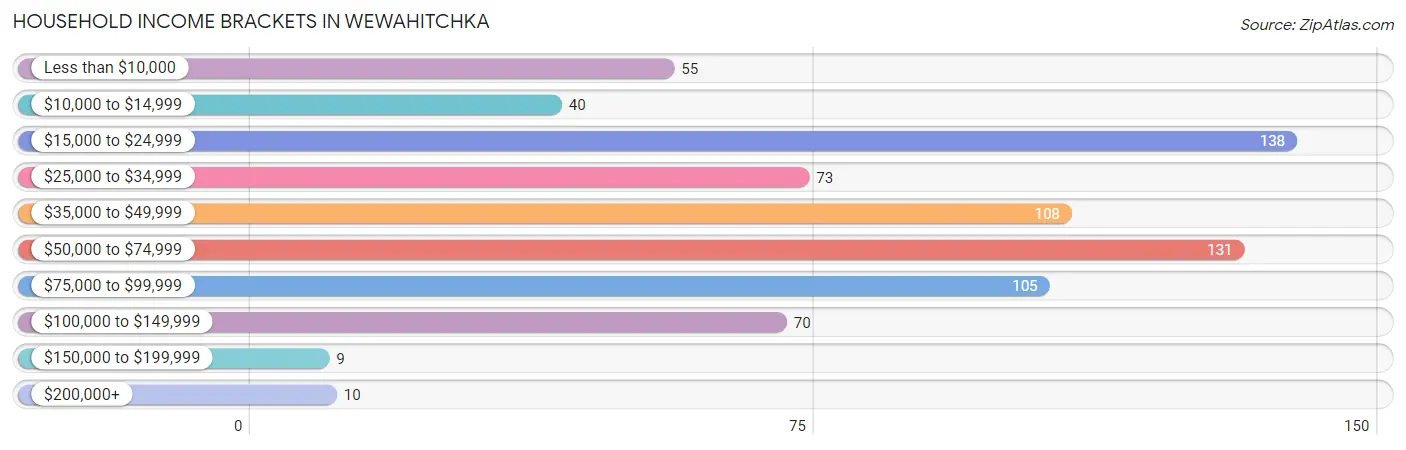
| Income Bracket | # Households | % Households |
| Less than $10,000 | 55 | 7.4% |
| $10,000 to $14,999 | 40 | 5.4% |
| $15,000 to $24,999 | 138 | 18.7% |
| $25,000 to $34,999 | 73 | 9.9% |
| $35,000 to $49,999 | 108 | 14.6% |
| $50,000 to $74,999 | 131 | 17.7% |
| $75,000 to $99,999 | 105 | 14.2% |
| $100,000 to $149,999 | 70 | 9.5% |
| $150,000 to $199,999 | 9 | 1.2% |
| $200,000+ | 10 | 1.4% |
Household Income by Householder Age in Wewahitchka
The median household income in Wewahitchka is $43,287, with the highest median household income of $70,882 found in the 25 to 44 years age bracket for the primary householder. A total of 162 households (21.9%) fall into this category. Meanwhile, the 15 to 24 years age bracket for the primary householder has the lowest median household income of $0, with 69 households (9.3%) in this group.
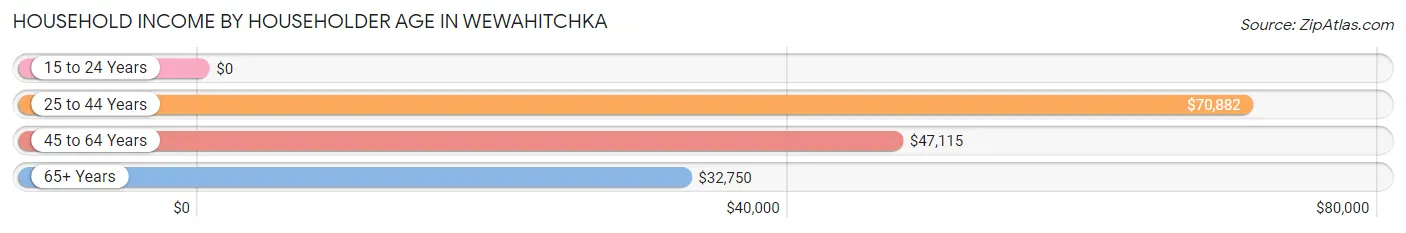
| Income Bracket | # Households | Median Income |
| 15 to 24 Years | 69 (9.3%) | $0 |
| 25 to 44 Years | 162 (21.9%) | $70,882 |
| 45 to 64 Years | 290 (39.2%) | $47,115 |
| 65+ Years | 218 (29.5%) | $32,750 |
| Total | 739 (100.0%) | $43,287 |
Poverty in Wewahitchka
Income Below Poverty by Sex and Age in Wewahitchka
With 9.1% poverty level for males and 23.2% for females among the residents of Wewahitchka, 12 to 14 year old males and 5 year old females are the most vulnerable to poverty, with 5 males (35.7%) and 3 females (100.0%) in their respective age groups living below the poverty level.
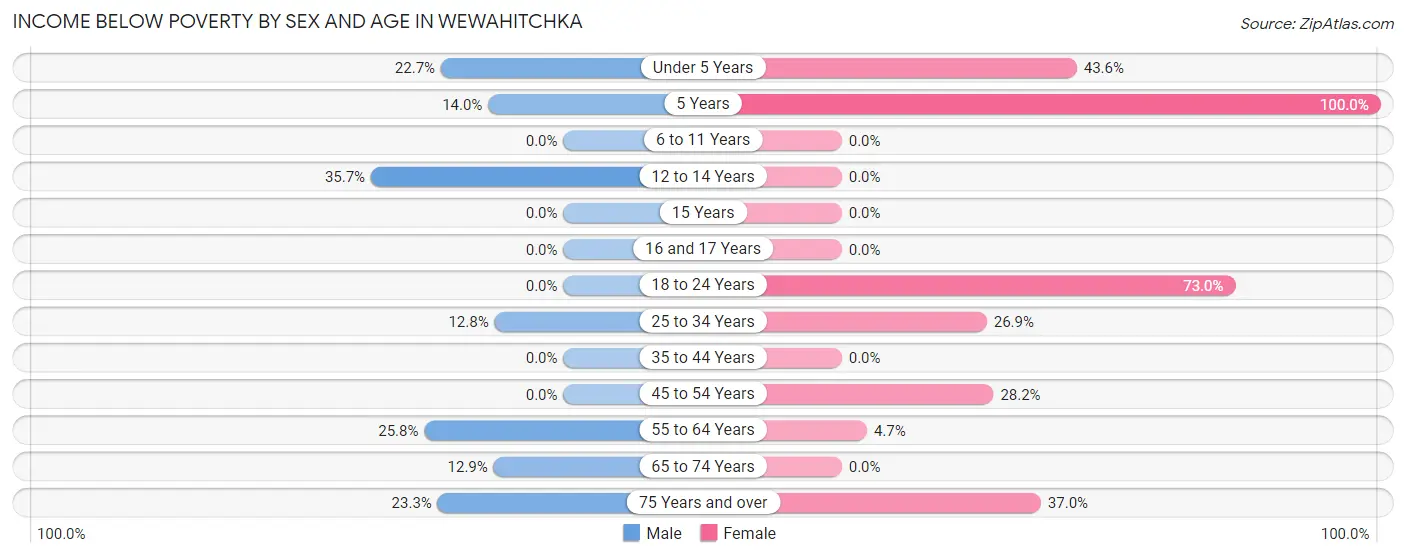
| Age Bracket | Male | Female |
| Under 5 Years | 10 (22.7%) | 41 (43.6%) |
| 5 Years | 6 (14.0%) | 3 (100.0%) |
| 6 to 11 Years | 0 (0.0%) | 0 (0.0%) |
| 12 to 14 Years | 5 (35.7%) | 0 (0.0%) |
| 15 Years | 0 (0.0%) | 0 (0.0%) |
| 16 and 17 Years | 0 (0.0%) | 0 (0.0%) |
| 18 to 24 Years | 0 (0.0%) | 65 (73.0%) |
| 25 to 34 Years | 17 (12.8%) | 35 (26.9%) |
| 35 to 44 Years | 0 (0.0%) | 0 (0.0%) |
| 45 to 54 Years | 0 (0.0%) | 38 (28.1%) |
| 55 to 64 Years | 16 (25.8%) | 5 (4.7%) |
| 65 to 74 Years | 11 (12.9%) | 0 (0.0%) |
| 75 Years and over | 7 (23.3%) | 17 (37.0%) |
| Total | 72 (9.1%) | 204 (23.2%) |
Income Above Poverty by Sex and Age in Wewahitchka
According to the poverty statistics in Wewahitchka, males aged 6 to 11 years and females aged 6 to 11 years are the age groups that are most secure financially, with 100.0% of males and 100.0% of females in these age groups living above the poverty line.
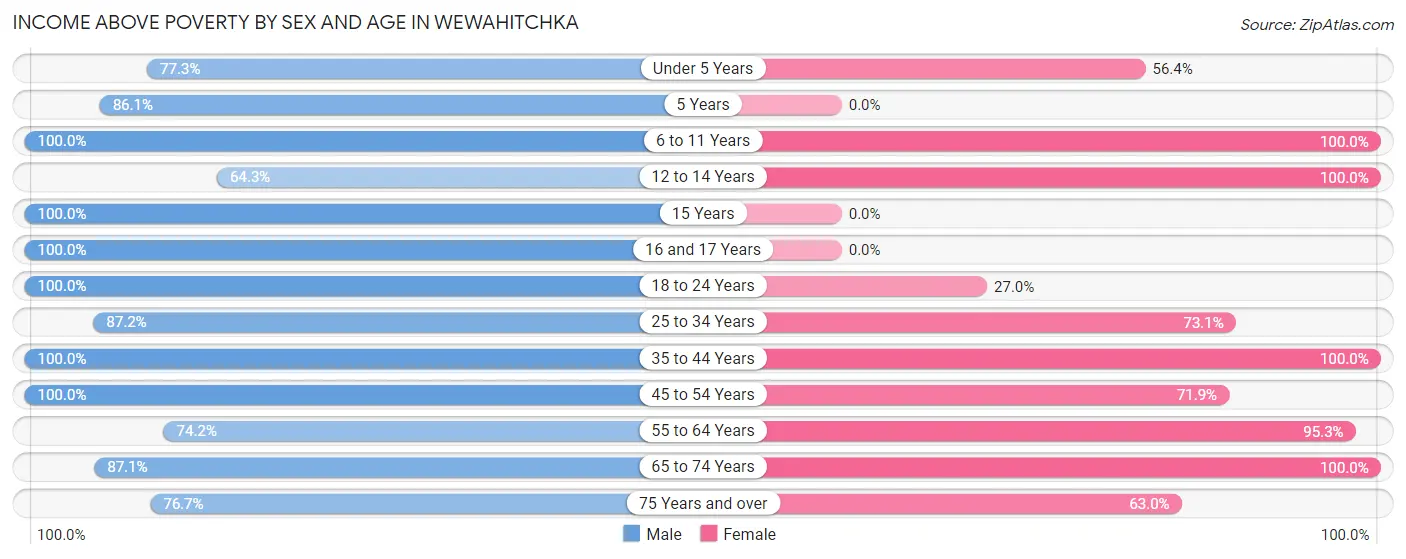
| Age Bracket | Male | Female |
| Under 5 Years | 34 (77.3%) | 53 (56.4%) |
| 5 Years | 37 (86.1%) | 0 (0.0%) |
| 6 to 11 Years | 65 (100.0%) | 52 (100.0%) |
| 12 to 14 Years | 9 (64.3%) | 26 (100.0%) |
| 15 Years | 17 (100.0%) | 0 (0.0%) |
| 16 and 17 Years | 35 (100.0%) | 0 (0.0%) |
| 18 to 24 Years | 55 (100.0%) | 24 (27.0%) |
| 25 to 34 Years | 116 (87.2%) | 95 (73.1%) |
| 35 to 44 Years | 89 (100.0%) | 86 (100.0%) |
| 45 to 54 Years | 116 (100.0%) | 97 (71.9%) |
| 55 to 64 Years | 46 (74.2%) | 102 (95.3%) |
| 65 to 74 Years | 74 (87.1%) | 112 (100.0%) |
| 75 Years and over | 23 (76.7%) | 29 (63.0%) |
| Total | 716 (90.9%) | 676 (76.8%) |
Income Below Poverty Among Married-Couple Families in Wewahitchka
The poverty statistics for married-couple families in Wewahitchka show that 13.7% or 38 of the total 277 families live below the poverty line. Families with 1 or 2 children have the highest poverty rate of 31.9%, comprising of 38 families. On the other hand, families with no children have the lowest poverty rate of 0.0%, which includes 0 families.
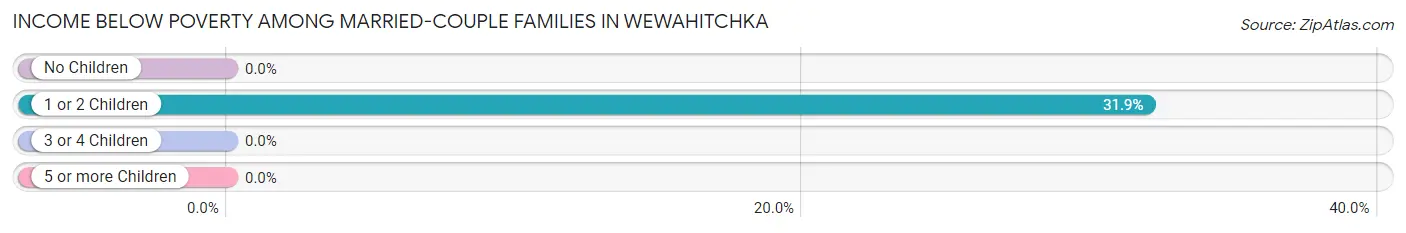
| Children | Above Poverty | Below Poverty |
| No Children | 125 (100.0%) | 0 (0.0%) |
| 1 or 2 Children | 81 (68.1%) | 38 (31.9%) |
| 3 or 4 Children | 29 (100.0%) | 0 (0.0%) |
| 5 or more Children | 4 (100.0%) | 0 (0.0%) |
| Total | 239 (86.3%) | 38 (13.7%) |
Income Below Poverty Among Single-Parent Households in Wewahitchka
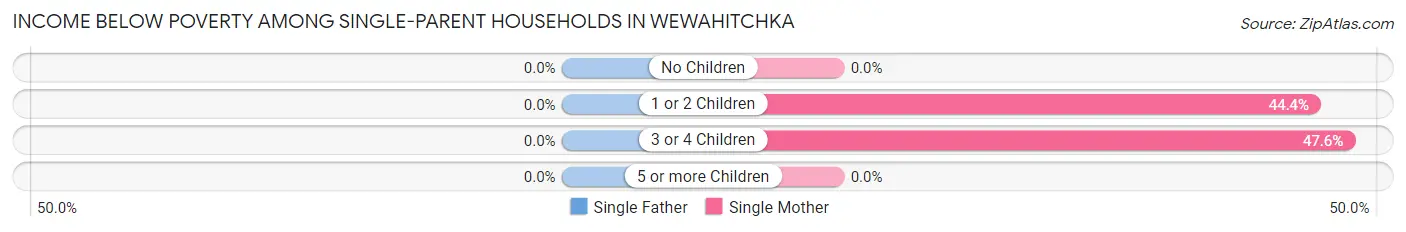
| Children | Single Father | Single Mother |
| No Children | 0 (0.0%) | 0 (0.0%) |
| 1 or 2 Children | 0 (0.0%) | 24 (44.4%) |
| 3 or 4 Children | 0 (0.0%) | 10 (47.6%) |
| 5 or more Children | 0 (0.0%) | 0 (0.0%) |
| Total | 0 (0.0%) | 34 (25.6%) |
Income Below Poverty Among Married-Couple vs Single-Parent Households in Wewahitchka
The poverty data for Wewahitchka shows that 38 of the married-couple family households (13.7%) and 34 of the single-parent households (21.2%) are living below the poverty level. Within the married-couple family households, those with 1 or 2 children have the highest poverty rate, with 38 households (31.9%) falling below the poverty line. Among the single-parent households, those with 3 or 4 children have the highest poverty rate, with 10 household (47.6%) living below poverty.
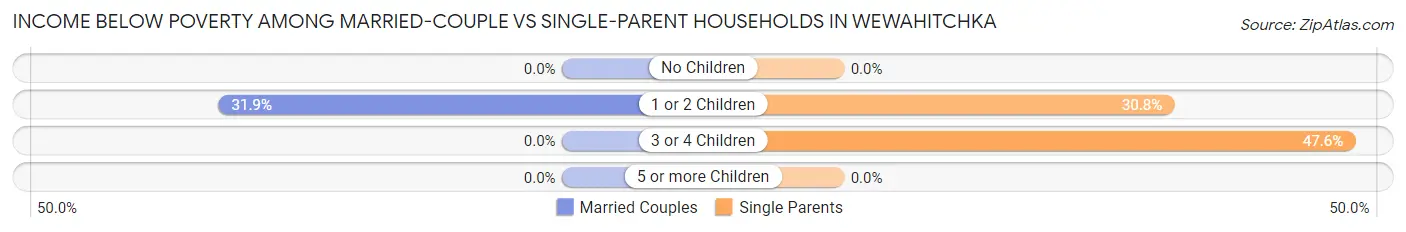
| Children | Married-Couple Families | Single-Parent Households |
| No Children | 0 (0.0%) | 0 (0.0%) |
| 1 or 2 Children | 38 (31.9%) | 24 (30.8%) |
| 3 or 4 Children | 0 (0.0%) | 10 (47.6%) |
| 5 or more Children | 0 (0.0%) | 0 (0.0%) |
| Total | 38 (13.7%) | 34 (21.2%) |
Race in Wewahitchka
The most populous races in Wewahitchka are White / Caucasian (1,478 | 88.6%), Two or more Races (104 | 6.2%), and Native / Alaskan (34 | 2.0%).
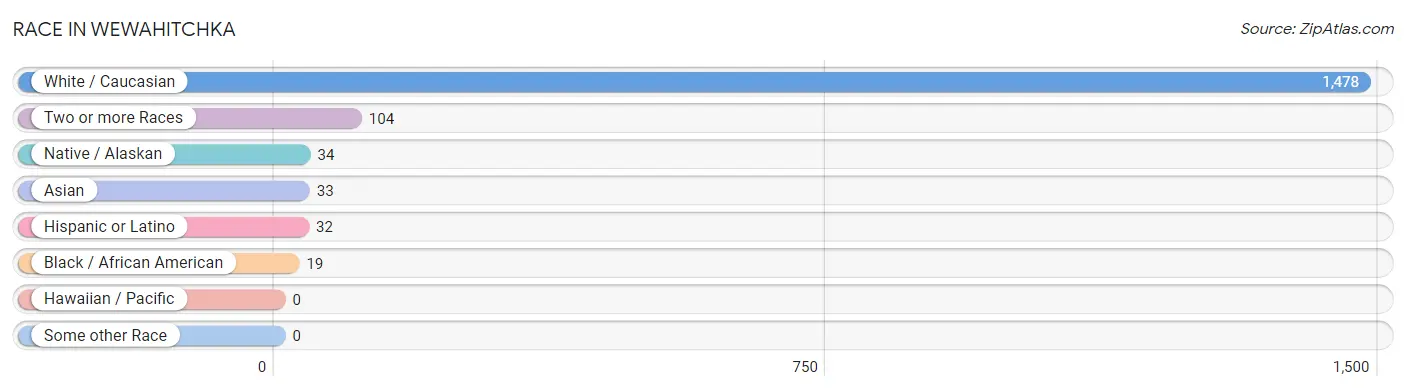
| Race | # Population | % Population |
| Asian | 33 | 2.0% |
| Black / African American | 19 | 1.1% |
| Hawaiian / Pacific | 0 | 0.0% |
| Hispanic or Latino | 32 | 1.9% |
| Native / Alaskan | 34 | 2.0% |
| White / Caucasian | 1,478 | 88.6% |
| Two or more Races | 104 | 6.2% |
| Some other Race | 0 | 0.0% |
| Total | 1,668 | 100.0% |
Ancestry in Wewahitchka
The most populous ancestries reported in Wewahitchka are Irish (189 | 11.3%), German (121 | 7.2%), American (114 | 6.8%), English (83 | 5.0%), and Cherokee (66 | 4.0%), together accounting for 34.4% of all Wewahitchka residents.
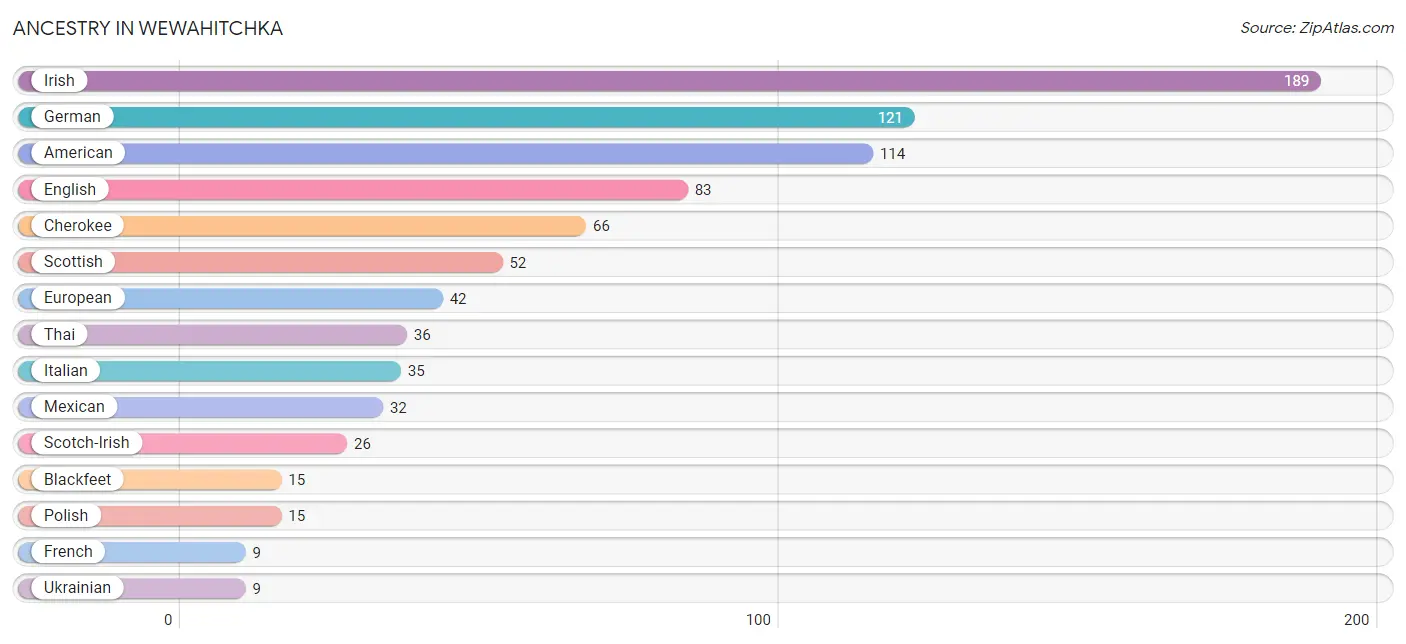
| Ancestry | # Population | % Population |
| American | 114 | 6.8% |
| Apache | 4 | 0.2% |
| Arab | 8 | 0.5% |
| Blackfeet | 15 | 0.9% |
| British | 6 | 0.4% |
| Cherokee | 66 | 4.0% |
| English | 83 | 5.0% |
| European | 42 | 2.5% |
| French | 9 | 0.5% |
| German | 121 | 7.2% |
| Irish | 189 | 11.3% |
| Italian | 35 | 2.1% |
| Jordanian | 8 | 0.5% |
| Mexican | 32 | 1.9% |
| Polish | 15 | 0.9% |
| Scotch-Irish | 26 | 1.6% |
| Scottish | 52 | 3.1% |
| Thai | 36 | 2.2% |
| Ukrainian | 9 | 0.5% | View All 19 Rows |
Immigrants in Wewahitchka
The most numerous immigrant groups reported in Wewahitchka came from Asia (8 | 0.5%), Jordan (8 | 0.5%), and Western Asia (8 | 0.5%), together accounting for 1.4% of all Wewahitchka residents.
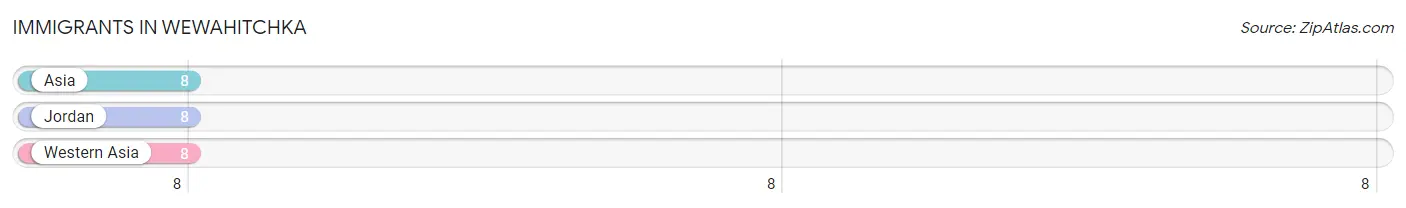
| Immigration Origin | # Population | % Population |
| Asia | 8 | 0.5% |
| Jordan | 8 | 0.5% |
| Western Asia | 8 | 0.5% | View All 3 Rows |
Sex and Age in Wewahitchka
Sex and Age in Wewahitchka
The most populous age groups in Wewahitchka are 35 to 39 Years (78 | 9.9%) for men and Under 5 Years (94 | 10.7%) for women.
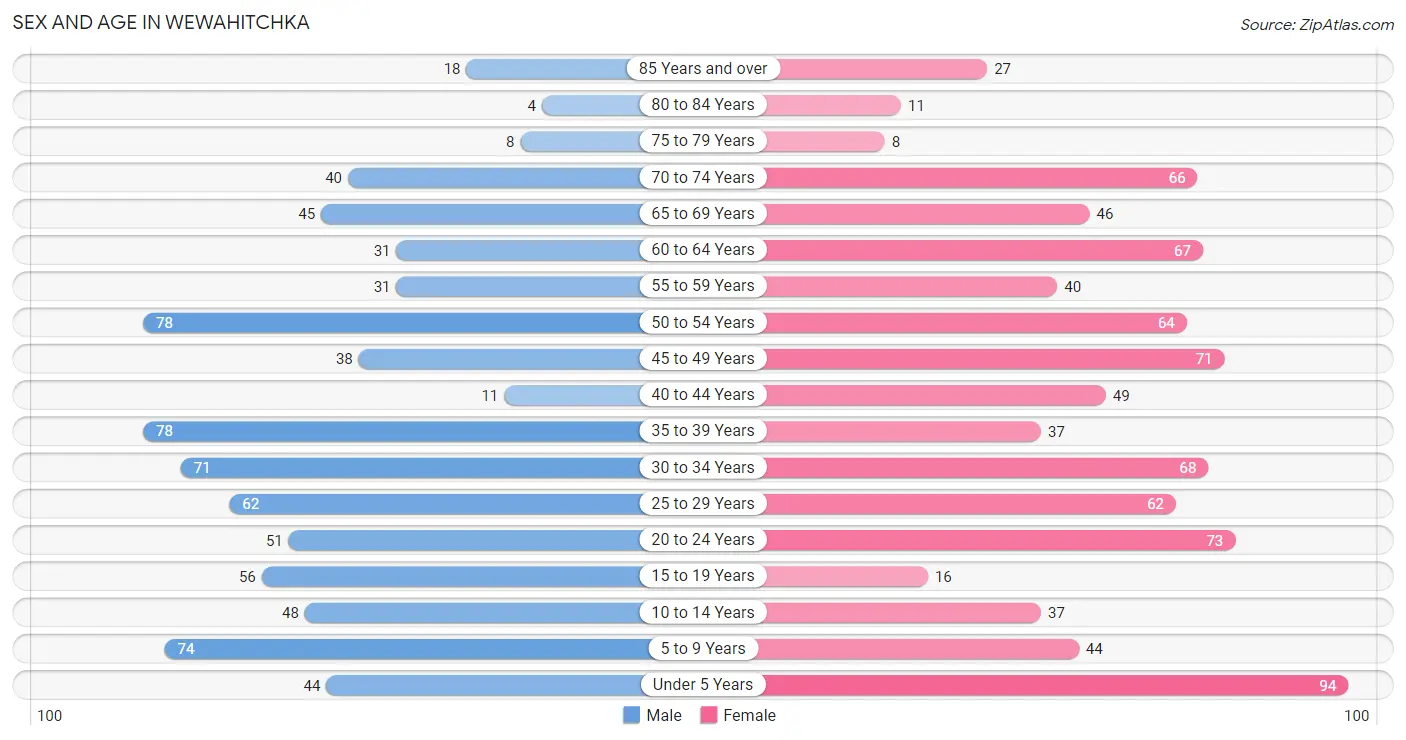
| Age Bracket | Male | Female |
| Under 5 Years | 44 (5.6%) | 94 (10.7%) |
| 5 to 9 Years | 74 (9.4%) | 44 (5.0%) |
| 10 to 14 Years | 48 (6.1%) | 37 (4.2%) |
| 15 to 19 Years | 56 (7.1%) | 16 (1.8%) |
| 20 to 24 Years | 51 (6.5%) | 73 (8.3%) |
| 25 to 29 Years | 62 (7.9%) | 62 (7.0%) |
| 30 to 34 Years | 71 (9.0%) | 68 (7.7%) |
| 35 to 39 Years | 78 (9.9%) | 37 (4.2%) |
| 40 to 44 Years | 11 (1.4%) | 49 (5.6%) |
| 45 to 49 Years | 38 (4.8%) | 71 (8.1%) |
| 50 to 54 Years | 78 (9.9%) | 64 (7.3%) |
| 55 to 59 Years | 31 (3.9%) | 40 (4.5%) |
| 60 to 64 Years | 31 (3.9%) | 67 (7.6%) |
| 65 to 69 Years | 45 (5.7%) | 46 (5.2%) |
| 70 to 74 Years | 40 (5.1%) | 66 (7.5%) |
| 75 to 79 Years | 8 (1.0%) | 8 (0.9%) |
| 80 to 84 Years | 4 (0.5%) | 11 (1.3%) |
| 85 Years and over | 18 (2.3%) | 27 (3.1%) |
| Total | 788 (100.0%) | 880 (100.0%) |
Families and Households in Wewahitchka
Median Family Size in Wewahitchka
The median family size in Wewahitchka is 3.00 persons per family, with married-couple families (277 | 63.4%) accounting for the largest median family size of 3.12 persons per family. On the other hand, single male/father families (27 | 6.2%) represent the smallest median family size with 2.19 persons per family.
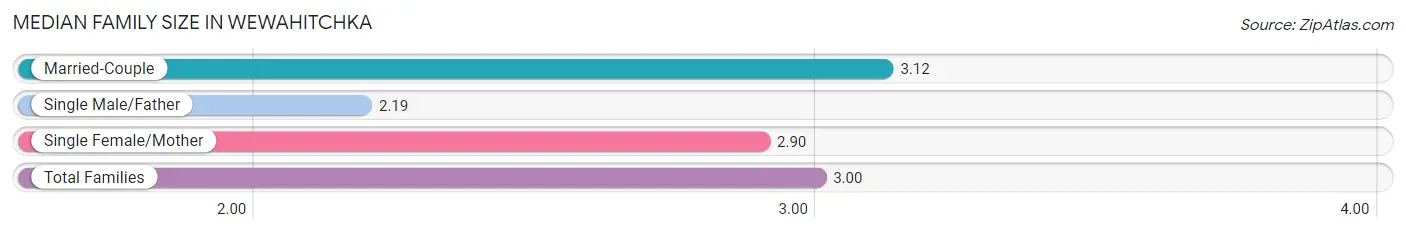
| Family Type | # Families | Family Size |
| Married-Couple | 277 (63.4%) | 3.12 |
| Single Male/Father | 27 (6.2%) | 2.19 |
| Single Female/Mother | 133 (30.4%) | 2.90 |
| Total Families | 437 (100.0%) | 3.00 |
Median Household Size in Wewahitchka
The median household size in Wewahitchka is 2.26 persons per household, with married-couple households (277 | 37.5%) accounting for the largest median household size of 3.13 persons per household. non-family households (302 | 40.9%) represent the smallest median household size with 1.13 persons per household.
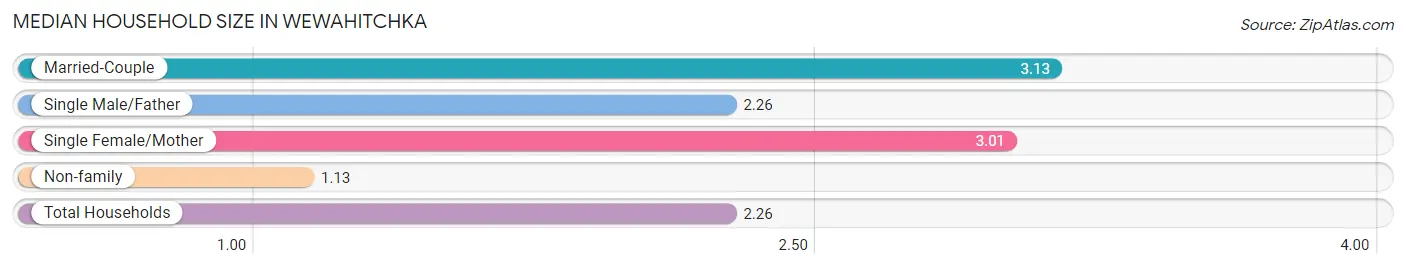
| Household Type | # Households | Household Size |
| Married-Couple | 277 (37.5%) | 3.13 |
| Single Male/Father | 27 (3.6%) | 2.26 |
| Single Female/Mother | 133 (18.0%) | 3.01 |
| Non-family | 302 (40.9%) | 1.13 |
| Total Households | 739 (100.0%) | 2.26 |
Household Size by Marriage Status in Wewahitchka
Out of a total of 739 households in Wewahitchka, 437 (59.1%) are family households, while 302 (40.9%) are nonfamily households. The most numerous type of family households are 2-person households, comprising 157, and the most common type of nonfamily households are 1-person households, comprising 250.
| Household Size | Family Households | Nonfamily Households |
| 1-Person Households | - | 250 (33.8%) |
| 2-Person Households | 157 (21.2%) | 52 (7.0%) |
| 3-Person Households | 115 (15.6%) | 0 (0.0%) |
| 4-Person Households | 103 (13.9%) | 0 (0.0%) |
| 5-Person Households | 41 (5.6%) | 0 (0.0%) |
| 6-Person Households | 6 (0.8%) | 0 (0.0%) |
| 7+ Person Households | 15 (2.0%) | 0 (0.0%) |
| Total | 437 (59.1%) | 302 (40.9%) |
Female Fertility in Wewahitchka
Fertility by Age in Wewahitchka
Average fertility rate in Wewahitchka is 26.0 births per 1,000 women. Women in the age bracket of 20 to 34 years have the highest fertility rate with 30.0 births per 1,000 women. Women in the age bracket of 20 to 34 years acount for 60.0% of all women with births.
| Age Bracket | Women with Births | Births / 1,000 Women |
| 15 to 19 years | 0 (0.0%) | 0.0 |
| 20 to 34 years | 6 (60.0%) | 30.0 |
| 35 to 50 years | 4 (40.0%) | 24.0 |
| Total | 10 (100.0%) | 26.0 |
Fertility by Age by Marriage Status in Wewahitchka
40.0% of women with births (10) in Wewahitchka are married. The highest percentage of unmarried women with births falls into 20 to 34 years age bracket with 100.0% of them unmarried at the time of birth, while the lowest percentage of unmarried women with births belong to 35 to 50 years age bracket with 0.0% of them unmarried.
| Age Bracket | Married | Unmarried |
| 15 to 19 years | 0 (0.0%) | 0 (0.0%) |
| 20 to 34 years | 0 (0.0%) | 6 (100.0%) |
| 35 to 50 years | 4 (100.0%) | 0 (0.0%) |
| Total | 4 (40.0%) | 6 (60.0%) |
Fertility by Education in Wewahitchka
| Educational Attainment | Women with Births | Births / 1,000 Women |
| Less than High School | 0 (0.0%) | 0.0 |
| High School Diploma | 6 (60.0%) | 43.0 |
| College or Associate's Degree | 4 (40.0%) | 38.0 |
| Bachelor's Degree | 0 (0.0%) | 0.0 |
| Graduate Degree | 0 (0.0%) | 0.0 |
| Total | 10 (100.0%) | 26.0 |
Fertility by Education by Marriage Status in Wewahitchka
60.0% of women with births in Wewahitchka are unmarried. Women with the educational attainment of college or associate's degree are most likely to be married with 100.0% of them married at childbirth, while women with the educational attainment of high school diploma are least likely to be married with 100.0% of them unmarried at childbirth.
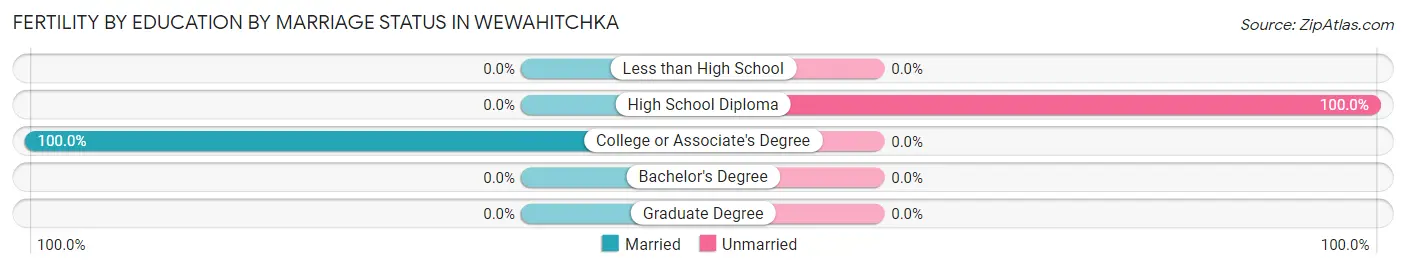
| Educational Attainment | Married | Unmarried |
| Less than High School | 0 (0.0%) | 0 (0.0%) |
| High School Diploma | 0 (0.0%) | 6 (100.0%) |
| College or Associate's Degree | 4 (100.0%) | 0 (0.0%) |
| Bachelor's Degree | 0 (0.0%) | 0 (0.0%) |
| Graduate Degree | 0 (0.0%) | 0 (0.0%) |
| Total | 4 (40.0%) | 6 (60.0%) |
Employment Characteristics in Wewahitchka
Employment by Class of Employer in Wewahitchka
Among the 764 employed individuals in Wewahitchka, private company employees (342 | 44.8%), local government employees (128 | 16.8%), and not-for-profit organizations (115 | 15.0%) make up the most common classes of employment.
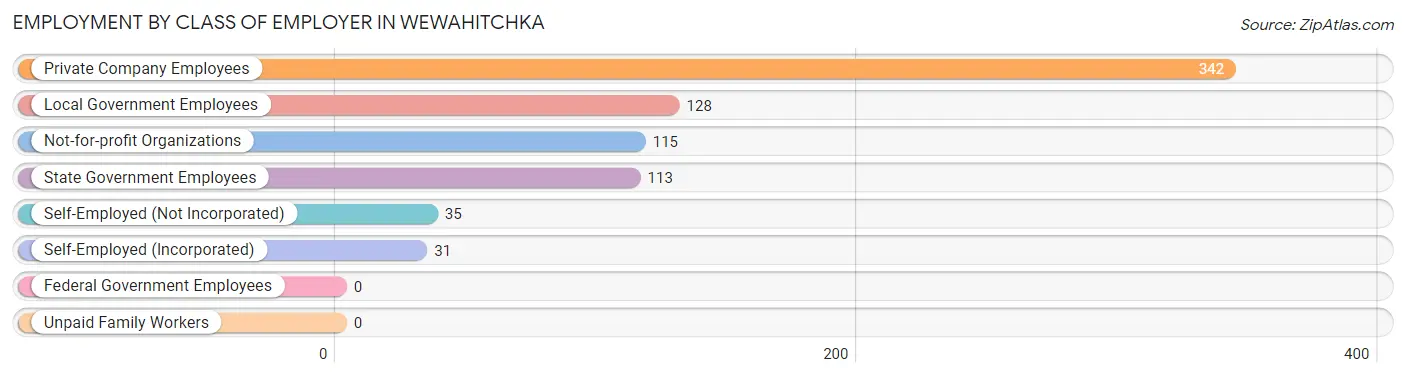
| Employer Class | # Employees | % Employees |
| Private Company Employees | 342 | 44.8% |
| Self-Employed (Incorporated) | 31 | 4.1% |
| Self-Employed (Not Incorporated) | 35 | 4.6% |
| Not-for-profit Organizations | 115 | 15.0% |
| Local Government Employees | 128 | 16.8% |
| State Government Employees | 113 | 14.8% |
| Federal Government Employees | 0 | 0.0% |
| Unpaid Family Workers | 0 | 0.0% |
| Total | 764 | 100.0% |
Employment Status by Age in Wewahitchka
According to the labor force statistics for Wewahitchka, out of the total population over 16 years of age (1,310), 60.8% or 796 individuals are in the labor force, with 3.4% or 27 of them unemployed. The age group with the highest labor force participation rate is 20 to 24 years, with 100.0% or 124 individuals in the labor force. Within the labor force, the 60 to 64 years age range has the highest percentage of unemployed individuals, with 16.7% or 10 of them being unemployed.
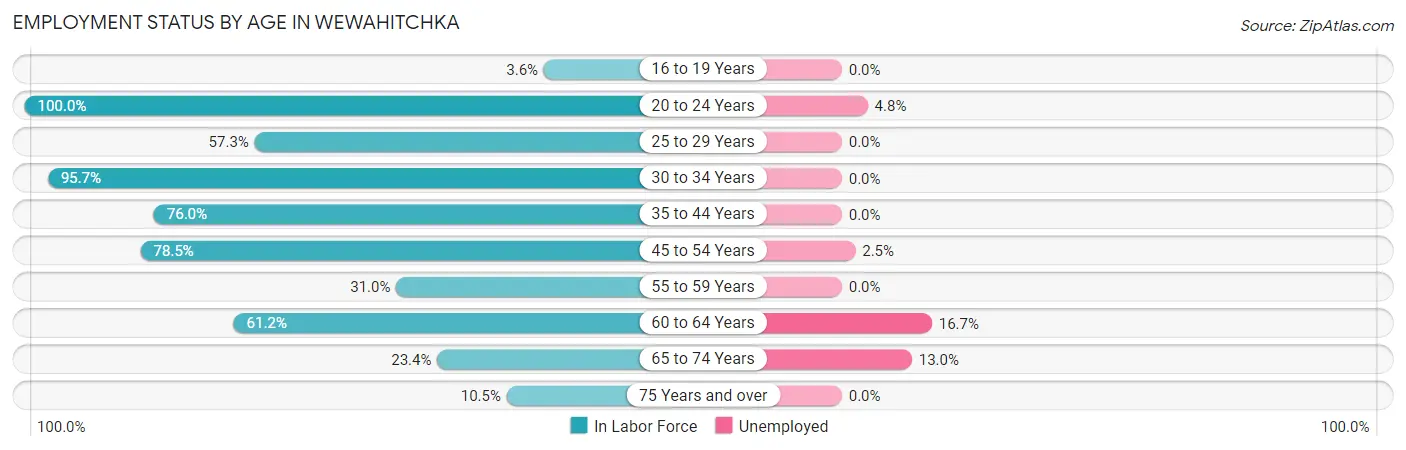
| Age Bracket | In Labor Force | Unemployed |
| 16 to 19 Years | 2 (3.6%) | 0 (0.0%) |
| 20 to 24 Years | 124 (100.0%) | 6 (4.8%) |
| 25 to 29 Years | 71 (57.3%) | 0 (0.0%) |
| 30 to 34 Years | 133 (95.7%) | 0 (0.0%) |
| 35 to 44 Years | 133 (76.0%) | 0 (0.0%) |
| 45 to 54 Years | 197 (78.5%) | 5 (2.5%) |
| 55 to 59 Years | 22 (31.0%) | 0 (0.0%) |
| 60 to 64 Years | 60 (61.2%) | 10 (16.7%) |
| 65 to 74 Years | 46 (23.4%) | 6 (13.0%) |
| 75 Years and over | 8 (10.5%) | 0 (0.0%) |
| Total | 796 (60.8%) | 27 (3.4%) |
Employment Status by Educational Attainment in Wewahitchka
According to labor force statistics for Wewahitchka, 71.8% of individuals (616) out of the total population between 25 and 64 years of age (858) are in the labor force, with 2.4% or 15 of them being unemployed. The group with the highest labor force participation rate are those with the educational attainment of bachelor's degree or higher, with 94.3% or 150 individuals in the labor force. Within the labor force, individuals with less than high school education have the highest percentage of unemployment, with 5.6% or 5 of them being unemployed.
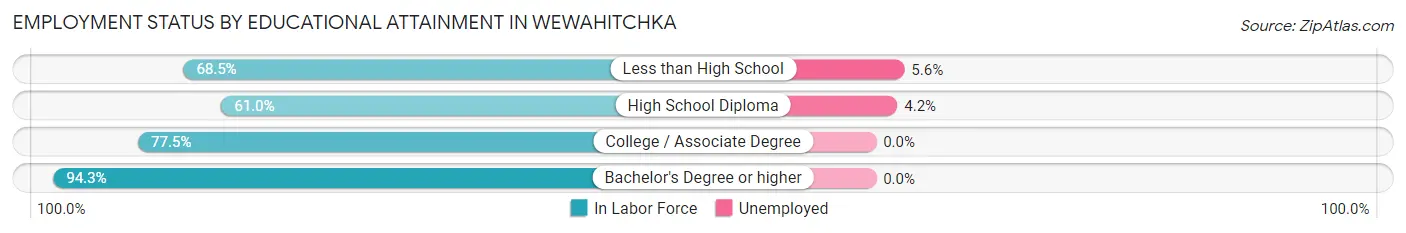
| Educational Attainment | In Labor Force | Unemployed |
| Less than High School | 89 (68.5%) | 7 (5.6%) |
| High School Diploma | 236 (61.0%) | 16 (4.2%) |
| College / Associate Degree | 141 (77.5%) | 0 (0.0%) |
| Bachelor's Degree or higher | 150 (94.3%) | 0 (0.0%) |
| Total | 616 (71.8%) | 21 (2.4%) |
Employment Occupations by Sex in Wewahitchka
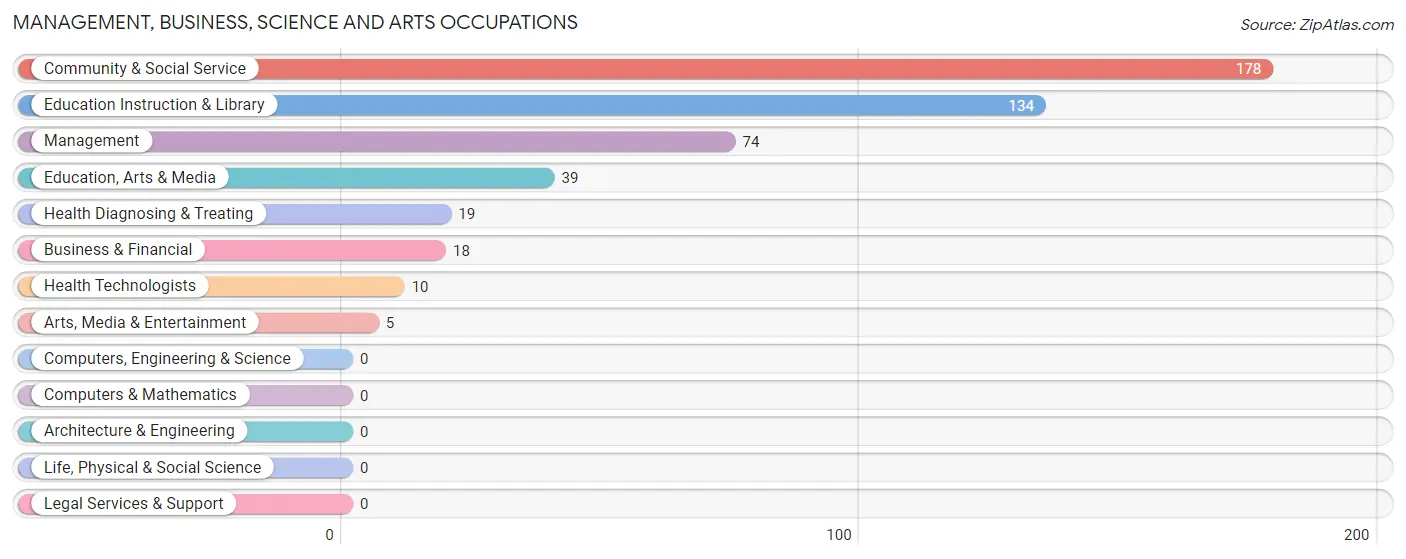
Management, Business, Science and Arts Occupations
The most common Management, Business, Science and Arts occupations in Wewahitchka are Community & Social Service (178 | 23.2%), Education Instruction & Library (134 | 17.4%), Management (74 | 9.6%), Education, Arts & Media (39 | 5.1%), and Health Diagnosing & Treating (19 | 2.5%).
Management, Business, Science and Arts Occupations by Sex
Within the Management, Business, Science and Arts occupations in Wewahitchka, the most male-oriented occupations are Business & Financial (100.0%), Health Technologists (100.0%), and Management (66.2%), while the most female-oriented occupations are Arts, Media & Entertainment (100.0%), Education Instruction & Library (85.1%), and Community & Social Service (79.2%).
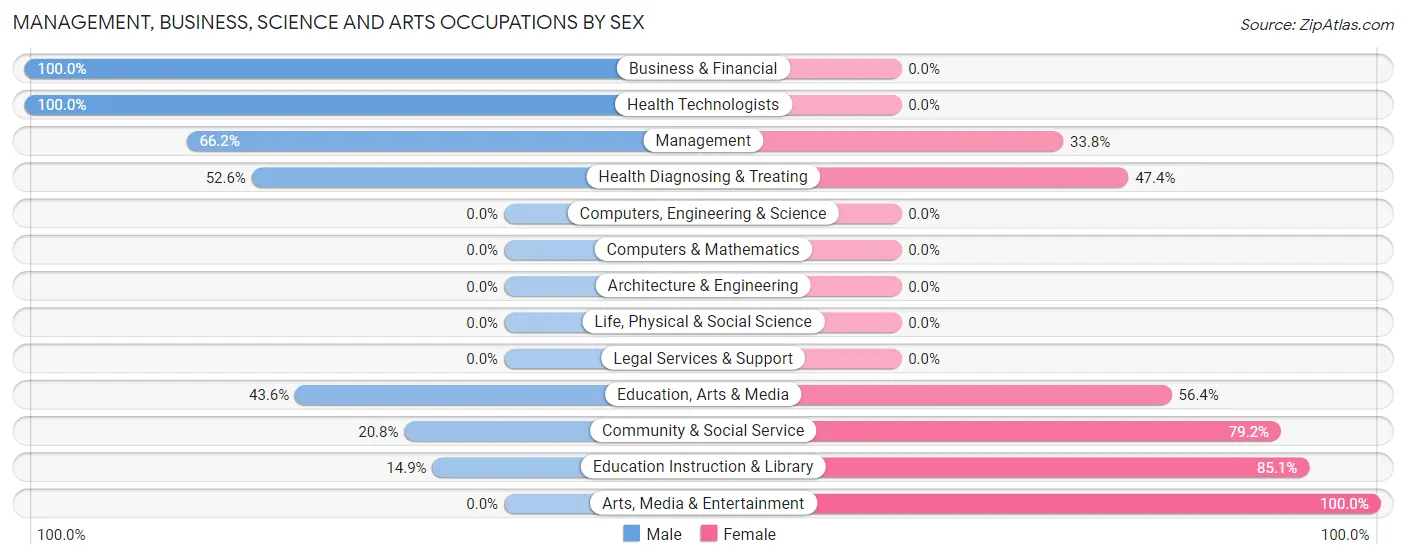
| Occupation | Male | Female |
| Management | 49 (66.2%) | 25 (33.8%) |
| Business & Financial | 18 (100.0%) | 0 (0.0%) |
| Computers, Engineering & Science | 0 (0.0%) | 0 (0.0%) |
| Computers & Mathematics | 0 (0.0%) | 0 (0.0%) |
| Architecture & Engineering | 0 (0.0%) | 0 (0.0%) |
| Life, Physical & Social Science | 0 (0.0%) | 0 (0.0%) |
| Community & Social Service | 37 (20.8%) | 141 (79.2%) |
| Education, Arts & Media | 17 (43.6%) | 22 (56.4%) |
| Legal Services & Support | 0 (0.0%) | 0 (0.0%) |
| Education Instruction & Library | 20 (14.9%) | 114 (85.1%) |
| Arts, Media & Entertainment | 0 (0.0%) | 5 (100.0%) |
| Health Diagnosing & Treating | 10 (52.6%) | 9 (47.4%) |
| Health Technologists | 10 (100.0%) | 0 (0.0%) |
| Total (Category) | 114 (39.5%) | 175 (60.6%) |
| Total (Overall) | 369 (48.0%) | 400 (52.0%) |
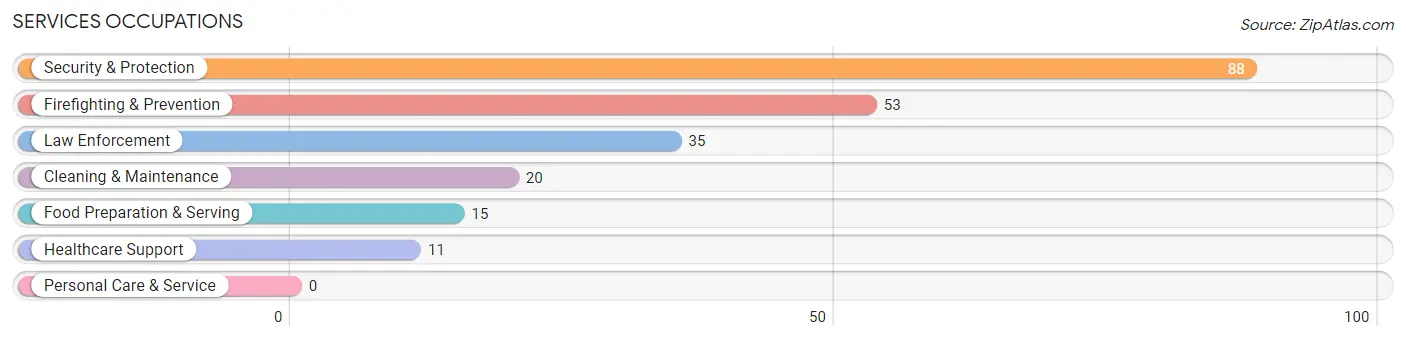
Services Occupations
The most common Services occupations in Wewahitchka are Security & Protection (88 | 11.4%), Firefighting & Prevention (53 | 6.9%), Law Enforcement (35 | 4.5%), Cleaning & Maintenance (20 | 2.6%), and Food Preparation & Serving (15 | 1.9%).
Services Occupations by Sex
Within the Services occupations in Wewahitchka, the most male-oriented occupations are Firefighting & Prevention (100.0%), Security & Protection (92.0%), and Law Enforcement (80.0%), while the most female-oriented occupations are Healthcare Support (100.0%), Food Preparation & Serving (100.0%), and Cleaning & Maintenance (50.0%).
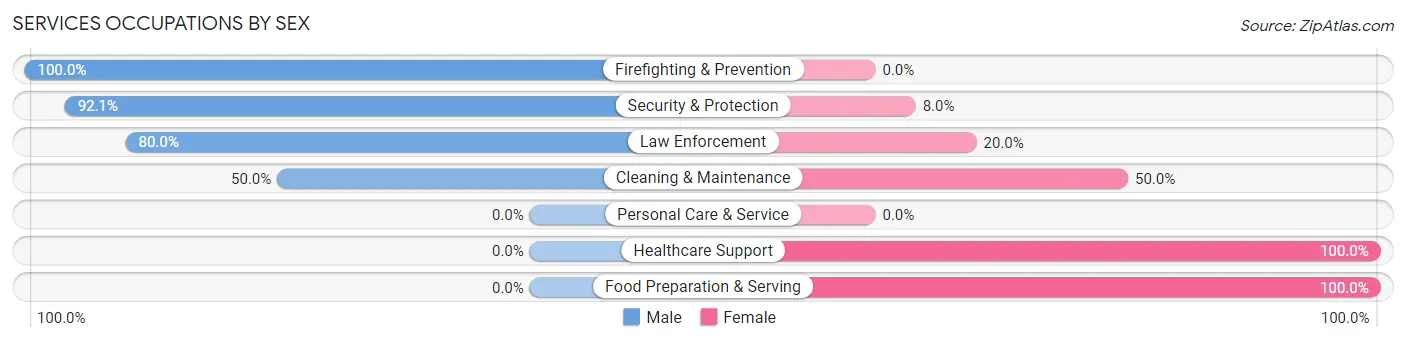
| Occupation | Male | Female |
| Healthcare Support | 0 (0.0%) | 11 (100.0%) |
| Security & Protection | 81 (92.0%) | 7 (8.0%) |
| Firefighting & Prevention | 53 (100.0%) | 0 (0.0%) |
| Law Enforcement | 28 (80.0%) | 7 (20.0%) |
| Food Preparation & Serving | 0 (0.0%) | 15 (100.0%) |
| Cleaning & Maintenance | 10 (50.0%) | 10 (50.0%) |
| Personal Care & Service | 0 (0.0%) | 0 (0.0%) |
| Total (Category) | 91 (67.9%) | 43 (32.1%) |
| Total (Overall) | 369 (48.0%) | 400 (52.0%) |
Sales and Office Occupations
The most common Sales and Office occupations in Wewahitchka are Office & Administration (102 | 13.3%), and Sales & Related (59 | 7.7%).
Sales and Office Occupations by Sex
| Occupation | Male | Female |
| Sales & Related | 38 (64.4%) | 21 (35.6%) |
| Office & Administration | 4 (3.9%) | 98 (96.1%) |
| Total (Category) | 42 (26.1%) | 119 (73.9%) |
| Total (Overall) | 369 (48.0%) | 400 (52.0%) |
Natural Resources, Construction and Maintenance Occupations
The most common Natural Resources, Construction and Maintenance occupations in Wewahitchka are Construction & Extraction (66 | 8.6%), Installation, Maintenance & Repair (24 | 3.1%), and Farming, Fishing & Forestry (4 | 0.5%).
Natural Resources, Construction and Maintenance Occupations by Sex
| Occupation | Male | Female |
| Farming, Fishing & Forestry | 4 (100.0%) | 0 (0.0%) |
| Construction & Extraction | 61 (92.4%) | 5 (7.6%) |
| Installation, Maintenance & Repair | 24 (100.0%) | 0 (0.0%) |
| Total (Category) | 89 (94.7%) | 5 (5.3%) |
| Total (Overall) | 369 (48.0%) | 400 (52.0%) |
Production, Transportation and Moving Occupations
The most common Production, Transportation and Moving occupations in Wewahitchka are Material Moving (66 | 8.6%), Transportation (13 | 1.7%), and Production (12 | 1.6%).
Production, Transportation and Moving Occupations by Sex
| Occupation | Male | Female |
| Production | 12 (100.0%) | 0 (0.0%) |
| Transportation | 13 (100.0%) | 0 (0.0%) |
| Material Moving | 8 (12.1%) | 58 (87.9%) |
| Total (Category) | 33 (36.3%) | 58 (63.7%) |
| Total (Overall) | 369 (48.0%) | 400 (52.0%) |
Employment Industries by Sex in Wewahitchka
Employment Industries in Wewahitchka
The major employment industries in Wewahitchka include Educational Services (139 | 18.1%), Retail Trade (132 | 17.2%), Public Administration (123 | 16.0%), Construction (98 | 12.7%), and Health Care & Social Assistance (65 | 8.5%).
Employment Industries by Sex in Wewahitchka
The Wewahitchka industries that see more men than women are Utilities (100.0%), Information (100.0%), and Arts, Entertainment & Recreation (100.0%), whereas the industries that tend to have a higher number of women are Wholesale Trade (100.0%), Real Estate, Rental & Leasing (100.0%), and Professional & Scientific (100.0%).
| Industry | Male | Female |
| Agriculture, Fishing & Hunting | 4 (28.6%) | 10 (71.4%) |
| Mining, Quarrying, & Extraction | 0 (0.0%) | 0 (0.0%) |
| Construction | 93 (94.9%) | 5 (5.1%) |
| Manufacturing | 16 (51.6%) | 15 (48.4%) |
| Wholesale Trade | 0 (0.0%) | 9 (100.0%) |
| Retail Trade | 68 (51.5%) | 64 (48.5%) |
| Transportation & Warehousing | 16 (88.9%) | 2 (11.1%) |
| Utilities | 1 (100.0%) | 0 (0.0%) |
| Information | 9 (100.0%) | 0 (0.0%) |
| Finance & Insurance | 0 (0.0%) | 0 (0.0%) |
| Real Estate, Rental & Leasing | 0 (0.0%) | 2 (100.0%) |
| Professional & Scientific | 0 (0.0%) | 5 (100.0%) |
| Enterprise Management | 0 (0.0%) | 0 (0.0%) |
| Administrative & Support | 5 (21.7%) | 18 (78.3%) |
| Educational Services | 17 (12.2%) | 122 (87.8%) |
| Health Care & Social Assistance | 10 (15.4%) | 55 (84.6%) |
| Arts, Entertainment & Recreation | 1 (100.0%) | 0 (0.0%) |
| Accommodation & Food Services | 10 (38.5%) | 16 (61.5%) |
| Public Administration | 102 (82.9%) | 21 (17.1%) |
| Total | 369 (48.0%) | 400 (52.0%) |
Education in Wewahitchka
School Enrollment in Wewahitchka
The most common levels of schooling among the 339 students in Wewahitchka are middle school (77 | 22.7%), elementary school (73 | 21.5%), and nursery / preschool (71 | 20.9%).
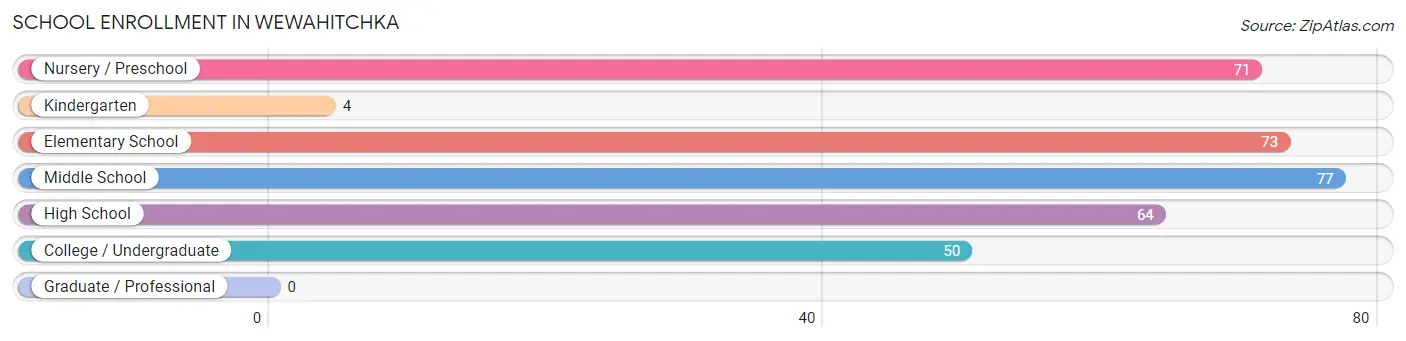
| School Level | # Students | % Students |
| Nursery / Preschool | 71 | 20.9% |
| Kindergarten | 4 | 1.2% |
| Elementary School | 73 | 21.5% |
| Middle School | 77 | 22.7% |
| High School | 64 | 18.9% |
| College / Undergraduate | 50 | 14.7% |
| Graduate / Professional | 0 | 0.0% |
| Total | 339 | 100.0% |
School Enrollment by Age by Funding Source in Wewahitchka
Out of a total of 339 students who are enrolled in schools in Wewahitchka, 9 (2.7%) attend a private institution, while the remaining 330 (97.3%) are enrolled in public schools. The age group of 3 to 4 year olds has the highest likelihood of being enrolled in private schools, with 9 (17.3% in the age bracket) enrolled. Conversely, the age group of 5 to 9 year old has the lowest likelihood of being enrolled in a private school, with 96 (100.0% in the age bracket) attending a public institution.
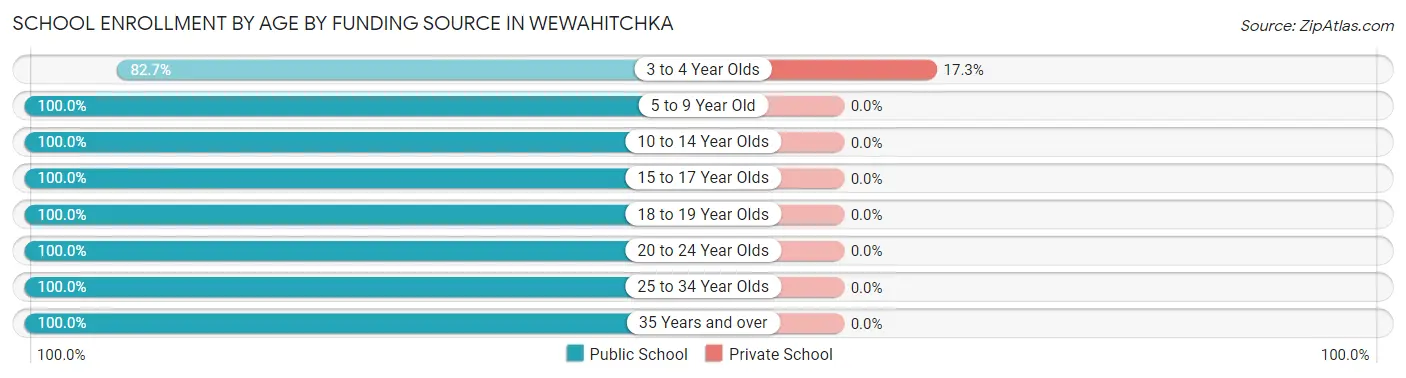
| Age Bracket | Public School | Private School |
| 3 to 4 Year Olds | 43 (82.7%) | 9 (17.3%) |
| 5 to 9 Year Old | 96 (100.0%) | 0 (0.0%) |
| 10 to 14 Year Olds | 85 (100.0%) | 0 (0.0%) |
| 15 to 17 Year Olds | 40 (100.0%) | 0 (0.0%) |
| 18 to 19 Year Olds | 16 (100.0%) | 0 (0.0%) |
| 20 to 24 Year Olds | 27 (100.0%) | 0 (0.0%) |
| 25 to 34 Year Olds | 17 (100.0%) | 0 (0.0%) |
| 35 Years and over | 6 (100.0%) | 0 (0.0%) |
| Total | 330 (97.3%) | 9 (2.7%) |
Educational Attainment by Field of Study in Wewahitchka
Education (74 | 40.9%), social sciences (34 | 18.8%), business (33 | 18.2%), psychology (14 | 7.7%), and literature & languages (8 | 4.4%) are the most common fields of study among 181 individuals in Wewahitchka who have obtained a bachelor's degree or higher.
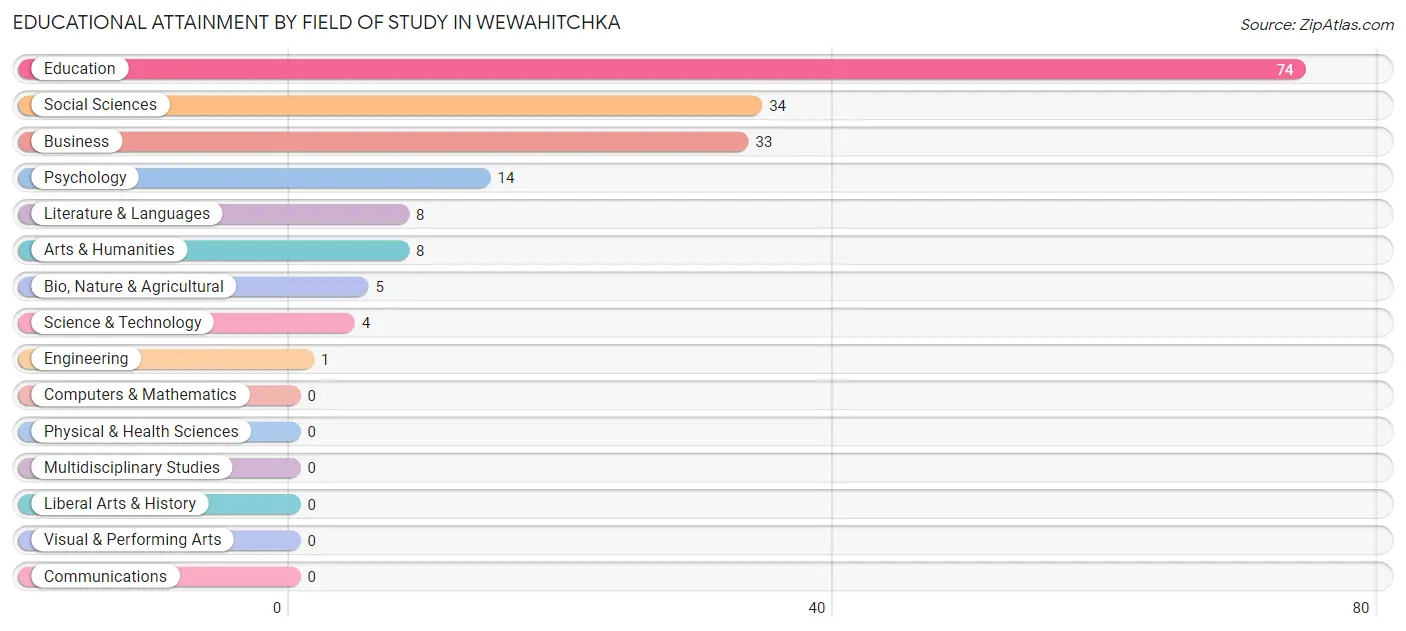
| Field of Study | # Graduates | % Graduates |
| Computers & Mathematics | 0 | 0.0% |
| Bio, Nature & Agricultural | 5 | 2.8% |
| Physical & Health Sciences | 0 | 0.0% |
| Psychology | 14 | 7.7% |
| Social Sciences | 34 | 18.8% |
| Engineering | 1 | 0.5% |
| Multidisciplinary Studies | 0 | 0.0% |
| Science & Technology | 4 | 2.2% |
| Business | 33 | 18.2% |
| Education | 74 | 40.9% |
| Literature & Languages | 8 | 4.4% |
| Liberal Arts & History | 0 | 0.0% |
| Visual & Performing Arts | 0 | 0.0% |
| Communications | 0 | 0.0% |
| Arts & Humanities | 8 | 4.4% |
| Total | 181 | 100.0% |
Transportation & Commute in Wewahitchka
Vehicle Availability by Sex in Wewahitchka
The most prevalent vehicle ownership categories in Wewahitchka are males with 2 vehicles (189, accounting for 51.2%) and females with 2 vehicles (185, making up 47.8%).
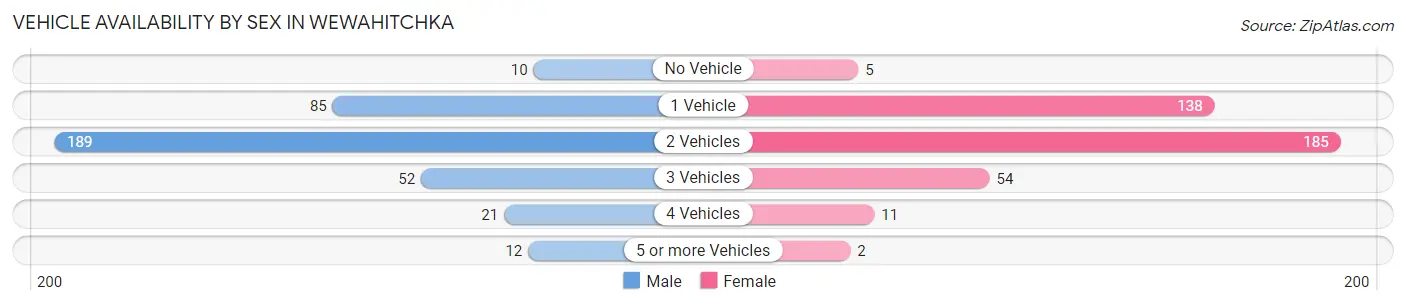
| Vehicles Available | Male | Female |
| No Vehicle | 10 (2.7%) | 5 (1.3%) |
| 1 Vehicle | 85 (23.0%) | 138 (34.9%) |
| 2 Vehicles | 189 (51.2%) | 185 (46.8%) |
| 3 Vehicles | 52 (14.1%) | 54 (13.7%) |
| 4 Vehicles | 21 (5.7%) | 11 (2.8%) |
| 5 or more Vehicles | 12 (3.3%) | 2 (0.5%) |
| Total | 369 (100.0%) | 395 (100.0%) |
Commute Time in Wewahitchka
The most frequently occuring commute durations in Wewahitchka are 5 to 9 minutes (158 commuters, 21.5%), less than 5 minutes (113 commuters, 15.4%), and 45 to 59 minutes (105 commuters, 14.3%).
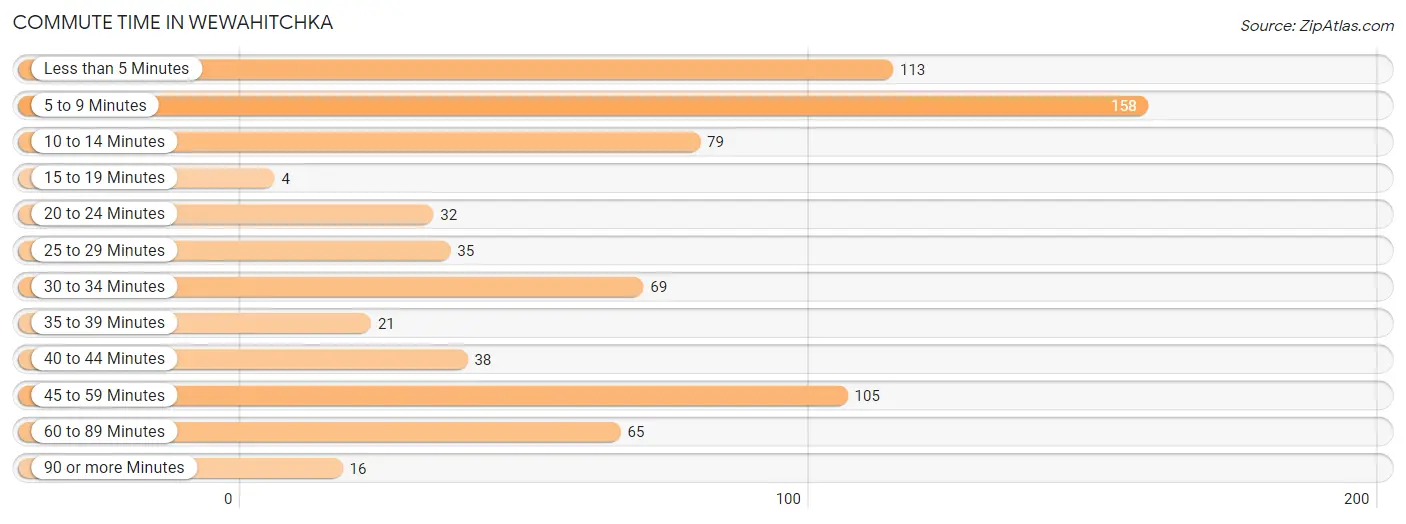
| Commute Time | # Commuters | % Commuters |
| Less than 5 Minutes | 113 | 15.4% |
| 5 to 9 Minutes | 158 | 21.5% |
| 10 to 14 Minutes | 79 | 10.7% |
| 15 to 19 Minutes | 4 | 0.5% |
| 20 to 24 Minutes | 32 | 4.3% |
| 25 to 29 Minutes | 35 | 4.8% |
| 30 to 34 Minutes | 69 | 9.4% |
| 35 to 39 Minutes | 21 | 2.9% |
| 40 to 44 Minutes | 38 | 5.2% |
| 45 to 59 Minutes | 105 | 14.3% |
| 60 to 89 Minutes | 65 | 8.8% |
| 90 or more Minutes | 16 | 2.2% |
Commute Time by Sex in Wewahitchka
The most common commute times in Wewahitchka are 60 to 89 minutes (59 commuters, 16.5%) for males and 5 to 9 minutes (101 commuters, 26.7%) for females.
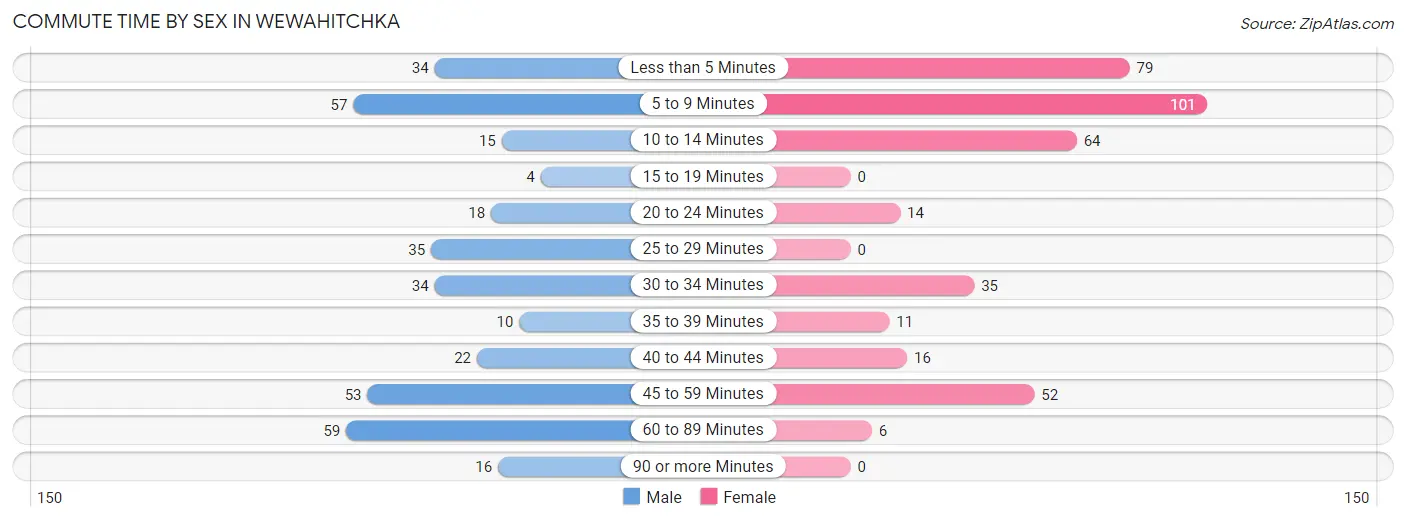
| Commute Time | Male | Female |
| Less than 5 Minutes | 34 (9.5%) | 79 (20.9%) |
| 5 to 9 Minutes | 57 (16.0%) | 101 (26.7%) |
| 10 to 14 Minutes | 15 (4.2%) | 64 (16.9%) |
| 15 to 19 Minutes | 4 (1.1%) | 0 (0.0%) |
| 20 to 24 Minutes | 18 (5.0%) | 14 (3.7%) |
| 25 to 29 Minutes | 35 (9.8%) | 0 (0.0%) |
| 30 to 34 Minutes | 34 (9.5%) | 35 (9.3%) |
| 35 to 39 Minutes | 10 (2.8%) | 11 (2.9%) |
| 40 to 44 Minutes | 22 (6.2%) | 16 (4.2%) |
| 45 to 59 Minutes | 53 (14.8%) | 52 (13.8%) |
| 60 to 89 Minutes | 59 (16.5%) | 6 (1.6%) |
| 90 or more Minutes | 16 (4.5%) | 0 (0.0%) |
Time of Departure to Work by Sex in Wewahitchka
The most frequent times of departure to work in Wewahitchka are 7:00 AM to 7:29 AM (79, 22.1%) for males and 7:00 AM to 7:29 AM (78, 20.6%) for females.
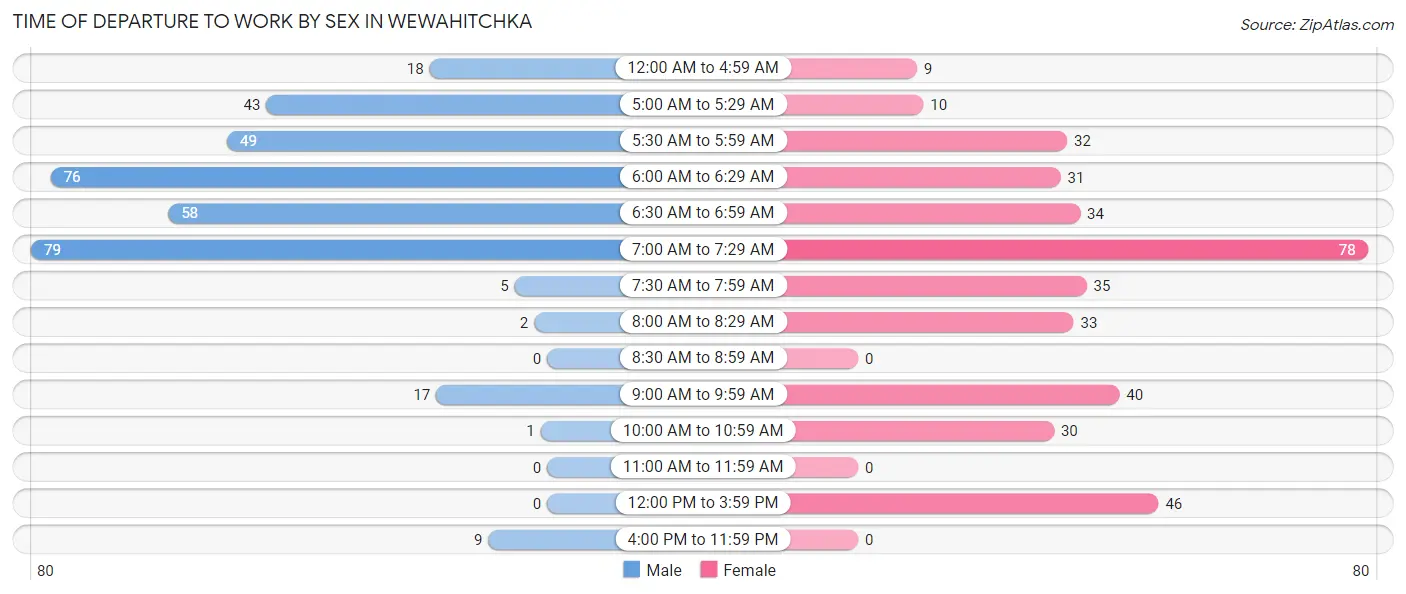
| Time of Departure | Male | Female |
| 12:00 AM to 4:59 AM | 18 (5.0%) | 9 (2.4%) |
| 5:00 AM to 5:29 AM | 43 (12.0%) | 10 (2.6%) |
| 5:30 AM to 5:59 AM | 49 (13.7%) | 32 (8.5%) |
| 6:00 AM to 6:29 AM | 76 (21.3%) | 31 (8.2%) |
| 6:30 AM to 6:59 AM | 58 (16.3%) | 34 (9.0%) |
| 7:00 AM to 7:29 AM | 79 (22.1%) | 78 (20.6%) |
| 7:30 AM to 7:59 AM | 5 (1.4%) | 35 (9.3%) |
| 8:00 AM to 8:29 AM | 2 (0.6%) | 33 (8.7%) |
| 8:30 AM to 8:59 AM | 0 (0.0%) | 0 (0.0%) |
| 9:00 AM to 9:59 AM | 17 (4.8%) | 40 (10.6%) |
| 10:00 AM to 10:59 AM | 1 (0.3%) | 30 (7.9%) |
| 11:00 AM to 11:59 AM | 0 (0.0%) | 0 (0.0%) |
| 12:00 PM to 3:59 PM | 0 (0.0%) | 46 (12.2%) |
| 4:00 PM to 11:59 PM | 9 (2.5%) | 0 (0.0%) |
| Total | 357 (100.0%) | 378 (100.0%) |
Housing Occupancy in Wewahitchka
Occupancy by Ownership in Wewahitchka
Of the total 739 dwellings in Wewahitchka, owner-occupied units account for 489 (66.2%), while renter-occupied units make up 250 (33.8%).
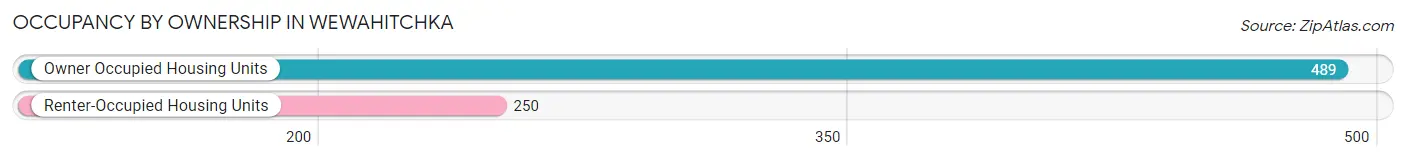
| Occupancy | # Housing Units | % Housing Units |
| Owner Occupied Housing Units | 489 | 66.2% |
| Renter-Occupied Housing Units | 250 | 33.8% |
| Total Occupied Housing Units | 739 | 100.0% |
Occupancy by Household Size in Wewahitchka
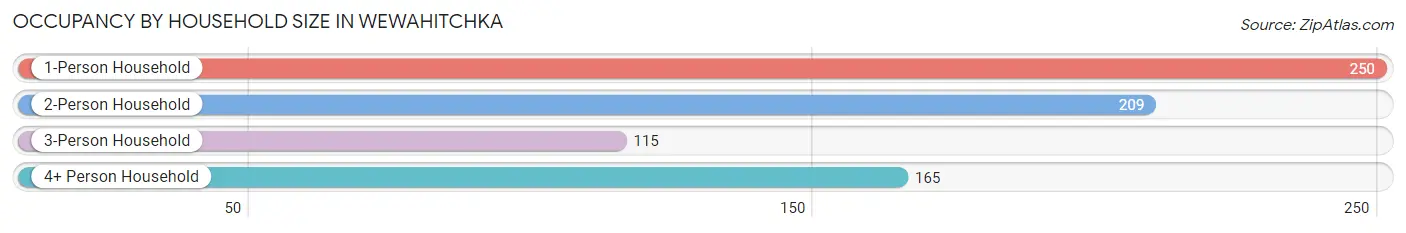
| Household Size | # Housing Units | % Housing Units |
| 1-Person Household | 250 | 33.8% |
| 2-Person Household | 209 | 28.3% |
| 3-Person Household | 115 | 15.6% |
| 4+ Person Household | 165 | 22.3% |
| Total Housing Units | 739 | 100.0% |
Occupancy by Ownership by Household Size in Wewahitchka
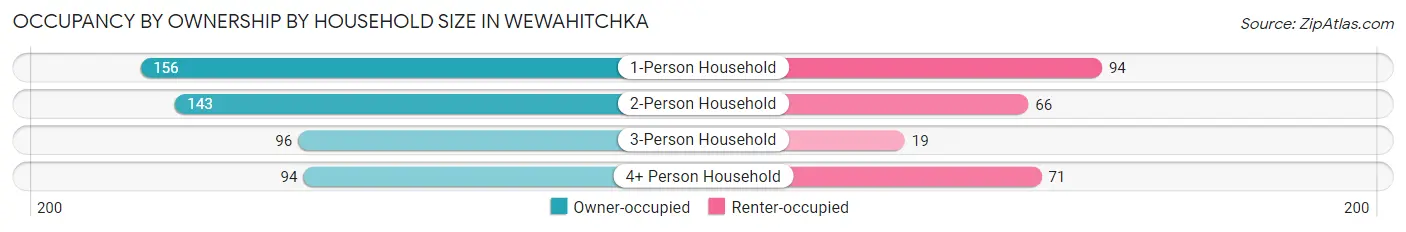
| Household Size | Owner-occupied | Renter-occupied |
| 1-Person Household | 156 (62.4%) | 94 (37.6%) |
| 2-Person Household | 143 (68.4%) | 66 (31.6%) |
| 3-Person Household | 96 (83.5%) | 19 (16.5%) |
| 4+ Person Household | 94 (57.0%) | 71 (43.0%) |
| Total Housing Units | 489 (66.2%) | 250 (33.8%) |
Occupancy by Educational Attainment in Wewahitchka
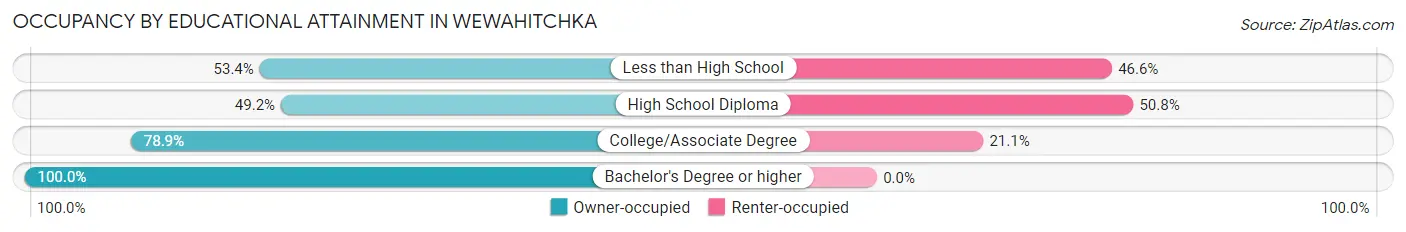
| Household Size | Owner-occupied | Renter-occupied |
| Less than High School | 55 (53.4%) | 48 (46.6%) |
| High School Diploma | 150 (49.2%) | 155 (50.8%) |
| College/Associate Degree | 176 (78.9%) | 47 (21.1%) |
| Bachelor's Degree or higher | 108 (100.0%) | 0 (0.0%) |
Occupancy by Age of Householder in Wewahitchka
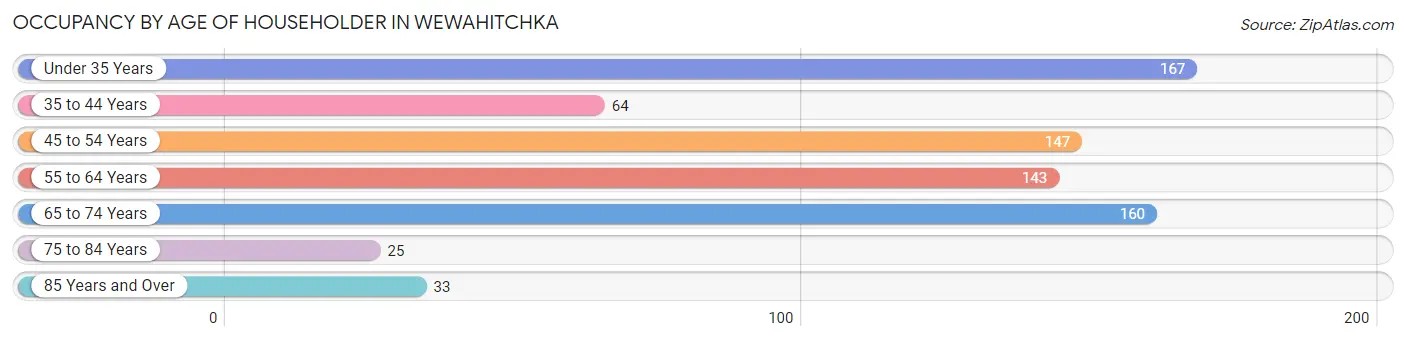
| Age Bracket | # Households | % Households |
| Under 35 Years | 167 | 22.6% |
| 35 to 44 Years | 64 | 8.7% |
| 45 to 54 Years | 147 | 19.9% |
| 55 to 64 Years | 143 | 19.4% |
| 65 to 74 Years | 160 | 21.6% |
| 75 to 84 Years | 25 | 3.4% |
| 85 Years and Over | 33 | 4.5% |
| Total | 739 | 100.0% |
Housing Finances in Wewahitchka
Median Income by Occupancy in Wewahitchka
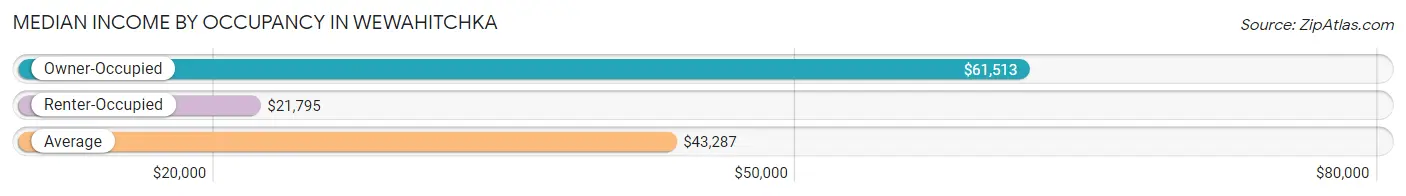
| Occupancy Type | # Households | Median Income |
| Owner-Occupied | 489 (66.2%) | $61,513 |
| Renter-Occupied | 250 (33.8%) | $21,795 |
| Average | 739 (100.0%) | $43,287 |
Occupancy by Householder Income Bracket in Wewahitchka
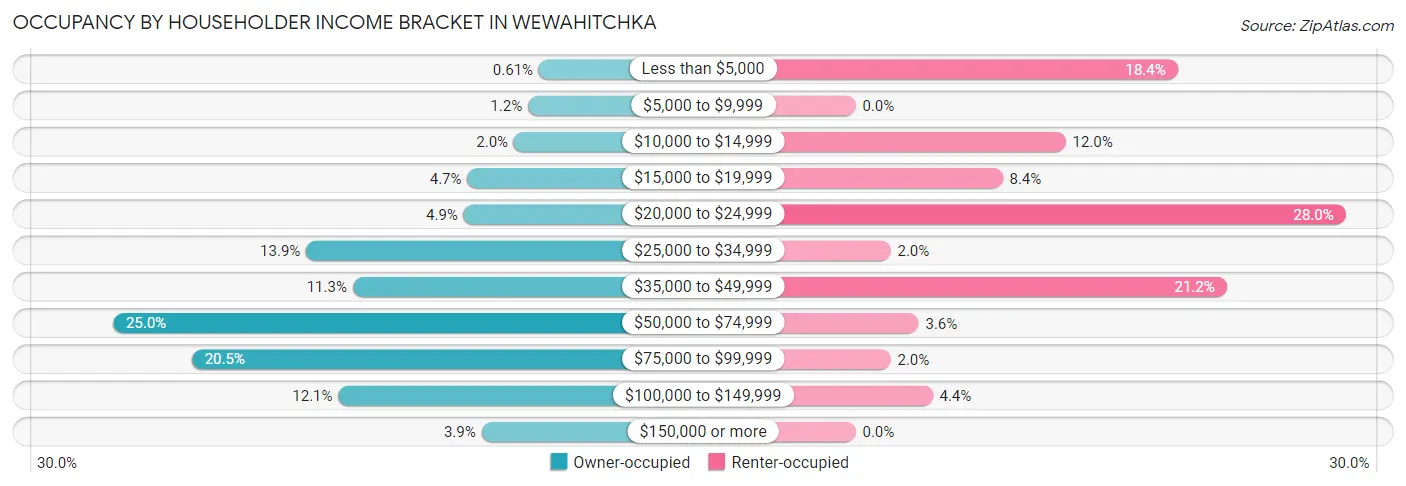
| Income Bracket | Owner-occupied | Renter-occupied |
| Less than $5,000 | 3 (0.6%) | 46 (18.4%) |
| $5,000 to $9,999 | 6 (1.2%) | 0 (0.0%) |
| $10,000 to $14,999 | 10 (2.0%) | 30 (12.0%) |
| $15,000 to $19,999 | 23 (4.7%) | 21 (8.4%) |
| $20,000 to $24,999 | 24 (4.9%) | 70 (28.0%) |
| $25,000 to $34,999 | 68 (13.9%) | 5 (2.0%) |
| $35,000 to $49,999 | 55 (11.3%) | 53 (21.2%) |
| $50,000 to $74,999 | 122 (24.9%) | 9 (3.6%) |
| $75,000 to $99,999 | 100 (20.4%) | 5 (2.0%) |
| $100,000 to $149,999 | 59 (12.1%) | 11 (4.4%) |
| $150,000 or more | 19 (3.9%) | 0 (0.0%) |
| Total | 489 (100.0%) | 250 (100.0%) |
Monthly Housing Cost Tiers in Wewahitchka
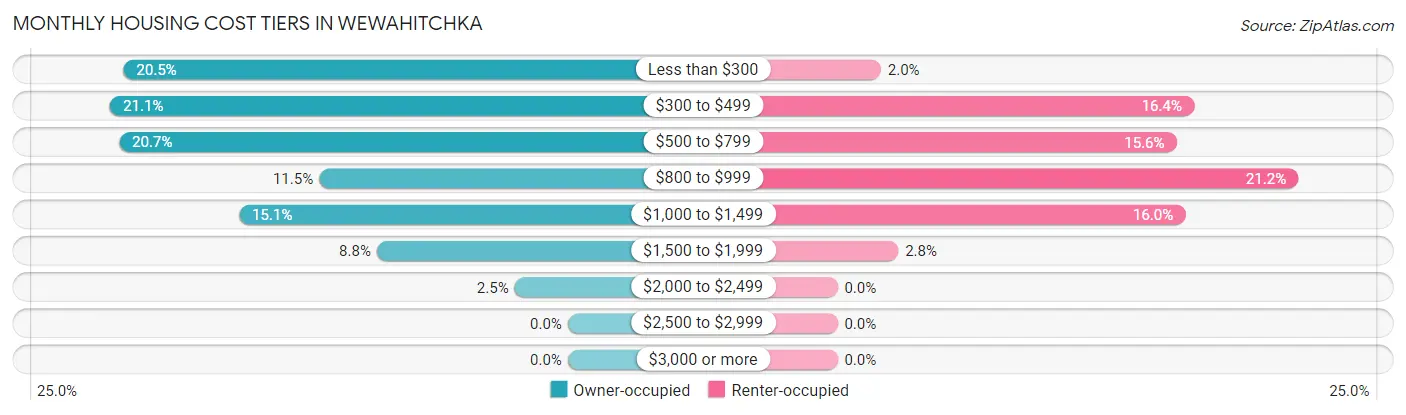
| Monthly Cost | Owner-occupied | Renter-occupied |
| Less than $300 | 100 (20.4%) | 5 (2.0%) |
| $300 to $499 | 103 (21.1%) | 41 (16.4%) |
| $500 to $799 | 101 (20.6%) | 39 (15.6%) |
| $800 to $999 | 56 (11.5%) | 53 (21.2%) |
| $1,000 to $1,499 | 74 (15.1%) | 40 (16.0%) |
| $1,500 to $1,999 | 43 (8.8%) | 7 (2.8%) |
| $2,000 to $2,499 | 12 (2.5%) | 0 (0.0%) |
| $2,500 to $2,999 | 0 (0.0%) | 0 (0.0%) |
| $3,000 or more | 0 (0.0%) | 0 (0.0%) |
| Total | 489 (100.0%) | 250 (100.0%) |
Physical Housing Characteristics in Wewahitchka
Housing Structures in Wewahitchka
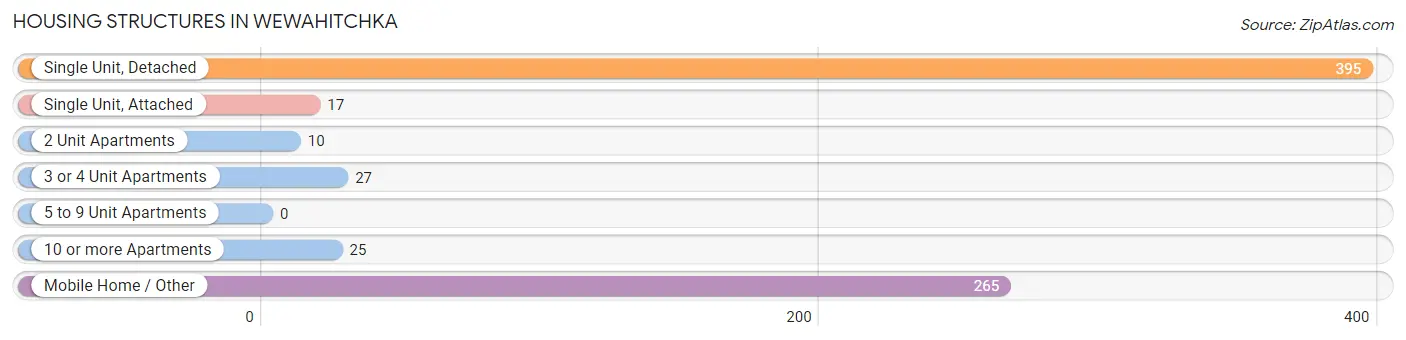
| Structure Type | # Housing Units | % Housing Units |
| Single Unit, Detached | 395 | 53.4% |
| Single Unit, Attached | 17 | 2.3% |
| 2 Unit Apartments | 10 | 1.3% |
| 3 or 4 Unit Apartments | 27 | 3.6% |
| 5 to 9 Unit Apartments | 0 | 0.0% |
| 10 or more Apartments | 25 | 3.4% |
| Mobile Home / Other | 265 | 35.9% |
| Total | 739 | 100.0% |
Housing Structures by Occupancy in Wewahitchka
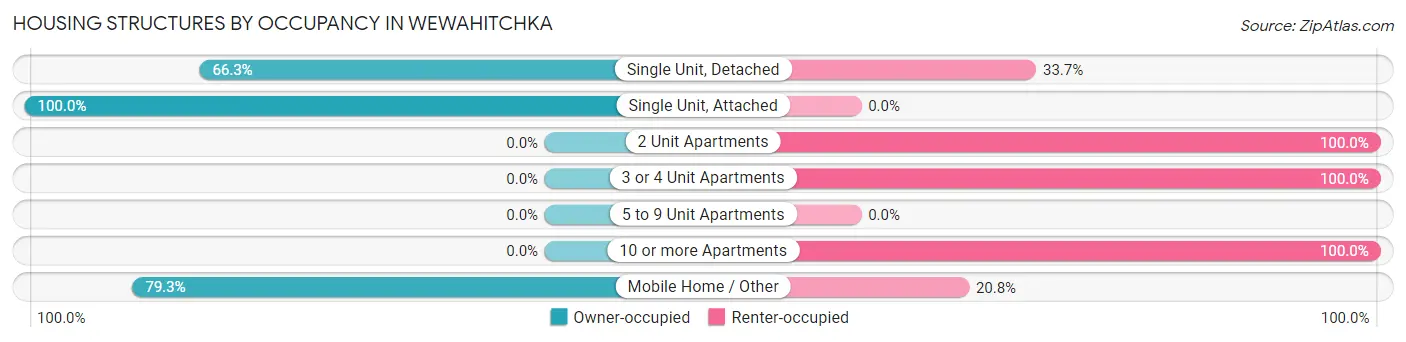
| Structure Type | Owner-occupied | Renter-occupied |
| Single Unit, Detached | 262 (66.3%) | 133 (33.7%) |
| Single Unit, Attached | 17 (100.0%) | 0 (0.0%) |
| 2 Unit Apartments | 0 (0.0%) | 10 (100.0%) |
| 3 or 4 Unit Apartments | 0 (0.0%) | 27 (100.0%) |
| 5 to 9 Unit Apartments | 0 (0.0%) | 0 (0.0%) |
| 10 or more Apartments | 0 (0.0%) | 25 (100.0%) |
| Mobile Home / Other | 210 (79.2%) | 55 (20.7%) |
| Total | 489 (66.2%) | 250 (33.8%) |
Housing Structures by Number of Rooms in Wewahitchka
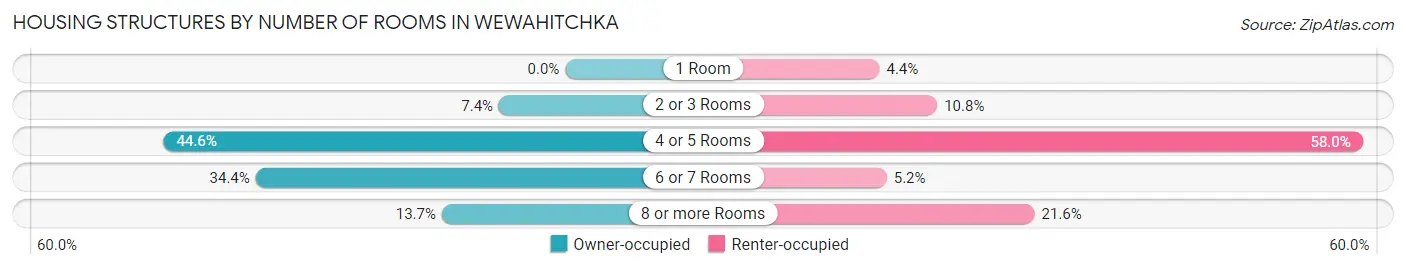
| Number of Rooms | Owner-occupied | Renter-occupied |
| 1 Room | 0 (0.0%) | 11 (4.4%) |
| 2 or 3 Rooms | 36 (7.4%) | 27 (10.8%) |
| 4 or 5 Rooms | 218 (44.6%) | 145 (58.0%) |
| 6 or 7 Rooms | 168 (34.4%) | 13 (5.2%) |
| 8 or more Rooms | 67 (13.7%) | 54 (21.6%) |
| Total | 489 (100.0%) | 250 (100.0%) |
Housing Structure by Heating Type in Wewahitchka
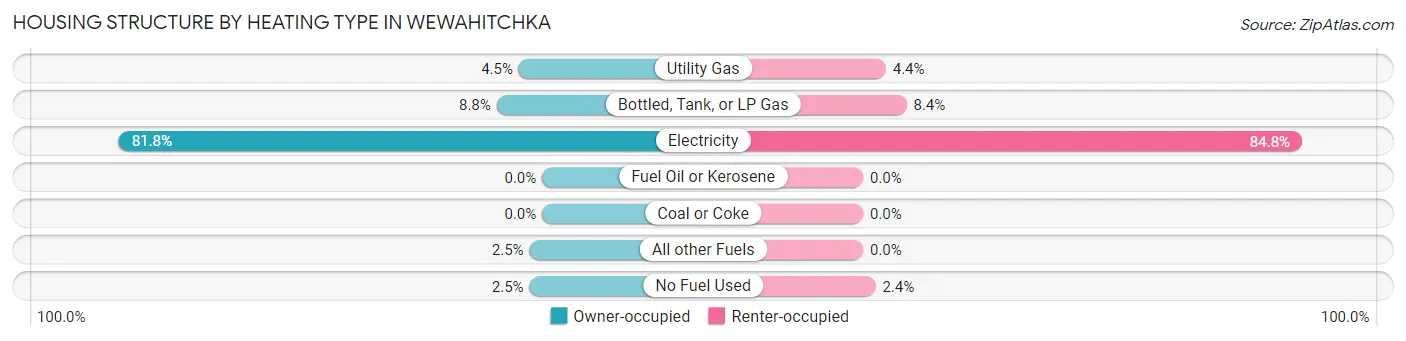
| Heating Type | Owner-occupied | Renter-occupied |
| Utility Gas | 22 (4.5%) | 11 (4.4%) |
| Bottled, Tank, or LP Gas | 43 (8.8%) | 21 (8.4%) |
| Electricity | 400 (81.8%) | 212 (84.8%) |
| Fuel Oil or Kerosene | 0 (0.0%) | 0 (0.0%) |
| Coal or Coke | 0 (0.0%) | 0 (0.0%) |
| All other Fuels | 12 (2.5%) | 0 (0.0%) |
| No Fuel Used | 12 (2.5%) | 6 (2.4%) |
| Total | 489 (100.0%) | 250 (100.0%) |
Household Vehicle Usage in Wewahitchka
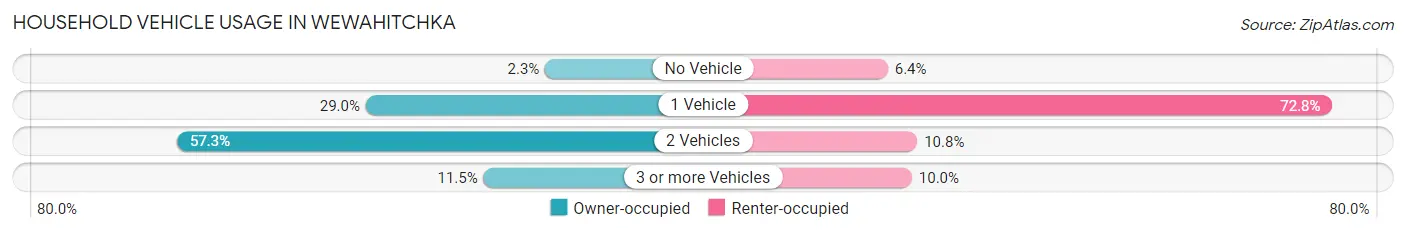
| Vehicles per Household | Owner-occupied | Renter-occupied |
| No Vehicle | 11 (2.2%) | 16 (6.4%) |
| 1 Vehicle | 142 (29.0%) | 182 (72.8%) |
| 2 Vehicles | 280 (57.3%) | 27 (10.8%) |
| 3 or more Vehicles | 56 (11.5%) | 25 (10.0%) |
| Total | 489 (100.0%) | 250 (100.0%) |
Real Estate & Mortgages in Wewahitchka
Real Estate and Mortgage Overview in Wewahitchka
| Characteristic | Without Mortgage | With Mortgage |
| Housing Units | 270 | 219 |
| Median Property Value | $83,900 | $185,300 |
| Median Household Income | $36,471 | $0 |
| Monthly Housing Costs | $369 | $0 |
| Real Estate Taxes | $492 | $31 |
Property Value by Mortgage Status in Wewahitchka
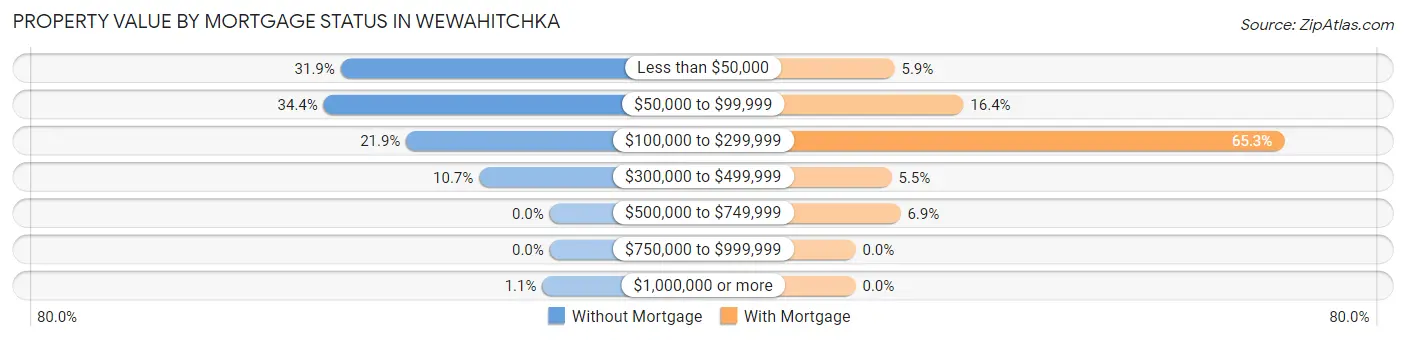
| Property Value | Without Mortgage | With Mortgage |
| Less than $50,000 | 86 (31.9%) | 13 (5.9%) |
| $50,000 to $99,999 | 93 (34.4%) | 36 (16.4%) |
| $100,000 to $299,999 | 59 (21.8%) | 143 (65.3%) |
| $300,000 to $499,999 | 29 (10.7%) | 12 (5.5%) |
| $500,000 to $749,999 | 0 (0.0%) | 15 (6.9%) |
| $750,000 to $999,999 | 0 (0.0%) | 0 (0.0%) |
| $1,000,000 or more | 3 (1.1%) | 0 (0.0%) |
| Total | 270 (100.0%) | 219 (100.0%) |
Household Income by Mortgage Status in Wewahitchka
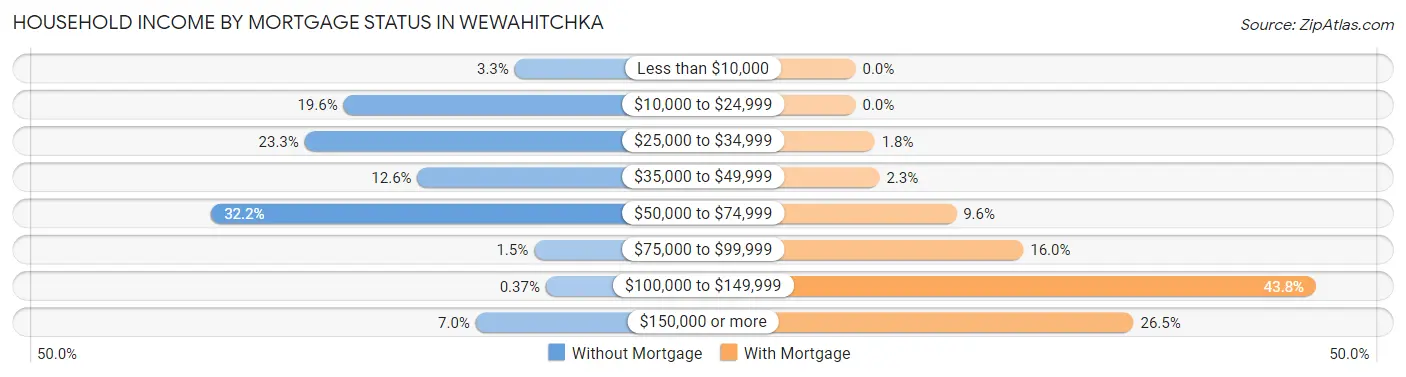
| Household Income | Without Mortgage | With Mortgage |
| Less than $10,000 | 9 (3.3%) | 0 (0.0%) |
| $10,000 to $24,999 | 53 (19.6%) | 0 (0.0%) |
| $25,000 to $34,999 | 63 (23.3%) | 4 (1.8%) |
| $35,000 to $49,999 | 34 (12.6%) | 5 (2.3%) |
| $50,000 to $74,999 | 87 (32.2%) | 21 (9.6%) |
| $75,000 to $99,999 | 4 (1.5%) | 35 (16.0%) |
| $100,000 to $149,999 | 1 (0.4%) | 96 (43.8%) |
| $150,000 or more | 19 (7.0%) | 58 (26.5%) |
| Total | 270 (100.0%) | 219 (100.0%) |
Property Value to Household Income Ratio in Wewahitchka
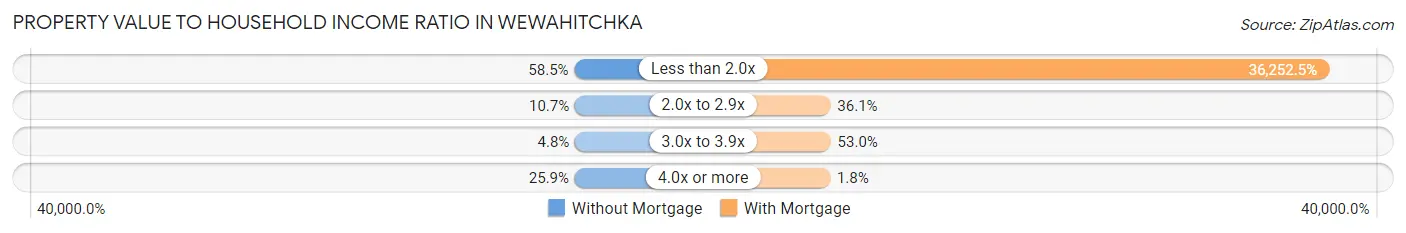
| Value-to-Income Ratio | Without Mortgage | With Mortgage |
| Less than 2.0x | 158 (58.5%) | 79,393 (36,252.5%) |
| 2.0x to 2.9x | 29 (10.7%) | 79 (36.1%) |
| 3.0x to 3.9x | 13 (4.8%) | 116 (53.0%) |
| 4.0x or more | 70 (25.9%) | 4 (1.8%) |
| Total | 270 (100.0%) | 219 (100.0%) |
Real Estate Taxes by Mortgage Status in Wewahitchka
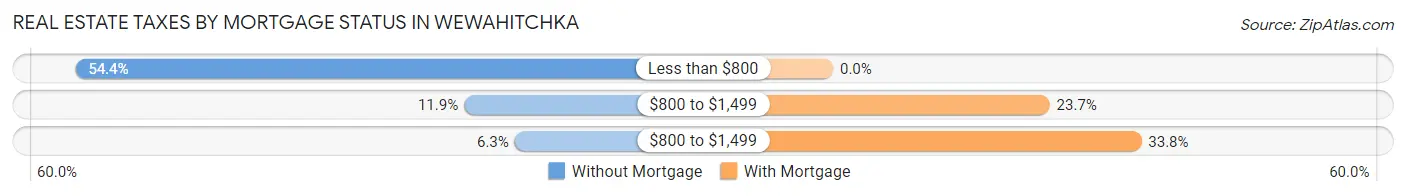
| Property Taxes | Without Mortgage | With Mortgage |
| Less than $800 | 147 (54.4%) | 0 (0.0%) |
| $800 to $1,499 | 32 (11.8%) | 52 (23.7%) |
| $800 to $1,499 | 17 (6.3%) | 74 (33.8%) |
| Total | 270 (100.0%) | 219 (100.0%) |
Health & Disability in Wewahitchka
Health Insurance Coverage by Age in Wewahitchka
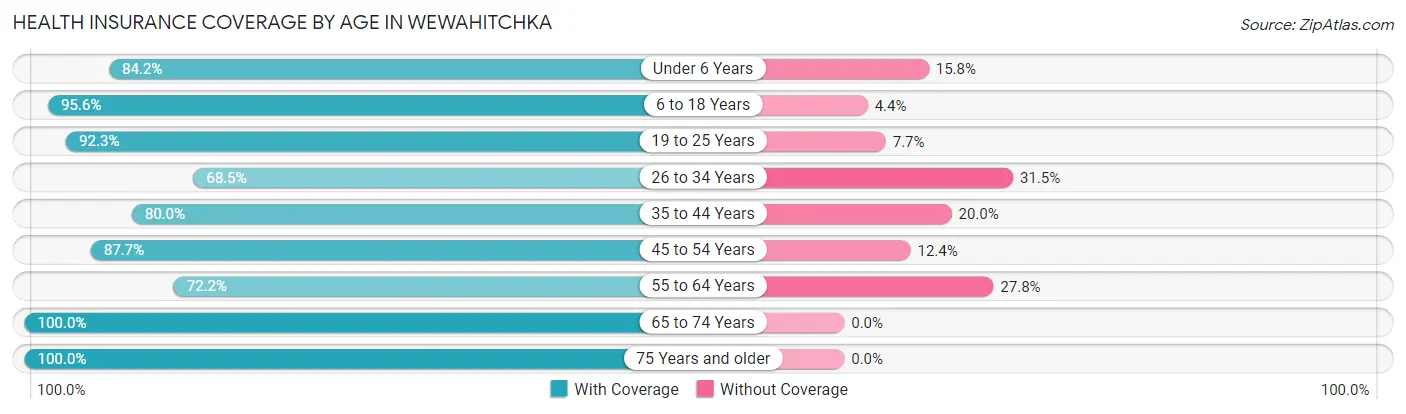
| Age Bracket | With Coverage | Without Coverage |
| Under 6 Years | 155 (84.2%) | 29 (15.8%) |
| 6 to 18 Years | 219 (95.6%) | 10 (4.4%) |
| 19 to 25 Years | 143 (92.3%) | 12 (7.7%) |
| 26 to 34 Years | 159 (68.5%) | 73 (31.5%) |
| 35 to 44 Years | 140 (80.0%) | 35 (20.0%) |
| 45 to 54 Years | 220 (87.6%) | 31 (12.3%) |
| 55 to 64 Years | 122 (72.2%) | 47 (27.8%) |
| 65 to 74 Years | 197 (100.0%) | 0 (0.0%) |
| 75 Years and older | 76 (100.0%) | 0 (0.0%) |
| Total | 1,431 (85.8%) | 237 (14.2%) |
Health Insurance Coverage by Citizenship Status in Wewahitchka
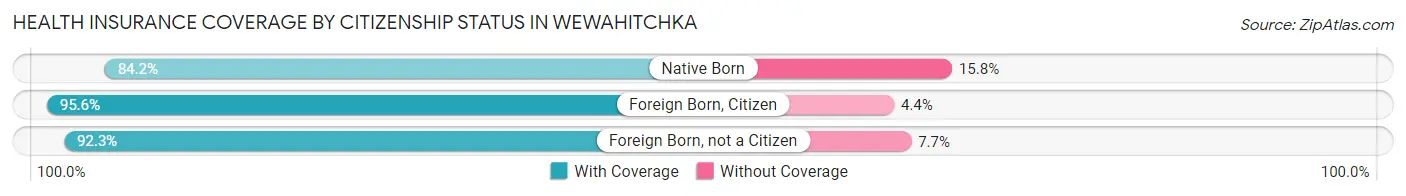
| Citizenship Status | With Coverage | Without Coverage |
| Native Born | 155 (84.2%) | 29 (15.8%) |
| Foreign Born, Citizen | 219 (95.6%) | 10 (4.4%) |
| Foreign Born, not a Citizen | 143 (92.3%) | 12 (7.7%) |
Health Insurance Coverage by Household Income in Wewahitchka
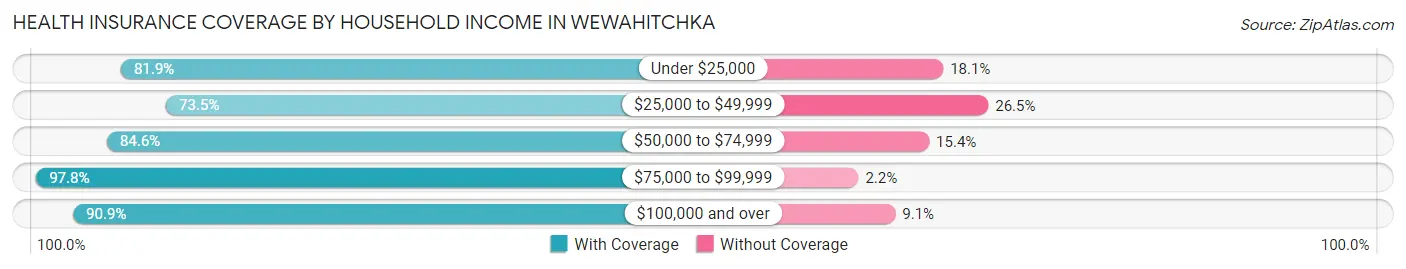
| Household Income | With Coverage | Without Coverage |
| Under $25,000 | 295 (81.9%) | 65 (18.1%) |
| $25,000 to $49,999 | 244 (73.5%) | 88 (26.5%) |
| $50,000 to $74,999 | 274 (84.6%) | 50 (15.4%) |
| $75,000 to $99,999 | 358 (97.8%) | 8 (2.2%) |
| $100,000 and over | 260 (90.9%) | 26 (9.1%) |
Public vs Private Health Insurance Coverage by Age in Wewahitchka
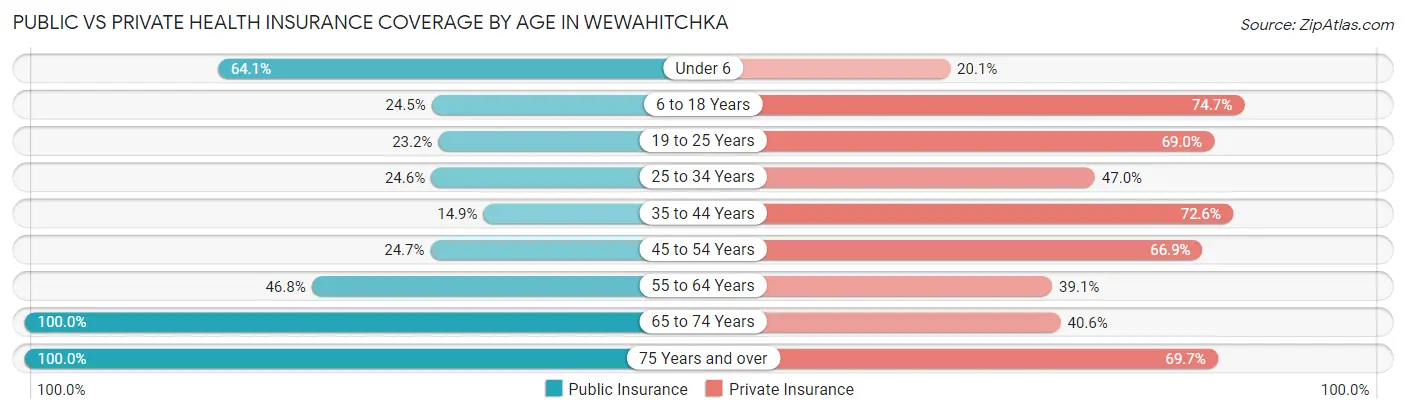
| Age Bracket | Public Insurance | Private Insurance |
| Under 6 | 118 (64.1%) | 37 (20.1%) |
| 6 to 18 Years | 56 (24.4%) | 171 (74.7%) |
| 19 to 25 Years | 36 (23.2%) | 107 (69.0%) |
| 25 to 34 Years | 57 (24.6%) | 109 (47.0%) |
| 35 to 44 Years | 26 (14.9%) | 127 (72.6%) |
| 45 to 54 Years | 62 (24.7%) | 168 (66.9%) |
| 55 to 64 Years | 79 (46.8%) | 66 (39.1%) |
| 65 to 74 Years | 197 (100.0%) | 80 (40.6%) |
| 75 Years and over | 76 (100.0%) | 53 (69.7%) |
| Total | 707 (42.4%) | 918 (55.0%) |
Disability Status by Sex by Age in Wewahitchka
| Age Bracket | Male | Female |
| Under 5 Years | 0 (0.0%) | 0 (0.0%) |
| 5 to 17 Years | 17 (9.8%) | 4 (4.9%) |
| 18 to 34 Years | 30 (16.0%) | 16 (7.3%) |
| 35 to 64 Years | 52 (19.5%) | 87 (26.5%) |
| 65 to 74 Years | 27 (31.8%) | 50 (44.6%) |
| 75 Years and over | 19 (63.3%) | 36 (78.3%) |
Disability Class by Sex by Age in Wewahitchka
Disability Class: Hearing Difficulty
| Age Bracket | Male | Female |
| Under 5 Years | 0 (0.0%) | 0 (0.0%) |
| 5 to 17 Years | 17 (9.8%) | 0 (0.0%) |
| 18 to 34 Years | 0 (0.0%) | 6 (2.7%) |
| 35 to 64 Years | 5 (1.9%) | 5 (1.5%) |
| 65 to 74 Years | 8 (9.4%) | 27 (24.1%) |
| 75 Years and over | 19 (63.3%) | 7 (15.2%) |
Disability Class: Vision Difficulty
| Age Bracket | Male | Female |
| Under 5 Years | 0 (0.0%) | 0 (0.0%) |
| 5 to 17 Years | 0 (0.0%) | 0 (0.0%) |
| 18 to 34 Years | 2 (1.1%) | 10 (4.6%) |
| 35 to 64 Years | 7 (2.6%) | 19 (5.8%) |
| 65 to 74 Years | 14 (16.5%) | 13 (11.6%) |
| 75 Years and over | 12 (40.0%) | 8 (17.4%) |
Disability Class: Cognitive Difficulty
| Age Bracket | Male | Female |
| 5 to 17 Years | 17 (9.8%) | 4 (4.9%) |
| 18 to 34 Years | 27 (14.4%) | 0 (0.0%) |
| 35 to 64 Years | 21 (7.9%) | 56 (17.1%) |
| 65 to 74 Years | 0 (0.0%) | 14 (12.5%) |
| 75 Years and over | 12 (40.0%) | 12 (26.1%) |
Disability Class: Ambulatory Difficulty
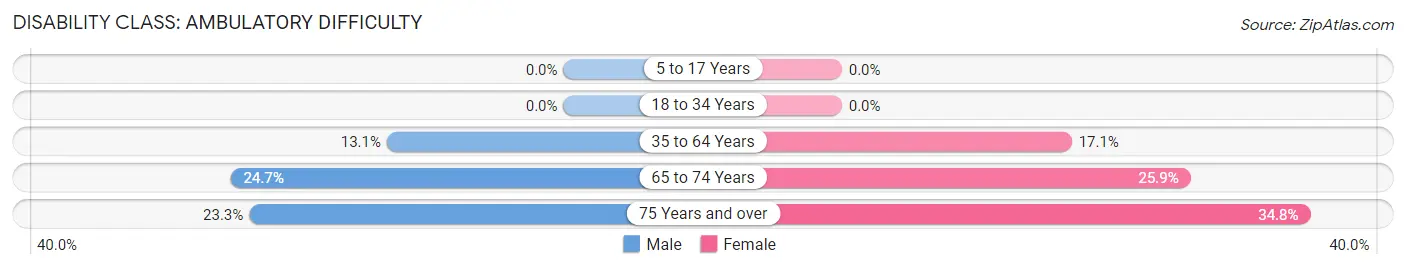
| Age Bracket | Male | Female |
| 5 to 17 Years | 0 (0.0%) | 0 (0.0%) |
| 18 to 34 Years | 0 (0.0%) | 0 (0.0%) |
| 35 to 64 Years | 35 (13.1%) | 56 (17.1%) |
| 65 to 74 Years | 21 (24.7%) | 29 (25.9%) |
| 75 Years and over | 7 (23.3%) | 16 (34.8%) |
Disability Class: Self-Care Difficulty
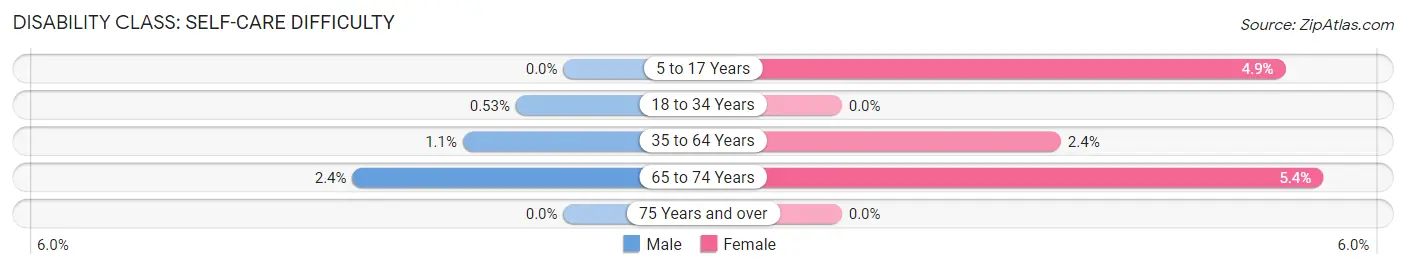
| Age Bracket | Male | Female |
| 5 to 17 Years | 0 (0.0%) | 4 (4.9%) |
| 18 to 34 Years | 1 (0.5%) | 0 (0.0%) |
| 35 to 64 Years | 3 (1.1%) | 8 (2.4%) |
| 65 to 74 Years | 2 (2.4%) | 6 (5.4%) |
| 75 Years and over | 0 (0.0%) | 0 (0.0%) |
Technology Access in Wewahitchka
Computing Device Access in Wewahitchka
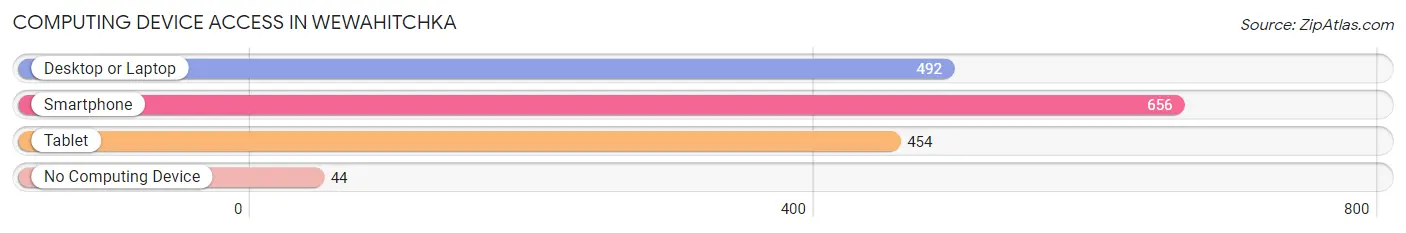
| Device Type | # Households | % Households |
| Desktop or Laptop | 492 | 66.6% |
| Smartphone | 656 | 88.8% |
| Tablet | 454 | 61.4% |
| No Computing Device | 44 | 5.9% |
| Total | 739 | 100.0% |
Internet Access in Wewahitchka
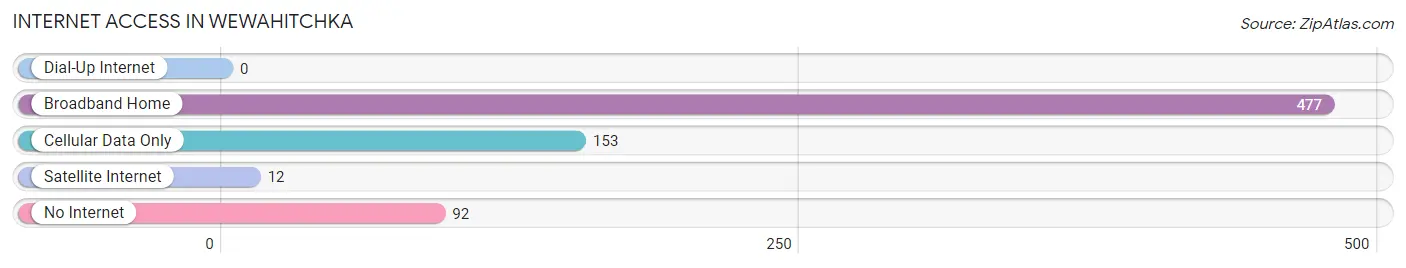
| Internet Type | # Households | % Households |
| Dial-Up Internet | 0 | 0.0% |
| Broadband Home | 477 | 64.5% |
| Cellular Data Only | 153 | 20.7% |
| Satellite Internet | 12 | 1.6% |
| No Internet | 92 | 12.4% |
| Total | 739 | 100.0% |
Wewahitchka Summary
Wewahitchka is a small city located in Gulf County, Florida, United States. It is situated on the banks of the Chipola River, approximately 20 miles northwest of Panama City. The city is part of the Panama City–Lynn Haven–Panama City Beach Metropolitan Statistical Area. As of the 2010 census, the population of Wewahitchka was 2,131.
History
The area that is now Wewahitchka was first inhabited by Native Americans, including the Apalachee, Creek, and Seminole tribes. The first European settlers arrived in the area in the early 19th century, and the town was officially founded in 1838. The name Wewahitchka is derived from the Creek words wewa, meaning “water,” and hitchka, meaning “little.”
The town was originally a trading post for the local Native American tribes, and it quickly grew into a bustling port town. In the late 19th century, the town was a major hub for the timber industry, and it was also home to several sawmills. The timber industry declined in the early 20th century, and the town’s economy shifted to agriculture and fishing.
Geography
Wewahitchka is located at 30°10'N 85°25'W (30.17, -85.41). According to the United States Census Bureau, the city has a total area of 4.2 square miles (10.9 km2), of which 4.1 square miles (10.6 km2) is land and 0.1 square miles (0.3 km2) is water.
The city is located on the banks of the Chipola River, and it is surrounded by several small lakes, including Lake Alice, Lake Mystic, and Lake Wewahitchka. The city is also home to several state parks, including Dead Lakes State Park and Wewahitchka State Park.
Economy
The economy of Wewahitchka is largely based on agriculture and fishing. The city is home to several farms, and it is also a major producer of seafood, including oysters, shrimp, and crabs. The city is also home to several small businesses, including restaurants, retail stores, and service providers.
Demographics
As of the 2010 census, there were 2,131 people, 845 households, and 590 families residing in the city. The population density was 514.3 people per square mile (198.3/km2). There were 945 housing units at an average density of 229.7 per square mile (88.7/km2). The racial makeup of the city was 79.2% White, 16.2% African American, 0.7% Native American, 0.7% Asian, 0.1% Pacific Islander, 1.2% from other races, and 2.0% from two or more races. Hispanic or Latino of any race were 3.2% of the population.
There were 845 households, out of which 28.2% had children under the age of 18 living with them, 48.2% were married couples living together, 15.2% had a female householder with no husband present, and 31.7% were non-families. 27.2% of all households were made up of individuals, and 12.2% had someone living alone who was 65 years of age or older. The average household size was 2.50 and the average family size was 3.02.
In the city, the population was spread out, with 24.7% under the age of 18, 8.2% from 18 to 24, 25.2% from 25 to 44, 25.2% from 45 to 64, and 16.7% who were 65 years of age or older. The median age was 38 years. For every 100 females, there were 91.2 males. For every 100 females age 18 and over, there were 87.2 males.
The median income for a household in the city was $30,938, and the median income for a family was $36,250. Males had a median income of $30,000 versus $20,000 for females. The per capita income for the city was $15,845. About 14.2% of families and 17.2% of the population were below the poverty line, including 22.2% of those under age 18 and 14.3% of those age 65 or over.
Common Questions
What is Per Capita Income in Wewahitchka?
Per Capita income in Wewahitchka is $23,631.
What is the Median Family Income in Wewahitchka?
Median Family Income in Wewahitchka is $48,750.
What is the Median Household income in Wewahitchka?
Median Household Income in Wewahitchka is $43,287.
What is Income or Wage Gap in Wewahitchka?
Income or Wage Gap in Wewahitchka is 50.0%.
Women in Wewahitchka earn 50.0 cents for every dollar earned by a man.
What is Inequality or Gini Index in Wewahitchka?
Inequality or Gini Index in Wewahitchka is 0.41.
What is the Total Population of Wewahitchka?
Total Population of Wewahitchka is 1,668.
What is the Total Male Population of Wewahitchka?
Total Male Population of Wewahitchka is 788.
What is the Total Female Population of Wewahitchka?
Total Female Population of Wewahitchka is 880.
What is the Ratio of Males per 100 Females in Wewahitchka?
There are 89.55 Males per 100 Females in Wewahitchka.
What is the Ratio of Females per 100 Males in Wewahitchka?
There are 111.68 Females per 100 Males in Wewahitchka.
What is the Median Population Age in Wewahitchka?
Median Population Age in Wewahitchka is 36.3 Years.
What is the Average Family Size in Wewahitchka
Average Family Size in Wewahitchka is 3.0 People.
What is the Average Household Size in Wewahitchka
Average Household Size in Wewahitchka is 2.3 People.
How Large is the Labor Force in Wewahitchka?
There are 796 People in the Labor Forcein in Wewahitchka.
What is the Percentage of People in the Labor Force in Wewahitchka?
60.8% of People are in the Labor Force in Wewahitchka.
What is the Unemployment Rate in Wewahitchka?
Unemployment Rate in Wewahitchka is 3.4%.