Warm Mineral Springs, FL Map & Demographics
Warm Mineral Springs Map
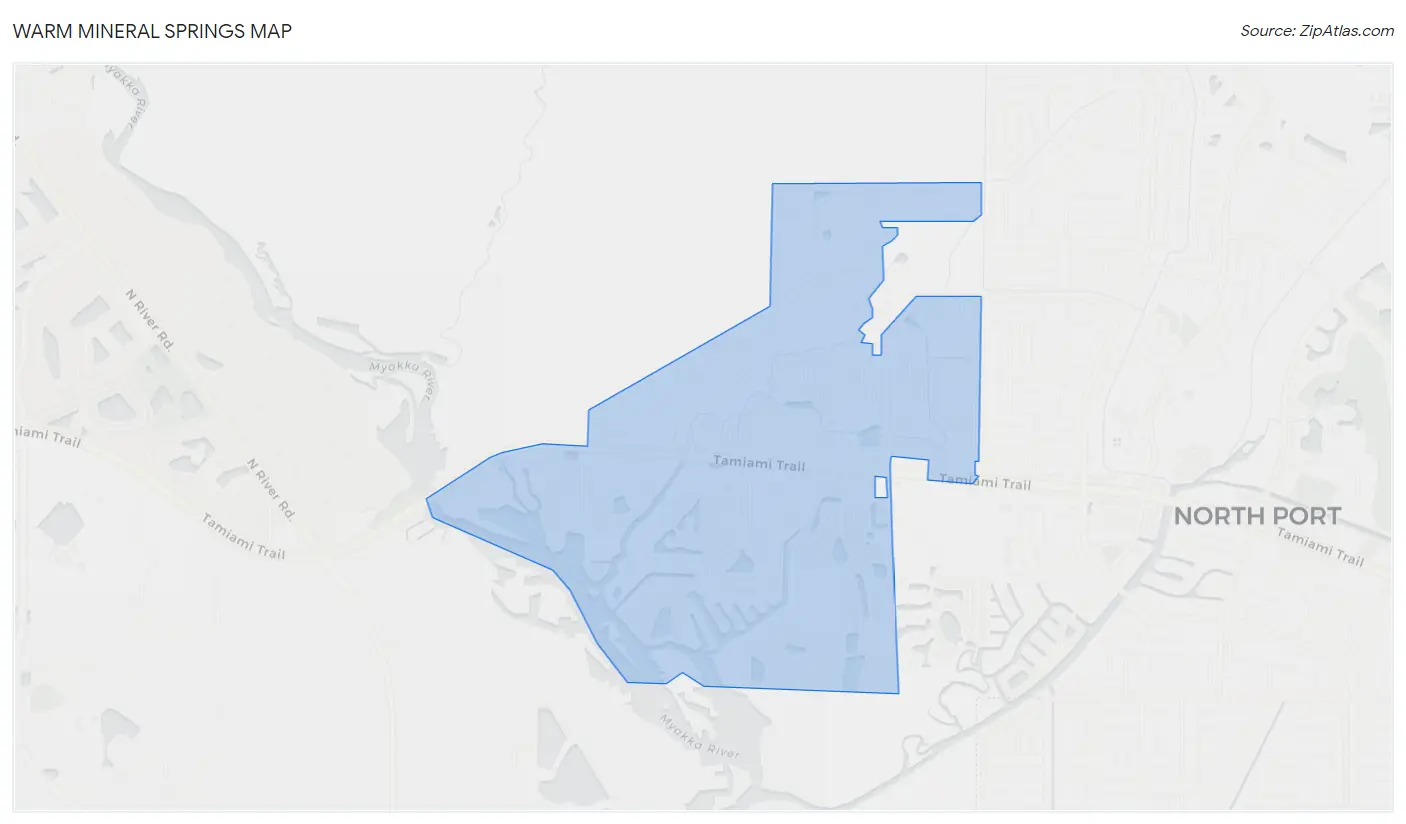
Warm Mineral Springs Overview
$35,298
PER CAPITA INCOME
$64,864
AVG FAMILY INCOME
$49,007
AVG HOUSEHOLD INCOME
0.8%
WAGE / INCOME GAP [ % ]
99.2¢/ $1
WAGE / INCOME GAP [ $ ]
0.39
INEQUALITY / GINI INDEX
4,540
TOTAL POPULATION
2,178
MALE POPULATION
2,362
FEMALE POPULATION
92.21
MALES / 100 FEMALES
108.45
FEMALES / 100 MALES
72.4
MEDIAN AGE
2.2
AVG FAMILY SIZE
1.8
AVG HOUSEHOLD SIZE
799
LABOR FORCE [ PEOPLE ]
18.5%
PERCENT IN LABOR FORCE
4.0%
UNEMPLOYMENT RATE
Income in Warm Mineral Springs
Income Overview in Warm Mineral Springs
Per Capita Income in Warm Mineral Springs is $35,298, while median incomes of families and households are $64,864 and $49,007 respectively.
| Characteristic | Number | Measure |
| Per Capita Income | 4,540 | $35,298 |
| Median Family Income | 1,340 | $64,864 |
| Mean Family Income | 1,340 | $73,112 |
| Median Household Income | 2,567 | $49,007 |
| Mean Household Income | 2,567 | $62,460 |
| Income Deficit | 1,340 | $0 |
| Wage / Income Gap (%) | 4,540 | 0.77% |
| Wage / Income Gap ($) | 4,540 | 99.23¢ per $1 |
| Gini / Inequality Index | 4,540 | 0.39 |
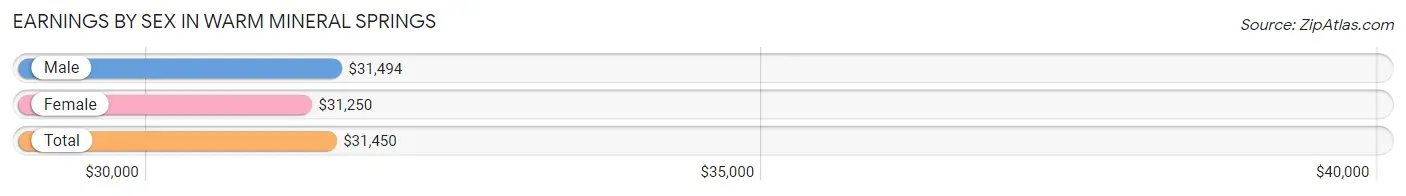
Earnings by Sex in Warm Mineral Springs
Average Earnings in Warm Mineral Springs are $31,450, $31,494 for men and $31,250 for women, a difference of 0.8%.
| Sex | Number | Average Earnings |
| Male | 466 (51.3%) | $31,494 |
| Female | 442 (48.7%) | $31,250 |
| Total | 908 (100.0%) | $31,450 |
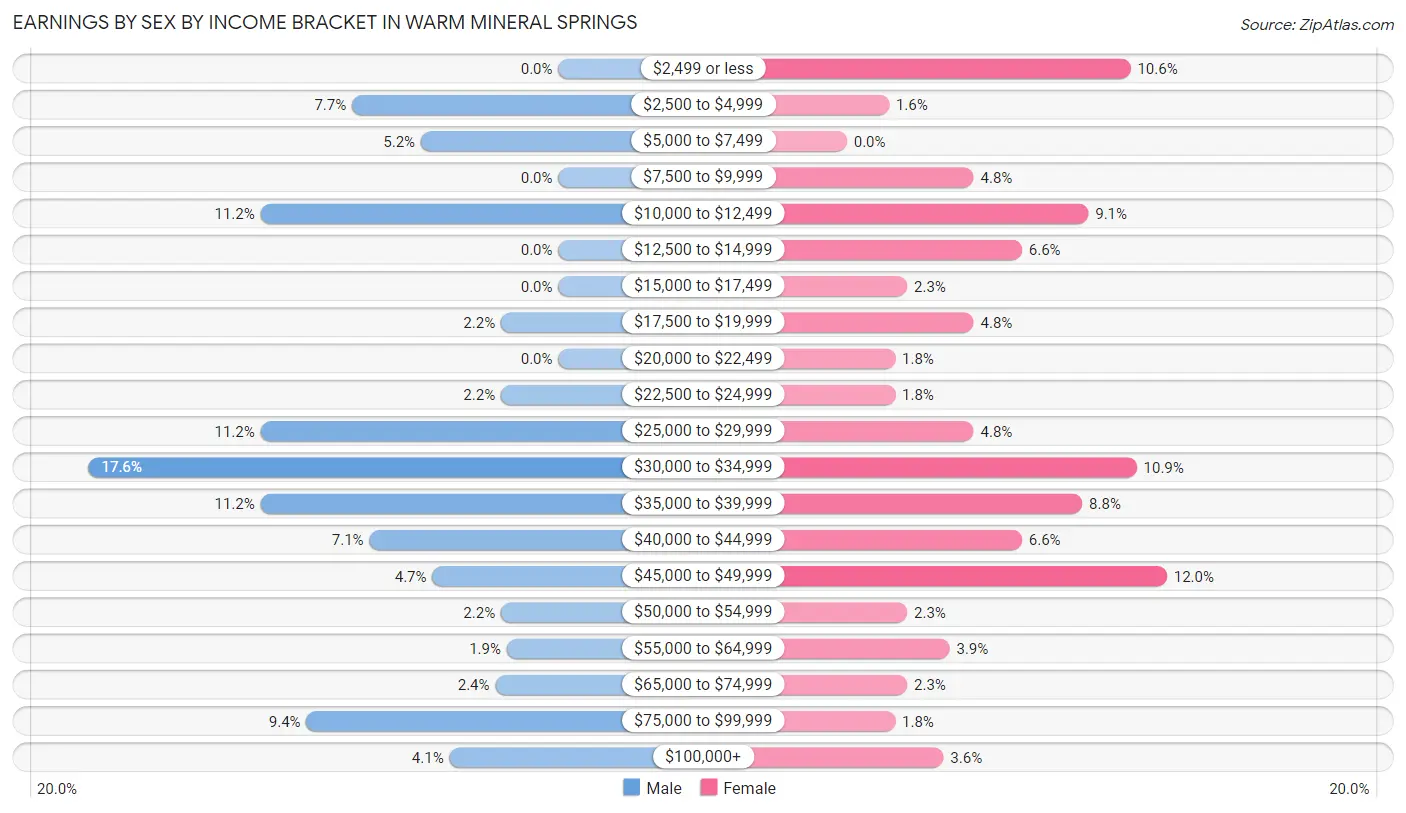
Earnings by Sex by Income Bracket in Warm Mineral Springs
The most common earnings brackets in Warm Mineral Springs are $30,000 to $34,999 for men (82 | 17.6%) and $45,000 to $49,999 for women (53 | 12.0%).
| Income | Male | Female |
| $2,499 or less | 0 (0.0%) | 47 (10.6%) |
| $2,500 to $4,999 | 36 (7.7%) | 7 (1.6%) |
| $5,000 to $7,499 | 24 (5.1%) | 0 (0.0%) |
| $7,500 to $9,999 | 0 (0.0%) | 21 (4.8%) |
| $10,000 to $12,499 | 52 (11.2%) | 40 (9.0%) |
| $12,500 to $14,999 | 0 (0.0%) | 29 (6.6%) |
| $15,000 to $17,499 | 0 (0.0%) | 10 (2.3%) |
| $17,500 to $19,999 | 10 (2.1%) | 21 (4.8%) |
| $20,000 to $22,499 | 0 (0.0%) | 8 (1.8%) |
| $22,500 to $24,999 | 10 (2.1%) | 8 (1.8%) |
| $25,000 to $29,999 | 52 (11.2%) | 21 (4.8%) |
| $30,000 to $34,999 | 82 (17.6%) | 48 (10.9%) |
| $35,000 to $39,999 | 52 (11.2%) | 39 (8.8%) |
| $40,000 to $44,999 | 33 (7.1%) | 29 (6.6%) |
| $45,000 to $49,999 | 22 (4.7%) | 53 (12.0%) |
| $50,000 to $54,999 | 10 (2.1%) | 10 (2.3%) |
| $55,000 to $64,999 | 9 (1.9%) | 17 (3.8%) |
| $65,000 to $74,999 | 11 (2.4%) | 10 (2.3%) |
| $75,000 to $99,999 | 44 (9.4%) | 8 (1.8%) |
| $100,000+ | 19 (4.1%) | 16 (3.6%) |
| Total | 466 (100.0%) | 442 (100.0%) |
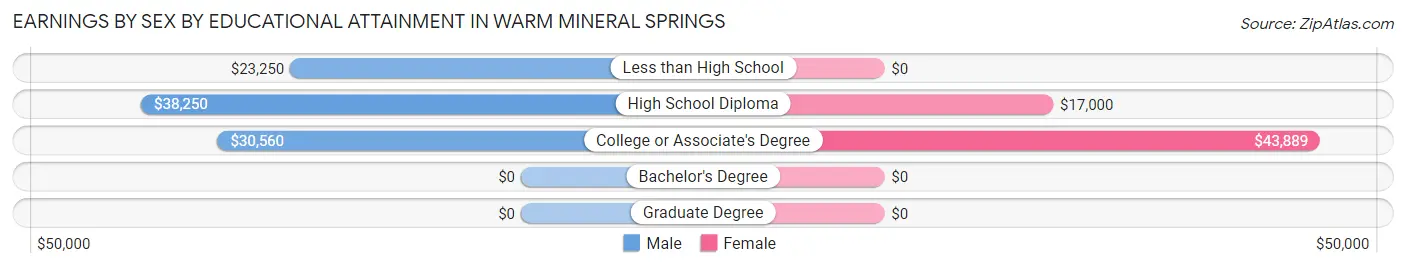
Earnings by Sex by Educational Attainment in Warm Mineral Springs
Average earnings in Warm Mineral Springs are $31,692 for men and $32,083 for women, a difference of 1.2%. Men with an educational attainment of high school diploma enjoy the highest average annual earnings of $38,250, while those with less than high school education earn the least with $23,250. Women with an educational attainment of college or associate's degree earn the most with the average annual earnings of $43,889, while those with high school diploma education have the smallest earnings of $17,000.
| Educational Attainment | Male Income | Female Income |
| Less than High School | $23,250 | $0 |
| High School Diploma | $38,250 | $17,000 |
| College or Associate's Degree | $30,560 | $43,889 |
| Bachelor's Degree | - | - |
| Graduate Degree | - | - |
| Total | $31,692 | $32,083 |
Family Income in Warm Mineral Springs
Family Income Brackets in Warm Mineral Springs
According to the Warm Mineral Springs family income data, there are 486 families falling into the $50,000 to $74,999 income range, which is the most common income bracket and makes up 36.3% of all families. Conversely, the less than $10,000 income bracket is the least frequent group with only 7 families (0.5%) belonging to this category.
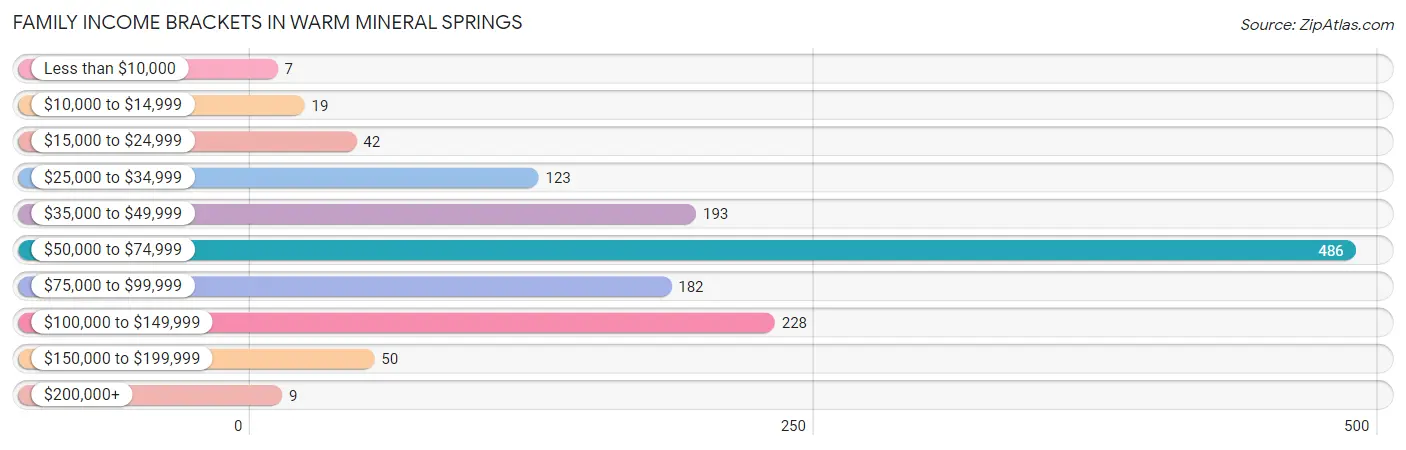
| Income Bracket | # Families | % Families |
| Less than $10,000 | 7 | 0.5% |
| $10,000 to $14,999 | 19 | 1.4% |
| $15,000 to $24,999 | 42 | 3.1% |
| $25,000 to $34,999 | 123 | 9.2% |
| $35,000 to $49,999 | 193 | 14.4% |
| $50,000 to $74,999 | 486 | 36.3% |
| $75,000 to $99,999 | 182 | 13.6% |
| $100,000 to $149,999 | 228 | 17.0% |
| $150,000 to $199,999 | 50 | 3.7% |
| $200,000+ | 9 | 0.7% |
Family Income by Famaliy Size in Warm Mineral Springs
3-person families (100 | 7.5%) account for the highest median family income in Warm Mineral Springs with $69,318 per family, while 2-person families (1,184 | 88.4%) have the highest median income of $32,182 per family member.
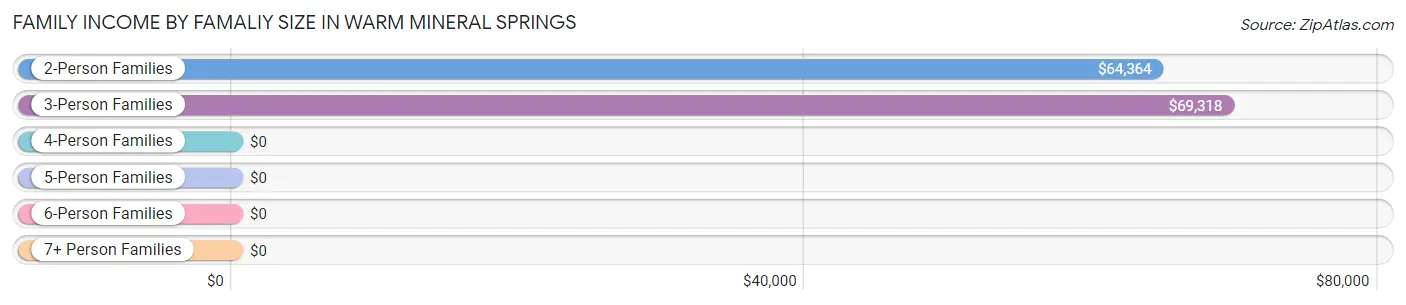
| Income Bracket | # Families | Median Income |
| 2-Person Families | 1,184 (88.4%) | $64,364 |
| 3-Person Families | 100 (7.5%) | $69,318 |
| 4-Person Families | 33 (2.5%) | $0 |
| 5-Person Families | 12 (0.9%) | $0 |
| 6-Person Families | 11 (0.8%) | $0 |
| 7+ Person Families | 0 (0.0%) | $0 |
| Total | 1,340 (100.0%) | $64,864 |
Family Income by Number of Earners in Warm Mineral Springs
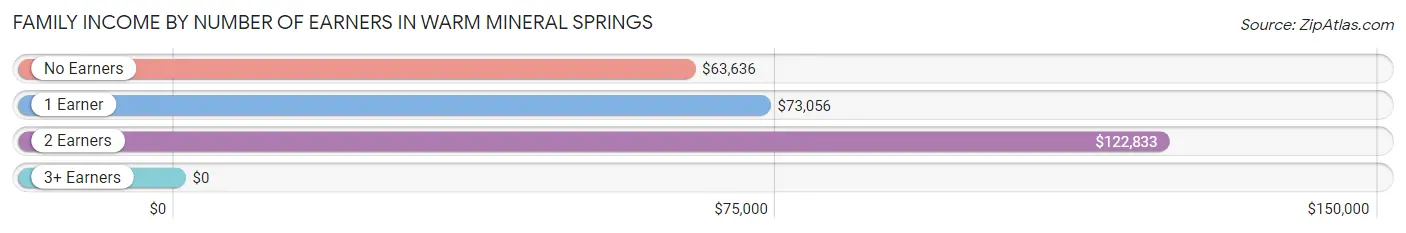
| Number of Earners | # Families | Median Income |
| No Earners | 958 (71.5%) | $63,636 |
| 1 Earner | 230 (17.2%) | $73,056 |
| 2 Earners | 124 (9.2%) | $122,833 |
| 3+ Earners | 28 (2.1%) | $0 |
| Total | 1,340 (100.0%) | $64,864 |
Household Income in Warm Mineral Springs
Household Income Brackets in Warm Mineral Springs
With 598 households falling in the category, the $50,000 to $74,999 income range is the most frequent in Warm Mineral Springs, accounting for 23.3% of all households. In contrast, only 46 households (1.8%) fall into the $200,000+ income bracket, making it the least populous group.
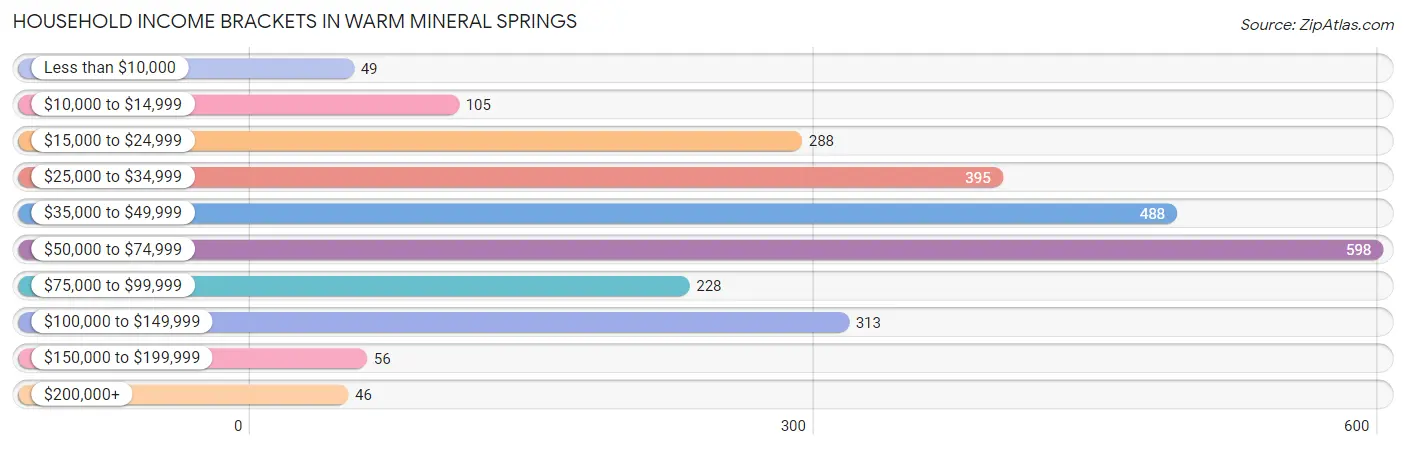
| Income Bracket | # Households | % Households |
| Less than $10,000 | 49 | 1.9% |
| $10,000 to $14,999 | 105 | 4.1% |
| $15,000 to $24,999 | 288 | 11.2% |
| $25,000 to $34,999 | 395 | 15.4% |
| $35,000 to $49,999 | 488 | 19.0% |
| $50,000 to $74,999 | 598 | 23.3% |
| $75,000 to $99,999 | 228 | 8.9% |
| $100,000 to $149,999 | 313 | 12.2% |
| $150,000 to $199,999 | 56 | 2.2% |
| $200,000+ | 46 | 1.8% |
Household Income by Householder Age in Warm Mineral Springs
The median household income in Warm Mineral Springs is $49,007, with the highest median household income of $62,000 found in the 45 to 64 years age bracket for the primary householder. A total of 398 households (15.5%) fall into this category.
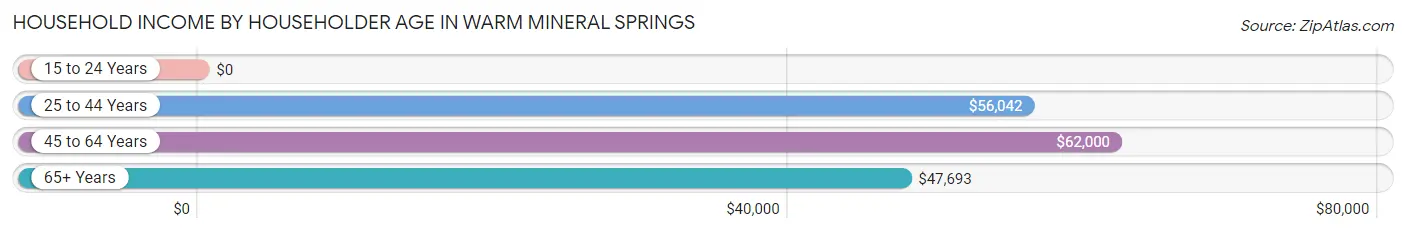
| Income Bracket | # Households | Median Income |
| 15 to 24 Years | 0 (0.0%) | $0 |
| 25 to 44 Years | 102 (4.0%) | $56,042 |
| 45 to 64 Years | 398 (15.5%) | $62,000 |
| 65+ Years | 2,067 (80.5%) | $47,693 |
| Total | 2,567 (100.0%) | $49,007 |
Poverty in Warm Mineral Springs
Income Below Poverty by Sex and Age in Warm Mineral Springs
With 7.3% poverty level for males and 9.9% for females among the residents of Warm Mineral Springs, 35 to 44 year old males and under 5 year old females are the most vulnerable to poverty, with 11 males (50.0%) and 22 females (100.0%) in their respective age groups living below the poverty level.
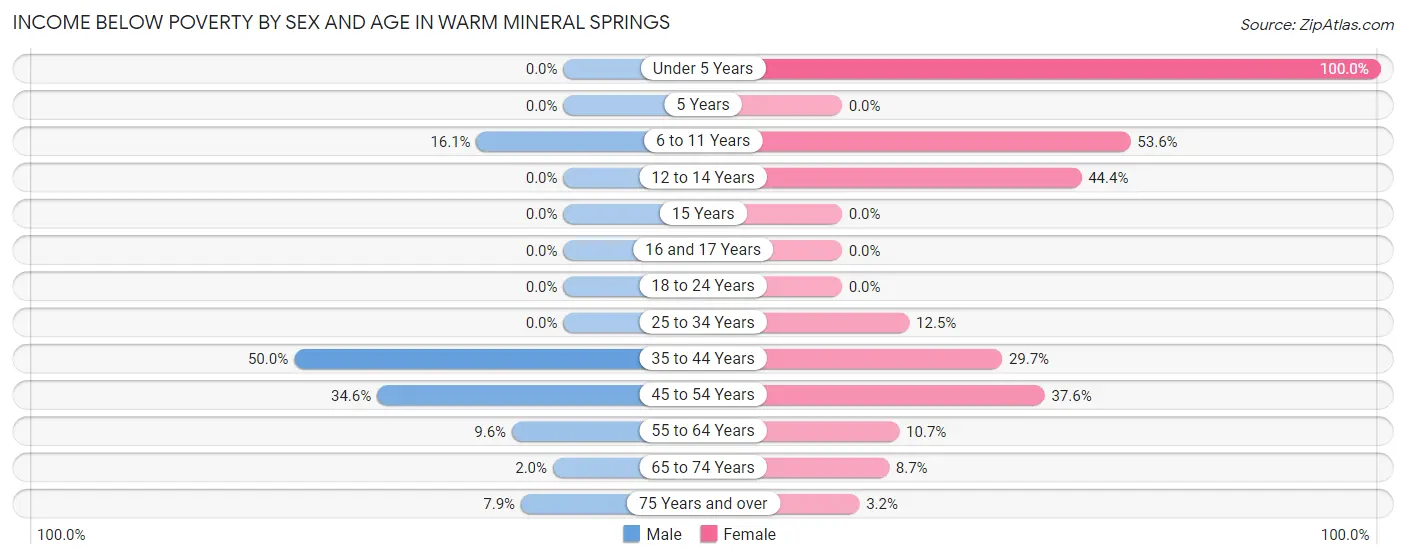
| Age Bracket | Male | Female |
| Under 5 Years | 0 (0.0%) | 22 (100.0%) |
| 5 Years | 0 (0.0%) | 0 (0.0%) |
| 6 to 11 Years | 10 (16.1%) | 15 (53.6%) |
| 12 to 14 Years | 0 (0.0%) | 12 (44.4%) |
| 15 Years | 0 (0.0%) | 0 (0.0%) |
| 16 and 17 Years | 0 (0.0%) | 0 (0.0%) |
| 18 to 24 Years | 0 (0.0%) | 0 (0.0%) |
| 25 to 34 Years | 0 (0.0%) | 11 (12.5%) |
| 35 to 44 Years | 11 (50.0%) | 11 (29.7%) |
| 45 to 54 Years | 37 (34.6%) | 38 (37.6%) |
| 55 to 64 Years | 21 (9.6%) | 28 (10.6%) |
| 65 to 74 Years | 15 (1.9%) | 58 (8.7%) |
| 75 Years and over | 65 (7.9%) | 35 (3.2%) |
| Total | 159 (7.3%) | 230 (9.9%) |
Income Above Poverty by Sex and Age in Warm Mineral Springs
According to the poverty statistics in Warm Mineral Springs, males aged under 5 years and females aged 18 to 24 years are the age groups that are most secure financially, with 100.0% of males and 100.0% of females in these age groups living above the poverty line.
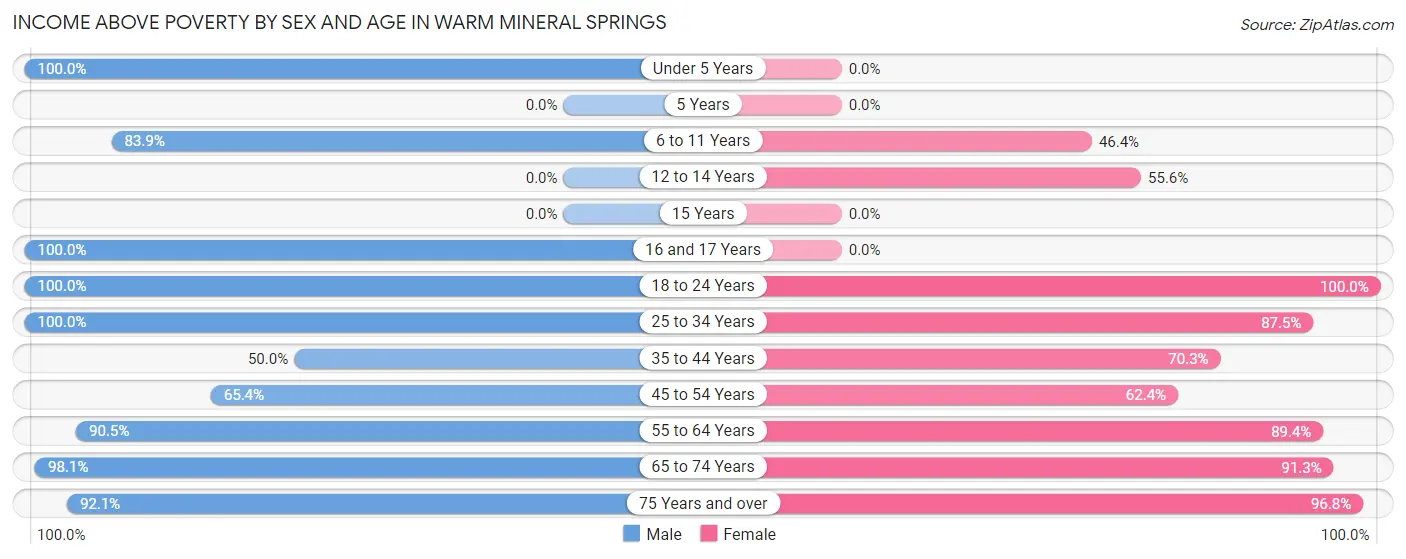
| Age Bracket | Male | Female |
| Under 5 Years | 29 (100.0%) | 0 (0.0%) |
| 5 Years | 0 (0.0%) | 0 (0.0%) |
| 6 to 11 Years | 52 (83.9%) | 13 (46.4%) |
| 12 to 14 Years | 0 (0.0%) | 15 (55.6%) |
| 15 Years | 0 (0.0%) | 0 (0.0%) |
| 16 and 17 Years | 10 (100.0%) | 0 (0.0%) |
| 18 to 24 Years | 13 (100.0%) | 12 (100.0%) |
| 25 to 34 Years | 105 (100.0%) | 77 (87.5%) |
| 35 to 44 Years | 11 (50.0%) | 26 (70.3%) |
| 45 to 54 Years | 70 (65.4%) | 63 (62.4%) |
| 55 to 64 Years | 199 (90.4%) | 235 (89.3%) |
| 65 to 74 Years | 753 (98.1%) | 606 (91.3%) |
| 75 Years and over | 761 (92.1%) | 1,046 (96.8%) |
| Total | 2,003 (92.6%) | 2,093 (90.1%) |
Income Below Poverty Among Married-Couple Families in Warm Mineral Springs
The poverty statistics for married-couple families in Warm Mineral Springs show that 1.2% or 15 of the total 1,281 families live below the poverty line. Families with no children have the highest poverty rate of 1.2%, comprising of 15 families. On the other hand, families with 1 or 2 children have the lowest poverty rate of 0.0%, which includes 0 families.
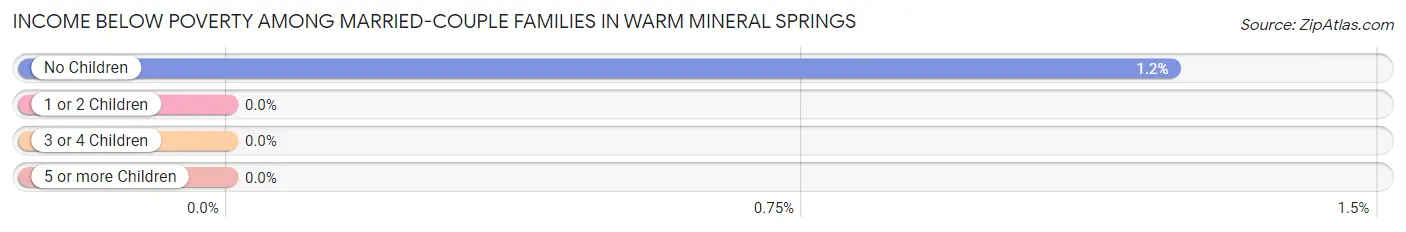
| Children | Above Poverty | Below Poverty |
| No Children | 1,205 (98.8%) | 15 (1.2%) |
| 1 or 2 Children | 49 (100.0%) | 0 (0.0%) |
| 3 or 4 Children | 12 (100.0%) | 0 (0.0%) |
| 5 or more Children | 0 (0.0%) | 0 (0.0%) |
| Total | 1,266 (98.8%) | 15 (1.2%) |
Income Below Poverty Among Single-Parent Households in Warm Mineral Springs
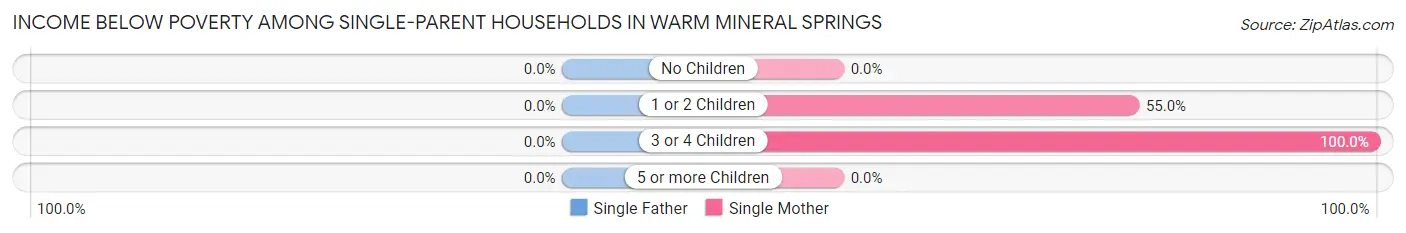
| Children | Single Father | Single Mother |
| No Children | 0 (0.0%) | 0 (0.0%) |
| 1 or 2 Children | 0 (0.0%) | 11 (55.0%) |
| 3 or 4 Children | 0 (0.0%) | 11 (100.0%) |
| 5 or more Children | 0 (0.0%) | 0 (0.0%) |
| Total | 0 (0.0%) | 22 (44.0%) |
Income Below Poverty Among Married-Couple vs Single-Parent Households in Warm Mineral Springs
The poverty data for Warm Mineral Springs shows that 15 of the married-couple family households (1.2%) and 22 of the single-parent households (37.3%) are living below the poverty level. Within the married-couple family households, those with no children have the highest poverty rate, with 15 households (1.2%) falling below the poverty line. Among the single-parent households, those with 3 or 4 children have the highest poverty rate, with 11 household (100.0%) living below poverty.
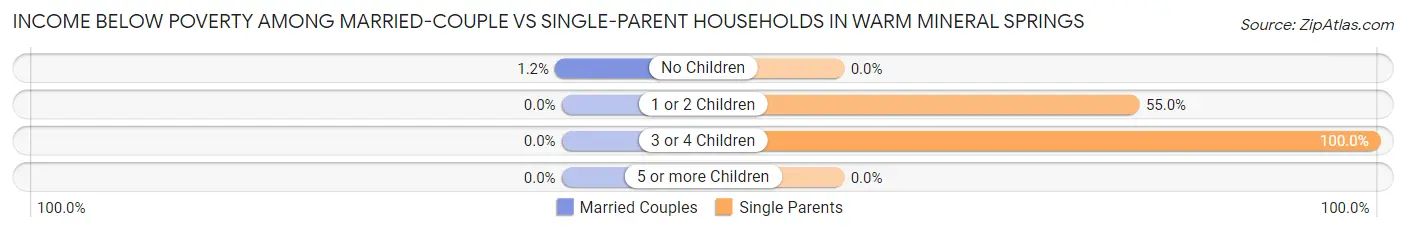
| Children | Married-Couple Families | Single-Parent Households |
| No Children | 15 (1.2%) | 0 (0.0%) |
| 1 or 2 Children | 0 (0.0%) | 11 (55.0%) |
| 3 or 4 Children | 0 (0.0%) | 11 (100.0%) |
| 5 or more Children | 0 (0.0%) | 0 (0.0%) |
| Total | 15 (1.2%) | 22 (37.3%) |
Race in Warm Mineral Springs
The most populous races in Warm Mineral Springs are White / Caucasian (4,338 | 95.6%), Hispanic or Latino (164 | 3.6%), and Asian (75 | 1.7%).
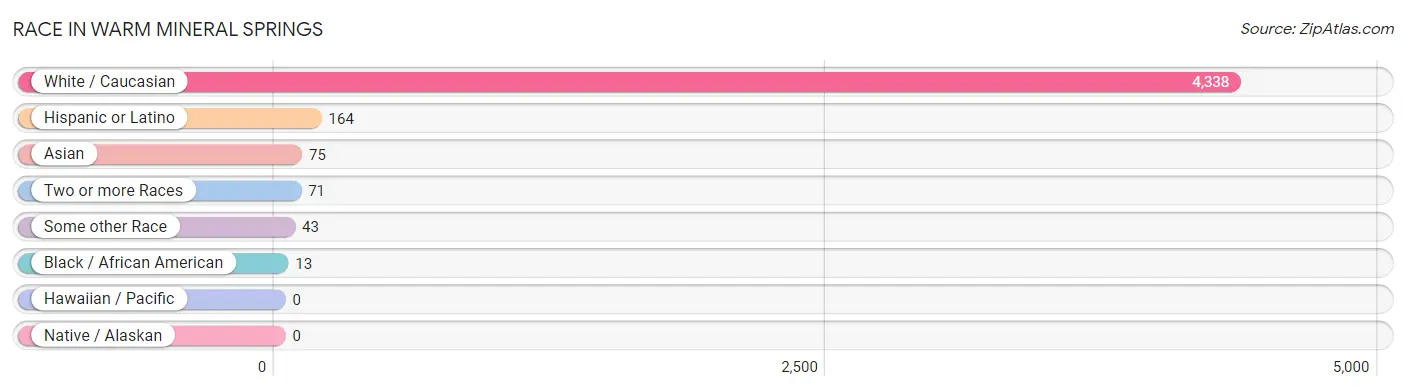
| Race | # Population | % Population |
| Asian | 75 | 1.7% |
| Black / African American | 13 | 0.3% |
| Hawaiian / Pacific | 0 | 0.0% |
| Hispanic or Latino | 164 | 3.6% |
| Native / Alaskan | 0 | 0.0% |
| White / Caucasian | 4,338 | 95.6% |
| Two or more Races | 71 | 1.6% |
| Some other Race | 43 | 0.9% |
| Total | 4,540 | 100.0% |
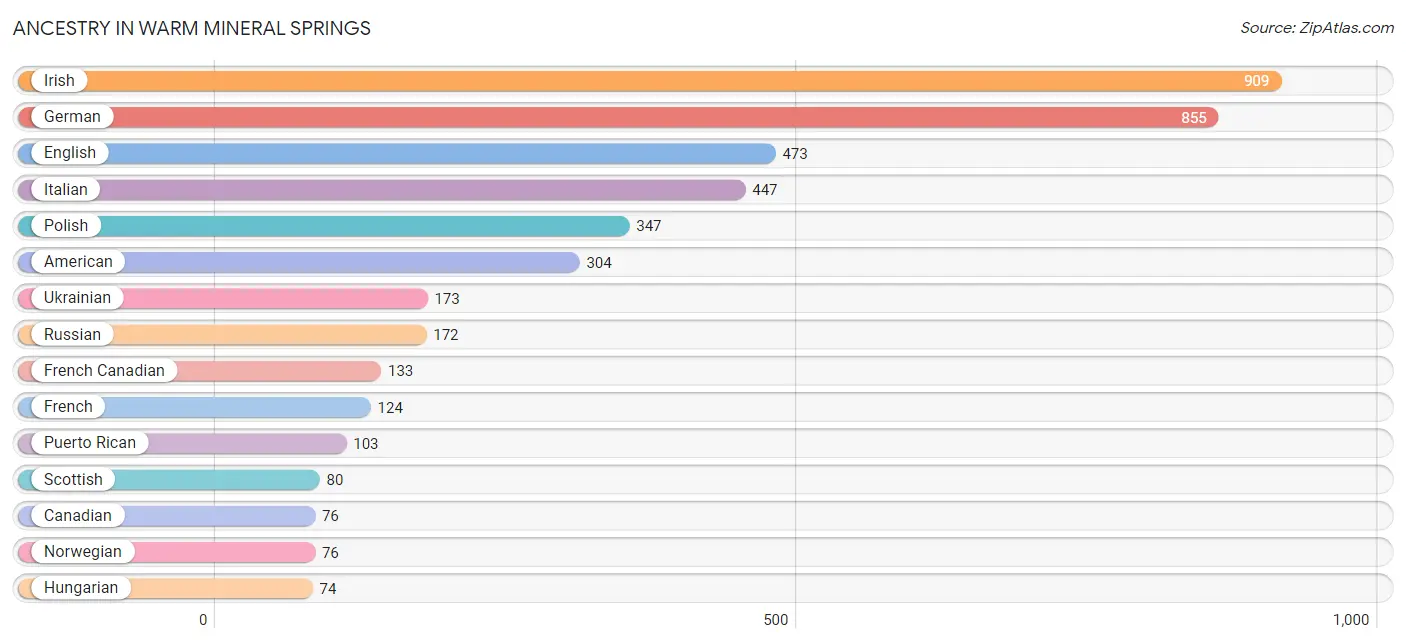
Ancestry in Warm Mineral Springs
The most populous ancestries reported in Warm Mineral Springs are Irish (909 | 20.0%), German (855 | 18.8%), English (473 | 10.4%), Italian (447 | 9.9%), and Polish (347 | 7.6%), together accounting for 66.8% of all Warm Mineral Springs residents.
| Ancestry | # Population | % Population |
| American | 304 | 6.7% |
| Armenian | 20 | 0.4% |
| Austrian | 10 | 0.2% |
| British | 26 | 0.6% |
| Burmese | 18 | 0.4% |
| Canadian | 76 | 1.7% |
| Croatian | 9 | 0.2% |
| Cuban | 7 | 0.2% |
| Czech | 13 | 0.3% |
| Czechoslovakian | 16 | 0.4% |
| Danish | 24 | 0.5% |
| Dutch | 69 | 1.5% |
| Eastern European | 10 | 0.2% |
| English | 473 | 10.4% |
| European | 35 | 0.8% |
| Finnish | 8 | 0.2% |
| French | 124 | 2.7% |
| French Canadian | 133 | 2.9% |
| German | 855 | 18.8% |
| Greek | 18 | 0.4% |
| Hungarian | 74 | 1.6% |
| Icelander | 17 | 0.4% |
| Irish | 909 | 20.0% |
| Iroquois | 8 | 0.2% |
| Italian | 447 | 9.9% |
| Lithuanian | 9 | 0.2% |
| Mexican | 34 | 0.7% |
| Norwegian | 76 | 1.7% |
| Pakistani | 28 | 0.6% |
| Polish | 347 | 7.6% |
| Portuguese | 51 | 1.1% |
| Puerto Rican | 103 | 2.3% |
| Russian | 172 | 3.8% |
| Scandinavian | 15 | 0.3% |
| Scotch-Irish | 44 | 1.0% |
| Scottish | 80 | 1.8% |
| Serbian | 50 | 1.1% |
| Slovak | 26 | 0.6% |
| Spaniard | 14 | 0.3% |
| Spanish | 6 | 0.1% |
| Sri Lankan | 18 | 0.4% |
| Swedish | 64 | 1.4% |
| Swiss | 7 | 0.2% |
| Ukrainian | 173 | 3.8% |
| Vietnamese | 11 | 0.2% |
| Welsh | 23 | 0.5% | View All 46 Rows |
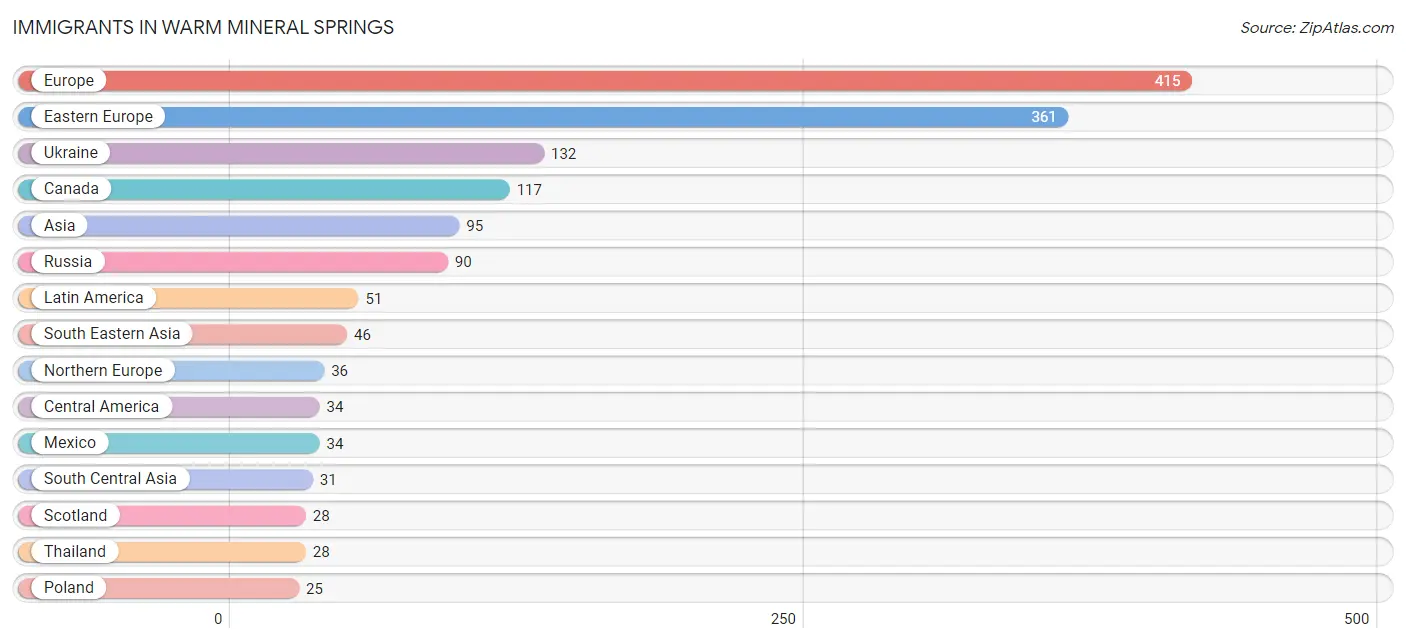
Immigrants in Warm Mineral Springs
The most numerous immigrant groups reported in Warm Mineral Springs came from Europe (415 | 9.1%), Eastern Europe (361 | 8.0%), Ukraine (132 | 2.9%), Canada (117 | 2.6%), and Asia (95 | 2.1%), together accounting for 24.7% of all Warm Mineral Springs residents.
| Immigration Origin | # Population | % Population |
| Asia | 95 | 2.1% |
| Bangladesh | 11 | 0.2% |
| Bosnia and Herzegovina | 9 | 0.2% |
| Canada | 117 | 2.6% |
| Caribbean | 17 | 0.4% |
| Central America | 34 | 0.7% |
| Eastern Asia | 18 | 0.4% |
| Eastern Europe | 361 | 8.0% |
| England | 8 | 0.2% |
| Europe | 415 | 9.1% |
| Germany | 9 | 0.2% |
| Iran | 20 | 0.4% |
| Italy | 9 | 0.2% |
| Korea | 18 | 0.4% |
| Latin America | 51 | 1.1% |
| Lithuania | 9 | 0.2% |
| Mexico | 34 | 0.7% |
| Northern Europe | 36 | 0.8% |
| Poland | 25 | 0.5% |
| Romania | 25 | 0.5% |
| Russia | 90 | 2.0% |
| Scotland | 28 | 0.6% |
| Serbia | 20 | 0.4% |
| South Central Asia | 31 | 0.7% |
| South Eastern Asia | 46 | 1.0% |
| Southern Europe | 9 | 0.2% |
| Thailand | 28 | 0.6% |
| Trinidad and Tobago | 17 | 0.4% |
| Ukraine | 132 | 2.9% |
| Vietnam | 18 | 0.4% |
| Western Europe | 9 | 0.2% | View All 31 Rows |
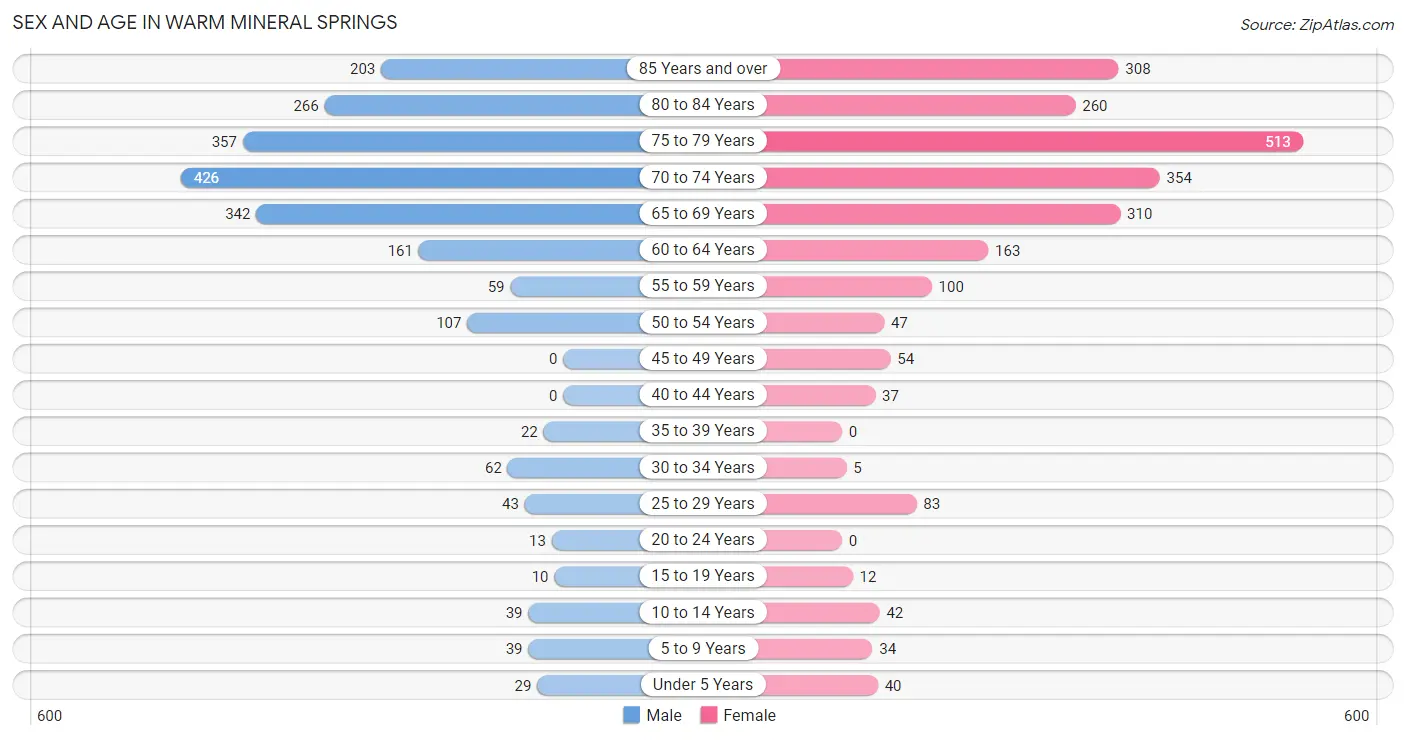
Sex and Age in Warm Mineral Springs
Sex and Age in Warm Mineral Springs
The most populous age groups in Warm Mineral Springs are 70 to 74 Years (426 | 19.6%) for men and 75 to 79 Years (513 | 21.7%) for women.
| Age Bracket | Male | Female |
| Under 5 Years | 29 (1.3%) | 40 (1.7%) |
| 5 to 9 Years | 39 (1.8%) | 34 (1.4%) |
| 10 to 14 Years | 39 (1.8%) | 42 (1.8%) |
| 15 to 19 Years | 10 (0.5%) | 12 (0.5%) |
| 20 to 24 Years | 13 (0.6%) | 0 (0.0%) |
| 25 to 29 Years | 43 (2.0%) | 83 (3.5%) |
| 30 to 34 Years | 62 (2.9%) | 5 (0.2%) |
| 35 to 39 Years | 22 (1.0%) | 0 (0.0%) |
| 40 to 44 Years | 0 (0.0%) | 37 (1.6%) |
| 45 to 49 Years | 0 (0.0%) | 54 (2.3%) |
| 50 to 54 Years | 107 (4.9%) | 47 (2.0%) |
| 55 to 59 Years | 59 (2.7%) | 100 (4.2%) |
| 60 to 64 Years | 161 (7.4%) | 163 (6.9%) |
| 65 to 69 Years | 342 (15.7%) | 310 (13.1%) |
| 70 to 74 Years | 426 (19.6%) | 354 (15.0%) |
| 75 to 79 Years | 357 (16.4%) | 513 (21.7%) |
| 80 to 84 Years | 266 (12.2%) | 260 (11.0%) |
| 85 Years and over | 203 (9.3%) | 308 (13.0%) |
| Total | 2,178 (100.0%) | 2,362 (100.0%) |
Families and Households in Warm Mineral Springs
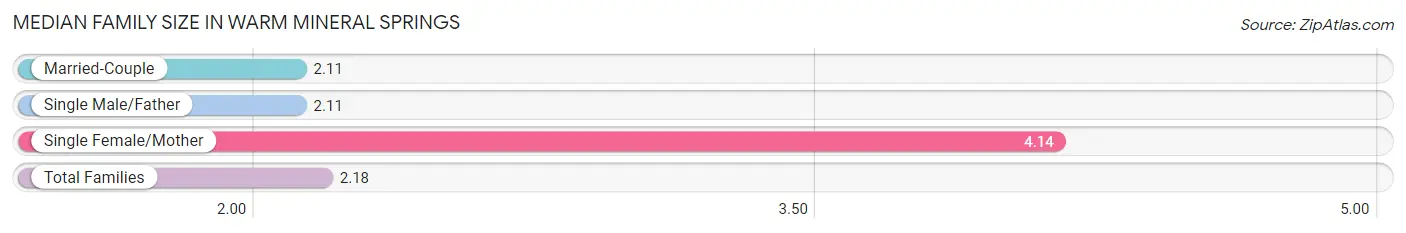
Median Family Size in Warm Mineral Springs
The median family size in Warm Mineral Springs is 2.18 persons per family, with single female/mother families (50 | 3.7%) accounting for the largest median family size of 4.14 persons per family. On the other hand, married-couple families (1,281 | 95.6%) represent the smallest median family size with 2.11 persons per family.
| Family Type | # Families | Family Size |
| Married-Couple | 1,281 (95.6%) | 2.11 |
| Single Male/Father | 9 (0.7%) | 2.11 |
| Single Female/Mother | 50 (3.7%) | 4.14 |
| Total Families | 1,340 (100.0%) | 2.18 |
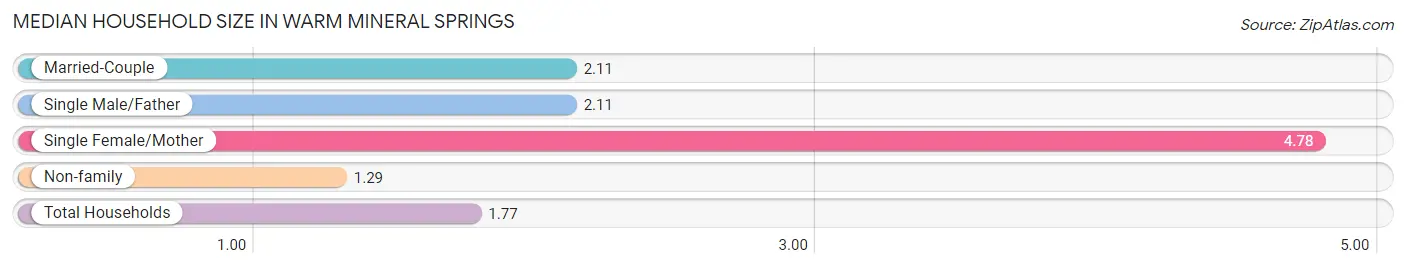
Median Household Size in Warm Mineral Springs
The median household size in Warm Mineral Springs is 1.77 persons per household, with single female/mother households (50 | 1.9%) accounting for the largest median household size of 4.78 persons per household. non-family households (1,227 | 47.8%) represent the smallest median household size with 1.29 persons per household.
| Household Type | # Households | Household Size |
| Married-Couple | 1,281 (49.9%) | 2.11 |
| Single Male/Father | 9 (0.4%) | 2.11 |
| Single Female/Mother | 50 (1.9%) | 4.78 |
| Non-family | 1,227 (47.8%) | 1.29 |
| Total Households | 2,567 (100.0%) | 1.77 |
Household Size by Marriage Status in Warm Mineral Springs
Out of a total of 2,567 households in Warm Mineral Springs, 1,340 (52.2%) are family households, while 1,227 (47.8%) are nonfamily households. The most numerous type of family households are 2-person households, comprising 1,175, and the most common type of nonfamily households are 1-person households, comprising 1,019.
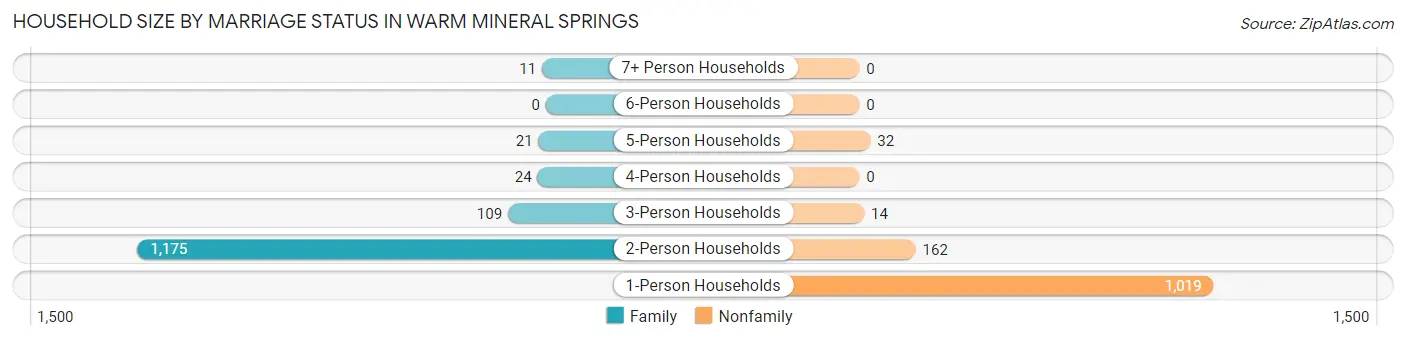
| Household Size | Family Households | Nonfamily Households |
| 1-Person Households | - | 1,019 (39.7%) |
| 2-Person Households | 1,175 (45.8%) | 162 (6.3%) |
| 3-Person Households | 109 (4.3%) | 14 (0.5%) |
| 4-Person Households | 24 (0.9%) | 0 (0.0%) |
| 5-Person Households | 21 (0.8%) | 32 (1.3%) |
| 6-Person Households | 0 (0.0%) | 0 (0.0%) |
| 7+ Person Households | 11 (0.4%) | 0 (0.0%) |
| Total | 1,340 (52.2%) | 1,227 (47.8%) |
Female Fertility in Warm Mineral Springs
Fertility by Age in Warm Mineral Springs
Average fertility rate in Warm Mineral Springs is 52.0 births per 1,000 women. Women in the age bracket of 20 to 34 years have the highest fertility rate with 125.0 births per 1,000 women. Women in the age bracket of 20 to 34 years acount for 100.0% of all women with births.
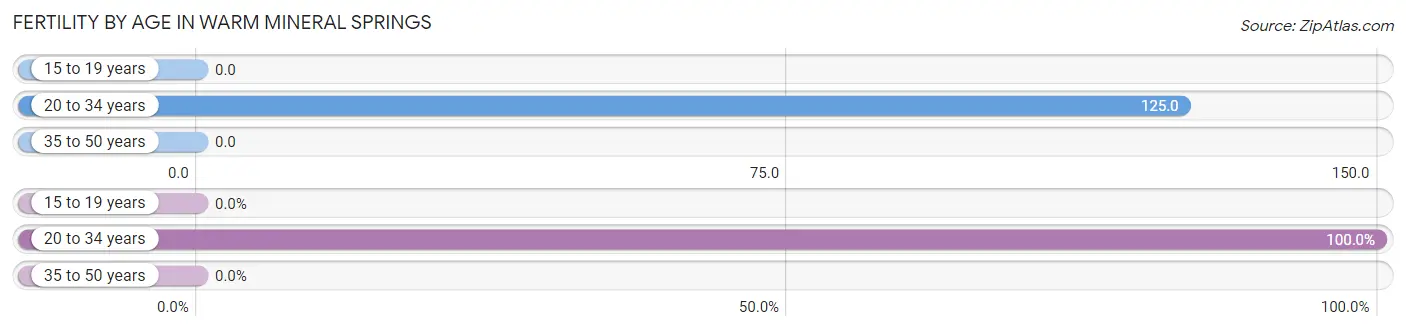
| Age Bracket | Women with Births | Births / 1,000 Women |
| 15 to 19 years | 0 (0.0%) | 0.0 |
| 20 to 34 years | 11 (100.0%) | 125.0 |
| 35 to 50 years | 0 (0.0%) | 0.0 |
| Total | 11 (100.0%) | 52.0 |
Fertility by Age by Marriage Status in Warm Mineral Springs
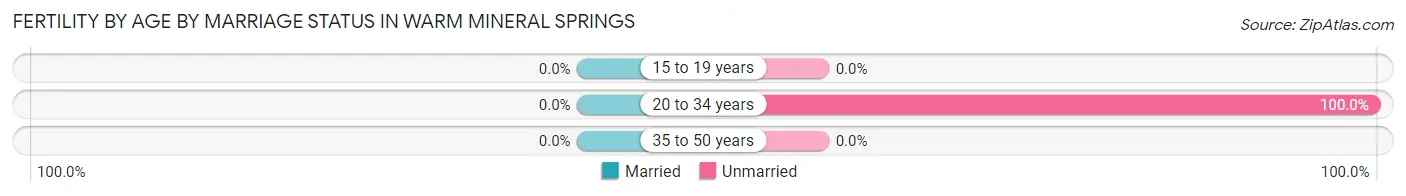
| Age Bracket | Married | Unmarried |
| 15 to 19 years | 0 (0.0%) | 0 (0.0%) |
| 20 to 34 years | 0 (0.0%) | 11 (100.0%) |
| 35 to 50 years | 0 (0.0%) | 0 (0.0%) |
| Total | 0 (0.0%) | 11 (100.0%) |
Fertility by Education in Warm Mineral Springs
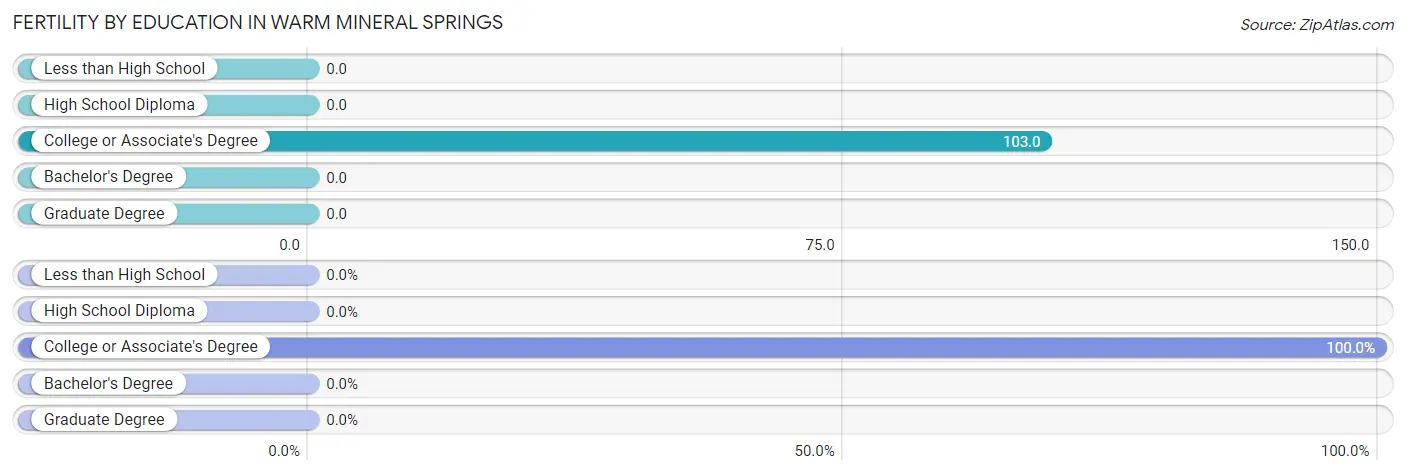
| Educational Attainment | Women with Births | Births / 1,000 Women |
| Less than High School | 0 (0.0%) | 0.0 |
| High School Diploma | 0 (0.0%) | 0.0 |
| College or Associate's Degree | 11 (100.0%) | 103.0 |
| Bachelor's Degree | 0 (0.0%) | 0.0 |
| Graduate Degree | 0 (0.0%) | 0.0 |
| Total | 11 (100.0%) | 52.0 |
Fertility by Education by Marriage Status in Warm Mineral Springs
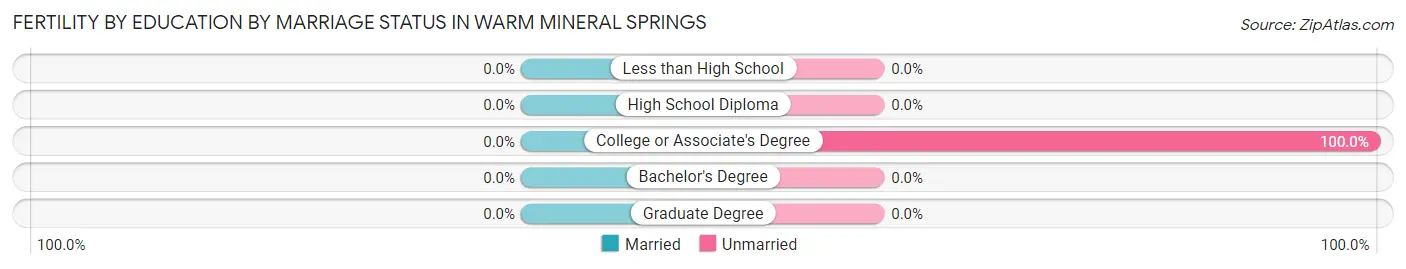
| Educational Attainment | Married | Unmarried |
| Less than High School | 0 (0.0%) | 0 (0.0%) |
| High School Diploma | 0 (0.0%) | 0 (0.0%) |
| College or Associate's Degree | 0 (0.0%) | 11 (100.0%) |
| Bachelor's Degree | 0 (0.0%) | 0 (0.0%) |
| Graduate Degree | 0 (0.0%) | 0 (0.0%) |
| Total | 0 (0.0%) | 11 (100.0%) |
Employment Characteristics in Warm Mineral Springs
Employment by Class of Employer in Warm Mineral Springs
Among the 739 employed individuals in Warm Mineral Springs, private company employees (481 | 65.1%), not-for-profit organizations (93 | 12.6%), and self-employed (not incorporated) (76 | 10.3%) make up the most common classes of employment.
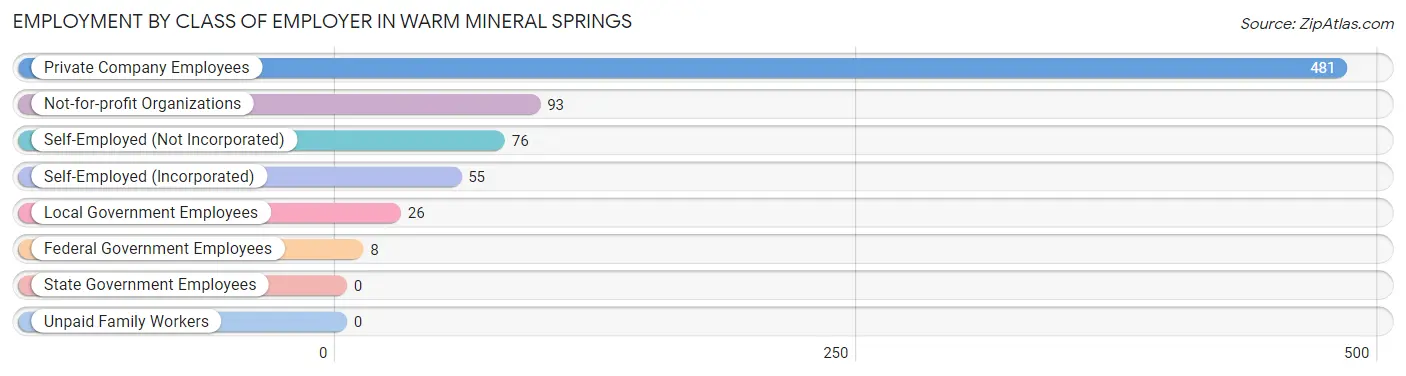
| Employer Class | # Employees | % Employees |
| Private Company Employees | 481 | 65.1% |
| Self-Employed (Incorporated) | 55 | 7.4% |
| Self-Employed (Not Incorporated) | 76 | 10.3% |
| Not-for-profit Organizations | 93 | 12.6% |
| Local Government Employees | 26 | 3.5% |
| State Government Employees | 0 | 0.0% |
| Federal Government Employees | 8 | 1.1% |
| Unpaid Family Workers | 0 | 0.0% |
| Total | 739 | 100.0% |
Employment Status by Age in Warm Mineral Springs
According to the labor force statistics for Warm Mineral Springs, out of the total population over 16 years of age (4,317), 18.5% or 799 individuals are in the labor force, with 4.0% or 32 of them unemployed. The age group with the highest labor force participation rate is 20 to 24 years, with 100.0% or 13 individuals in the labor force. Within the labor force, the 45 to 54 years age range has the highest percentage of unemployed individuals, with 9.7% or 15 of them being unemployed.
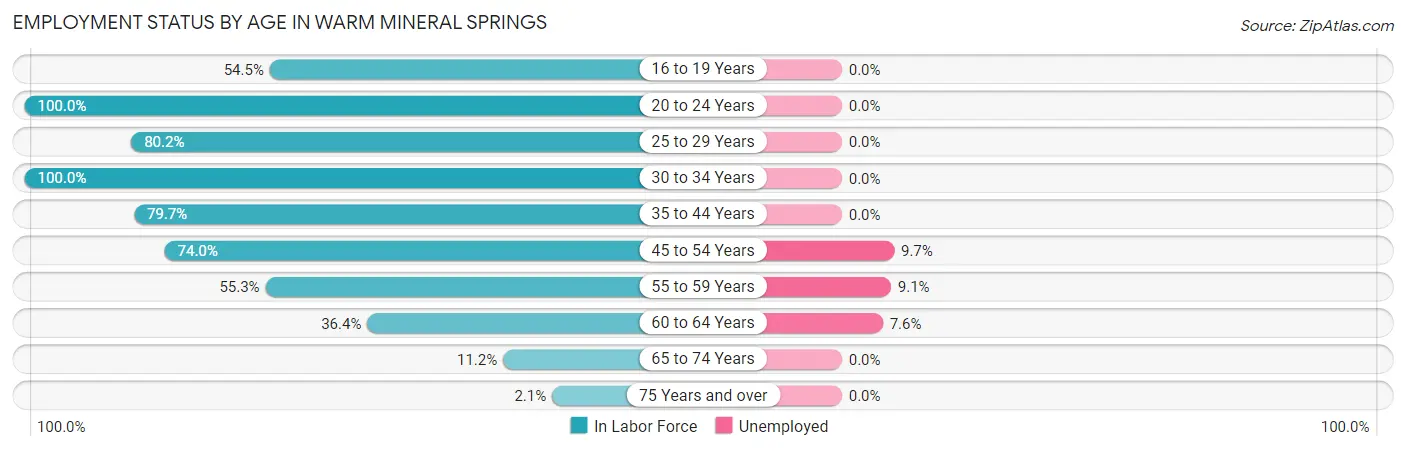
| Age Bracket | In Labor Force | Unemployed |
| 16 to 19 Years | 12 (54.5%) | 0 (0.0%) |
| 20 to 24 Years | 13 (100.0%) | 0 (0.0%) |
| 25 to 29 Years | 101 (80.2%) | 0 (0.0%) |
| 30 to 34 Years | 67 (100.0%) | 0 (0.0%) |
| 35 to 44 Years | 47 (79.7%) | 0 (0.0%) |
| 45 to 54 Years | 154 (74.0%) | 15 (9.7%) |
| 55 to 59 Years | 88 (55.3%) | 8 (9.1%) |
| 60 to 64 Years | 118 (36.4%) | 9 (7.6%) |
| 65 to 74 Years | 160 (11.2%) | 0 (0.0%) |
| 75 Years and over | 40 (2.1%) | 0 (0.0%) |
| Total | 799 (18.5%) | 32 (4.0%) |
Employment Status by Educational Attainment in Warm Mineral Springs
According to labor force statistics for Warm Mineral Springs, 61.0% of individuals (575) out of the total population between 25 and 64 years of age (943) are in the labor force, with 5.6% or 32 of them being unemployed. The group with the highest labor force participation rate are those with the educational attainment of less than high school, with 100.0% or 20 individuals in the labor force. Within the labor force, individuals with high school diploma education have the highest percentage of unemployment, with 7.8% or 17 of them being unemployed.
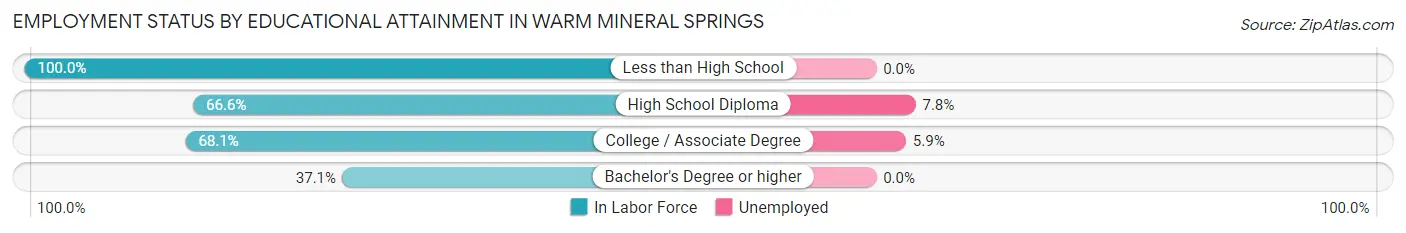
| Educational Attainment | In Labor Force | Unemployed |
| Less than High School | 20 (100.0%) | 0 (0.0%) |
| High School Diploma | 219 (66.6%) | 26 (7.8%) |
| College / Associate Degree | 254 (68.1%) | 22 (5.9%) |
| Bachelor's Degree or higher | 82 (37.1%) | 0 (0.0%) |
| Total | 575 (61.0%) | 53 (5.6%) |
Employment Occupations by Sex in Warm Mineral Springs
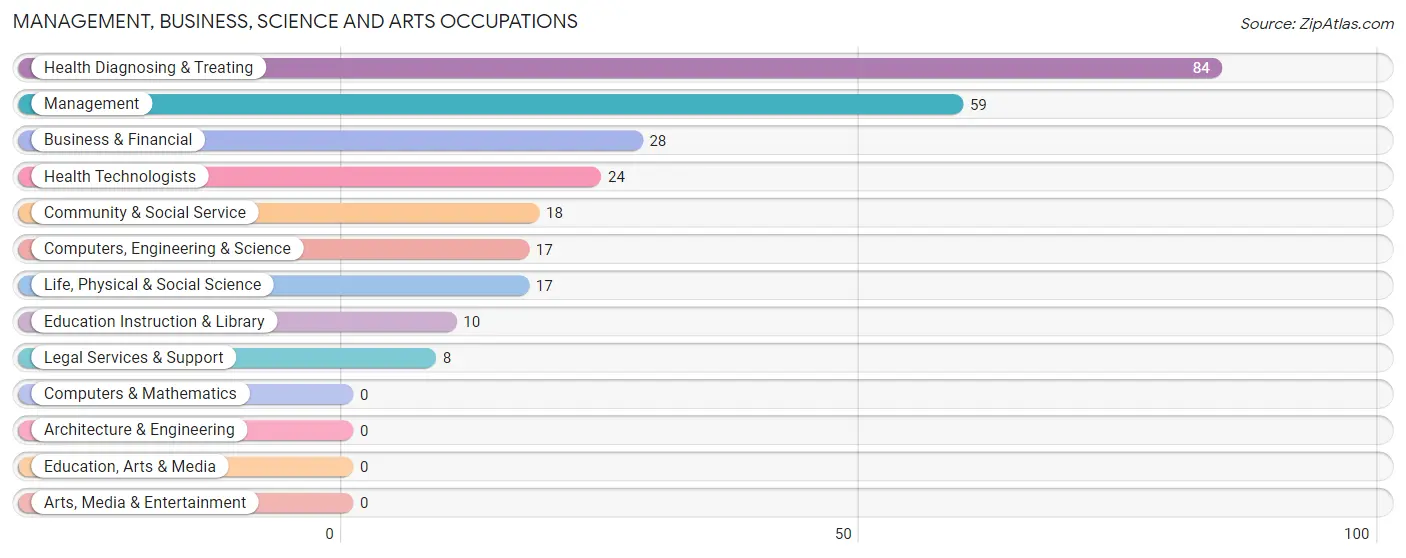
Management, Business, Science and Arts Occupations
The most common Management, Business, Science and Arts occupations in Warm Mineral Springs are Health Diagnosing & Treating (84 | 10.9%), Management (59 | 7.7%), Business & Financial (28 | 3.6%), Health Technologists (24 | 3.1%), and Community & Social Service (18 | 2.3%).
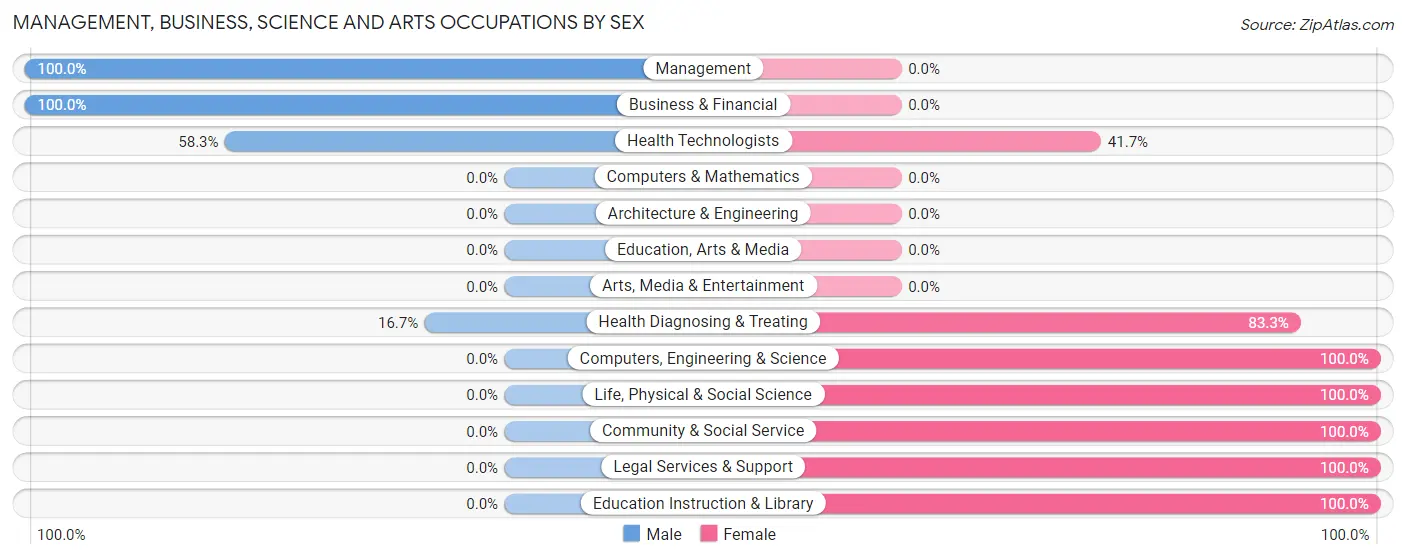
Management, Business, Science and Arts Occupations by Sex
Within the Management, Business, Science and Arts occupations in Warm Mineral Springs, the most male-oriented occupations are Management (100.0%), Business & Financial (100.0%), and Health Technologists (58.3%), while the most female-oriented occupations are Computers, Engineering & Science (100.0%), Life, Physical & Social Science (100.0%), and Community & Social Service (100.0%).
| Occupation | Male | Female |
| Management | 59 (100.0%) | 0 (0.0%) |
| Business & Financial | 28 (100.0%) | 0 (0.0%) |
| Computers, Engineering & Science | 0 (0.0%) | 17 (100.0%) |
| Computers & Mathematics | 0 (0.0%) | 0 (0.0%) |
| Architecture & Engineering | 0 (0.0%) | 0 (0.0%) |
| Life, Physical & Social Science | 0 (0.0%) | 17 (100.0%) |
| Community & Social Service | 0 (0.0%) | 18 (100.0%) |
| Education, Arts & Media | 0 (0.0%) | 0 (0.0%) |
| Legal Services & Support | 0 (0.0%) | 8 (100.0%) |
| Education Instruction & Library | 0 (0.0%) | 10 (100.0%) |
| Arts, Media & Entertainment | 0 (0.0%) | 0 (0.0%) |
| Health Diagnosing & Treating | 14 (16.7%) | 70 (83.3%) |
| Health Technologists | 14 (58.3%) | 10 (41.7%) |
| Total (Category) | 101 (49.0%) | 105 (51.0%) |
| Total (Overall) | 427 (55.6%) | 341 (44.4%) |
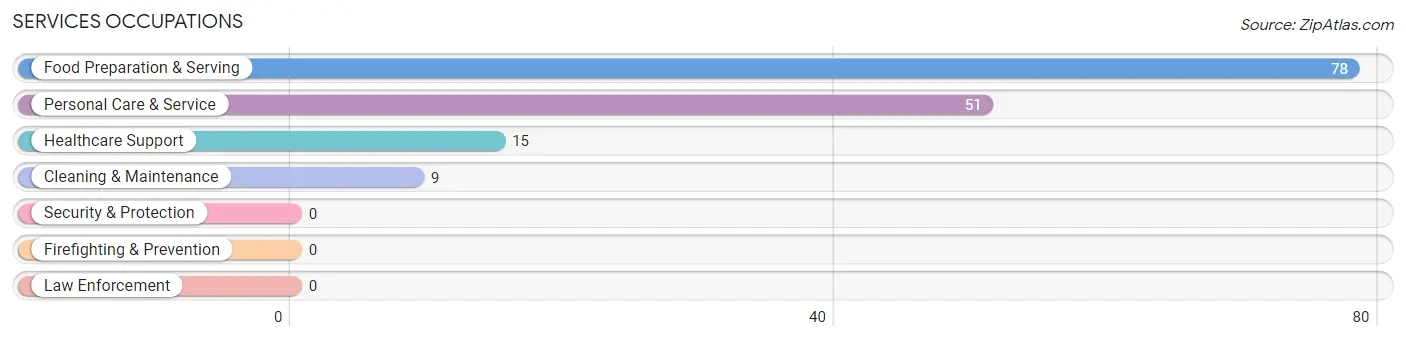
Services Occupations
The most common Services occupations in Warm Mineral Springs are Food Preparation & Serving (78 | 10.2%), Personal Care & Service (51 | 6.6%), Healthcare Support (15 | 1.9%), and Cleaning & Maintenance (9 | 1.2%).
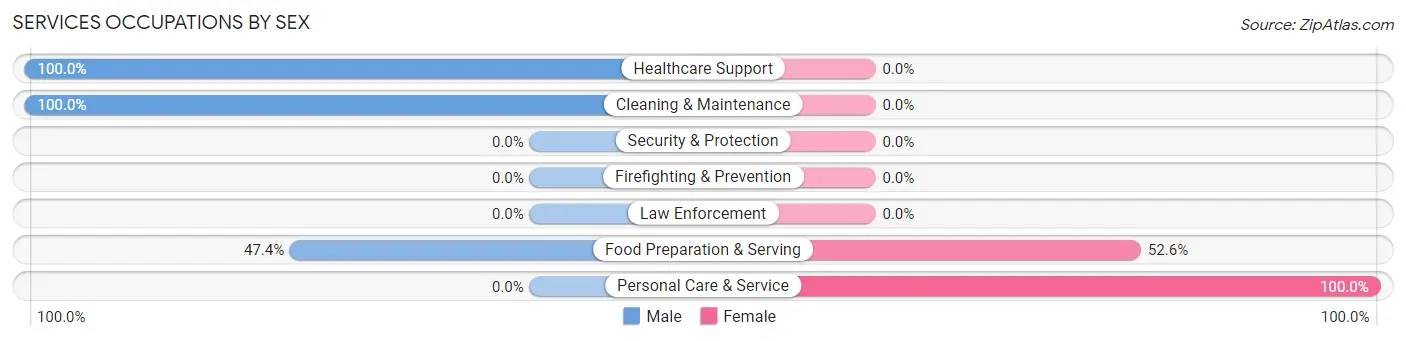
Services Occupations by Sex
Within the Services occupations in Warm Mineral Springs, the most male-oriented occupations are Healthcare Support (100.0%), Cleaning & Maintenance (100.0%), and Food Preparation & Serving (47.4%), while the most female-oriented occupations are Personal Care & Service (100.0%), and Food Preparation & Serving (52.6%).
| Occupation | Male | Female |
| Healthcare Support | 15 (100.0%) | 0 (0.0%) |
| Security & Protection | 0 (0.0%) | 0 (0.0%) |
| Firefighting & Prevention | 0 (0.0%) | 0 (0.0%) |
| Law Enforcement | 0 (0.0%) | 0 (0.0%) |
| Food Preparation & Serving | 37 (47.4%) | 41 (52.6%) |
| Cleaning & Maintenance | 9 (100.0%) | 0 (0.0%) |
| Personal Care & Service | 0 (0.0%) | 51 (100.0%) |
| Total (Category) | 61 (39.9%) | 92 (60.1%) |
| Total (Overall) | 427 (55.6%) | 341 (44.4%) |
Sales and Office Occupations
The most common Sales and Office occupations in Warm Mineral Springs are Office & Administration (108 | 14.1%), and Sales & Related (37 | 4.8%).
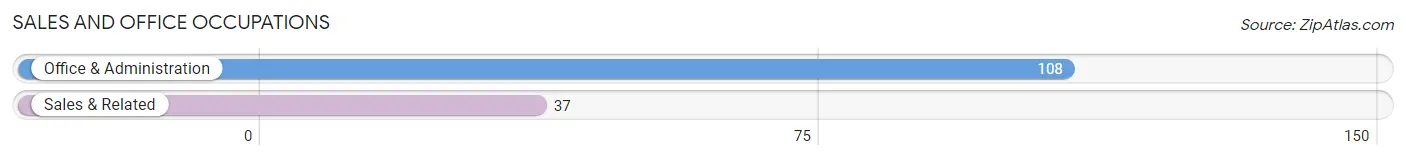
Sales and Office Occupations by Sex
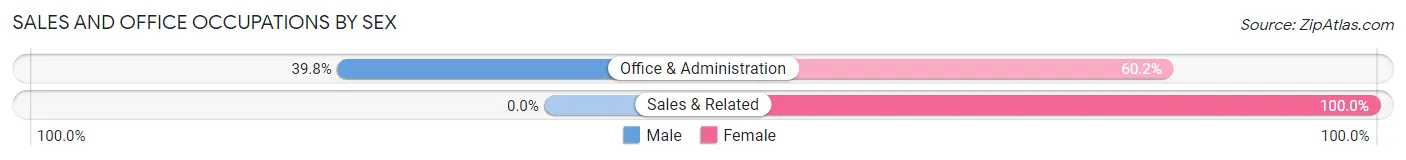
| Occupation | Male | Female |
| Sales & Related | 0 (0.0%) | 37 (100.0%) |
| Office & Administration | 43 (39.8%) | 65 (60.2%) |
| Total (Category) | 43 (29.7%) | 102 (70.3%) |
| Total (Overall) | 427 (55.6%) | 341 (44.4%) |
Natural Resources, Construction and Maintenance Occupations
The most common Natural Resources, Construction and Maintenance occupations in Warm Mineral Springs are Construction & Extraction (109 | 14.2%), and Installation, Maintenance & Repair (20 | 2.6%).
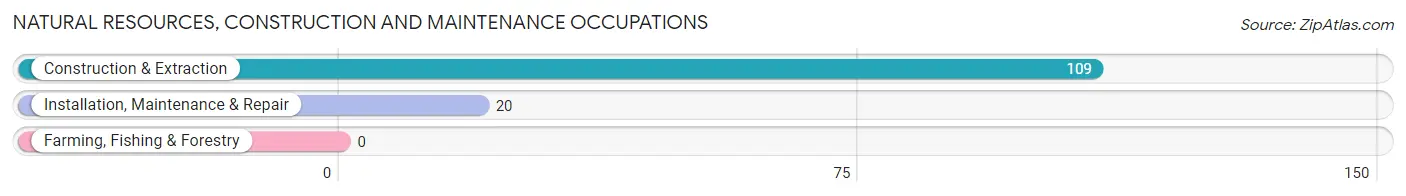
Natural Resources, Construction and Maintenance Occupations by Sex
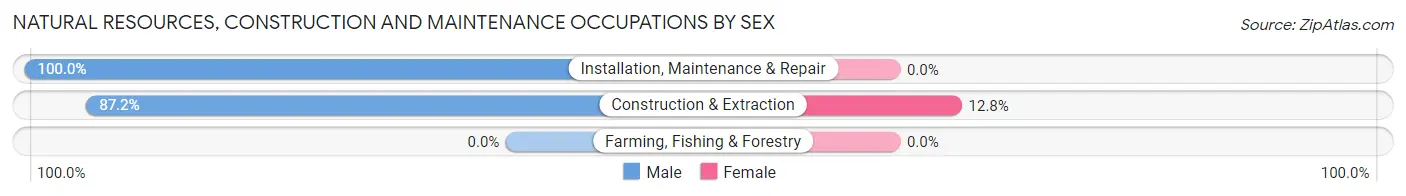
| Occupation | Male | Female |
| Farming, Fishing & Forestry | 0 (0.0%) | 0 (0.0%) |
| Construction & Extraction | 95 (87.2%) | 14 (12.8%) |
| Installation, Maintenance & Repair | 20 (100.0%) | 0 (0.0%) |
| Total (Category) | 115 (89.1%) | 14 (10.8%) |
| Total (Overall) | 427 (55.6%) | 341 (44.4%) |
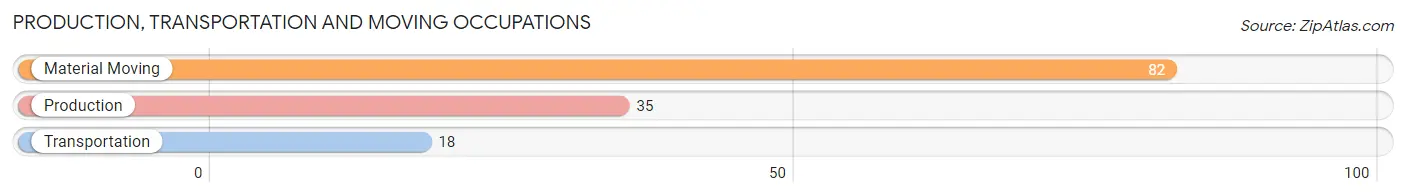
Production, Transportation and Moving Occupations
The most common Production, Transportation and Moving occupations in Warm Mineral Springs are Material Moving (82 | 10.7%), Production (35 | 4.6%), and Transportation (18 | 2.3%).
Production, Transportation and Moving Occupations by Sex
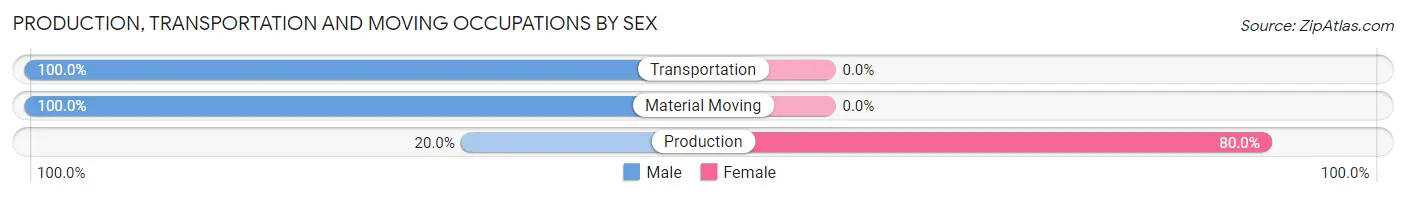
| Occupation | Male | Female |
| Production | 7 (20.0%) | 28 (80.0%) |
| Transportation | 18 (100.0%) | 0 (0.0%) |
| Material Moving | 82 (100.0%) | 0 (0.0%) |
| Total (Category) | 107 (79.3%) | 28 (20.7%) |
| Total (Overall) | 427 (55.6%) | 341 (44.4%) |
Employment Industries by Sex in Warm Mineral Springs
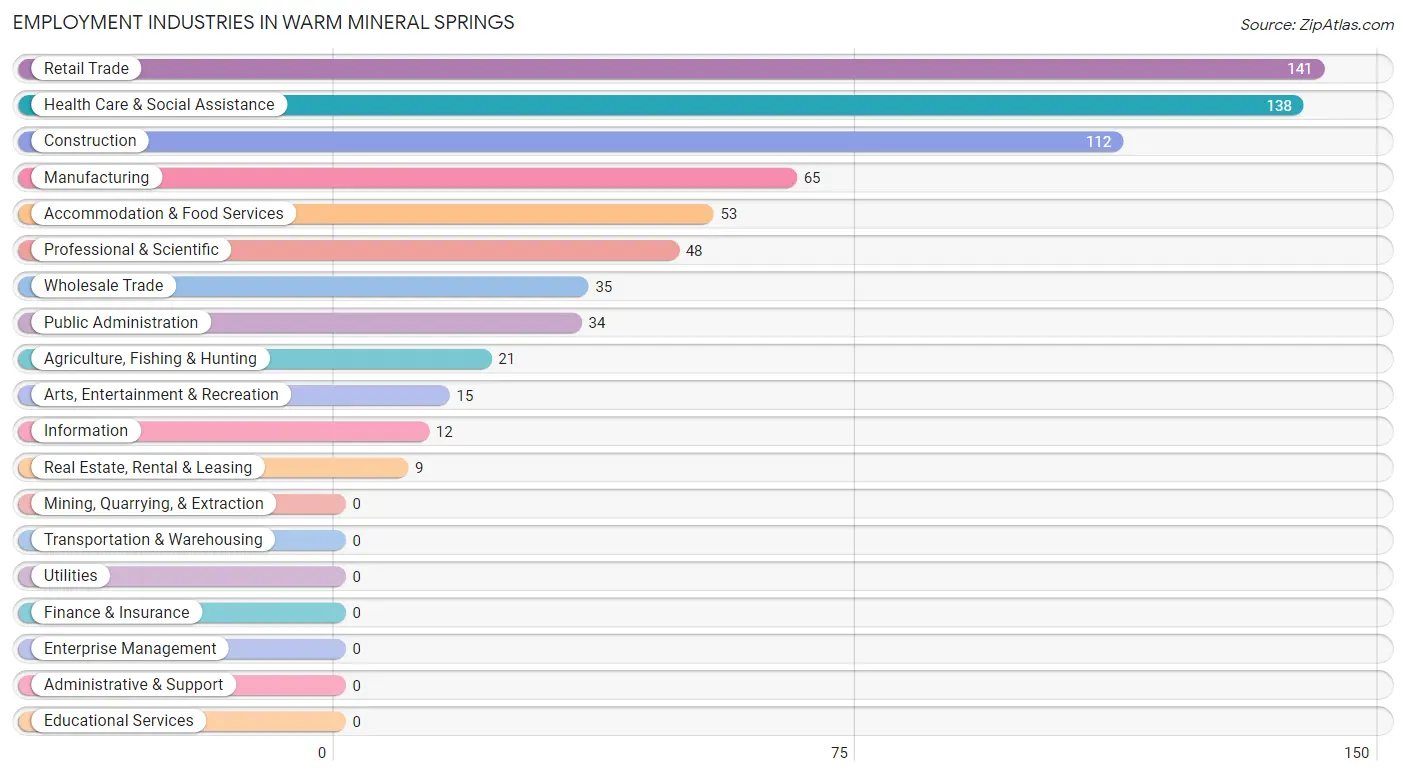
Employment Industries in Warm Mineral Springs
The major employment industries in Warm Mineral Springs include Retail Trade (141 | 18.4%), Health Care & Social Assistance (138 | 18.0%), Construction (112 | 14.6%), Manufacturing (65 | 8.5%), and Accommodation & Food Services (53 | 6.9%).
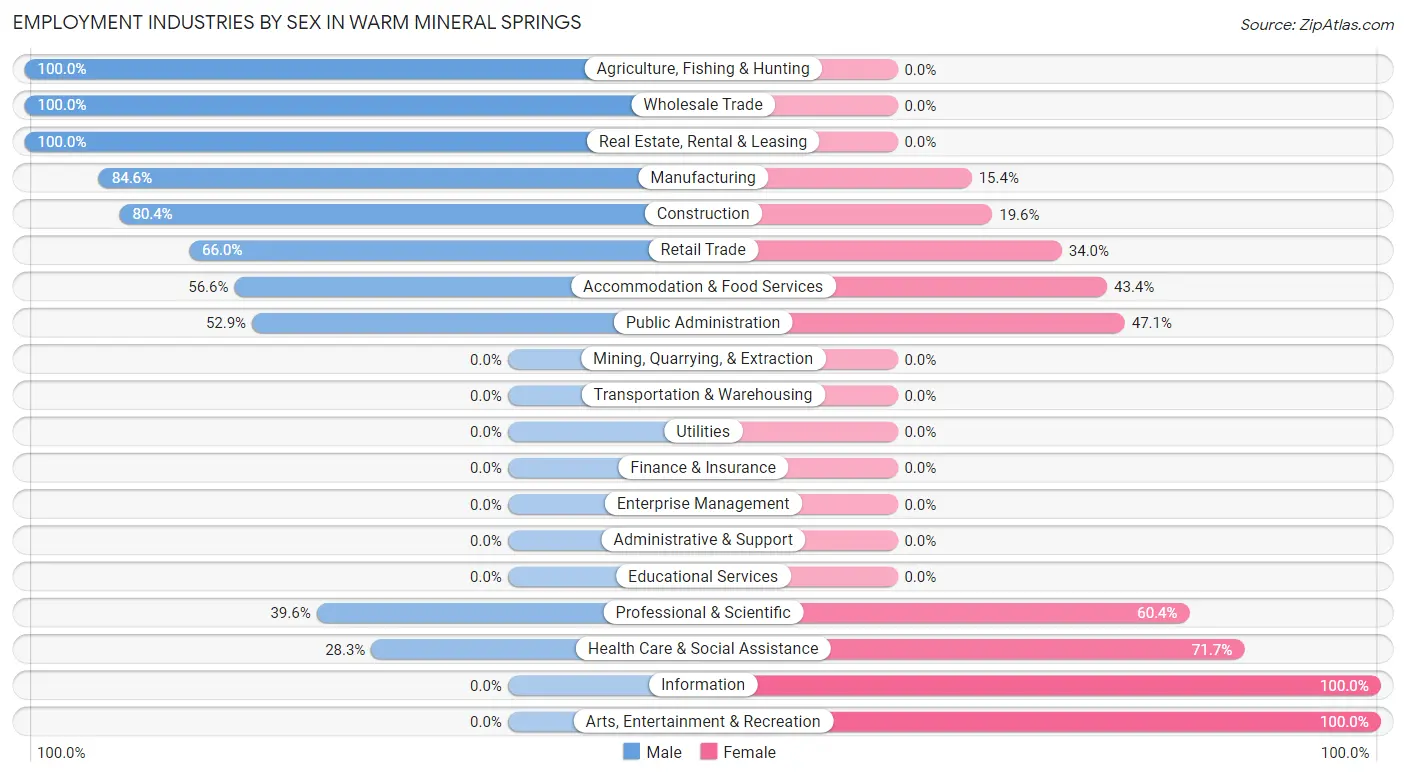
Employment Industries by Sex in Warm Mineral Springs
The Warm Mineral Springs industries that see more men than women are Agriculture, Fishing & Hunting (100.0%), Wholesale Trade (100.0%), and Real Estate, Rental & Leasing (100.0%), whereas the industries that tend to have a higher number of women are Information (100.0%), Arts, Entertainment & Recreation (100.0%), and Health Care & Social Assistance (71.7%).
| Industry | Male | Female |
| Agriculture, Fishing & Hunting | 21 (100.0%) | 0 (0.0%) |
| Mining, Quarrying, & Extraction | 0 (0.0%) | 0 (0.0%) |
| Construction | 90 (80.4%) | 22 (19.6%) |
| Manufacturing | 55 (84.6%) | 10 (15.4%) |
| Wholesale Trade | 35 (100.0%) | 0 (0.0%) |
| Retail Trade | 93 (66.0%) | 48 (34.0%) |
| Transportation & Warehousing | 0 (0.0%) | 0 (0.0%) |
| Utilities | 0 (0.0%) | 0 (0.0%) |
| Information | 0 (0.0%) | 12 (100.0%) |
| Finance & Insurance | 0 (0.0%) | 0 (0.0%) |
| Real Estate, Rental & Leasing | 9 (100.0%) | 0 (0.0%) |
| Professional & Scientific | 19 (39.6%) | 29 (60.4%) |
| Enterprise Management | 0 (0.0%) | 0 (0.0%) |
| Administrative & Support | 0 (0.0%) | 0 (0.0%) |
| Educational Services | 0 (0.0%) | 0 (0.0%) |
| Health Care & Social Assistance | 39 (28.3%) | 99 (71.7%) |
| Arts, Entertainment & Recreation | 0 (0.0%) | 15 (100.0%) |
| Accommodation & Food Services | 30 (56.6%) | 23 (43.4%) |
| Public Administration | 18 (52.9%) | 16 (47.1%) |
| Total | 427 (55.6%) | 341 (44.4%) |
Education in Warm Mineral Springs
School Enrollment in Warm Mineral Springs
The most common levels of schooling among the 291 students in Warm Mineral Springs are elementary school (66 | 22.7%), high school (53 | 18.2%), and nursery / preschool (50 | 17.2%).
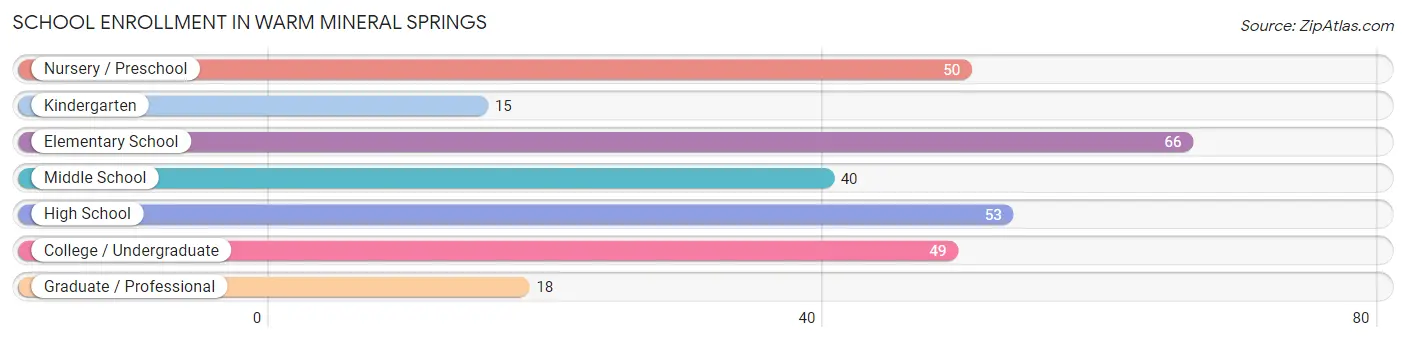
| School Level | # Students | % Students |
| Nursery / Preschool | 50 | 17.2% |
| Kindergarten | 15 | 5.1% |
| Elementary School | 66 | 22.7% |
| Middle School | 40 | 13.8% |
| High School | 53 | 18.2% |
| College / Undergraduate | 49 | 16.8% |
| Graduate / Professional | 18 | 6.2% |
| Total | 291 | 100.0% |
School Enrollment by Age by Funding Source in Warm Mineral Springs
Out of a total of 291 students who are enrolled in schools in Warm Mineral Springs, 95 (32.6%) attend a private institution, while the remaining 196 (67.4%) are enrolled in public schools. The age group of 3 to 4 year olds has the highest likelihood of being enrolled in private schools, with 29 (100.0% in the age bracket) enrolled. Conversely, the age group of 10 to 14 year olds has the lowest likelihood of being enrolled in a private school, with 81 (100.0% in the age bracket) attending a public institution.
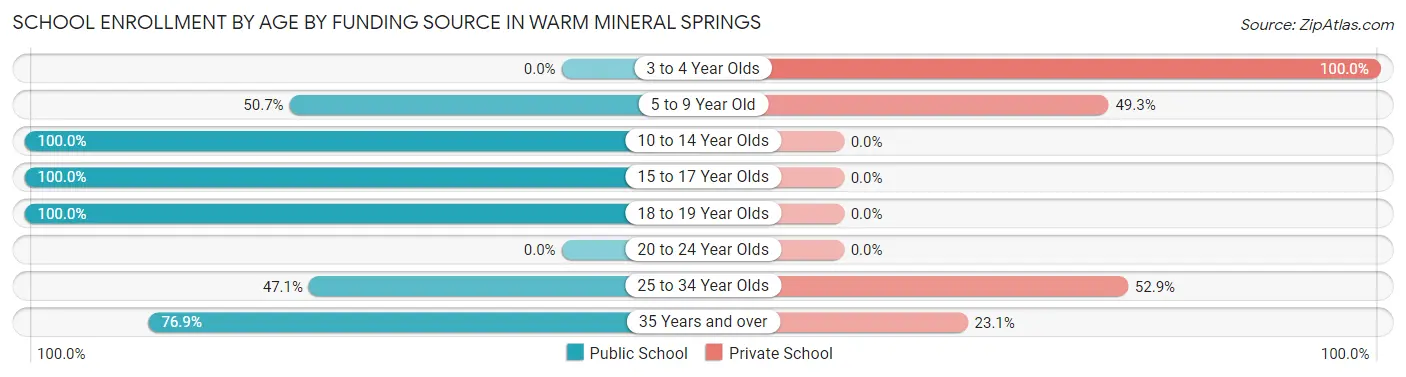
| Age Bracket | Public School | Private School |
| 3 to 4 Year Olds | 0 (0.0%) | 29 (100.0%) |
| 5 to 9 Year Old | 37 (50.7%) | 36 (49.3%) |
| 10 to 14 Year Olds | 81 (100.0%) | 0 (0.0%) |
| 15 to 17 Year Olds | 10 (100.0%) | 0 (0.0%) |
| 18 to 19 Year Olds | 12 (100.0%) | 0 (0.0%) |
| 20 to 24 Year Olds | 0 (0.0%) | 0 (0.0%) |
| 25 to 34 Year Olds | 16 (47.1%) | 18 (52.9%) |
| 35 Years and over | 40 (76.9%) | 12 (23.1%) |
| Total | 196 (67.4%) | 95 (32.6%) |
Educational Attainment by Field of Study in Warm Mineral Springs
Business (238 | 24.6%), education (177 | 18.3%), engineering (129 | 13.3%), computers & mathematics (79 | 8.2%), and science & technology (61 | 6.3%) are the most common fields of study among 968 individuals in Warm Mineral Springs who have obtained a bachelor's degree or higher.
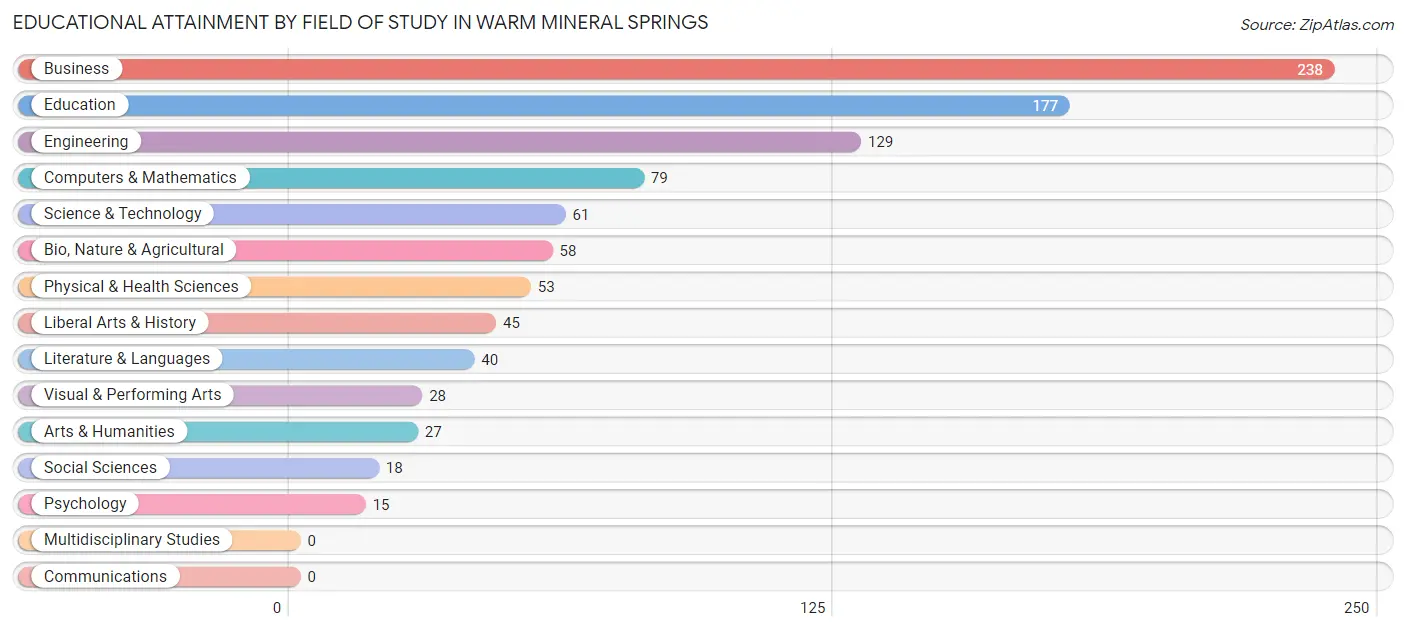
| Field of Study | # Graduates | % Graduates |
| Computers & Mathematics | 79 | 8.2% |
| Bio, Nature & Agricultural | 58 | 6.0% |
| Physical & Health Sciences | 53 | 5.5% |
| Psychology | 15 | 1.5% |
| Social Sciences | 18 | 1.9% |
| Engineering | 129 | 13.3% |
| Multidisciplinary Studies | 0 | 0.0% |
| Science & Technology | 61 | 6.3% |
| Business | 238 | 24.6% |
| Education | 177 | 18.3% |
| Literature & Languages | 40 | 4.1% |
| Liberal Arts & History | 45 | 4.6% |
| Visual & Performing Arts | 28 | 2.9% |
| Communications | 0 | 0.0% |
| Arts & Humanities | 27 | 2.8% |
| Total | 968 | 100.0% |
Transportation & Commute in Warm Mineral Springs
Vehicle Availability by Sex in Warm Mineral Springs
The most prevalent vehicle ownership categories in Warm Mineral Springs are males with 1 vehicle (149, accounting for 34.9%) and females with 1 vehicle (113, making up 47.8%).
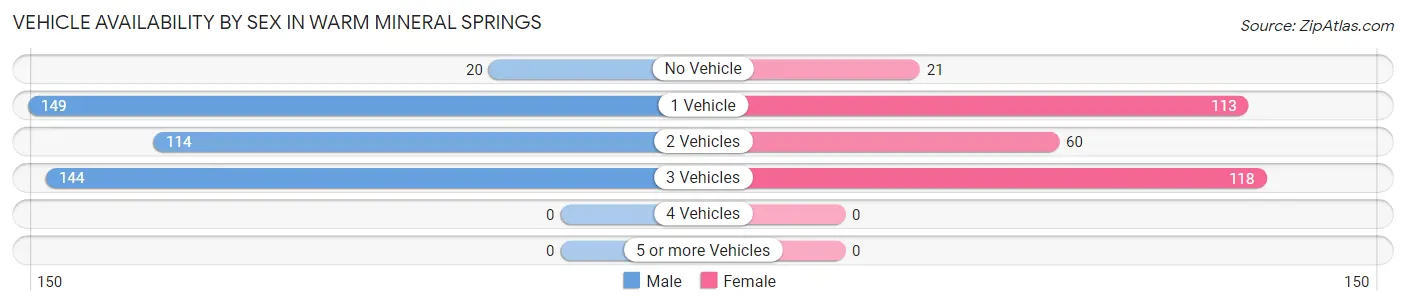
| Vehicles Available | Male | Female |
| No Vehicle | 20 (4.7%) | 21 (6.7%) |
| 1 Vehicle | 149 (34.9%) | 113 (36.2%) |
| 2 Vehicles | 114 (26.7%) | 60 (19.2%) |
| 3 Vehicles | 144 (33.7%) | 118 (37.8%) |
| 4 Vehicles | 0 (0.0%) | 0 (0.0%) |
| 5 or more Vehicles | 0 (0.0%) | 0 (0.0%) |
| Total | 427 (100.0%) | 312 (100.0%) |
Commute Time in Warm Mineral Springs
The most frequently occuring commute durations in Warm Mineral Springs are 30 to 34 minutes (212 commuters, 29.5%), 20 to 24 minutes (113 commuters, 15.7%), and 15 to 19 minutes (85 commuters, 11.8%).
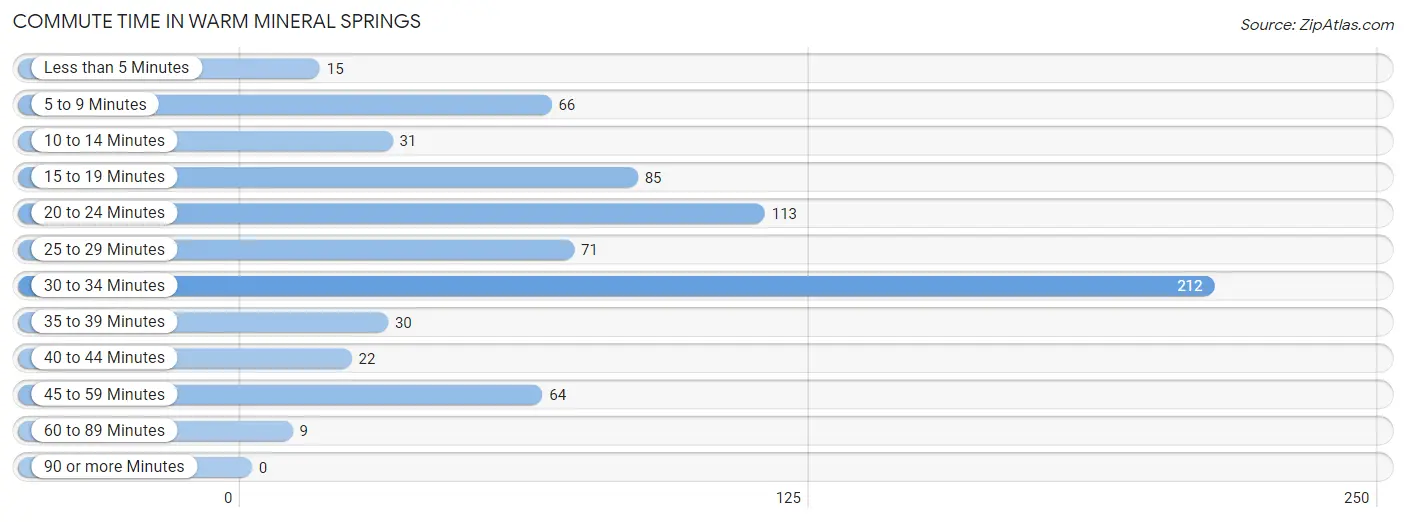
| Commute Time | # Commuters | % Commuters |
| Less than 5 Minutes | 15 | 2.1% |
| 5 to 9 Minutes | 66 | 9.2% |
| 10 to 14 Minutes | 31 | 4.3% |
| 15 to 19 Minutes | 85 | 11.8% |
| 20 to 24 Minutes | 113 | 15.7% |
| 25 to 29 Minutes | 71 | 9.9% |
| 30 to 34 Minutes | 212 | 29.5% |
| 35 to 39 Minutes | 30 | 4.2% |
| 40 to 44 Minutes | 22 | 3.1% |
| 45 to 59 Minutes | 64 | 8.9% |
| 60 to 89 Minutes | 9 | 1.3% |
| 90 or more Minutes | 0 | 0.0% |
Commute Time by Sex in Warm Mineral Springs
The most common commute times in Warm Mineral Springs are 30 to 34 minutes (156 commuters, 37.7%) for males and 20 to 24 minutes (82 commuters, 27.0%) for females.
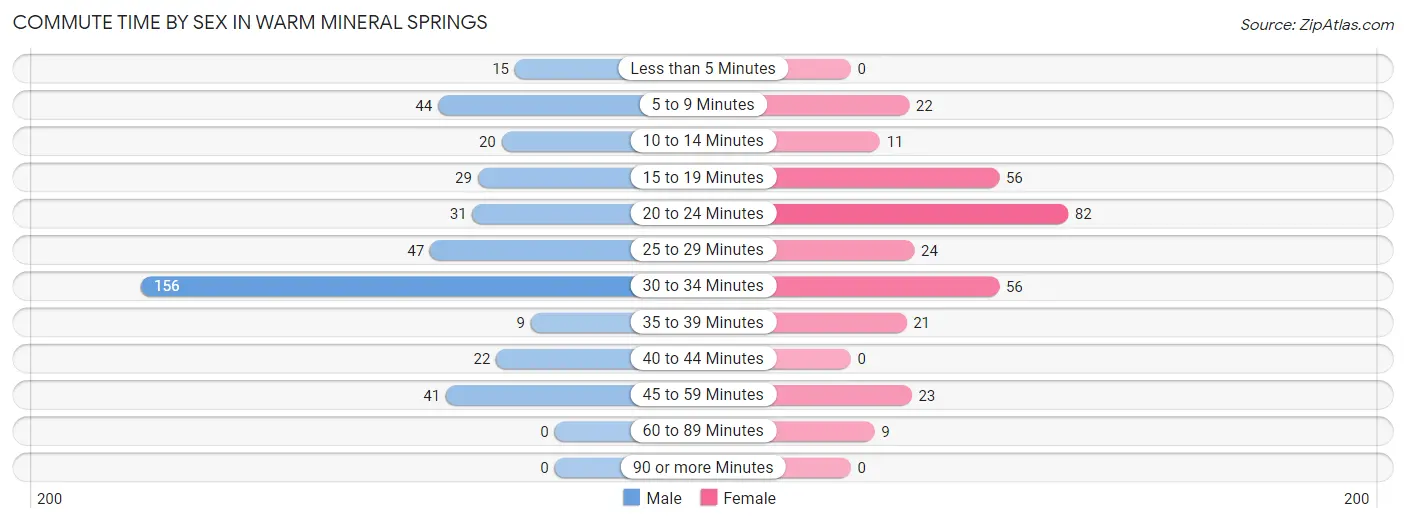
| Commute Time | Male | Female |
| Less than 5 Minutes | 15 (3.6%) | 0 (0.0%) |
| 5 to 9 Minutes | 44 (10.6%) | 22 (7.2%) |
| 10 to 14 Minutes | 20 (4.8%) | 11 (3.6%) |
| 15 to 19 Minutes | 29 (7.0%) | 56 (18.4%) |
| 20 to 24 Minutes | 31 (7.5%) | 82 (27.0%) |
| 25 to 29 Minutes | 47 (11.4%) | 24 (7.9%) |
| 30 to 34 Minutes | 156 (37.7%) | 56 (18.4%) |
| 35 to 39 Minutes | 9 (2.2%) | 21 (6.9%) |
| 40 to 44 Minutes | 22 (5.3%) | 0 (0.0%) |
| 45 to 59 Minutes | 41 (9.9%) | 23 (7.6%) |
| 60 to 89 Minutes | 0 (0.0%) | 9 (3.0%) |
| 90 or more Minutes | 0 (0.0%) | 0 (0.0%) |
Time of Departure to Work by Sex in Warm Mineral Springs
The most frequent times of departure to work in Warm Mineral Springs are 7:00 AM to 7:29 AM (150, 36.2%) for males and 7:00 AM to 7:29 AM (86, 28.3%) for females.
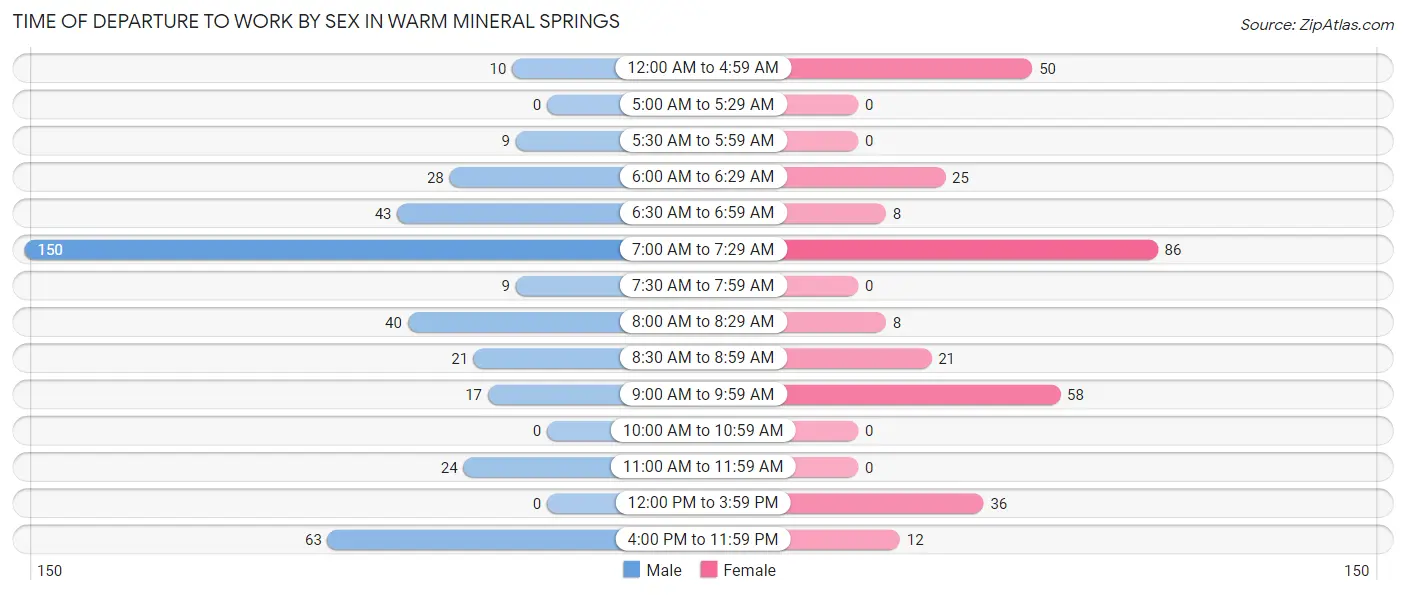
| Time of Departure | Male | Female |
| 12:00 AM to 4:59 AM | 10 (2.4%) | 50 (16.5%) |
| 5:00 AM to 5:29 AM | 0 (0.0%) | 0 (0.0%) |
| 5:30 AM to 5:59 AM | 9 (2.2%) | 0 (0.0%) |
| 6:00 AM to 6:29 AM | 28 (6.8%) | 25 (8.2%) |
| 6:30 AM to 6:59 AM | 43 (10.4%) | 8 (2.6%) |
| 7:00 AM to 7:29 AM | 150 (36.2%) | 86 (28.3%) |
| 7:30 AM to 7:59 AM | 9 (2.2%) | 0 (0.0%) |
| 8:00 AM to 8:29 AM | 40 (9.7%) | 8 (2.6%) |
| 8:30 AM to 8:59 AM | 21 (5.1%) | 21 (6.9%) |
| 9:00 AM to 9:59 AM | 17 (4.1%) | 58 (19.1%) |
| 10:00 AM to 10:59 AM | 0 (0.0%) | 0 (0.0%) |
| 11:00 AM to 11:59 AM | 24 (5.8%) | 0 (0.0%) |
| 12:00 PM to 3:59 PM | 0 (0.0%) | 36 (11.8%) |
| 4:00 PM to 11:59 PM | 63 (15.2%) | 12 (4.0%) |
| Total | 414 (100.0%) | 304 (100.0%) |
Housing Occupancy in Warm Mineral Springs
Occupancy by Ownership in Warm Mineral Springs
Of the total 2,567 dwellings in Warm Mineral Springs, owner-occupied units account for 2,289 (89.2%), while renter-occupied units make up 278 (10.8%).
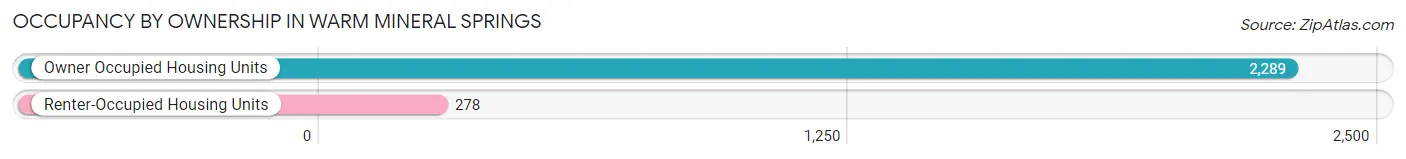
| Occupancy | # Housing Units | % Housing Units |
| Owner Occupied Housing Units | 2,289 | 89.2% |
| Renter-Occupied Housing Units | 278 | 10.8% |
| Total Occupied Housing Units | 2,567 | 100.0% |
Occupancy by Household Size in Warm Mineral Springs
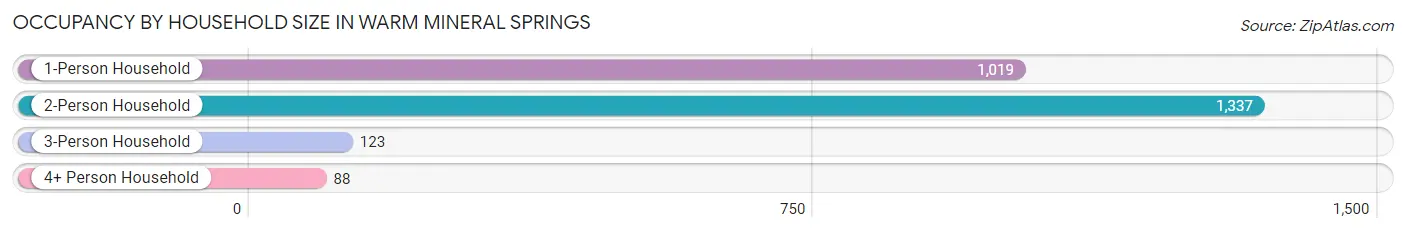
| Household Size | # Housing Units | % Housing Units |
| 1-Person Household | 1,019 | 39.7% |
| 2-Person Household | 1,337 | 52.1% |
| 3-Person Household | 123 | 4.8% |
| 4+ Person Household | 88 | 3.4% |
| Total Housing Units | 2,567 | 100.0% |
Occupancy by Ownership by Household Size in Warm Mineral Springs
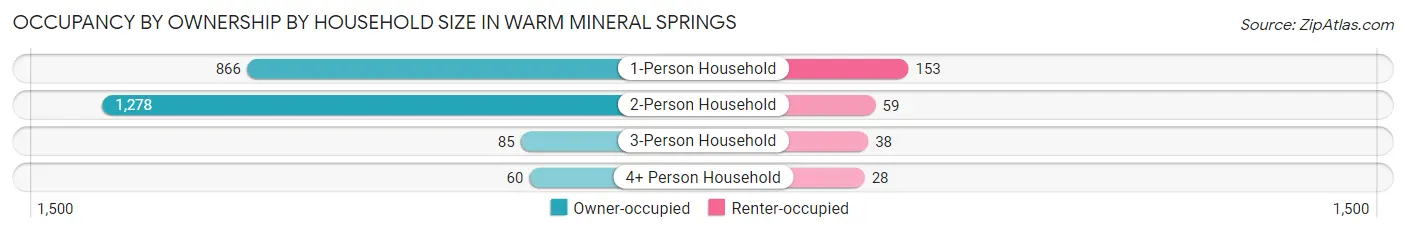
| Household Size | Owner-occupied | Renter-occupied |
| 1-Person Household | 866 (85.0%) | 153 (15.0%) |
| 2-Person Household | 1,278 (95.6%) | 59 (4.4%) |
| 3-Person Household | 85 (69.1%) | 38 (30.9%) |
| 4+ Person Household | 60 (68.2%) | 28 (31.8%) |
| Total Housing Units | 2,289 (89.2%) | 278 (10.8%) |
Occupancy by Educational Attainment in Warm Mineral Springs
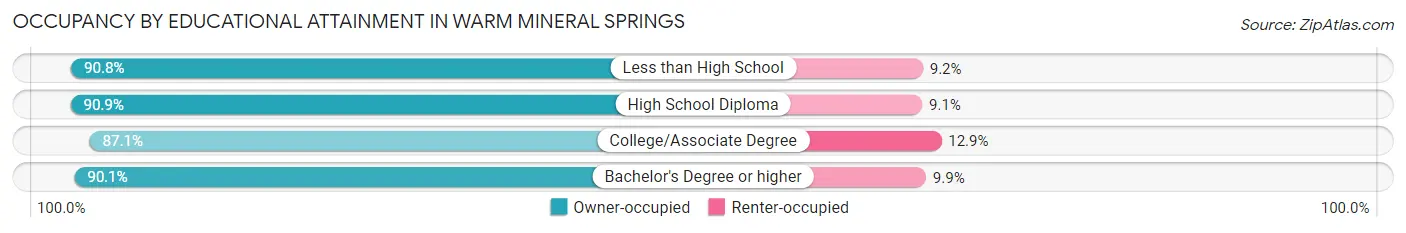
| Household Size | Owner-occupied | Renter-occupied |
| Less than High School | 108 (90.8%) | 11 (9.2%) |
| High School Diploma | 758 (90.9%) | 76 (9.1%) |
| College/Associate Degree | 911 (87.1%) | 135 (12.9%) |
| Bachelor's Degree or higher | 512 (90.1%) | 56 (9.9%) |
Occupancy by Age of Householder in Warm Mineral Springs
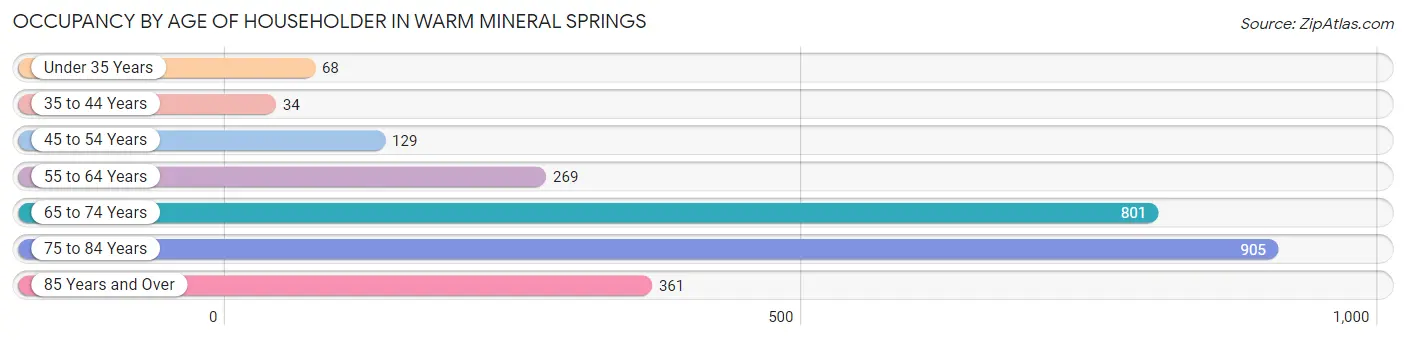
| Age Bracket | # Households | % Households |
| Under 35 Years | 68 | 2.6% |
| 35 to 44 Years | 34 | 1.3% |
| 45 to 54 Years | 129 | 5.0% |
| 55 to 64 Years | 269 | 10.5% |
| 65 to 74 Years | 801 | 31.2% |
| 75 to 84 Years | 905 | 35.3% |
| 85 Years and Over | 361 | 14.1% |
| Total | 2,567 | 100.0% |
Housing Finances in Warm Mineral Springs
Median Income by Occupancy in Warm Mineral Springs
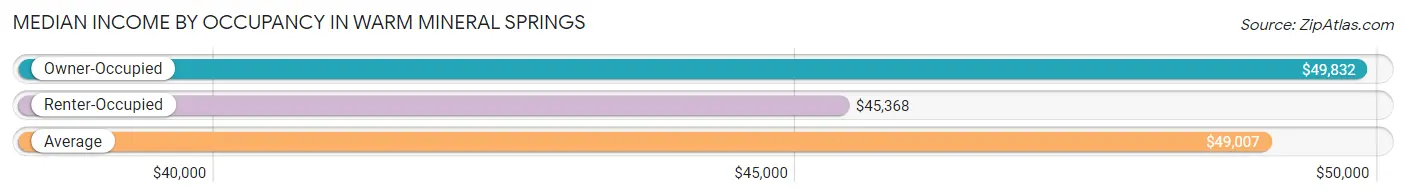
| Occupancy Type | # Households | Median Income |
| Owner-Occupied | 2,289 (89.2%) | $49,832 |
| Renter-Occupied | 278 (10.8%) | $45,368 |
| Average | 2,567 (100.0%) | $49,007 |
Occupancy by Householder Income Bracket in Warm Mineral Springs
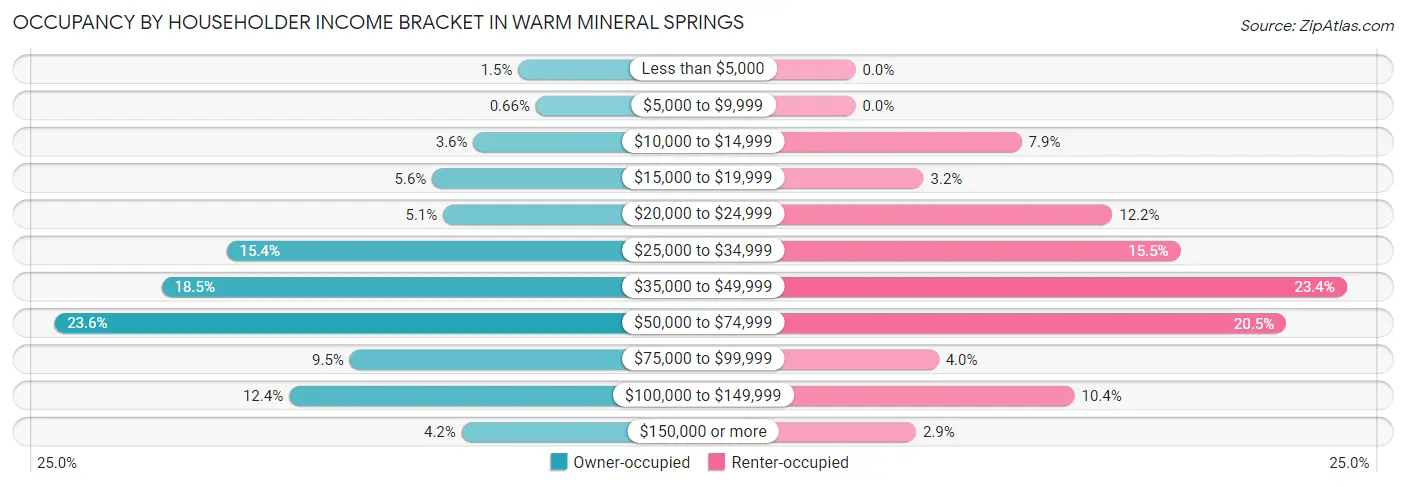
| Income Bracket | Owner-occupied | Renter-occupied |
| Less than $5,000 | 34 (1.5%) | 0 (0.0%) |
| $5,000 to $9,999 | 15 (0.7%) | 0 (0.0%) |
| $10,000 to $14,999 | 83 (3.6%) | 22 (7.9%) |
| $15,000 to $19,999 | 128 (5.6%) | 9 (3.2%) |
| $20,000 to $24,999 | 116 (5.1%) | 34 (12.2%) |
| $25,000 to $34,999 | 352 (15.4%) | 43 (15.5%) |
| $35,000 to $49,999 | 423 (18.5%) | 65 (23.4%) |
| $50,000 to $74,999 | 540 (23.6%) | 57 (20.5%) |
| $75,000 to $99,999 | 218 (9.5%) | 11 (4.0%) |
| $100,000 to $149,999 | 284 (12.4%) | 29 (10.4%) |
| $150,000 or more | 96 (4.2%) | 8 (2.9%) |
| Total | 2,289 (100.0%) | 278 (100.0%) |
Monthly Housing Cost Tiers in Warm Mineral Springs
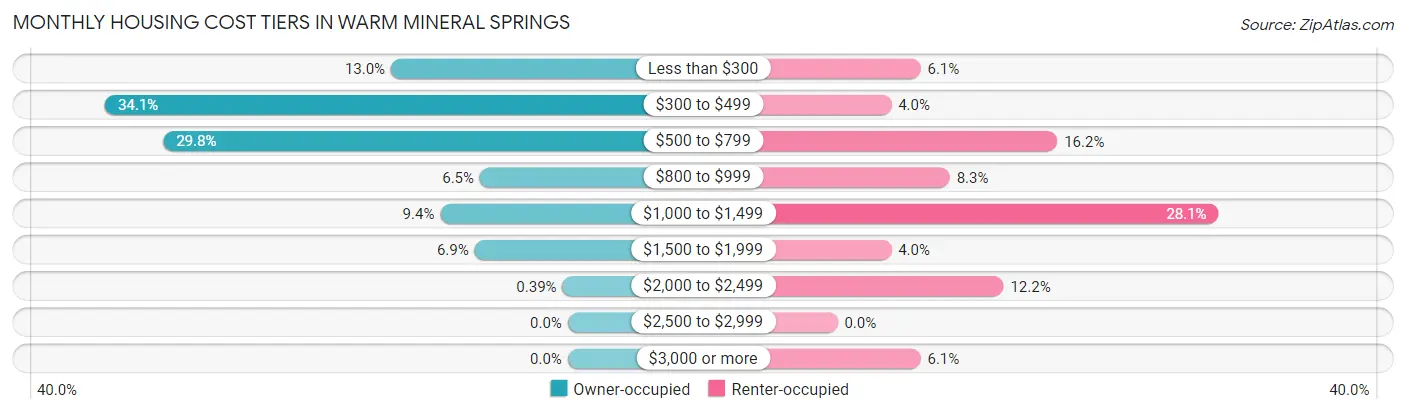
| Monthly Cost | Owner-occupied | Renter-occupied |
| Less than $300 | 298 (13.0%) | 17 (6.1%) |
| $300 to $499 | 780 (34.1%) | 11 (4.0%) |
| $500 to $799 | 682 (29.8%) | 45 (16.2%) |
| $800 to $999 | 148 (6.5%) | 23 (8.3%) |
| $1,000 to $1,499 | 215 (9.4%) | 78 (28.1%) |
| $1,500 to $1,999 | 157 (6.9%) | 11 (4.0%) |
| $2,000 to $2,499 | 9 (0.4%) | 34 (12.2%) |
| $2,500 to $2,999 | 0 (0.0%) | 0 (0.0%) |
| $3,000 or more | 0 (0.0%) | 17 (6.1%) |
| Total | 2,289 (100.0%) | 278 (100.0%) |
Physical Housing Characteristics in Warm Mineral Springs
Housing Structures in Warm Mineral Springs
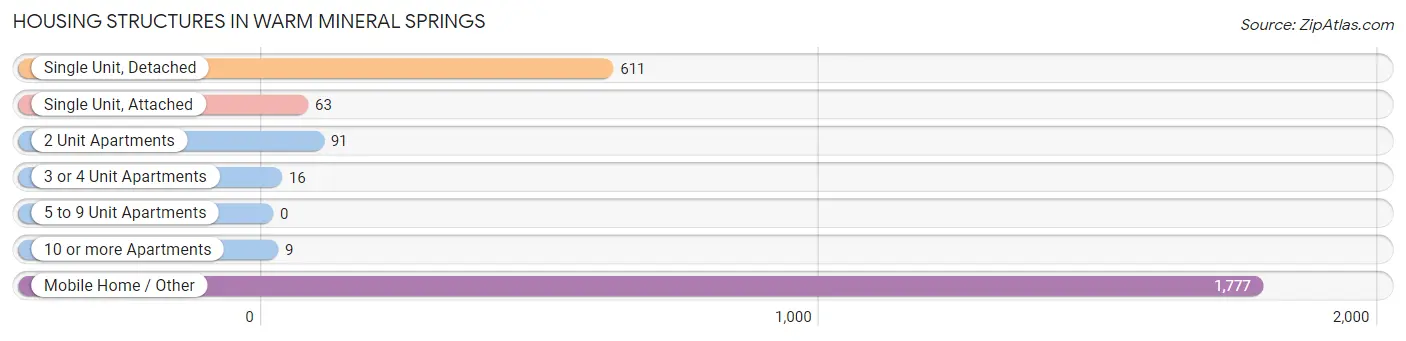
| Structure Type | # Housing Units | % Housing Units |
| Single Unit, Detached | 611 | 23.8% |
| Single Unit, Attached | 63 | 2.5% |
| 2 Unit Apartments | 91 | 3.5% |
| 3 or 4 Unit Apartments | 16 | 0.6% |
| 5 to 9 Unit Apartments | 0 | 0.0% |
| 10 or more Apartments | 9 | 0.4% |
| Mobile Home / Other | 1,777 | 69.2% |
| Total | 2,567 | 100.0% |
Housing Structures by Occupancy in Warm Mineral Springs
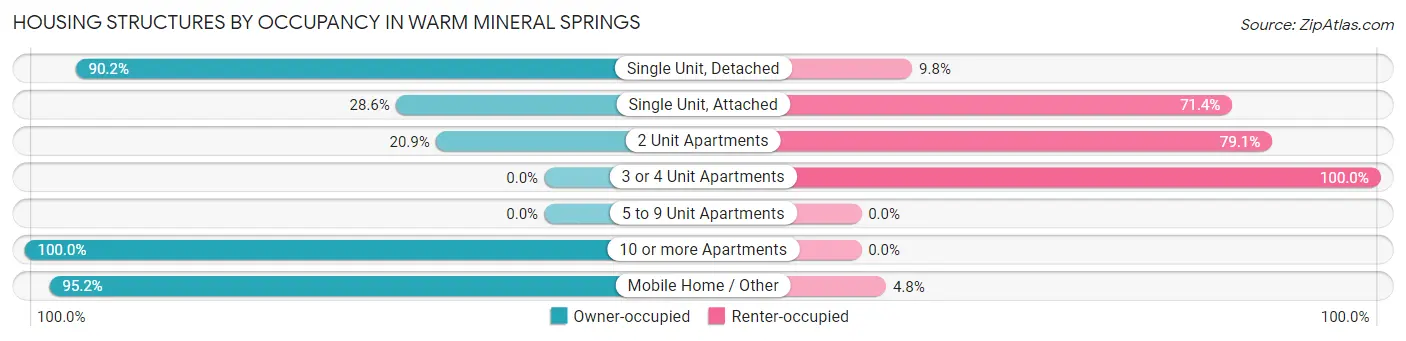
| Structure Type | Owner-occupied | Renter-occupied |
| Single Unit, Detached | 551 (90.2%) | 60 (9.8%) |
| Single Unit, Attached | 18 (28.6%) | 45 (71.4%) |
| 2 Unit Apartments | 19 (20.9%) | 72 (79.1%) |
| 3 or 4 Unit Apartments | 0 (0.0%) | 16 (100.0%) |
| 5 to 9 Unit Apartments | 0 (0.0%) | 0 (0.0%) |
| 10 or more Apartments | 9 (100.0%) | 0 (0.0%) |
| Mobile Home / Other | 1,692 (95.2%) | 85 (4.8%) |
| Total | 2,289 (89.2%) | 278 (10.8%) |
Housing Structures by Number of Rooms in Warm Mineral Springs
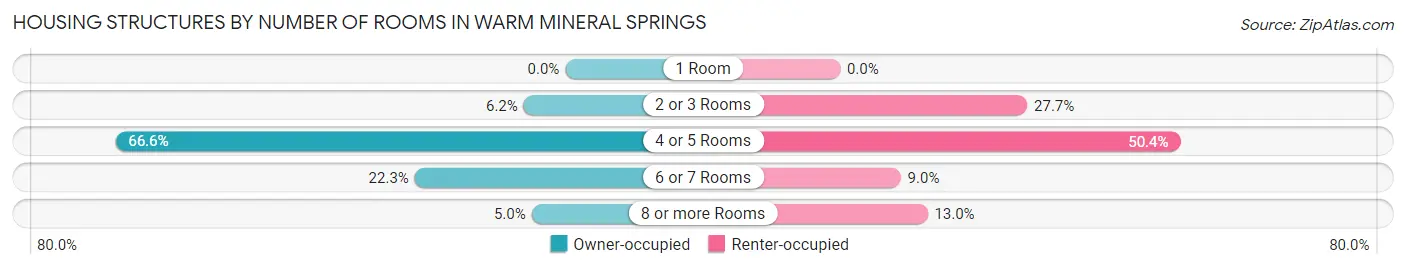
| Number of Rooms | Owner-occupied | Renter-occupied |
| 1 Room | 0 (0.0%) | 0 (0.0%) |
| 2 or 3 Rooms | 141 (6.2%) | 77 (27.7%) |
| 4 or 5 Rooms | 1,524 (66.6%) | 140 (50.4%) |
| 6 or 7 Rooms | 510 (22.3%) | 25 (9.0%) |
| 8 or more Rooms | 114 (5.0%) | 36 (13.0%) |
| Total | 2,289 (100.0%) | 278 (100.0%) |
Housing Structure by Heating Type in Warm Mineral Springs
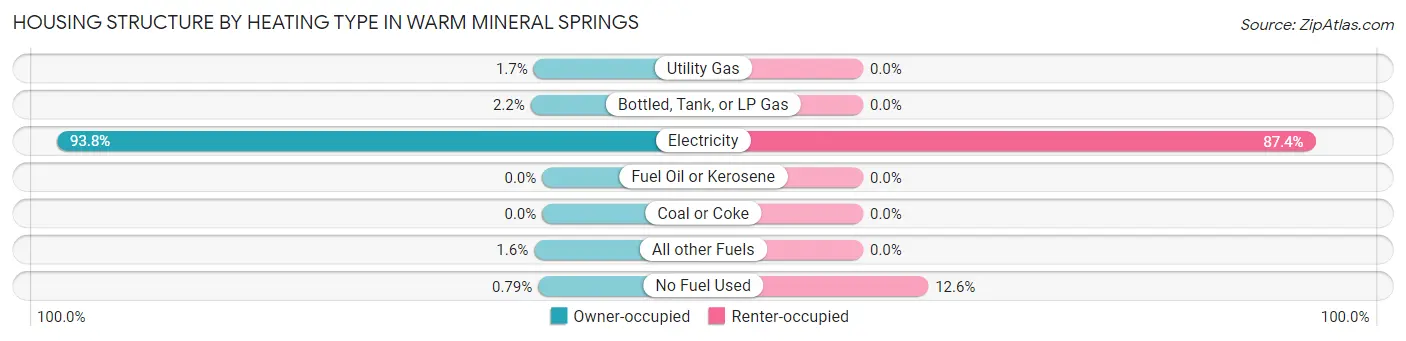
| Heating Type | Owner-occupied | Renter-occupied |
| Utility Gas | 38 (1.7%) | 0 (0.0%) |
| Bottled, Tank, or LP Gas | 51 (2.2%) | 0 (0.0%) |
| Electricity | 2,146 (93.8%) | 243 (87.4%) |
| Fuel Oil or Kerosene | 0 (0.0%) | 0 (0.0%) |
| Coal or Coke | 0 (0.0%) | 0 (0.0%) |
| All other Fuels | 36 (1.6%) | 0 (0.0%) |
| No Fuel Used | 18 (0.8%) | 35 (12.6%) |
| Total | 2,289 (100.0%) | 278 (100.0%) |
Household Vehicle Usage in Warm Mineral Springs
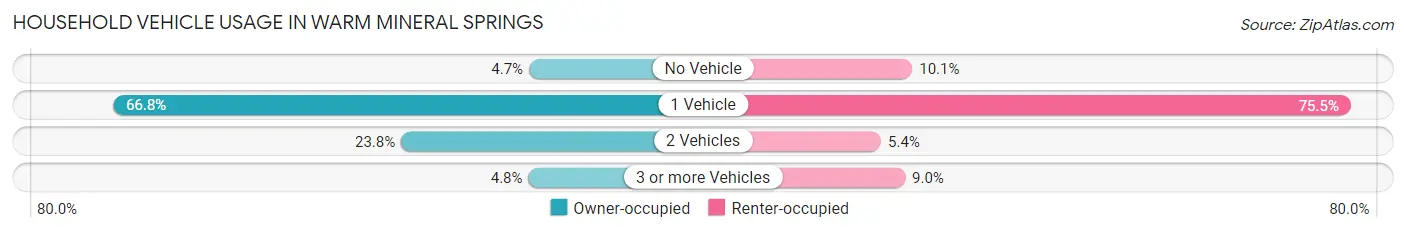
| Vehicles per Household | Owner-occupied | Renter-occupied |
| No Vehicle | 107 (4.7%) | 28 (10.1%) |
| 1 Vehicle | 1,529 (66.8%) | 210 (75.5%) |
| 2 Vehicles | 544 (23.8%) | 15 (5.4%) |
| 3 or more Vehicles | 109 (4.8%) | 25 (9.0%) |
| Total | 2,289 (100.0%) | 278 (100.0%) |
Real Estate & Mortgages in Warm Mineral Springs
Real Estate and Mortgage Overview in Warm Mineral Springs
| Characteristic | Without Mortgage | With Mortgage |
| Housing Units | 2,047 | 242 |
| Median Property Value | $159,700 | $210,700 |
| Median Household Income | $50,052 | $0 |
| Monthly Housing Costs | $485 | $0 |
| Real Estate Taxes | $1,187 | $18 |
Property Value by Mortgage Status in Warm Mineral Springs
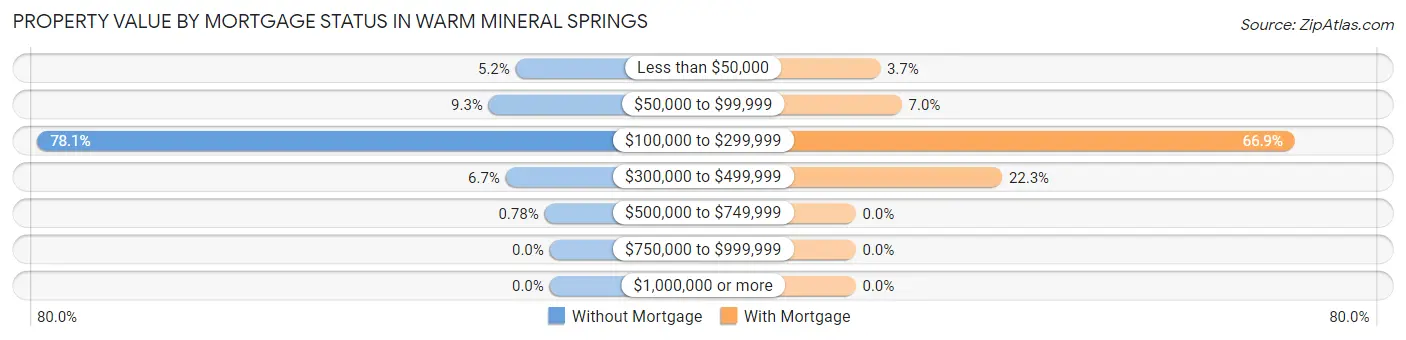
| Property Value | Without Mortgage | With Mortgage |
| Less than $50,000 | 106 (5.2%) | 9 (3.7%) |
| $50,000 to $99,999 | 190 (9.3%) | 17 (7.0%) |
| $100,000 to $299,999 | 1,598 (78.1%) | 162 (66.9%) |
| $300,000 to $499,999 | 137 (6.7%) | 54 (22.3%) |
| $500,000 to $749,999 | 16 (0.8%) | 0 (0.0%) |
| $750,000 to $999,999 | 0 (0.0%) | 0 (0.0%) |
| $1,000,000 or more | 0 (0.0%) | 0 (0.0%) |
| Total | 2,047 (100.0%) | 242 (100.0%) |
Household Income by Mortgage Status in Warm Mineral Springs
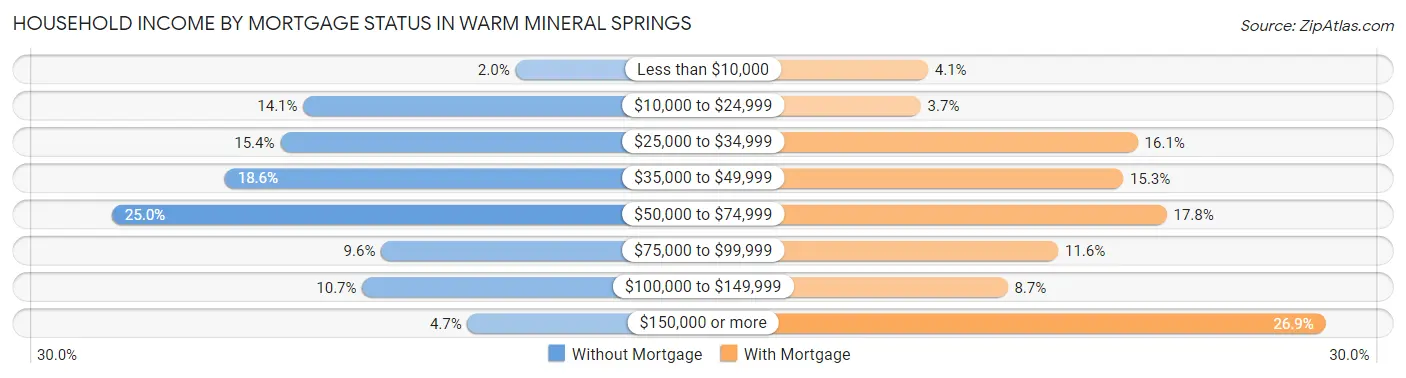
| Household Income | Without Mortgage | With Mortgage |
| Less than $10,000 | 40 (1.9%) | 10 (4.1%) |
| $10,000 to $24,999 | 288 (14.1%) | 9 (3.7%) |
| $25,000 to $34,999 | 315 (15.4%) | 39 (16.1%) |
| $35,000 to $49,999 | 380 (18.6%) | 37 (15.3%) |
| $50,000 to $74,999 | 512 (25.0%) | 43 (17.8%) |
| $75,000 to $99,999 | 197 (9.6%) | 28 (11.6%) |
| $100,000 to $149,999 | 219 (10.7%) | 21 (8.7%) |
| $150,000 or more | 96 (4.7%) | 65 (26.9%) |
| Total | 2,047 (100.0%) | 242 (100.0%) |
Property Value to Household Income Ratio in Warm Mineral Springs
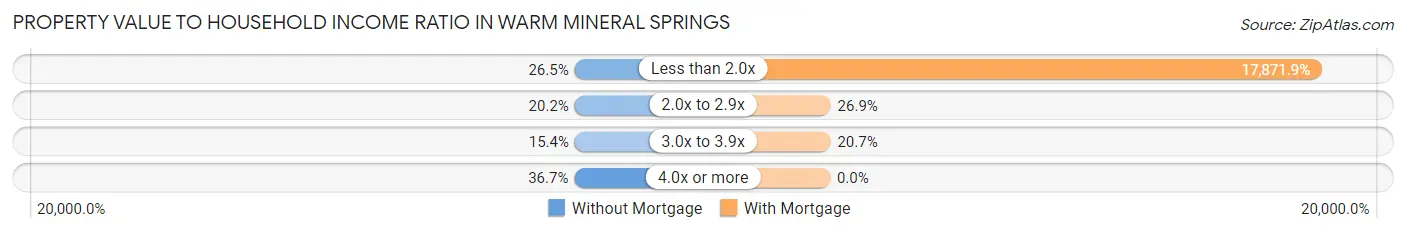
| Value-to-Income Ratio | Without Mortgage | With Mortgage |
| Less than 2.0x | 542 (26.5%) | 43,250 (17,871.9%) |
| 2.0x to 2.9x | 413 (20.2%) | 65 (26.9%) |
| 3.0x to 3.9x | 315 (15.4%) | 50 (20.7%) |
| 4.0x or more | 752 (36.7%) | 0 (0.0%) |
| Total | 2,047 (100.0%) | 242 (100.0%) |
Real Estate Taxes by Mortgage Status in Warm Mineral Springs
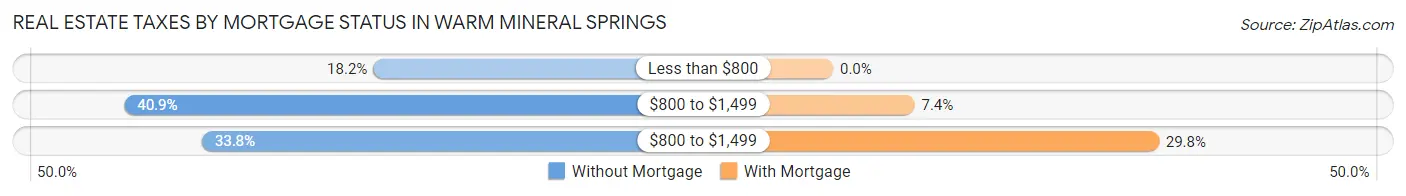
| Property Taxes | Without Mortgage | With Mortgage |
| Less than $800 | 372 (18.2%) | 0 (0.0%) |
| $800 to $1,499 | 837 (40.9%) | 18 (7.4%) |
| $800 to $1,499 | 692 (33.8%) | 72 (29.7%) |
| Total | 2,047 (100.0%) | 242 (100.0%) |
Health & Disability in Warm Mineral Springs
Health Insurance Coverage by Age in Warm Mineral Springs
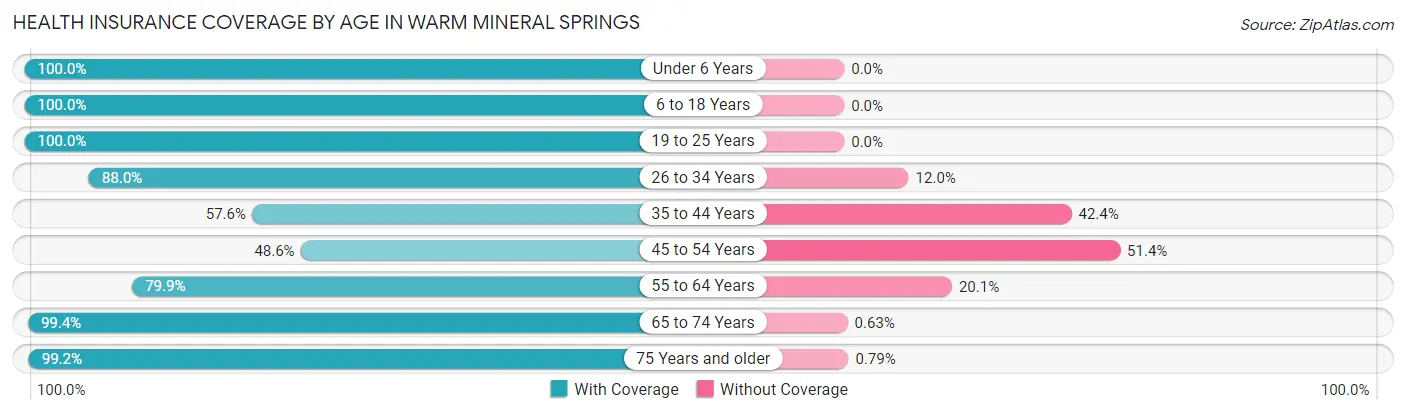
| Age Bracket | With Coverage | Without Coverage |
| Under 6 Years | 90 (100.0%) | 0 (0.0%) |
| 6 to 18 Years | 155 (100.0%) | 0 (0.0%) |
| 19 to 25 Years | 31 (100.0%) | 0 (0.0%) |
| 26 to 34 Years | 154 (88.0%) | 21 (12.0%) |
| 35 to 44 Years | 34 (57.6%) | 25 (42.4%) |
| 45 to 54 Years | 101 (48.6%) | 107 (51.4%) |
| 55 to 64 Years | 386 (79.9%) | 97 (20.1%) |
| 65 to 74 Years | 1,423 (99.4%) | 9 (0.6%) |
| 75 Years and older | 1,892 (99.2%) | 15 (0.8%) |
| Total | 4,266 (94.0%) | 274 (6.0%) |
Health Insurance Coverage by Citizenship Status in Warm Mineral Springs
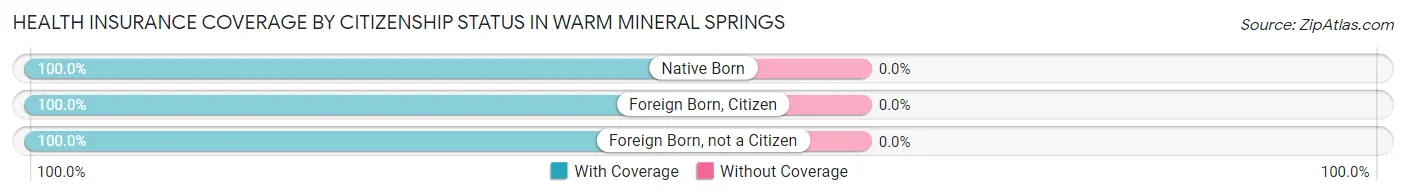
| Citizenship Status | With Coverage | Without Coverage |
| Native Born | 90 (100.0%) | 0 (0.0%) |
| Foreign Born, Citizen | 155 (100.0%) | 0 (0.0%) |
| Foreign Born, not a Citizen | 31 (100.0%) | 0 (0.0%) |
Health Insurance Coverage by Household Income in Warm Mineral Springs
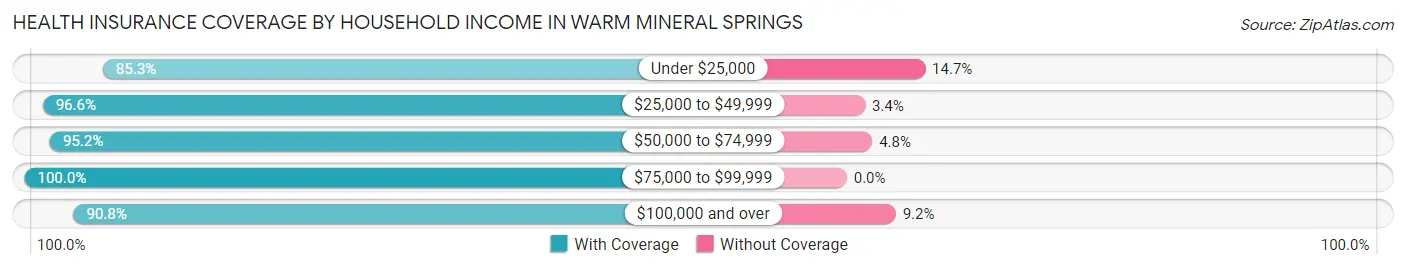
| Household Income | With Coverage | Without Coverage |
| Under $25,000 | 523 (85.3%) | 90 (14.7%) |
| $25,000 to $49,999 | 1,249 (96.6%) | 44 (3.4%) |
| $50,000 to $74,999 | 1,140 (95.2%) | 57 (4.8%) |
| $75,000 to $99,999 | 532 (100.0%) | 0 (0.0%) |
| $100,000 and over | 822 (90.8%) | 83 (9.2%) |
Public vs Private Health Insurance Coverage by Age in Warm Mineral Springs
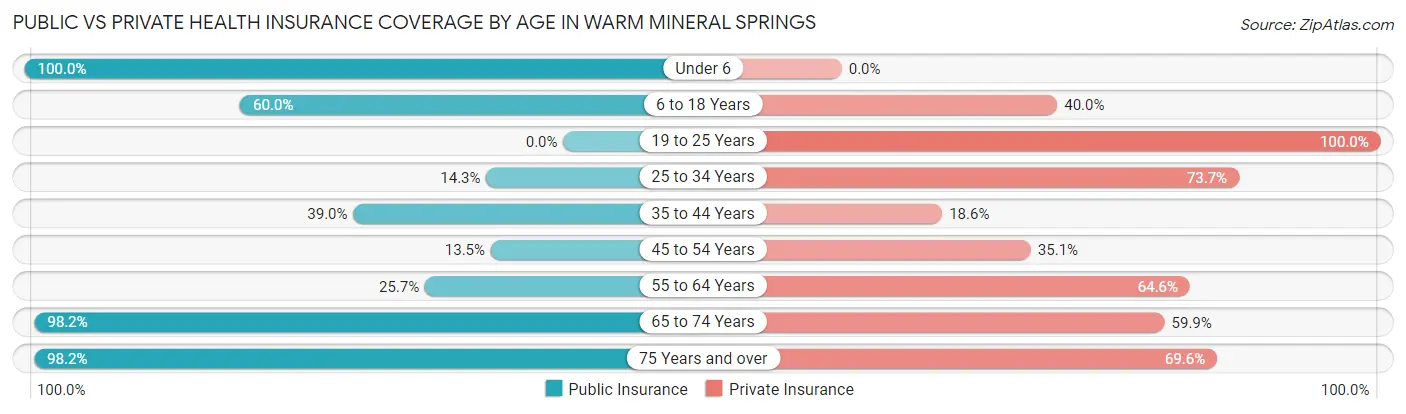
| Age Bracket | Public Insurance | Private Insurance |
| Under 6 | 90 (100.0%) | 0 (0.0%) |
| 6 to 18 Years | 93 (60.0%) | 62 (40.0%) |
| 19 to 25 Years | 0 (0.0%) | 31 (100.0%) |
| 25 to 34 Years | 25 (14.3%) | 129 (73.7%) |
| 35 to 44 Years | 23 (39.0%) | 11 (18.6%) |
| 45 to 54 Years | 28 (13.5%) | 73 (35.1%) |
| 55 to 64 Years | 124 (25.7%) | 312 (64.6%) |
| 65 to 74 Years | 1,406 (98.2%) | 858 (59.9%) |
| 75 Years and over | 1,873 (98.2%) | 1,328 (69.6%) |
| Total | 3,662 (80.7%) | 2,804 (61.8%) |
Disability Status by Sex by Age in Warm Mineral Springs
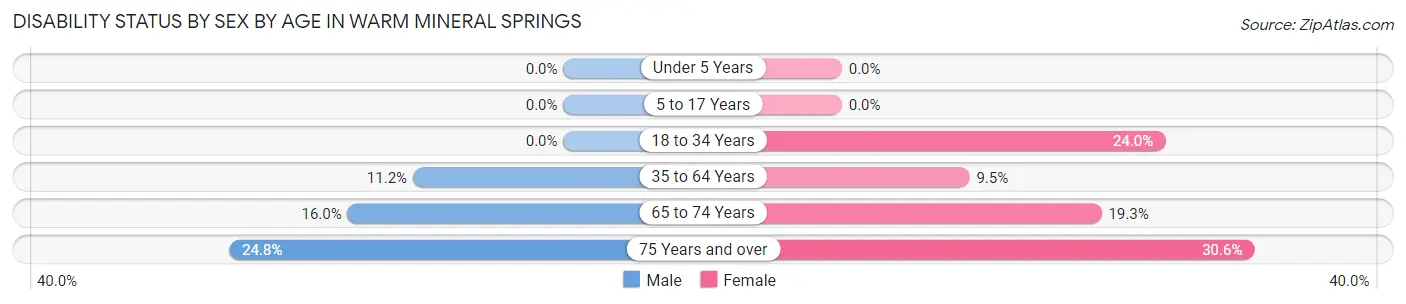
| Age Bracket | Male | Female |
| Under 5 Years | 0 (0.0%) | 0 (0.0%) |
| 5 to 17 Years | 0 (0.0%) | 0 (0.0%) |
| 18 to 34 Years | 0 (0.0%) | 24 (24.0%) |
| 35 to 64 Years | 39 (11.2%) | 38 (9.5%) |
| 65 to 74 Years | 123 (16.0%) | 128 (19.3%) |
| 75 Years and over | 205 (24.8%) | 331 (30.6%) |
Disability Class by Sex by Age in Warm Mineral Springs
Disability Class: Hearing Difficulty
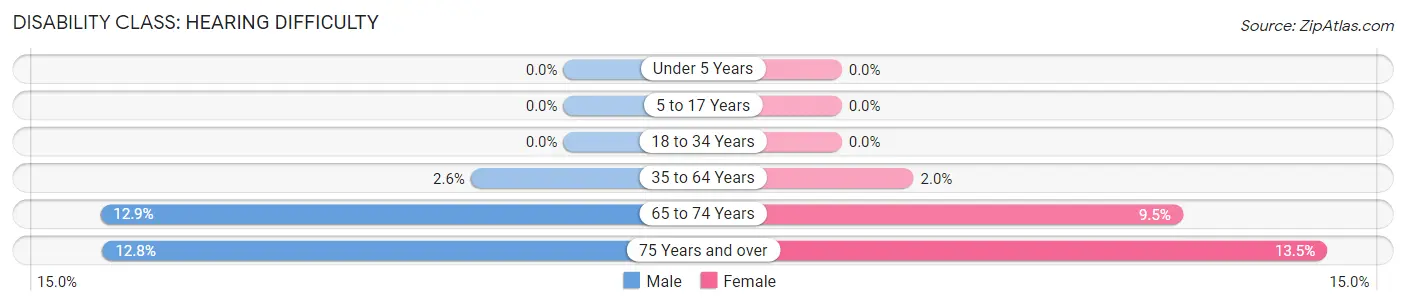
| Age Bracket | Male | Female |
| Under 5 Years | 0 (0.0%) | 0 (0.0%) |
| 5 to 17 Years | 0 (0.0%) | 0 (0.0%) |
| 18 to 34 Years | 0 (0.0%) | 0 (0.0%) |
| 35 to 64 Years | 9 (2.6%) | 8 (2.0%) |
| 65 to 74 Years | 99 (12.9%) | 63 (9.5%) |
| 75 Years and over | 106 (12.8%) | 146 (13.5%) |
Disability Class: Vision Difficulty
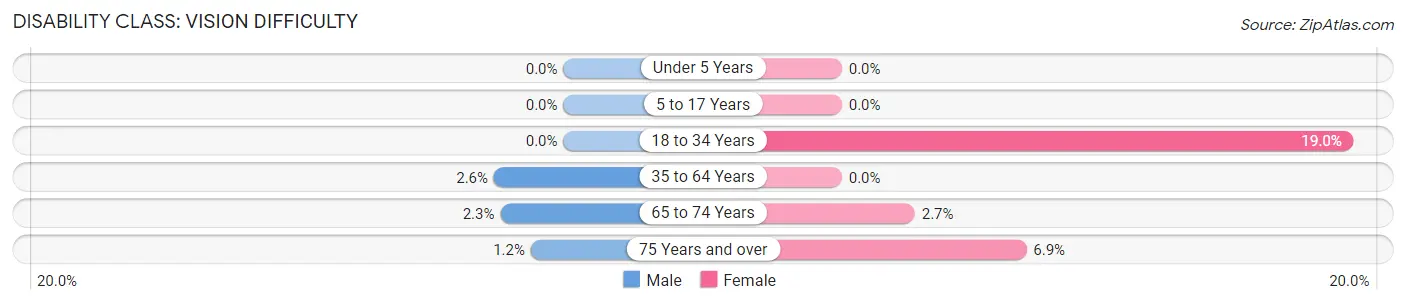
| Age Bracket | Male | Female |
| Under 5 Years | 0 (0.0%) | 0 (0.0%) |
| 5 to 17 Years | 0 (0.0%) | 0 (0.0%) |
| 18 to 34 Years | 0 (0.0%) | 19 (19.0%) |
| 35 to 64 Years | 9 (2.6%) | 0 (0.0%) |
| 65 to 74 Years | 18 (2.3%) | 18 (2.7%) |
| 75 Years and over | 10 (1.2%) | 74 (6.9%) |
Disability Class: Cognitive Difficulty
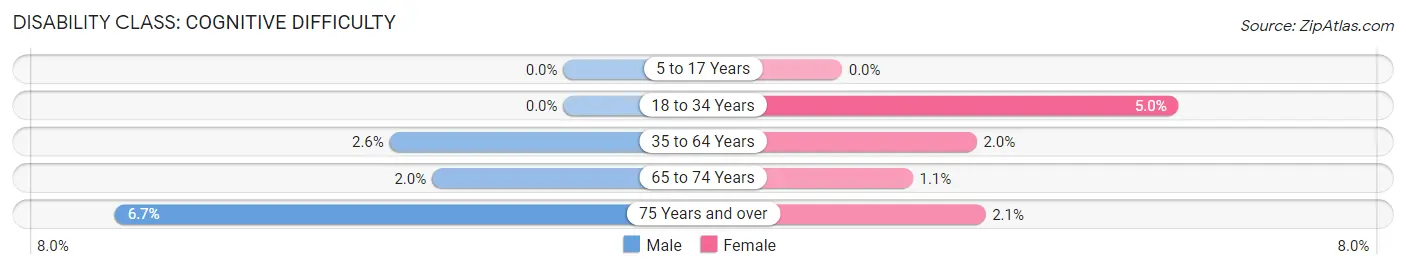
| Age Bracket | Male | Female |
| 5 to 17 Years | 0 (0.0%) | 0 (0.0%) |
| 18 to 34 Years | 0 (0.0%) | 5 (5.0%) |
| 35 to 64 Years | 9 (2.6%) | 8 (2.0%) |
| 65 to 74 Years | 15 (1.9%) | 7 (1.1%) |
| 75 Years and over | 55 (6.7%) | 23 (2.1%) |
Disability Class: Ambulatory Difficulty
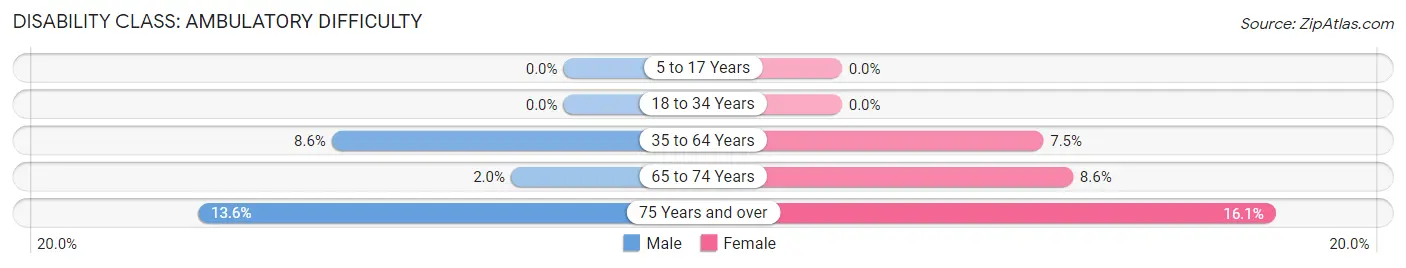
| Age Bracket | Male | Female |
| 5 to 17 Years | 0 (0.0%) | 0 (0.0%) |
| 18 to 34 Years | 0 (0.0%) | 0 (0.0%) |
| 35 to 64 Years | 30 (8.6%) | 30 (7.5%) |
| 65 to 74 Years | 15 (1.9%) | 57 (8.6%) |
| 75 Years and over | 112 (13.6%) | 174 (16.1%) |
Disability Class: Self-Care Difficulty
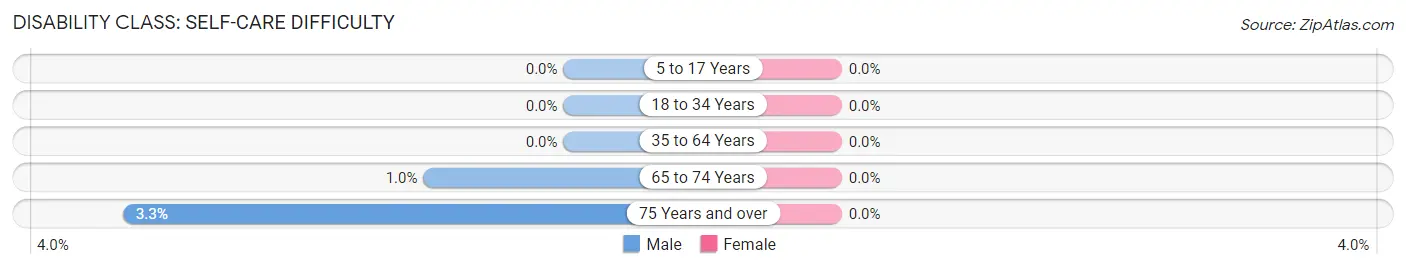
| Age Bracket | Male | Female |
| 5 to 17 Years | 0 (0.0%) | 0 (0.0%) |
| 18 to 34 Years | 0 (0.0%) | 0 (0.0%) |
| 35 to 64 Years | 0 (0.0%) | 0 (0.0%) |
| 65 to 74 Years | 8 (1.0%) | 0 (0.0%) |
| 75 Years and over | 27 (3.3%) | 0 (0.0%) |
Technology Access in Warm Mineral Springs
Computing Device Access in Warm Mineral Springs
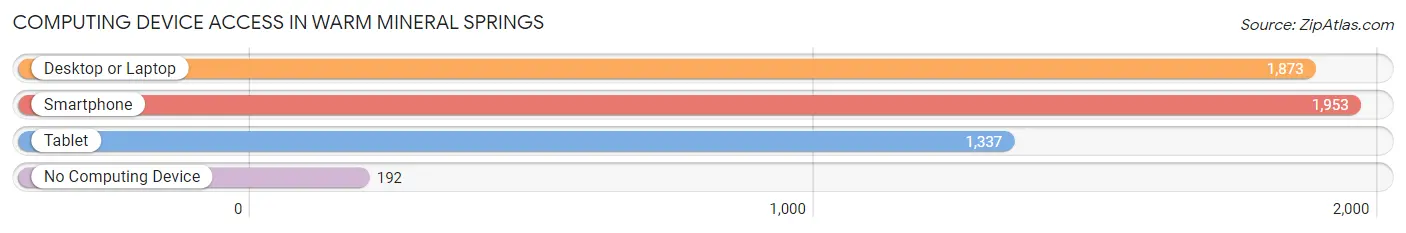
| Device Type | # Households | % Households |
| Desktop or Laptop | 1,873 | 73.0% |
| Smartphone | 1,953 | 76.1% |
| Tablet | 1,337 | 52.1% |
| No Computing Device | 192 | 7.5% |
| Total | 2,567 | 100.0% |
Internet Access in Warm Mineral Springs
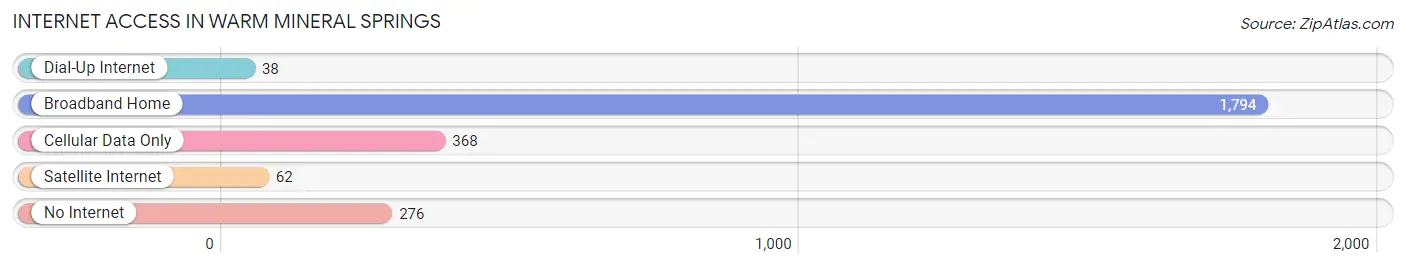
| Internet Type | # Households | % Households |
| Dial-Up Internet | 38 | 1.5% |
| Broadband Home | 1,794 | 69.9% |
| Cellular Data Only | 368 | 14.3% |
| Satellite Internet | 62 | 2.4% |
| No Internet | 276 | 10.7% |
| Total | 2,567 | 100.0% |
Warm Mineral Springs Summary
Warm Mineral Springs is a small unincorporated community located in Sarasota County, Florida, United States. It is situated on the Gulf Coast of Florida, approximately 20 miles north of Venice and 25 miles south of Sarasota. The community is known for its natural mineral springs, which are believed to have healing properties.
History
The Warm Mineral Springs area has been inhabited for thousands of years. The first known inhabitants were the Calusa Indians, who lived in the area from 500 BC to 1500 AD. The Calusa were a powerful tribe that controlled much of the area’s trade and commerce. They were known for their advanced engineering skills, which included building canals and mounds.
The first Europeans to explore the area were Spanish explorers in the 16th century. They named the area “Aguas Calientes”, which translates to “hot waters” in English. The Spanish were the first to recognize the healing properties of the mineral springs.
In the late 19th century, the area was settled by homesteaders. The first post office was established in 1887. The area was known as “Warm Mineral Springs” by the early 1900s.
In the 1950s, the area began to attract tourists due to its natural mineral springs. The springs were believed to have healing properties and were used by locals and visitors alike. In the 1960s, the area was developed into a resort and spa.
Geography
Warm Mineral Springs is located in Sarasota County, Florida, approximately 20 miles north of Venice and 25 miles south of Sarasota. The community is situated on the Gulf Coast of Florida, near the Myakka River.
The area is characterized by flat terrain and sandy soil. The climate is subtropical, with hot, humid summers and mild winters. The average temperature is around 75 degrees Fahrenheit.
Economy
The economy of Warm Mineral Springs is largely based on tourism. The area is known for its natural mineral springs, which are believed to have healing properties. The springs attract visitors from all over the world, who come to experience the healing waters.
The area is also home to several businesses, including restaurants, hotels, and shops. The local economy is also supported by fishing, farming, and other agricultural activities.
Demographics
As of the 2010 census, the population of Warm Mineral Springs was 1,719. The population is largely white (90.3%), with a small Hispanic population (7.2%). The median household income is $37,917, and the median age is 44.
Conclusion
Warm Mineral Springs is a small unincorporated community located in Sarasota County, Florida. It is known for its natural mineral springs, which are believed to have healing properties. The economy of the area is largely based on tourism, and the population is largely white. The area is also home to several businesses, including restaurants, hotels, and shops.
Common Questions
What is Per Capita Income in Warm Mineral Springs?
Per Capita income in Warm Mineral Springs is $35,298.
What is the Median Family Income in Warm Mineral Springs?
Median Family Income in Warm Mineral Springs is $64,864.
What is the Median Household income in Warm Mineral Springs?
Median Household Income in Warm Mineral Springs is $49,007.
What is Income or Wage Gap in Warm Mineral Springs?
Income or Wage Gap in Warm Mineral Springs is 0.8%.
Women in Warm Mineral Springs earn 99.2 cents for every dollar earned by a man.
What is Inequality or Gini Index in Warm Mineral Springs?
Inequality or Gini Index in Warm Mineral Springs is 0.39.
What is the Total Population of Warm Mineral Springs?
Total Population of Warm Mineral Springs is 4,540.
What is the Total Male Population of Warm Mineral Springs?
Total Male Population of Warm Mineral Springs is 2,178.
What is the Total Female Population of Warm Mineral Springs?
Total Female Population of Warm Mineral Springs is 2,362.
What is the Ratio of Males per 100 Females in Warm Mineral Springs?
There are 92.21 Males per 100 Females in Warm Mineral Springs.
What is the Ratio of Females per 100 Males in Warm Mineral Springs?
There are 108.45 Females per 100 Males in Warm Mineral Springs.
What is the Median Population Age in Warm Mineral Springs?
Median Population Age in Warm Mineral Springs is 72.4 Years.
What is the Average Family Size in Warm Mineral Springs
Average Family Size in Warm Mineral Springs is 2.2 People.
What is the Average Household Size in Warm Mineral Springs
Average Household Size in Warm Mineral Springs is 1.8 People.
How Large is the Labor Force in Warm Mineral Springs?
There are 799 People in the Labor Forcein in Warm Mineral Springs.
What is the Percentage of People in the Labor Force in Warm Mineral Springs?
18.5% of People are in the Labor Force in Warm Mineral Springs.
What is the Unemployment Rate in Warm Mineral Springs?
Unemployment Rate in Warm Mineral Springs is 4.0%.