Crystal Lake, FL Map & Demographics
Crystal Lake Map
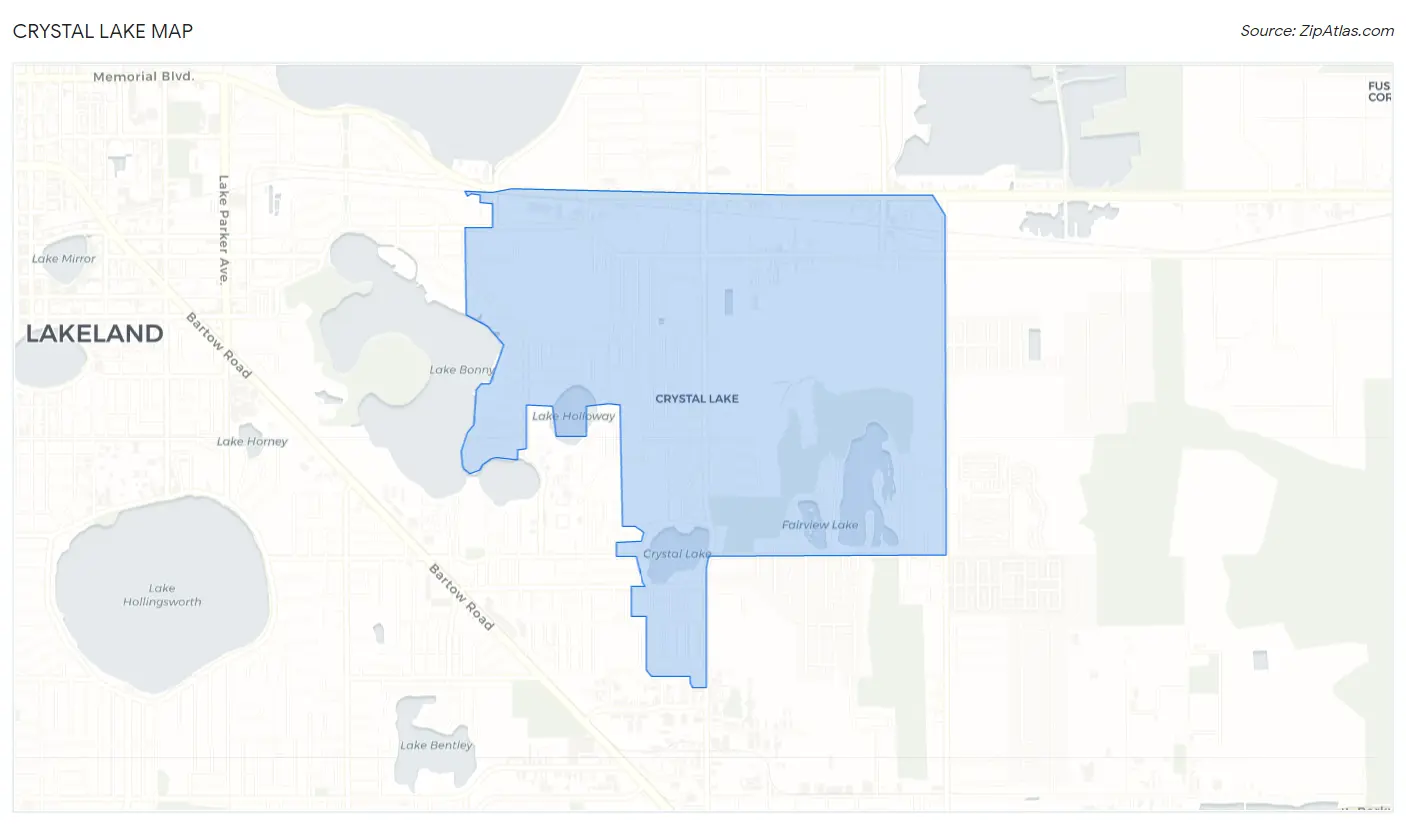
Crystal Lake Overview
$19,189
PER CAPITA INCOME
$45,723
AVG FAMILY INCOME
$45,166
AVG HOUSEHOLD INCOME
28.9%
WAGE / INCOME GAP [ % ]
71.1¢/ $1
WAGE / INCOME GAP [ $ ]
$14,729
FAMILY INCOME DEFICIT
0.41
INEQUALITY / GINI INDEX
6,048
TOTAL POPULATION
3,018
MALE POPULATION
3,030
FEMALE POPULATION
99.60
MALES / 100 FEMALES
100.40
FEMALES / 100 MALES
30.6
MEDIAN AGE
3.4
AVG FAMILY SIZE
3.0
AVG HOUSEHOLD SIZE
2,641
LABOR FORCE [ PEOPLE ]
64.1%
PERCENT IN LABOR FORCE
7.4%
UNEMPLOYMENT RATE
Income in Crystal Lake
Income Overview in Crystal Lake
Per Capita Income in Crystal Lake is $19,189, while median incomes of families and households are $45,723 and $45,166 respectively.
| Characteristic | Number | Measure |
| Per Capita Income | 6,048 | $19,189 |
| Median Family Income | 1,450 | $45,723 |
| Mean Family Income | 1,450 | $54,010 |
| Median Household Income | 2,025 | $45,166 |
| Mean Household Income | 2,025 | $52,725 |
| Income Deficit | 1,450 | $14,729 |
| Wage / Income Gap (%) | 6,048 | 28.90% |
| Wage / Income Gap ($) | 6,048 | 71.10¢ per $1 |
| Gini / Inequality Index | 6,048 | 0.41 |
Earnings by Sex in Crystal Lake
Average Earnings in Crystal Lake are $31,357, $36,338 for men and $25,838 for women, a difference of 28.9%.
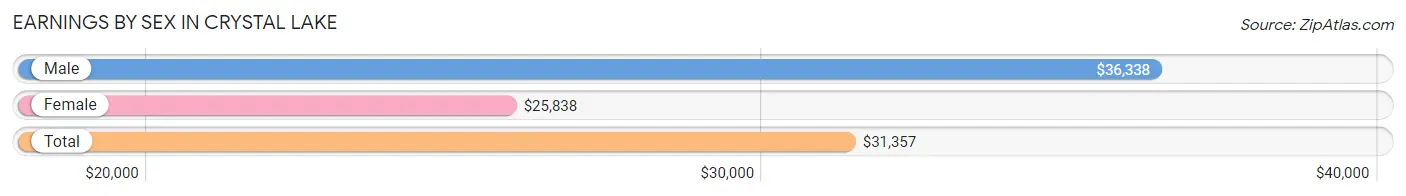
| Sex | Number | Average Earnings |
| Male | 1,380 (53.8%) | $36,338 |
| Female | 1,187 (46.2%) | $25,838 |
| Total | 2,567 (100.0%) | $31,357 |
Earnings by Sex by Income Bracket in Crystal Lake
The most common earnings brackets in Crystal Lake are $35,000 to $39,999 for men (213 | 15.4%) and $25,000 to $29,999 for women (143 | 12.0%).
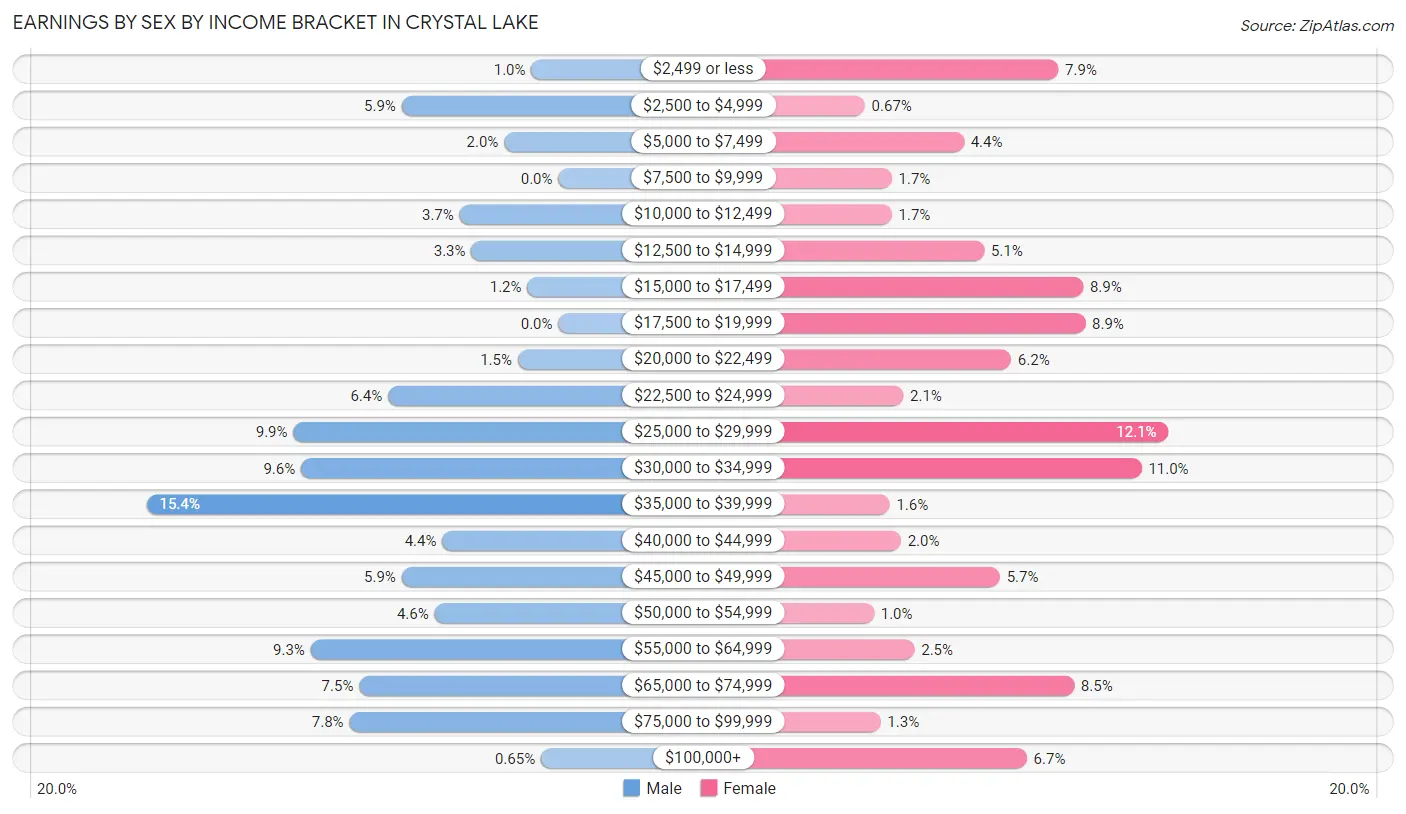
| Income | Male | Female |
| $2,499 or less | 14 (1.0%) | 94 (7.9%) |
| $2,500 to $4,999 | 81 (5.9%) | 8 (0.7%) |
| $5,000 to $7,499 | 28 (2.0%) | 52 (4.4%) |
| $7,500 to $9,999 | 0 (0.0%) | 20 (1.7%) |
| $10,000 to $12,499 | 51 (3.7%) | 20 (1.7%) |
| $12,500 to $14,999 | 45 (3.3%) | 61 (5.1%) |
| $15,000 to $17,499 | 16 (1.2%) | 105 (8.8%) |
| $17,500 to $19,999 | 0 (0.0%) | 106 (8.9%) |
| $20,000 to $22,499 | 21 (1.5%) | 73 (6.1%) |
| $22,500 to $24,999 | 88 (6.4%) | 25 (2.1%) |
| $25,000 to $29,999 | 137 (9.9%) | 143 (12.0%) |
| $30,000 to $34,999 | 133 (9.6%) | 131 (11.0%) |
| $35,000 to $39,999 | 213 (15.4%) | 19 (1.6%) |
| $40,000 to $44,999 | 60 (4.3%) | 24 (2.0%) |
| $45,000 to $49,999 | 81 (5.9%) | 68 (5.7%) |
| $50,000 to $54,999 | 64 (4.6%) | 12 (1.0%) |
| $55,000 to $64,999 | 128 (9.3%) | 30 (2.5%) |
| $65,000 to $74,999 | 103 (7.5%) | 101 (8.5%) |
| $75,000 to $99,999 | 108 (7.8%) | 15 (1.3%) |
| $100,000+ | 9 (0.6%) | 80 (6.7%) |
| Total | 1,380 (100.0%) | 1,187 (100.0%) |
Earnings by Sex by Educational Attainment in Crystal Lake
Average earnings in Crystal Lake are $37,351 for men and $26,321 for women, a difference of 29.5%. Men with an educational attainment of graduate degree enjoy the highest average annual earnings of $59,598, while those with less than high school education earn the least with $30,125. Women with an educational attainment of graduate degree earn the most with the average annual earnings of $94,886, while those with bachelor's degree education have the smallest earnings of $17,931.
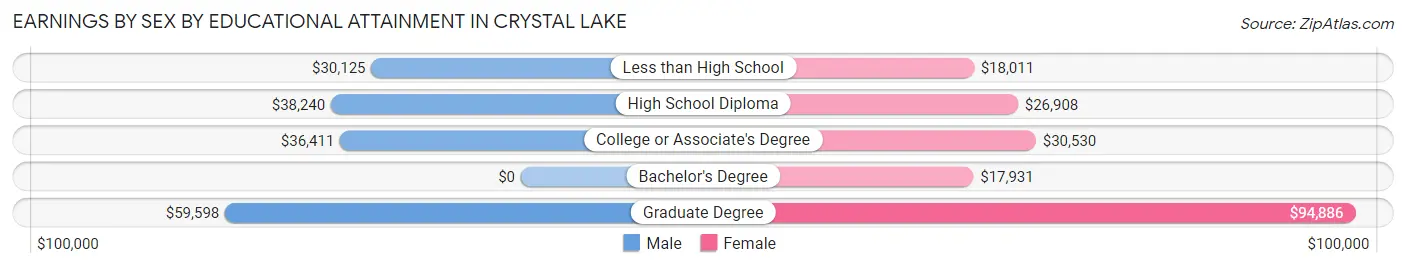
| Educational Attainment | Male Income | Female Income |
| Less than High School | $30,125 | $18,011 |
| High School Diploma | $38,240 | $26,908 |
| College or Associate's Degree | $36,411 | $30,530 |
| Bachelor's Degree | - | - |
| Graduate Degree | $59,598 | $94,886 |
| Total | $37,351 | $26,321 |
Family Income in Crystal Lake
Family Income Brackets in Crystal Lake
According to the Crystal Lake family income data, there are 260 families falling into the $35,000 to $49,999 income range, which is the most common income bracket and makes up 17.9% of all families. Conversely, the $150,000 to $199,999 income bracket is the least frequent group with only 19 families (1.3%) belonging to this category.
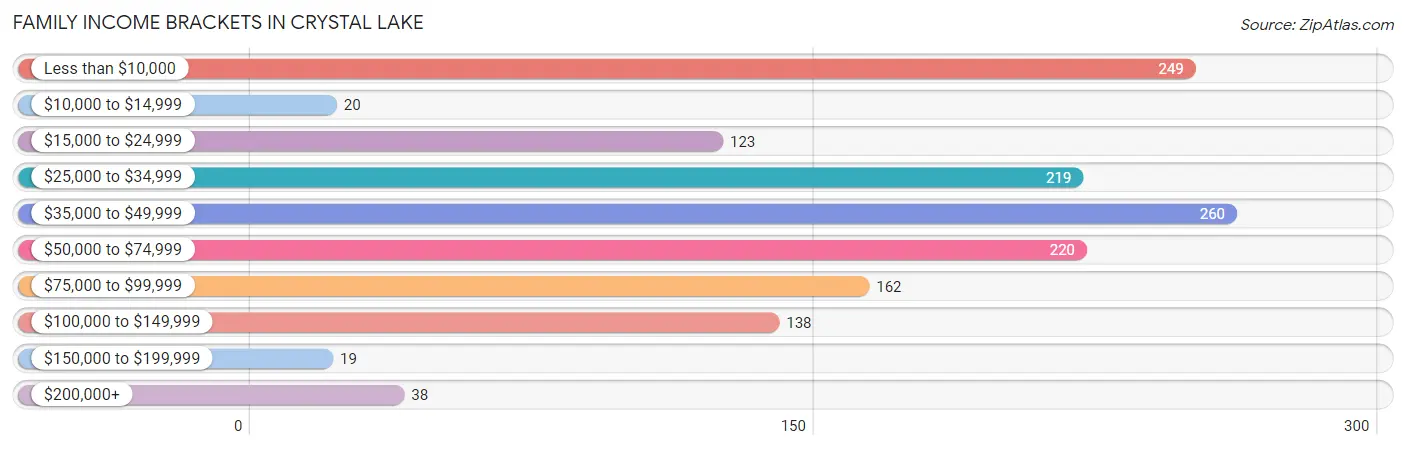
| Income Bracket | # Families | % Families |
| Less than $10,000 | 249 | 17.2% |
| $10,000 to $14,999 | 20 | 1.4% |
| $15,000 to $24,999 | 123 | 8.5% |
| $25,000 to $34,999 | 219 | 15.1% |
| $35,000 to $49,999 | 260 | 17.9% |
| $50,000 to $74,999 | 220 | 15.2% |
| $75,000 to $99,999 | 162 | 11.2% |
| $100,000 to $149,999 | 138 | 9.5% |
| $150,000 to $199,999 | 19 | 1.3% |
| $200,000+ | 38 | 2.6% |
Family Income by Famaliy Size in Crystal Lake
5-person families (110 | 7.6%) account for the highest median family income in Crystal Lake with $80,300 per family, while 2-person families (571 | 39.4%) have the highest median income of $23,620 per family member.
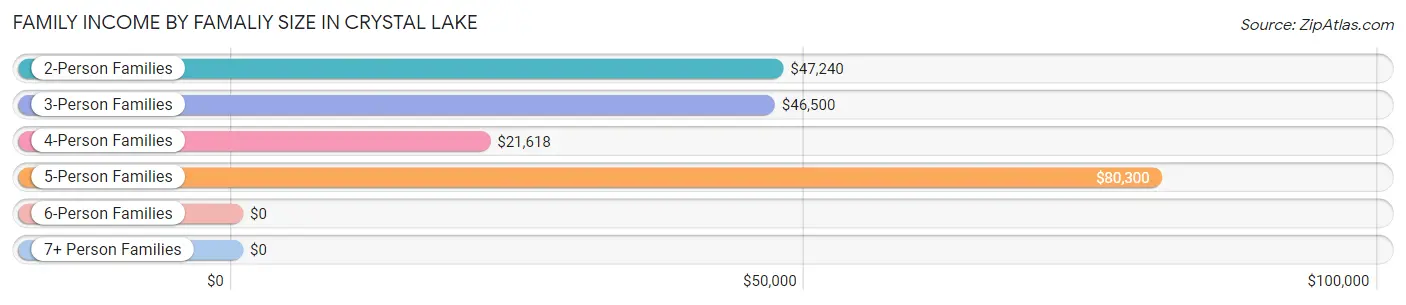
| Income Bracket | # Families | Median Income |
| 2-Person Families | 571 (39.4%) | $47,240 |
| 3-Person Families | 384 (26.5%) | $46,500 |
| 4-Person Families | 334 (23.0%) | $21,618 |
| 5-Person Families | 110 (7.6%) | $80,300 |
| 6-Person Families | 13 (0.9%) | $0 |
| 7+ Person Families | 38 (2.6%) | $0 |
| Total | 1,450 (100.0%) | $45,723 |
Family Income by Number of Earners in Crystal Lake
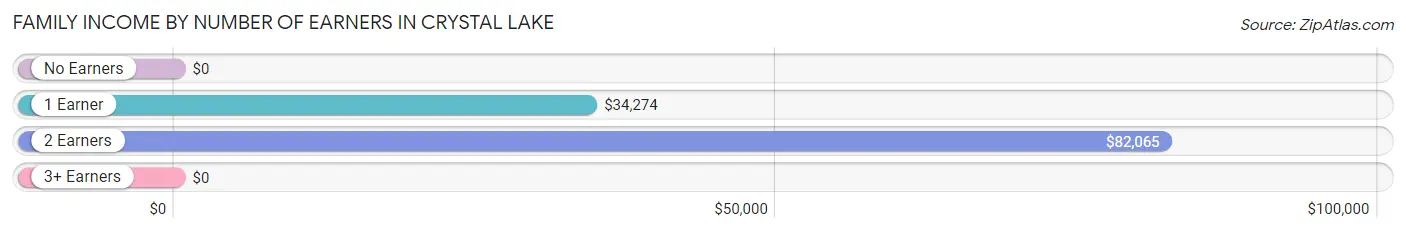
| Number of Earners | # Families | Median Income |
| No Earners | 403 (27.8%) | $0 |
| 1 Earner | 618 (42.6%) | $34,274 |
| 2 Earners | 352 (24.3%) | $82,065 |
| 3+ Earners | 77 (5.3%) | $0 |
| Total | 1,450 (100.0%) | $45,723 |
Household Income in Crystal Lake
Household Income Brackets in Crystal Lake
With 468 households falling in the category, the $35,000 to $49,999 income range is the most frequent in Crystal Lake, accounting for 23.1% of all households. In contrast, only 32 households (1.6%) fall into the $150,000 to $199,999 income bracket, making it the least populous group.
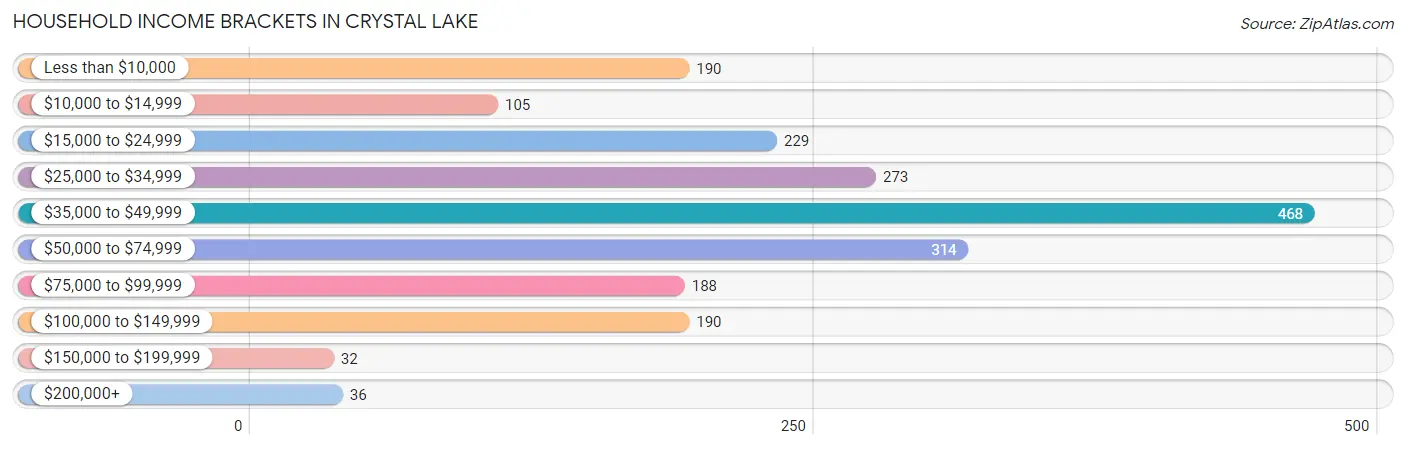
| Income Bracket | # Households | % Households |
| Less than $10,000 | 190 | 9.4% |
| $10,000 to $14,999 | 105 | 5.2% |
| $15,000 to $24,999 | 229 | 11.3% |
| $25,000 to $34,999 | 273 | 13.5% |
| $35,000 to $49,999 | 468 | 23.1% |
| $50,000 to $74,999 | 314 | 15.5% |
| $75,000 to $99,999 | 188 | 9.3% |
| $100,000 to $149,999 | 190 | 9.4% |
| $150,000 to $199,999 | 32 | 1.6% |
| $200,000+ | 36 | 1.8% |
Household Income by Householder Age in Crystal Lake
The median household income in Crystal Lake is $45,166, with the highest median household income of $83,229 found in the 15 to 24 years age bracket for the primary householder. A total of 138 households (6.8%) fall into this category. Meanwhile, the 65+ years age bracket for the primary householder has the lowest median household income of $38,167, with 372 households (18.4%) in this group.
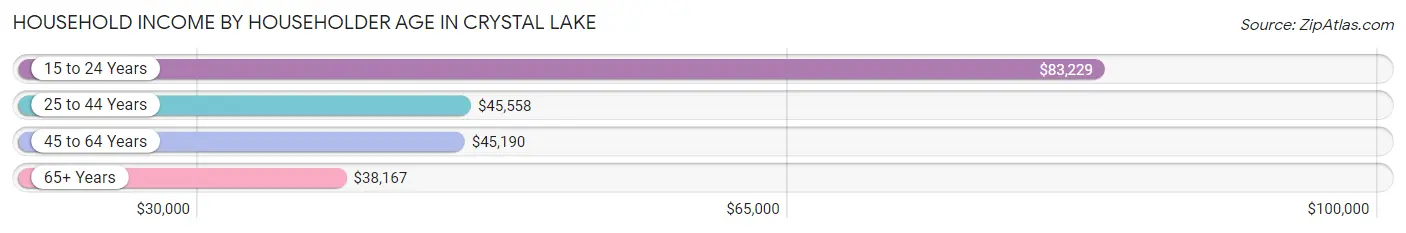
| Income Bracket | # Households | Median Income |
| 15 to 24 Years | 138 (6.8%) | $83,229 |
| 25 to 44 Years | 739 (36.5%) | $45,558 |
| 45 to 64 Years | 776 (38.3%) | $45,190 |
| 65+ Years | 372 (18.4%) | $38,167 |
| Total | 2,025 (100.0%) | $45,166 |
Poverty in Crystal Lake
Income Below Poverty by Sex and Age in Crystal Lake
With 34.0% poverty level for males and 38.8% for females among the residents of Crystal Lake, 15 year old males and 5 year old females are the most vulnerable to poverty, with 136 males (100.0%) and 73 females (81.1%) in their respective age groups living below the poverty level.
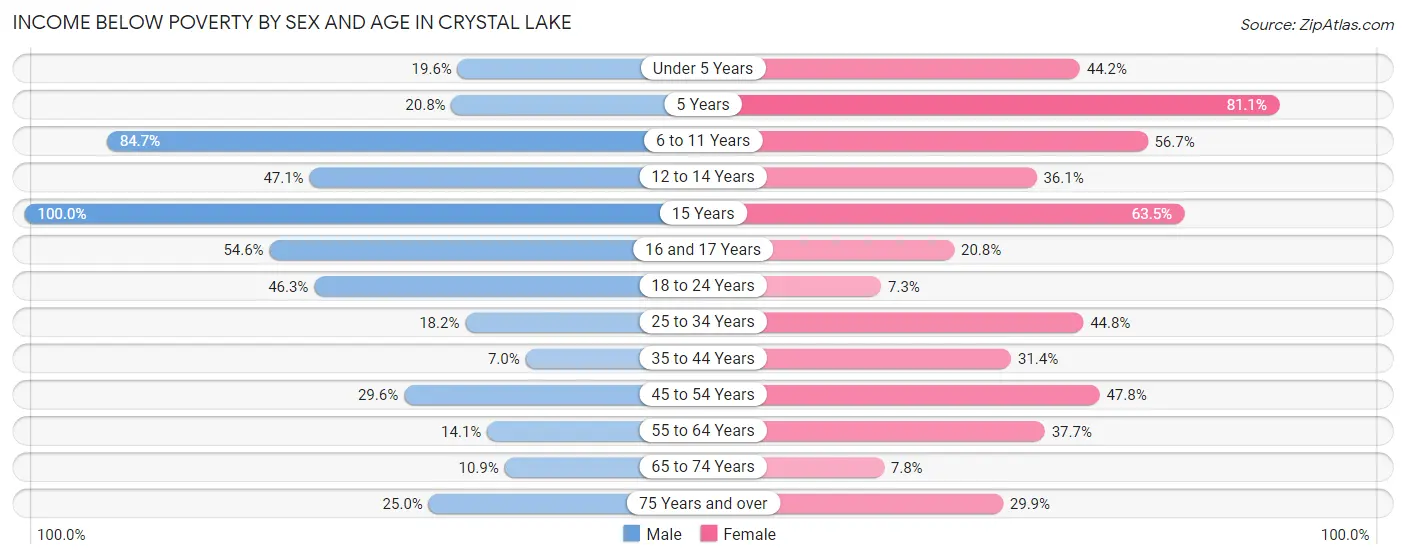
| Age Bracket | Male | Female |
| Under 5 Years | 41 (19.6%) | 148 (44.2%) |
| 5 Years | 16 (20.8%) | 73 (81.1%) |
| 6 to 11 Years | 261 (84.7%) | 202 (56.7%) |
| 12 to 14 Years | 82 (47.1%) | 30 (36.1%) |
| 15 Years | 136 (100.0%) | 80 (63.5%) |
| 16 and 17 Years | 48 (54.5%) | 10 (20.8%) |
| 18 to 24 Years | 142 (46.3%) | 20 (7.3%) |
| 25 to 34 Years | 59 (18.2%) | 190 (44.8%) |
| 35 to 44 Years | 29 (7.0%) | 93 (31.4%) |
| 45 to 54 Years | 121 (29.6%) | 143 (47.8%) |
| 55 to 64 Years | 41 (14.1%) | 113 (37.7%) |
| 65 to 74 Years | 18 (10.9%) | 16 (7.8%) |
| 75 Years and over | 21 (25.0%) | 58 (29.9%) |
| Total | 1,015 (34.0%) | 1,176 (38.8%) |
Income Above Poverty by Sex and Age in Crystal Lake
According to the poverty statistics in Crystal Lake, males aged 35 to 44 years and females aged 18 to 24 years are the age groups that are most secure financially, with 93.0% of males and 92.7% of females in these age groups living above the poverty line.
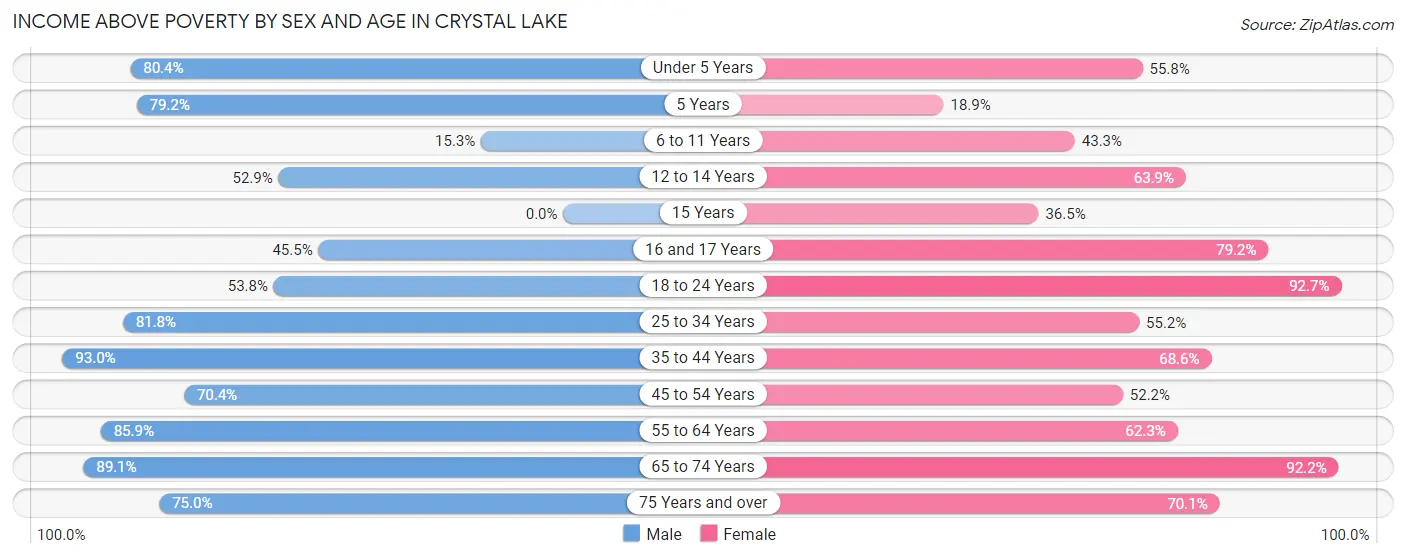
| Age Bracket | Male | Female |
| Under 5 Years | 168 (80.4%) | 187 (55.8%) |
| 5 Years | 61 (79.2%) | 17 (18.9%) |
| 6 to 11 Years | 47 (15.3%) | 154 (43.3%) |
| 12 to 14 Years | 92 (52.9%) | 53 (63.9%) |
| 15 Years | 0 (0.0%) | 46 (36.5%) |
| 16 and 17 Years | 40 (45.5%) | 38 (79.2%) |
| 18 to 24 Years | 165 (53.7%) | 254 (92.7%) |
| 25 to 34 Years | 265 (81.8%) | 234 (55.2%) |
| 35 to 44 Years | 384 (93.0%) | 203 (68.6%) |
| 45 to 54 Years | 288 (70.4%) | 156 (52.2%) |
| 55 to 64 Years | 249 (85.9%) | 187 (62.3%) |
| 65 to 74 Years | 147 (89.1%) | 189 (92.2%) |
| 75 Years and over | 63 (75.0%) | 136 (70.1%) |
| Total | 1,969 (66.0%) | 1,854 (61.2%) |
Income Below Poverty Among Married-Couple Families in Crystal Lake
The poverty statistics for married-couple families in Crystal Lake show that 13.6% or 87 of the total 642 families live below the poverty line. Families with 3 or 4 children have the highest poverty rate of 25.6%, comprising of 20 families. On the other hand, families with no children have the lowest poverty rate of 6.1%, which includes 24 families.
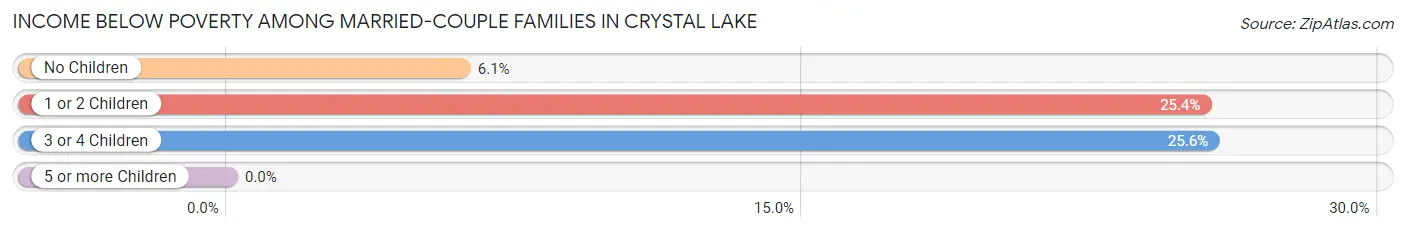
| Children | Above Poverty | Below Poverty |
| No Children | 371 (93.9%) | 24 (6.1%) |
| 1 or 2 Children | 126 (74.6%) | 43 (25.4%) |
| 3 or 4 Children | 58 (74.4%) | 20 (25.6%) |
| 5 or more Children | 0 (0.0%) | 0 (0.0%) |
| Total | 555 (86.5%) | 87 (13.6%) |
Income Below Poverty Among Single-Parent Households in Crystal Lake
According to the poverty data in Crystal Lake, 27.3% or 79 single-father households and 54.3% or 282 single-mother households are living below the poverty line. Among single-father households, those with 1 or 2 children have the highest poverty rate, with 66 households (29.6%) experiencing poverty. Likewise, among single-mother households, those with 5 or more children have the highest poverty rate, with 38 households (100.0%) falling below the poverty line.
| Children | Single Father | Single Mother |
| No Children | 13 (19.7%) | 8 (7.5%) |
| 1 or 2 Children | 66 (29.6%) | 118 (51.3%) |
| 3 or 4 Children | 0 (0.0%) | 118 (81.9%) |
| 5 or more Children | 0 (0.0%) | 38 (100.0%) |
| Total | 79 (27.3%) | 282 (54.3%) |
Income Below Poverty Among Married-Couple vs Single-Parent Households in Crystal Lake
The poverty data for Crystal Lake shows that 87 of the married-couple family households (13.6%) and 361 of the single-parent households (44.7%) are living below the poverty level. Within the married-couple family households, those with 3 or 4 children have the highest poverty rate, with 20 households (25.6%) falling below the poverty line. Among the single-parent households, those with 5 or more children have the highest poverty rate, with 38 household (100.0%) living below poverty.
| Children | Married-Couple Families | Single-Parent Households |
| No Children | 24 (6.1%) | 21 (12.1%) |
| 1 or 2 Children | 43 (25.4%) | 184 (40.6%) |
| 3 or 4 Children | 20 (25.6%) | 118 (81.9%) |
| 5 or more Children | 0 (0.0%) | 38 (100.0%) |
| Total | 87 (13.6%) | 361 (44.7%) |
Race in Crystal Lake
The most populous races in Crystal Lake are White / Caucasian (3,393 | 56.1%), Hispanic or Latino (2,009 | 33.2%), and Black / African American (1,346 | 22.3%).
| Race | # Population | % Population |
| Asian | 182 | 3.0% |
| Black / African American | 1,346 | 22.3% |
| Hawaiian / Pacific | 0 | 0.0% |
| Hispanic or Latino | 2,009 | 33.2% |
| Native / Alaskan | 5 | 0.1% |
| White / Caucasian | 3,393 | 56.1% |
| Two or more Races | 297 | 4.9% |
| Some other Race | 825 | 13.6% |
| Total | 6,048 | 100.0% |
Ancestry in Crystal Lake
The most populous ancestries reported in Crystal Lake are Mexican (1,036 | 17.1%), American (897 | 14.8%), Puerto Rican (732 | 12.1%), German (382 | 6.3%), and English (320 | 5.3%), together accounting for 55.7% of all Crystal Lake residents.
| Ancestry | # Population | % Population |
| African | 11 | 0.2% |
| American | 897 | 14.8% |
| Belizean | 70 | 1.2% |
| Blackfeet | 9 | 0.2% |
| British | 62 | 1.0% |
| Central American | 47 | 0.8% |
| Cherokee | 20 | 0.3% |
| Creek | 26 | 0.4% |
| Cuban | 150 | 2.5% |
| Czech | 13 | 0.2% |
| Dominican | 16 | 0.3% |
| Dutch | 64 | 1.1% |
| English | 320 | 5.3% |
| European | 9 | 0.2% |
| French | 87 | 1.4% |
| French Canadian | 56 | 0.9% |
| German | 382 | 6.3% |
| Irish | 263 | 4.3% |
| Italian | 93 | 1.5% |
| Korean | 50 | 0.8% |
| Malaysian | 48 | 0.8% |
| Mexican | 1,036 | 17.1% |
| Norwegian | 21 | 0.4% |
| Peruvian | 16 | 0.3% |
| Polish | 11 | 0.2% |
| Puerto Rican | 732 | 12.1% |
| Romanian | 56 | 0.9% |
| Scotch-Irish | 32 | 0.5% |
| Scottish | 15 | 0.3% |
| Seminole | 33 | 0.5% |
| Slovak | 5 | 0.1% |
| South American | 16 | 0.3% |
| Sri Lankan | 62 | 1.0% |
| Subsaharan African | 11 | 0.2% |
| Swedish | 12 | 0.2% |
| Thai | 22 | 0.4% |
| Welsh | 28 | 0.5% | View All 37 Rows |
Immigrants in Crystal Lake
The most numerous immigrant groups reported in Crystal Lake came from Latin America (561 | 9.3%), Central America (381 | 6.3%), Mexico (334 | 5.5%), Caribbean (180 | 3.0%), and Asia (132 | 2.2%), together accounting for 26.3% of all Crystal Lake residents.
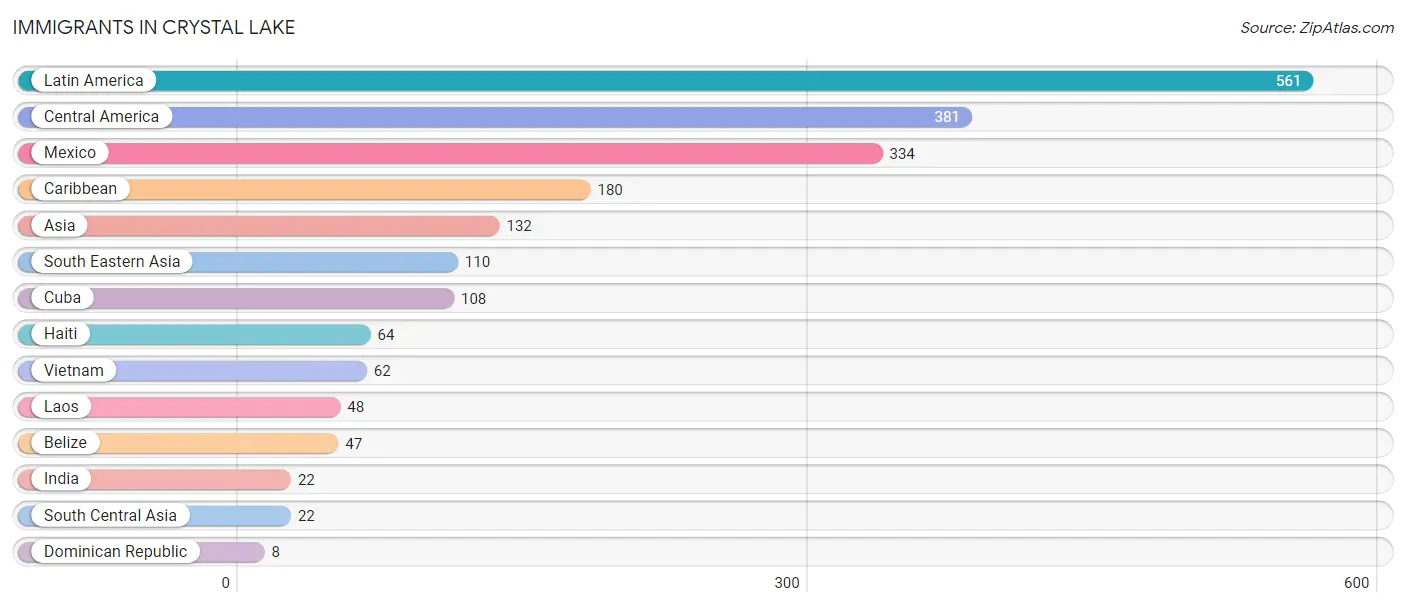
| Immigration Origin | # Population | % Population |
| Asia | 132 | 2.2% |
| Belize | 47 | 0.8% |
| Caribbean | 180 | 3.0% |
| Central America | 381 | 6.3% |
| Cuba | 108 | 1.8% |
| Dominican Republic | 8 | 0.1% |
| Haiti | 64 | 1.1% |
| India | 22 | 0.4% |
| Laos | 48 | 0.8% |
| Latin America | 561 | 9.3% |
| Mexico | 334 | 5.5% |
| South Central Asia | 22 | 0.4% |
| South Eastern Asia | 110 | 1.8% |
| Vietnam | 62 | 1.0% | View All 14 Rows |
Sex and Age in Crystal Lake
Sex and Age in Crystal Lake
The most populous age groups in Crystal Lake are 5 to 9 Years (325 | 10.8%) for men and Under 5 Years (335 | 11.1%) for women.
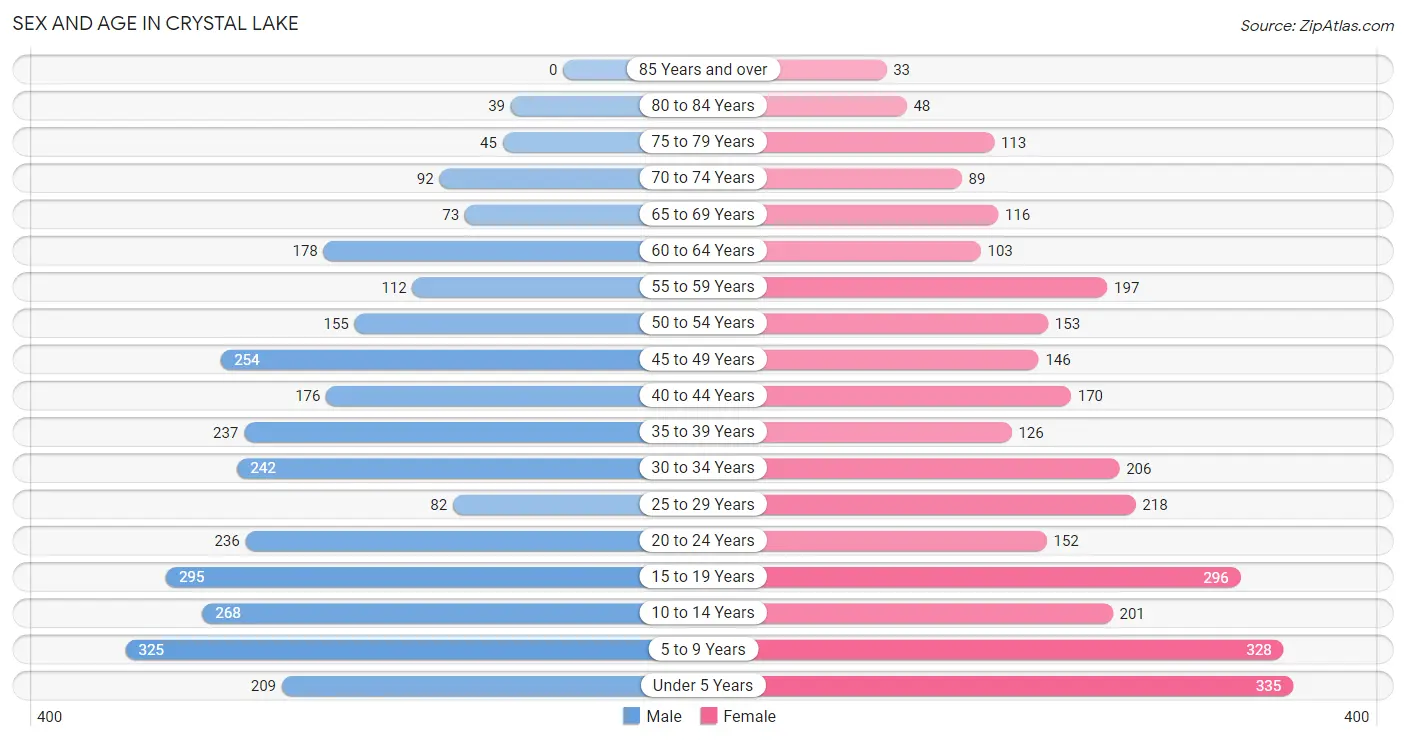
| Age Bracket | Male | Female |
| Under 5 Years | 209 (6.9%) | 335 (11.1%) |
| 5 to 9 Years | 325 (10.8%) | 328 (10.8%) |
| 10 to 14 Years | 268 (8.9%) | 201 (6.6%) |
| 15 to 19 Years | 295 (9.8%) | 296 (9.8%) |
| 20 to 24 Years | 236 (7.8%) | 152 (5.0%) |
| 25 to 29 Years | 82 (2.7%) | 218 (7.2%) |
| 30 to 34 Years | 242 (8.0%) | 206 (6.8%) |
| 35 to 39 Years | 237 (7.9%) | 126 (4.2%) |
| 40 to 44 Years | 176 (5.8%) | 170 (5.6%) |
| 45 to 49 Years | 254 (8.4%) | 146 (4.8%) |
| 50 to 54 Years | 155 (5.1%) | 153 (5.1%) |
| 55 to 59 Years | 112 (3.7%) | 197 (6.5%) |
| 60 to 64 Years | 178 (5.9%) | 103 (3.4%) |
| 65 to 69 Years | 73 (2.4%) | 116 (3.8%) |
| 70 to 74 Years | 92 (3.0%) | 89 (2.9%) |
| 75 to 79 Years | 45 (1.5%) | 113 (3.7%) |
| 80 to 84 Years | 39 (1.3%) | 48 (1.6%) |
| 85 Years and over | 0 (0.0%) | 33 (1.1%) |
| Total | 3,018 (100.0%) | 3,030 (100.0%) |
Families and Households in Crystal Lake
Median Family Size in Crystal Lake
The median family size in Crystal Lake is 3.43 persons per family, with single female/mother families (519 | 35.8%) accounting for the largest median family size of 4.11 persons per family. On the other hand, single male/father families (289 | 19.9%) represent the smallest median family size with 2.91 persons per family.
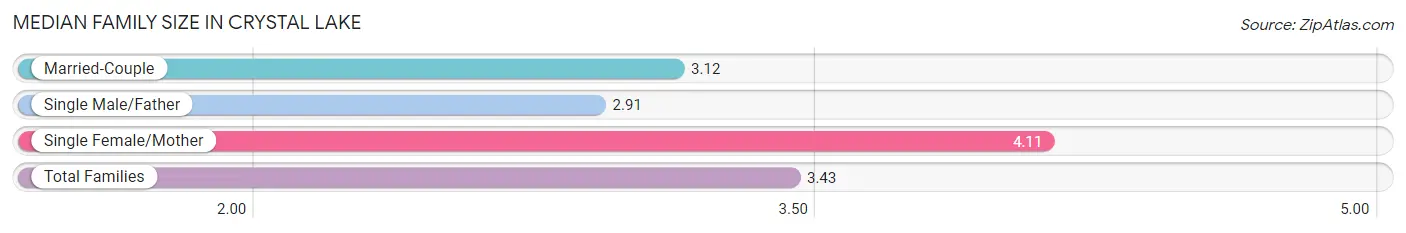
| Family Type | # Families | Family Size |
| Married-Couple | 642 (44.3%) | 3.12 |
| Single Male/Father | 289 (19.9%) | 2.91 |
| Single Female/Mother | 519 (35.8%) | 4.11 |
| Total Families | 1,450 (100.0%) | 3.43 |
Median Household Size in Crystal Lake
The median household size in Crystal Lake is 2.99 persons per household, with single female/mother households (519 | 25.6%) accounting for the largest median household size of 4.55 persons per household. non-family households (575 | 28.4%) represent the smallest median household size with 1.25 persons per household.
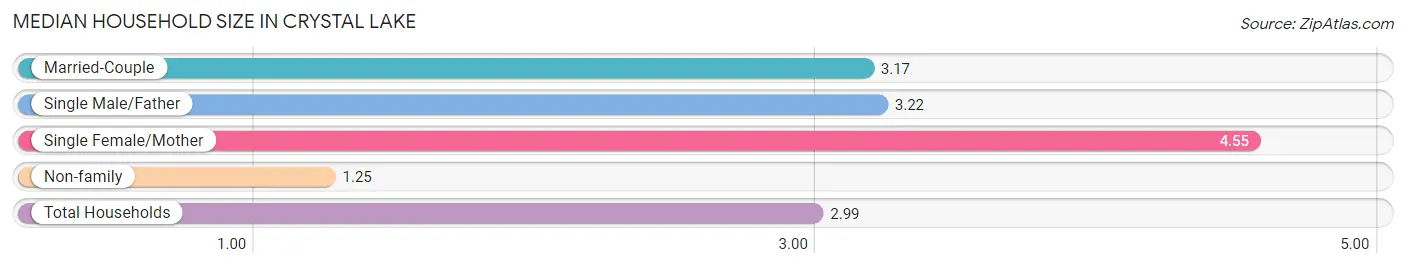
| Household Type | # Households | Household Size |
| Married-Couple | 642 (31.7%) | 3.17 |
| Single Male/Father | 289 (14.3%) | 3.22 |
| Single Female/Mother | 519 (25.6%) | 4.55 |
| Non-family | 575 (28.4%) | 1.25 |
| Total Households | 2,025 (100.0%) | 2.99 |
Household Size by Marriage Status in Crystal Lake
Out of a total of 2,025 households in Crystal Lake, 1,450 (71.6%) are family households, while 575 (28.4%) are nonfamily households. The most numerous type of family households are 2-person households, comprising 481, and the most common type of nonfamily households are 1-person households, comprising 450.
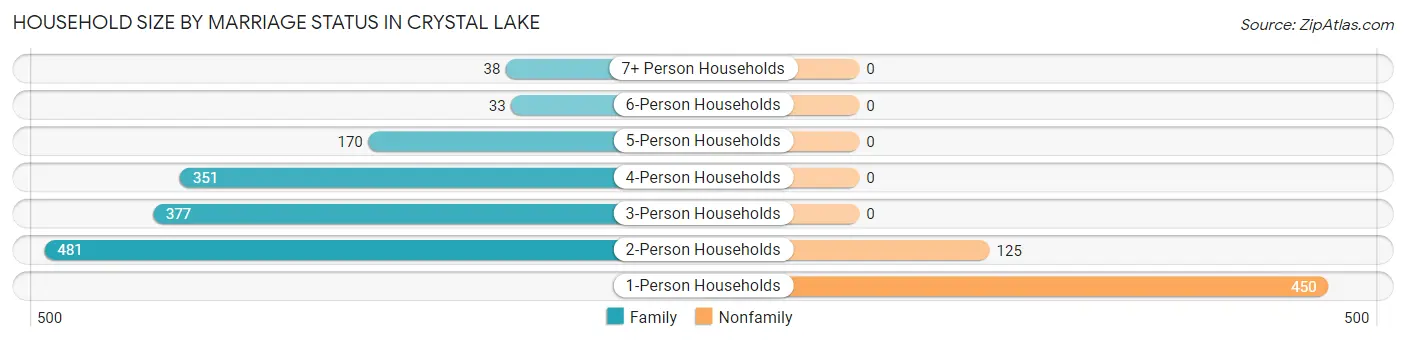
| Household Size | Family Households | Nonfamily Households |
| 1-Person Households | - | 450 (22.2%) |
| 2-Person Households | 481 (23.7%) | 125 (6.2%) |
| 3-Person Households | 377 (18.6%) | 0 (0.0%) |
| 4-Person Households | 351 (17.3%) | 0 (0.0%) |
| 5-Person Households | 170 (8.4%) | 0 (0.0%) |
| 6-Person Households | 33 (1.6%) | 0 (0.0%) |
| 7+ Person Households | 38 (1.9%) | 0 (0.0%) |
| Total | 1,450 (71.6%) | 575 (28.4%) |
Female Fertility in Crystal Lake
Fertility by Age in Crystal Lake
| Age Bracket | Women with Births | Births / 1,000 Women |
| 15 to 19 years | 0 (0.0%) | 0.0 |
| 20 to 34 years | 0 (0.0%) | 0.0 |
| 35 to 50 years | 0 (0.0%) | 0.0 |
| Total | 0 (0.0%) | 0.0 |
Fertility by Age by Marriage Status in Crystal Lake
| Age Bracket | Married | Unmarried |
| 15 to 19 years | 0 (0.0%) | 0 (0.0%) |
| 20 to 34 years | 0 (0.0%) | 0 (0.0%) |
| 35 to 50 years | 0 (0.0%) | 0 (0.0%) |
| Total | 0 (0.0%) | 0 (0.0%) |
Fertility by Education in Crystal Lake
| Educational Attainment | Women with Births | Births / 1,000 Women |
| Less than High School | 0 (0.0%) | 0.0 |
| High School Diploma | 0 (0.0%) | 0.0 |
| College or Associate's Degree | 0 (0.0%) | 0.0 |
| Bachelor's Degree | 0 (0.0%) | 0.0 |
| Graduate Degree | 0 (0.0%) | 0.0 |
| Total | 0 (0.0%) | 0.0 |
Fertility by Education by Marriage Status in Crystal Lake
| Educational Attainment | Married | Unmarried |
| Less than High School | 0 (0.0%) | 0 (0.0%) |
| High School Diploma | 0 (0.0%) | 0 (0.0%) |
| College or Associate's Degree | 0 (0.0%) | 0 (0.0%) |
| Bachelor's Degree | 0 (0.0%) | 0 (0.0%) |
| Graduate Degree | 0 (0.0%) | 0 (0.0%) |
| Total | 0 (0.0%) | 0 (0.0%) |
Employment Characteristics in Crystal Lake
Employment by Class of Employer in Crystal Lake
Among the 2,433 employed individuals in Crystal Lake, private company employees (1,878 | 77.2%), not-for-profit organizations (164 | 6.7%), and self-employed (incorporated) (138 | 5.7%) make up the most common classes of employment.
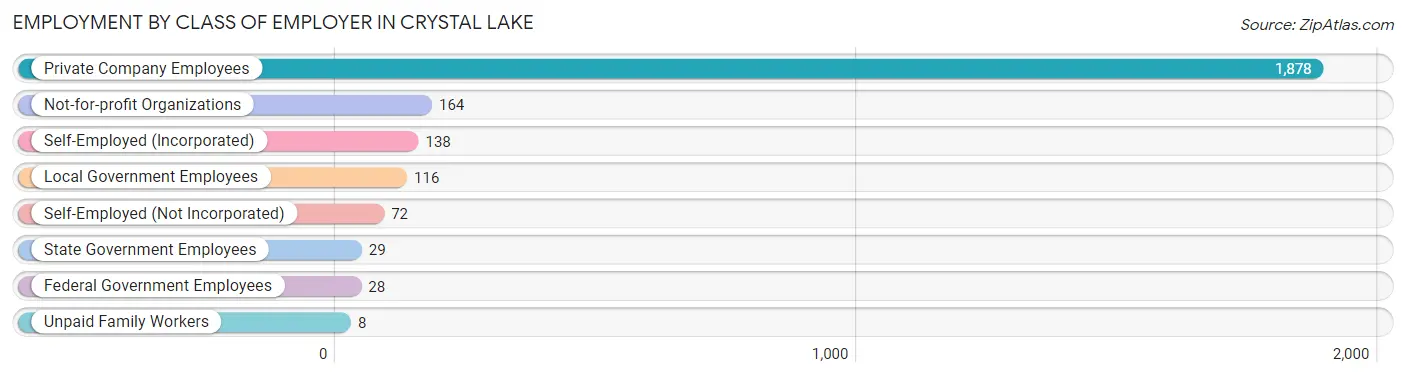
| Employer Class | # Employees | % Employees |
| Private Company Employees | 1,878 | 77.2% |
| Self-Employed (Incorporated) | 138 | 5.7% |
| Self-Employed (Not Incorporated) | 72 | 3.0% |
| Not-for-profit Organizations | 164 | 6.7% |
| Local Government Employees | 116 | 4.8% |
| State Government Employees | 29 | 1.2% |
| Federal Government Employees | 28 | 1.1% |
| Unpaid Family Workers | 8 | 0.3% |
| Total | 2,433 | 100.0% |
Employment Status by Age in Crystal Lake
According to the labor force statistics for Crystal Lake, out of the total population over 16 years of age (4,120), 64.1% or 2,641 individuals are in the labor force, with 7.4% or 195 of them unemployed. The age group with the highest labor force participation rate is 20 to 24 years, with 100.0% or 388 individuals in the labor force. Within the labor force, the 20 to 24 years age range has the highest percentage of unemployed individuals, with 22.7% or 88 of them being unemployed.
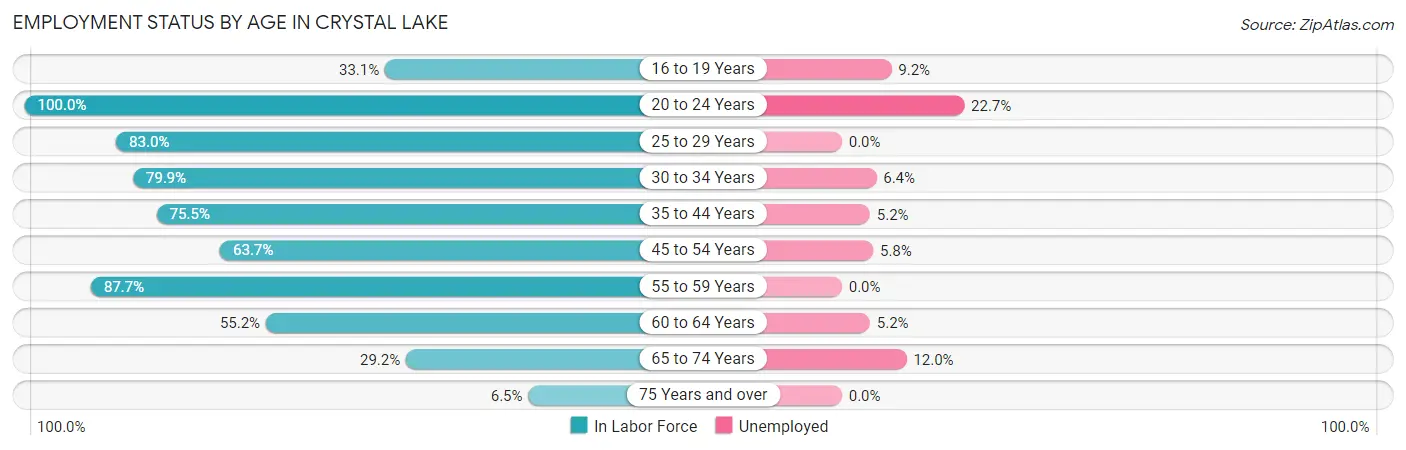
| Age Bracket | In Labor Force | Unemployed |
| 16 to 19 Years | 109 (33.1%) | 10 (9.2%) |
| 20 to 24 Years | 388 (100.0%) | 88 (22.7%) |
| 25 to 29 Years | 249 (83.0%) | 0 (0.0%) |
| 30 to 34 Years | 358 (79.9%) | 23 (6.4%) |
| 35 to 44 Years | 535 (75.5%) | 28 (5.2%) |
| 45 to 54 Years | 451 (63.7%) | 26 (5.8%) |
| 55 to 59 Years | 271 (87.7%) | 0 (0.0%) |
| 60 to 64 Years | 155 (55.2%) | 8 (5.2%) |
| 65 to 74 Years | 108 (29.2%) | 13 (12.0%) |
| 75 Years and over | 18 (6.5%) | 0 (0.0%) |
| Total | 2,641 (64.1%) | 195 (7.4%) |
Employment Status by Educational Attainment in Crystal Lake
According to labor force statistics for Crystal Lake, 73.3% of individuals (2,019) out of the total population between 25 and 64 years of age (2,755) are in the labor force, with 4.2% or 85 of them being unemployed. The group with the highest labor force participation rate are those with the educational attainment of bachelor's degree or higher, with 87.8% or 330 individuals in the labor force. Within the labor force, individuals with bachelor's degree or higher education have the highest percentage of unemployment, with 7.6% or 25 of them being unemployed.
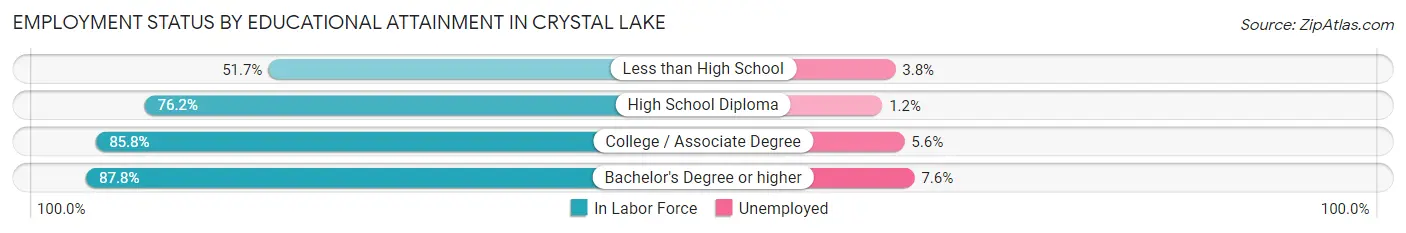
| Educational Attainment | In Labor Force | Unemployed |
| Less than High School | 418 (51.7%) | 31 (3.8%) |
| High School Diploma | 608 (76.2%) | 10 (1.2%) |
| College / Associate Degree | 663 (85.8%) | 43 (5.6%) |
| Bachelor's Degree or higher | 330 (87.8%) | 29 (7.6%) |
| Total | 2,019 (73.3%) | 116 (4.2%) |
Employment Occupations by Sex in Crystal Lake
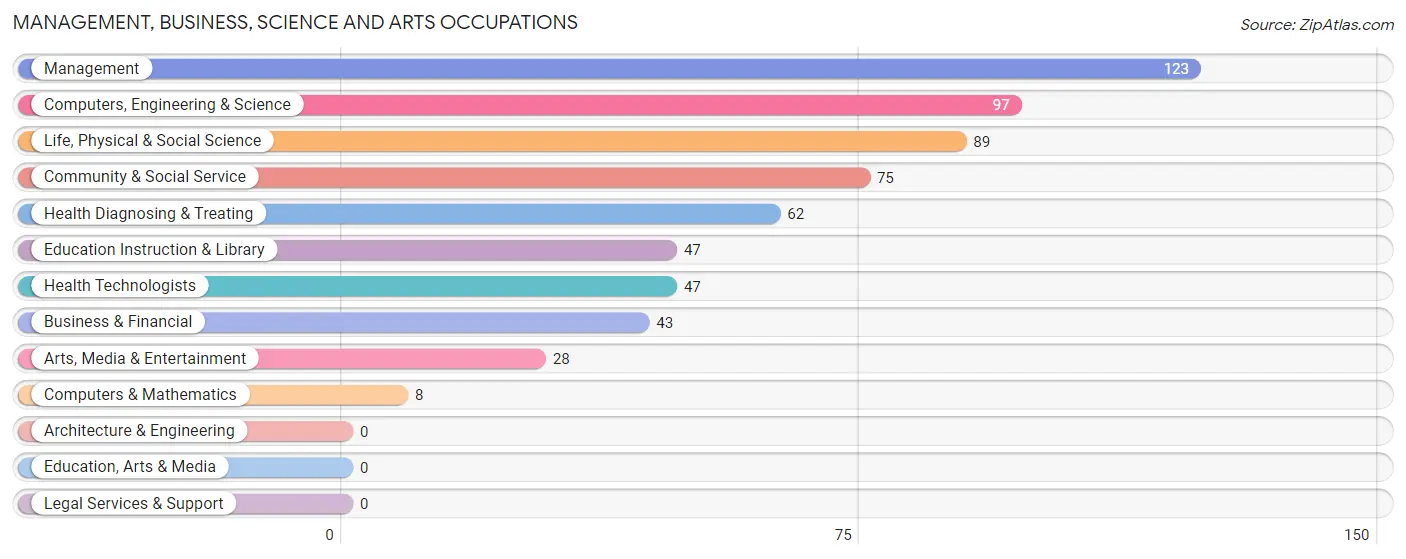
Management, Business, Science and Arts Occupations
The most common Management, Business, Science and Arts occupations in Crystal Lake are Management (123 | 5.0%), Computers, Engineering & Science (97 | 4.0%), Life, Physical & Social Science (89 | 3.6%), Community & Social Service (75 | 3.1%), and Health Diagnosing & Treating (62 | 2.5%).
Management, Business, Science and Arts Occupations by Sex
Within the Management, Business, Science and Arts occupations in Crystal Lake, the most male-oriented occupations are Arts, Media & Entertainment (100.0%), Management (65.0%), and Life, Physical & Social Science (62.9%), while the most female-oriented occupations are Computers & Mathematics (100.0%), Health Technologists (100.0%), and Health Diagnosing & Treating (96.8%).
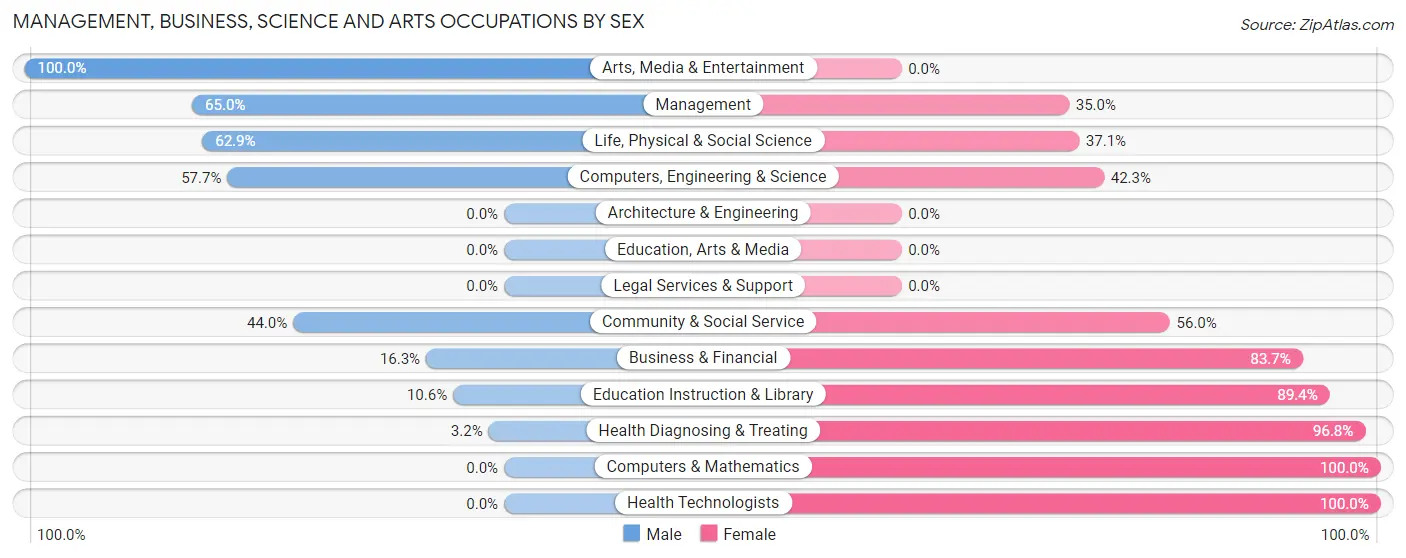
| Occupation | Male | Female |
| Management | 80 (65.0%) | 43 (35.0%) |
| Business & Financial | 7 (16.3%) | 36 (83.7%) |
| Computers, Engineering & Science | 56 (57.7%) | 41 (42.3%) |
| Computers & Mathematics | 0 (0.0%) | 8 (100.0%) |
| Architecture & Engineering | 0 (0.0%) | 0 (0.0%) |
| Life, Physical & Social Science | 56 (62.9%) | 33 (37.1%) |
| Community & Social Service | 33 (44.0%) | 42 (56.0%) |
| Education, Arts & Media | 0 (0.0%) | 0 (0.0%) |
| Legal Services & Support | 0 (0.0%) | 0 (0.0%) |
| Education Instruction & Library | 5 (10.6%) | 42 (89.4%) |
| Arts, Media & Entertainment | 28 (100.0%) | 0 (0.0%) |
| Health Diagnosing & Treating | 2 (3.2%) | 60 (96.8%) |
| Health Technologists | 0 (0.0%) | 47 (100.0%) |
| Total (Category) | 178 (44.5%) | 222 (55.5%) |
| Total (Overall) | 1,306 (53.4%) | 1,140 (46.6%) |
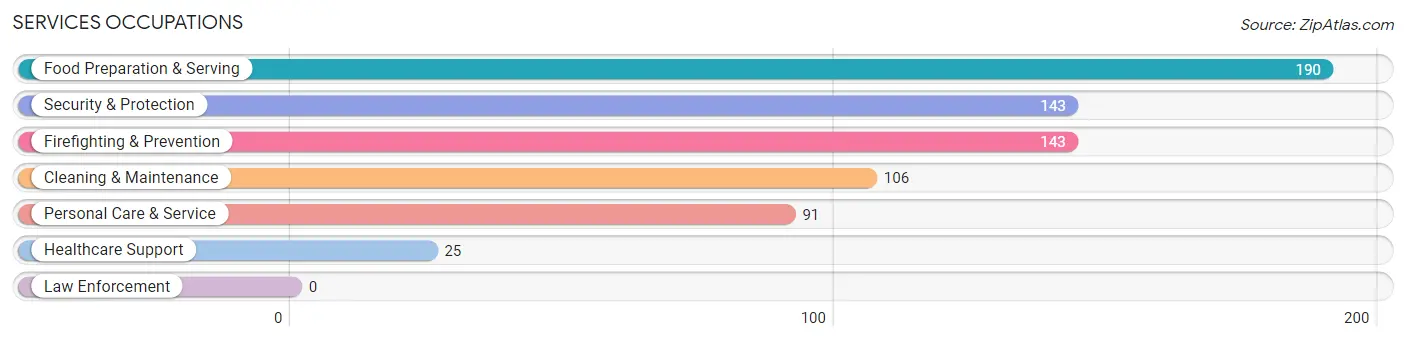
Services Occupations
The most common Services occupations in Crystal Lake are Food Preparation & Serving (190 | 7.8%), Security & Protection (143 | 5.9%), Firefighting & Prevention (143 | 5.9%), Cleaning & Maintenance (106 | 4.3%), and Personal Care & Service (91 | 3.7%).
Services Occupations by Sex
Within the Services occupations in Crystal Lake, the most male-oriented occupations are Security & Protection (81.8%), Firefighting & Prevention (81.8%), and Food Preparation & Serving (56.8%), while the most female-oriented occupations are Healthcare Support (100.0%), Cleaning & Maintenance (80.2%), and Personal Care & Service (68.1%).
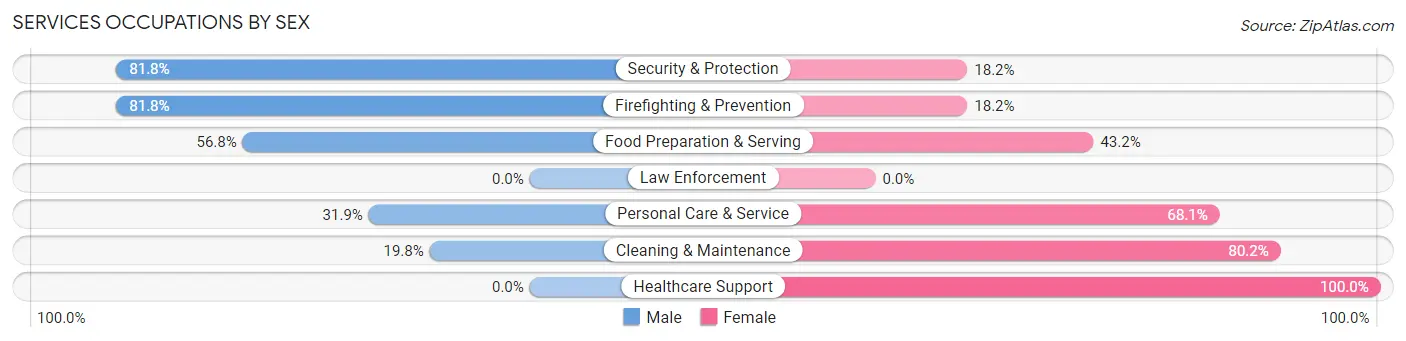
| Occupation | Male | Female |
| Healthcare Support | 0 (0.0%) | 25 (100.0%) |
| Security & Protection | 117 (81.8%) | 26 (18.2%) |
| Firefighting & Prevention | 117 (81.8%) | 26 (18.2%) |
| Law Enforcement | 0 (0.0%) | 0 (0.0%) |
| Food Preparation & Serving | 108 (56.8%) | 82 (43.2%) |
| Cleaning & Maintenance | 21 (19.8%) | 85 (80.2%) |
| Personal Care & Service | 29 (31.9%) | 62 (68.1%) |
| Total (Category) | 275 (49.5%) | 280 (50.4%) |
| Total (Overall) | 1,306 (53.4%) | 1,140 (46.6%) |
Sales and Office Occupations
The most common Sales and Office occupations in Crystal Lake are Office & Administration (366 | 15.0%), and Sales & Related (170 | 7.0%).
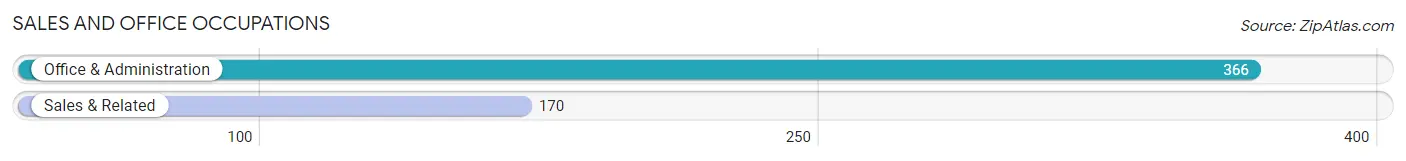
Sales and Office Occupations by Sex
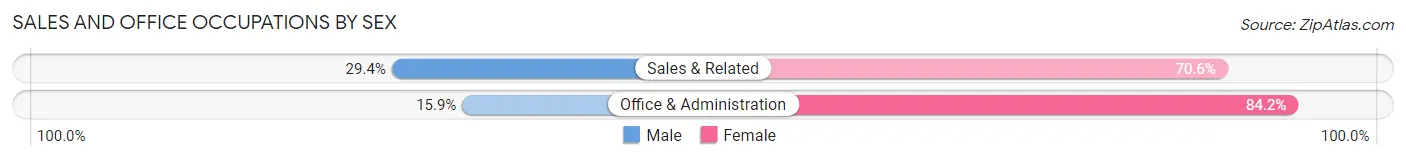
| Occupation | Male | Female |
| Sales & Related | 50 (29.4%) | 120 (70.6%) |
| Office & Administration | 58 (15.9%) | 308 (84.2%) |
| Total (Category) | 108 (20.2%) | 428 (79.8%) |
| Total (Overall) | 1,306 (53.4%) | 1,140 (46.6%) |
Natural Resources, Construction and Maintenance Occupations
The most common Natural Resources, Construction and Maintenance occupations in Crystal Lake are Construction & Extraction (254 | 10.4%), Installation, Maintenance & Repair (183 | 7.5%), and Farming, Fishing & Forestry (6 | 0.3%).
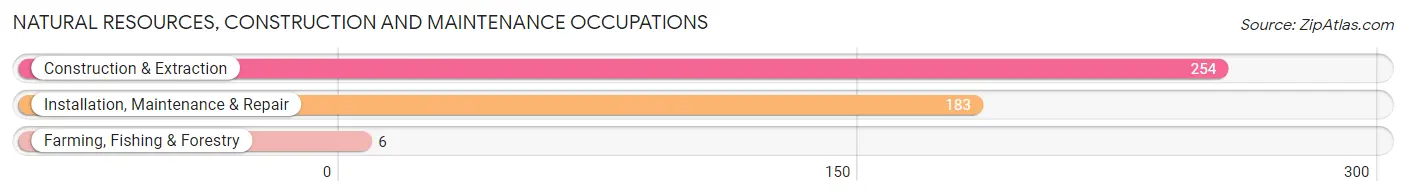
Natural Resources, Construction and Maintenance Occupations by Sex
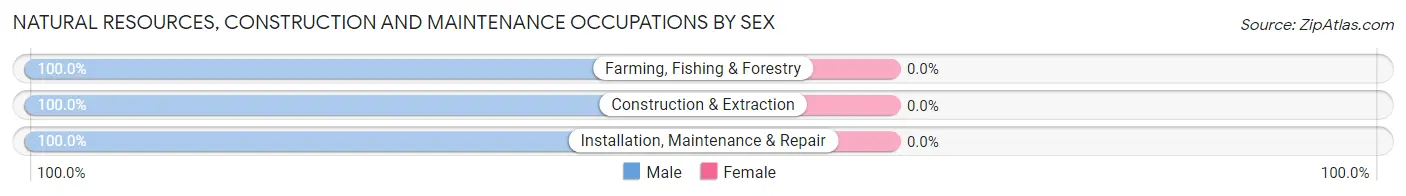
| Occupation | Male | Female |
| Farming, Fishing & Forestry | 6 (100.0%) | 0 (0.0%) |
| Construction & Extraction | 254 (100.0%) | 0 (0.0%) |
| Installation, Maintenance & Repair | 183 (100.0%) | 0 (0.0%) |
| Total (Category) | 443 (100.0%) | 0 (0.0%) |
| Total (Overall) | 1,306 (53.4%) | 1,140 (46.6%) |
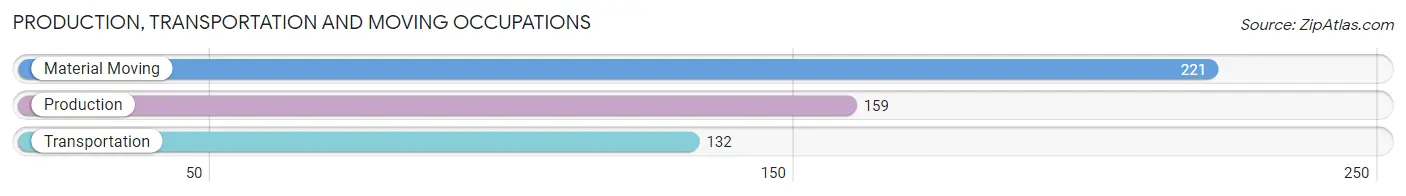
Production, Transportation and Moving Occupations
The most common Production, Transportation and Moving occupations in Crystal Lake are Material Moving (221 | 9.0%), Production (159 | 6.5%), and Transportation (132 | 5.4%).
Production, Transportation and Moving Occupations by Sex
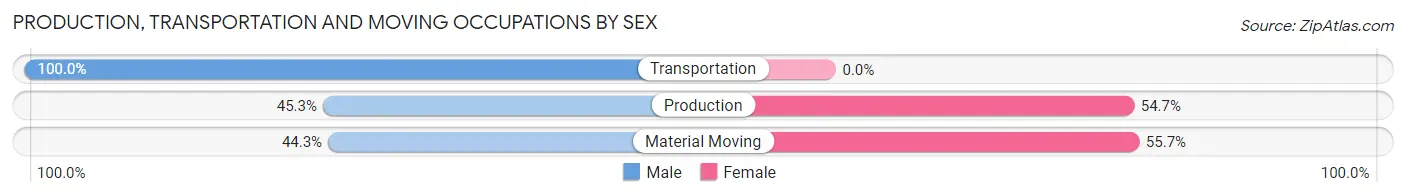
| Occupation | Male | Female |
| Production | 72 (45.3%) | 87 (54.7%) |
| Transportation | 132 (100.0%) | 0 (0.0%) |
| Material Moving | 98 (44.3%) | 123 (55.7%) |
| Total (Category) | 302 (59.0%) | 210 (41.0%) |
| Total (Overall) | 1,306 (53.4%) | 1,140 (46.6%) |
Employment Industries by Sex in Crystal Lake
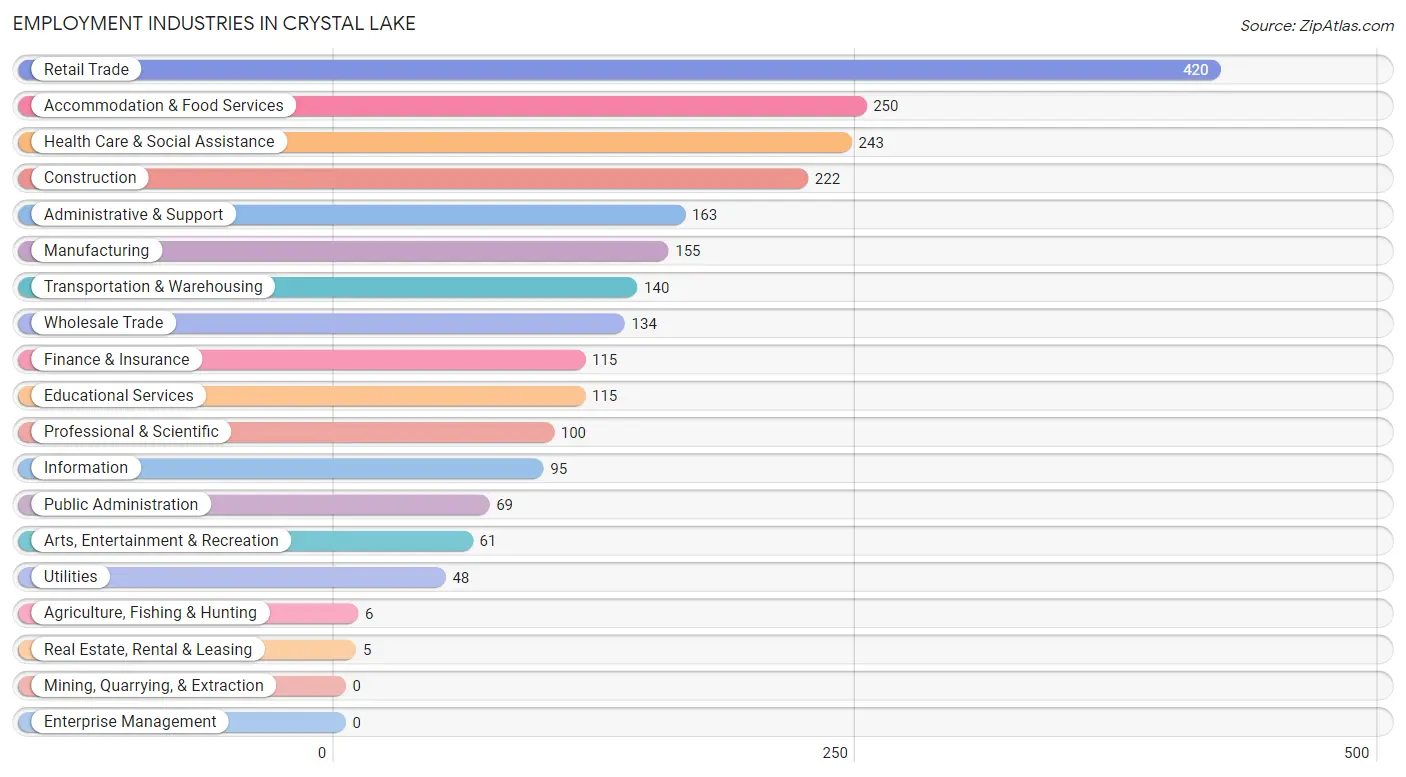
Employment Industries in Crystal Lake
The major employment industries in Crystal Lake include Retail Trade (420 | 17.2%), Accommodation & Food Services (250 | 10.2%), Health Care & Social Assistance (243 | 9.9%), Construction (222 | 9.1%), and Administrative & Support (163 | 6.7%).
Employment Industries by Sex in Crystal Lake
The Crystal Lake industries that see more men than women are Agriculture, Fishing & Hunting (100.0%), Utilities (100.0%), and Construction (86.9%), whereas the industries that tend to have a higher number of women are Finance & Insurance (100.0%), Real Estate, Rental & Leasing (100.0%), and Professional & Scientific (100.0%).
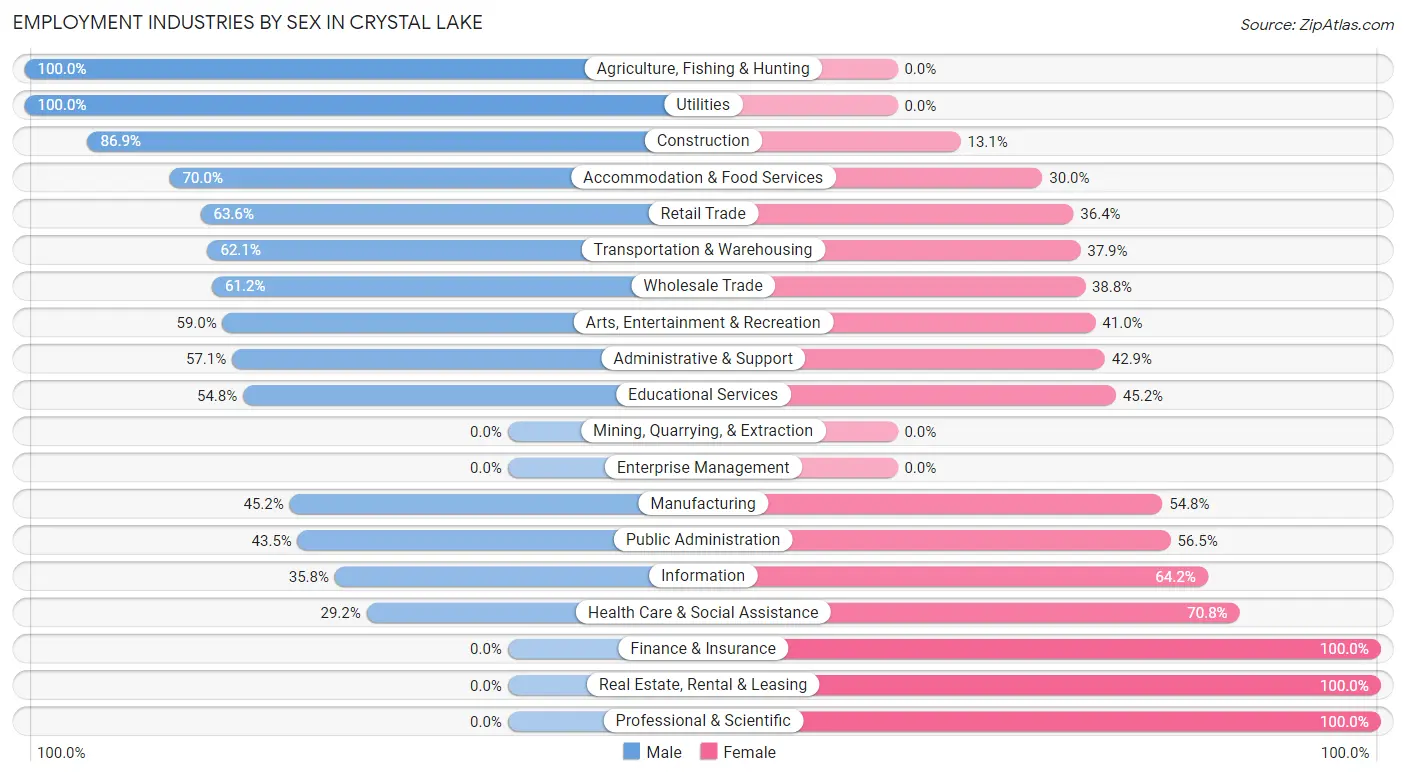
| Industry | Male | Female |
| Agriculture, Fishing & Hunting | 6 (100.0%) | 0 (0.0%) |
| Mining, Quarrying, & Extraction | 0 (0.0%) | 0 (0.0%) |
| Construction | 193 (86.9%) | 29 (13.1%) |
| Manufacturing | 70 (45.2%) | 85 (54.8%) |
| Wholesale Trade | 82 (61.2%) | 52 (38.8%) |
| Retail Trade | 267 (63.6%) | 153 (36.4%) |
| Transportation & Warehousing | 87 (62.1%) | 53 (37.9%) |
| Utilities | 48 (100.0%) | 0 (0.0%) |
| Information | 34 (35.8%) | 61 (64.2%) |
| Finance & Insurance | 0 (0.0%) | 115 (100.0%) |
| Real Estate, Rental & Leasing | 0 (0.0%) | 5 (100.0%) |
| Professional & Scientific | 0 (0.0%) | 100 (100.0%) |
| Enterprise Management | 0 (0.0%) | 0 (0.0%) |
| Administrative & Support | 93 (57.1%) | 70 (42.9%) |
| Educational Services | 63 (54.8%) | 52 (45.2%) |
| Health Care & Social Assistance | 71 (29.2%) | 172 (70.8%) |
| Arts, Entertainment & Recreation | 36 (59.0%) | 25 (41.0%) |
| Accommodation & Food Services | 175 (70.0%) | 75 (30.0%) |
| Public Administration | 30 (43.5%) | 39 (56.5%) |
| Total | 1,306 (53.4%) | 1,140 (46.6%) |
Education in Crystal Lake
School Enrollment in Crystal Lake
The most common levels of schooling among the 1,893 students in Crystal Lake are middle school (463 | 24.5%), elementary school (447 | 23.6%), and high school (408 | 21.5%).
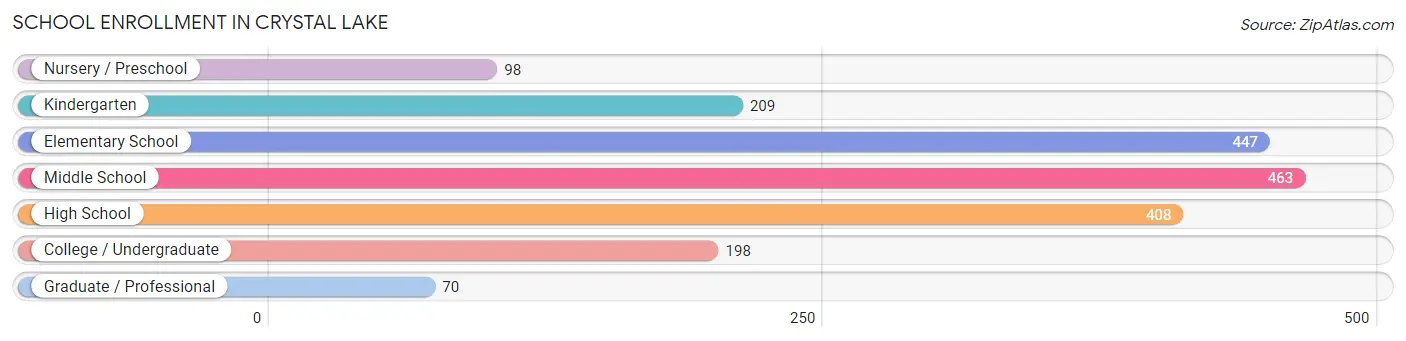
| School Level | # Students | % Students |
| Nursery / Preschool | 98 | 5.2% |
| Kindergarten | 209 | 11.0% |
| Elementary School | 447 | 23.6% |
| Middle School | 463 | 24.5% |
| High School | 408 | 21.5% |
| College / Undergraduate | 198 | 10.5% |
| Graduate / Professional | 70 | 3.7% |
| Total | 1,893 | 100.0% |
School Enrollment by Age by Funding Source in Crystal Lake
Out of a total of 1,893 students who are enrolled in schools in Crystal Lake, 240 (12.7%) attend a private institution, while the remaining 1,653 (87.3%) are enrolled in public schools. The age group of 20 to 24 year olds has the highest likelihood of being enrolled in private schools, with 52 (100.0% in the age bracket) enrolled. Conversely, the age group of 5 to 9 year old has the lowest likelihood of being enrolled in a private school, with 599 (100.0% in the age bracket) attending a public institution.
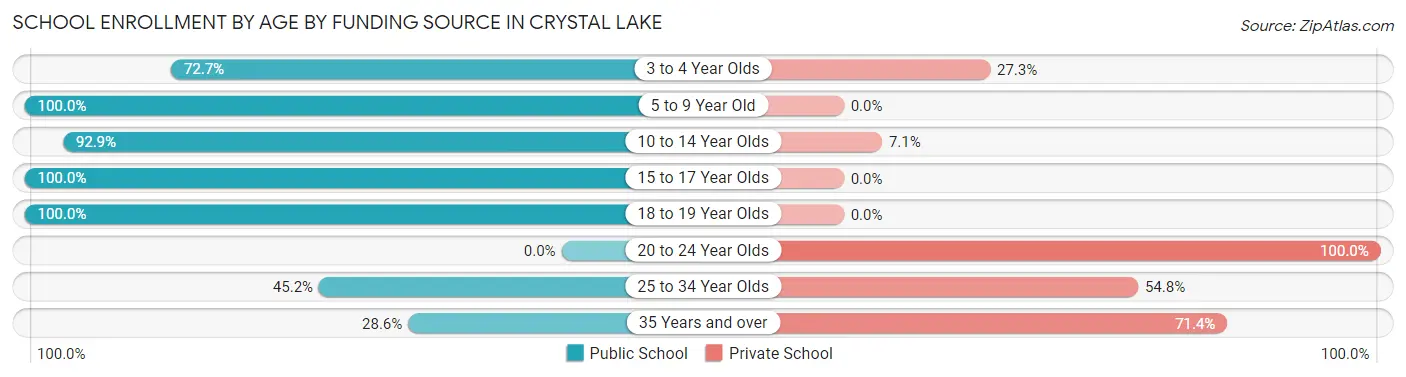
| Age Bracket | Public School | Private School |
| 3 to 4 Year Olds | 96 (72.7%) | 36 (27.3%) |
| 5 to 9 Year Old | 599 (100.0%) | 0 (0.0%) |
| 10 to 14 Year Olds | 417 (92.9%) | 32 (7.1%) |
| 15 to 17 Year Olds | 321 (100.0%) | 0 (0.0%) |
| 18 to 19 Year Olds | 132 (100.0%) | 0 (0.0%) |
| 20 to 24 Year Olds | 0 (0.0%) | 52 (100.0%) |
| 25 to 34 Year Olds | 75 (45.2%) | 91 (54.8%) |
| 35 Years and over | 12 (28.6%) | 30 (71.4%) |
| Total | 1,653 (87.3%) | 240 (12.7%) |
Educational Attainment by Field of Study in Crystal Lake
Psychology (92 | 19.9%), education (80 | 17.3%), science & technology (58 | 12.6%), social sciences (48 | 10.4%), and multidisciplinary studies (48 | 10.4%) are the most common fields of study among 462 individuals in Crystal Lake who have obtained a bachelor's degree or higher.

| Field of Study | # Graduates | % Graduates |
| Computers & Mathematics | 0 | 0.0% |
| Bio, Nature & Agricultural | 27 | 5.8% |
| Physical & Health Sciences | 8 | 1.7% |
| Psychology | 92 | 19.9% |
| Social Sciences | 48 | 10.4% |
| Engineering | 25 | 5.4% |
| Multidisciplinary Studies | 48 | 10.4% |
| Science & Technology | 58 | 12.6% |
| Business | 41 | 8.9% |
| Education | 80 | 17.3% |
| Literature & Languages | 21 | 4.5% |
| Liberal Arts & History | 0 | 0.0% |
| Visual & Performing Arts | 0 | 0.0% |
| Communications | 0 | 0.0% |
| Arts & Humanities | 14 | 3.0% |
| Total | 462 | 100.0% |
Transportation & Commute in Crystal Lake
Vehicle Availability by Sex in Crystal Lake
The most prevalent vehicle ownership categories in Crystal Lake are males with 2 vehicles (639, accounting for 48.9%) and females with 2 vehicles (452, making up 56.7%).
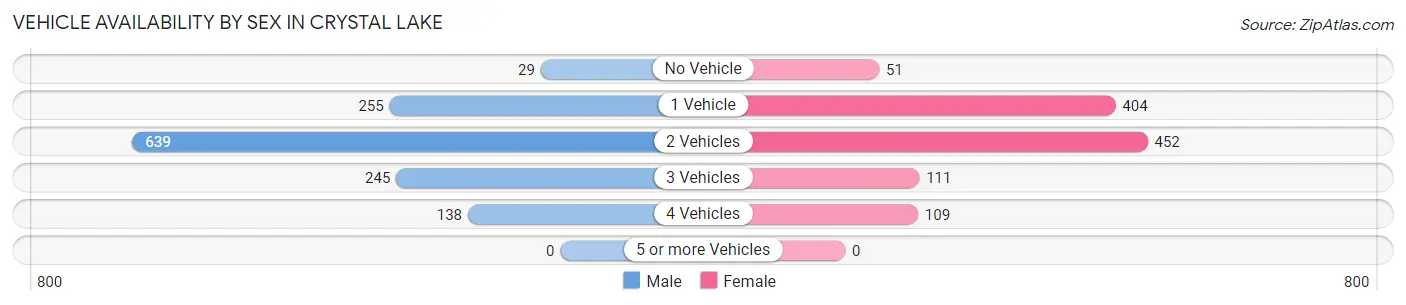
| Vehicles Available | Male | Female |
| No Vehicle | 29 (2.2%) | 51 (4.5%) |
| 1 Vehicle | 255 (19.5%) | 404 (35.8%) |
| 2 Vehicles | 639 (48.9%) | 452 (40.1%) |
| 3 Vehicles | 245 (18.8%) | 111 (9.9%) |
| 4 Vehicles | 138 (10.6%) | 109 (9.7%) |
| 5 or more Vehicles | 0 (0.0%) | 0 (0.0%) |
| Total | 1,306 (100.0%) | 1,127 (100.0%) |
Commute Time in Crystal Lake
The most frequently occuring commute durations in Crystal Lake are 20 to 24 minutes (496 commuters, 21.5%), 15 to 19 minutes (395 commuters, 17.1%), and 30 to 34 minutes (388 commuters, 16.8%).

| Commute Time | # Commuters | % Commuters |
| Less than 5 Minutes | 54 | 2.3% |
| 5 to 9 Minutes | 44 | 1.9% |
| 10 to 14 Minutes | 262 | 11.4% |
| 15 to 19 Minutes | 395 | 17.1% |
| 20 to 24 Minutes | 496 | 21.5% |
| 25 to 29 Minutes | 152 | 6.6% |
| 30 to 34 Minutes | 388 | 16.8% |
| 35 to 39 Minutes | 0 | 0.0% |
| 40 to 44 Minutes | 23 | 1.0% |
| 45 to 59 Minutes | 151 | 6.6% |
| 60 to 89 Minutes | 182 | 7.9% |
| 90 or more Minutes | 157 | 6.8% |
Commute Time by Sex in Crystal Lake
The most common commute times in Crystal Lake are 15 to 19 minutes (202 commuters, 16.4%) for males and 20 to 24 minutes (319 commuters, 29.7%) for females.
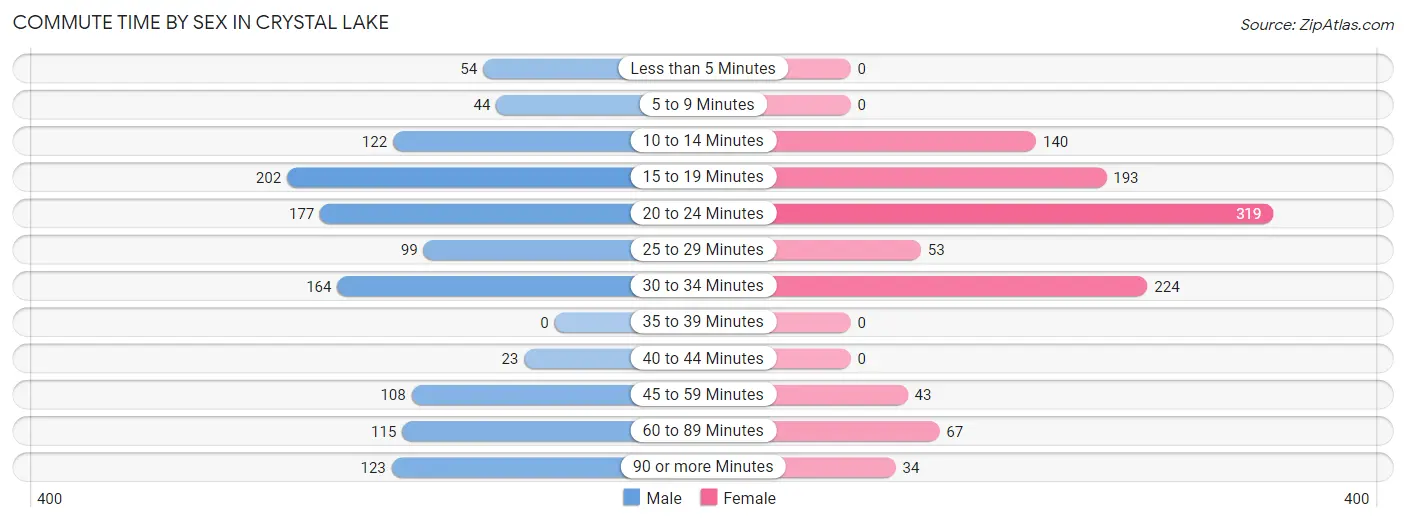
| Commute Time | Male | Female |
| Less than 5 Minutes | 54 (4.4%) | 0 (0.0%) |
| 5 to 9 Minutes | 44 (3.6%) | 0 (0.0%) |
| 10 to 14 Minutes | 122 (9.9%) | 140 (13.1%) |
| 15 to 19 Minutes | 202 (16.4%) | 193 (18.0%) |
| 20 to 24 Minutes | 177 (14.4%) | 319 (29.7%) |
| 25 to 29 Minutes | 99 (8.0%) | 53 (4.9%) |
| 30 to 34 Minutes | 164 (13.3%) | 224 (20.9%) |
| 35 to 39 Minutes | 0 (0.0%) | 0 (0.0%) |
| 40 to 44 Minutes | 23 (1.9%) | 0 (0.0%) |
| 45 to 59 Minutes | 108 (8.8%) | 43 (4.0%) |
| 60 to 89 Minutes | 115 (9.3%) | 67 (6.2%) |
| 90 or more Minutes | 123 (10.0%) | 34 (3.2%) |
Time of Departure to Work by Sex in Crystal Lake
The most frequent times of departure to work in Crystal Lake are 7:00 AM to 7:29 AM (341, 27.7%) for males and 12:00 PM to 3:59 PM (254, 23.7%) for females.
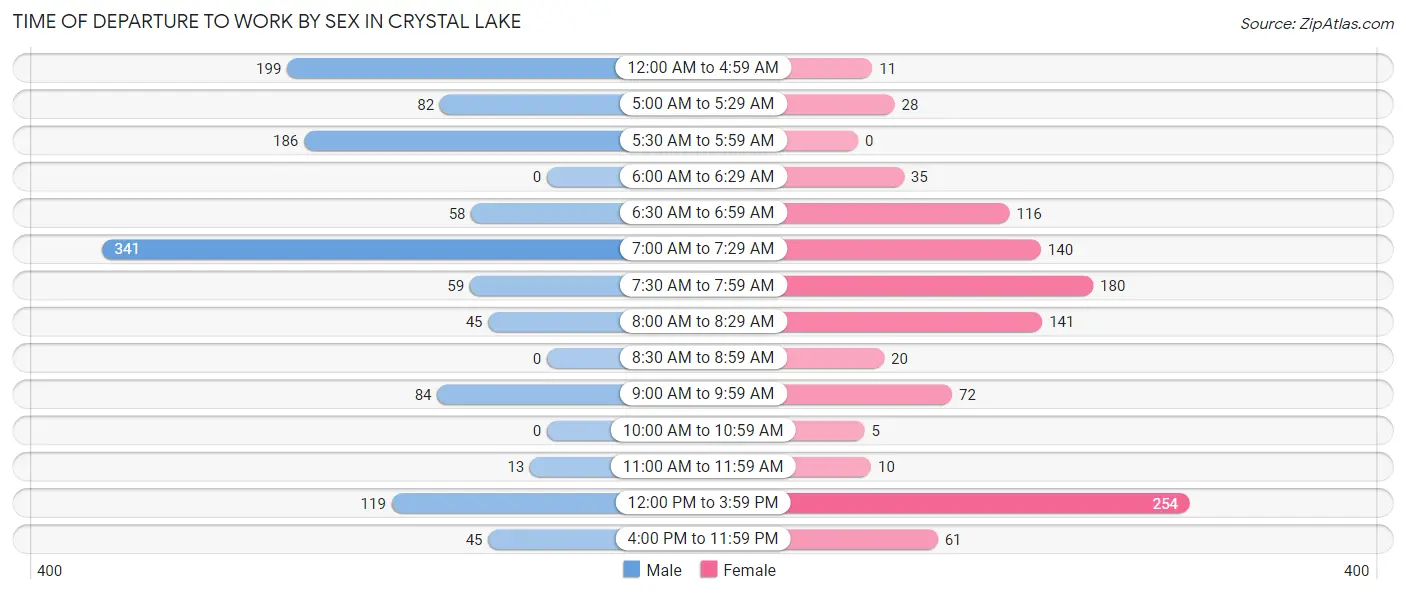
| Time of Departure | Male | Female |
| 12:00 AM to 4:59 AM | 199 (16.2%) | 11 (1.0%) |
| 5:00 AM to 5:29 AM | 82 (6.7%) | 28 (2.6%) |
| 5:30 AM to 5:59 AM | 186 (15.1%) | 0 (0.0%) |
| 6:00 AM to 6:29 AM | 0 (0.0%) | 35 (3.3%) |
| 6:30 AM to 6:59 AM | 58 (4.7%) | 116 (10.8%) |
| 7:00 AM to 7:29 AM | 341 (27.7%) | 140 (13.1%) |
| 7:30 AM to 7:59 AM | 59 (4.8%) | 180 (16.8%) |
| 8:00 AM to 8:29 AM | 45 (3.7%) | 141 (13.1%) |
| 8:30 AM to 8:59 AM | 0 (0.0%) | 20 (1.9%) |
| 9:00 AM to 9:59 AM | 84 (6.8%) | 72 (6.7%) |
| 10:00 AM to 10:59 AM | 0 (0.0%) | 5 (0.5%) |
| 11:00 AM to 11:59 AM | 13 (1.1%) | 10 (0.9%) |
| 12:00 PM to 3:59 PM | 119 (9.7%) | 254 (23.7%) |
| 4:00 PM to 11:59 PM | 45 (3.7%) | 61 (5.7%) |
| Total | 1,231 (100.0%) | 1,073 (100.0%) |
Housing Occupancy in Crystal Lake
Occupancy by Ownership in Crystal Lake
Of the total 2,025 dwellings in Crystal Lake, owner-occupied units account for 909 (44.9%), while renter-occupied units make up 1,116 (55.1%).
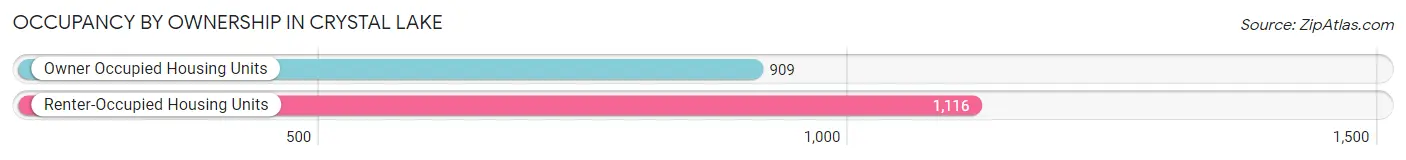
| Occupancy | # Housing Units | % Housing Units |
| Owner Occupied Housing Units | 909 | 44.9% |
| Renter-Occupied Housing Units | 1,116 | 55.1% |
| Total Occupied Housing Units | 2,025 | 100.0% |
Occupancy by Household Size in Crystal Lake
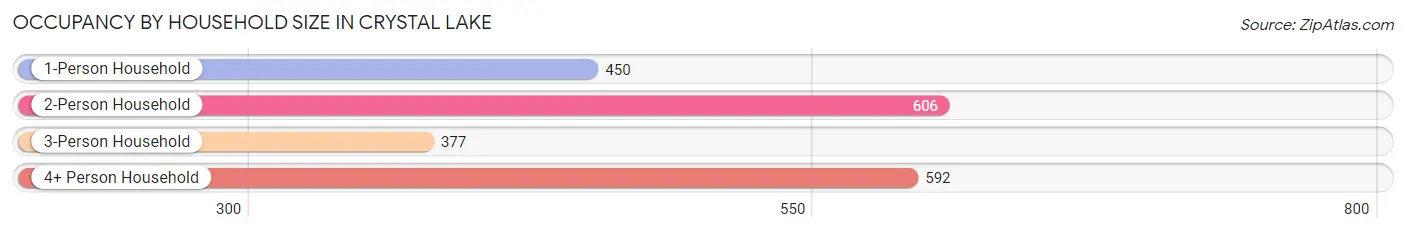
| Household Size | # Housing Units | % Housing Units |
| 1-Person Household | 450 | 22.2% |
| 2-Person Household | 606 | 29.9% |
| 3-Person Household | 377 | 18.6% |
| 4+ Person Household | 592 | 29.2% |
| Total Housing Units | 2,025 | 100.0% |
Occupancy by Ownership by Household Size in Crystal Lake
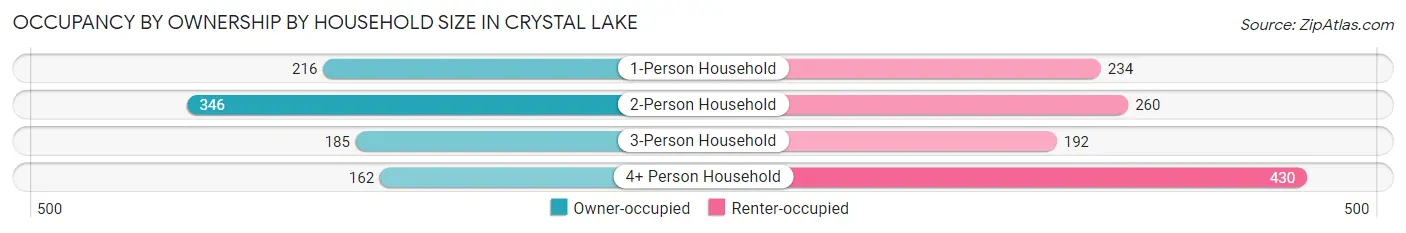
| Household Size | Owner-occupied | Renter-occupied |
| 1-Person Household | 216 (48.0%) | 234 (52.0%) |
| 2-Person Household | 346 (57.1%) | 260 (42.9%) |
| 3-Person Household | 185 (49.1%) | 192 (50.9%) |
| 4+ Person Household | 162 (27.4%) | 430 (72.6%) |
| Total Housing Units | 909 (44.9%) | 1,116 (55.1%) |
Occupancy by Educational Attainment in Crystal Lake
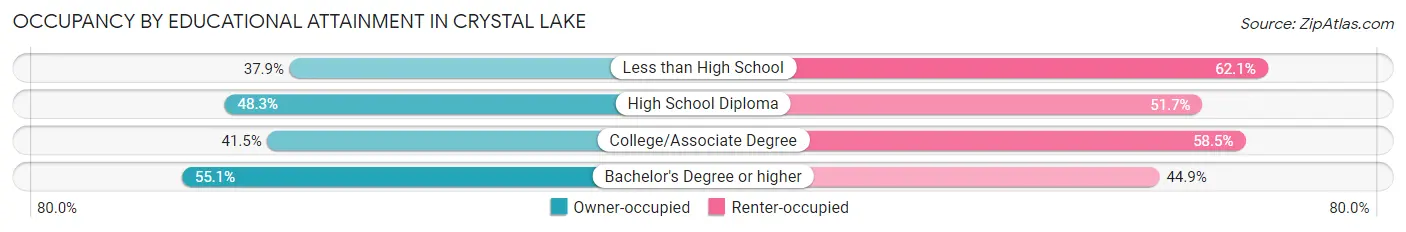
| Household Size | Owner-occupied | Renter-occupied |
| Less than High School | 192 (37.9%) | 314 (62.1%) |
| High School Diploma | 361 (48.3%) | 387 (51.7%) |
| College/Associate Degree | 209 (41.5%) | 295 (58.5%) |
| Bachelor's Degree or higher | 147 (55.1%) | 120 (44.9%) |
Occupancy by Age of Householder in Crystal Lake
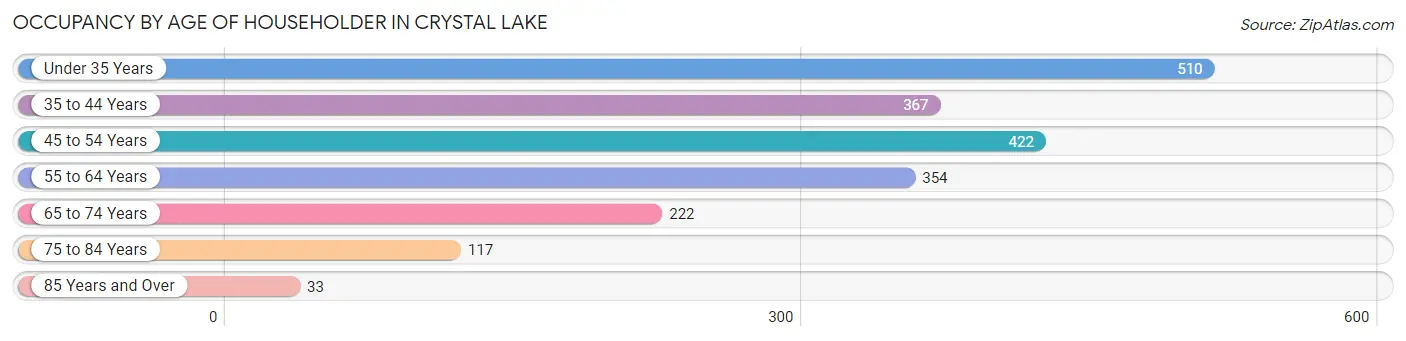
| Age Bracket | # Households | % Households |
| Under 35 Years | 510 | 25.2% |
| 35 to 44 Years | 367 | 18.1% |
| 45 to 54 Years | 422 | 20.8% |
| 55 to 64 Years | 354 | 17.5% |
| 65 to 74 Years | 222 | 11.0% |
| 75 to 84 Years | 117 | 5.8% |
| 85 Years and Over | 33 | 1.6% |
| Total | 2,025 | 100.0% |
Housing Finances in Crystal Lake
Median Income by Occupancy in Crystal Lake
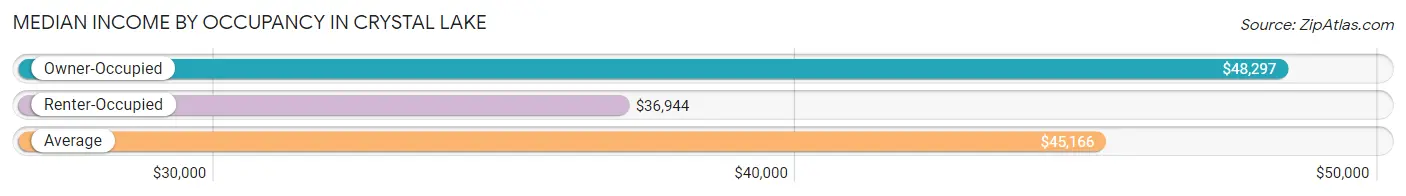
| Occupancy Type | # Households | Median Income |
| Owner-Occupied | 909 (44.9%) | $48,297 |
| Renter-Occupied | 1,116 (55.1%) | $36,944 |
| Average | 2,025 (100.0%) | $45,166 |
Occupancy by Householder Income Bracket in Crystal Lake
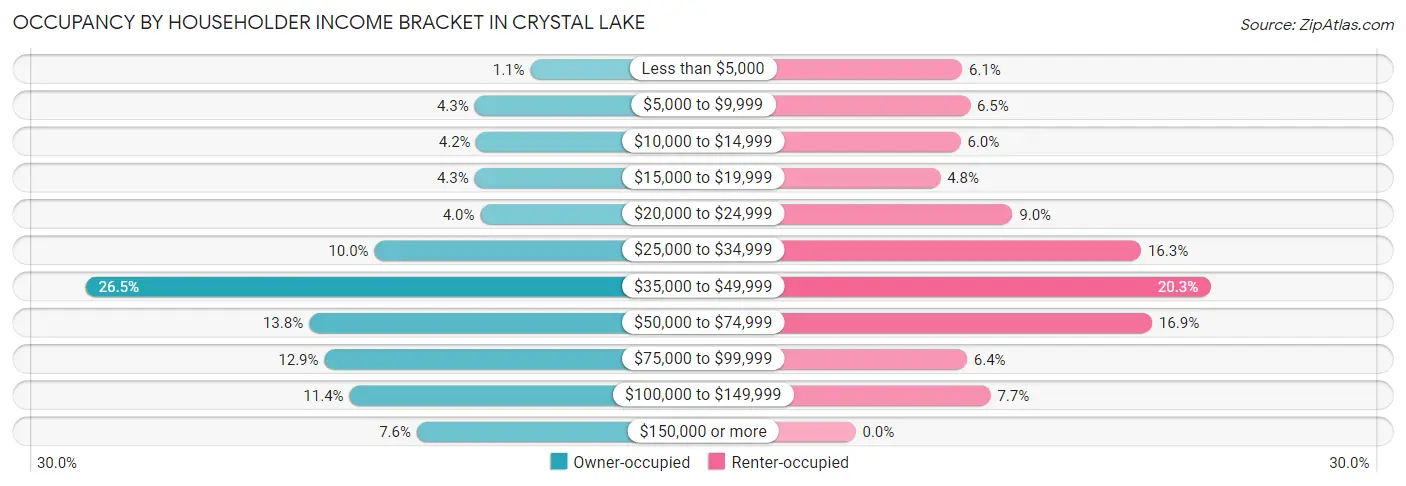
| Income Bracket | Owner-occupied | Renter-occupied |
| Less than $5,000 | 10 (1.1%) | 68 (6.1%) |
| $5,000 to $9,999 | 39 (4.3%) | 73 (6.5%) |
| $10,000 to $14,999 | 38 (4.2%) | 67 (6.0%) |
| $15,000 to $19,999 | 39 (4.3%) | 54 (4.8%) |
| $20,000 to $24,999 | 36 (4.0%) | 100 (9.0%) |
| $25,000 to $34,999 | 91 (10.0%) | 182 (16.3%) |
| $35,000 to $49,999 | 241 (26.5%) | 226 (20.3%) |
| $50,000 to $74,999 | 125 (13.8%) | 189 (16.9%) |
| $75,000 to $99,999 | 117 (12.9%) | 71 (6.4%) |
| $100,000 to $149,999 | 104 (11.4%) | 86 (7.7%) |
| $150,000 or more | 69 (7.6%) | 0 (0.0%) |
| Total | 909 (100.0%) | 1,116 (100.0%) |
Monthly Housing Cost Tiers in Crystal Lake
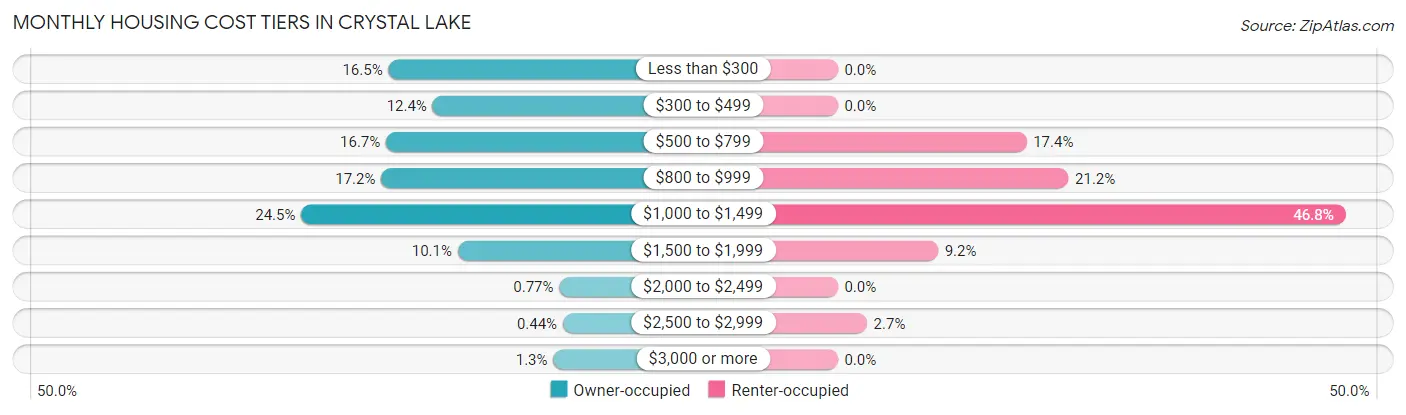
| Monthly Cost | Owner-occupied | Renter-occupied |
| Less than $300 | 150 (16.5%) | 0 (0.0%) |
| $300 to $499 | 113 (12.4%) | 0 (0.0%) |
| $500 to $799 | 152 (16.7%) | 194 (17.4%) |
| $800 to $999 | 156 (17.2%) | 237 (21.2%) |
| $1,000 to $1,499 | 223 (24.5%) | 522 (46.8%) |
| $1,500 to $1,999 | 92 (10.1%) | 103 (9.2%) |
| $2,000 to $2,499 | 7 (0.8%) | 0 (0.0%) |
| $2,500 to $2,999 | 4 (0.4%) | 30 (2.7%) |
| $3,000 or more | 12 (1.3%) | 0 (0.0%) |
| Total | 909 (100.0%) | 1,116 (100.0%) |
Physical Housing Characteristics in Crystal Lake
Housing Structures in Crystal Lake
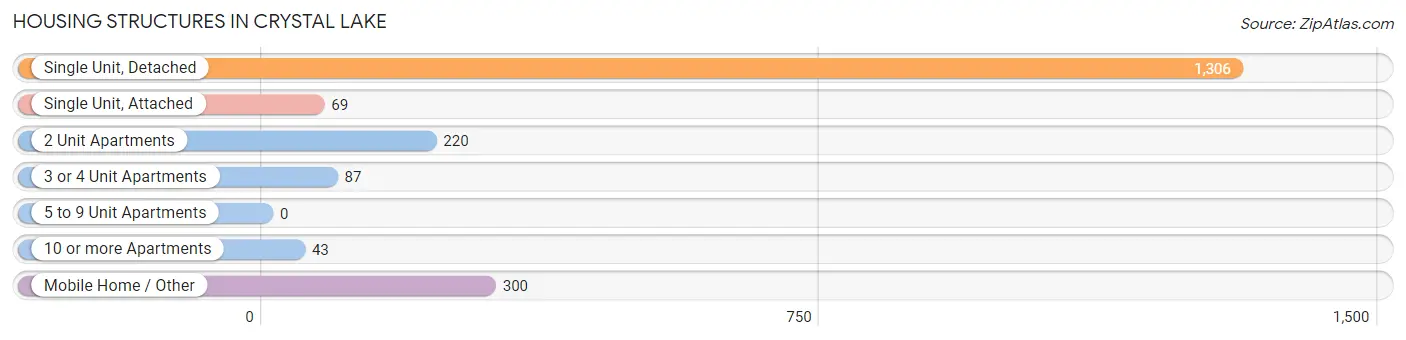
| Structure Type | # Housing Units | % Housing Units |
| Single Unit, Detached | 1,306 | 64.5% |
| Single Unit, Attached | 69 | 3.4% |
| 2 Unit Apartments | 220 | 10.9% |
| 3 or 4 Unit Apartments | 87 | 4.3% |
| 5 to 9 Unit Apartments | 0 | 0.0% |
| 10 or more Apartments | 43 | 2.1% |
| Mobile Home / Other | 300 | 14.8% |
| Total | 2,025 | 100.0% |
Housing Structures by Occupancy in Crystal Lake
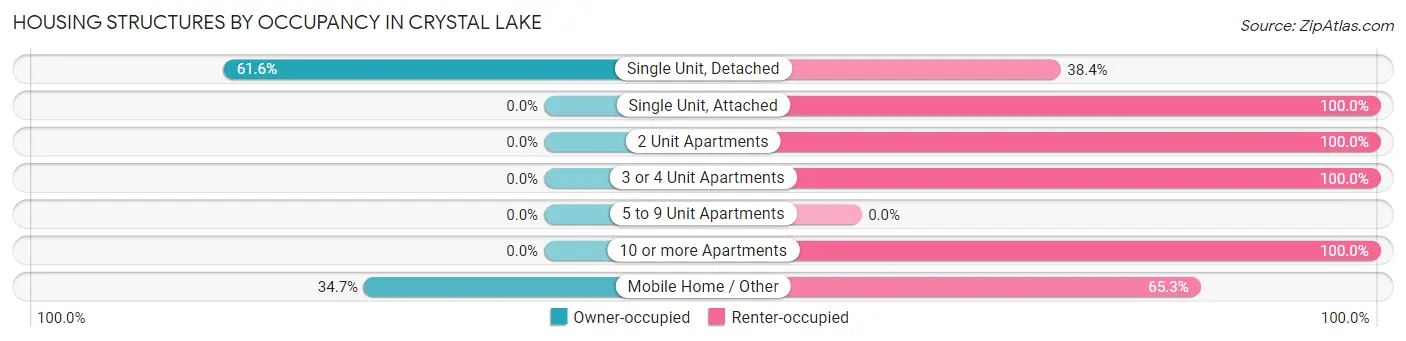
| Structure Type | Owner-occupied | Renter-occupied |
| Single Unit, Detached | 805 (61.6%) | 501 (38.4%) |
| Single Unit, Attached | 0 (0.0%) | 69 (100.0%) |
| 2 Unit Apartments | 0 (0.0%) | 220 (100.0%) |
| 3 or 4 Unit Apartments | 0 (0.0%) | 87 (100.0%) |
| 5 to 9 Unit Apartments | 0 (0.0%) | 0 (0.0%) |
| 10 or more Apartments | 0 (0.0%) | 43 (100.0%) |
| Mobile Home / Other | 104 (34.7%) | 196 (65.3%) |
| Total | 909 (44.9%) | 1,116 (55.1%) |
Housing Structures by Number of Rooms in Crystal Lake
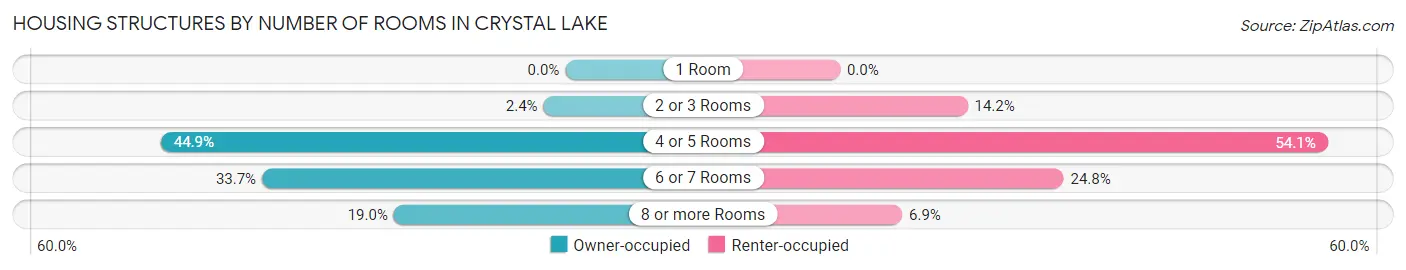
| Number of Rooms | Owner-occupied | Renter-occupied |
| 1 Room | 0 (0.0%) | 0 (0.0%) |
| 2 or 3 Rooms | 22 (2.4%) | 158 (14.2%) |
| 4 or 5 Rooms | 408 (44.9%) | 604 (54.1%) |
| 6 or 7 Rooms | 306 (33.7%) | 277 (24.8%) |
| 8 or more Rooms | 173 (19.0%) | 77 (6.9%) |
| Total | 909 (100.0%) | 1,116 (100.0%) |
Housing Structure by Heating Type in Crystal Lake
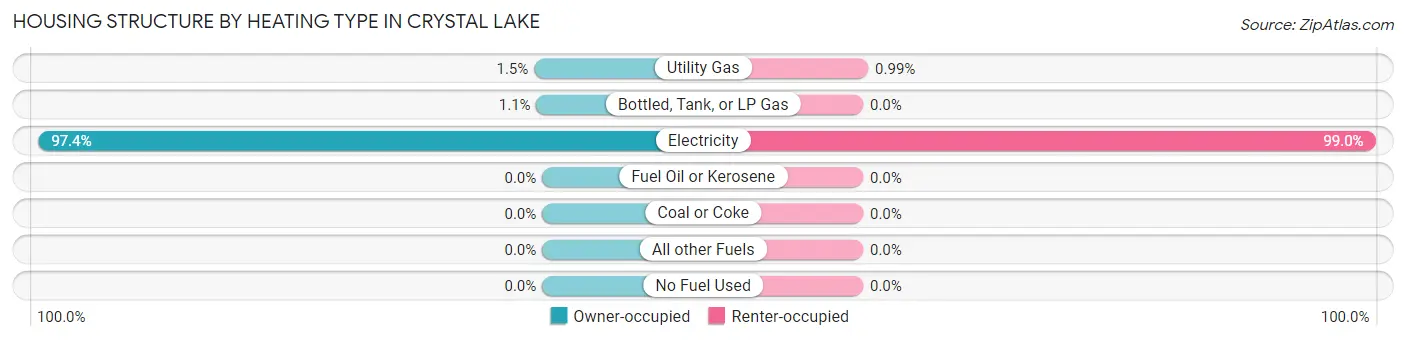
| Heating Type | Owner-occupied | Renter-occupied |
| Utility Gas | 14 (1.5%) | 11 (1.0%) |
| Bottled, Tank, or LP Gas | 10 (1.1%) | 0 (0.0%) |
| Electricity | 885 (97.4%) | 1,105 (99.0%) |
| Fuel Oil or Kerosene | 0 (0.0%) | 0 (0.0%) |
| Coal or Coke | 0 (0.0%) | 0 (0.0%) |
| All other Fuels | 0 (0.0%) | 0 (0.0%) |
| No Fuel Used | 0 (0.0%) | 0 (0.0%) |
| Total | 909 (100.0%) | 1,116 (100.0%) |
Household Vehicle Usage in Crystal Lake
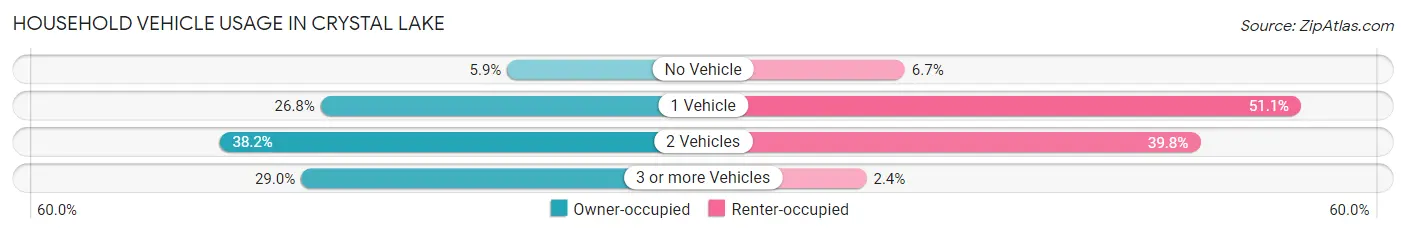
| Vehicles per Household | Owner-occupied | Renter-occupied |
| No Vehicle | 54 (5.9%) | 75 (6.7%) |
| 1 Vehicle | 244 (26.8%) | 570 (51.1%) |
| 2 Vehicles | 347 (38.2%) | 444 (39.8%) |
| 3 or more Vehicles | 264 (29.0%) | 27 (2.4%) |
| Total | 909 (100.0%) | 1,116 (100.0%) |
Real Estate & Mortgages in Crystal Lake
Real Estate and Mortgage Overview in Crystal Lake
| Characteristic | Without Mortgage | With Mortgage |
| Housing Units | 347 | 562 |
| Median Property Value | $109,700 | $162,900 |
| Median Household Income | $34,402 | $56 |
| Monthly Housing Costs | $371 | $12 |
| Real Estate Taxes | $745 | $15 |
Property Value by Mortgage Status in Crystal Lake
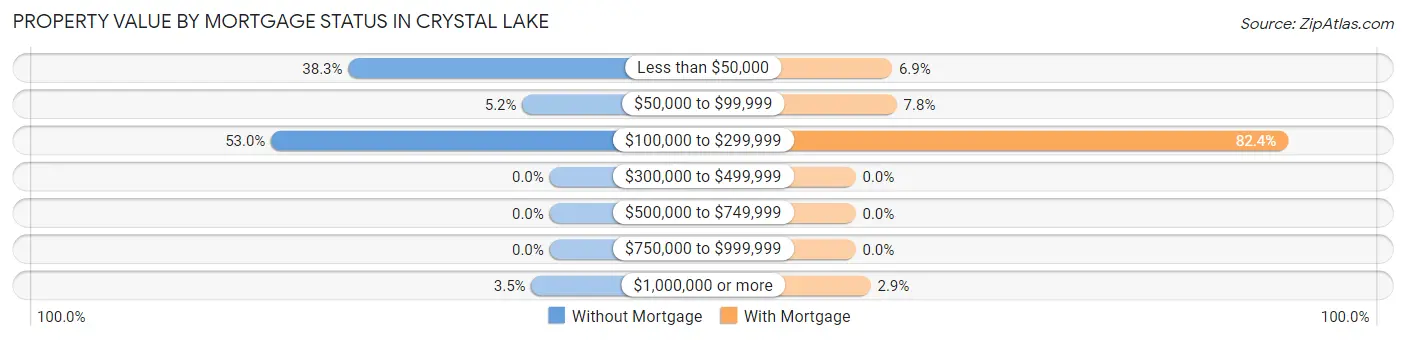
| Property Value | Without Mortgage | With Mortgage |
| Less than $50,000 | 133 (38.3%) | 39 (6.9%) |
| $50,000 to $99,999 | 18 (5.2%) | 44 (7.8%) |
| $100,000 to $299,999 | 184 (53.0%) | 463 (82.4%) |
| $300,000 to $499,999 | 0 (0.0%) | 0 (0.0%) |
| $500,000 to $749,999 | 0 (0.0%) | 0 (0.0%) |
| $750,000 to $999,999 | 0 (0.0%) | 0 (0.0%) |
| $1,000,000 or more | 12 (3.5%) | 16 (2.9%) |
| Total | 347 (100.0%) | 562 (100.0%) |
Household Income by Mortgage Status in Crystal Lake
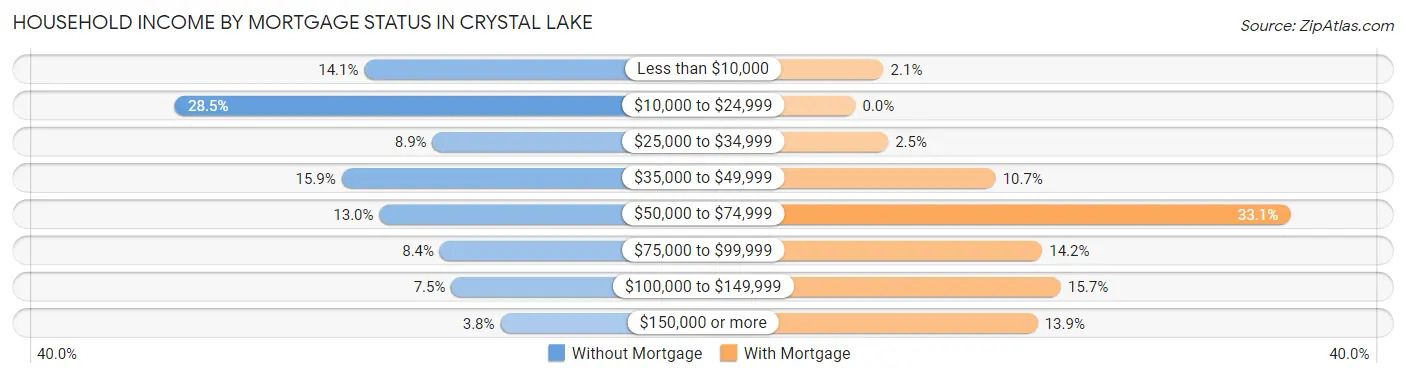
| Household Income | Without Mortgage | With Mortgage |
| Less than $10,000 | 49 (14.1%) | 12 (2.1%) |
| $10,000 to $24,999 | 99 (28.5%) | 0 (0.0%) |
| $25,000 to $34,999 | 31 (8.9%) | 14 (2.5%) |
| $35,000 to $49,999 | 55 (15.9%) | 60 (10.7%) |
| $50,000 to $74,999 | 45 (13.0%) | 186 (33.1%) |
| $75,000 to $99,999 | 29 (8.4%) | 80 (14.2%) |
| $100,000 to $149,999 | 26 (7.5%) | 88 (15.7%) |
| $150,000 or more | 13 (3.7%) | 78 (13.9%) |
| Total | 347 (100.0%) | 562 (100.0%) |
Property Value to Household Income Ratio in Crystal Lake
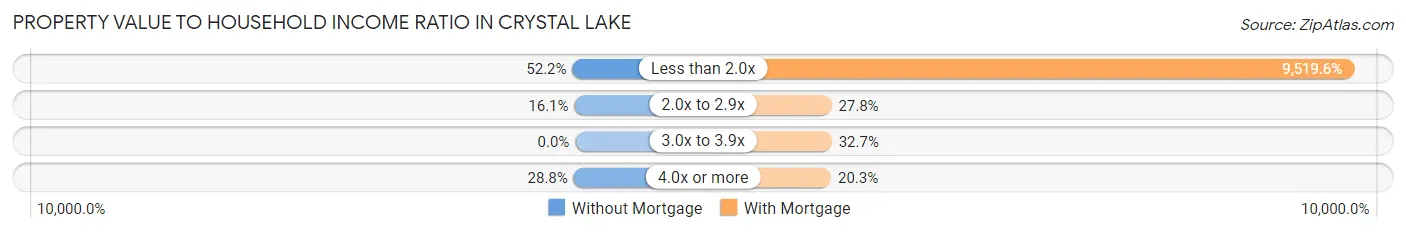
| Value-to-Income Ratio | Without Mortgage | With Mortgage |
| Less than 2.0x | 181 (52.2%) | 53,500 (9,519.6%) |
| 2.0x to 2.9x | 56 (16.1%) | 156 (27.8%) |
| 3.0x to 3.9x | 0 (0.0%) | 184 (32.7%) |
| 4.0x or more | 100 (28.8%) | 114 (20.3%) |
| Total | 347 (100.0%) | 562 (100.0%) |
Real Estate Taxes by Mortgage Status in Crystal Lake
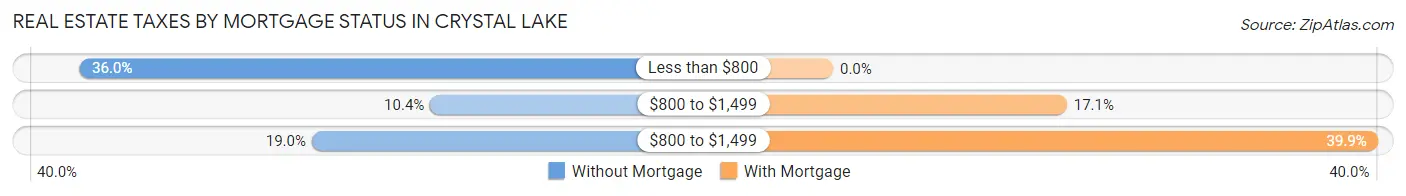
| Property Taxes | Without Mortgage | With Mortgage |
| Less than $800 | 125 (36.0%) | 0 (0.0%) |
| $800 to $1,499 | 36 (10.4%) | 96 (17.1%) |
| $800 to $1,499 | 66 (19.0%) | 224 (39.9%) |
| Total | 347 (100.0%) | 562 (100.0%) |
Health & Disability in Crystal Lake
Health Insurance Coverage by Age in Crystal Lake
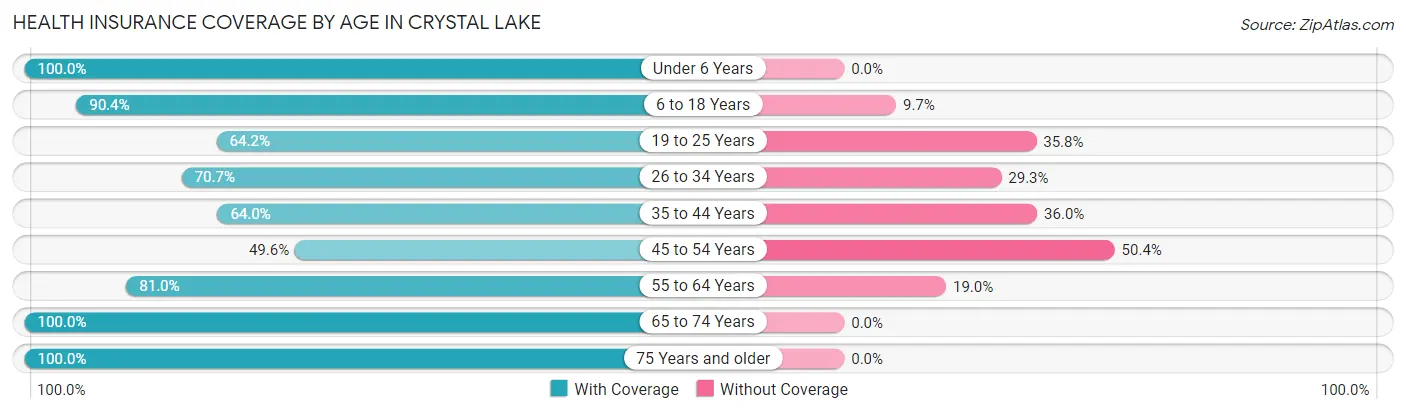
| Age Bracket | With Coverage | Without Coverage |
| Under 6 Years | 711 (100.0%) | 0 (0.0%) |
| 6 to 18 Years | 1,348 (90.3%) | 144 (9.7%) |
| 19 to 25 Years | 319 (64.2%) | 178 (35.8%) |
| 26 to 34 Years | 490 (70.7%) | 203 (29.3%) |
| 35 to 44 Years | 454 (64.0%) | 255 (36.0%) |
| 45 to 54 Years | 351 (49.6%) | 357 (50.4%) |
| 55 to 64 Years | 478 (81.0%) | 112 (19.0%) |
| 65 to 74 Years | 370 (100.0%) | 0 (0.0%) |
| 75 Years and older | 278 (100.0%) | 0 (0.0%) |
| Total | 4,799 (79.3%) | 1,249 (20.6%) |
Health Insurance Coverage by Citizenship Status in Crystal Lake
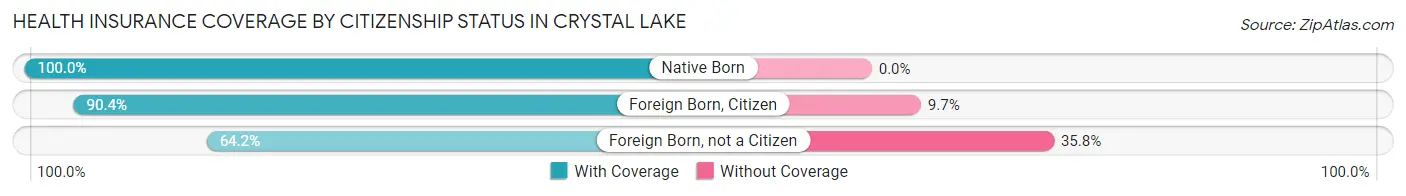
| Citizenship Status | With Coverage | Without Coverage |
| Native Born | 711 (100.0%) | 0 (0.0%) |
| Foreign Born, Citizen | 1,348 (90.3%) | 144 (9.7%) |
| Foreign Born, not a Citizen | 319 (64.2%) | 178 (35.8%) |
Health Insurance Coverage by Household Income in Crystal Lake
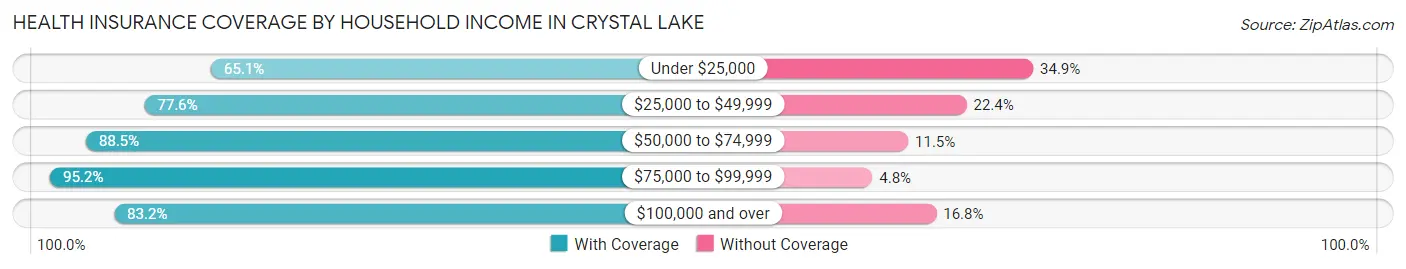
| Household Income | With Coverage | Without Coverage |
| Under $25,000 | 837 (65.1%) | 449 (34.9%) |
| $25,000 to $49,999 | 1,694 (77.6%) | 490 (22.4%) |
| $50,000 to $74,999 | 786 (88.5%) | 102 (11.5%) |
| $75,000 to $99,999 | 598 (95.2%) | 30 (4.8%) |
| $100,000 and over | 884 (83.2%) | 178 (16.8%) |
Public vs Private Health Insurance Coverage by Age in Crystal Lake
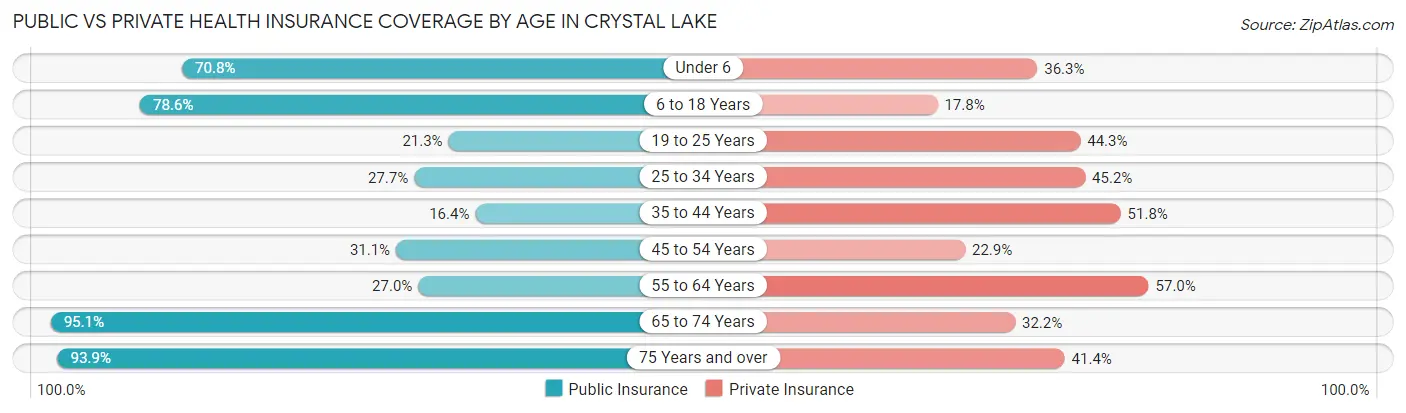
| Age Bracket | Public Insurance | Private Insurance |
| Under 6 | 503 (70.8%) | 258 (36.3%) |
| 6 to 18 Years | 1,172 (78.5%) | 265 (17.8%) |
| 19 to 25 Years | 106 (21.3%) | 220 (44.3%) |
| 25 to 34 Years | 192 (27.7%) | 313 (45.2%) |
| 35 to 44 Years | 116 (16.4%) | 367 (51.8%) |
| 45 to 54 Years | 220 (31.1%) | 162 (22.9%) |
| 55 to 64 Years | 159 (27.0%) | 336 (57.0%) |
| 65 to 74 Years | 352 (95.1%) | 119 (32.2%) |
| 75 Years and over | 261 (93.9%) | 115 (41.4%) |
| Total | 3,081 (50.9%) | 2,155 (35.6%) |
Disability Status by Sex by Age in Crystal Lake
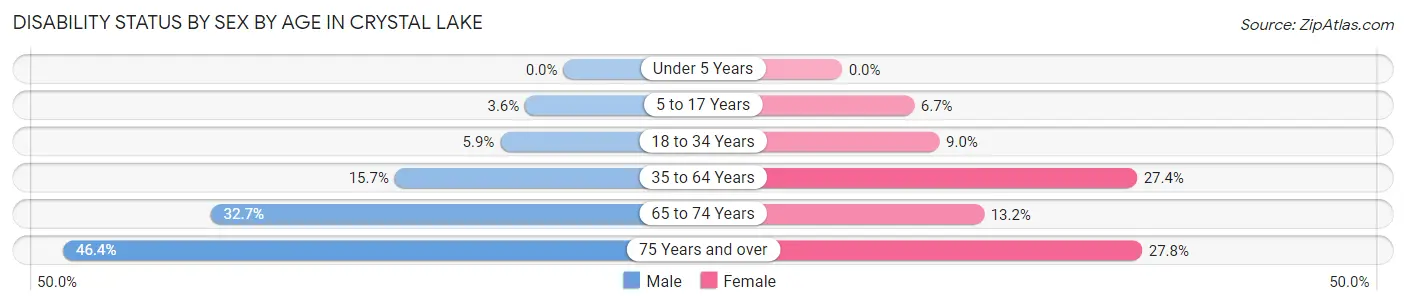
| Age Bracket | Male | Female |
| Under 5 Years | 0 (0.0%) | 0 (0.0%) |
| 5 to 17 Years | 29 (3.5%) | 47 (6.7%) |
| 18 to 34 Years | 37 (5.9%) | 63 (9.0%) |
| 35 to 64 Years | 174 (15.7%) | 245 (27.4%) |
| 65 to 74 Years | 54 (32.7%) | 27 (13.2%) |
| 75 Years and over | 39 (46.4%) | 54 (27.8%) |
Disability Class by Sex by Age in Crystal Lake
Disability Class: Hearing Difficulty
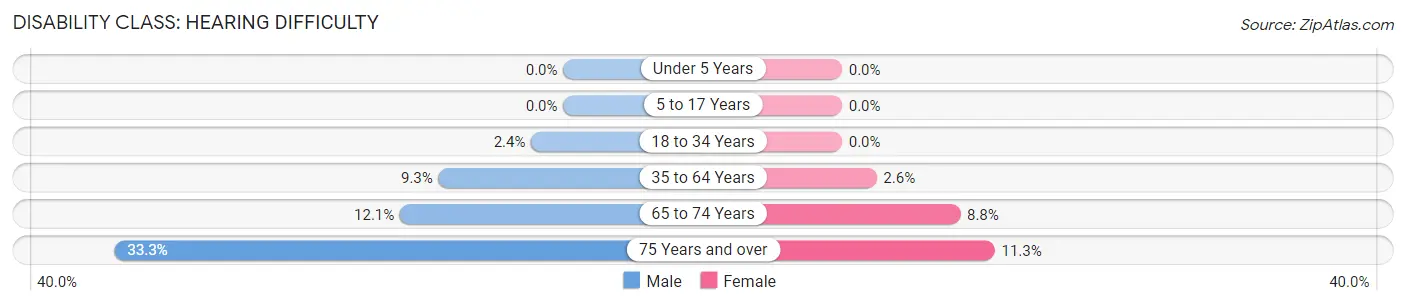
| Age Bracket | Male | Female |
| Under 5 Years | 0 (0.0%) | 0 (0.0%) |
| 5 to 17 Years | 0 (0.0%) | 0 (0.0%) |
| 18 to 34 Years | 15 (2.4%) | 0 (0.0%) |
| 35 to 64 Years | 103 (9.3%) | 23 (2.6%) |
| 65 to 74 Years | 20 (12.1%) | 18 (8.8%) |
| 75 Years and over | 28 (33.3%) | 22 (11.3%) |
Disability Class: Vision Difficulty
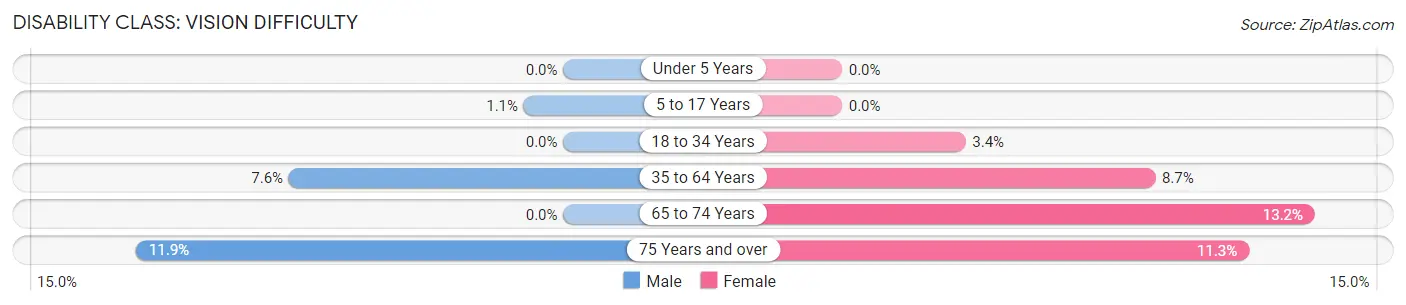
| Age Bracket | Male | Female |
| Under 5 Years | 0 (0.0%) | 0 (0.0%) |
| 5 to 17 Years | 9 (1.1%) | 0 (0.0%) |
| 18 to 34 Years | 0 (0.0%) | 24 (3.4%) |
| 35 to 64 Years | 85 (7.6%) | 78 (8.7%) |
| 65 to 74 Years | 0 (0.0%) | 27 (13.2%) |
| 75 Years and over | 10 (11.9%) | 22 (11.3%) |
Disability Class: Cognitive Difficulty
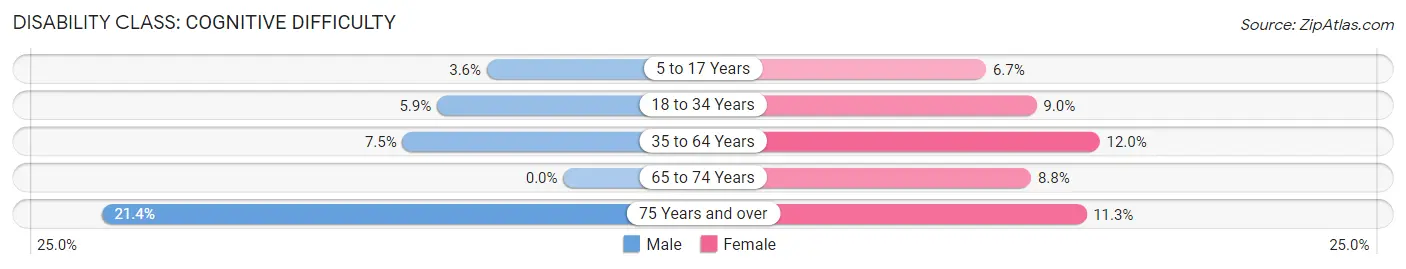
| Age Bracket | Male | Female |
| 5 to 17 Years | 29 (3.5%) | 47 (6.7%) |
| 18 to 34 Years | 37 (5.9%) | 63 (9.0%) |
| 35 to 64 Years | 83 (7.5%) | 107 (12.0%) |
| 65 to 74 Years | 0 (0.0%) | 18 (8.8%) |
| 75 Years and over | 18 (21.4%) | 22 (11.3%) |
Disability Class: Ambulatory Difficulty
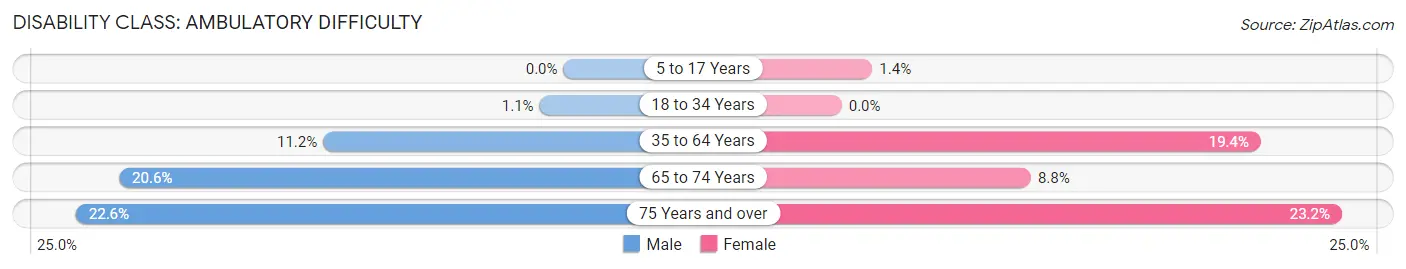
| Age Bracket | Male | Female |
| 5 to 17 Years | 0 (0.0%) | 10 (1.4%) |
| 18 to 34 Years | 7 (1.1%) | 0 (0.0%) |
| 35 to 64 Years | 124 (11.2%) | 174 (19.4%) |
| 65 to 74 Years | 34 (20.6%) | 18 (8.8%) |
| 75 Years and over | 19 (22.6%) | 45 (23.2%) |
Disability Class: Self-Care Difficulty
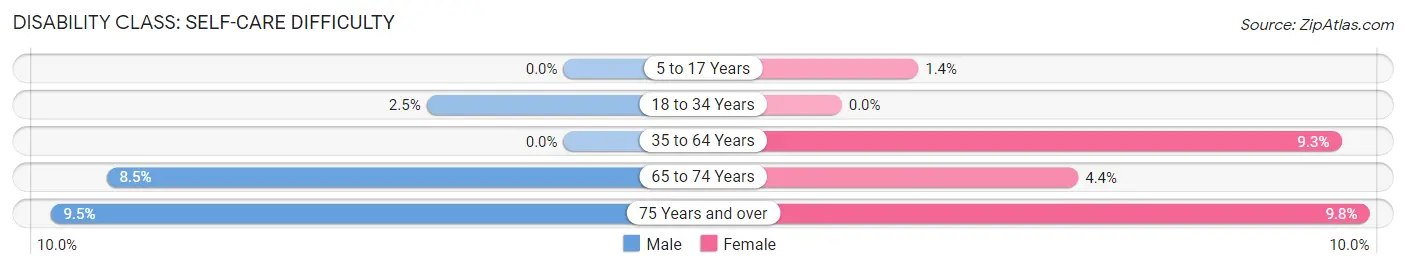
| Age Bracket | Male | Female |
| 5 to 17 Years | 0 (0.0%) | 10 (1.4%) |
| 18 to 34 Years | 16 (2.5%) | 0 (0.0%) |
| 35 to 64 Years | 0 (0.0%) | 83 (9.3%) |
| 65 to 74 Years | 14 (8.5%) | 9 (4.4%) |
| 75 Years and over | 8 (9.5%) | 19 (9.8%) |
Technology Access in Crystal Lake
Computing Device Access in Crystal Lake
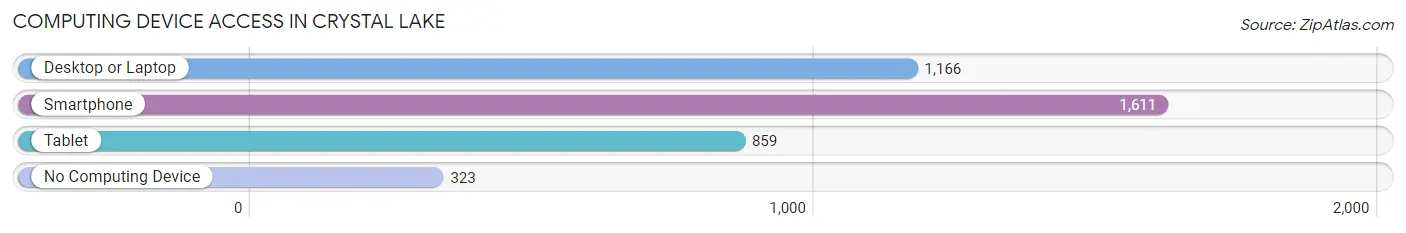
| Device Type | # Households | % Households |
| Desktop or Laptop | 1,166 | 57.6% |
| Smartphone | 1,611 | 79.6% |
| Tablet | 859 | 42.4% |
| No Computing Device | 323 | 16.0% |
| Total | 2,025 | 100.0% |
Internet Access in Crystal Lake
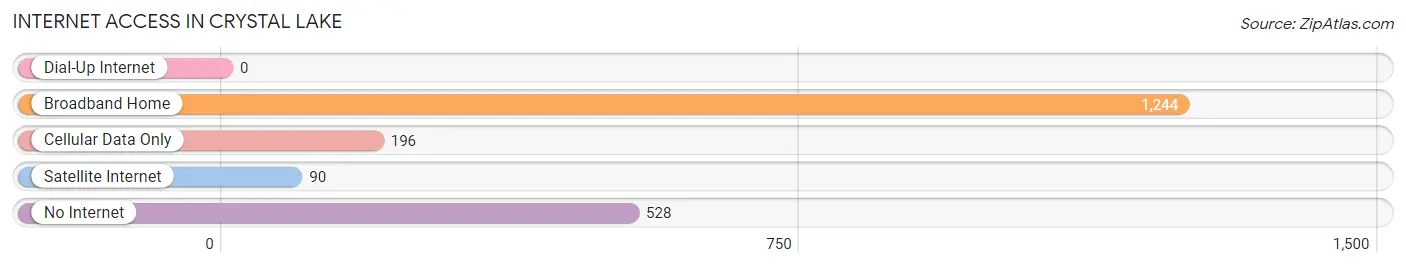
| Internet Type | # Households | % Households |
| Dial-Up Internet | 0 | 0.0% |
| Broadband Home | 1,244 | 61.4% |
| Cellular Data Only | 196 | 9.7% |
| Satellite Internet | 90 | 4.4% |
| No Internet | 528 | 26.1% |
| Total | 2,025 | 100.0% |
Crystal Lake Summary
Introduction
Crystal Lake is a small town located in the state of Florida, United States. It is situated in the northern part of the state, in the county of Citrus. The town is known for its crystal clear lake, which is the main attraction of the area. The town has a population of around 2,000 people and is a popular tourist destination.
History
Crystal Lake was first settled in the late 1800s by a group of settlers from the nearby town of Inverness. The settlers were attracted to the area due to its crystal clear lake, which was a source of fresh water for the settlers. The settlers named the lake after the crystal clear water and the town was named after the lake.
The town was officially incorporated in 1887 and was initially a small farming community. The town grew slowly over the years and by the early 1900s, it had become a popular tourist destination. The town was known for its crystal clear lake and its beautiful scenery.
Geography
Crystal Lake is located in the northern part of the state of Florida, in the county of Citrus. The town is situated on the banks of the Crystal Lake, which is the main attraction of the area. The lake is surrounded by lush green forests and is a popular spot for fishing and swimming. The town is also home to several other lakes, including Lake Rousseau, Lake Tsala Apopka, and Lake Hernando.
The town is located in a humid subtropical climate zone, with hot and humid summers and mild winters. The average temperature in the summer is around 90°F and in the winter it is around 60°F. The town receives an average of 50 inches of rain per year.
Economy
The economy of Crystal Lake is mainly based on tourism. The town is a popular destination for fishing, swimming, and other outdoor activities. The town also has several restaurants, hotels, and other businesses that cater to tourists. The town also has a few small businesses that provide services to the local community.
The town is also home to several citrus farms, which provide jobs to the local population. The town also has a few manufacturing plants that produce products such as furniture and clothing.
Demographics
As of the 2010 census, the population of Crystal Lake was 2,000 people. The town has a population density of around 1,000 people per square mile. The racial makeup of the town is predominantly white, with around 90% of the population being white. The remaining 10% of the population is made up of African Americans, Hispanics, and other races.
The median household income in the town is around $40,000 per year. The median age of the population is around 40 years old. The town has a high rate of homeownership, with around 80% of the population owning their own homes.
Conclusion
Crystal Lake is a small town located in the northern part of the state of Florida. The town is known for its crystal clear lake, which is the main attraction of the area. The town has a population of around 2,000 people and is a popular tourist destination. The economy of the town is mainly based on tourism and the town also has several small businesses that provide services to the local community. The town has a predominantly white population, with around 90% of the population being white. The median household income in the town is around $40,000 per year and the median age of the population is around 40 years old.
Common Questions
What is Per Capita Income in Crystal Lake?
Per Capita income in Crystal Lake is $19,189.
What is the Median Family Income in Crystal Lake?
Median Family Income in Crystal Lake is $45,723.
What is the Median Household income in Crystal Lake?
Median Household Income in Crystal Lake is $45,166.
What is Income or Wage Gap in Crystal Lake?
Income or Wage Gap in Crystal Lake is 28.9%.
Women in Crystal Lake earn 71.1 cents for every dollar earned by a man.
What is Family Income Deficit in Crystal Lake?
Family Income Deficit in Crystal Lake is $14,729.
Families that are below poverty line in Crystal Lake earn $14,729 less on average than the poverty threshold level.
What is Inequality or Gini Index in Crystal Lake?
Inequality or Gini Index in Crystal Lake is 0.41.
What is the Total Population of Crystal Lake?
Total Population of Crystal Lake is 6,048.
What is the Total Male Population of Crystal Lake?
Total Male Population of Crystal Lake is 3,018.
What is the Total Female Population of Crystal Lake?
Total Female Population of Crystal Lake is 3,030.
What is the Ratio of Males per 100 Females in Crystal Lake?
There are 99.60 Males per 100 Females in Crystal Lake.
What is the Ratio of Females per 100 Males in Crystal Lake?
There are 100.40 Females per 100 Males in Crystal Lake.
What is the Median Population Age in Crystal Lake?
Median Population Age in Crystal Lake is 30.6 Years.
What is the Average Family Size in Crystal Lake
Average Family Size in Crystal Lake is 3.4 People.
What is the Average Household Size in Crystal Lake
Average Household Size in Crystal Lake is 3.0 People.
How Large is the Labor Force in Crystal Lake?
There are 2,641 People in the Labor Forcein in Crystal Lake.
What is the Percentage of People in the Labor Force in Crystal Lake?
64.1% of People are in the Labor Force in Crystal Lake.
What is the Unemployment Rate in Crystal Lake?
Unemployment Rate in Crystal Lake is 7.4%.