Crystal Springs, FL Map & Demographics
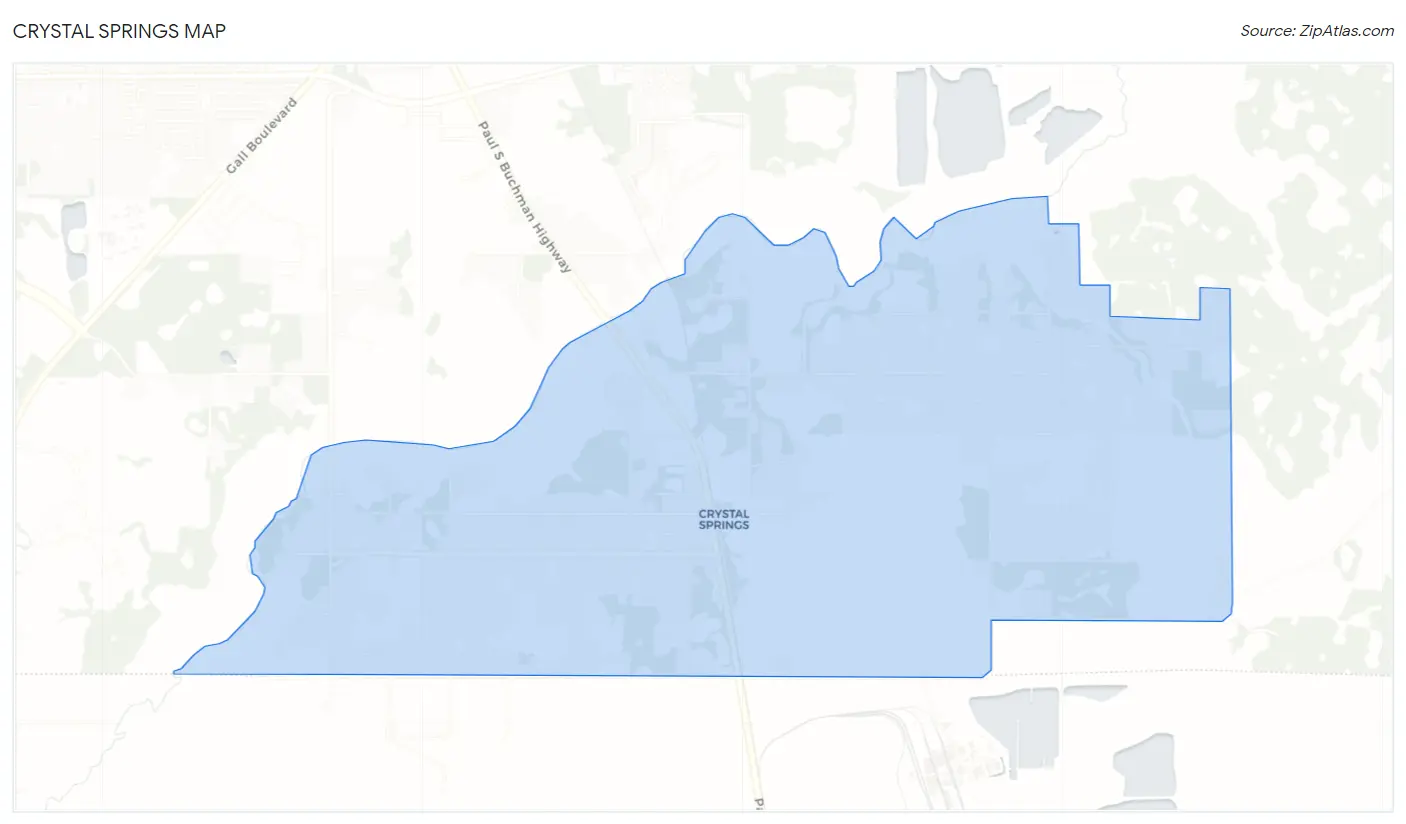
Crystal Springs Map
Crystal Springs Overview
$26,064
PER CAPITA INCOME
$47,411
AVG HOUSEHOLD INCOME
40.7%
WAGE / INCOME GAP [ % ]
59.3¢/ $1
WAGE / INCOME GAP [ $ ]
0.43
INEQUALITY / GINI INDEX
973
TOTAL POPULATION
487
MALE POPULATION
486
FEMALE POPULATION
100.21
MALES / 100 FEMALES
99.79
FEMALES / 100 MALES
53.2
MEDIAN AGE
2.7
AVG FAMILY SIZE
2.2
AVG HOUSEHOLD SIZE
398
LABOR FORCE [ PEOPLE ]
47.5%
PERCENT IN LABOR FORCE
13.8%
UNEMPLOYMENT RATE
Income in Crystal Springs
Income Overview in Crystal Springs
| Characteristic | Number | Measure |
| Per Capita Income | 973 | $26,064 |
| Median Family Income | 251 | $0 |
| Mean Family Income | 251 | $59,335 |
| Median Household Income | 445 | $47,411 |
| Mean Household Income | 445 | $58,921 |
| Income Deficit | 251 | $0 |
| Wage / Income Gap (%) | 973 | 40.67% |
| Wage / Income Gap ($) | 973 | 59.33¢ per $1 |
| Gini / Inequality Index | 973 | 0.43 |
Earnings by Sex in Crystal Springs
Average Earnings in Crystal Springs are $41,429, $55,119 for men and $32,700 for women, a difference of 40.7%.
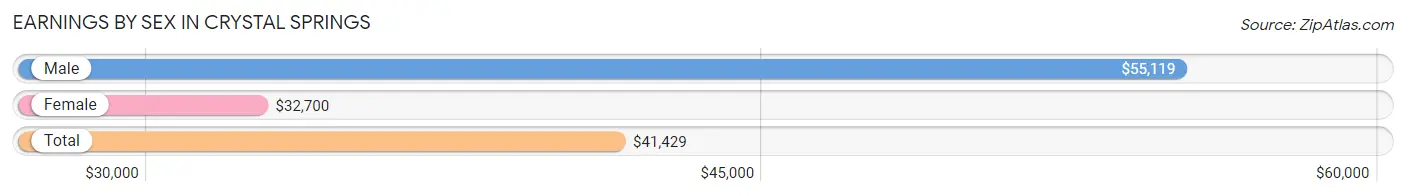
| Sex | Number | Average Earnings |
| Male | 252 (61.8%) | $55,119 |
| Female | 156 (38.2%) | $32,700 |
| Total | 408 (100.0%) | $41,429 |
Earnings by Sex by Income Bracket in Crystal Springs
The most common earnings brackets in Crystal Springs are $55,000 to $64,999 for men (81 | 32.1%) and $2,500 to $4,999 for women (28 | 17.9%).
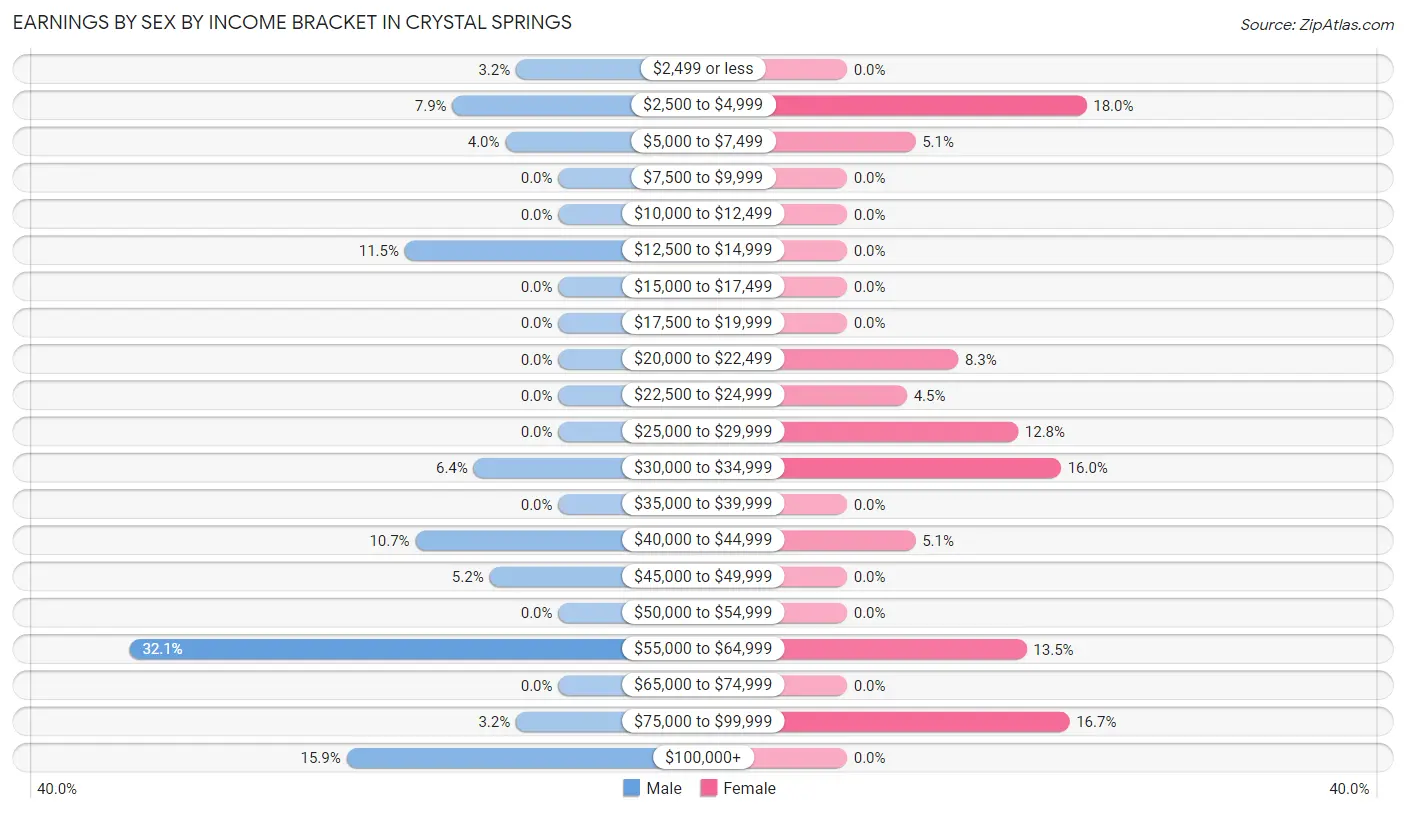
| Income | Male | Female |
| $2,499 or less | 8 (3.2%) | 0 (0.0%) |
| $2,500 to $4,999 | 20 (7.9%) | 28 (17.9%) |
| $5,000 to $7,499 | 10 (4.0%) | 8 (5.1%) |
| $7,500 to $9,999 | 0 (0.0%) | 0 (0.0%) |
| $10,000 to $12,499 | 0 (0.0%) | 0 (0.0%) |
| $12,500 to $14,999 | 29 (11.5%) | 0 (0.0%) |
| $15,000 to $17,499 | 0 (0.0%) | 0 (0.0%) |
| $17,500 to $19,999 | 0 (0.0%) | 0 (0.0%) |
| $20,000 to $22,499 | 0 (0.0%) | 13 (8.3%) |
| $22,500 to $24,999 | 0 (0.0%) | 7 (4.5%) |
| $25,000 to $29,999 | 0 (0.0%) | 20 (12.8%) |
| $30,000 to $34,999 | 16 (6.4%) | 25 (16.0%) |
| $35,000 to $39,999 | 0 (0.0%) | 0 (0.0%) |
| $40,000 to $44,999 | 27 (10.7%) | 8 (5.1%) |
| $45,000 to $49,999 | 13 (5.2%) | 0 (0.0%) |
| $50,000 to $54,999 | 0 (0.0%) | 0 (0.0%) |
| $55,000 to $64,999 | 81 (32.1%) | 21 (13.5%) |
| $65,000 to $74,999 | 0 (0.0%) | 0 (0.0%) |
| $75,000 to $99,999 | 8 (3.2%) | 26 (16.7%) |
| $100,000+ | 40 (15.9%) | 0 (0.0%) |
| Total | 252 (100.0%) | 156 (100.0%) |
Earnings by Sex by Educational Attainment in Crystal Springs
Average earnings in Crystal Springs are $55,278 for men and $34,300 for women, a difference of 38.0%. Men with an educational attainment of high school diploma enjoy the highest average annual earnings of $56,032, while those with bachelor's degree education earn the least with $46,538. Women with an educational attainment of college or associate's degree earn the most with the average annual earnings of $61,528, while those with high school diploma education have the smallest earnings of $32,650.
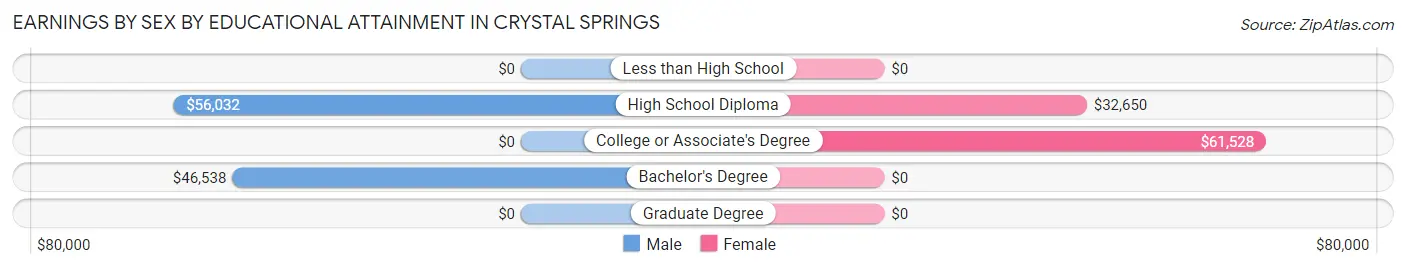
| Educational Attainment | Male Income | Female Income |
| Less than High School | - | - |
| High School Diploma | $56,032 | $32,650 |
| College or Associate's Degree | - | - |
| Bachelor's Degree | $46,538 | $0 |
| Graduate Degree | - | - |
| Total | $55,278 | $34,300 |
Family Income in Crystal Springs
Family Income Brackets in Crystal Springs
According to the Crystal Springs family income data, there are 92 families falling into the less than $10,000 income range, which is the most common income bracket and makes up 36.6% of all families.
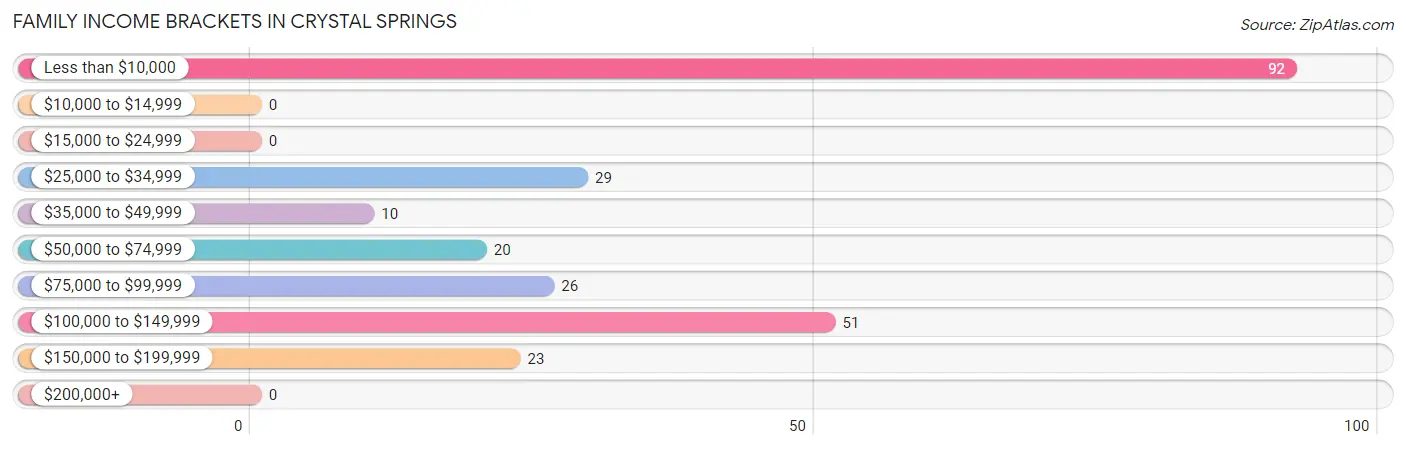
| Income Bracket | # Families | % Families |
| Less than $10,000 | 92 | 36.7% |
| $10,000 to $14,999 | 0 | 0.0% |
| $15,000 to $24,999 | 0 | 0.0% |
| $25,000 to $34,999 | 29 | 11.6% |
| $35,000 to $49,999 | 10 | 4.0% |
| $50,000 to $74,999 | 20 | 8.0% |
| $75,000 to $99,999 | 26 | 10.4% |
| $100,000 to $149,999 | 51 | 20.3% |
| $150,000 to $199,999 | 23 | 9.2% |
| $200,000+ | 0 | 0.0% |
Family Income by Famaliy Size in Crystal Springs
3-person families (66 | 26.3%) account for the highest median family income in Crystal Springs with $77,500 per family, while 3-person families (66 | 26.3%) have the highest median income of $25,833 per family member.
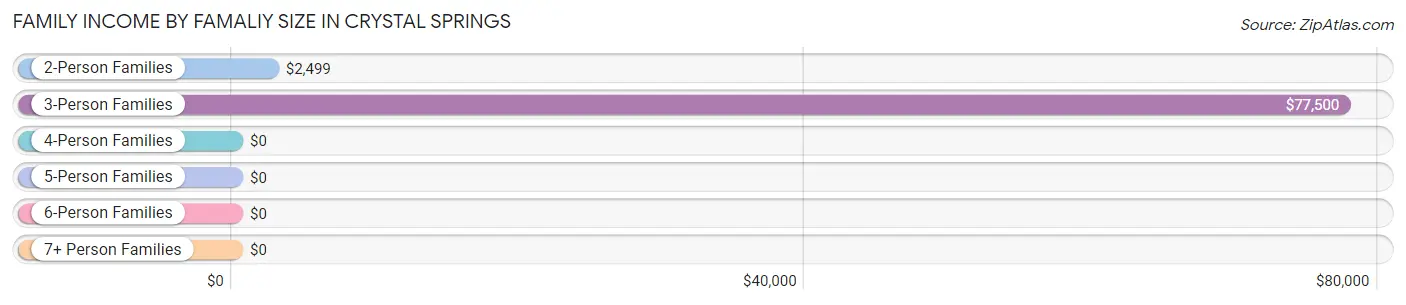
| Income Bracket | # Families | Median Income |
| 2-Person Families | 144 (57.4%) | $2,499 |
| 3-Person Families | 66 (26.3%) | $77,500 |
| 4-Person Families | 31 (12.3%) | $0 |
| 5-Person Families | 0 (0.0%) | $0 |
| 6-Person Families | 10 (4.0%) | $0 |
| 7+ Person Families | 0 (0.0%) | $0 |
| Total | 251 (100.0%) | $0 |
Family Income by Number of Earners in Crystal Springs
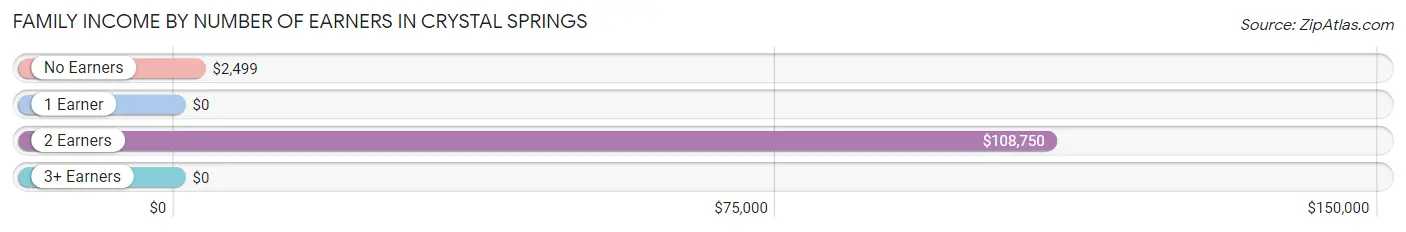
| Number of Earners | # Families | Median Income |
| No Earners | 120 (47.8%) | $2,499 |
| 1 Earner | 42 (16.7%) | $0 |
| 2 Earners | 74 (29.5%) | $108,750 |
| 3+ Earners | 15 (6.0%) | $0 |
| Total | 251 (100.0%) | $0 |
Household Income in Crystal Springs
Household Income Brackets in Crystal Springs
With 93 households falling in the category, the $50,000 to $74,999 income range is the most frequent in Crystal Springs, accounting for 20.9% of all households.
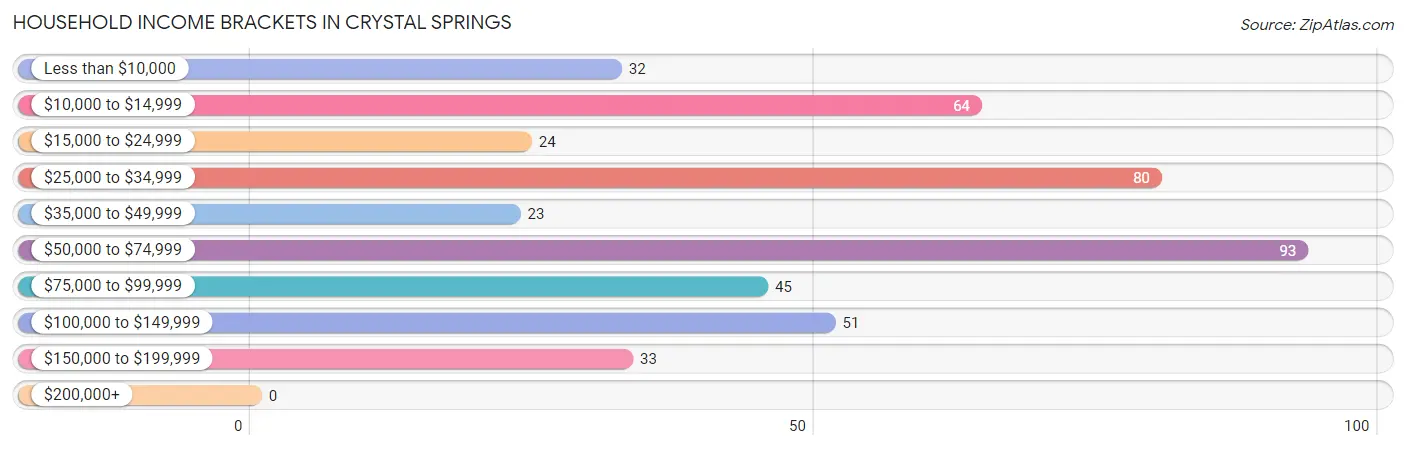
| Income Bracket | # Households | % Households |
| Less than $10,000 | 32 | 7.2% |
| $10,000 to $14,999 | 64 | 14.4% |
| $15,000 to $24,999 | 24 | 5.4% |
| $25,000 to $34,999 | 80 | 18.0% |
| $35,000 to $49,999 | 23 | 5.2% |
| $50,000 to $74,999 | 93 | 20.9% |
| $75,000 to $99,999 | 45 | 10.1% |
| $100,000 to $149,999 | 51 | 11.5% |
| $150,000 to $199,999 | 33 | 7.4% |
| $200,000+ | 0 | 0.0% |
Household Income by Householder Age in Crystal Springs
The median household income in Crystal Springs is $47,411, with the highest median household income of $84,737 found in the 25 to 44 years age bracket for the primary householder. A total of 90 households (20.2%) fall into this category.
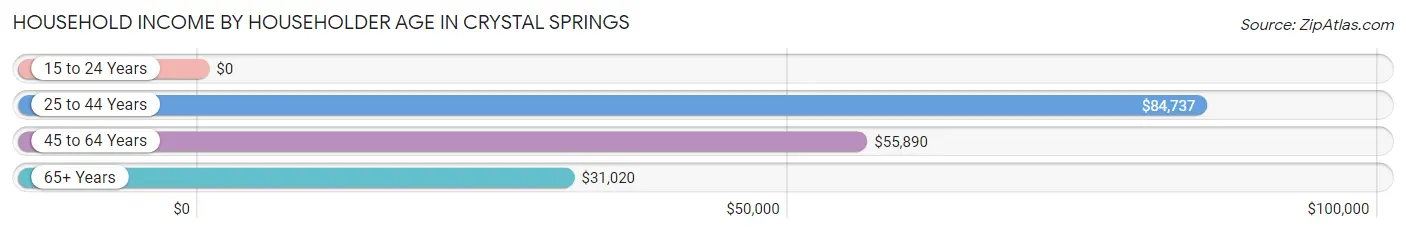
| Income Bracket | # Households | Median Income |
| 15 to 24 Years | 0 (0.0%) | $0 |
| 25 to 44 Years | 90 (20.2%) | $84,737 |
| 45 to 64 Years | 232 (52.1%) | $55,890 |
| 65+ Years | 123 (27.6%) | $31,020 |
| Total | 445 (100.0%) | $47,411 |
Poverty in Crystal Springs
Income Below Poverty by Sex and Age in Crystal Springs
With 27.7% poverty level for males and 31.1% for females among the residents of Crystal Springs, 25 to 34 year old males and 45 to 54 year old females are the most vulnerable to poverty, with 67 males (68.4%) and 73 females (76.0%) in their respective age groups living below the poverty level.
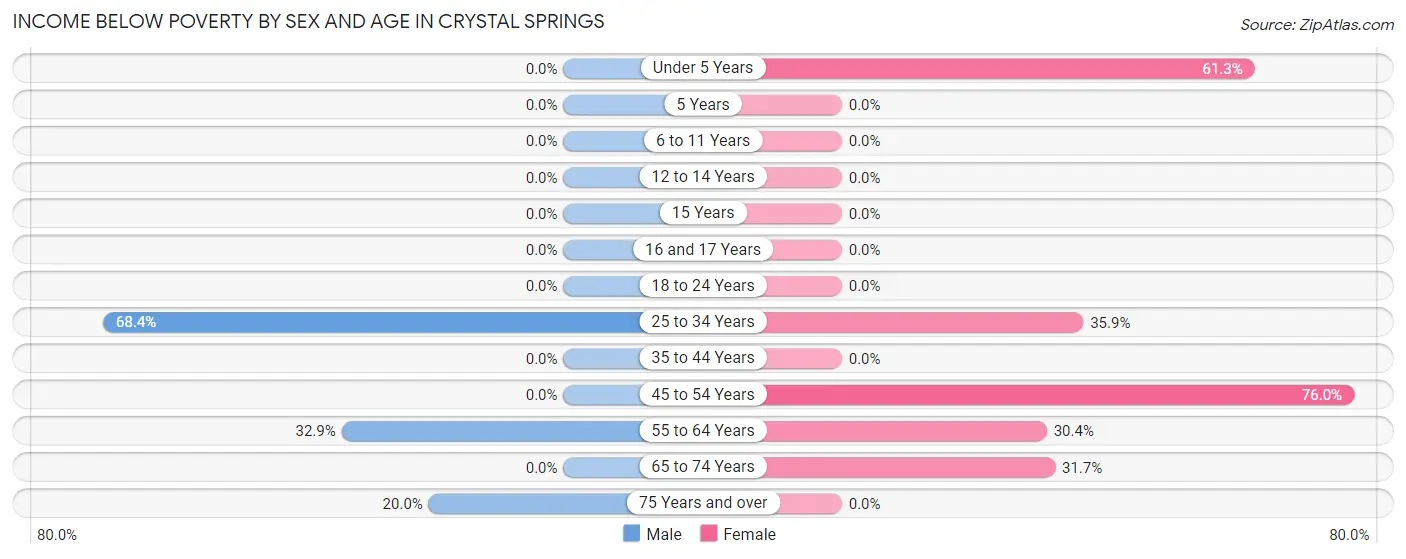
| Age Bracket | Male | Female |
| Under 5 Years | 0 (0.0%) | 19 (61.3%) |
| 5 Years | 0 (0.0%) | 0 (0.0%) |
| 6 to 11 Years | 0 (0.0%) | 0 (0.0%) |
| 12 to 14 Years | 0 (0.0%) | 0 (0.0%) |
| 15 Years | 0 (0.0%) | 0 (0.0%) |
| 16 and 17 Years | 0 (0.0%) | 0 (0.0%) |
| 18 to 24 Years | 0 (0.0%) | 0 (0.0%) |
| 25 to 34 Years | 67 (68.4%) | 19 (35.8%) |
| 35 to 44 Years | 0 (0.0%) | 0 (0.0%) |
| 45 to 54 Years | 0 (0.0%) | 73 (76.0%) |
| 55 to 64 Years | 55 (32.9%) | 21 (30.4%) |
| 65 to 74 Years | 0 (0.0%) | 19 (31.7%) |
| 75 Years and over | 13 (20.0%) | 0 (0.0%) |
| Total | 135 (27.7%) | 151 (31.1%) |
Income Above Poverty by Sex and Age in Crystal Springs
According to the poverty statistics in Crystal Springs, males aged under 5 years and females aged 6 to 11 years are the age groups that are most secure financially, with 100.0% of males and 100.0% of females in these age groups living above the poverty line.
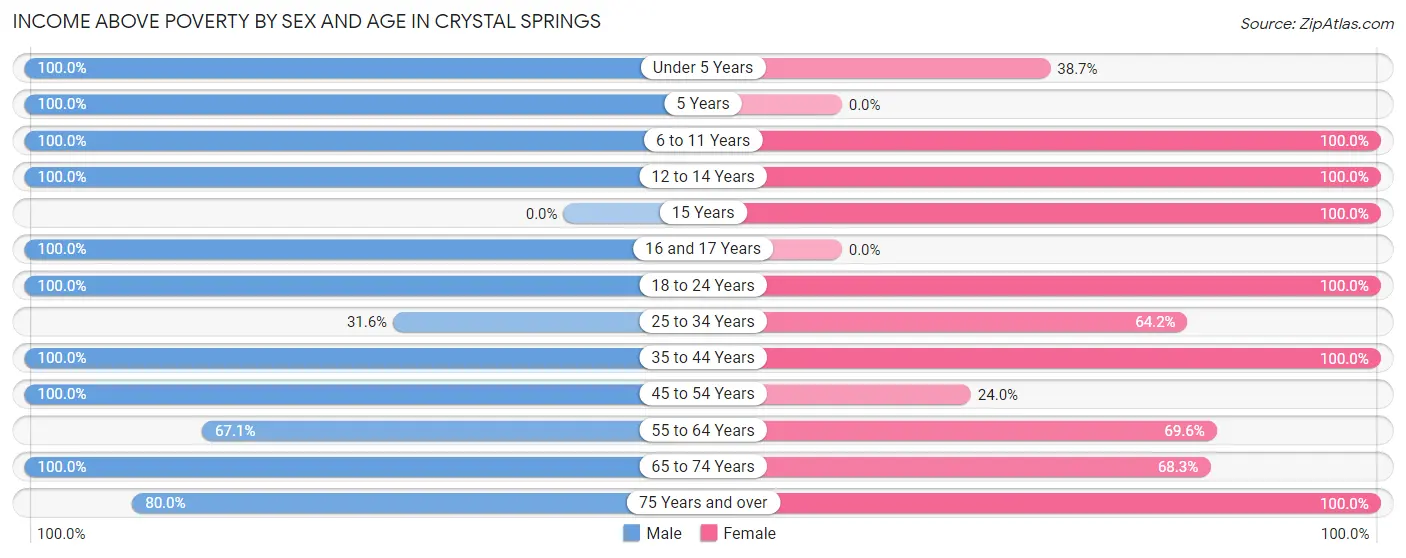
| Age Bracket | Male | Female |
| Under 5 Years | 30 (100.0%) | 12 (38.7%) |
| 5 Years | 6 (100.0%) | 0 (0.0%) |
| 6 to 11 Years | 10 (100.0%) | 5 (100.0%) |
| 12 to 14 Years | 21 (100.0%) | 22 (100.0%) |
| 15 Years | 0 (0.0%) | 10 (100.0%) |
| 16 and 17 Years | 13 (100.0%) | 0 (0.0%) |
| 18 to 24 Years | 8 (100.0%) | 32 (100.0%) |
| 25 to 34 Years | 31 (31.6%) | 34 (64.1%) |
| 35 to 44 Years | 56 (100.0%) | 49 (100.0%) |
| 45 to 54 Years | 6 (100.0%) | 23 (24.0%) |
| 55 to 64 Years | 112 (67.1%) | 48 (69.6%) |
| 65 to 74 Years | 7 (100.0%) | 41 (68.3%) |
| 75 Years and over | 52 (80.0%) | 59 (100.0%) |
| Total | 352 (72.3%) | 335 (68.9%) |
Income Below Poverty Among Married-Couple Families in Crystal Springs
The poverty statistics for married-couple families in Crystal Springs show that 11.3% or 19 of the total 168 families live below the poverty line. Families with 1 or 2 children have the highest poverty rate of 25.7%, comprising of 19 families. On the other hand, families with no children have the lowest poverty rate of 0.0%, which includes 0 families.
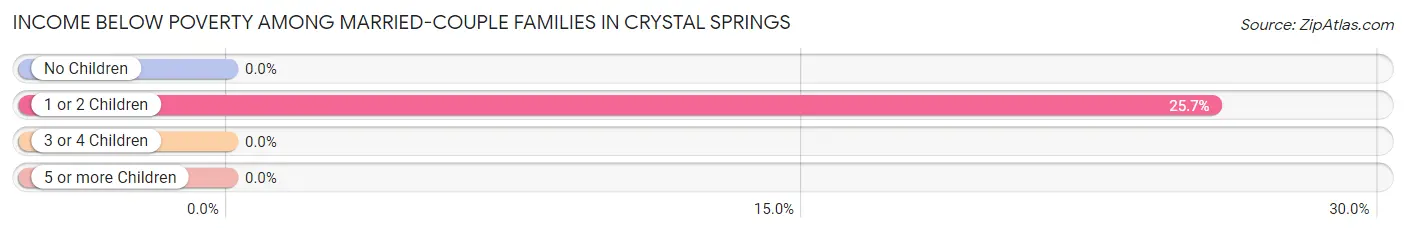
| Children | Above Poverty | Below Poverty |
| No Children | 94 (100.0%) | 0 (0.0%) |
| 1 or 2 Children | 55 (74.3%) | 19 (25.7%) |
| 3 or 4 Children | 0 (0.0%) | 0 (0.0%) |
| 5 or more Children | 0 (0.0%) | 0 (0.0%) |
| Total | 149 (88.7%) | 19 (11.3%) |
Income Below Poverty Among Single-Parent Households in Crystal Springs
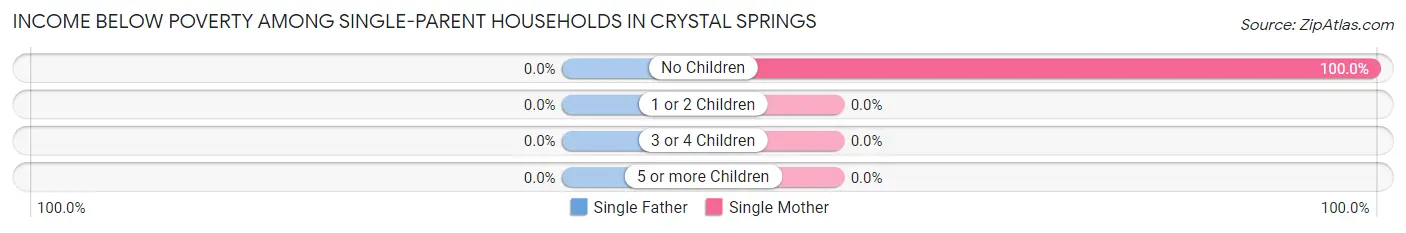
| Children | Single Father | Single Mother |
| No Children | 0 (0.0%) | 73 (100.0%) |
| 1 or 2 Children | 0 (0.0%) | 0 (0.0%) |
| 3 or 4 Children | 0 (0.0%) | 0 (0.0%) |
| 5 or more Children | 0 (0.0%) | 0 (0.0%) |
| Total | 0 (0.0%) | 73 (87.9%) |
Income Below Poverty Among Married-Couple vs Single-Parent Households in Crystal Springs
The poverty data for Crystal Springs shows that 19 of the married-couple family households (11.3%) and 73 of the single-parent households (87.9%) are living below the poverty level. Within the married-couple family households, those with 1 or 2 children have the highest poverty rate, with 19 households (25.7%) falling below the poverty line. Among the single-parent households, those with no children have the highest poverty rate, with 73 household (100.0%) living below poverty.
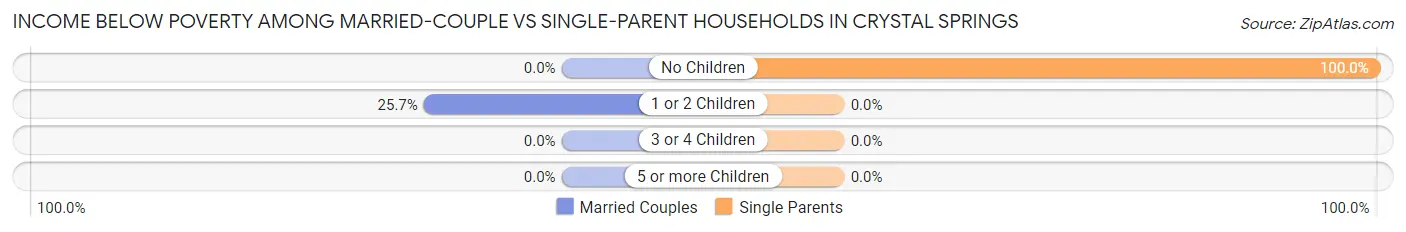
| Children | Married-Couple Families | Single-Parent Households |
| No Children | 0 (0.0%) | 73 (100.0%) |
| 1 or 2 Children | 19 (25.7%) | 0 (0.0%) |
| 3 or 4 Children | 0 (0.0%) | 0 (0.0%) |
| 5 or more Children | 0 (0.0%) | 0 (0.0%) |
| Total | 19 (11.3%) | 73 (87.9%) |
Race in Crystal Springs
The most populous races in Crystal Springs are White / Caucasian (886 | 91.1%), Hispanic or Latino (83 | 8.5%), and Two or more Races (50 | 5.1%).
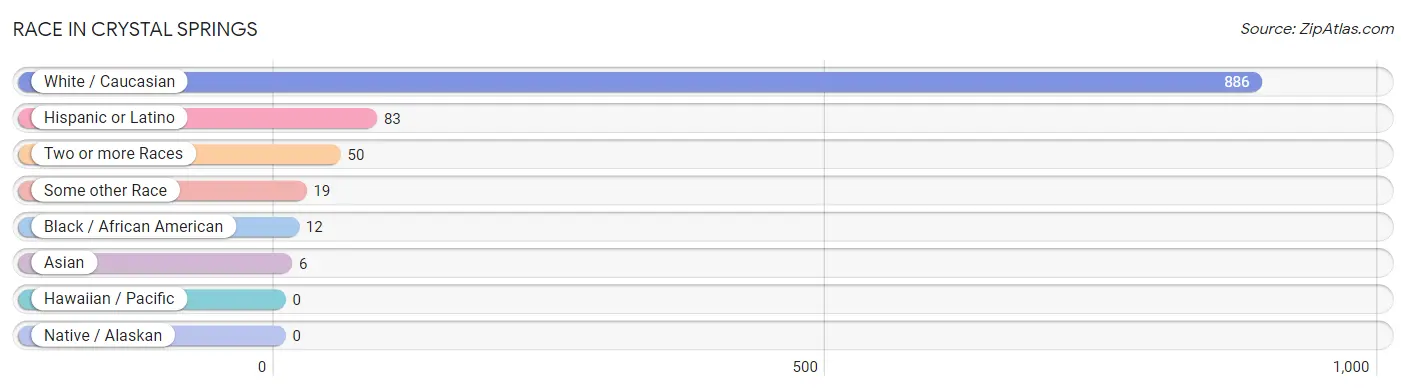
| Race | # Population | % Population |
| Asian | 6 | 0.6% |
| Black / African American | 12 | 1.2% |
| Hawaiian / Pacific | 0 | 0.0% |
| Hispanic or Latino | 83 | 8.5% |
| Native / Alaskan | 0 | 0.0% |
| White / Caucasian | 886 | 91.1% |
| Two or more Races | 50 | 5.1% |
| Some other Race | 19 | 1.9% |
| Total | 973 | 100.0% |
Ancestry in Crystal Springs
The most populous ancestries reported in Crystal Springs are European (169 | 17.4%), English (103 | 10.6%), Polish (94 | 9.7%), Irish (82 | 8.4%), and German (75 | 7.7%), together accounting for 53.8% of all Crystal Springs residents.
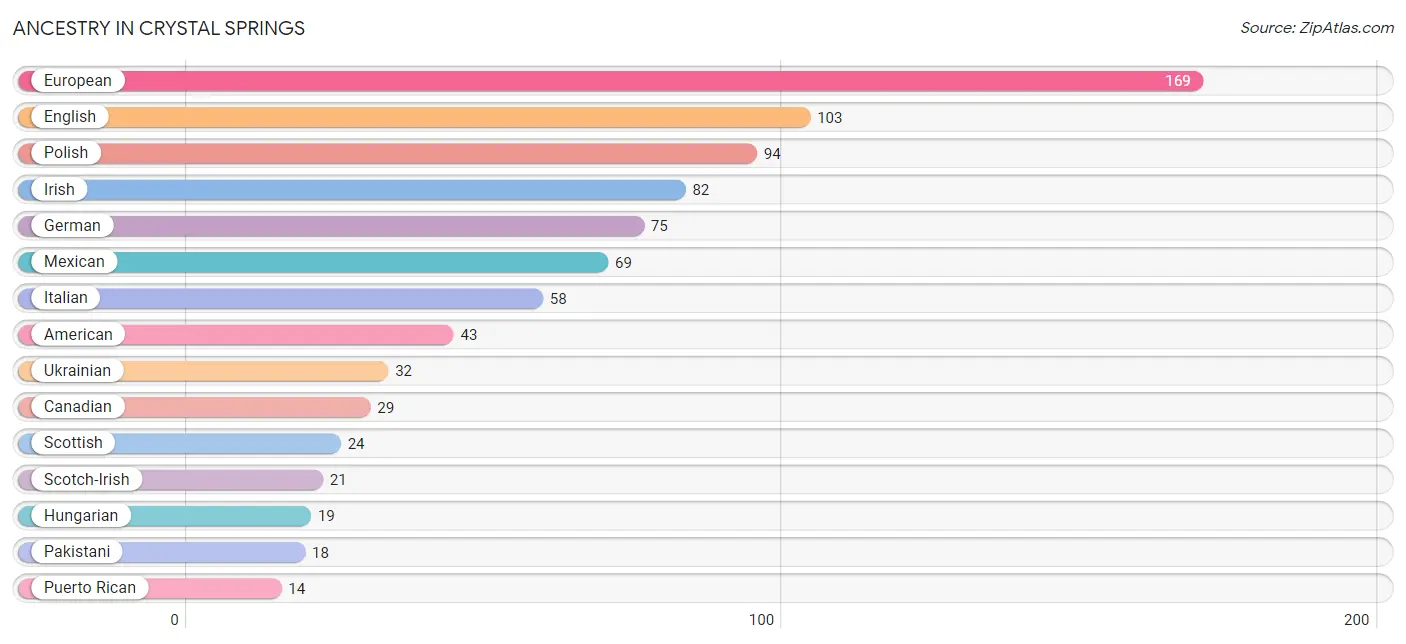
| Ancestry | # Population | % Population |
| American | 43 | 4.4% |
| Arab | 9 | 0.9% |
| Canadian | 29 | 3.0% |
| English | 103 | 10.6% |
| European | 169 | 17.4% |
| French | 10 | 1.0% |
| French Canadian | 6 | 0.6% |
| German | 75 | 7.7% |
| Hungarian | 19 | 1.9% |
| Irish | 82 | 8.4% |
| Italian | 58 | 6.0% |
| Lebanese | 9 | 0.9% |
| Mexican | 69 | 7.1% |
| Pakistani | 18 | 1.8% |
| Polish | 94 | 9.7% |
| Puerto Rican | 14 | 1.4% |
| Scotch-Irish | 21 | 2.2% |
| Scottish | 24 | 2.5% |
| Ukrainian | 32 | 3.3% | View All 19 Rows |
Immigrants in Crystal Springs
The most numerous immigrant groups reported in Crystal Springs came from Central America (39 | 4.0%), Latin America (39 | 4.0%), Mexico (39 | 4.0%), Asia (13 | 1.3%), and South Eastern Asia (13 | 1.3%), together accounting for 14.7% of all Crystal Springs residents.
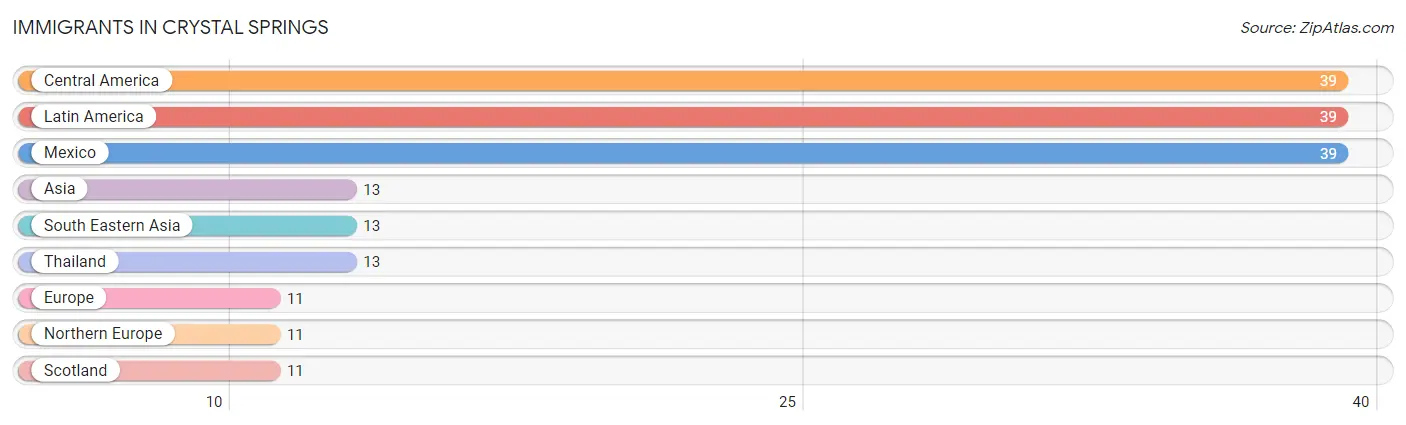
| Immigration Origin | # Population | % Population |
| Asia | 13 | 1.3% |
| Central America | 39 | 4.0% |
| Europe | 11 | 1.1% |
| Latin America | 39 | 4.0% |
| Mexico | 39 | 4.0% |
| Northern Europe | 11 | 1.1% |
| Scotland | 11 | 1.1% |
| South Eastern Asia | 13 | 1.3% |
| Thailand | 13 | 1.3% | View All 9 Rows |
Sex and Age in Crystal Springs
Sex and Age in Crystal Springs
The most populous age groups in Crystal Springs are 30 to 34 Years (89 | 18.3%) for men and 50 to 54 Years (96 | 19.8%) for women.
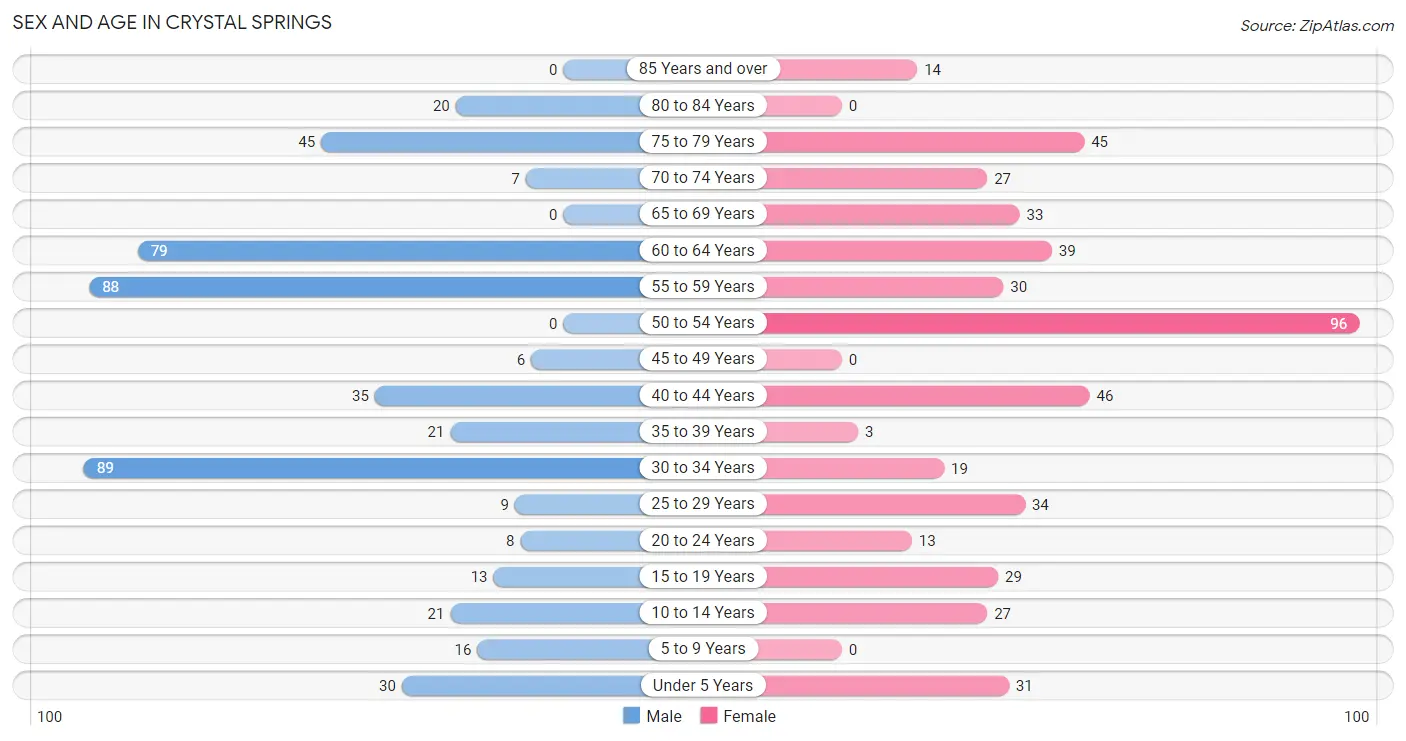
| Age Bracket | Male | Female |
| Under 5 Years | 30 (6.2%) | 31 (6.4%) |
| 5 to 9 Years | 16 (3.3%) | 0 (0.0%) |
| 10 to 14 Years | 21 (4.3%) | 27 (5.6%) |
| 15 to 19 Years | 13 (2.7%) | 29 (6.0%) |
| 20 to 24 Years | 8 (1.6%) | 13 (2.7%) |
| 25 to 29 Years | 9 (1.8%) | 34 (7.0%) |
| 30 to 34 Years | 89 (18.3%) | 19 (3.9%) |
| 35 to 39 Years | 21 (4.3%) | 3 (0.6%) |
| 40 to 44 Years | 35 (7.2%) | 46 (9.5%) |
| 45 to 49 Years | 6 (1.2%) | 0 (0.0%) |
| 50 to 54 Years | 0 (0.0%) | 96 (19.8%) |
| 55 to 59 Years | 88 (18.1%) | 30 (6.2%) |
| 60 to 64 Years | 79 (16.2%) | 39 (8.0%) |
| 65 to 69 Years | 0 (0.0%) | 33 (6.8%) |
| 70 to 74 Years | 7 (1.4%) | 27 (5.6%) |
| 75 to 79 Years | 45 (9.2%) | 45 (9.3%) |
| 80 to 84 Years | 20 (4.1%) | 0 (0.0%) |
| 85 Years and over | 0 (0.0%) | 14 (2.9%) |
| Total | 487 (100.0%) | 486 (100.0%) |
Families and Households in Crystal Springs
Median Family Size in Crystal Springs
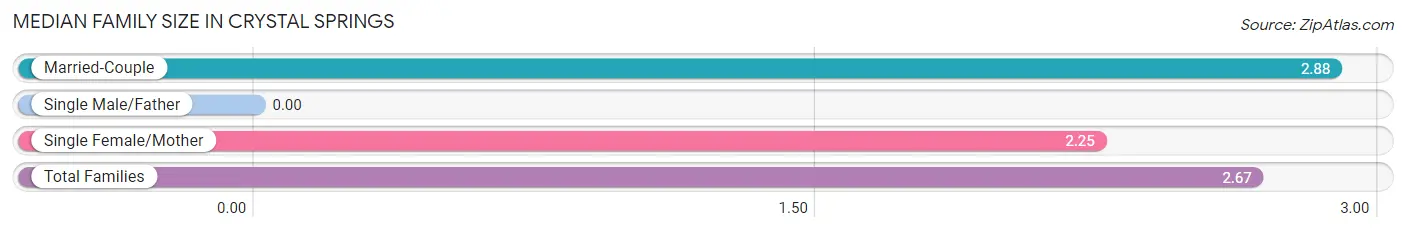
| Family Type | # Families | Family Size |
| Married-Couple | 168 (66.9%) | 2.88 |
| Single Male/Father | 0 (0.0%) | - |
| Single Female/Mother | 83 (33.1%) | 2.25 |
| Total Families | 251 (100.0%) | 2.67 |
Median Household Size in Crystal Springs
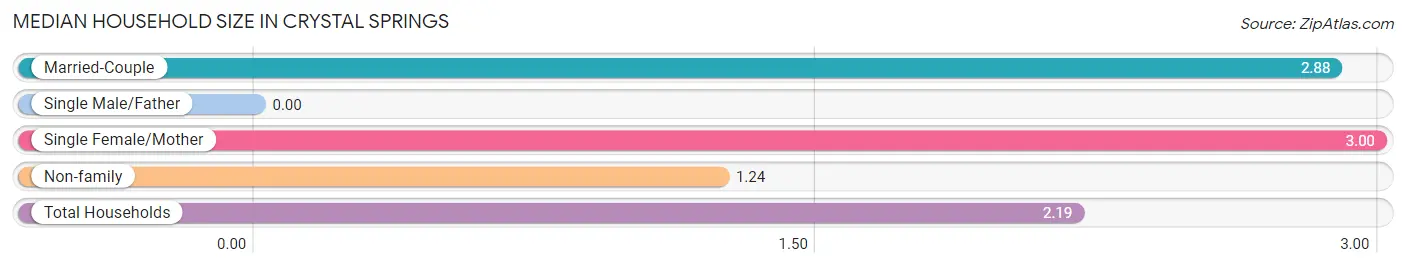
| Household Type | # Households | Household Size |
| Married-Couple | 168 (37.8%) | 2.88 |
| Single Male/Father | 0 (0.0%) | - |
| Single Female/Mother | 83 (18.6%) | 3.00 |
| Non-family | 194 (43.6%) | 1.24 |
| Total Households | 445 (100.0%) | 2.19 |
Household Size by Marriage Status in Crystal Springs
Out of a total of 445 households in Crystal Springs, 251 (56.4%) are family households, while 194 (43.6%) are nonfamily households. The most numerous type of family households are 3-person households, comprising 139, and the most common type of nonfamily households are 1-person households, comprising 161.
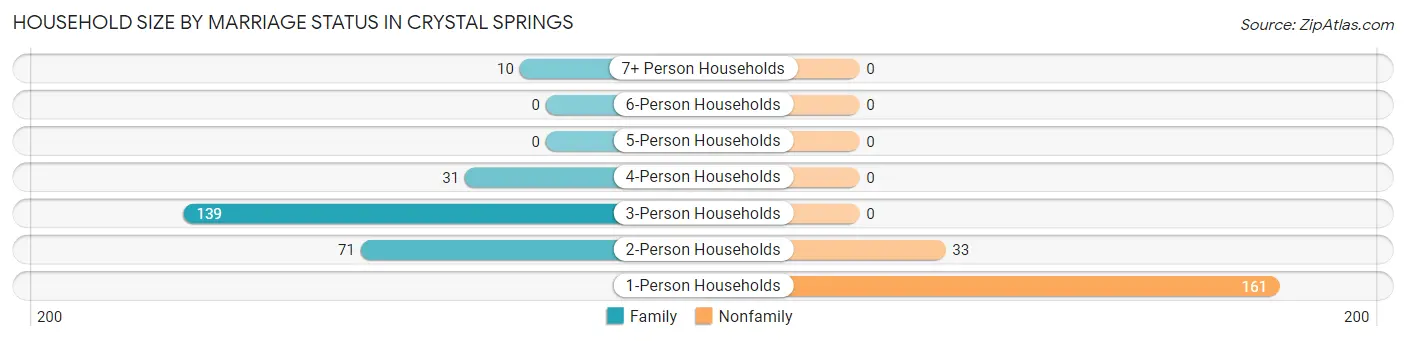
| Household Size | Family Households | Nonfamily Households |
| 1-Person Households | - | 161 (36.2%) |
| 2-Person Households | 71 (16.0%) | 33 (7.4%) |
| 3-Person Households | 139 (31.2%) | 0 (0.0%) |
| 4-Person Households | 31 (7.0%) | 0 (0.0%) |
| 5-Person Households | 0 (0.0%) | 0 (0.0%) |
| 6-Person Households | 0 (0.0%) | 0 (0.0%) |
| 7+ Person Households | 10 (2.2%) | 0 (0.0%) |
| Total | 251 (56.4%) | 194 (43.6%) |
Female Fertility in Crystal Springs
Fertility by Age in Crystal Springs
Average fertility rate in Crystal Springs is 132.0 births per 1,000 women. Women in the age bracket of 20 to 34 years have the highest fertility rate with 288.0 births per 1,000 women. Women in the age bracket of 20 to 34 years acount for 100.0% of all women with births.
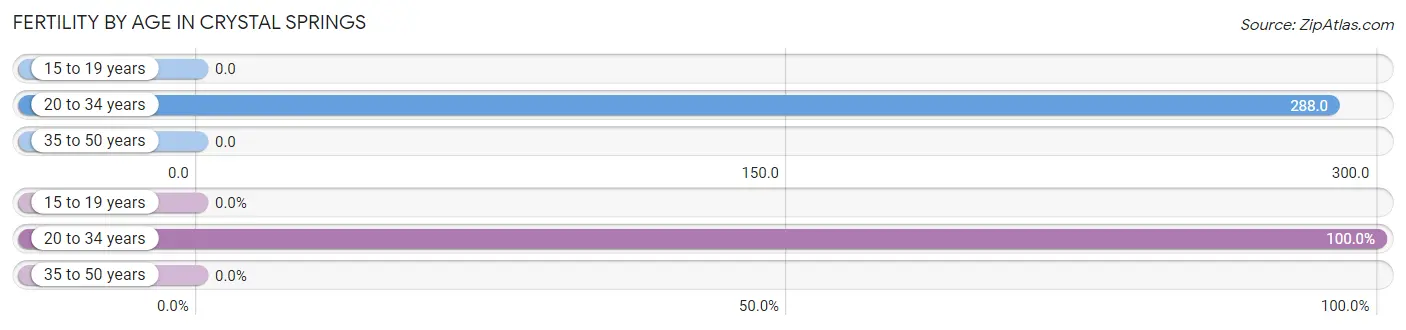
| Age Bracket | Women with Births | Births / 1,000 Women |
| 15 to 19 years | 0 (0.0%) | 0.0 |
| 20 to 34 years | 19 (100.0%) | 288.0 |
| 35 to 50 years | 0 (0.0%) | 0.0 |
| Total | 19 (100.0%) | 132.0 |
Fertility by Age by Marriage Status in Crystal Springs
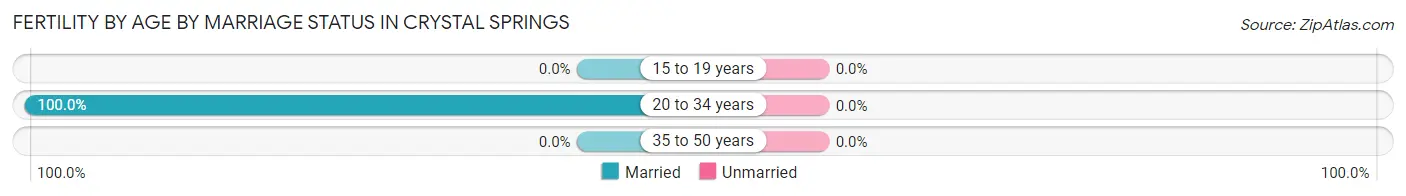
| Age Bracket | Married | Unmarried |
| 15 to 19 years | 0 (0.0%) | 0 (0.0%) |
| 20 to 34 years | 19 (100.0%) | 0 (0.0%) |
| 35 to 50 years | 0 (0.0%) | 0 (0.0%) |
| Total | 19 (100.0%) | 0 (0.0%) |
Fertility by Education in Crystal Springs
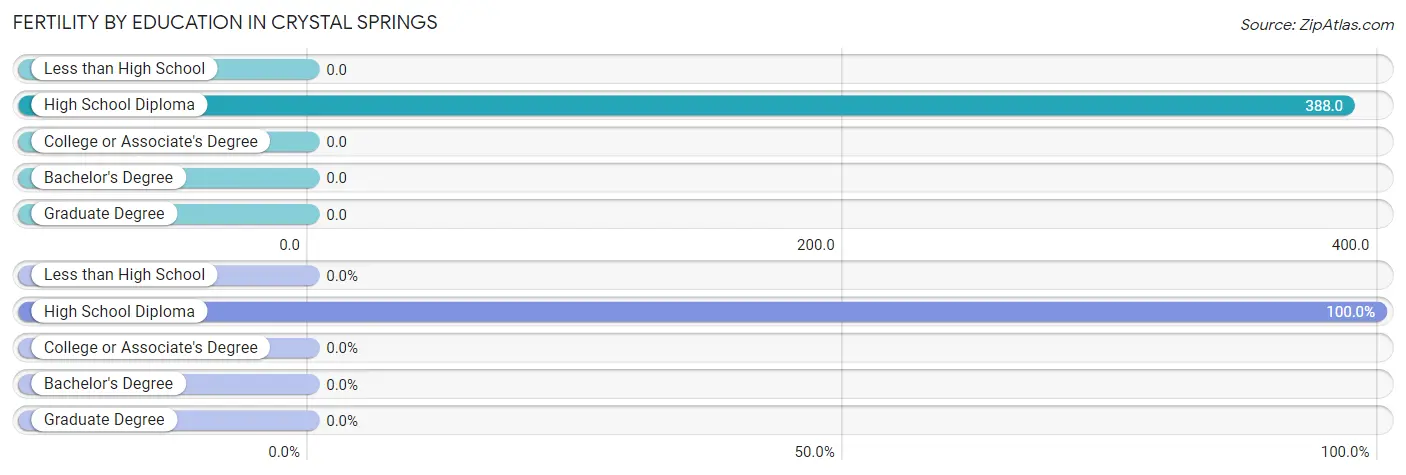
| Educational Attainment | Women with Births | Births / 1,000 Women |
| Less than High School | 0 (0.0%) | 0.0 |
| High School Diploma | 19 (100.0%) | 388.0 |
| College or Associate's Degree | 0 (0.0%) | 0.0 |
| Bachelor's Degree | 0 (0.0%) | 0.0 |
| Graduate Degree | 0 (0.0%) | 0.0 |
| Total | 19 (100.0%) | 132.0 |
Fertility by Education by Marriage Status in Crystal Springs
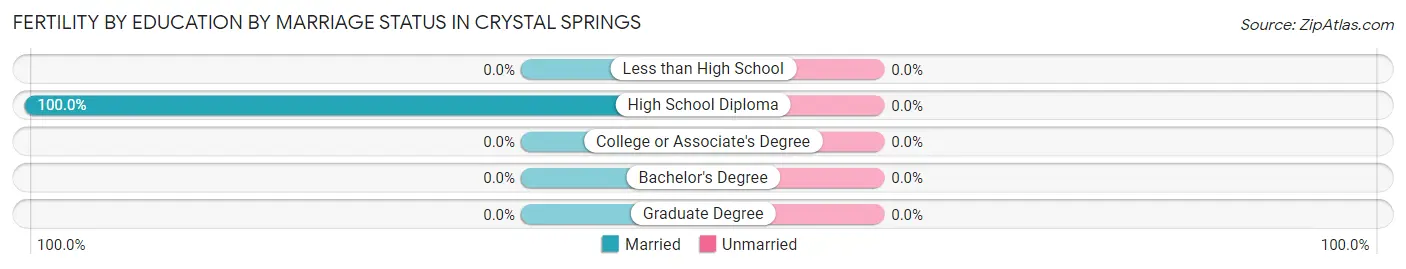
| Educational Attainment | Married | Unmarried |
| Less than High School | 0 (0.0%) | 0 (0.0%) |
| High School Diploma | 19 (100.0%) | 0 (0.0%) |
| College or Associate's Degree | 0 (0.0%) | 0 (0.0%) |
| Bachelor's Degree | 0 (0.0%) | 0 (0.0%) |
| Graduate Degree | 0 (0.0%) | 0 (0.0%) |
| Total | 19 (100.0%) | 0 (0.0%) |
Employment Characteristics in Crystal Springs
Employment by Class of Employer in Crystal Springs
Among the 343 employed individuals in Crystal Springs, private company employees (229 | 66.8%), local government employees (30 | 8.7%), and federal government employees (24 | 7.0%) make up the most common classes of employment.
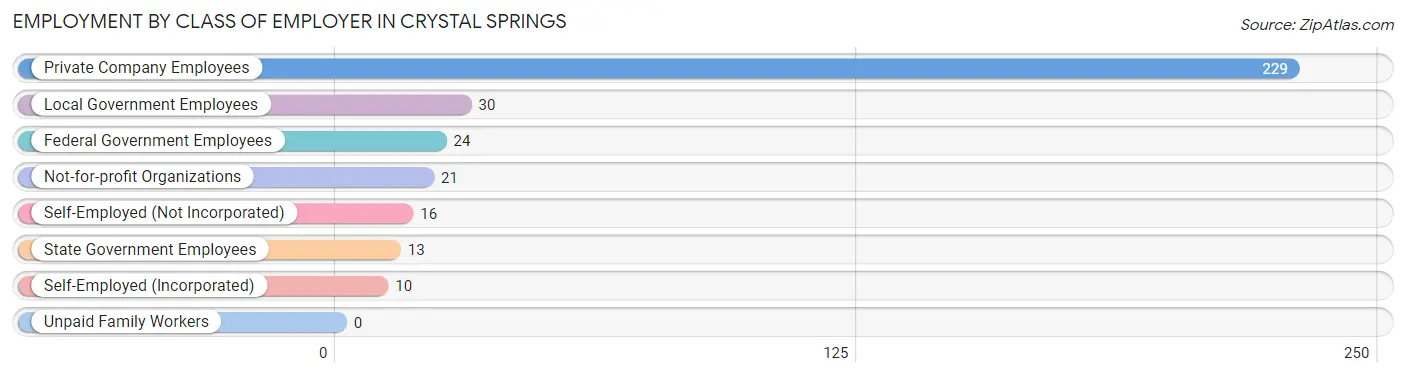
| Employer Class | # Employees | % Employees |
| Private Company Employees | 229 | 66.8% |
| Self-Employed (Incorporated) | 10 | 2.9% |
| Self-Employed (Not Incorporated) | 16 | 4.7% |
| Not-for-profit Organizations | 21 | 6.1% |
| Local Government Employees | 30 | 8.7% |
| State Government Employees | 13 | 3.8% |
| Federal Government Employees | 24 | 7.0% |
| Unpaid Family Workers | 0 | 0.0% |
| Total | 343 | 100.0% |
Employment Status by Age in Crystal Springs
According to the labor force statistics for Crystal Springs, out of the total population over 16 years of age (838), 47.5% or 398 individuals are in the labor force, with 13.8% or 55 of them unemployed. The age group with the highest labor force participation rate is 20 to 24 years, with 100.0% or 21 individuals in the labor force. Within the labor force, the 30 to 34 years age range has the highest percentage of unemployed individuals, with 43.5% or 47 of them being unemployed.
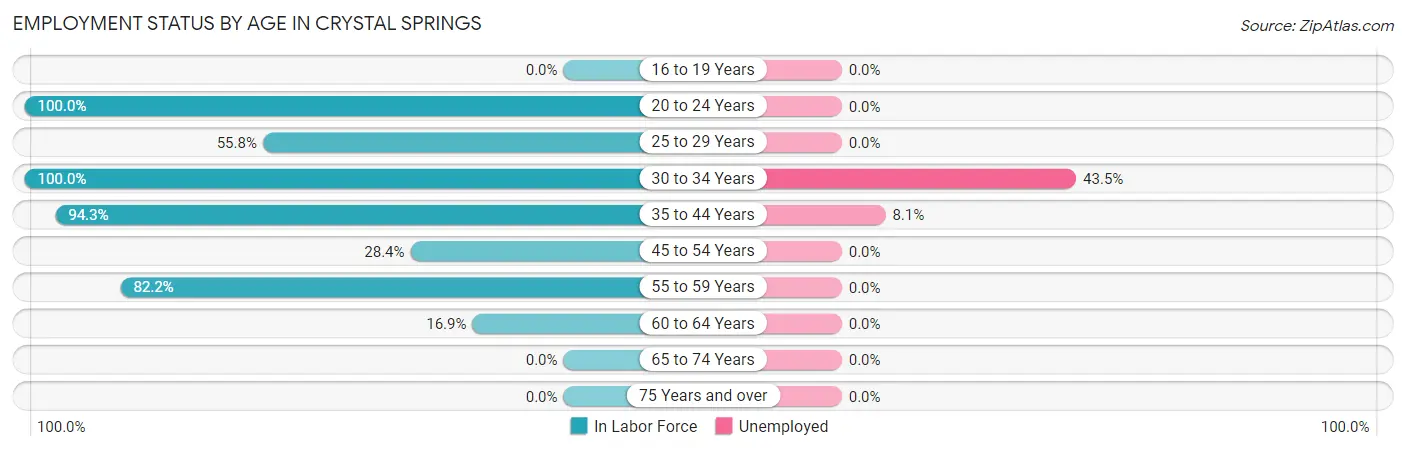
| Age Bracket | In Labor Force | Unemployed |
| 16 to 19 Years | 0 (0.0%) | 0 (0.0%) |
| 20 to 24 Years | 21 (100.0%) | 0 (0.0%) |
| 25 to 29 Years | 24 (55.8%) | 0 (0.0%) |
| 30 to 34 Years | 108 (100.0%) | 47 (43.5%) |
| 35 to 44 Years | 99 (94.3%) | 8 (8.1%) |
| 45 to 54 Years | 29 (28.4%) | 0 (0.0%) |
| 55 to 59 Years | 97 (82.2%) | 0 (0.0%) |
| 60 to 64 Years | 20 (16.9%) | 0 (0.0%) |
| 65 to 74 Years | 0 (0.0%) | 0 (0.0%) |
| 75 Years and over | 0 (0.0%) | 0 (0.0%) |
| Total | 398 (47.5%) | 55 (13.8%) |
Employment Status by Educational Attainment in Crystal Springs
According to labor force statistics for Crystal Springs, 63.5% of individuals (377) out of the total population between 25 and 64 years of age (594) are in the labor force, with 14.6% or 55 of them being unemployed. The group with the highest labor force participation rate are those with the educational attainment of bachelor's degree or higher, with 100.0% or 51 individuals in the labor force. Within the labor force, individuals with high school diploma education have the highest percentage of unemployment, with 19.9% or 47 of them being unemployed.
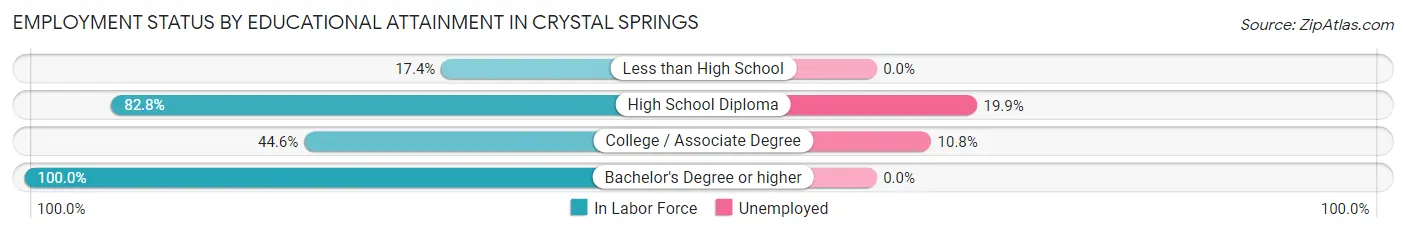
| Educational Attainment | In Labor Force | Unemployed |
| Less than High School | 16 (17.4%) | 0 (0.0%) |
| High School Diploma | 236 (82.8%) | 57 (19.9%) |
| College / Associate Degree | 74 (44.6%) | 18 (10.8%) |
| Bachelor's Degree or higher | 51 (100.0%) | 0 (0.0%) |
| Total | 377 (63.5%) | 87 (14.6%) |
Employment Occupations by Sex in Crystal Springs
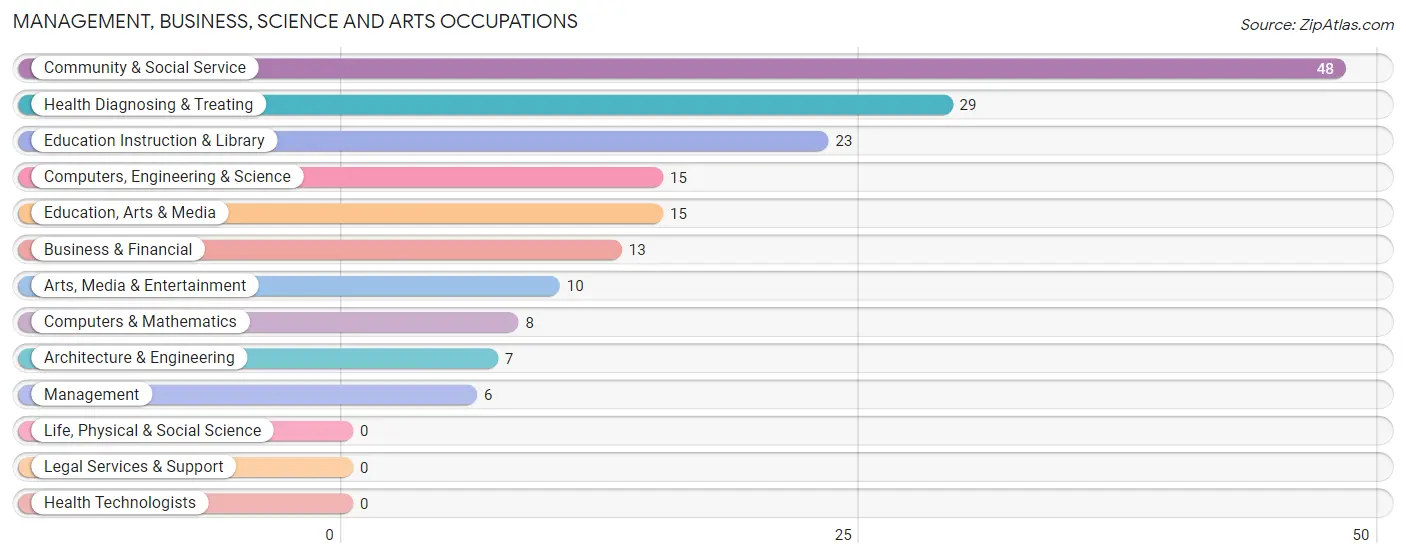
Management, Business, Science and Arts Occupations
The most common Management, Business, Science and Arts occupations in Crystal Springs are Community & Social Service (48 | 14.0%), Health Diagnosing & Treating (29 | 8.5%), Education Instruction & Library (23 | 6.7%), Computers, Engineering & Science (15 | 4.4%), and Education, Arts & Media (15 | 4.4%).
Management, Business, Science and Arts Occupations by Sex
Within the Management, Business, Science and Arts occupations in Crystal Springs, the most male-oriented occupations are Management (100.0%), Business & Financial (100.0%), and Computers, Engineering & Science (100.0%), while the most female-oriented occupations are Education, Arts & Media (100.0%), Health Diagnosing & Treating (100.0%), and Community & Social Service (54.2%).
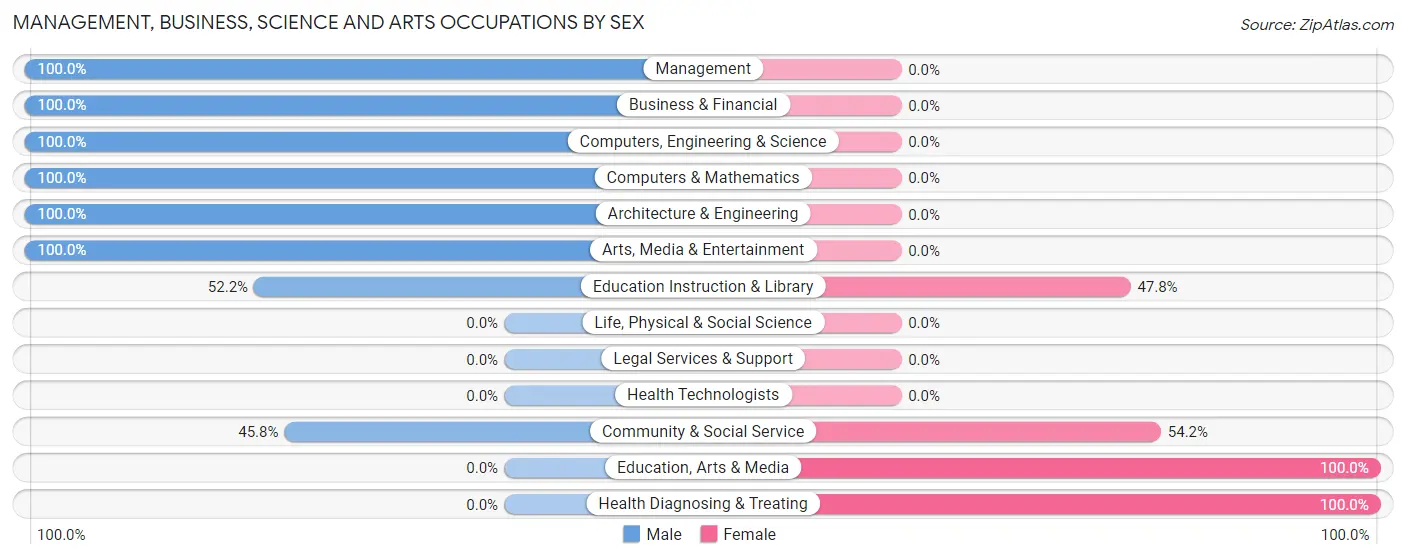
| Occupation | Male | Female |
| Management | 6 (100.0%) | 0 (0.0%) |
| Business & Financial | 13 (100.0%) | 0 (0.0%) |
| Computers, Engineering & Science | 15 (100.0%) | 0 (0.0%) |
| Computers & Mathematics | 8 (100.0%) | 0 (0.0%) |
| Architecture & Engineering | 7 (100.0%) | 0 (0.0%) |
| Life, Physical & Social Science | 0 (0.0%) | 0 (0.0%) |
| Community & Social Service | 22 (45.8%) | 26 (54.2%) |
| Education, Arts & Media | 0 (0.0%) | 15 (100.0%) |
| Legal Services & Support | 0 (0.0%) | 0 (0.0%) |
| Education Instruction & Library | 12 (52.2%) | 11 (47.8%) |
| Arts, Media & Entertainment | 10 (100.0%) | 0 (0.0%) |
| Health Diagnosing & Treating | 0 (0.0%) | 29 (100.0%) |
| Health Technologists | 0 (0.0%) | 0 (0.0%) |
| Total (Category) | 56 (50.4%) | 55 (49.5%) |
| Total (Overall) | 223 (65.0%) | 120 (35.0%) |
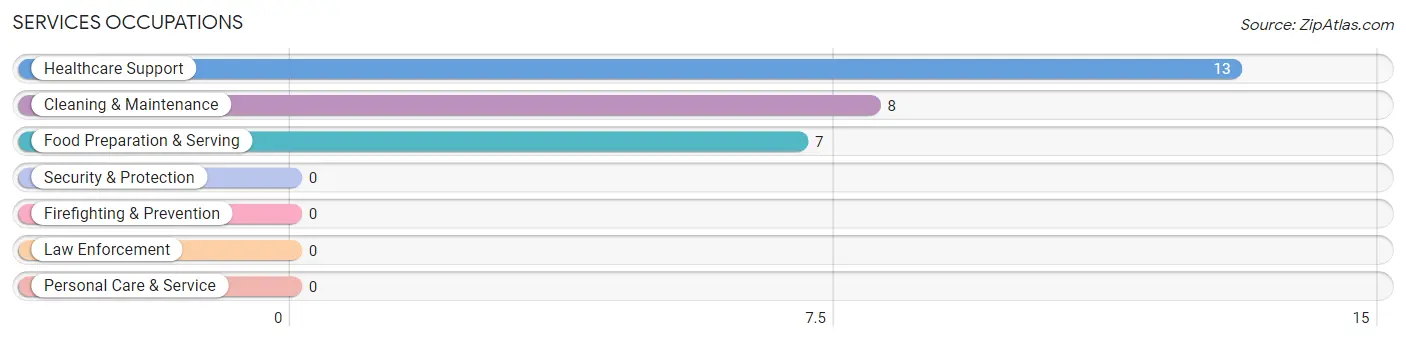
Services Occupations
The most common Services occupations in Crystal Springs are Healthcare Support (13 | 3.8%), Cleaning & Maintenance (8 | 2.3%), and Food Preparation & Serving (7 | 2.0%).
Services Occupations by Sex
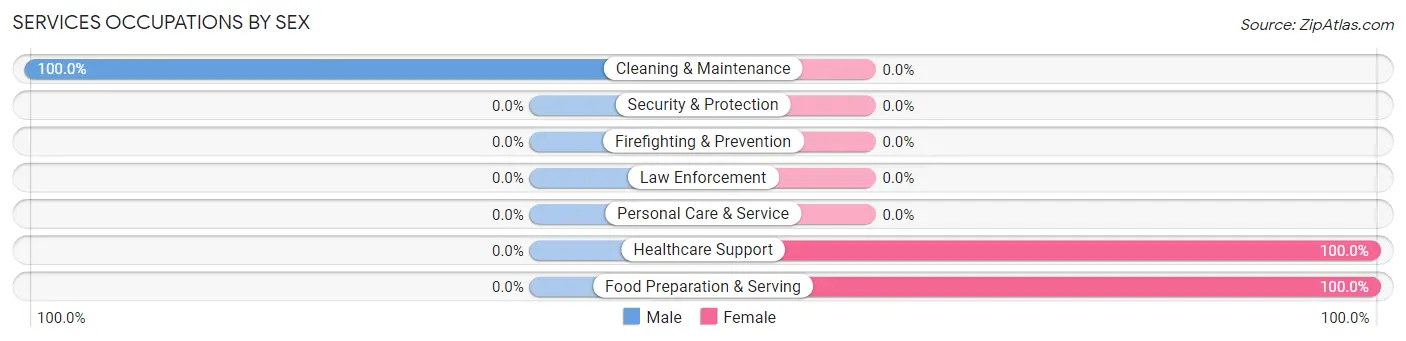
| Occupation | Male | Female |
| Healthcare Support | 0 (0.0%) | 13 (100.0%) |
| Security & Protection | 0 (0.0%) | 0 (0.0%) |
| Firefighting & Prevention | 0 (0.0%) | 0 (0.0%) |
| Law Enforcement | 0 (0.0%) | 0 (0.0%) |
| Food Preparation & Serving | 0 (0.0%) | 7 (100.0%) |
| Cleaning & Maintenance | 8 (100.0%) | 0 (0.0%) |
| Personal Care & Service | 0 (0.0%) | 0 (0.0%) |
| Total (Category) | 8 (28.6%) | 20 (71.4%) |
| Total (Overall) | 223 (65.0%) | 120 (35.0%) |
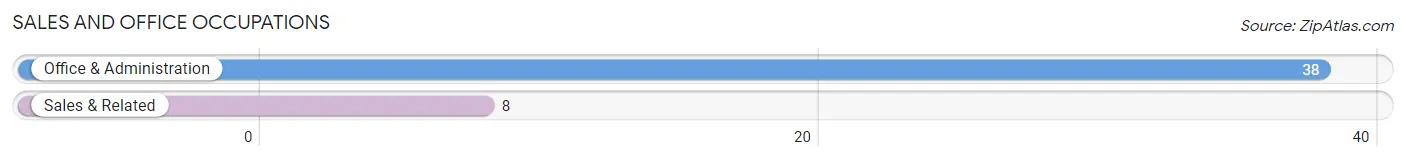
Sales and Office Occupations
The most common Sales and Office occupations in Crystal Springs are Office & Administration (38 | 11.1%), and Sales & Related (8 | 2.3%).
Sales and Office Occupations by Sex
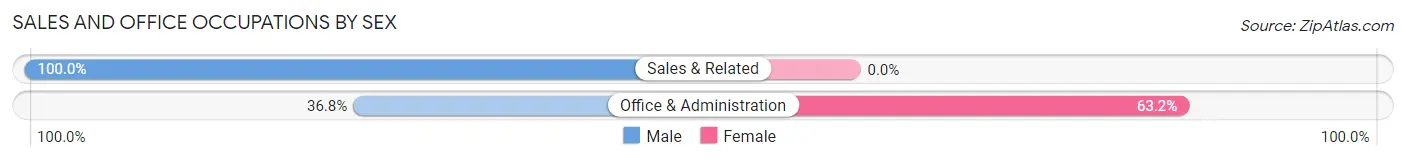
| Occupation | Male | Female |
| Sales & Related | 8 (100.0%) | 0 (0.0%) |
| Office & Administration | 14 (36.8%) | 24 (63.2%) |
| Total (Category) | 22 (47.8%) | 24 (52.2%) |
| Total (Overall) | 223 (65.0%) | 120 (35.0%) |
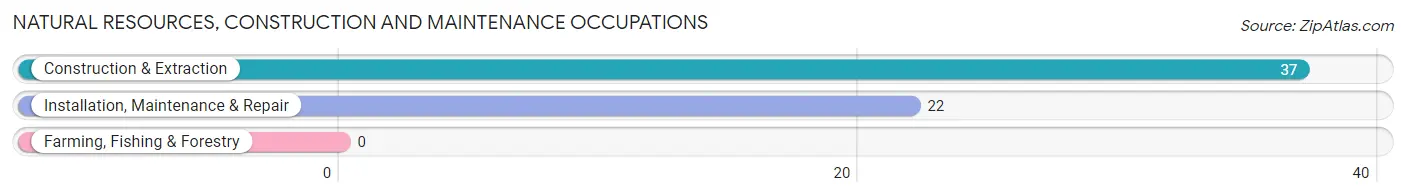
Natural Resources, Construction and Maintenance Occupations
The most common Natural Resources, Construction and Maintenance occupations in Crystal Springs are Construction & Extraction (37 | 10.8%), and Installation, Maintenance & Repair (22 | 6.4%).
Natural Resources, Construction and Maintenance Occupations by Sex
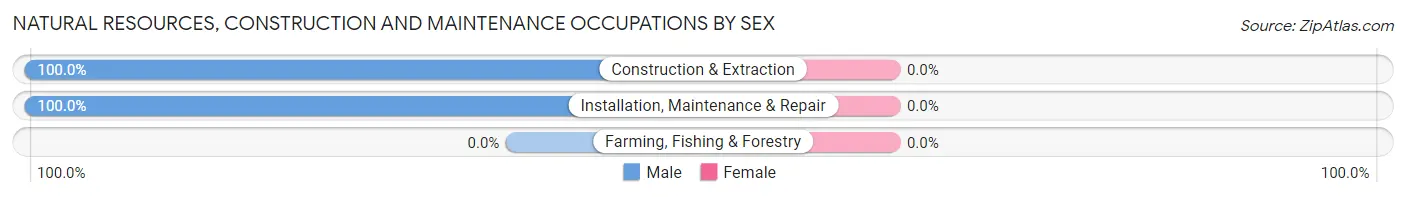
| Occupation | Male | Female |
| Farming, Fishing & Forestry | 0 (0.0%) | 0 (0.0%) |
| Construction & Extraction | 37 (100.0%) | 0 (0.0%) |
| Installation, Maintenance & Repair | 22 (100.0%) | 0 (0.0%) |
| Total (Category) | 59 (100.0%) | 0 (0.0%) |
| Total (Overall) | 223 (65.0%) | 120 (35.0%) |
Production, Transportation and Moving Occupations
The most common Production, Transportation and Moving occupations in Crystal Springs are Material Moving (54 | 15.7%), Production (29 | 8.5%), and Transportation (16 | 4.7%).
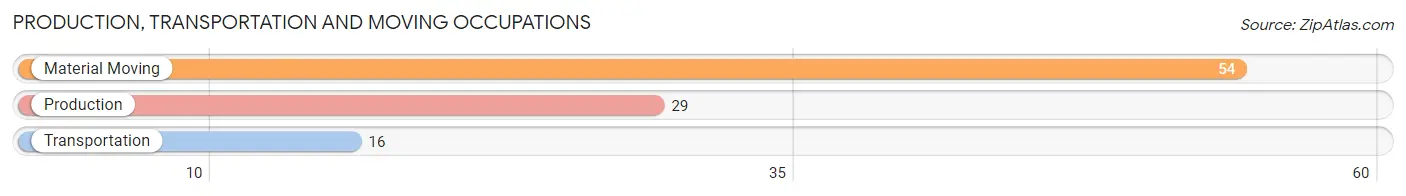
Production, Transportation and Moving Occupations by Sex
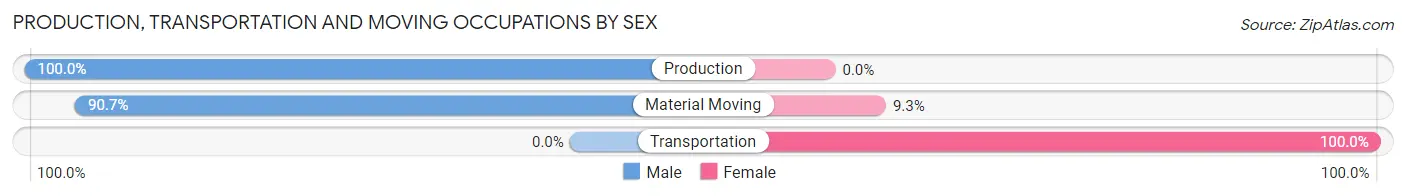
| Occupation | Male | Female |
| Production | 29 (100.0%) | 0 (0.0%) |
| Transportation | 0 (0.0%) | 16 (100.0%) |
| Material Moving | 49 (90.7%) | 5 (9.3%) |
| Total (Category) | 78 (78.8%) | 21 (21.2%) |
| Total (Overall) | 223 (65.0%) | 120 (35.0%) |
Employment Industries by Sex in Crystal Springs
Employment Industries in Crystal Springs
The major employment industries in Crystal Springs include Construction (67 | 19.5%), Utilities (58 | 16.9%), Health Care & Social Assistance (51 | 14.9%), Educational Services (43 | 12.5%), and Transportation & Warehousing (25 | 7.3%).
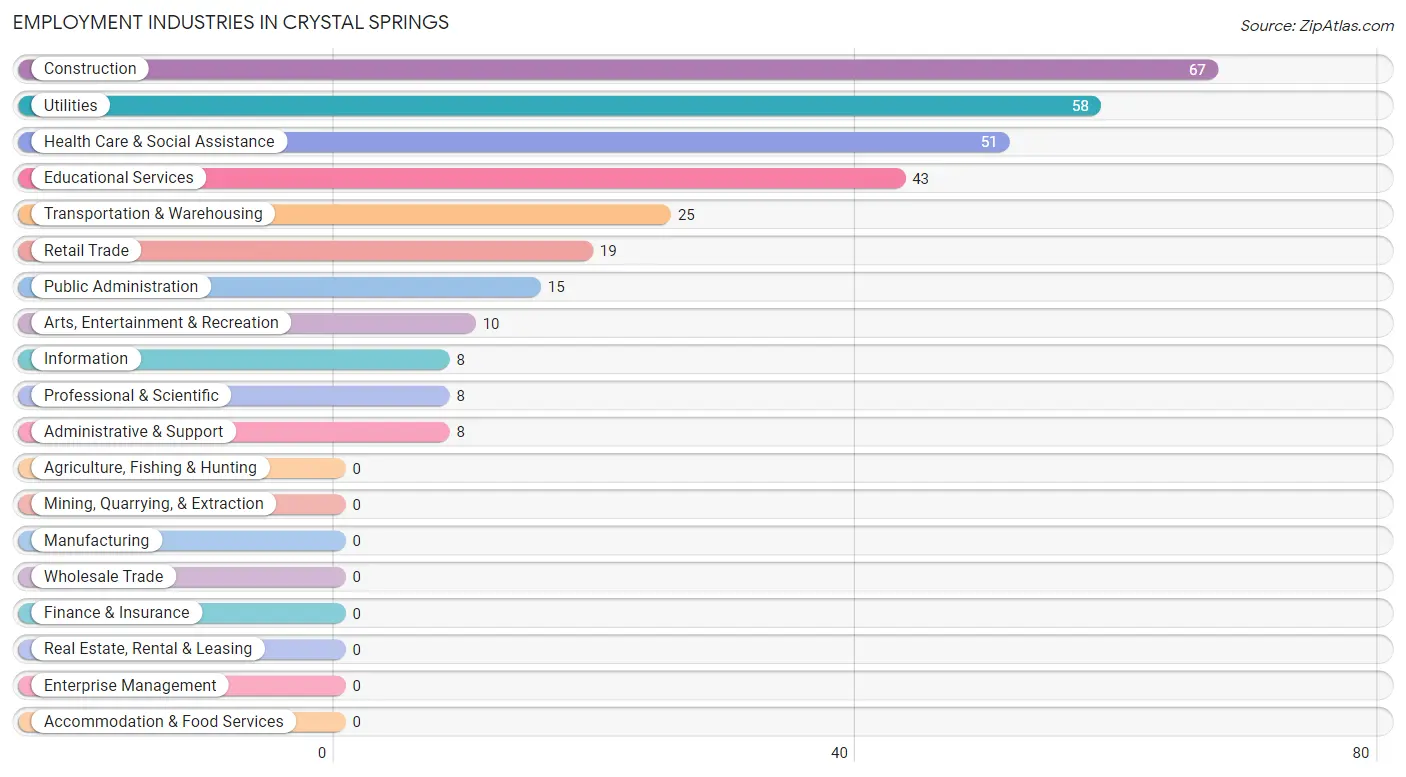
Employment Industries by Sex in Crystal Springs
The Crystal Springs industries that see more men than women are Utilities (100.0%), Information (100.0%), and Professional & Scientific (100.0%), whereas the industries that tend to have a higher number of women are Transportation & Warehousing (100.0%), Health Care & Social Assistance (100.0%), and Public Administration (100.0%).
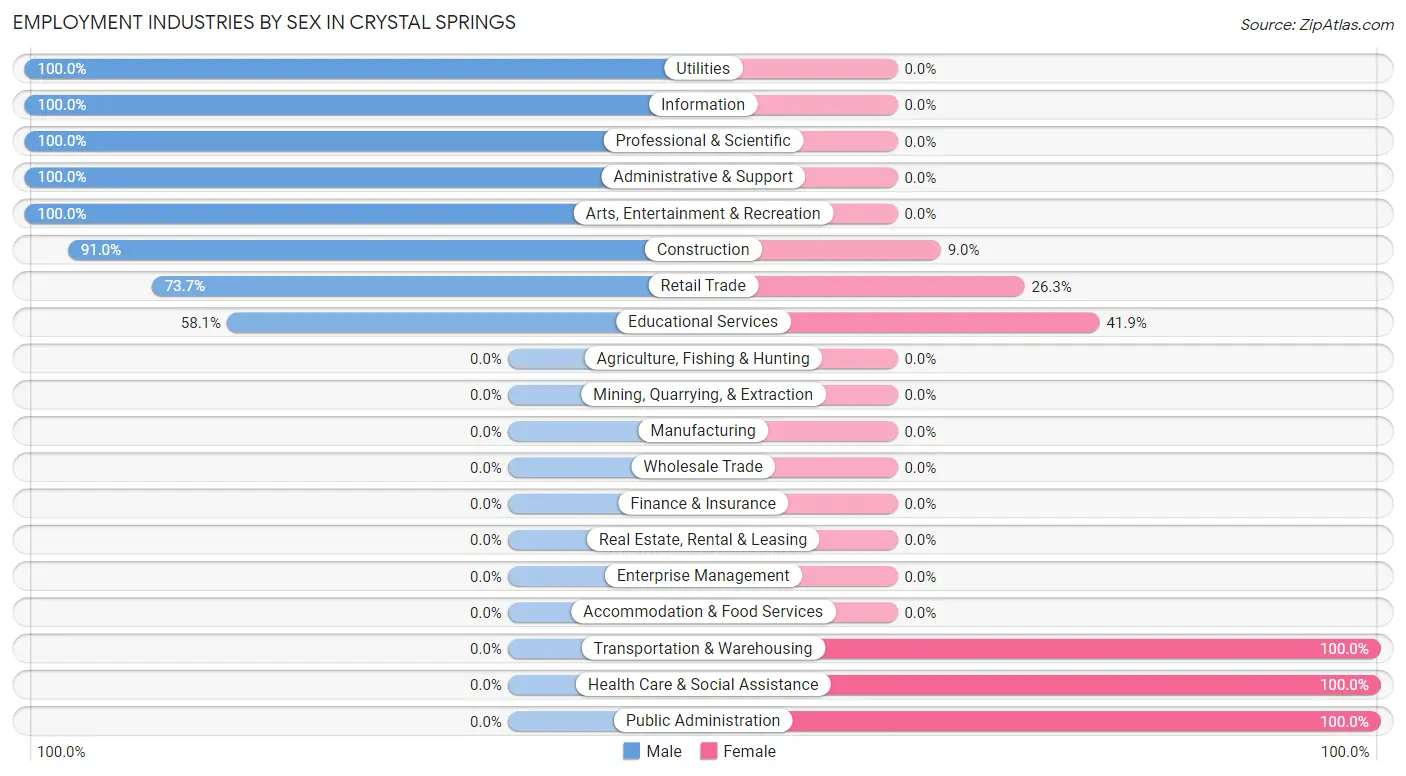
| Industry | Male | Female |
| Agriculture, Fishing & Hunting | 0 (0.0%) | 0 (0.0%) |
| Mining, Quarrying, & Extraction | 0 (0.0%) | 0 (0.0%) |
| Construction | 61 (91.0%) | 6 (9.0%) |
| Manufacturing | 0 (0.0%) | 0 (0.0%) |
| Wholesale Trade | 0 (0.0%) | 0 (0.0%) |
| Retail Trade | 14 (73.7%) | 5 (26.3%) |
| Transportation & Warehousing | 0 (0.0%) | 25 (100.0%) |
| Utilities | 58 (100.0%) | 0 (0.0%) |
| Information | 8 (100.0%) | 0 (0.0%) |
| Finance & Insurance | 0 (0.0%) | 0 (0.0%) |
| Real Estate, Rental & Leasing | 0 (0.0%) | 0 (0.0%) |
| Professional & Scientific | 8 (100.0%) | 0 (0.0%) |
| Enterprise Management | 0 (0.0%) | 0 (0.0%) |
| Administrative & Support | 8 (100.0%) | 0 (0.0%) |
| Educational Services | 25 (58.1%) | 18 (41.9%) |
| Health Care & Social Assistance | 0 (0.0%) | 51 (100.0%) |
| Arts, Entertainment & Recreation | 10 (100.0%) | 0 (0.0%) |
| Accommodation & Food Services | 0 (0.0%) | 0 (0.0%) |
| Public Administration | 0 (0.0%) | 15 (100.0%) |
| Total | 223 (65.0%) | 120 (35.0%) |
Education in Crystal Springs
School Enrollment in Crystal Springs
The most common levels of schooling among the 127 students in Crystal Springs are middle school (43 | 33.9%), high school (42 | 33.1%), and elementary school (15 | 11.8%).
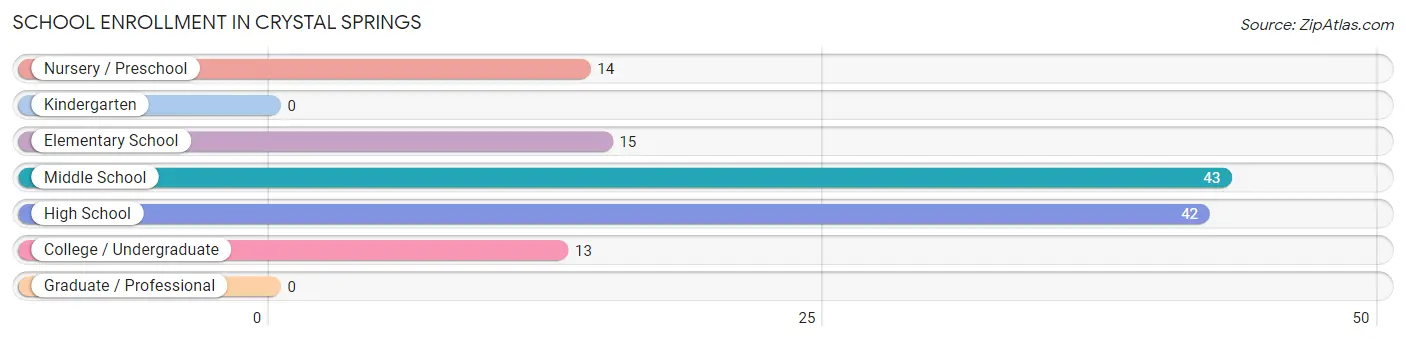
| School Level | # Students | % Students |
| Nursery / Preschool | 14 | 11.0% |
| Kindergarten | 0 | 0.0% |
| Elementary School | 15 | 11.8% |
| Middle School | 43 | 33.9% |
| High School | 42 | 33.1% |
| College / Undergraduate | 13 | 10.2% |
| Graduate / Professional | 0 | 0.0% |
| Total | 127 | 100.0% |
School Enrollment by Age by Funding Source in Crystal Springs
Out of a total of 127 students who are enrolled in schools in Crystal Springs, 13 (10.2%) attend a private institution, while the remaining 114 (89.8%) are enrolled in public schools. The age group of 20 to 24 year olds has the highest likelihood of being enrolled in private schools, with 13 (100.0% in the age bracket) enrolled. Conversely, the age group of 3 to 4 year olds has the lowest likelihood of being enrolled in a private school, with 8 (100.0% in the age bracket) attending a public institution.
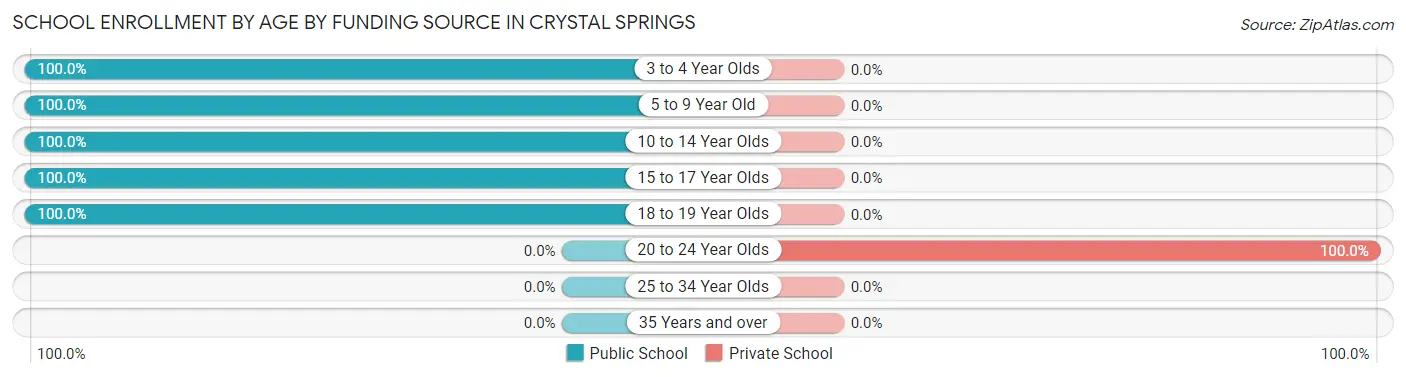
| Age Bracket | Public School | Private School |
| 3 to 4 Year Olds | 8 (100.0%) | 0 (0.0%) |
| 5 to 9 Year Old | 16 (100.0%) | 0 (0.0%) |
| 10 to 14 Year Olds | 48 (100.0%) | 0 (0.0%) |
| 15 to 17 Year Olds | 23 (100.0%) | 0 (0.0%) |
| 18 to 19 Year Olds | 19 (100.0%) | 0 (0.0%) |
| 20 to 24 Year Olds | 0 (0.0%) | 13 (100.0%) |
| 25 to 34 Year Olds | 0 (0.0%) | 0 (0.0%) |
| 35 Years and over | 0 (0.0%) | 0 (0.0%) |
| Total | 114 (89.8%) | 13 (10.2%) |
Educational Attainment by Field of Study in Crystal Springs
Science & technology (24 | 19.5%), visual & performing arts (20 | 16.3%), liberal arts & history (15 | 12.2%), business (14 | 11.4%), and computers & mathematics (12 | 9.8%) are the most common fields of study among 123 individuals in Crystal Springs who have obtained a bachelor's degree or higher.
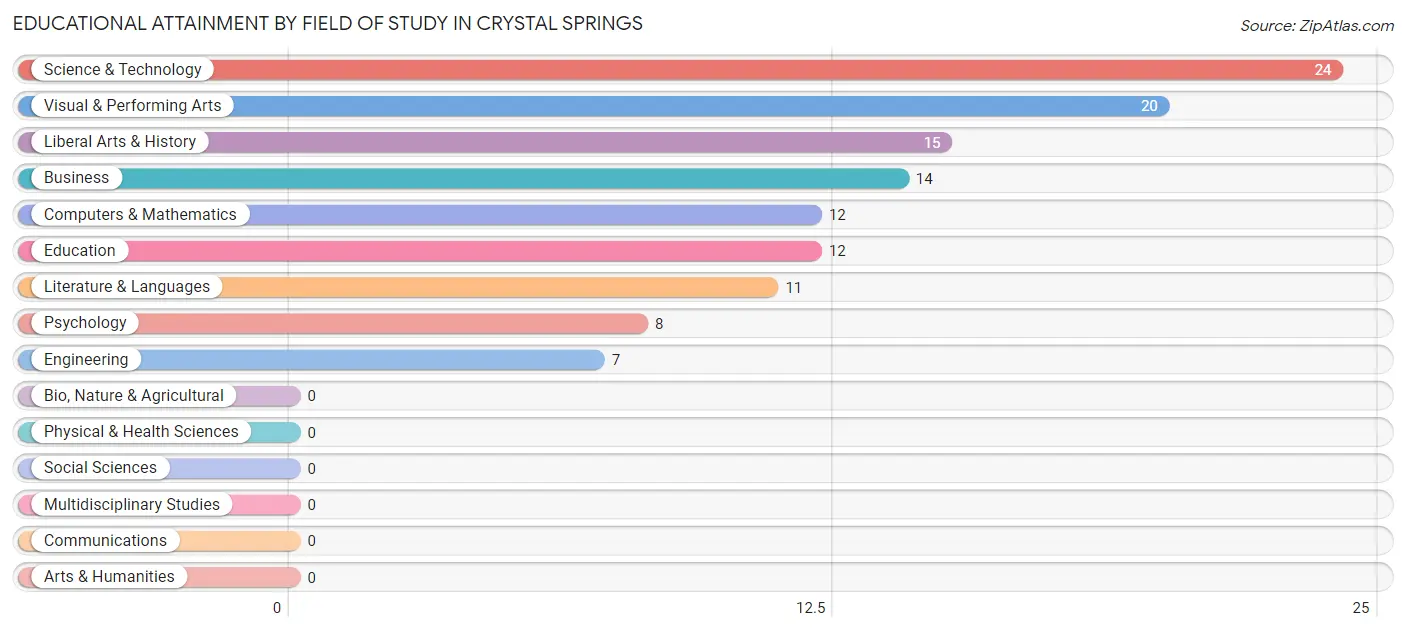
| Field of Study | # Graduates | % Graduates |
| Computers & Mathematics | 12 | 9.8% |
| Bio, Nature & Agricultural | 0 | 0.0% |
| Physical & Health Sciences | 0 | 0.0% |
| Psychology | 8 | 6.5% |
| Social Sciences | 0 | 0.0% |
| Engineering | 7 | 5.7% |
| Multidisciplinary Studies | 0 | 0.0% |
| Science & Technology | 24 | 19.5% |
| Business | 14 | 11.4% |
| Education | 12 | 9.8% |
| Literature & Languages | 11 | 8.9% |
| Liberal Arts & History | 15 | 12.2% |
| Visual & Performing Arts | 20 | 16.3% |
| Communications | 0 | 0.0% |
| Arts & Humanities | 0 | 0.0% |
| Total | 123 | 100.0% |
Transportation & Commute in Crystal Springs
Vehicle Availability by Sex in Crystal Springs
The most prevalent vehicle ownership categories in Crystal Springs are males with 2 vehicles (136, accounting for 61.0%) and females with 2 vehicles (42, making up 113.3%).
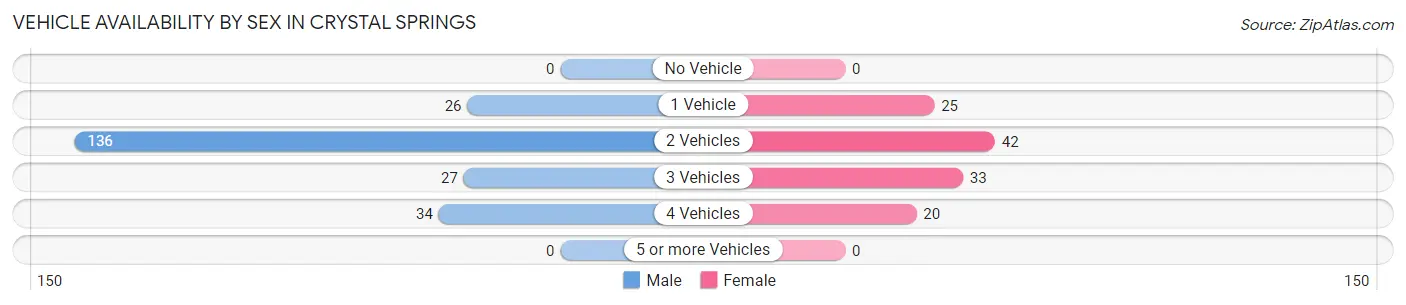
| Vehicles Available | Male | Female |
| No Vehicle | 0 (0.0%) | 0 (0.0%) |
| 1 Vehicle | 26 (11.7%) | 25 (20.8%) |
| 2 Vehicles | 136 (61.0%) | 42 (35.0%) |
| 3 Vehicles | 27 (12.1%) | 33 (27.5%) |
| 4 Vehicles | 34 (15.2%) | 20 (16.7%) |
| 5 or more Vehicles | 0 (0.0%) | 0 (0.0%) |
| Total | 223 (100.0%) | 120 (100.0%) |
Commute Time in Crystal Springs
The most frequently occuring commute durations in Crystal Springs are 10 to 14 minutes (71 commuters, 22.1%), 20 to 24 minutes (65 commuters, 20.3%), and 45 to 59 minutes (52 commuters, 16.2%).
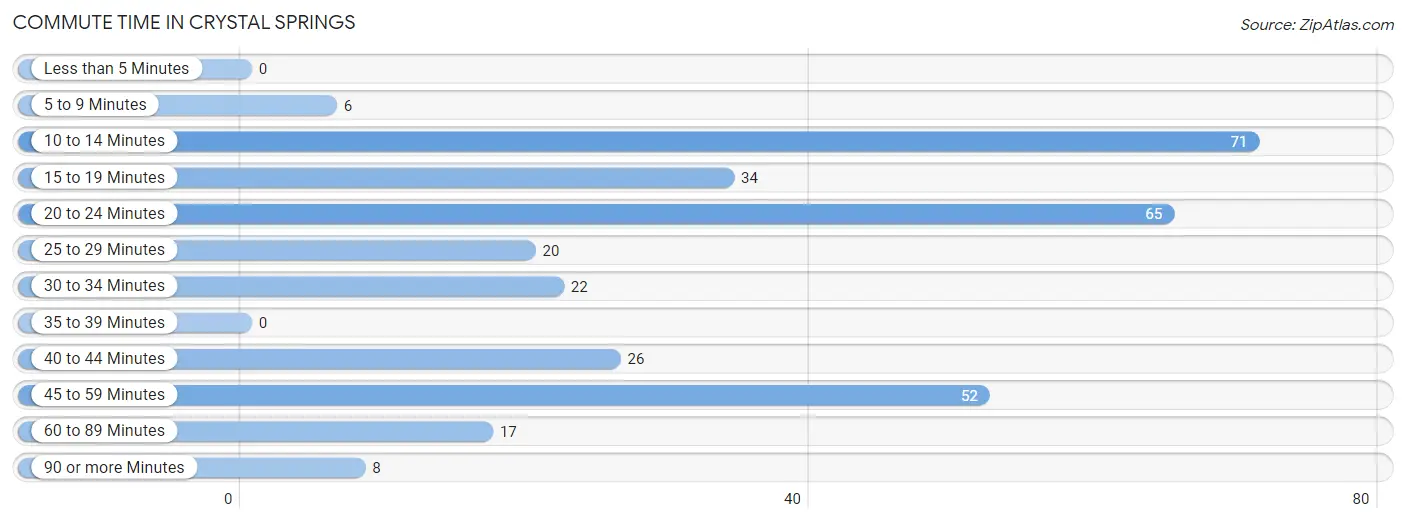
| Commute Time | # Commuters | % Commuters |
| Less than 5 Minutes | 0 | 0.0% |
| 5 to 9 Minutes | 6 | 1.9% |
| 10 to 14 Minutes | 71 | 22.1% |
| 15 to 19 Minutes | 34 | 10.6% |
| 20 to 24 Minutes | 65 | 20.3% |
| 25 to 29 Minutes | 20 | 6.2% |
| 30 to 34 Minutes | 22 | 6.9% |
| 35 to 39 Minutes | 0 | 0.0% |
| 40 to 44 Minutes | 26 | 8.1% |
| 45 to 59 Minutes | 52 | 16.2% |
| 60 to 89 Minutes | 17 | 5.3% |
| 90 or more Minutes | 8 | 2.5% |
Commute Time by Sex in Crystal Springs
The most common commute times in Crystal Springs are 10 to 14 minutes (49 commuters, 22.7%) for males and 15 to 19 minutes (34 commuters, 32.4%) for females.
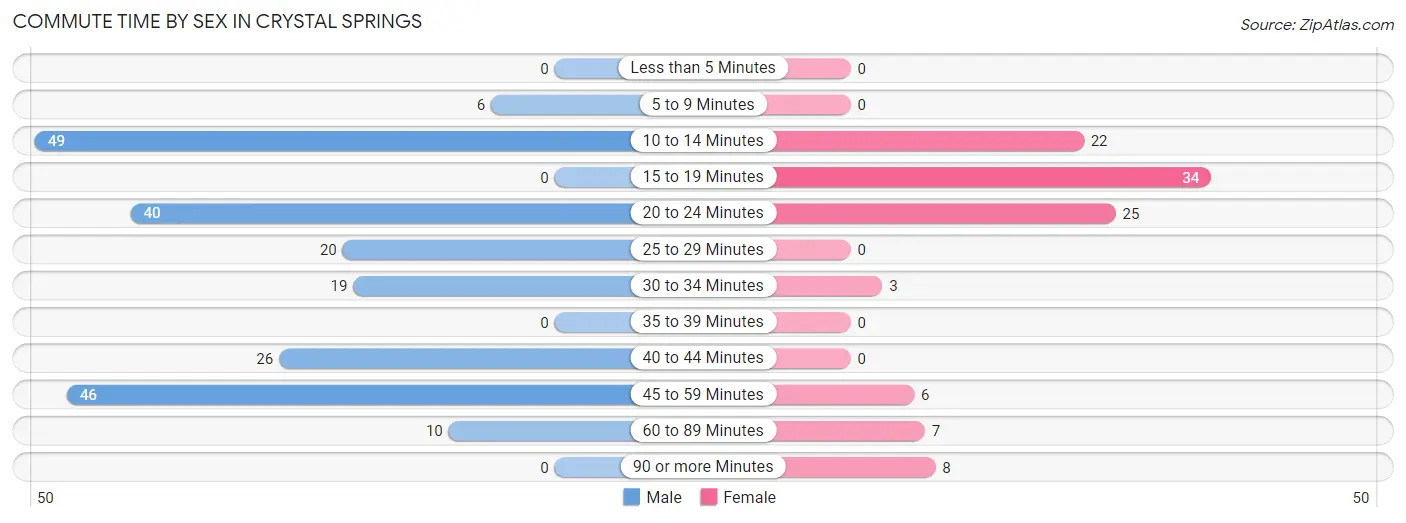
| Commute Time | Male | Female |
| Less than 5 Minutes | 0 (0.0%) | 0 (0.0%) |
| 5 to 9 Minutes | 6 (2.8%) | 0 (0.0%) |
| 10 to 14 Minutes | 49 (22.7%) | 22 (20.9%) |
| 15 to 19 Minutes | 0 (0.0%) | 34 (32.4%) |
| 20 to 24 Minutes | 40 (18.5%) | 25 (23.8%) |
| 25 to 29 Minutes | 20 (9.3%) | 0 (0.0%) |
| 30 to 34 Minutes | 19 (8.8%) | 3 (2.9%) |
| 35 to 39 Minutes | 0 (0.0%) | 0 (0.0%) |
| 40 to 44 Minutes | 26 (12.0%) | 0 (0.0%) |
| 45 to 59 Minutes | 46 (21.3%) | 6 (5.7%) |
| 60 to 89 Minutes | 10 (4.6%) | 7 (6.7%) |
| 90 or more Minutes | 0 (0.0%) | 8 (7.6%) |
Time of Departure to Work by Sex in Crystal Springs
The most frequent times of departure to work in Crystal Springs are 12:00 AM to 4:59 AM (98, 45.4%) for males and 6:30 AM to 6:59 AM (38, 36.2%) for females.
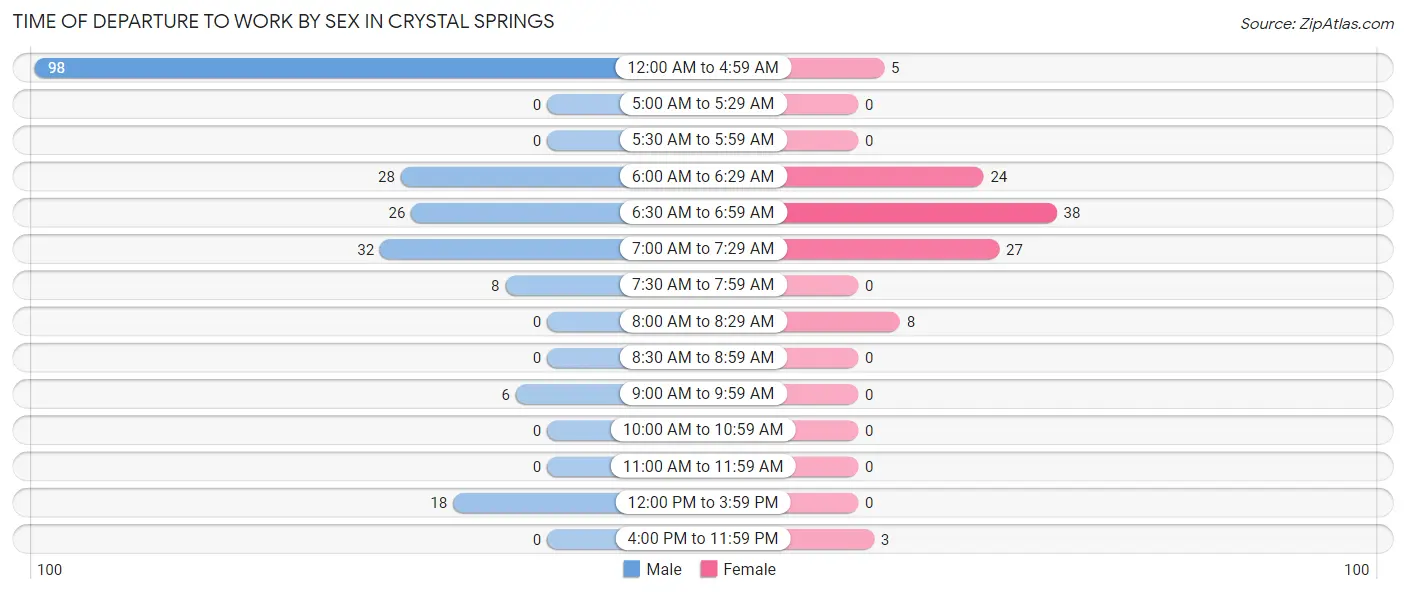
| Time of Departure | Male | Female |
| 12:00 AM to 4:59 AM | 98 (45.4%) | 5 (4.8%) |
| 5:00 AM to 5:29 AM | 0 (0.0%) | 0 (0.0%) |
| 5:30 AM to 5:59 AM | 0 (0.0%) | 0 (0.0%) |
| 6:00 AM to 6:29 AM | 28 (13.0%) | 24 (22.9%) |
| 6:30 AM to 6:59 AM | 26 (12.0%) | 38 (36.2%) |
| 7:00 AM to 7:29 AM | 32 (14.8%) | 27 (25.7%) |
| 7:30 AM to 7:59 AM | 8 (3.7%) | 0 (0.0%) |
| 8:00 AM to 8:29 AM | 0 (0.0%) | 8 (7.6%) |
| 8:30 AM to 8:59 AM | 0 (0.0%) | 0 (0.0%) |
| 9:00 AM to 9:59 AM | 6 (2.8%) | 0 (0.0%) |
| 10:00 AM to 10:59 AM | 0 (0.0%) | 0 (0.0%) |
| 11:00 AM to 11:59 AM | 0 (0.0%) | 0 (0.0%) |
| 12:00 PM to 3:59 PM | 18 (8.3%) | 0 (0.0%) |
| 4:00 PM to 11:59 PM | 0 (0.0%) | 3 (2.9%) |
| Total | 216 (100.0%) | 105 (100.0%) |
Housing Occupancy in Crystal Springs
Occupancy by Ownership in Crystal Springs
Of the total 445 dwellings in Crystal Springs, owner-occupied units account for 394 (88.5%), while renter-occupied units make up 51 (11.5%).
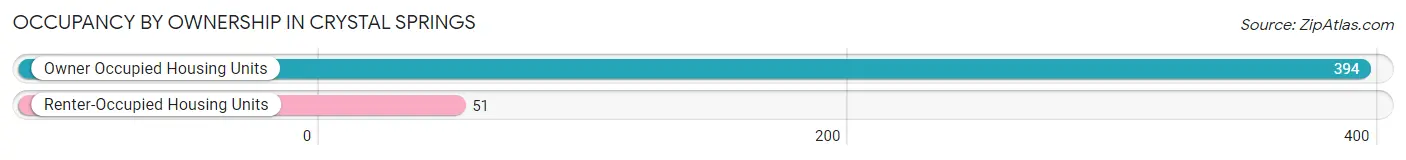
| Occupancy | # Housing Units | % Housing Units |
| Owner Occupied Housing Units | 394 | 88.5% |
| Renter-Occupied Housing Units | 51 | 11.5% |
| Total Occupied Housing Units | 445 | 100.0% |
Occupancy by Household Size in Crystal Springs
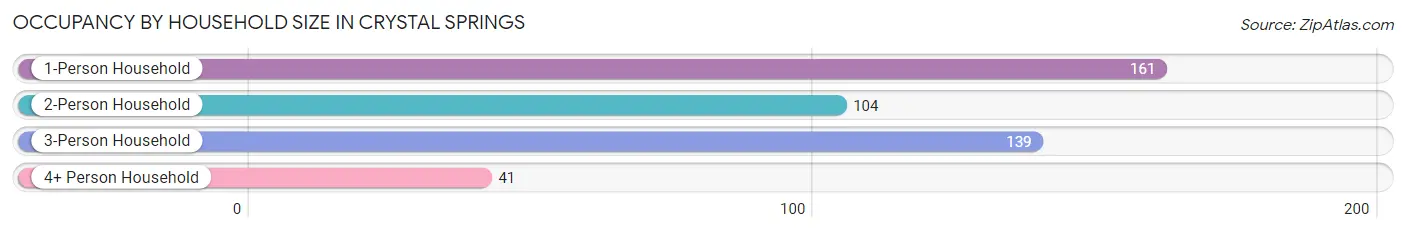
| Household Size | # Housing Units | % Housing Units |
| 1-Person Household | 161 | 36.2% |
| 2-Person Household | 104 | 23.4% |
| 3-Person Household | 139 | 31.2% |
| 4+ Person Household | 41 | 9.2% |
| Total Housing Units | 445 | 100.0% |
Occupancy by Ownership by Household Size in Crystal Springs
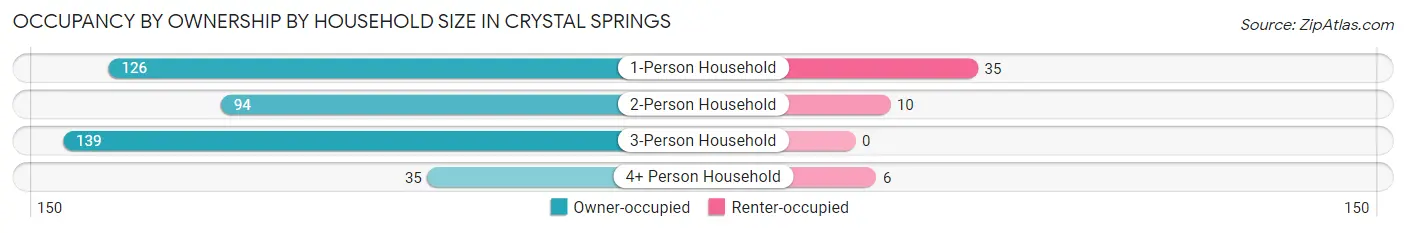
| Household Size | Owner-occupied | Renter-occupied |
| 1-Person Household | 126 (78.3%) | 35 (21.7%) |
| 2-Person Household | 94 (90.4%) | 10 (9.6%) |
| 3-Person Household | 139 (100.0%) | 0 (0.0%) |
| 4+ Person Household | 35 (85.4%) | 6 (14.6%) |
| Total Housing Units | 394 (88.5%) | 51 (11.5%) |
Occupancy by Educational Attainment in Crystal Springs
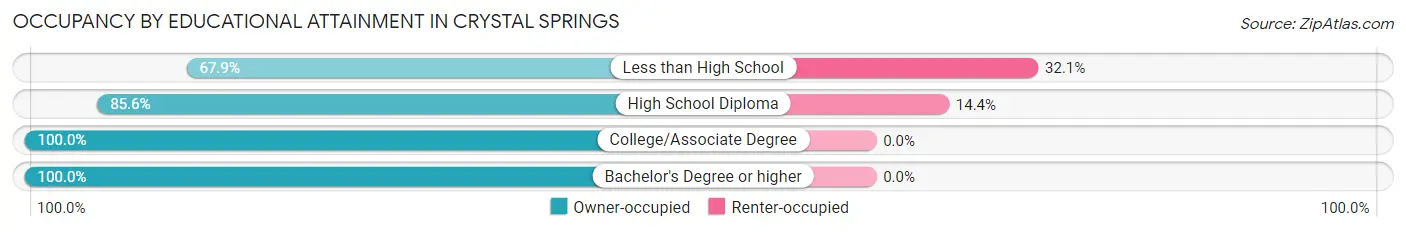
| Household Size | Owner-occupied | Renter-occupied |
| Less than High School | 74 (67.9%) | 35 (32.1%) |
| High School Diploma | 95 (85.6%) | 16 (14.4%) |
| College/Associate Degree | 151 (100.0%) | 0 (0.0%) |
| Bachelor's Degree or higher | 74 (100.0%) | 0 (0.0%) |
Occupancy by Age of Householder in Crystal Springs
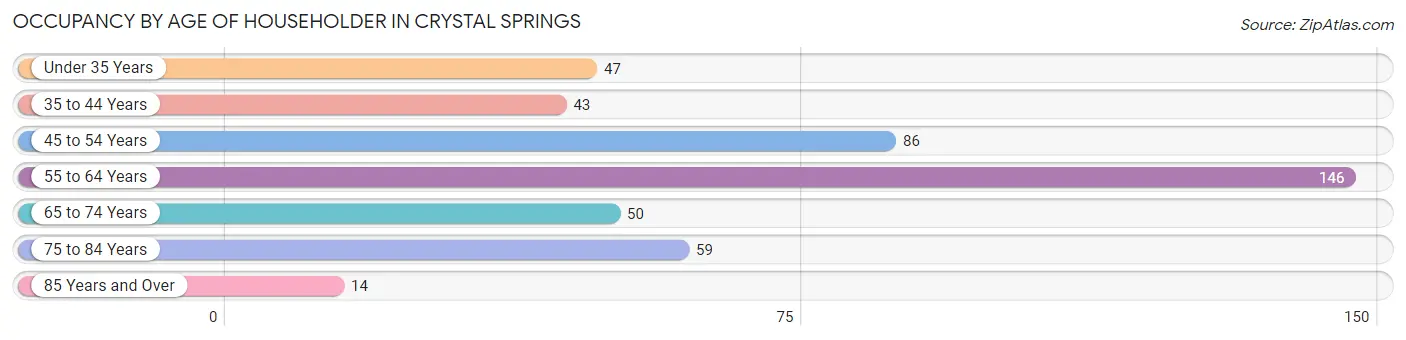
| Age Bracket | # Households | % Households |
| Under 35 Years | 47 | 10.6% |
| 35 to 44 Years | 43 | 9.7% |
| 45 to 54 Years | 86 | 19.3% |
| 55 to 64 Years | 146 | 32.8% |
| 65 to 74 Years | 50 | 11.2% |
| 75 to 84 Years | 59 | 13.3% |
| 85 Years and Over | 14 | 3.2% |
| Total | 445 | 100.0% |
Housing Finances in Crystal Springs
Median Income by Occupancy in Crystal Springs
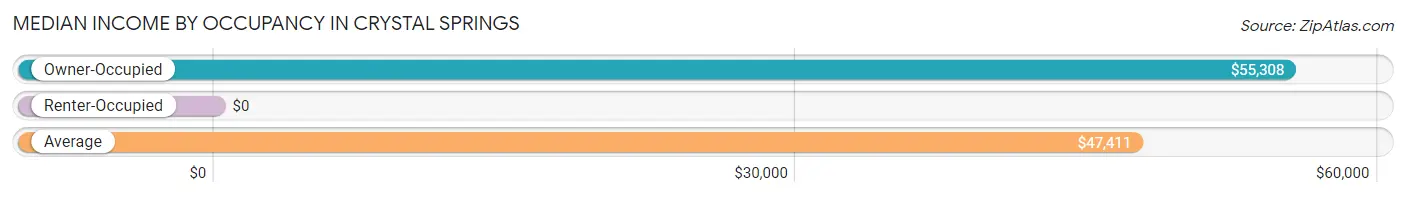
| Occupancy Type | # Households | Median Income |
| Owner-Occupied | 394 (88.5%) | $55,308 |
| Renter-Occupied | 51 (11.5%) | $0 |
| Average | 445 (100.0%) | $47,411 |
Occupancy by Householder Income Bracket in Crystal Springs
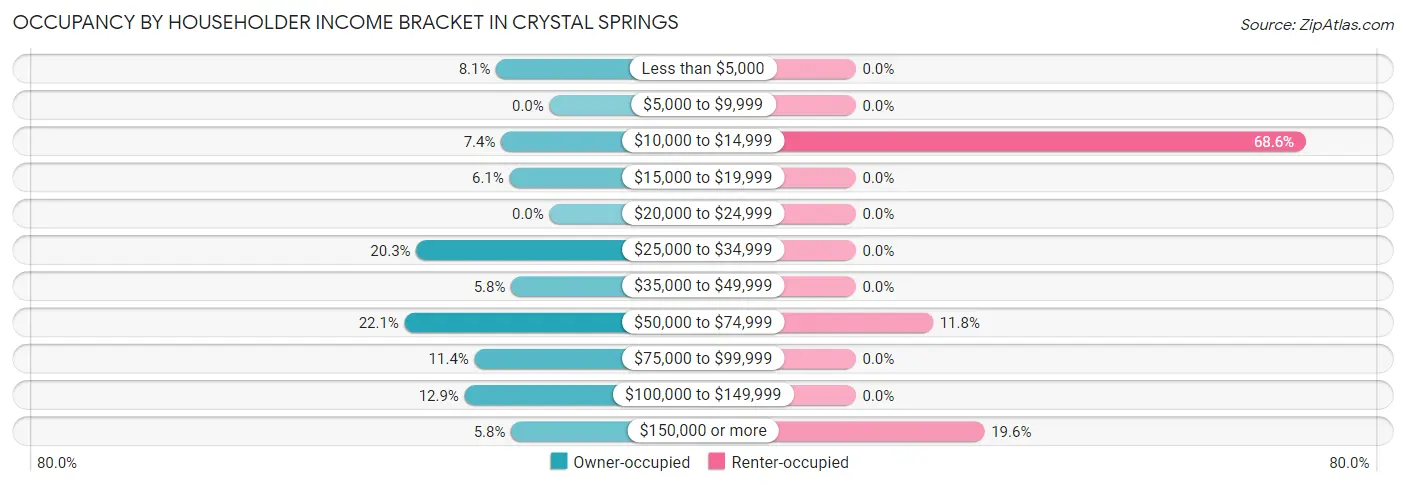
| Income Bracket | Owner-occupied | Renter-occupied |
| Less than $5,000 | 32 (8.1%) | 0 (0.0%) |
| $5,000 to $9,999 | 0 (0.0%) | 0 (0.0%) |
| $10,000 to $14,999 | 29 (7.4%) | 35 (68.6%) |
| $15,000 to $19,999 | 24 (6.1%) | 0 (0.0%) |
| $20,000 to $24,999 | 0 (0.0%) | 0 (0.0%) |
| $25,000 to $34,999 | 80 (20.3%) | 0 (0.0%) |
| $35,000 to $49,999 | 23 (5.8%) | 0 (0.0%) |
| $50,000 to $74,999 | 87 (22.1%) | 6 (11.8%) |
| $75,000 to $99,999 | 45 (11.4%) | 0 (0.0%) |
| $100,000 to $149,999 | 51 (12.9%) | 0 (0.0%) |
| $150,000 or more | 23 (5.8%) | 10 (19.6%) |
| Total | 394 (100.0%) | 51 (100.0%) |
Monthly Housing Cost Tiers in Crystal Springs
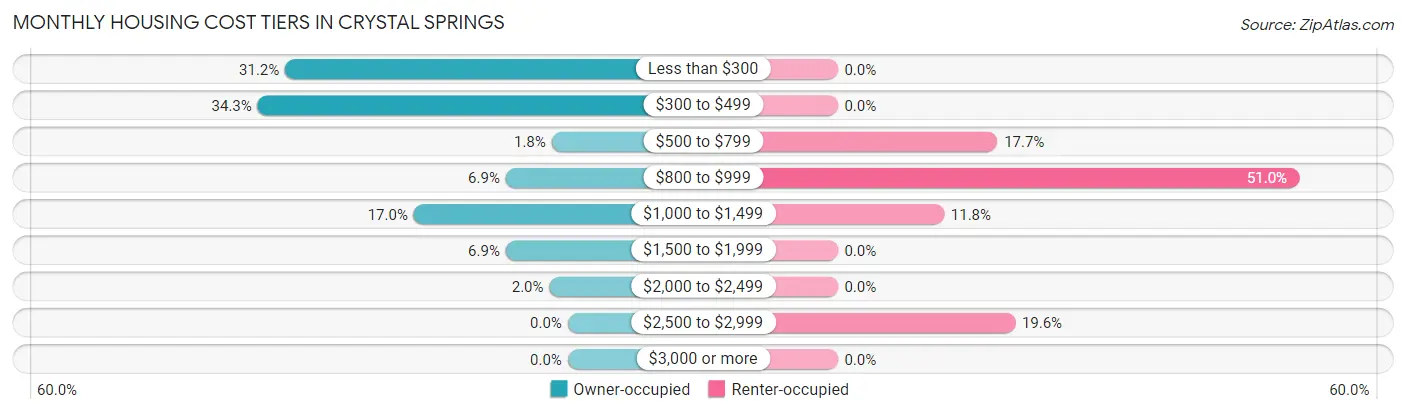
| Monthly Cost | Owner-occupied | Renter-occupied |
| Less than $300 | 123 (31.2%) | 0 (0.0%) |
| $300 to $499 | 135 (34.3%) | 0 (0.0%) |
| $500 to $799 | 7 (1.8%) | 9 (17.6%) |
| $800 to $999 | 27 (6.9%) | 26 (51.0%) |
| $1,000 to $1,499 | 67 (17.0%) | 6 (11.8%) |
| $1,500 to $1,999 | 27 (6.9%) | 0 (0.0%) |
| $2,000 to $2,499 | 8 (2.0%) | 0 (0.0%) |
| $2,500 to $2,999 | 0 (0.0%) | 10 (19.6%) |
| $3,000 or more | 0 (0.0%) | 0 (0.0%) |
| Total | 394 (100.0%) | 51 (100.0%) |
Physical Housing Characteristics in Crystal Springs
Housing Structures in Crystal Springs
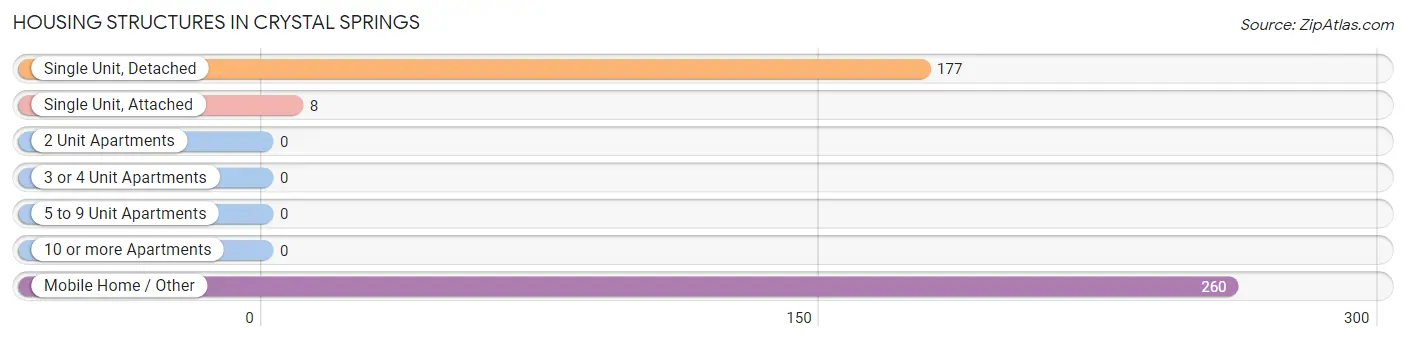
| Structure Type | # Housing Units | % Housing Units |
| Single Unit, Detached | 177 | 39.8% |
| Single Unit, Attached | 8 | 1.8% |
| 2 Unit Apartments | 0 | 0.0% |
| 3 or 4 Unit Apartments | 0 | 0.0% |
| 5 to 9 Unit Apartments | 0 | 0.0% |
| 10 or more Apartments | 0 | 0.0% |
| Mobile Home / Other | 260 | 58.4% |
| Total | 445 | 100.0% |
Housing Structures by Occupancy in Crystal Springs
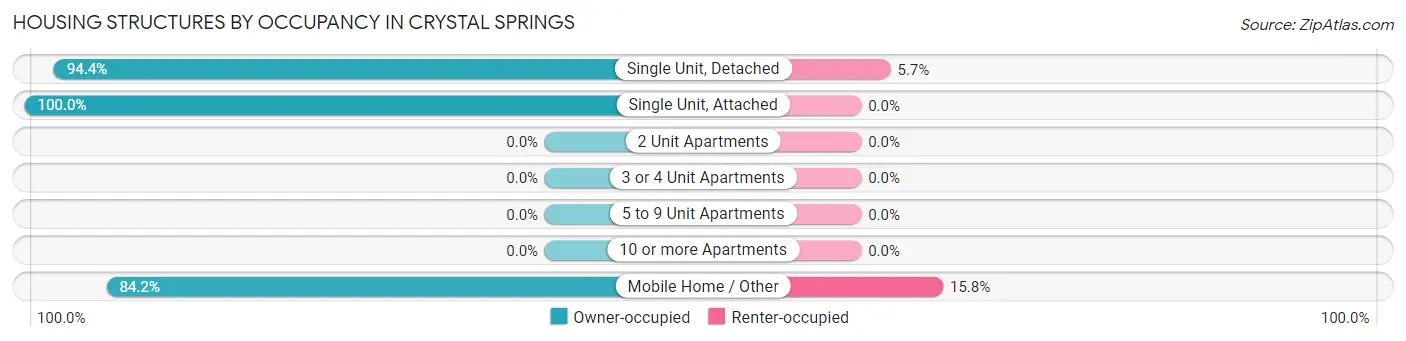
| Structure Type | Owner-occupied | Renter-occupied |
| Single Unit, Detached | 167 (94.4%) | 10 (5.7%) |
| Single Unit, Attached | 8 (100.0%) | 0 (0.0%) |
| 2 Unit Apartments | 0 (0.0%) | 0 (0.0%) |
| 3 or 4 Unit Apartments | 0 (0.0%) | 0 (0.0%) |
| 5 to 9 Unit Apartments | 0 (0.0%) | 0 (0.0%) |
| 10 or more Apartments | 0 (0.0%) | 0 (0.0%) |
| Mobile Home / Other | 219 (84.2%) | 41 (15.8%) |
| Total | 394 (88.5%) | 51 (11.5%) |
Housing Structures by Number of Rooms in Crystal Springs
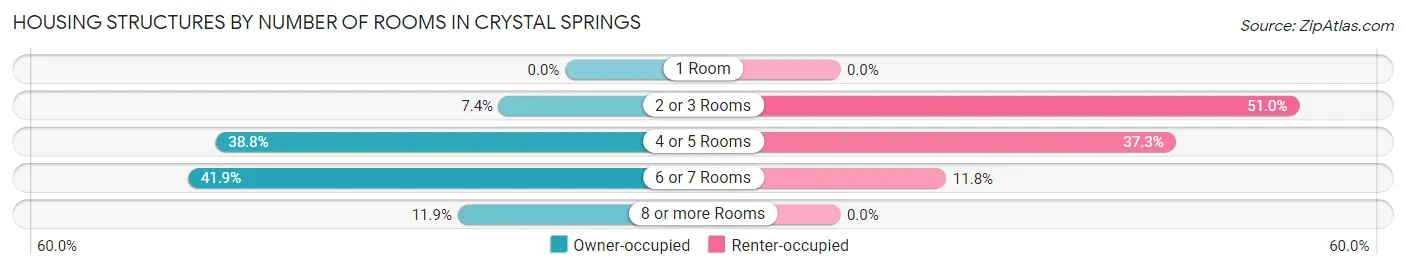
| Number of Rooms | Owner-occupied | Renter-occupied |
| 1 Room | 0 (0.0%) | 0 (0.0%) |
| 2 or 3 Rooms | 29 (7.4%) | 26 (51.0%) |
| 4 or 5 Rooms | 153 (38.8%) | 19 (37.2%) |
| 6 or 7 Rooms | 165 (41.9%) | 6 (11.8%) |
| 8 or more Rooms | 47 (11.9%) | 0 (0.0%) |
| Total | 394 (100.0%) | 51 (100.0%) |
Housing Structure by Heating Type in Crystal Springs
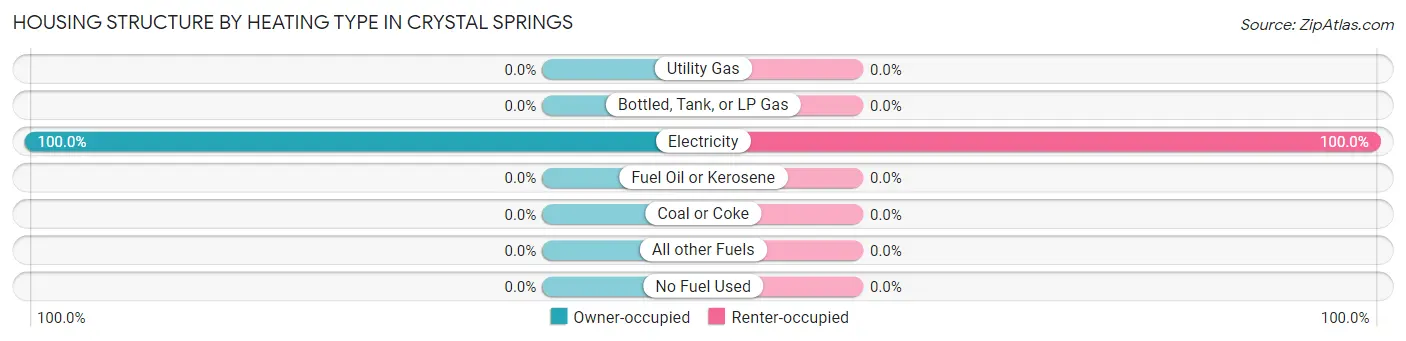
| Heating Type | Owner-occupied | Renter-occupied |
| Utility Gas | 0 (0.0%) | 0 (0.0%) |
| Bottled, Tank, or LP Gas | 0 (0.0%) | 0 (0.0%) |
| Electricity | 394 (100.0%) | 51 (100.0%) |
| Fuel Oil or Kerosene | 0 (0.0%) | 0 (0.0%) |
| Coal or Coke | 0 (0.0%) | 0 (0.0%) |
| All other Fuels | 0 (0.0%) | 0 (0.0%) |
| No Fuel Used | 0 (0.0%) | 0 (0.0%) |
| Total | 394 (100.0%) | 51 (100.0%) |
Household Vehicle Usage in Crystal Springs
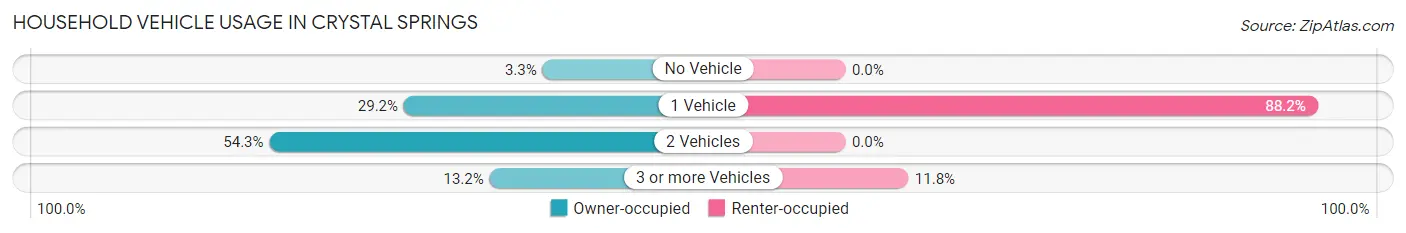
| Vehicles per Household | Owner-occupied | Renter-occupied |
| No Vehicle | 13 (3.3%) | 0 (0.0%) |
| 1 Vehicle | 115 (29.2%) | 45 (88.2%) |
| 2 Vehicles | 214 (54.3%) | 0 (0.0%) |
| 3 or more Vehicles | 52 (13.2%) | 6 (11.8%) |
| Total | 394 (100.0%) | 51 (100.0%) |
Real Estate & Mortgages in Crystal Springs
Real Estate and Mortgage Overview in Crystal Springs
| Characteristic | Without Mortgage | With Mortgage |
| Housing Units | 295 | 99 |
| Median Property Value | $128,700 | $139,800 |
| Median Household Income | $41,528 | $0 |
| Monthly Housing Costs | $312 | $0 |
| Real Estate Taxes | $702 | $0 |
Property Value by Mortgage Status in Crystal Springs
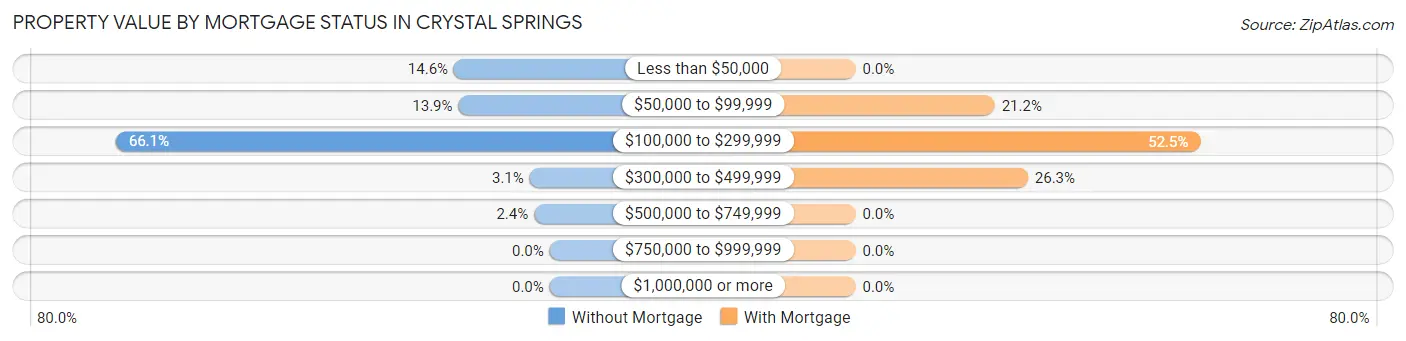
| Property Value | Without Mortgage | With Mortgage |
| Less than $50,000 | 43 (14.6%) | 0 (0.0%) |
| $50,000 to $99,999 | 41 (13.9%) | 21 (21.2%) |
| $100,000 to $299,999 | 195 (66.1%) | 52 (52.5%) |
| $300,000 to $499,999 | 9 (3.0%) | 26 (26.3%) |
| $500,000 to $749,999 | 7 (2.4%) | 0 (0.0%) |
| $750,000 to $999,999 | 0 (0.0%) | 0 (0.0%) |
| $1,000,000 or more | 0 (0.0%) | 0 (0.0%) |
| Total | 295 (100.0%) | 99 (100.0%) |
Household Income by Mortgage Status in Crystal Springs
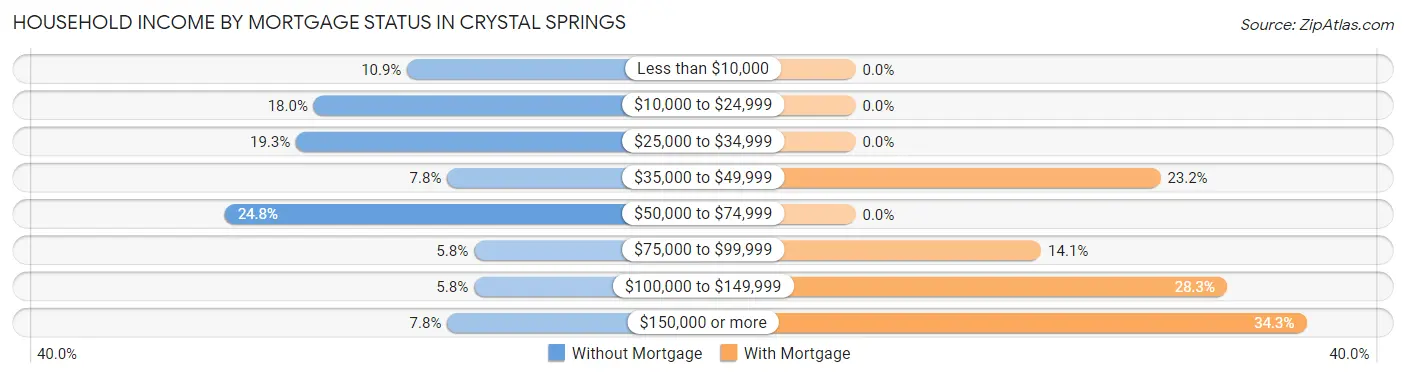
| Household Income | Without Mortgage | With Mortgage |
| Less than $10,000 | 32 (10.8%) | 0 (0.0%) |
| $10,000 to $24,999 | 53 (18.0%) | 0 (0.0%) |
| $25,000 to $34,999 | 57 (19.3%) | 0 (0.0%) |
| $35,000 to $49,999 | 23 (7.8%) | 23 (23.2%) |
| $50,000 to $74,999 | 73 (24.7%) | 0 (0.0%) |
| $75,000 to $99,999 | 17 (5.8%) | 14 (14.1%) |
| $100,000 to $149,999 | 17 (5.8%) | 28 (28.3%) |
| $150,000 or more | 23 (7.8%) | 34 (34.3%) |
| Total | 295 (100.0%) | 99 (100.0%) |
Property Value to Household Income Ratio in Crystal Springs
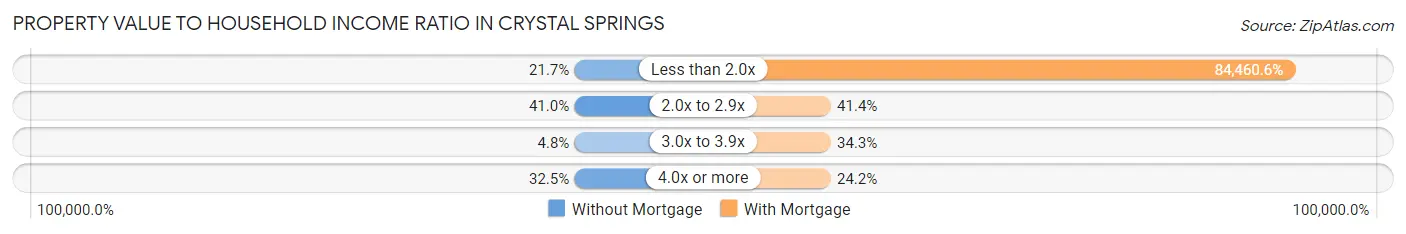
| Value-to-Income Ratio | Without Mortgage | With Mortgage |
| Less than 2.0x | 64 (21.7%) | 83,616 (84,460.6%) |
| 2.0x to 2.9x | 121 (41.0%) | 41 (41.4%) |
| 3.0x to 3.9x | 14 (4.8%) | 34 (34.3%) |
| 4.0x or more | 96 (32.5%) | 24 (24.2%) |
| Total | 295 (100.0%) | 99 (100.0%) |
Real Estate Taxes by Mortgage Status in Crystal Springs
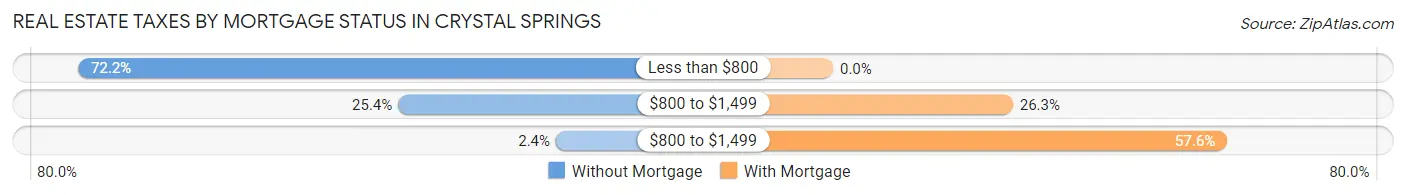
| Property Taxes | Without Mortgage | With Mortgage |
| Less than $800 | 213 (72.2%) | 0 (0.0%) |
| $800 to $1,499 | 75 (25.4%) | 26 (26.3%) |
| $800 to $1,499 | 7 (2.4%) | 57 (57.6%) |
| Total | 295 (100.0%) | 99 (100.0%) |
Health & Disability in Crystal Springs
Health Insurance Coverage by Age in Crystal Springs
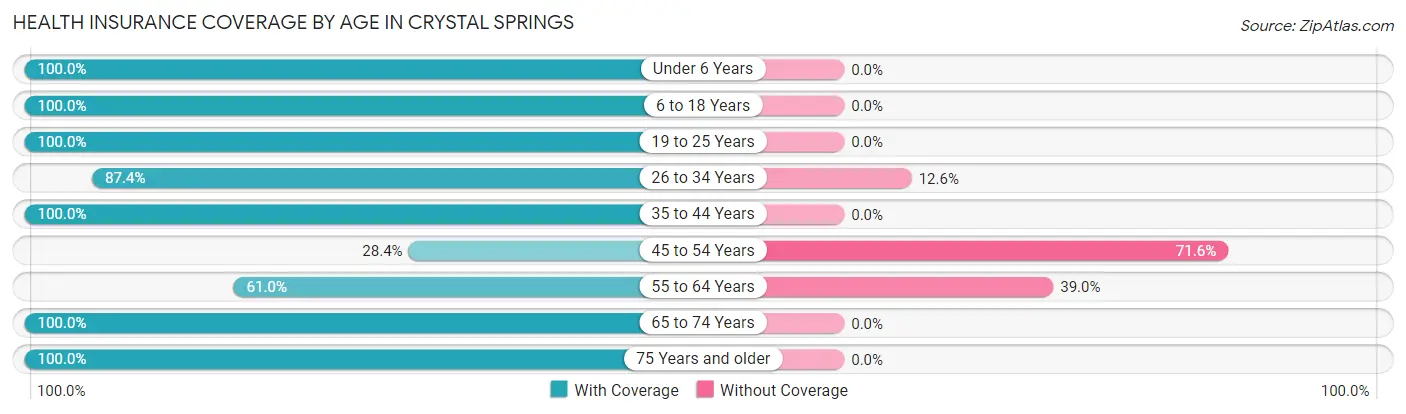
| Age Bracket | With Coverage | Without Coverage |
| Under 6 Years | 67 (100.0%) | 0 (0.0%) |
| 6 to 18 Years | 100 (100.0%) | 0 (0.0%) |
| 19 to 25 Years | 21 (100.0%) | 0 (0.0%) |
| 26 to 34 Years | 132 (87.4%) | 19 (12.6%) |
| 35 to 44 Years | 105 (100.0%) | 0 (0.0%) |
| 45 to 54 Years | 29 (28.4%) | 73 (71.6%) |
| 55 to 64 Years | 144 (61.0%) | 92 (39.0%) |
| 65 to 74 Years | 67 (100.0%) | 0 (0.0%) |
| 75 Years and older | 124 (100.0%) | 0 (0.0%) |
| Total | 789 (81.1%) | 184 (18.9%) |
Health Insurance Coverage by Citizenship Status in Crystal Springs
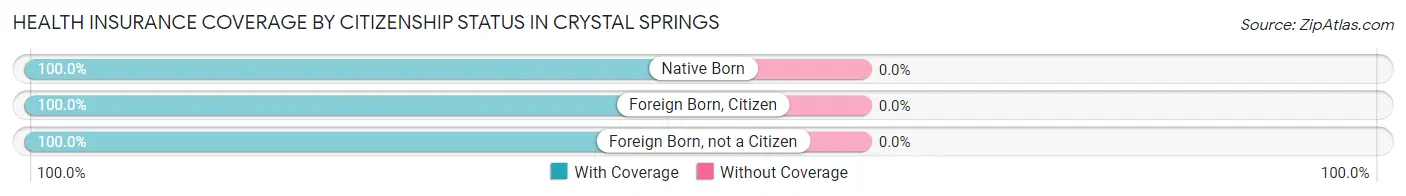
| Citizenship Status | With Coverage | Without Coverage |
| Native Born | 67 (100.0%) | 0 (0.0%) |
| Foreign Born, Citizen | 100 (100.0%) | 0 (0.0%) |
| Foreign Born, not a Citizen | 21 (100.0%) | 0 (0.0%) |
Health Insurance Coverage by Household Income in Crystal Springs
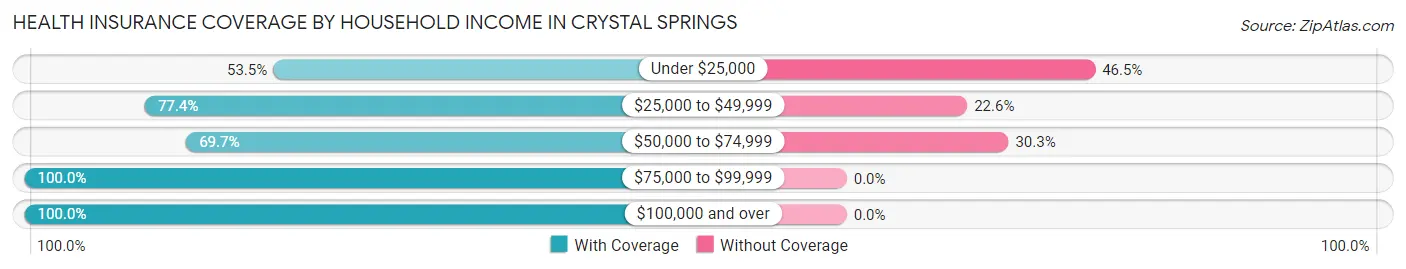
| Household Income | With Coverage | Without Coverage |
| Under $25,000 | 85 (53.5%) | 74 (46.5%) |
| $25,000 to $49,999 | 127 (77.4%) | 37 (22.6%) |
| $50,000 to $74,999 | 168 (69.7%) | 73 (30.3%) |
| $75,000 to $99,999 | 178 (100.0%) | 0 (0.0%) |
| $100,000 and over | 231 (100.0%) | 0 (0.0%) |
Public vs Private Health Insurance Coverage by Age in Crystal Springs
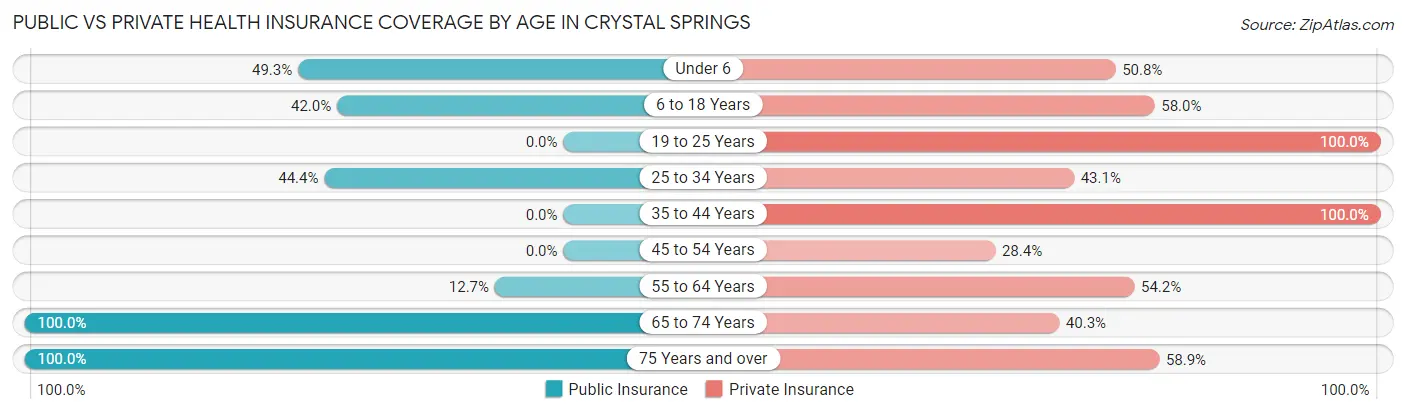
| Age Bracket | Public Insurance | Private Insurance |
| Under 6 | 33 (49.2%) | 34 (50.7%) |
| 6 to 18 Years | 42 (42.0%) | 58 (58.0%) |
| 19 to 25 Years | 0 (0.0%) | 21 (100.0%) |
| 25 to 34 Years | 67 (44.4%) | 65 (43.0%) |
| 35 to 44 Years | 0 (0.0%) | 105 (100.0%) |
| 45 to 54 Years | 0 (0.0%) | 29 (28.4%) |
| 55 to 64 Years | 30 (12.7%) | 128 (54.2%) |
| 65 to 74 Years | 67 (100.0%) | 27 (40.3%) |
| 75 Years and over | 124 (100.0%) | 73 (58.9%) |
| Total | 363 (37.3%) | 540 (55.5%) |
Disability Status by Sex by Age in Crystal Springs
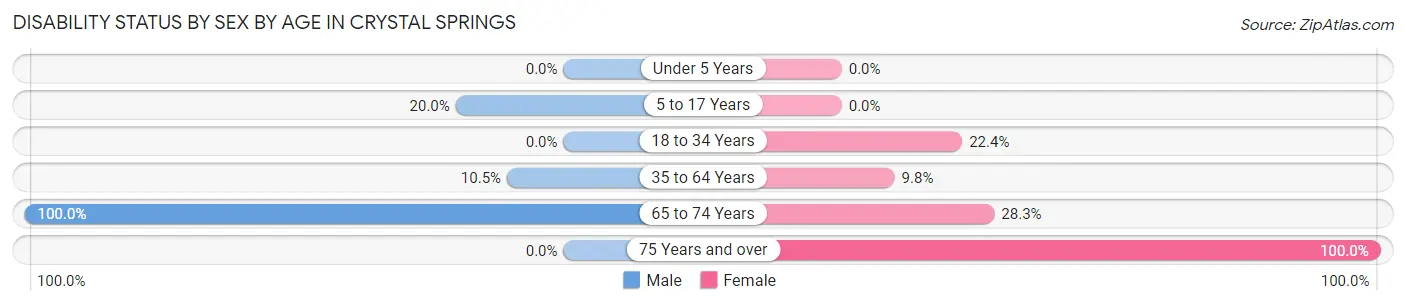
| Age Bracket | Male | Female |
| Under 5 Years | 0 (0.0%) | 0 (0.0%) |
| 5 to 17 Years | 10 (20.0%) | 0 (0.0%) |
| 18 to 34 Years | 0 (0.0%) | 19 (22.4%) |
| 35 to 64 Years | 24 (10.5%) | 21 (9.8%) |
| 65 to 74 Years | 7 (100.0%) | 17 (28.3%) |
| 75 Years and over | 0 (0.0%) | 59 (100.0%) |
Disability Class by Sex by Age in Crystal Springs
Disability Class: Hearing Difficulty
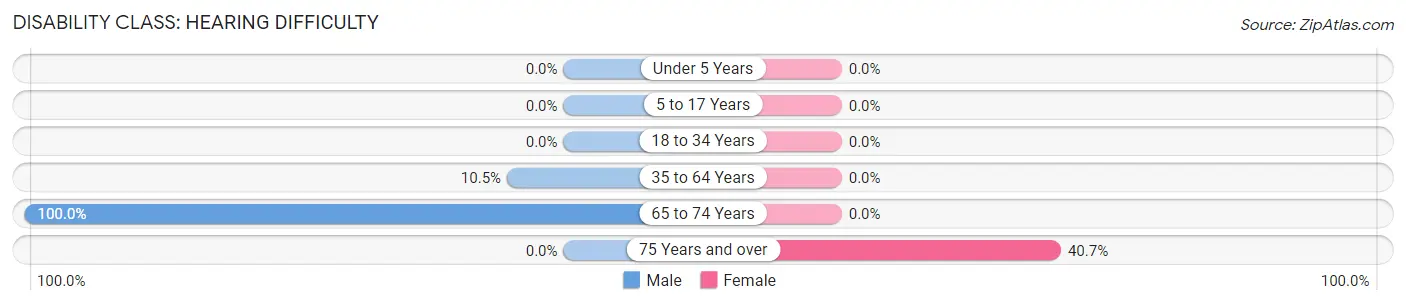
| Age Bracket | Male | Female |
| Under 5 Years | 0 (0.0%) | 0 (0.0%) |
| 5 to 17 Years | 0 (0.0%) | 0 (0.0%) |
| 18 to 34 Years | 0 (0.0%) | 0 (0.0%) |
| 35 to 64 Years | 24 (10.5%) | 0 (0.0%) |
| 65 to 74 Years | 7 (100.0%) | 0 (0.0%) |
| 75 Years and over | 0 (0.0%) | 24 (40.7%) |
Disability Class: Vision Difficulty
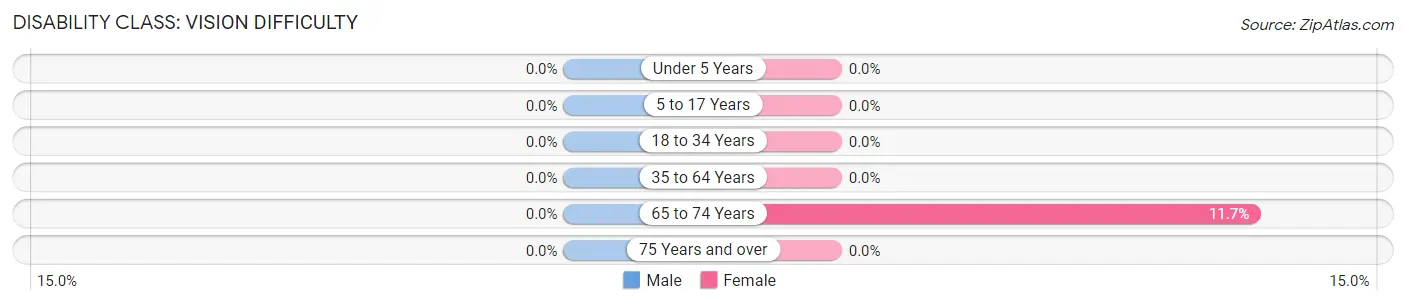
| Age Bracket | Male | Female |
| Under 5 Years | 0 (0.0%) | 0 (0.0%) |
| 5 to 17 Years | 0 (0.0%) | 0 (0.0%) |
| 18 to 34 Years | 0 (0.0%) | 0 (0.0%) |
| 35 to 64 Years | 0 (0.0%) | 0 (0.0%) |
| 65 to 74 Years | 0 (0.0%) | 7 (11.7%) |
| 75 Years and over | 0 (0.0%) | 0 (0.0%) |
Disability Class: Cognitive Difficulty
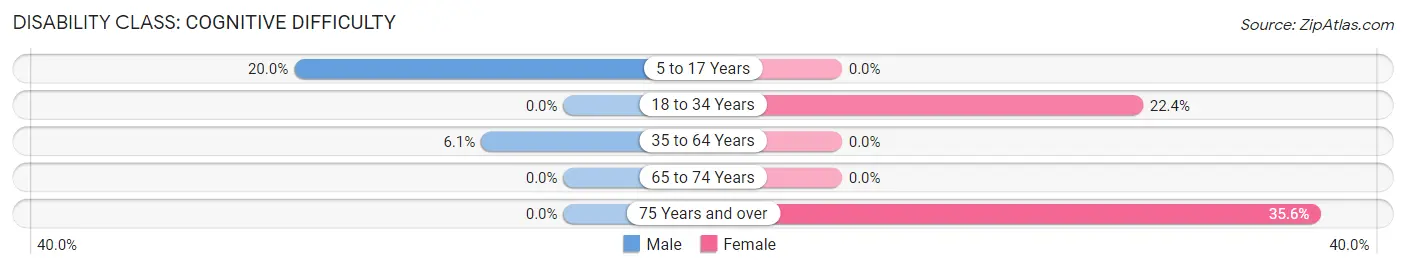
| Age Bracket | Male | Female |
| 5 to 17 Years | 10 (20.0%) | 0 (0.0%) |
| 18 to 34 Years | 0 (0.0%) | 19 (22.4%) |
| 35 to 64 Years | 14 (6.1%) | 0 (0.0%) |
| 65 to 74 Years | 0 (0.0%) | 0 (0.0%) |
| 75 Years and over | 0 (0.0%) | 21 (35.6%) |
Disability Class: Ambulatory Difficulty
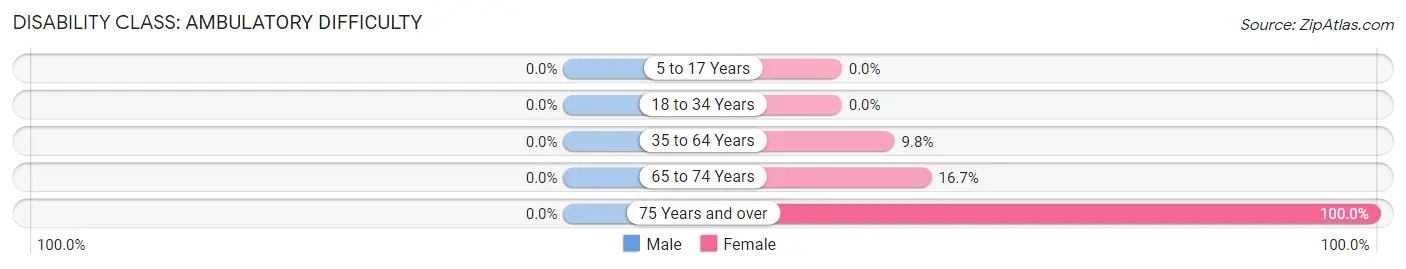
| Age Bracket | Male | Female |
| 5 to 17 Years | 0 (0.0%) | 0 (0.0%) |
| 18 to 34 Years | 0 (0.0%) | 0 (0.0%) |
| 35 to 64 Years | 0 (0.0%) | 21 (9.8%) |
| 65 to 74 Years | 0 (0.0%) | 10 (16.7%) |
| 75 Years and over | 0 (0.0%) | 59 (100.0%) |
Disability Class: Self-Care Difficulty
| Age Bracket | Male | Female |
| 5 to 17 Years | 0 (0.0%) | 0 (0.0%) |
| 18 to 34 Years | 0 (0.0%) | 0 (0.0%) |
| 35 to 64 Years | 0 (0.0%) | 0 (0.0%) |
| 65 to 74 Years | 0 (0.0%) | 0 (0.0%) |
| 75 Years and over | 0 (0.0%) | 0 (0.0%) |
Technology Access in Crystal Springs
Computing Device Access in Crystal Springs
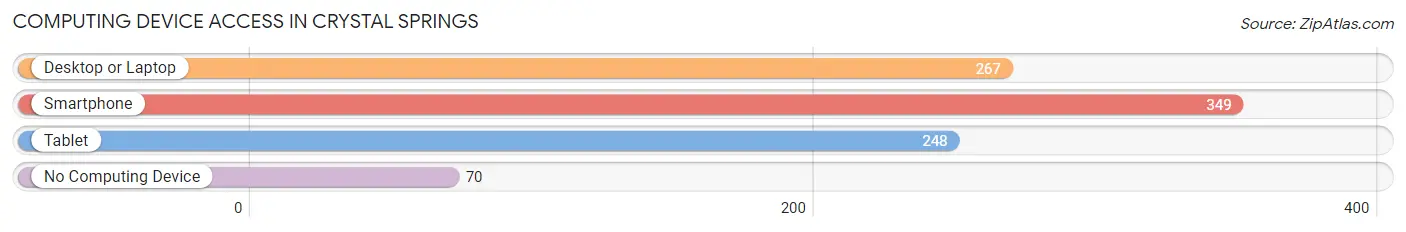
| Device Type | # Households | % Households |
| Desktop or Laptop | 267 | 60.0% |
| Smartphone | 349 | 78.4% |
| Tablet | 248 | 55.7% |
| No Computing Device | 70 | 15.7% |
| Total | 445 | 100.0% |
Internet Access in Crystal Springs
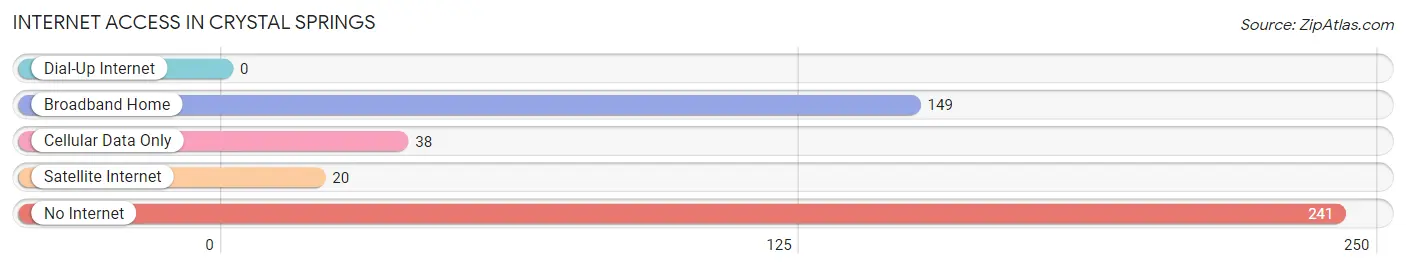
| Internet Type | # Households | % Households |
| Dial-Up Internet | 0 | 0.0% |
| Broadband Home | 149 | 33.5% |
| Cellular Data Only | 38 | 8.5% |
| Satellite Internet | 20 | 4.5% |
| No Internet | 241 | 54.2% |
| Total | 445 | 100.0% |
Crystal Springs Summary
Introduction
Crystal Springs is a small town located in the state of Florida, United States. It is situated in the southeastern part of the state, about 25 miles north of Tampa. The town has a population of approximately 2,000 people and is part of the Hillsborough County. The town is known for its natural beauty and its proximity to the Gulf of Mexico.
History
Crystal Springs was founded in 1883 by a group of settlers from Georgia. The town was named after the crystal-clear springs that were found in the area. The settlers built a sawmill and a gristmill, which provided the town with its first industry. The town grew slowly but steadily, and by the early 1900s, it had become a popular tourist destination.
In the 1920s, the town was incorporated and the population began to grow. The town was known for its citrus industry, and it was home to several packing houses. The town also had a thriving dairy industry, and it was home to several dairy farms.
In the 1950s, the town began to experience a decline in population as people moved away to larger cities. However, the town has experienced a resurgence in recent years, and it is now home to a variety of businesses and attractions.
Geography
Crystal Springs is located in the southeastern part of the state of Florida. It is situated in Hillsborough County, about 25 miles north of Tampa. The town is located on the banks of the Hillsborough River, which flows into the Gulf of Mexico. The town is surrounded by lush green forests and is home to several natural springs.
The town has a humid subtropical climate, with hot and humid summers and mild winters. The average temperature in the summer is around 90 degrees Fahrenheit, and the average temperature in the winter is around 60 degrees Fahrenheit.
Economy
Crystal Springs is a small town with a population of approximately 2,000 people. The town is home to a variety of businesses, including restaurants, retail stores, and service providers. The town is also home to several tourist attractions, including the Crystal Springs Nature Preserve and the Crystal Springs Golf Course.
The town is also home to several manufacturing companies, including a paper mill and a plastics factory. The town is also home to several agricultural businesses, including citrus farms and dairy farms.
Demographics
As of the 2010 census, the population of Crystal Springs was 2,000 people. The racial makeup of the town was 94.2% White, 2.2% African American, 0.7% Native American, 0.7% Asian, 0.2% Pacific Islander, and 1.9% from other races. The median household income was $37,500, and the median family income was $45,000.
Conclusion
Crystal Springs is a small town located in the southeastern part of the state of Florida. The town has a population of approximately 2,000 people and is known for its natural beauty and its proximity to the Gulf of Mexico. The town is home to a variety of businesses, including restaurants, retail stores, and service providers. The town is also home to several tourist attractions, including the Crystal Springs Nature Preserve and the Crystal Springs Golf Course. The town has a humid subtropical climate, with hot and humid summers and mild winters. The racial makeup of the town is 94.2% White, 2.2% African American, 0.7% Native American, 0.7% Asian, 0.2% Pacific Islander, and 1.9% from other races. The median household income was $37,500, and the median family income was $45,000.
Common Questions
What is Per Capita Income in Crystal Springs?
Per Capita income in Crystal Springs is $26,064.
What is the Median Household income in Crystal Springs?
Median Household Income in Crystal Springs is $47,411.
What is Income or Wage Gap in Crystal Springs?
Income or Wage Gap in Crystal Springs is 40.7%.
Women in Crystal Springs earn 59.3 cents for every dollar earned by a man.
What is Inequality or Gini Index in Crystal Springs?
Inequality or Gini Index in Crystal Springs is 0.43.
What is the Total Population of Crystal Springs?
Total Population of Crystal Springs is 973.
What is the Total Male Population of Crystal Springs?
Total Male Population of Crystal Springs is 487.
What is the Total Female Population of Crystal Springs?
Total Female Population of Crystal Springs is 486.
What is the Ratio of Males per 100 Females in Crystal Springs?
There are 100.21 Males per 100 Females in Crystal Springs.
What is the Ratio of Females per 100 Males in Crystal Springs?
There are 99.79 Females per 100 Males in Crystal Springs.
What is the Median Population Age in Crystal Springs?
Median Population Age in Crystal Springs is 53.2 Years.
What is the Average Family Size in Crystal Springs
Average Family Size in Crystal Springs is 2.7 People.
What is the Average Household Size in Crystal Springs
Average Household Size in Crystal Springs is 2.2 People.
How Large is the Labor Force in Crystal Springs?
There are 398 People in the Labor Forcein in Crystal Springs.
What is the Percentage of People in the Labor Force in Crystal Springs?
47.5% of People are in the Labor Force in Crystal Springs.
What is the Unemployment Rate in Crystal Springs?
Unemployment Rate in Crystal Springs is 13.8%.