North DeLand, FL Map & Demographics
North DeLand Map
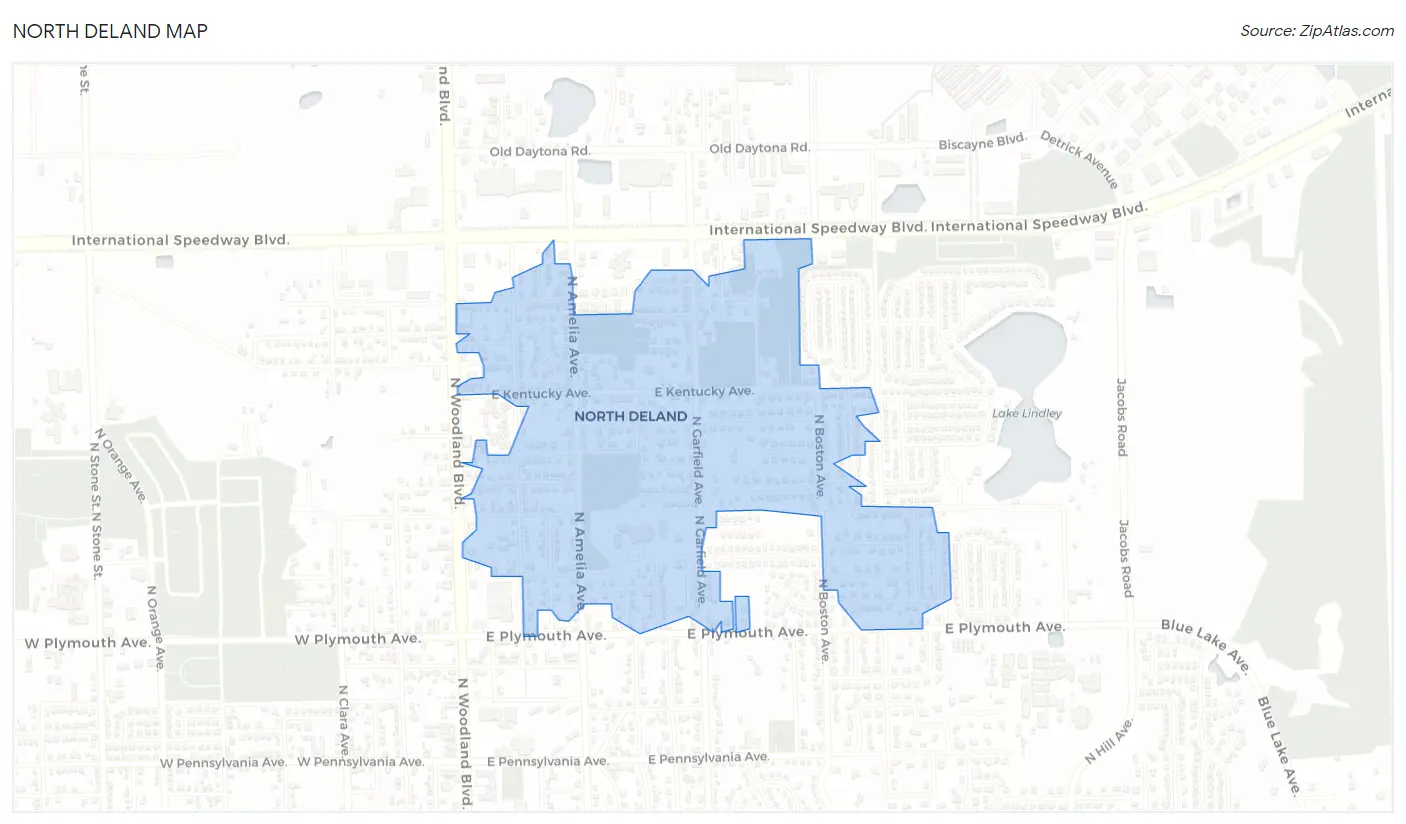
North DeLand Overview
$23,191
PER CAPITA INCOME
$38,056
AVG FAMILY INCOME
$39,542
AVG HOUSEHOLD INCOME
19.5%
WAGE / INCOME GAP [ % ]
80.5¢/ $1
WAGE / INCOME GAP [ $ ]
0.46
INEQUALITY / GINI INDEX
1,220
TOTAL POPULATION
671
MALE POPULATION
549
FEMALE POPULATION
122.22
MALES / 100 FEMALES
81.82
FEMALES / 100 MALES
35.4
MEDIAN AGE
2.7
AVG FAMILY SIZE
2.4
AVG HOUSEHOLD SIZE
459
LABOR FORCE [ PEOPLE ]
50.4%
PERCENT IN LABOR FORCE
5.2%
UNEMPLOYMENT RATE
Income in North DeLand
Income Overview in North DeLand
Per Capita Income in North DeLand is $23,191, while median incomes of families and households are $38,056 and $39,542 respectively.
| Characteristic | Number | Measure |
| Per Capita Income | 1,220 | $23,191 |
| Median Family Income | 310 | $38,056 |
| Mean Family Income | 310 | $46,959 |
| Median Household Income | 520 | $39,542 |
| Mean Household Income | 520 | $50,380 |
| Income Deficit | 310 | $0 |
| Wage / Income Gap (%) | 1,220 | 19.54% |
| Wage / Income Gap ($) | 1,220 | 80.46¢ per $1 |
| Gini / Inequality Index | 1,220 | 0.46 |
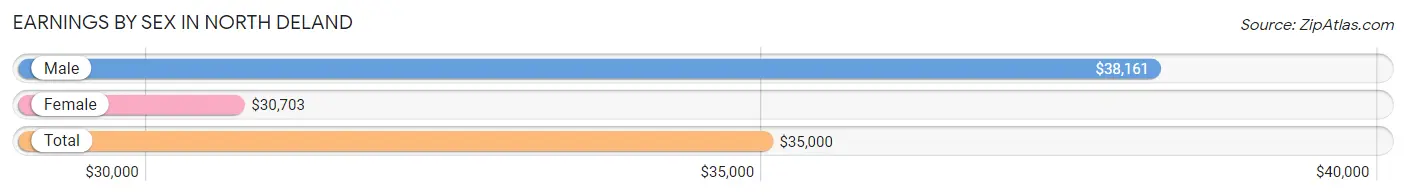
Earnings by Sex in North DeLand
Average Earnings in North DeLand are $35,000, $38,161 for men and $30,703 for women, a difference of 19.5%.
| Sex | Number | Average Earnings |
| Male | 272 (57.6%) | $38,161 |
| Female | 200 (42.4%) | $30,703 |
| Total | 472 (100.0%) | $35,000 |
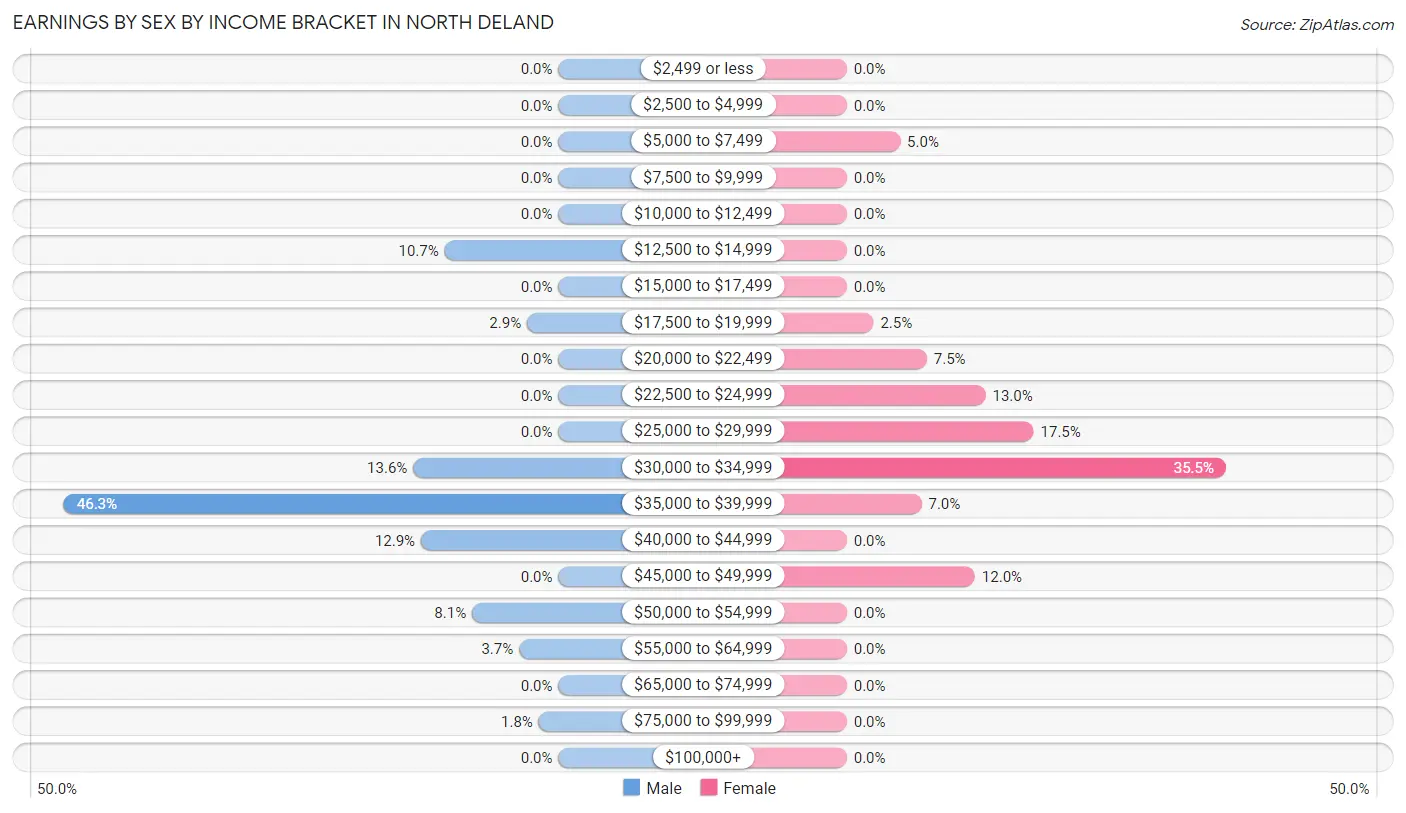
Earnings by Sex by Income Bracket in North DeLand
The most common earnings brackets in North DeLand are $35,000 to $39,999 for men (126 | 46.3%) and $30,000 to $34,999 for women (71 | 35.5%).
| Income | Male | Female |
| $2,499 or less | 0 (0.0%) | 0 (0.0%) |
| $2,500 to $4,999 | 0 (0.0%) | 0 (0.0%) |
| $5,000 to $7,499 | 0 (0.0%) | 10 (5.0%) |
| $7,500 to $9,999 | 0 (0.0%) | 0 (0.0%) |
| $10,000 to $12,499 | 0 (0.0%) | 0 (0.0%) |
| $12,500 to $14,999 | 29 (10.7%) | 0 (0.0%) |
| $15,000 to $17,499 | 0 (0.0%) | 0 (0.0%) |
| $17,500 to $19,999 | 8 (2.9%) | 5 (2.5%) |
| $20,000 to $22,499 | 0 (0.0%) | 15 (7.5%) |
| $22,500 to $24,999 | 0 (0.0%) | 26 (13.0%) |
| $25,000 to $29,999 | 0 (0.0%) | 35 (17.5%) |
| $30,000 to $34,999 | 37 (13.6%) | 71 (35.5%) |
| $35,000 to $39,999 | 126 (46.3%) | 14 (7.0%) |
| $40,000 to $44,999 | 35 (12.9%) | 0 (0.0%) |
| $45,000 to $49,999 | 0 (0.0%) | 24 (12.0%) |
| $50,000 to $54,999 | 22 (8.1%) | 0 (0.0%) |
| $55,000 to $64,999 | 10 (3.7%) | 0 (0.0%) |
| $65,000 to $74,999 | 0 (0.0%) | 0 (0.0%) |
| $75,000 to $99,999 | 5 (1.8%) | 0 (0.0%) |
| $100,000+ | 0 (0.0%) | 0 (0.0%) |
| Total | 272 (100.0%) | 200 (100.0%) |
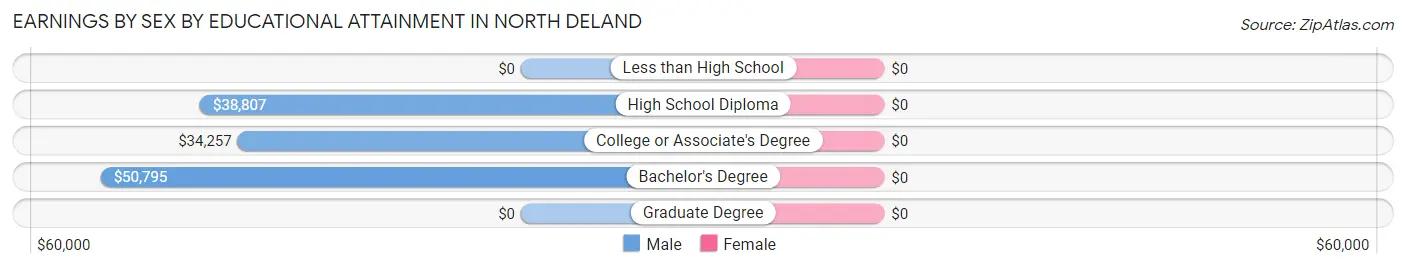
Earnings by Sex by Educational Attainment in North DeLand
| Educational Attainment | Male Income | Female Income |
| Less than High School | - | - |
| High School Diploma | $38,807 | $0 |
| College or Associate's Degree | $34,257 | $0 |
| Bachelor's Degree | $50,795 | $0 |
| Graduate Degree | - | - |
| Total | $38,693 | $32,857 |
Family Income in North DeLand
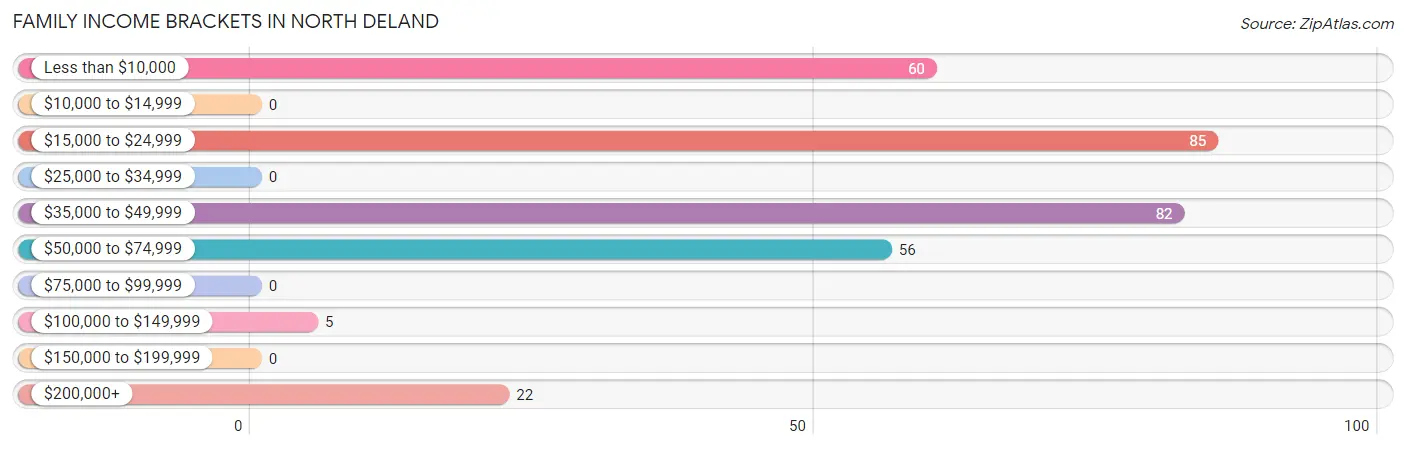
Family Income Brackets in North DeLand
According to the North DeLand family income data, there are 85 families falling into the $15,000 to $24,999 income range, which is the most common income bracket and makes up 27.4% of all families.
| Income Bracket | # Families | % Families |
| Less than $10,000 | 60 | 19.4% |
| $10,000 to $14,999 | 0 | 0.0% |
| $15,000 to $24,999 | 85 | 27.4% |
| $25,000 to $34,999 | 0 | 0.0% |
| $35,000 to $49,999 | 82 | 26.5% |
| $50,000 to $74,999 | 56 | 18.1% |
| $75,000 to $99,999 | 0 | 0.0% |
| $100,000 to $149,999 | 5 | 1.6% |
| $150,000 to $199,999 | 0 | 0.0% |
| $200,000+ | 22 | 7.1% |
Family Income by Famaliy Size in North DeLand
| Income Bracket | # Families | Median Income |
| 2-Person Families | 156 (50.3%) | $0 |
| 3-Person Families | 154 (49.7%) | $0 |
| 4-Person Families | 0 (0.0%) | $0 |
| 5-Person Families | 0 (0.0%) | $0 |
| 6-Person Families | 0 (0.0%) | $0 |
| 7+ Person Families | 0 (0.0%) | $0 |
| Total | 310 (100.0%) | $38,056 |
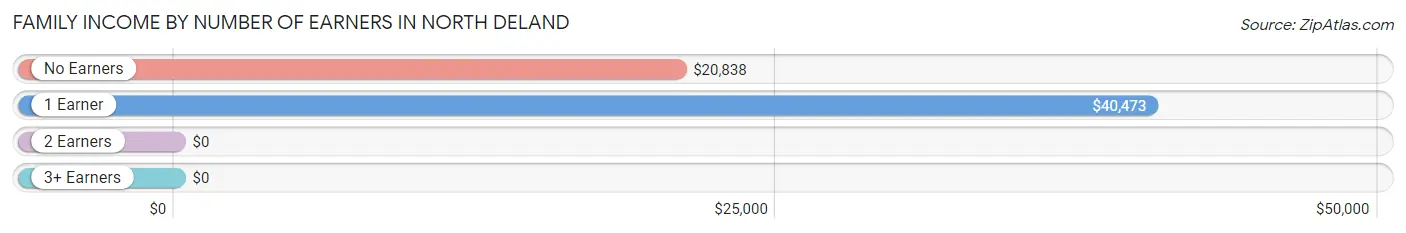
Family Income by Number of Earners in North DeLand
| Number of Earners | # Families | Median Income |
| No Earners | 177 (57.1%) | $20,838 |
| 1 Earner | 104 (33.6%) | $40,473 |
| 2 Earners | 29 (9.3%) | $0 |
| 3+ Earners | 0 (0.0%) | $0 |
| Total | 310 (100.0%) | $38,056 |
Household Income in North DeLand
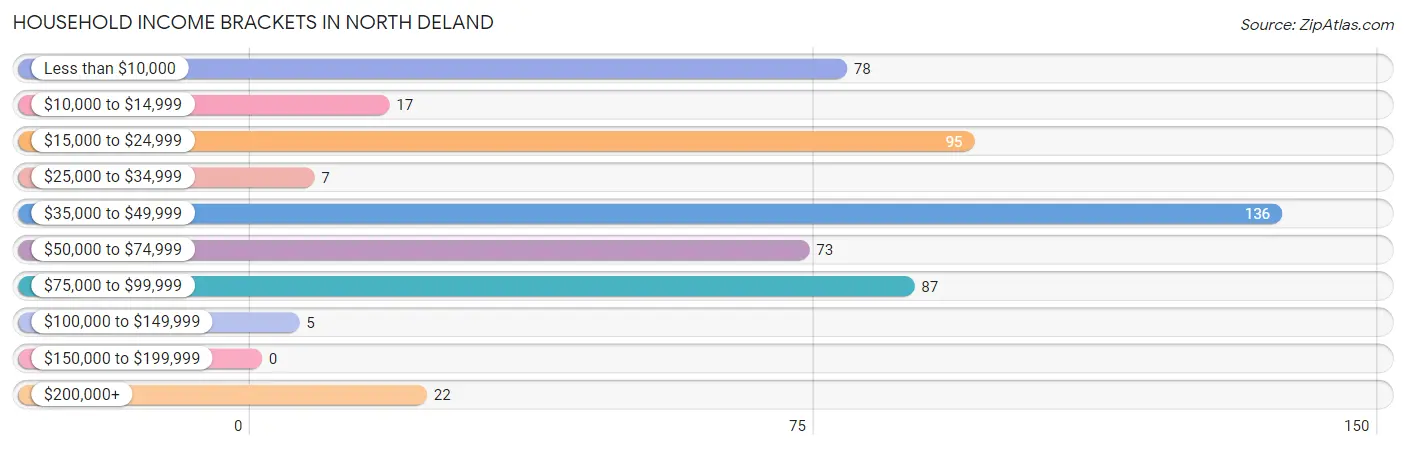
Household Income Brackets in North DeLand
With 136 households falling in the category, the $35,000 to $49,999 income range is the most frequent in North DeLand, accounting for 26.2% of all households.
| Income Bracket | # Households | % Households |
| Less than $10,000 | 78 | 15.0% |
| $10,000 to $14,999 | 17 | 3.3% |
| $15,000 to $24,999 | 95 | 18.3% |
| $25,000 to $34,999 | 7 | 1.3% |
| $35,000 to $49,999 | 136 | 26.2% |
| $50,000 to $74,999 | 73 | 14.0% |
| $75,000 to $99,999 | 87 | 16.7% |
| $100,000 to $149,999 | 5 | 1.0% |
| $150,000 to $199,999 | 0 | 0.0% |
| $200,000+ | 22 | 4.2% |
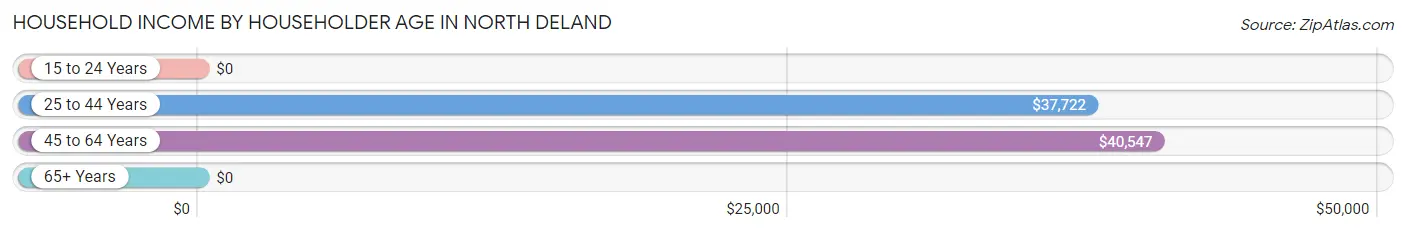
Household Income by Householder Age in North DeLand
The median household income in North DeLand is $39,542, with the highest median household income of $40,547 found in the 45 to 64 years age bracket for the primary householder. A total of 191 households (36.7%) fall into this category. Meanwhile, the 15 to 24 years age bracket for the primary householder has the lowest median household income of $0, with 36 households (6.9%) in this group.
| Income Bracket | # Households | Median Income |
| 15 to 24 Years | 36 (6.9%) | $0 |
| 25 to 44 Years | 132 (25.4%) | $37,722 |
| 45 to 64 Years | 191 (36.7%) | $40,547 |
| 65+ Years | 161 (31.0%) | $0 |
| Total | 520 (100.0%) | $39,542 |
Poverty in North DeLand
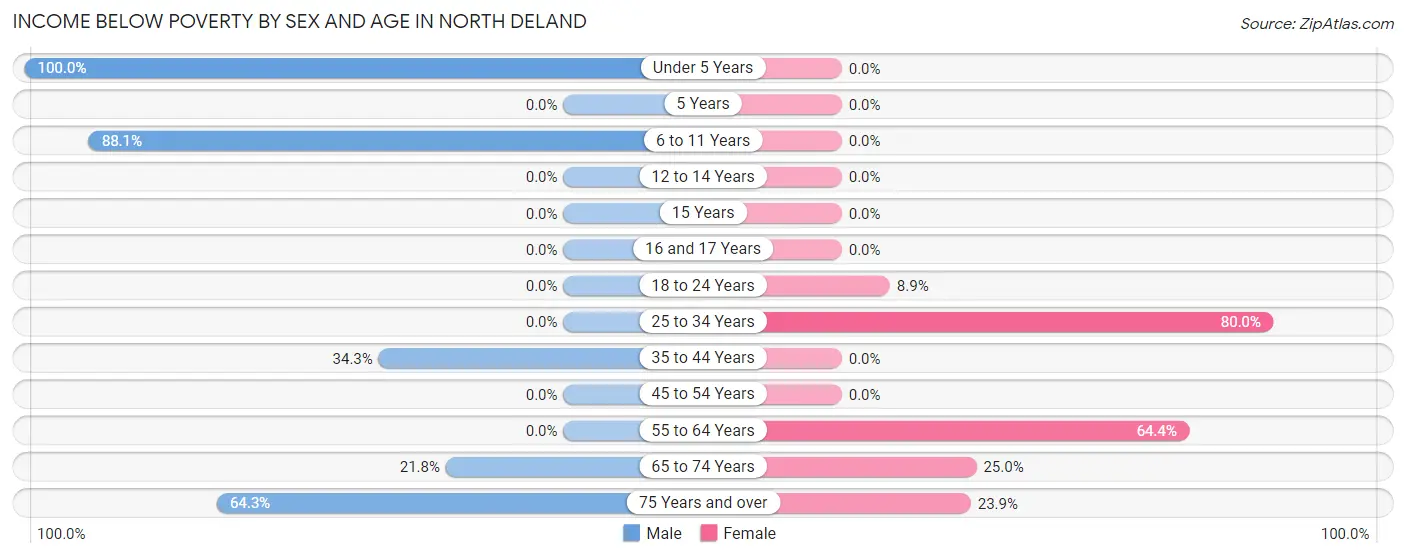
Income Below Poverty by Sex and Age in North DeLand
With 47.7% poverty level for males and 32.8% for females among the residents of North DeLand, under 5 year old males and 25 to 34 year old females are the most vulnerable to poverty, with 50 males (100.0%) and 56 females (80.0%) in their respective age groups living below the poverty level.
| Age Bracket | Male | Female |
| Under 5 Years | 50 (100.0%) | 0 (0.0%) |
| 5 Years | 0 (0.0%) | 0 (0.0%) |
| 6 to 11 Years | 192 (88.1%) | 0 (0.0%) |
| 12 to 14 Years | 0 (0.0%) | 0 (0.0%) |
| 15 Years | 0 (0.0%) | 0 (0.0%) |
| 16 and 17 Years | 0 (0.0%) | 0 (0.0%) |
| 18 to 24 Years | 0 (0.0%) | 10 (8.9%) |
| 25 to 34 Years | 0 (0.0%) | 56 (80.0%) |
| 35 to 44 Years | 48 (34.3%) | 0 (0.0%) |
| 45 to 54 Years | 0 (0.0%) | 0 (0.0%) |
| 55 to 64 Years | 0 (0.0%) | 85 (64.4%) |
| 65 to 74 Years | 12 (21.8%) | 12 (25.0%) |
| 75 Years and over | 18 (64.3%) | 17 (23.9%) |
| Total | 320 (47.7%) | 180 (32.8%) |
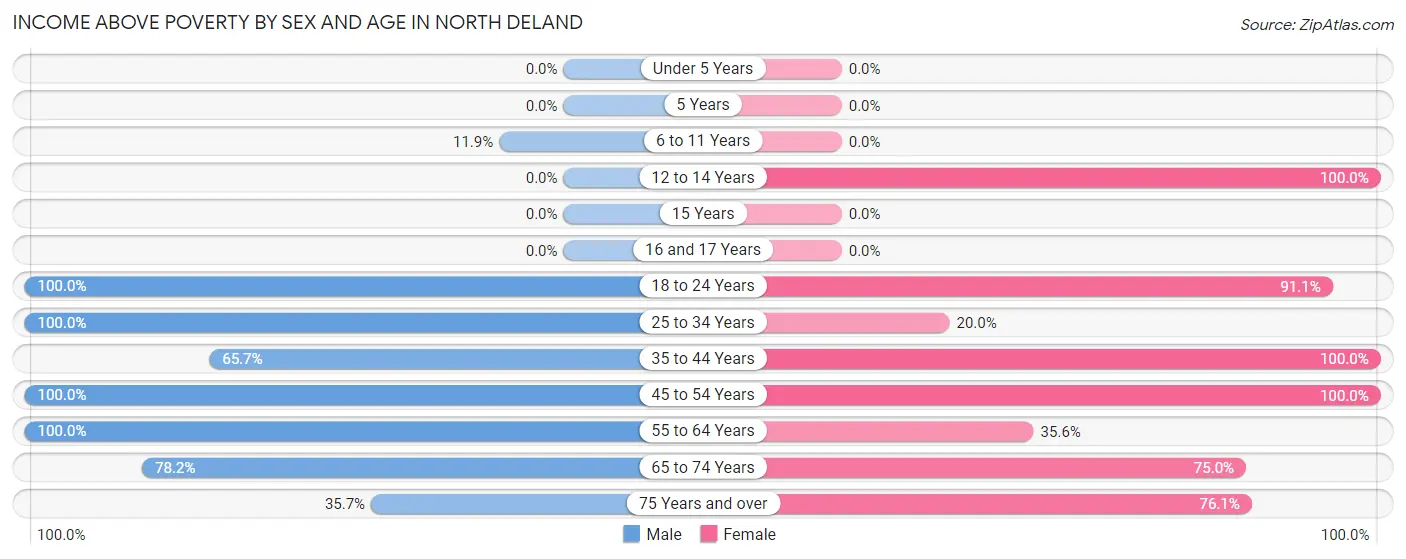
Income Above Poverty by Sex and Age in North DeLand
According to the poverty statistics in North DeLand, males aged 18 to 24 years and females aged 12 to 14 years are the age groups that are most secure financially, with 100.0% of males and 100.0% of females in these age groups living above the poverty line.
| Age Bracket | Male | Female |
| Under 5 Years | 0 (0.0%) | 0 (0.0%) |
| 5 Years | 0 (0.0%) | 0 (0.0%) |
| 6 to 11 Years | 26 (11.9%) | 0 (0.0%) |
| 12 to 14 Years | 0 (0.0%) | 42 (100.0%) |
| 15 Years | 0 (0.0%) | 0 (0.0%) |
| 16 and 17 Years | 0 (0.0%) | 0 (0.0%) |
| 18 to 24 Years | 37 (100.0%) | 102 (91.1%) |
| 25 to 34 Years | 61 (100.0%) | 14 (20.0%) |
| 35 to 44 Years | 92 (65.7%) | 50 (100.0%) |
| 45 to 54 Years | 61 (100.0%) | 24 (100.0%) |
| 55 to 64 Years | 21 (100.0%) | 47 (35.6%) |
| 65 to 74 Years | 43 (78.2%) | 36 (75.0%) |
| 75 Years and over | 10 (35.7%) | 54 (76.1%) |
| Total | 351 (52.3%) | 369 (67.2%) |
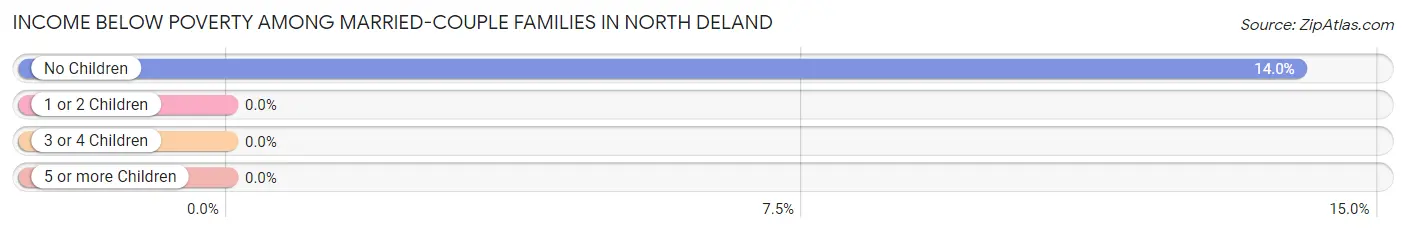
Income Below Poverty Among Married-Couple Families in North DeLand
The poverty statistics for married-couple families in North DeLand show that 9.2% or 12 of the total 131 families live below the poverty line. Families with no children have the highest poverty rate of 14.0%, comprising of 12 families. On the other hand, families with 1 or 2 children have the lowest poverty rate of 0.0%, which includes 0 families.
| Children | Above Poverty | Below Poverty |
| No Children | 74 (86.1%) | 12 (14.0%) |
| 1 or 2 Children | 45 (100.0%) | 0 (0.0%) |
| 3 or 4 Children | 0 (0.0%) | 0 (0.0%) |
| 5 or more Children | 0 (0.0%) | 0 (0.0%) |
| Total | 119 (90.8%) | 12 (9.2%) |
Income Below Poverty Among Single-Parent Households in North DeLand
According to the poverty data in North DeLand, 100.0% or 48 single-father households and 64.9% or 85 single-mother households are living below the poverty line. Among single-father households, those with 1 or 2 children have the highest poverty rate, with 48 households (100.0%) experiencing poverty. Likewise, among single-mother households, those with 1 or 2 children have the highest poverty rate, with 85 households (78.0%) falling below the poverty line.
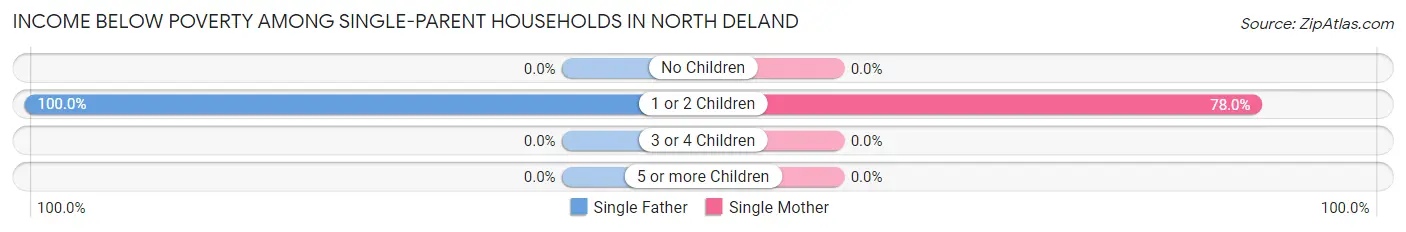
| Children | Single Father | Single Mother |
| No Children | 0 (0.0%) | 0 (0.0%) |
| 1 or 2 Children | 48 (100.0%) | 85 (78.0%) |
| 3 or 4 Children | 0 (0.0%) | 0 (0.0%) |
| 5 or more Children | 0 (0.0%) | 0 (0.0%) |
| Total | 48 (100.0%) | 85 (64.9%) |
Income Below Poverty Among Married-Couple vs Single-Parent Households in North DeLand
The poverty data for North DeLand shows that 12 of the married-couple family households (9.2%) and 133 of the single-parent households (74.3%) are living below the poverty level. Within the married-couple family households, those with no children have the highest poverty rate, with 12 households (14.0%) falling below the poverty line. Among the single-parent households, those with 1 or 2 children have the highest poverty rate, with 133 household (84.7%) living below poverty.
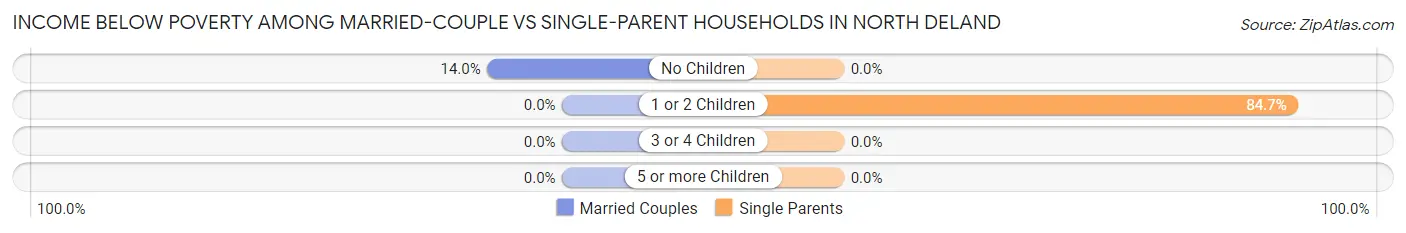
| Children | Married-Couple Families | Single-Parent Households |
| No Children | 12 (14.0%) | 0 (0.0%) |
| 1 or 2 Children | 0 (0.0%) | 133 (84.7%) |
| 3 or 4 Children | 0 (0.0%) | 0 (0.0%) |
| 5 or more Children | 0 (0.0%) | 0 (0.0%) |
| Total | 12 (9.2%) | 133 (74.3%) |
Race in North DeLand
The most populous races in North DeLand are White / Caucasian (1,046 | 85.7%), Asian (87 | 7.1%), and Hispanic or Latino (87 | 7.1%).
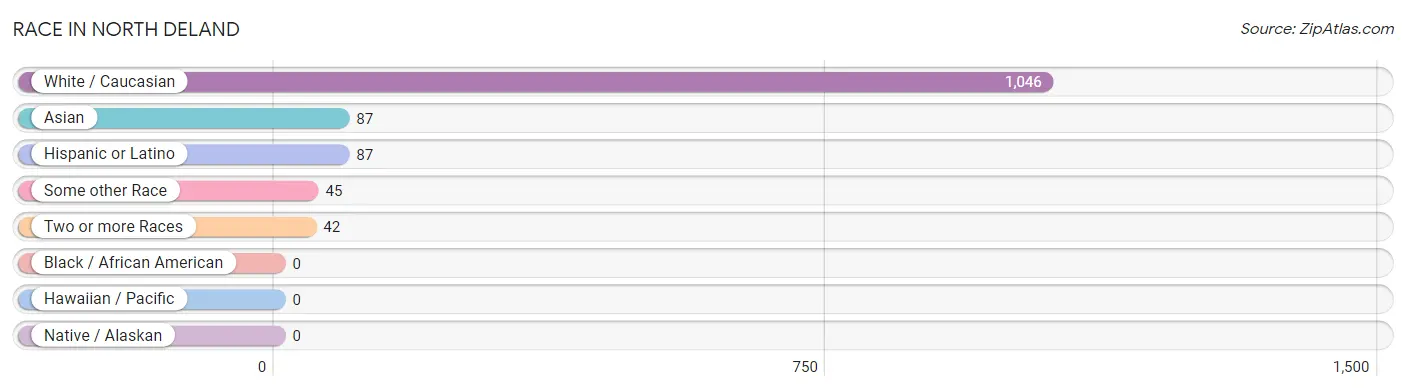
| Race | # Population | % Population |
| Asian | 87 | 7.1% |
| Black / African American | 0 | 0.0% |
| Hawaiian / Pacific | 0 | 0.0% |
| Hispanic or Latino | 87 | 7.1% |
| Native / Alaskan | 0 | 0.0% |
| White / Caucasian | 1,046 | 85.7% |
| Two or more Races | 42 | 3.4% |
| Some other Race | 45 | 3.7% |
| Total | 1,220 | 100.0% |
Ancestry in North DeLand
The most populous ancestries reported in North DeLand are Laotian (129 | 10.6%), English (117 | 9.6%), Dutch (87 | 7.1%), Mexican (87 | 7.1%), and German (66 | 5.4%), together accounting for 39.8% of all North DeLand residents.
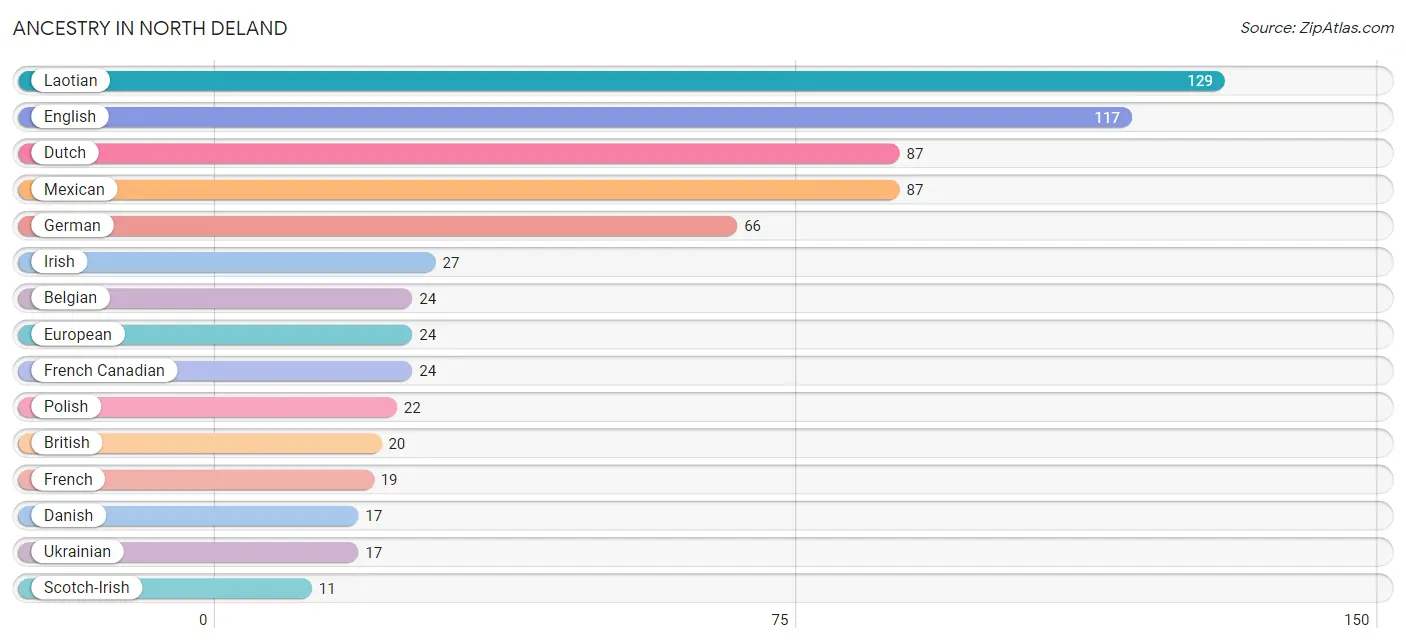
| Ancestry | # Population | % Population |
| Belgian | 24 | 2.0% |
| British | 20 | 1.6% |
| Danish | 17 | 1.4% |
| Dutch | 87 | 7.1% |
| English | 117 | 9.6% |
| European | 24 | 2.0% |
| French | 19 | 1.6% |
| French Canadian | 24 | 2.0% |
| German | 66 | 5.4% |
| Irish | 27 | 2.2% |
| Italian | 7 | 0.6% |
| Laotian | 129 | 10.6% |
| Mexican | 87 | 7.1% |
| Polish | 22 | 1.8% |
| Scotch-Irish | 11 | 0.9% |
| Ukrainian | 17 | 1.4% | View All 16 Rows |
Immigrants in North DeLand
The most numerous immigrant groups reported in North DeLand came from Europe (111 | 9.1%), Western Europe (111 | 9.1%), Germany (87 | 7.1%), and Belgium (24 | 2.0%), together accounting for 27.3% of all North DeLand residents.
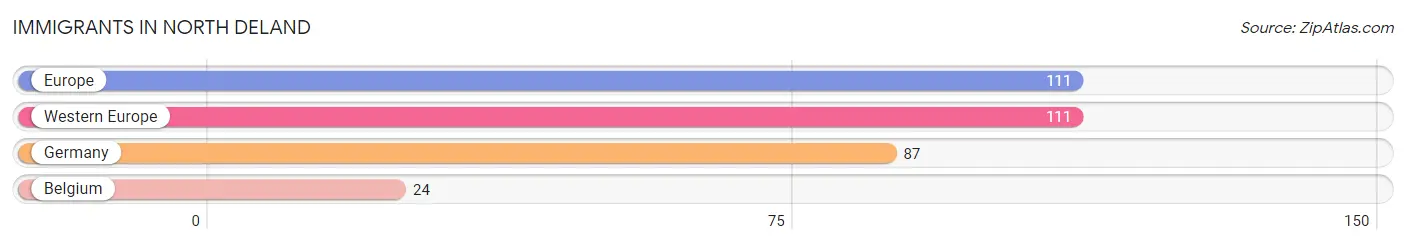
| Immigration Origin | # Population | % Population |
| Belgium | 24 | 2.0% |
| Europe | 111 | 9.1% |
| Germany | 87 | 7.1% |
| Western Europe | 111 | 9.1% | View All 4 Rows |
Sex and Age in North DeLand
Sex and Age in North DeLand
The most populous age groups in North DeLand are 10 to 14 Years (122 | 18.2%) for men and 20 to 24 Years (112 | 20.4%) for women.
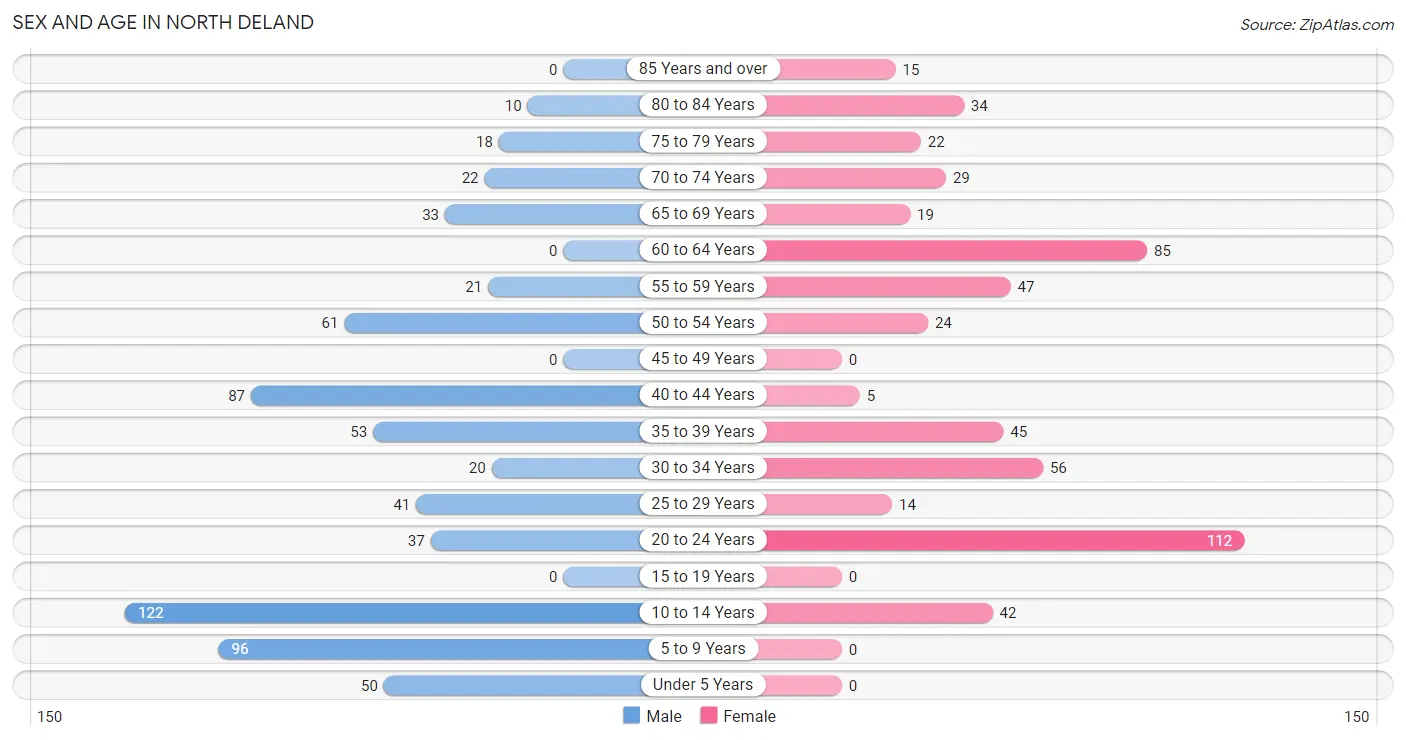
| Age Bracket | Male | Female |
| Under 5 Years | 50 (7.4%) | 0 (0.0%) |
| 5 to 9 Years | 96 (14.3%) | 0 (0.0%) |
| 10 to 14 Years | 122 (18.2%) | 42 (7.6%) |
| 15 to 19 Years | 0 (0.0%) | 0 (0.0%) |
| 20 to 24 Years | 37 (5.5%) | 112 (20.4%) |
| 25 to 29 Years | 41 (6.1%) | 14 (2.5%) |
| 30 to 34 Years | 20 (3.0%) | 56 (10.2%) |
| 35 to 39 Years | 53 (7.9%) | 45 (8.2%) |
| 40 to 44 Years | 87 (13.0%) | 5 (0.9%) |
| 45 to 49 Years | 0 (0.0%) | 0 (0.0%) |
| 50 to 54 Years | 61 (9.1%) | 24 (4.4%) |
| 55 to 59 Years | 21 (3.1%) | 47 (8.6%) |
| 60 to 64 Years | 0 (0.0%) | 85 (15.5%) |
| 65 to 69 Years | 33 (4.9%) | 19 (3.5%) |
| 70 to 74 Years | 22 (3.3%) | 29 (5.3%) |
| 75 to 79 Years | 18 (2.7%) | 22 (4.0%) |
| 80 to 84 Years | 10 (1.5%) | 34 (6.2%) |
| 85 Years and over | 0 (0.0%) | 15 (2.7%) |
| Total | 671 (100.0%) | 549 (100.0%) |
Families and Households in North DeLand
Median Family Size in North DeLand
The median family size in North DeLand is 2.70 persons per family, with single female/mother families (131 | 42.3%) accounting for the largest median family size of 3.12 persons per family. On the other hand, single male/father families (48 | 15.5%) represent the smallest median family size with 2.04 persons per family.
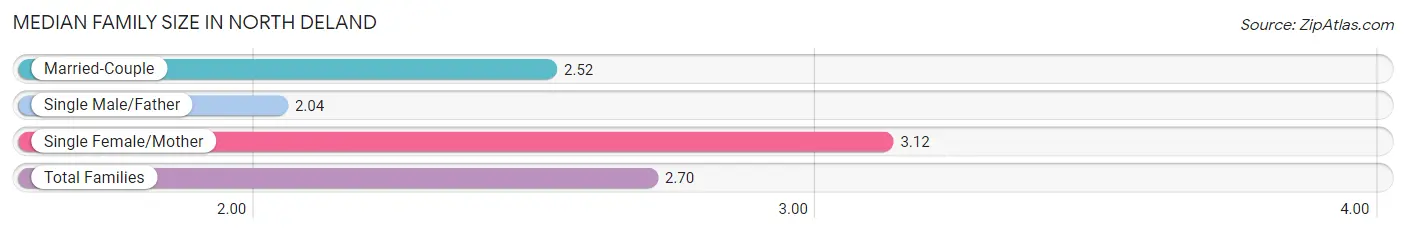
| Family Type | # Families | Family Size |
| Married-Couple | 131 (42.3%) | 2.52 |
| Single Male/Father | 48 (15.5%) | 2.04 |
| Single Female/Mother | 131 (42.3%) | 3.12 |
| Total Families | 310 (100.0%) | 2.70 |
Median Household Size in North DeLand
The median household size in North DeLand is 2.35 persons per household, with single male/father households (48 | 9.2%) accounting for the largest median household size of 3.21 persons per household. non-family households (210 | 40.4%) represent the smallest median household size with 1.56 persons per household.
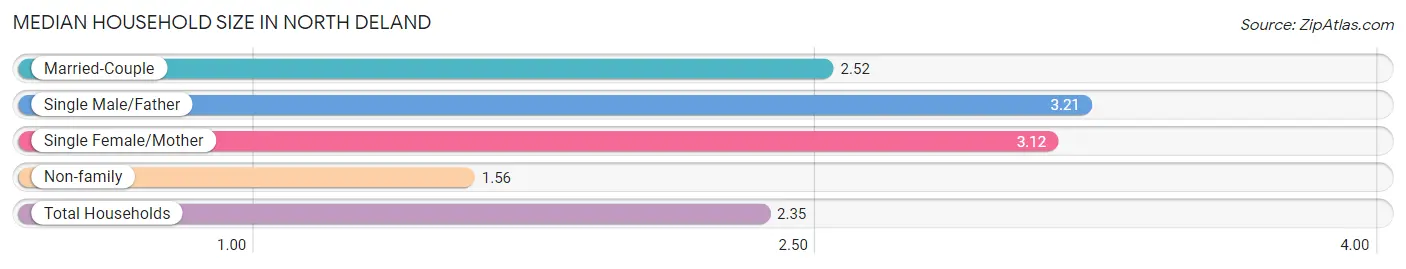
| Household Type | # Households | Household Size |
| Married-Couple | 131 (25.2%) | 2.52 |
| Single Male/Father | 48 (9.2%) | 3.21 |
| Single Female/Mother | 131 (25.2%) | 3.12 |
| Non-family | 210 (40.4%) | 1.56 |
| Total Households | 520 (100.0%) | 2.35 |
Household Size by Marriage Status in North DeLand
Out of a total of 520 households in North DeLand, 310 (59.6%) are family households, while 210 (40.4%) are nonfamily households. The most numerous type of family households are 3-person households, comprising 202, and the most common type of nonfamily households are 1-person households, comprising 130.
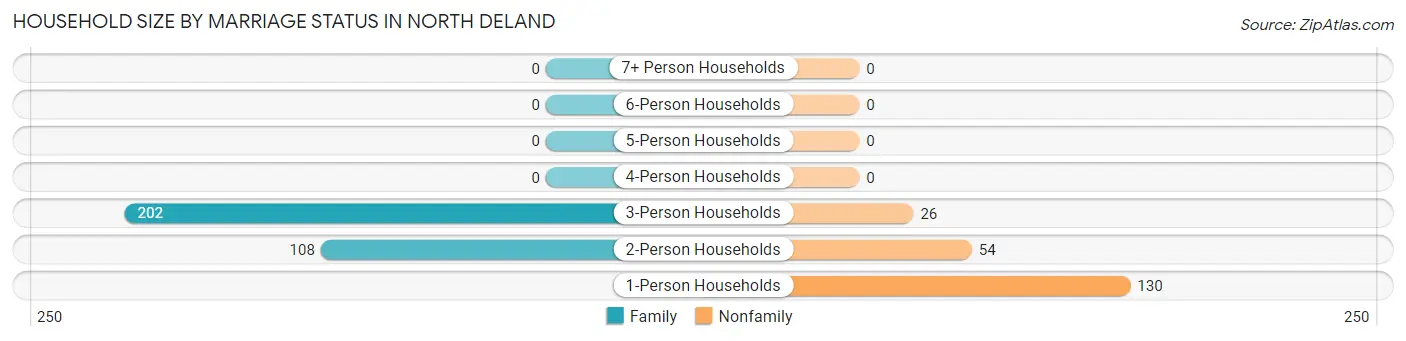
| Household Size | Family Households | Nonfamily Households |
| 1-Person Households | - | 130 (25.0%) |
| 2-Person Households | 108 (20.8%) | 54 (10.4%) |
| 3-Person Households | 202 (38.9%) | 26 (5.0%) |
| 4-Person Households | 0 (0.0%) | 0 (0.0%) |
| 5-Person Households | 0 (0.0%) | 0 (0.0%) |
| 6-Person Households | 0 (0.0%) | 0 (0.0%) |
| 7+ Person Households | 0 (0.0%) | 0 (0.0%) |
| Total | 310 (59.6%) | 210 (40.4%) |
Female Fertility in North DeLand
Fertility by Age in North DeLand
| Age Bracket | Women with Births | Births / 1,000 Women |
| 15 to 19 years | 0 (0.0%) | 0.0 |
| 20 to 34 years | 0 (0.0%) | 0.0 |
| 35 to 50 years | 0 (0.0%) | 0.0 |
| Total | 0 (0.0%) | 0.0 |
Fertility by Age by Marriage Status in North DeLand
| Age Bracket | Married | Unmarried |
| 15 to 19 years | 0 (0.0%) | 0 (0.0%) |
| 20 to 34 years | 0 (0.0%) | 0 (0.0%) |
| 35 to 50 years | 0 (0.0%) | 0 (0.0%) |
| Total | 0 (0.0%) | 0 (0.0%) |
Fertility by Education in North DeLand
| Educational Attainment | Women with Births | Births / 1,000 Women |
| Less than High School | 0 (0.0%) | 0.0 |
| High School Diploma | 0 (0.0%) | 0.0 |
| College or Associate's Degree | 0 (0.0%) | 0.0 |
| Bachelor's Degree | 0 (0.0%) | 0.0 |
| Graduate Degree | 0 (0.0%) | 0.0 |
| Total | 0 (0.0%) | 0.0 |
Fertility by Education by Marriage Status in North DeLand
| Educational Attainment | Married | Unmarried |
| Less than High School | 0 (0.0%) | 0 (0.0%) |
| High School Diploma | 0 (0.0%) | 0 (0.0%) |
| College or Associate's Degree | 0 (0.0%) | 0 (0.0%) |
| Bachelor's Degree | 0 (0.0%) | 0 (0.0%) |
| Graduate Degree | 0 (0.0%) | 0 (0.0%) |
| Total | 0 (0.0%) | 0 (0.0%) |
Employment Characteristics in North DeLand
Employment by Class of Employer in North DeLand
Among the 435 employed individuals in North DeLand, private company employees (221 | 50.8%), not-for-profit organizations (126 | 29.0%), and self-employed (not incorporated) (43 | 9.9%) make up the most common classes of employment.
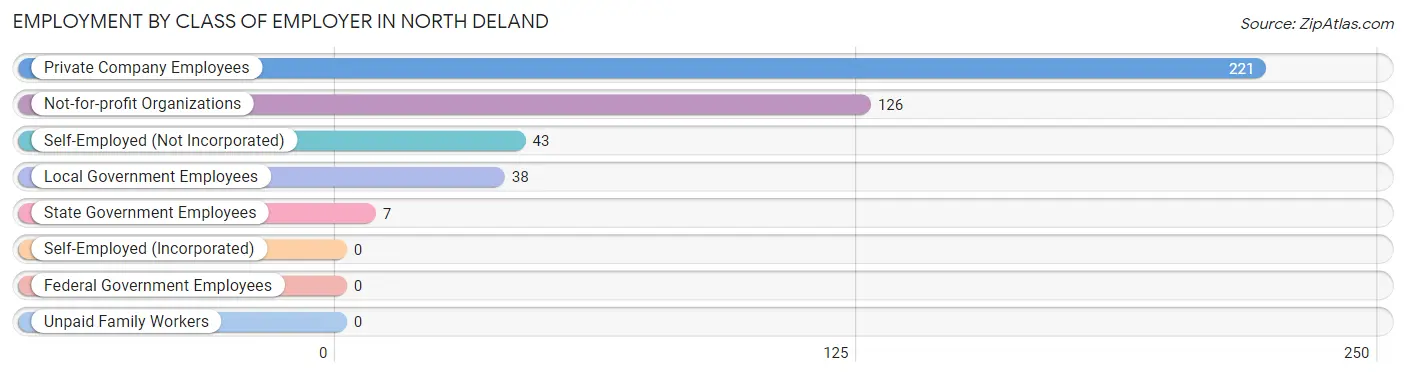
| Employer Class | # Employees | % Employees |
| Private Company Employees | 221 | 50.8% |
| Self-Employed (Incorporated) | 0 | 0.0% |
| Self-Employed (Not Incorporated) | 43 | 9.9% |
| Not-for-profit Organizations | 126 | 29.0% |
| Local Government Employees | 38 | 8.7% |
| State Government Employees | 7 | 1.6% |
| Federal Government Employees | 0 | 0.0% |
| Unpaid Family Workers | 0 | 0.0% |
| Total | 435 | 100.0% |
Employment Status by Age in North DeLand
According to the labor force statistics for North DeLand, out of the total population over 16 years of age (910), 50.4% or 459 individuals are in the labor force, with 5.2% or 24 of them unemployed. The age group with the highest labor force participation rate is 20 to 24 years, with 100.0% or 149 individuals in the labor force. Within the labor force, the 55 to 59 years age range has the highest percentage of unemployed individuals, with 35.3% or 24 of them being unemployed.
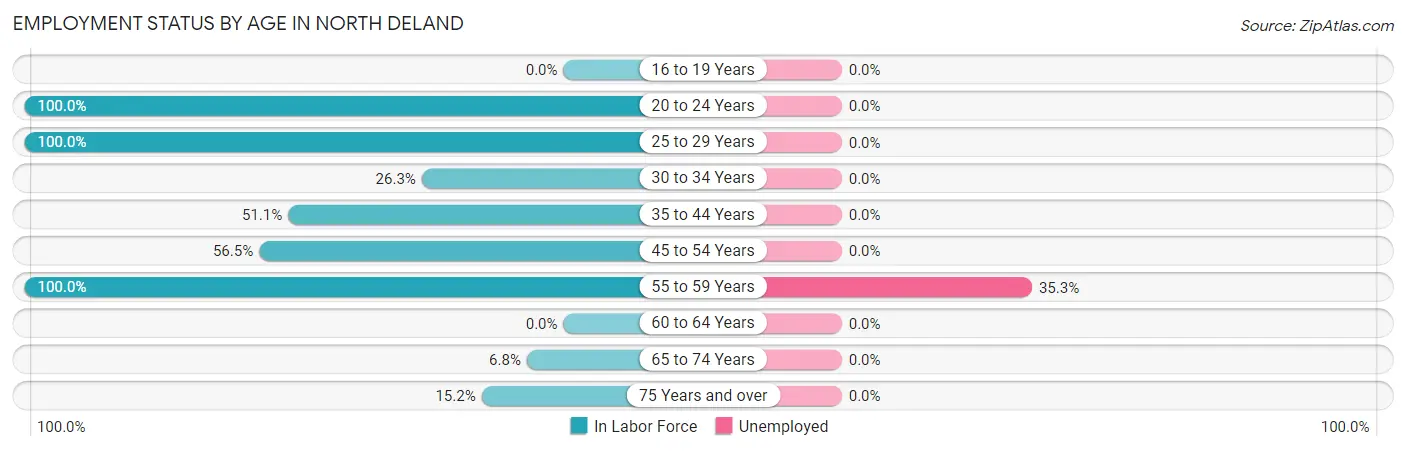
| Age Bracket | In Labor Force | Unemployed |
| 16 to 19 Years | 0 (0.0%) | 0 (0.0%) |
| 20 to 24 Years | 149 (100.0%) | 0 (0.0%) |
| 25 to 29 Years | 55 (100.0%) | 0 (0.0%) |
| 30 to 34 Years | 20 (26.3%) | 0 (0.0%) |
| 35 to 44 Years | 97 (51.1%) | 0 (0.0%) |
| 45 to 54 Years | 48 (56.5%) | 0 (0.0%) |
| 55 to 59 Years | 68 (100.0%) | 24 (35.3%) |
| 60 to 64 Years | 0 (0.0%) | 0 (0.0%) |
| 65 to 74 Years | 7 (6.8%) | 0 (0.0%) |
| 75 Years and over | 15 (15.2%) | 0 (0.0%) |
| Total | 459 (50.4%) | 24 (5.2%) |
Employment Status by Educational Attainment in North DeLand
According to labor force statistics for North DeLand, 51.5% of individuals (288) out of the total population between 25 and 64 years of age (559) are in the labor force, with 8.3% or 24 of them being unemployed. The group with the highest labor force participation rate are those with the educational attainment of bachelor's degree or higher, with 100.0% or 68 individuals in the labor force. Within the labor force, individuals with high school diploma education have the highest percentage of unemployment, with 12.0% or 24 of them being unemployed.
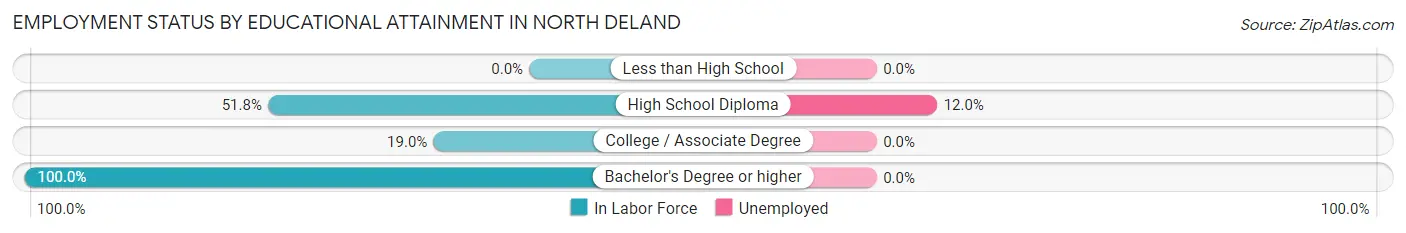
| Educational Attainment | In Labor Force | Unemployed |
| Less than High School | 0 (0.0%) | 0 (0.0%) |
| High School Diploma | 200 (51.8%) | 46 (12.0%) |
| College / Associate Degree | 20 (19.0%) | 0 (0.0%) |
| Bachelor's Degree or higher | 68 (100.0%) | 0 (0.0%) |
| Total | 288 (51.5%) | 46 (8.3%) |
Employment Occupations by Sex in North DeLand
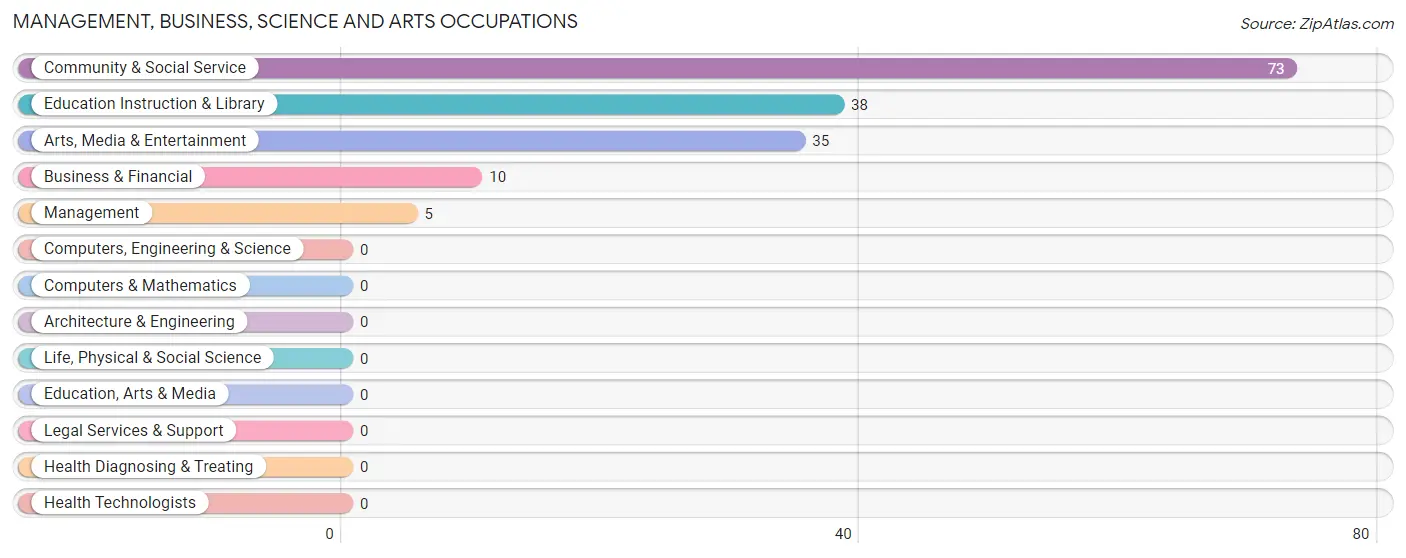
Management, Business, Science and Arts Occupations
The most common Management, Business, Science and Arts occupations in North DeLand are Community & Social Service (73 | 16.8%), Education Instruction & Library (38 | 8.7%), Arts, Media & Entertainment (35 | 8.1%), Business & Financial (10 | 2.3%), and Management (5 | 1.1%).
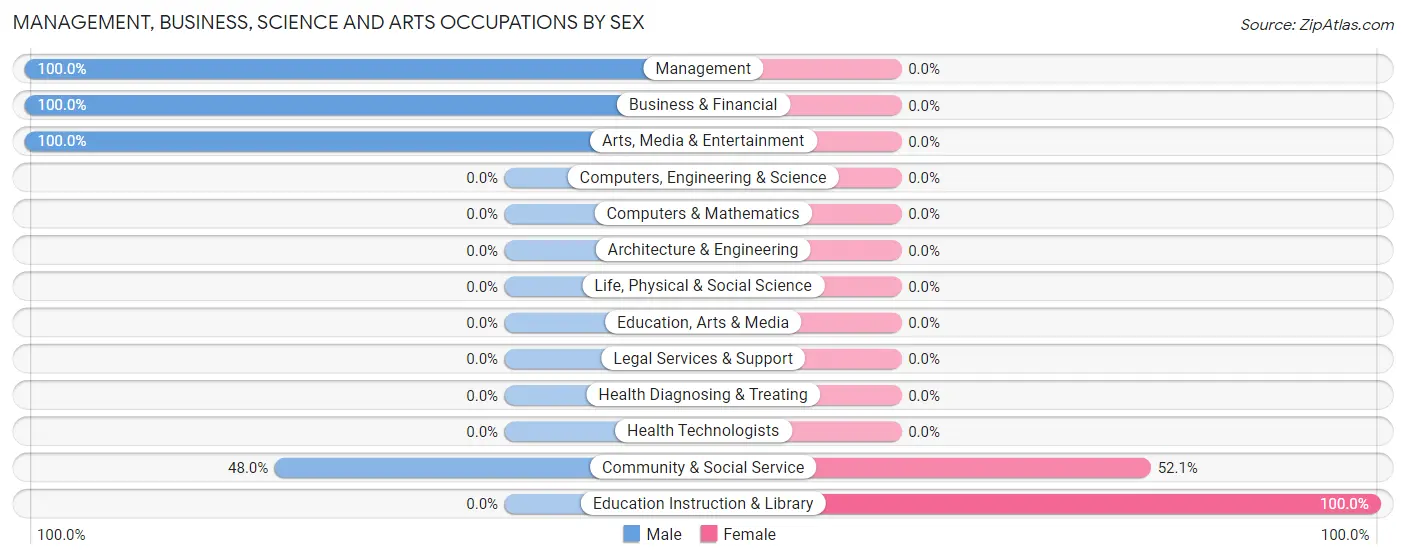
Management, Business, Science and Arts Occupations by Sex
Within the Management, Business, Science and Arts occupations in North DeLand, the most male-oriented occupations are Management (100.0%), Business & Financial (100.0%), and Arts, Media & Entertainment (100.0%), while the most female-oriented occupations are Education Instruction & Library (100.0%), and Community & Social Service (52.0%).
| Occupation | Male | Female |
| Management | 5 (100.0%) | 0 (0.0%) |
| Business & Financial | 10 (100.0%) | 0 (0.0%) |
| Computers, Engineering & Science | 0 (0.0%) | 0 (0.0%) |
| Computers & Mathematics | 0 (0.0%) | 0 (0.0%) |
| Architecture & Engineering | 0 (0.0%) | 0 (0.0%) |
| Life, Physical & Social Science | 0 (0.0%) | 0 (0.0%) |
| Community & Social Service | 35 (47.9%) | 38 (52.0%) |
| Education, Arts & Media | 0 (0.0%) | 0 (0.0%) |
| Legal Services & Support | 0 (0.0%) | 0 (0.0%) |
| Education Instruction & Library | 0 (0.0%) | 38 (100.0%) |
| Arts, Media & Entertainment | 35 (100.0%) | 0 (0.0%) |
| Health Diagnosing & Treating | 0 (0.0%) | 0 (0.0%) |
| Health Technologists | 0 (0.0%) | 0 (0.0%) |
| Total (Category) | 50 (56.8%) | 38 (43.2%) |
| Total (Overall) | 235 (54.0%) | 200 (46.0%) |
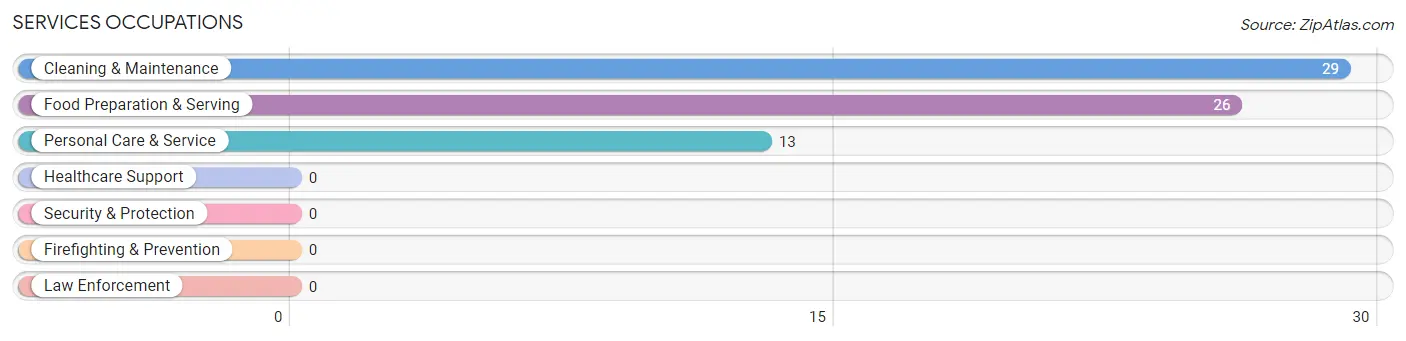
Services Occupations
The most common Services occupations in North DeLand are Cleaning & Maintenance (29 | 6.7%), Food Preparation & Serving (26 | 6.0%), and Personal Care & Service (13 | 3.0%).
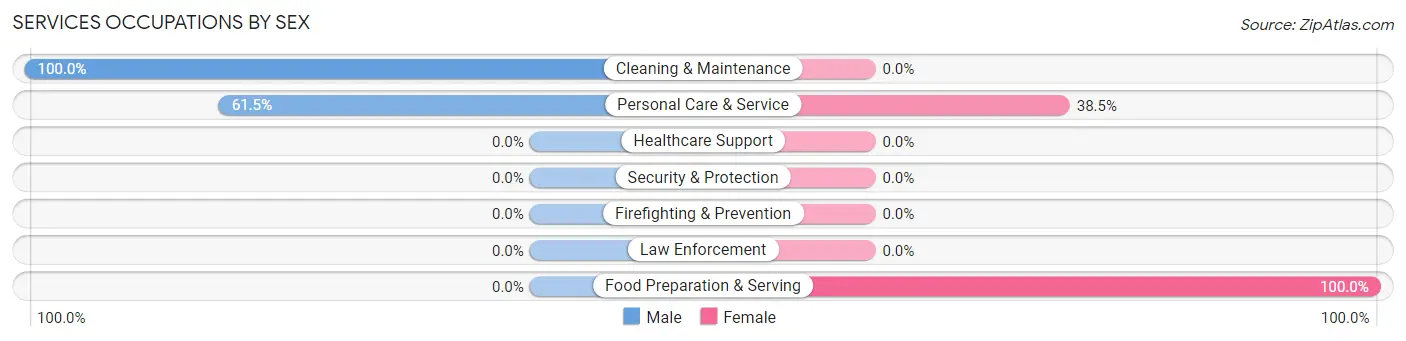
Services Occupations by Sex
Within the Services occupations in North DeLand, the most male-oriented occupations are Cleaning & Maintenance (100.0%), and Personal Care & Service (61.5%), while the most female-oriented occupations are Food Preparation & Serving (100.0%), and Personal Care & Service (38.5%).
| Occupation | Male | Female |
| Healthcare Support | 0 (0.0%) | 0 (0.0%) |
| Security & Protection | 0 (0.0%) | 0 (0.0%) |
| Firefighting & Prevention | 0 (0.0%) | 0 (0.0%) |
| Law Enforcement | 0 (0.0%) | 0 (0.0%) |
| Food Preparation & Serving | 0 (0.0%) | 26 (100.0%) |
| Cleaning & Maintenance | 29 (100.0%) | 0 (0.0%) |
| Personal Care & Service | 8 (61.5%) | 5 (38.5%) |
| Total (Category) | 37 (54.4%) | 31 (45.6%) |
| Total (Overall) | 235 (54.0%) | 200 (46.0%) |
Sales and Office Occupations
The most common Sales and Office occupations in North DeLand are Office & Administration (106 | 24.4%), and Sales & Related (92 | 21.1%).
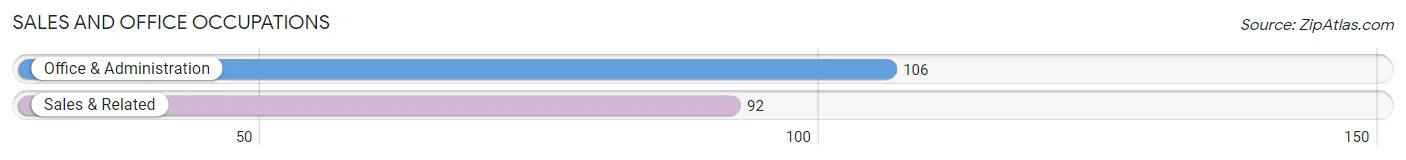
Sales and Office Occupations by Sex

| Occupation | Male | Female |
| Sales & Related | 12 (13.0%) | 80 (87.0%) |
| Office & Administration | 87 (82.1%) | 19 (17.9%) |
| Total (Category) | 99 (50.0%) | 99 (50.0%) |
| Total (Overall) | 235 (54.0%) | 200 (46.0%) |
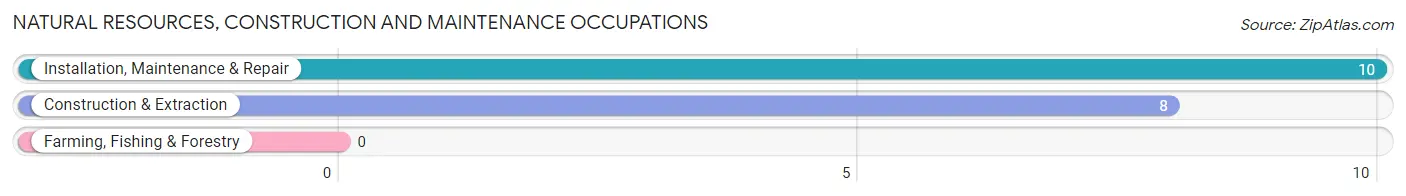
Natural Resources, Construction and Maintenance Occupations
The most common Natural Resources, Construction and Maintenance occupations in North DeLand are Installation, Maintenance & Repair (10 | 2.3%), and Construction & Extraction (8 | 1.8%).
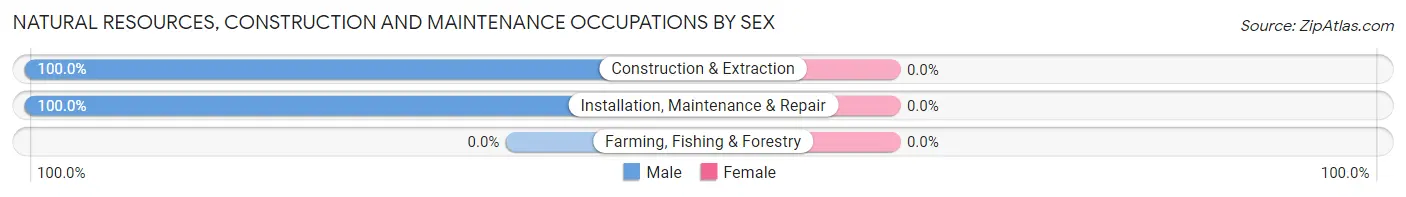
Natural Resources, Construction and Maintenance Occupations by Sex
| Occupation | Male | Female |
| Farming, Fishing & Forestry | 0 (0.0%) | 0 (0.0%) |
| Construction & Extraction | 8 (100.0%) | 0 (0.0%) |
| Installation, Maintenance & Repair | 10 (100.0%) | 0 (0.0%) |
| Total (Category) | 18 (100.0%) | 0 (0.0%) |
| Total (Overall) | 235 (54.0%) | 200 (46.0%) |
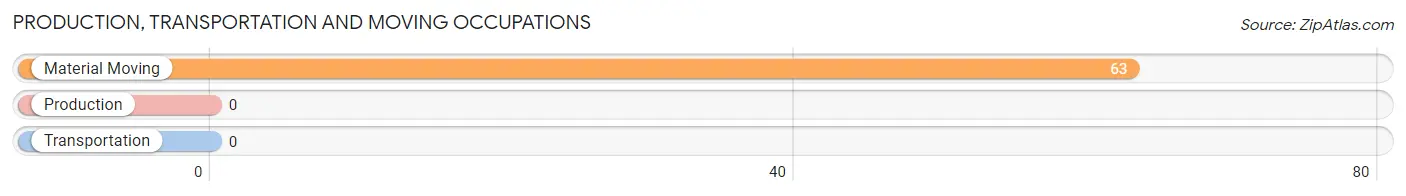
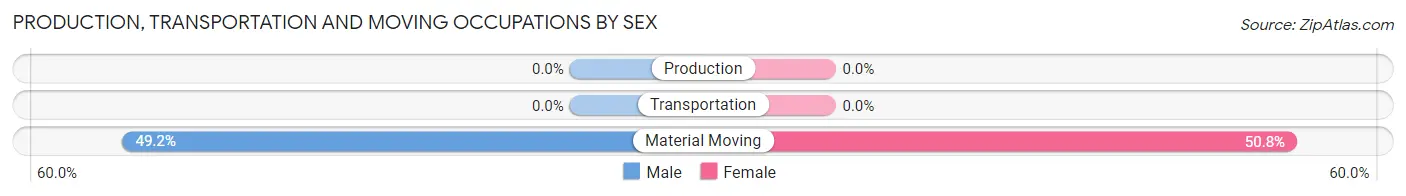
Production, Transportation and Moving Occupations
The most common Production, Transportation and Moving occupations in North DeLand are , and Material Moving (63 | 14.5%).
Production, Transportation and Moving Occupations by Sex
| Occupation | Male | Female |
| Production | 0 (0.0%) | 0 (0.0%) |
| Transportation | 0 (0.0%) | 0 (0.0%) |
| Material Moving | 31 (49.2%) | 32 (50.8%) |
| Total (Category) | 31 (49.2%) | 32 (50.8%) |
| Total (Overall) | 235 (54.0%) | 200 (46.0%) |
Employment Industries by Sex in North DeLand
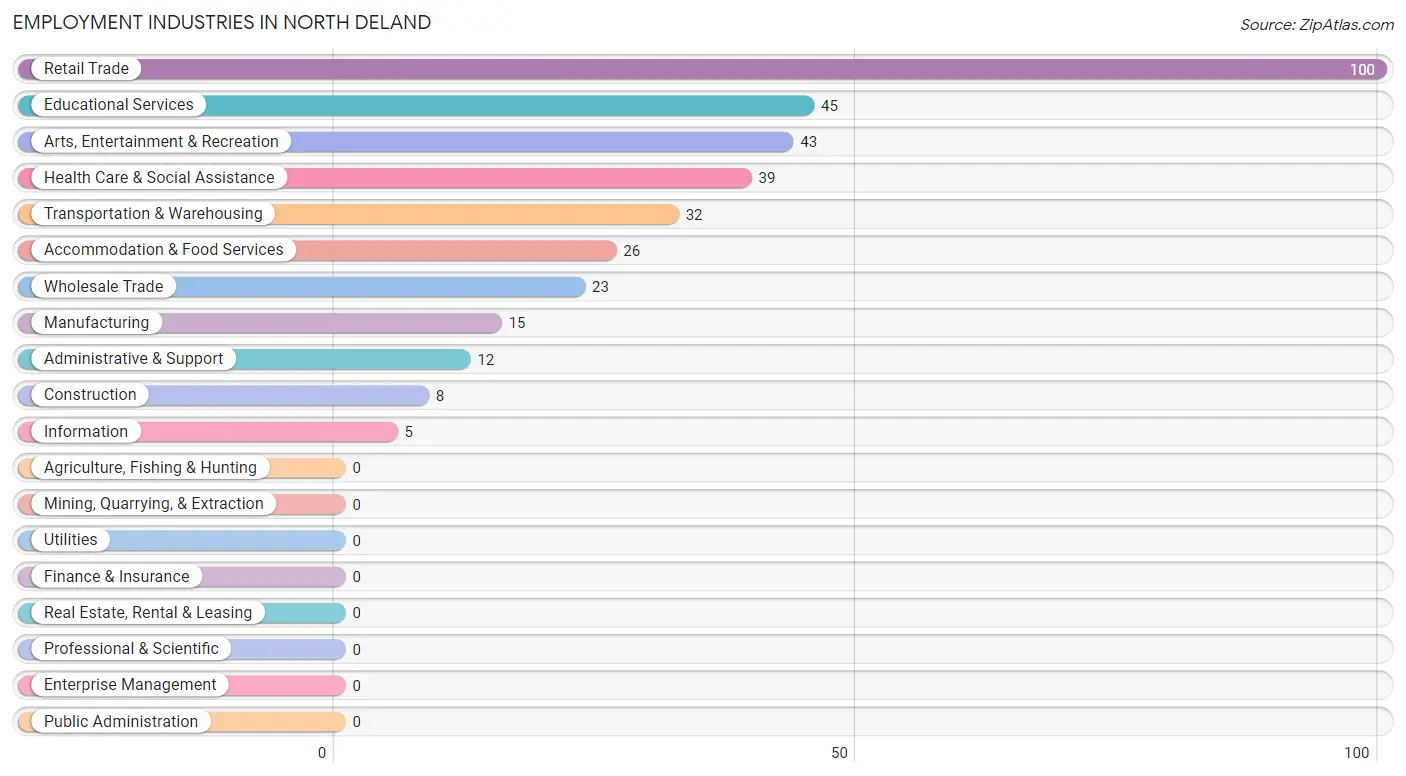
Employment Industries in North DeLand
The major employment industries in North DeLand include Retail Trade (100 | 23.0%), Educational Services (45 | 10.3%), Arts, Entertainment & Recreation (43 | 9.9%), Health Care & Social Assistance (39 | 9.0%), and Transportation & Warehousing (32 | 7.4%).
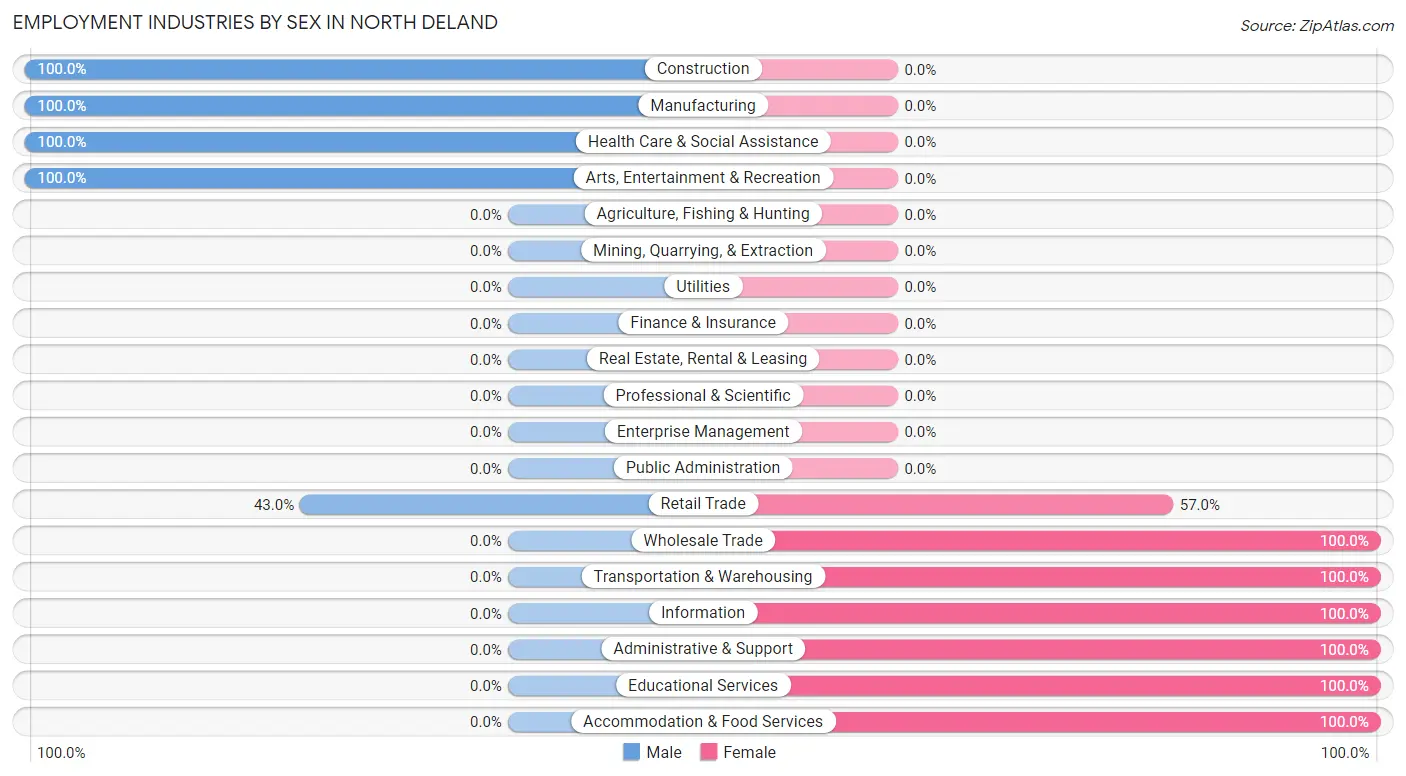
Employment Industries by Sex in North DeLand
The North DeLand industries that see more men than women are Construction (100.0%), Manufacturing (100.0%), and Health Care & Social Assistance (100.0%), whereas the industries that tend to have a higher number of women are Wholesale Trade (100.0%), Transportation & Warehousing (100.0%), and Information (100.0%).
| Industry | Male | Female |
| Agriculture, Fishing & Hunting | 0 (0.0%) | 0 (0.0%) |
| Mining, Quarrying, & Extraction | 0 (0.0%) | 0 (0.0%) |
| Construction | 8 (100.0%) | 0 (0.0%) |
| Manufacturing | 15 (100.0%) | 0 (0.0%) |
| Wholesale Trade | 0 (0.0%) | 23 (100.0%) |
| Retail Trade | 43 (43.0%) | 57 (57.0%) |
| Transportation & Warehousing | 0 (0.0%) | 32 (100.0%) |
| Utilities | 0 (0.0%) | 0 (0.0%) |
| Information | 0 (0.0%) | 5 (100.0%) |
| Finance & Insurance | 0 (0.0%) | 0 (0.0%) |
| Real Estate, Rental & Leasing | 0 (0.0%) | 0 (0.0%) |
| Professional & Scientific | 0 (0.0%) | 0 (0.0%) |
| Enterprise Management | 0 (0.0%) | 0 (0.0%) |
| Administrative & Support | 0 (0.0%) | 12 (100.0%) |
| Educational Services | 0 (0.0%) | 45 (100.0%) |
| Health Care & Social Assistance | 39 (100.0%) | 0 (0.0%) |
| Arts, Entertainment & Recreation | 43 (100.0%) | 0 (0.0%) |
| Accommodation & Food Services | 0 (0.0%) | 26 (100.0%) |
| Public Administration | 0 (0.0%) | 0 (0.0%) |
| Total | 235 (54.0%) | 200 (46.0%) |
Education in North DeLand
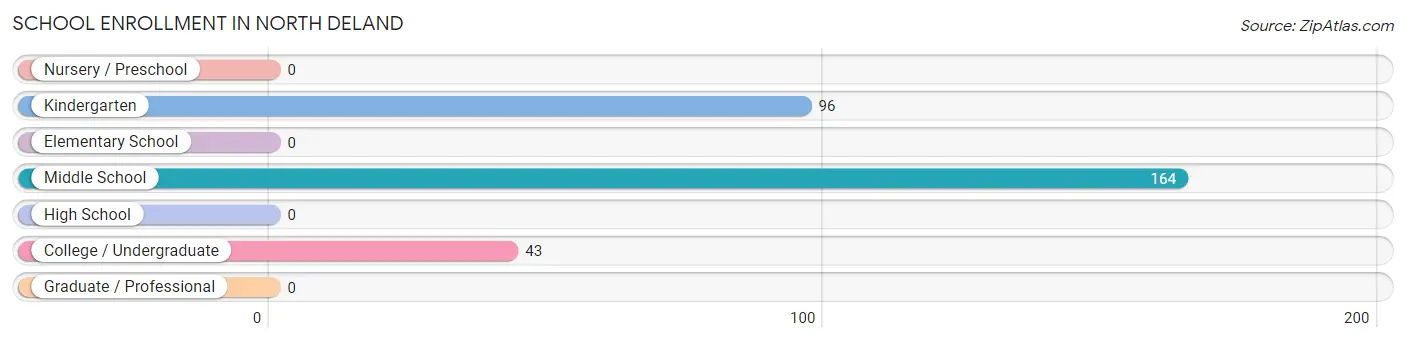
School Enrollment in North DeLand
The most common levels of schooling among the 303 students in North DeLand are middle school (164 | 54.1%), kindergarten (96 | 31.7%), and college / undergraduate (43 | 14.2%).
| School Level | # Students | % Students |
| Nursery / Preschool | 0 | 0.0% |
| Kindergarten | 96 | 31.7% |
| Elementary School | 0 | 0.0% |
| Middle School | 164 | 54.1% |
| High School | 0 | 0.0% |
| College / Undergraduate | 43 | 14.2% |
| Graduate / Professional | 0 | 0.0% |
| Total | 303 | 100.0% |
School Enrollment by Age by Funding Source in North DeLand
Out of a total of 303 students who are enrolled in schools in North DeLand, 68 (22.4%) attend a private institution, while the remaining 235 (77.6%) are enrolled in public schools. The age group of 10 to 14 year olds has the highest likelihood of being enrolled in private schools, with 68 (41.5% in the age bracket) enrolled. Conversely, the age group of 5 to 9 year old has the lowest likelihood of being enrolled in a private school, with 96 (100.0% in the age bracket) attending a public institution.
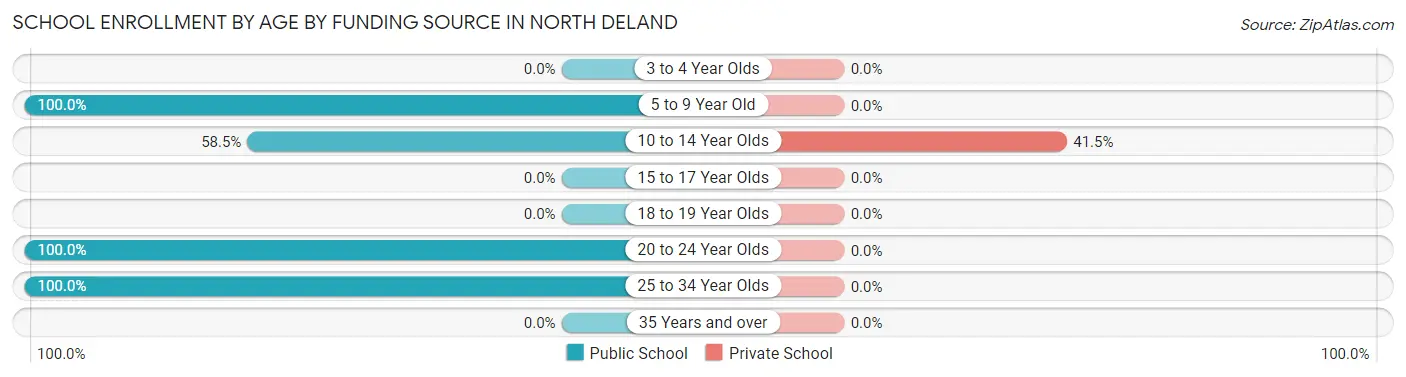
| Age Bracket | Public School | Private School |
| 3 to 4 Year Olds | 0 (0.0%) | 0 (0.0%) |
| 5 to 9 Year Old | 96 (100.0%) | 0 (0.0%) |
| 10 to 14 Year Olds | 96 (58.5%) | 68 (41.5%) |
| 15 to 17 Year Olds | 0 (0.0%) | 0 (0.0%) |
| 18 to 19 Year Olds | 0 (0.0%) | 0 (0.0%) |
| 20 to 24 Year Olds | 29 (100.0%) | 0 (0.0%) |
| 25 to 34 Year Olds | 14 (100.0%) | 0 (0.0%) |
| 35 Years and over | 0 (0.0%) | 0 (0.0%) |
| Total | 235 (77.6%) | 68 (22.4%) |
Educational Attainment by Field of Study in North DeLand
Business (32 | 18.0%), bio, nature & agricultural (29 | 16.3%), science & technology (28 | 15.7%), physical & health sciences (19 | 10.7%), and education (17 | 9.6%) are the most common fields of study among 178 individuals in North DeLand who have obtained a bachelor's degree or higher.
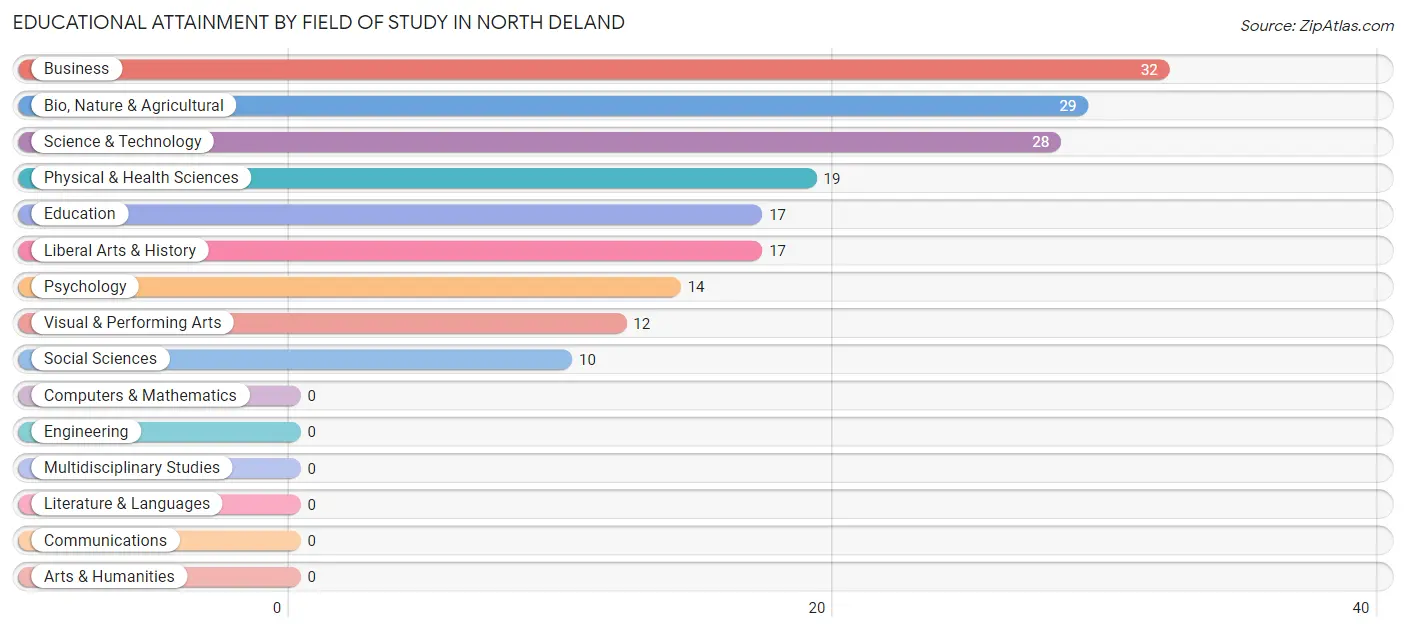
| Field of Study | # Graduates | % Graduates |
| Computers & Mathematics | 0 | 0.0% |
| Bio, Nature & Agricultural | 29 | 16.3% |
| Physical & Health Sciences | 19 | 10.7% |
| Psychology | 14 | 7.9% |
| Social Sciences | 10 | 5.6% |
| Engineering | 0 | 0.0% |
| Multidisciplinary Studies | 0 | 0.0% |
| Science & Technology | 28 | 15.7% |
| Business | 32 | 18.0% |
| Education | 17 | 9.6% |
| Literature & Languages | 0 | 0.0% |
| Liberal Arts & History | 17 | 9.6% |
| Visual & Performing Arts | 12 | 6.7% |
| Communications | 0 | 0.0% |
| Arts & Humanities | 0 | 0.0% |
| Total | 178 | 100.0% |
Transportation & Commute in North DeLand
Vehicle Availability by Sex in North DeLand
The most prevalent vehicle ownership categories in North DeLand are males with 2 vehicles (134, accounting for 57.0%) and females with 2 vehicles (24, making up 67.0%).
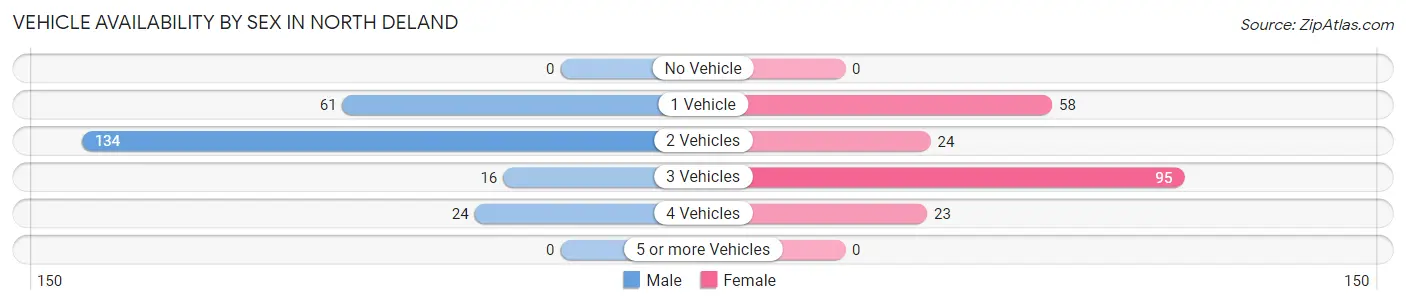
| Vehicles Available | Male | Female |
| No Vehicle | 0 (0.0%) | 0 (0.0%) |
| 1 Vehicle | 61 (26.0%) | 58 (29.0%) |
| 2 Vehicles | 134 (57.0%) | 24 (12.0%) |
| 3 Vehicles | 16 (6.8%) | 95 (47.5%) |
| 4 Vehicles | 24 (10.2%) | 23 (11.5%) |
| 5 or more Vehicles | 0 (0.0%) | 0 (0.0%) |
| Total | 235 (100.0%) | 200 (100.0%) |
Commute Time in North DeLand
The most frequently occuring commute durations in North DeLand are 10 to 14 minutes (151 commuters, 36.7%), 45 to 59 minutes (92 commuters, 22.4%), and 5 to 9 minutes (73 commuters, 17.8%).
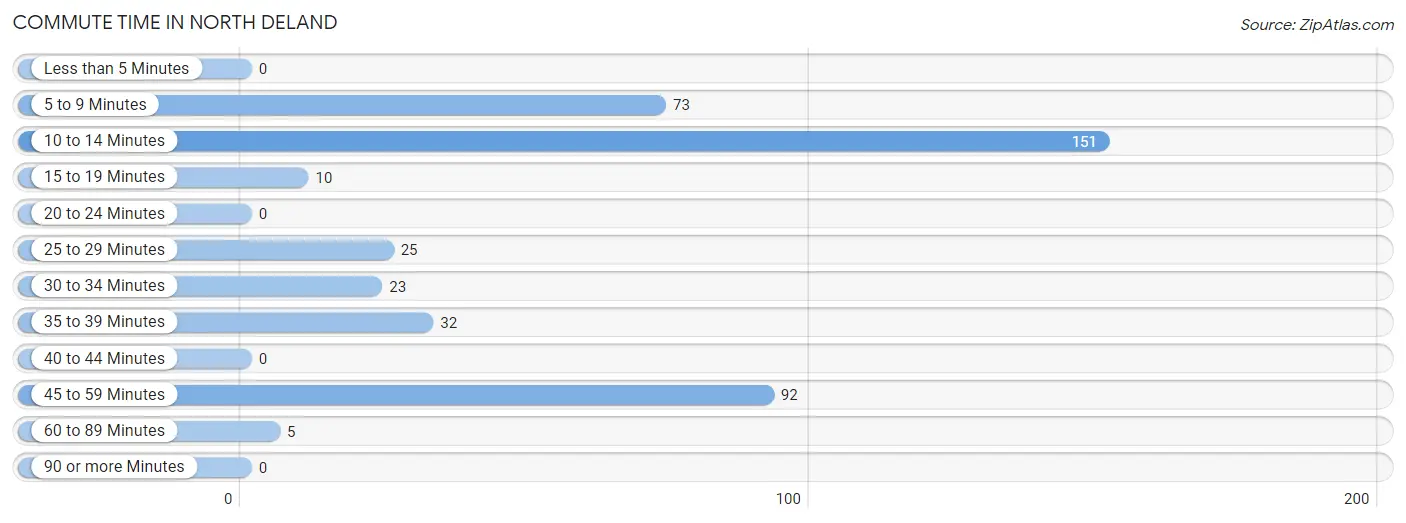
| Commute Time | # Commuters | % Commuters |
| Less than 5 Minutes | 0 | 0.0% |
| 5 to 9 Minutes | 73 | 17.8% |
| 10 to 14 Minutes | 151 | 36.7% |
| 15 to 19 Minutes | 10 | 2.4% |
| 20 to 24 Minutes | 0 | 0.0% |
| 25 to 29 Minutes | 25 | 6.1% |
| 30 to 34 Minutes | 23 | 5.6% |
| 35 to 39 Minutes | 32 | 7.8% |
| 40 to 44 Minutes | 0 | 0.0% |
| 45 to 59 Minutes | 92 | 22.4% |
| 60 to 89 Minutes | 5 | 1.2% |
| 90 or more Minutes | 0 | 0.0% |
Commute Time by Sex in North DeLand
The most common commute times in North DeLand are 10 to 14 minutes (95 commuters, 42.6%) for males and 45 to 59 minutes (57 commuters, 30.3%) for females.
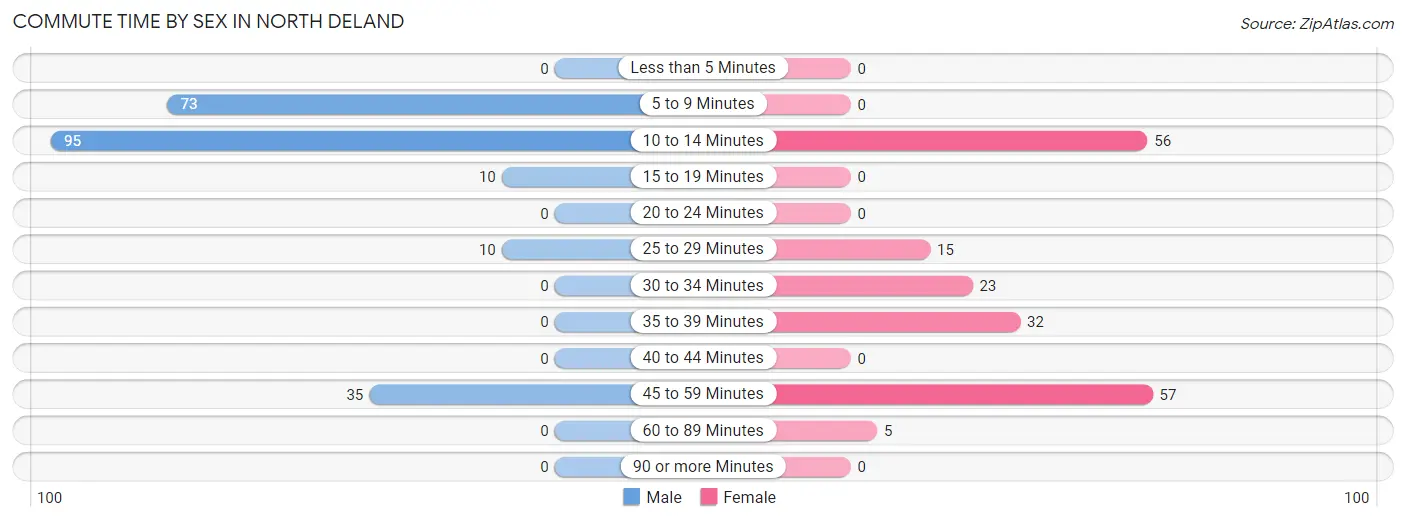
| Commute Time | Male | Female |
| Less than 5 Minutes | 0 (0.0%) | 0 (0.0%) |
| 5 to 9 Minutes | 73 (32.7%) | 0 (0.0%) |
| 10 to 14 Minutes | 95 (42.6%) | 56 (29.8%) |
| 15 to 19 Minutes | 10 (4.5%) | 0 (0.0%) |
| 20 to 24 Minutes | 0 (0.0%) | 0 (0.0%) |
| 25 to 29 Minutes | 10 (4.5%) | 15 (8.0%) |
| 30 to 34 Minutes | 0 (0.0%) | 23 (12.2%) |
| 35 to 39 Minutes | 0 (0.0%) | 32 (17.0%) |
| 40 to 44 Minutes | 0 (0.0%) | 0 (0.0%) |
| 45 to 59 Minutes | 35 (15.7%) | 57 (30.3%) |
| 60 to 89 Minutes | 0 (0.0%) | 5 (2.7%) |
| 90 or more Minutes | 0 (0.0%) | 0 (0.0%) |
Time of Departure to Work by Sex in North DeLand
The most frequent times of departure to work in North DeLand are 4:00 PM to 11:59 PM (95, 42.6%) for males and 6:30 AM to 6:59 AM (57, 30.3%) for females.
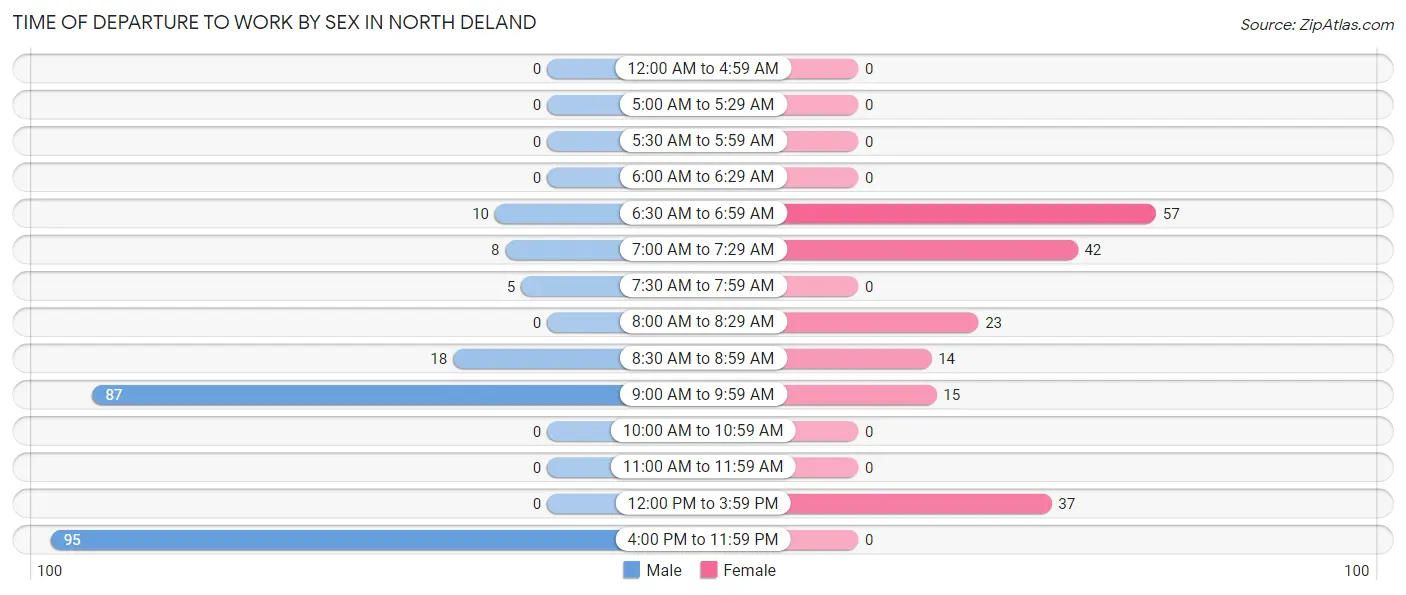
| Time of Departure | Male | Female |
| 12:00 AM to 4:59 AM | 0 (0.0%) | 0 (0.0%) |
| 5:00 AM to 5:29 AM | 0 (0.0%) | 0 (0.0%) |
| 5:30 AM to 5:59 AM | 0 (0.0%) | 0 (0.0%) |
| 6:00 AM to 6:29 AM | 0 (0.0%) | 0 (0.0%) |
| 6:30 AM to 6:59 AM | 10 (4.5%) | 57 (30.3%) |
| 7:00 AM to 7:29 AM | 8 (3.6%) | 42 (22.3%) |
| 7:30 AM to 7:59 AM | 5 (2.2%) | 0 (0.0%) |
| 8:00 AM to 8:29 AM | 0 (0.0%) | 23 (12.2%) |
| 8:30 AM to 8:59 AM | 18 (8.1%) | 14 (7.4%) |
| 9:00 AM to 9:59 AM | 87 (39.0%) | 15 (8.0%) |
| 10:00 AM to 10:59 AM | 0 (0.0%) | 0 (0.0%) |
| 11:00 AM to 11:59 AM | 0 (0.0%) | 0 (0.0%) |
| 12:00 PM to 3:59 PM | 0 (0.0%) | 37 (19.7%) |
| 4:00 PM to 11:59 PM | 95 (42.6%) | 0 (0.0%) |
| Total | 223 (100.0%) | 188 (100.0%) |
Housing Occupancy in North DeLand
Occupancy by Ownership in North DeLand
Of the total 520 dwellings in North DeLand, owner-occupied units account for 268 (51.5%), while renter-occupied units make up 252 (48.5%).
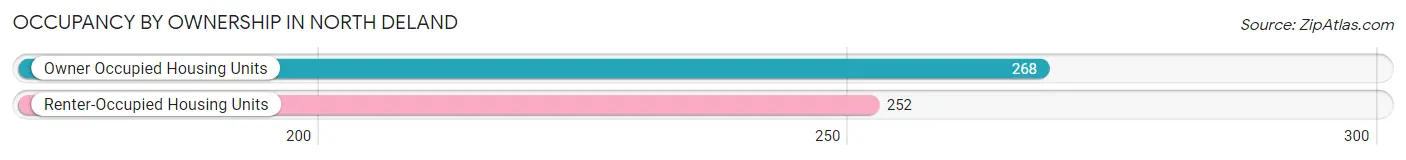
| Occupancy | # Housing Units | % Housing Units |
| Owner Occupied Housing Units | 268 | 51.5% |
| Renter-Occupied Housing Units | 252 | 48.5% |
| Total Occupied Housing Units | 520 | 100.0% |
Occupancy by Household Size in North DeLand
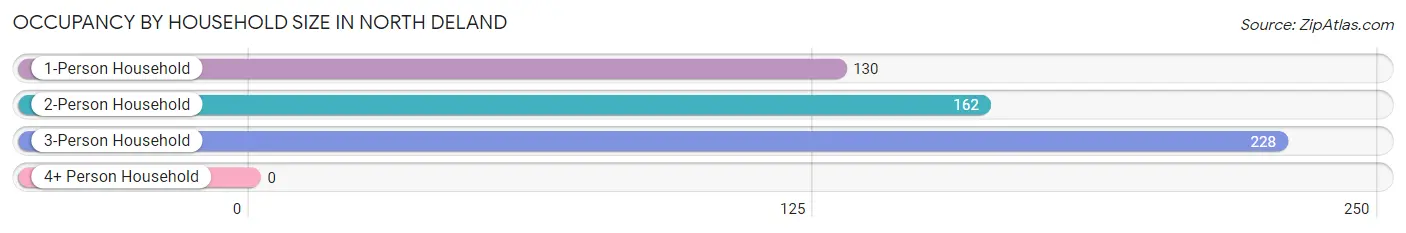
| Household Size | # Housing Units | % Housing Units |
| 1-Person Household | 130 | 25.0% |
| 2-Person Household | 162 | 31.1% |
| 3-Person Household | 228 | 43.9% |
| 4+ Person Household | 0 | 0.0% |
| Total Housing Units | 520 | 100.0% |
Occupancy by Ownership by Household Size in North DeLand
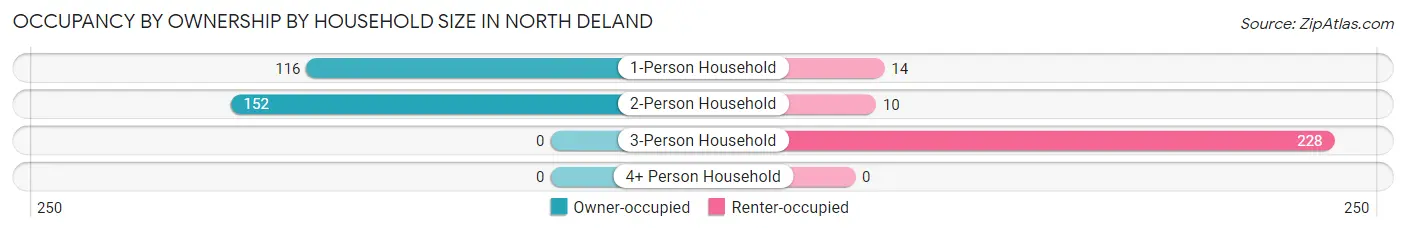
| Household Size | Owner-occupied | Renter-occupied |
| 1-Person Household | 116 (89.2%) | 14 (10.8%) |
| 2-Person Household | 152 (93.8%) | 10 (6.2%) |
| 3-Person Household | 0 (0.0%) | 228 (100.0%) |
| 4+ Person Household | 0 (0.0%) | 0 (0.0%) |
| Total Housing Units | 268 (51.5%) | 252 (48.5%) |
Occupancy by Educational Attainment in North DeLand
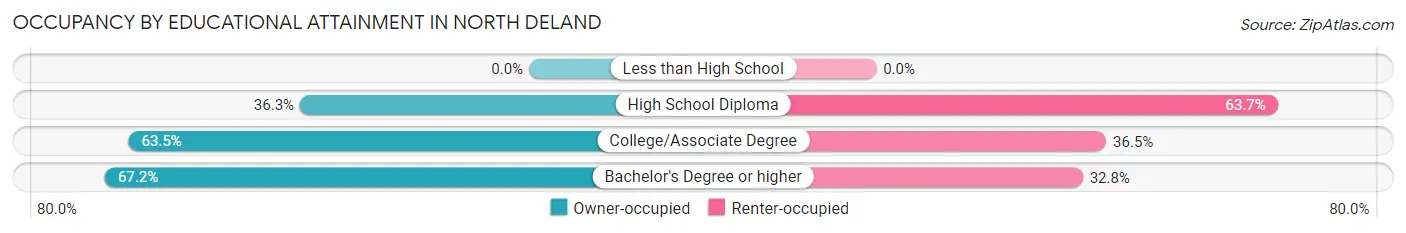
| Household Size | Owner-occupied | Renter-occupied |
| Less than High School | 0 (0.0%) | 0 (0.0%) |
| High School Diploma | 89 (36.3%) | 156 (63.7%) |
| College/Associate Degree | 101 (63.5%) | 58 (36.5%) |
| Bachelor's Degree or higher | 78 (67.2%) | 38 (32.8%) |
Occupancy by Age of Householder in North DeLand
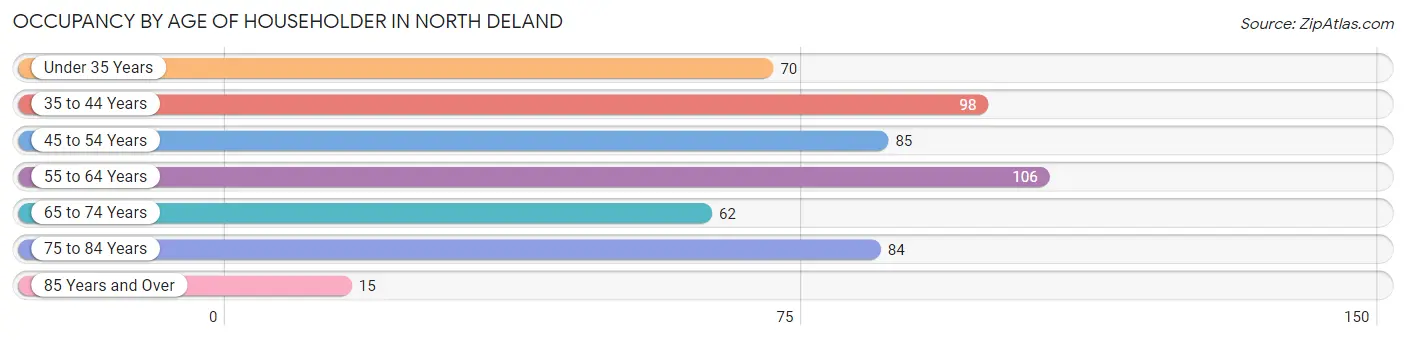
| Age Bracket | # Households | % Households |
| Under 35 Years | 70 | 13.5% |
| 35 to 44 Years | 98 | 18.9% |
| 45 to 54 Years | 85 | 16.4% |
| 55 to 64 Years | 106 | 20.4% |
| 65 to 74 Years | 62 | 11.9% |
| 75 to 84 Years | 84 | 16.2% |
| 85 Years and Over | 15 | 2.9% |
| Total | 520 | 100.0% |
Housing Finances in North DeLand
Median Income by Occupancy in North DeLand
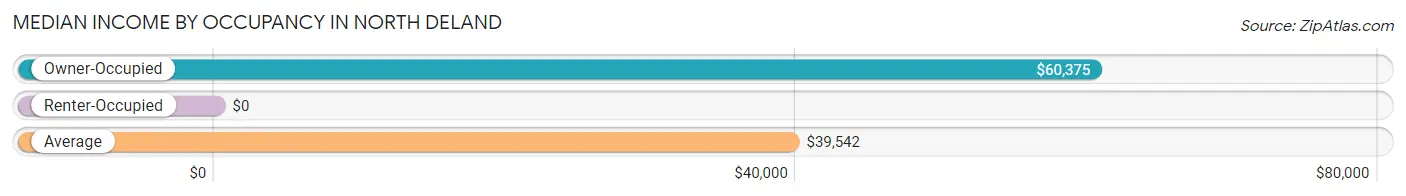
| Occupancy Type | # Households | Median Income |
| Owner-Occupied | 268 (51.5%) | $60,375 |
| Renter-Occupied | 252 (48.5%) | $0 |
| Average | 520 (100.0%) | $39,542 |
Occupancy by Householder Income Bracket in North DeLand
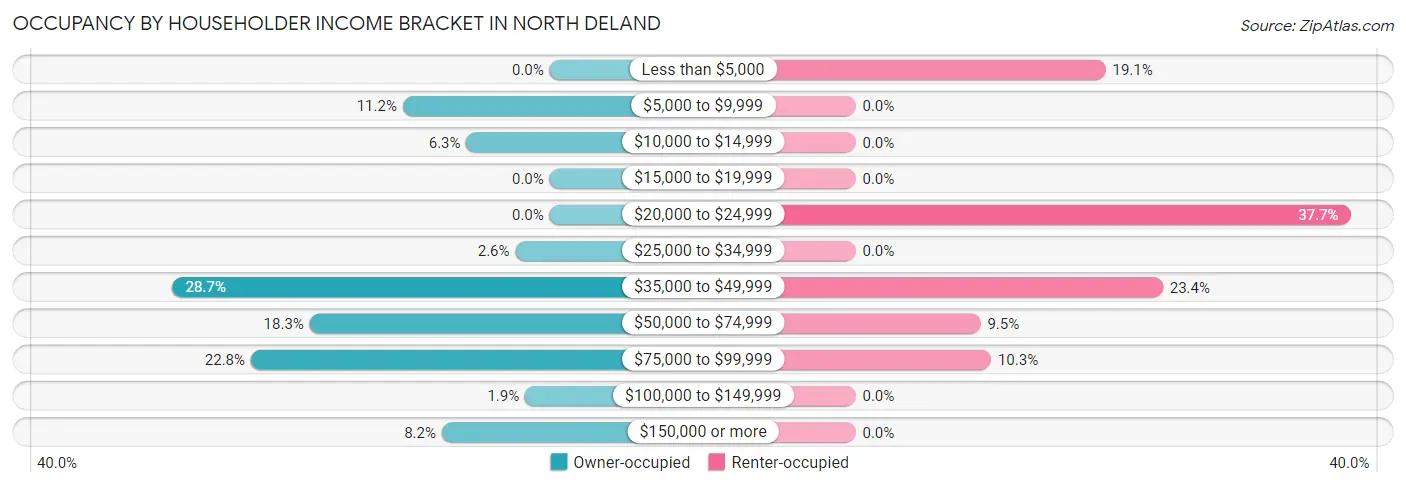
| Income Bracket | Owner-occupied | Renter-occupied |
| Less than $5,000 | 0 (0.0%) | 48 (19.1%) |
| $5,000 to $9,999 | 30 (11.2%) | 0 (0.0%) |
| $10,000 to $14,999 | 17 (6.3%) | 0 (0.0%) |
| $15,000 to $19,999 | 0 (0.0%) | 0 (0.0%) |
| $20,000 to $24,999 | 0 (0.0%) | 95 (37.7%) |
| $25,000 to $34,999 | 7 (2.6%) | 0 (0.0%) |
| $35,000 to $49,999 | 77 (28.7%) | 59 (23.4%) |
| $50,000 to $74,999 | 49 (18.3%) | 24 (9.5%) |
| $75,000 to $99,999 | 61 (22.8%) | 26 (10.3%) |
| $100,000 to $149,999 | 5 (1.9%) | 0 (0.0%) |
| $150,000 or more | 22 (8.2%) | 0 (0.0%) |
| Total | 268 (100.0%) | 252 (100.0%) |
Monthly Housing Cost Tiers in North DeLand
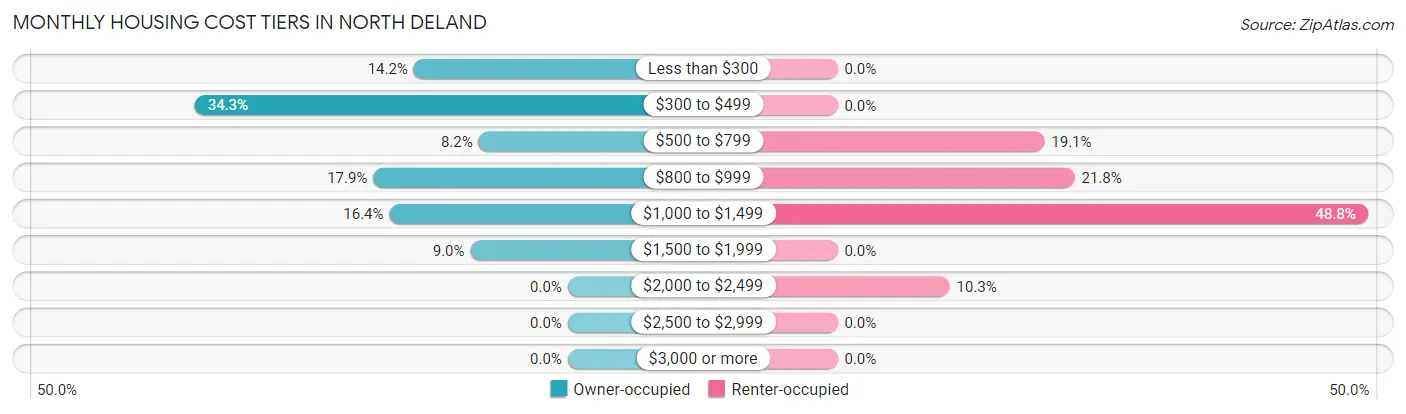
| Monthly Cost | Owner-occupied | Renter-occupied |
| Less than $300 | 38 (14.2%) | 0 (0.0%) |
| $300 to $499 | 92 (34.3%) | 0 (0.0%) |
| $500 to $799 | 22 (8.2%) | 48 (19.1%) |
| $800 to $999 | 48 (17.9%) | 55 (21.8%) |
| $1,000 to $1,499 | 44 (16.4%) | 123 (48.8%) |
| $1,500 to $1,999 | 24 (9.0%) | 0 (0.0%) |
| $2,000 to $2,499 | 0 (0.0%) | 26 (10.3%) |
| $2,500 to $2,999 | 0 (0.0%) | 0 (0.0%) |
| $3,000 or more | 0 (0.0%) | 0 (0.0%) |
| Total | 268 (100.0%) | 252 (100.0%) |
Physical Housing Characteristics in North DeLand
Housing Structures in North DeLand
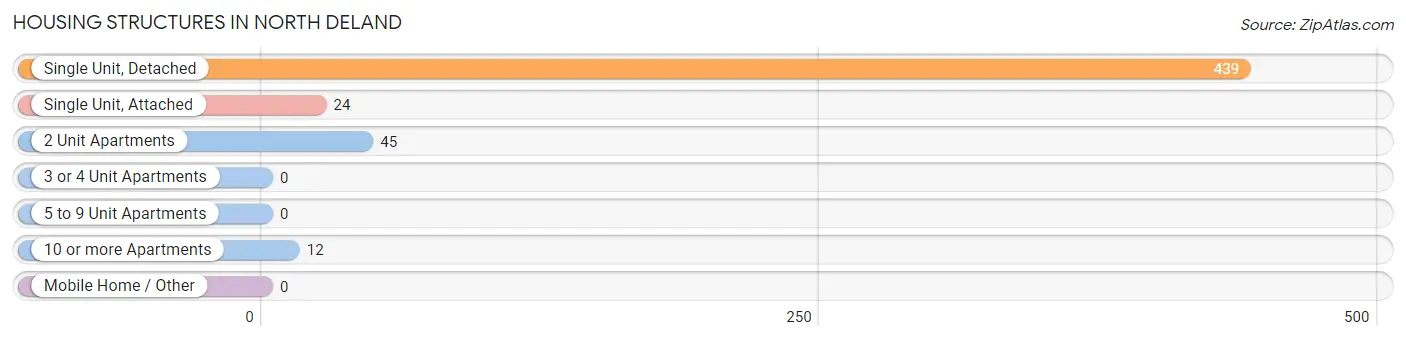
| Structure Type | # Housing Units | % Housing Units |
| Single Unit, Detached | 439 | 84.4% |
| Single Unit, Attached | 24 | 4.6% |
| 2 Unit Apartments | 45 | 8.6% |
| 3 or 4 Unit Apartments | 0 | 0.0% |
| 5 to 9 Unit Apartments | 0 | 0.0% |
| 10 or more Apartments | 12 | 2.3% |
| Mobile Home / Other | 0 | 0.0% |
| Total | 520 | 100.0% |
Housing Structures by Occupancy in North DeLand
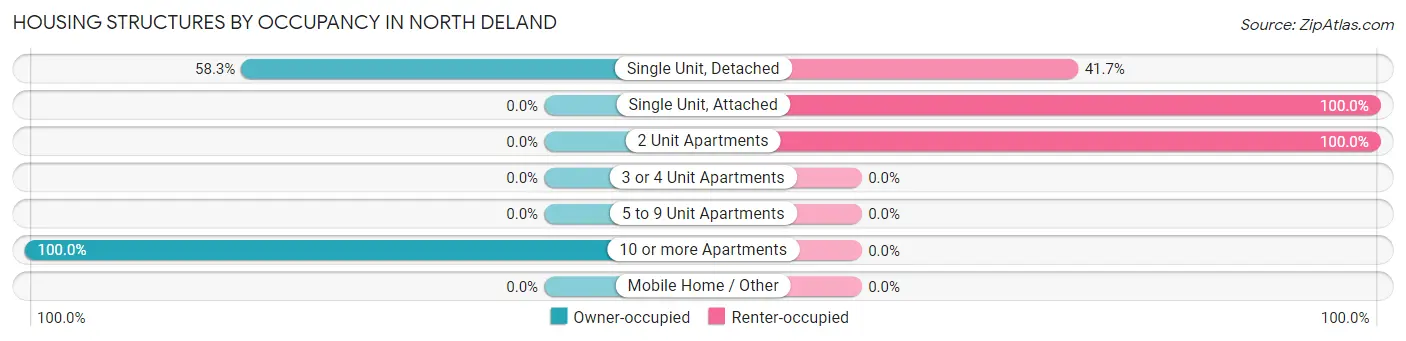
| Structure Type | Owner-occupied | Renter-occupied |
| Single Unit, Detached | 256 (58.3%) | 183 (41.7%) |
| Single Unit, Attached | 0 (0.0%) | 24 (100.0%) |
| 2 Unit Apartments | 0 (0.0%) | 45 (100.0%) |
| 3 or 4 Unit Apartments | 0 (0.0%) | 0 (0.0%) |
| 5 to 9 Unit Apartments | 0 (0.0%) | 0 (0.0%) |
| 10 or more Apartments | 12 (100.0%) | 0 (0.0%) |
| Mobile Home / Other | 0 (0.0%) | 0 (0.0%) |
| Total | 268 (51.5%) | 252 (48.5%) |
Housing Structures by Number of Rooms in North DeLand
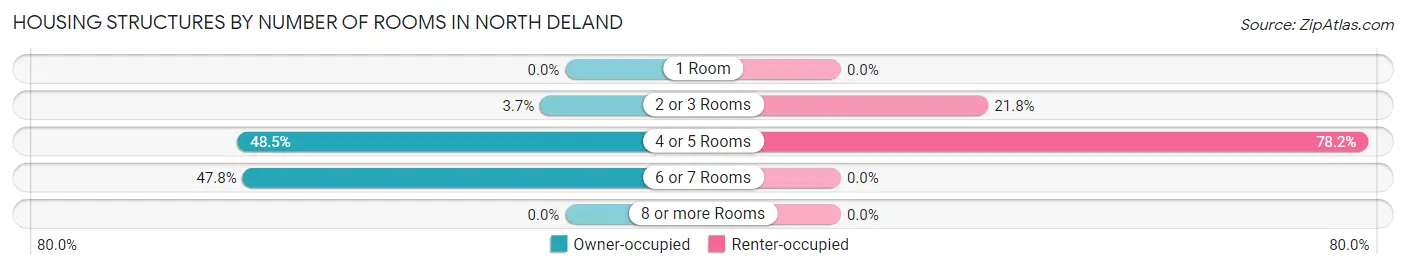
| Number of Rooms | Owner-occupied | Renter-occupied |
| 1 Room | 0 (0.0%) | 0 (0.0%) |
| 2 or 3 Rooms | 10 (3.7%) | 55 (21.8%) |
| 4 or 5 Rooms | 130 (48.5%) | 197 (78.2%) |
| 6 or 7 Rooms | 128 (47.8%) | 0 (0.0%) |
| 8 or more Rooms | 0 (0.0%) | 0 (0.0%) |
| Total | 268 (100.0%) | 252 (100.0%) |
Housing Structure by Heating Type in North DeLand
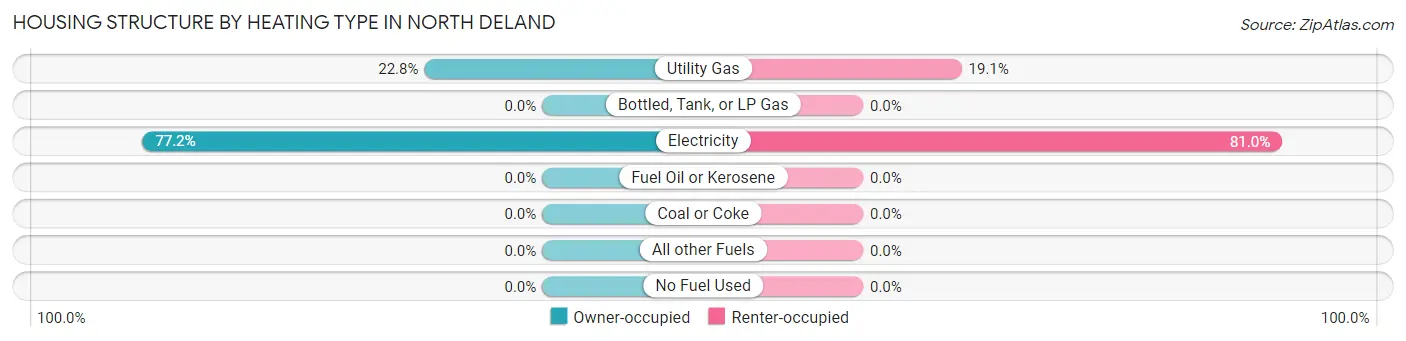
| Heating Type | Owner-occupied | Renter-occupied |
| Utility Gas | 61 (22.8%) | 48 (19.1%) |
| Bottled, Tank, or LP Gas | 0 (0.0%) | 0 (0.0%) |
| Electricity | 207 (77.2%) | 204 (80.9%) |
| Fuel Oil or Kerosene | 0 (0.0%) | 0 (0.0%) |
| Coal or Coke | 0 (0.0%) | 0 (0.0%) |
| All other Fuels | 0 (0.0%) | 0 (0.0%) |
| No Fuel Used | 0 (0.0%) | 0 (0.0%) |
| Total | 268 (100.0%) | 252 (100.0%) |
Household Vehicle Usage in North DeLand
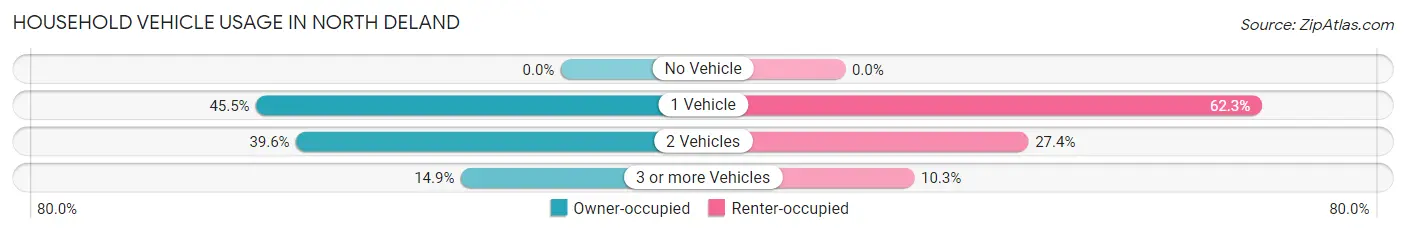
| Vehicles per Household | Owner-occupied | Renter-occupied |
| No Vehicle | 0 (0.0%) | 0 (0.0%) |
| 1 Vehicle | 122 (45.5%) | 157 (62.3%) |
| 2 Vehicles | 106 (39.6%) | 69 (27.4%) |
| 3 or more Vehicles | 40 (14.9%) | 26 (10.3%) |
| Total | 268 (100.0%) | 252 (100.0%) |
Real Estate & Mortgages in North DeLand
Real Estate and Mortgage Overview in North DeLand
| Characteristic | Without Mortgage | With Mortgage |
| Housing Units | 164 | 104 |
| Median Property Value | $184,200 | $165,600 |
| Median Household Income | $72,841 | $0 |
| Monthly Housing Costs | $348 | $0 |
| Real Estate Taxes | $1,073 | $0 |
Property Value by Mortgage Status in North DeLand
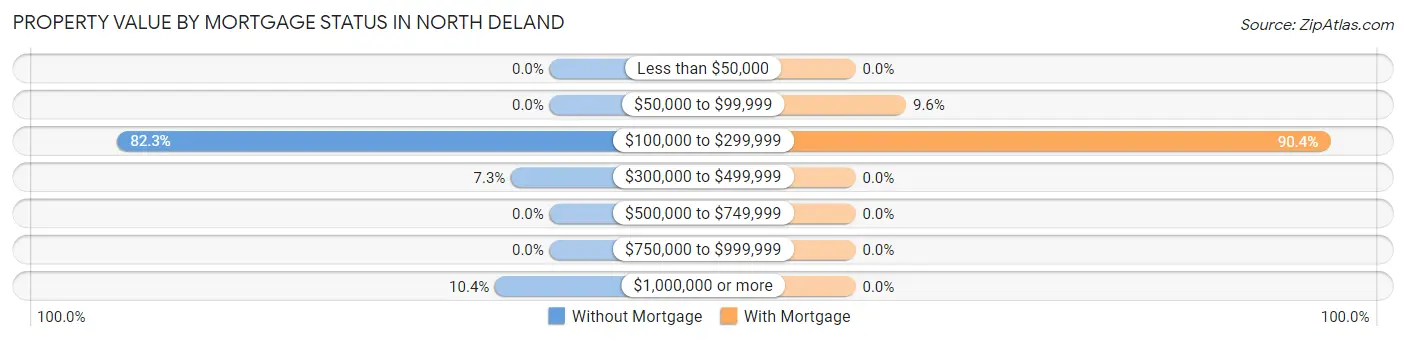
| Property Value | Without Mortgage | With Mortgage |
| Less than $50,000 | 0 (0.0%) | 0 (0.0%) |
| $50,000 to $99,999 | 0 (0.0%) | 10 (9.6%) |
| $100,000 to $299,999 | 135 (82.3%) | 94 (90.4%) |
| $300,000 to $499,999 | 12 (7.3%) | 0 (0.0%) |
| $500,000 to $749,999 | 0 (0.0%) | 0 (0.0%) |
| $750,000 to $999,999 | 0 (0.0%) | 0 (0.0%) |
| $1,000,000 or more | 17 (10.4%) | 0 (0.0%) |
| Total | 164 (100.0%) | 104 (100.0%) |
Household Income by Mortgage Status in North DeLand
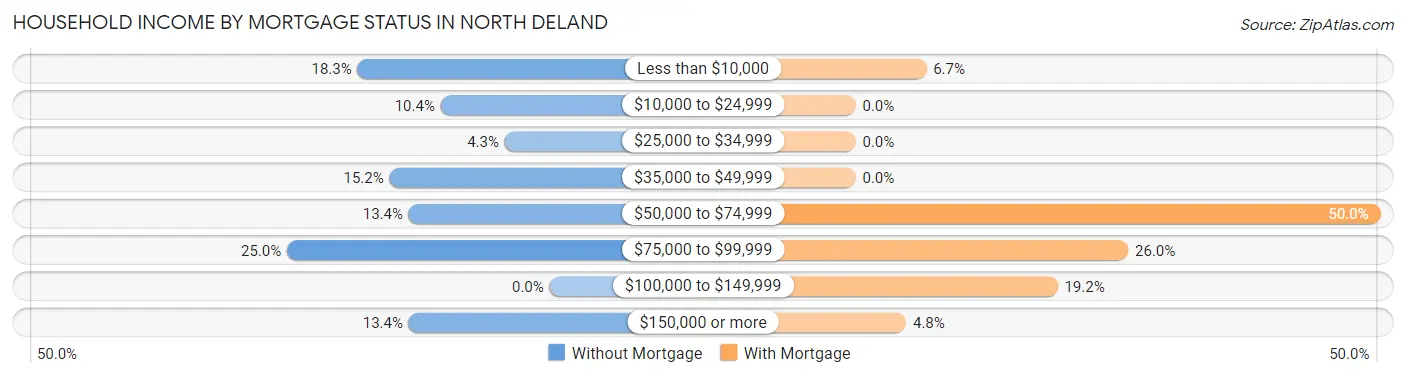
| Household Income | Without Mortgage | With Mortgage |
| Less than $10,000 | 30 (18.3%) | 7 (6.7%) |
| $10,000 to $24,999 | 17 (10.4%) | 0 (0.0%) |
| $25,000 to $34,999 | 7 (4.3%) | 0 (0.0%) |
| $35,000 to $49,999 | 25 (15.2%) | 0 (0.0%) |
| $50,000 to $74,999 | 22 (13.4%) | 52 (50.0%) |
| $75,000 to $99,999 | 41 (25.0%) | 27 (26.0%) |
| $100,000 to $149,999 | 0 (0.0%) | 20 (19.2%) |
| $150,000 or more | 22 (13.4%) | 5 (4.8%) |
| Total | 164 (100.0%) | 104 (100.0%) |
Property Value to Household Income Ratio in North DeLand
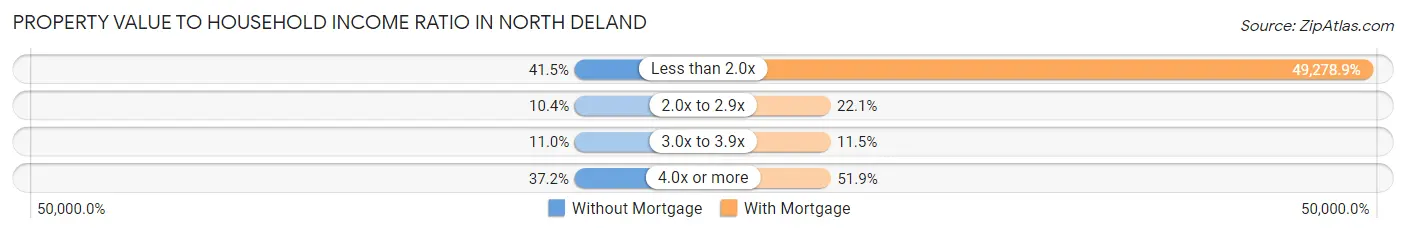
| Value-to-Income Ratio | Without Mortgage | With Mortgage |
| Less than 2.0x | 68 (41.5%) | 51,250 (49,278.8%) |
| 2.0x to 2.9x | 17 (10.4%) | 23 (22.1%) |
| 3.0x to 3.9x | 18 (11.0%) | 12 (11.5%) |
| 4.0x or more | 61 (37.2%) | 54 (51.9%) |
| Total | 164 (100.0%) | 104 (100.0%) |
Real Estate Taxes by Mortgage Status in North DeLand
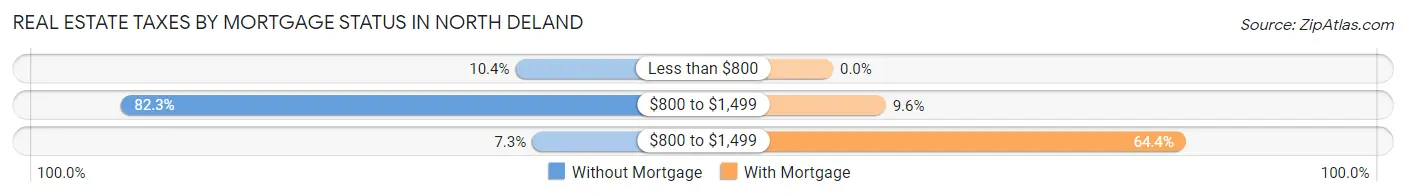
| Property Taxes | Without Mortgage | With Mortgage |
| Less than $800 | 17 (10.4%) | 0 (0.0%) |
| $800 to $1,499 | 135 (82.3%) | 10 (9.6%) |
| $800 to $1,499 | 12 (7.3%) | 67 (64.4%) |
| Total | 164 (100.0%) | 104 (100.0%) |
Health & Disability in North DeLand
Health Insurance Coverage by Age in North DeLand
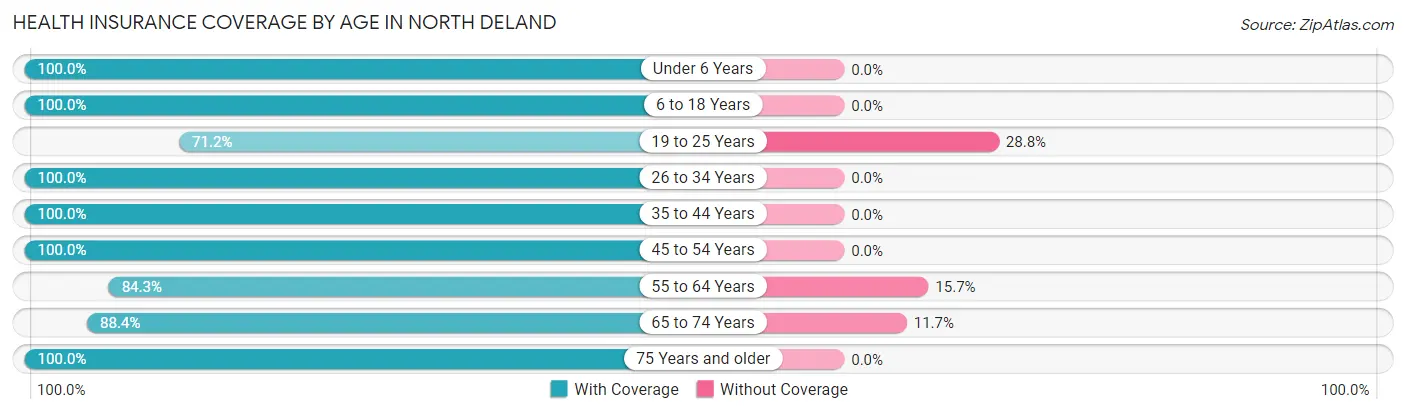
| Age Bracket | With Coverage | Without Coverage |
| Under 6 Years | 50 (100.0%) | 0 (0.0%) |
| 6 to 18 Years | 260 (100.0%) | 0 (0.0%) |
| 19 to 25 Years | 116 (71.2%) | 47 (28.8%) |
| 26 to 34 Years | 117 (100.0%) | 0 (0.0%) |
| 35 to 44 Years | 190 (100.0%) | 0 (0.0%) |
| 45 to 54 Years | 85 (100.0%) | 0 (0.0%) |
| 55 to 64 Years | 129 (84.3%) | 24 (15.7%) |
| 65 to 74 Years | 91 (88.3%) | 12 (11.7%) |
| 75 Years and older | 99 (100.0%) | 0 (0.0%) |
| Total | 1,137 (93.2%) | 83 (6.8%) |
Health Insurance Coverage by Citizenship Status in North DeLand
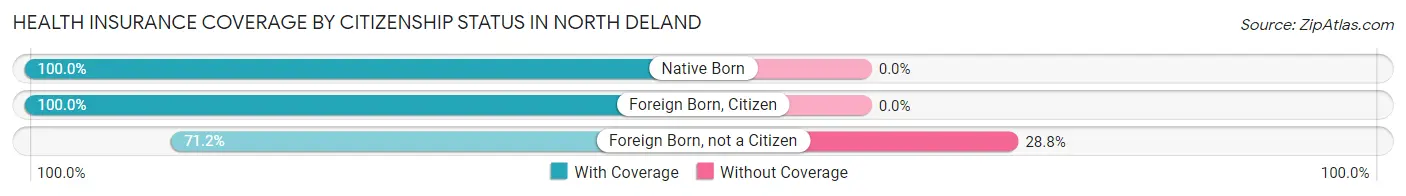
| Citizenship Status | With Coverage | Without Coverage |
| Native Born | 50 (100.0%) | 0 (0.0%) |
| Foreign Born, Citizen | 260 (100.0%) | 0 (0.0%) |
| Foreign Born, not a Citizen | 116 (71.2%) | 47 (28.8%) |
Health Insurance Coverage by Household Income in North DeLand
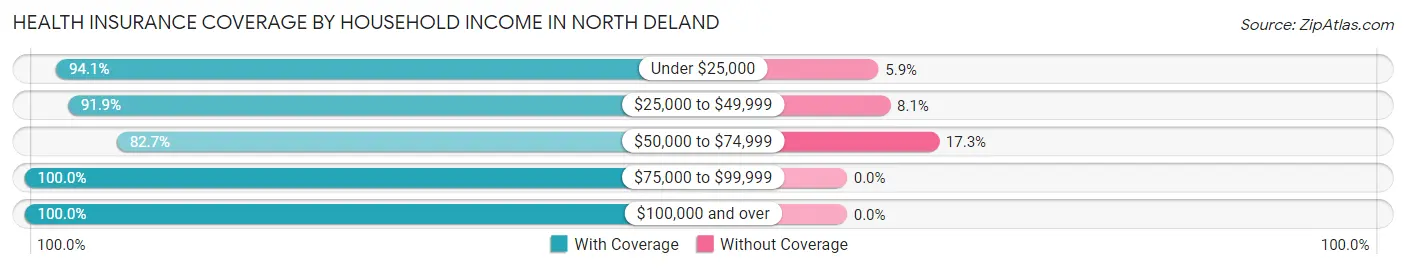
| Household Income | With Coverage | Without Coverage |
| Under $25,000 | 478 (94.1%) | 30 (5.9%) |
| $25,000 to $49,999 | 272 (91.9%) | 24 (8.1%) |
| $50,000 to $74,999 | 139 (82.7%) | 29 (17.3%) |
| $75,000 to $99,999 | 196 (100.0%) | 0 (0.0%) |
| $100,000 and over | 52 (100.0%) | 0 (0.0%) |
Public vs Private Health Insurance Coverage by Age in North DeLand
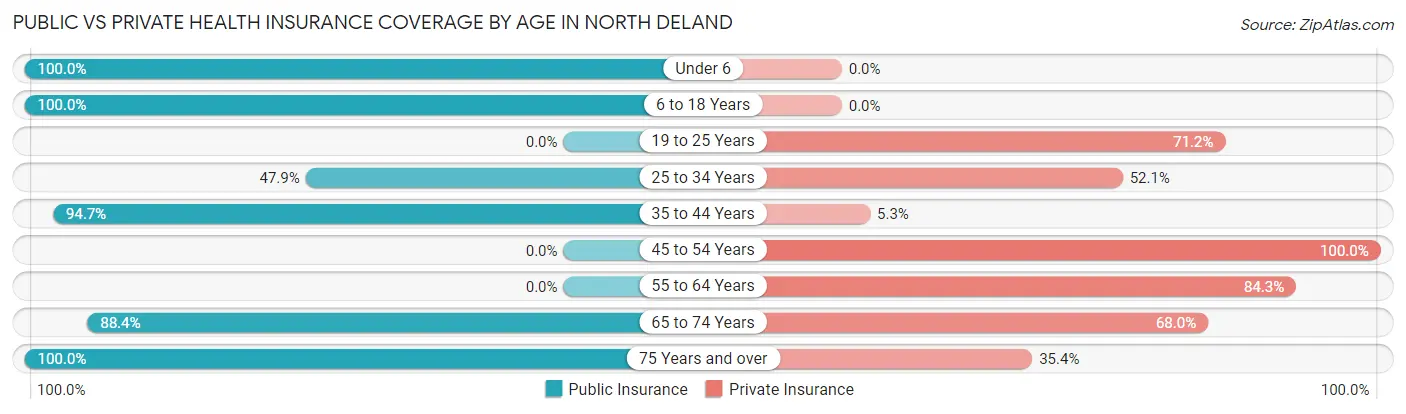
| Age Bracket | Public Insurance | Private Insurance |
| Under 6 | 50 (100.0%) | 0 (0.0%) |
| 6 to 18 Years | 260 (100.0%) | 0 (0.0%) |
| 19 to 25 Years | 0 (0.0%) | 116 (71.2%) |
| 25 to 34 Years | 56 (47.9%) | 61 (52.1%) |
| 35 to 44 Years | 180 (94.7%) | 10 (5.3%) |
| 45 to 54 Years | 0 (0.0%) | 85 (100.0%) |
| 55 to 64 Years | 0 (0.0%) | 129 (84.3%) |
| 65 to 74 Years | 91 (88.3%) | 70 (68.0%) |
| 75 Years and over | 99 (100.0%) | 35 (35.3%) |
| Total | 736 (60.3%) | 506 (41.5%) |
Disability Status by Sex by Age in North DeLand
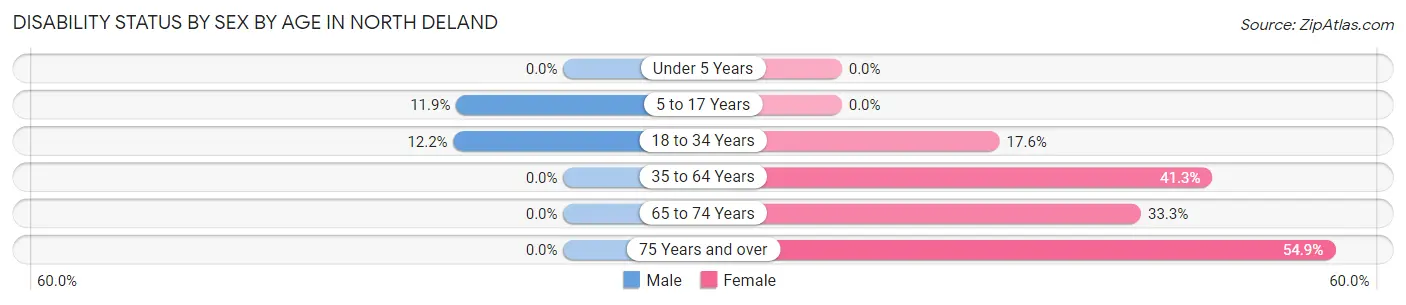
| Age Bracket | Male | Female |
| Under 5 Years | 0 (0.0%) | 0 (0.0%) |
| 5 to 17 Years | 26 (11.9%) | 0 (0.0%) |
| 18 to 34 Years | 12 (12.2%) | 32 (17.6%) |
| 35 to 64 Years | 0 (0.0%) | 85 (41.3%) |
| 65 to 74 Years | 0 (0.0%) | 16 (33.3%) |
| 75 Years and over | 0 (0.0%) | 39 (54.9%) |
Disability Class by Sex by Age in North DeLand
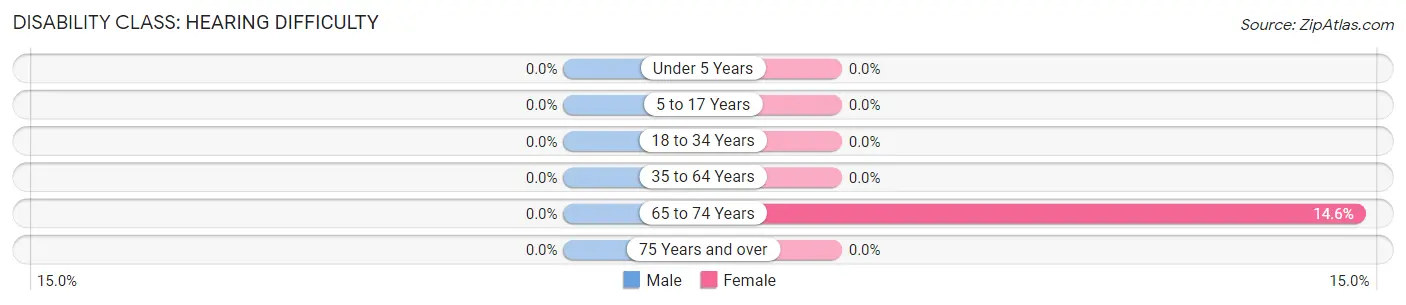
Disability Class: Hearing Difficulty
| Age Bracket | Male | Female |
| Under 5 Years | 0 (0.0%) | 0 (0.0%) |
| 5 to 17 Years | 0 (0.0%) | 0 (0.0%) |
| 18 to 34 Years | 0 (0.0%) | 0 (0.0%) |
| 35 to 64 Years | 0 (0.0%) | 0 (0.0%) |
| 65 to 74 Years | 0 (0.0%) | 7 (14.6%) |
| 75 Years and over | 0 (0.0%) | 0 (0.0%) |
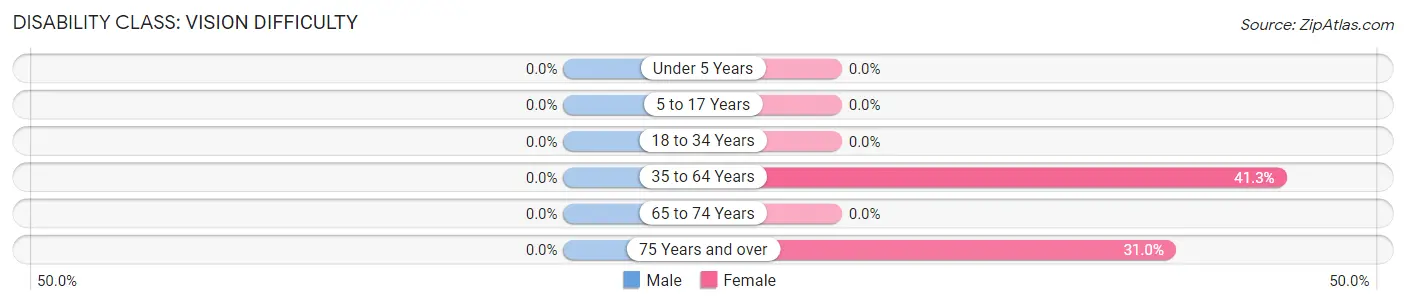
Disability Class: Vision Difficulty
| Age Bracket | Male | Female |
| Under 5 Years | 0 (0.0%) | 0 (0.0%) |
| 5 to 17 Years | 0 (0.0%) | 0 (0.0%) |
| 18 to 34 Years | 0 (0.0%) | 0 (0.0%) |
| 35 to 64 Years | 0 (0.0%) | 85 (41.3%) |
| 65 to 74 Years | 0 (0.0%) | 0 (0.0%) |
| 75 Years and over | 0 (0.0%) | 22 (31.0%) |
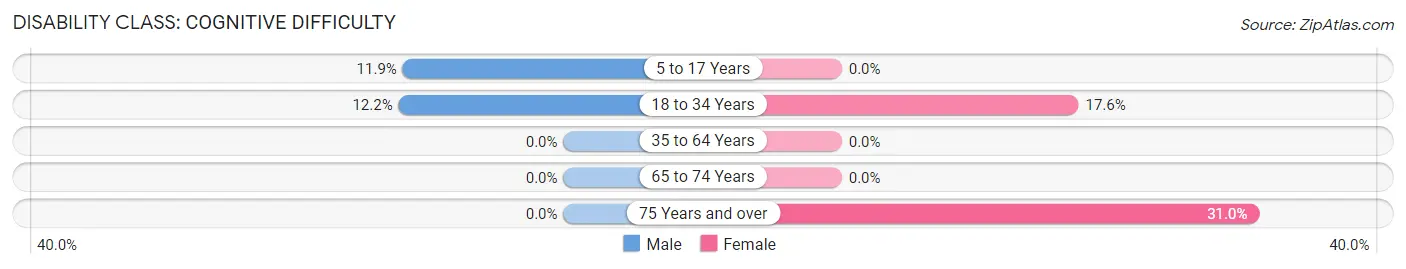
Disability Class: Cognitive Difficulty
| Age Bracket | Male | Female |
| 5 to 17 Years | 26 (11.9%) | 0 (0.0%) |
| 18 to 34 Years | 12 (12.2%) | 32 (17.6%) |
| 35 to 64 Years | 0 (0.0%) | 0 (0.0%) |
| 65 to 74 Years | 0 (0.0%) | 0 (0.0%) |
| 75 Years and over | 0 (0.0%) | 22 (31.0%) |
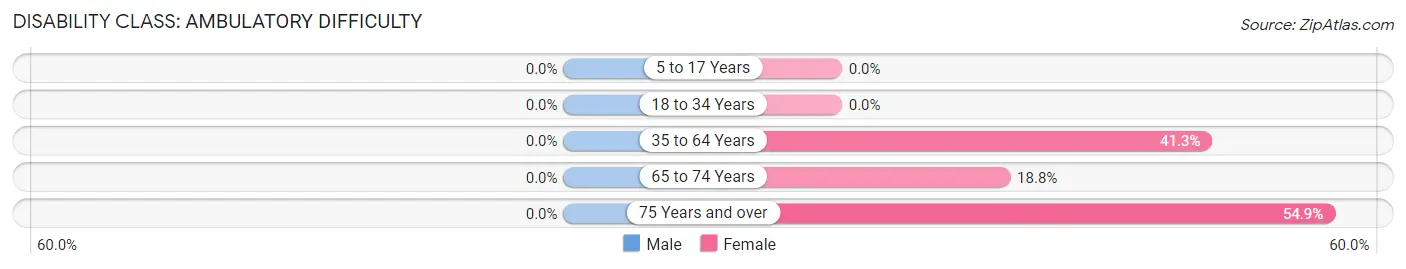
Disability Class: Ambulatory Difficulty
| Age Bracket | Male | Female |
| 5 to 17 Years | 0 (0.0%) | 0 (0.0%) |
| 18 to 34 Years | 0 (0.0%) | 0 (0.0%) |
| 35 to 64 Years | 0 (0.0%) | 85 (41.3%) |
| 65 to 74 Years | 0 (0.0%) | 9 (18.8%) |
| 75 Years and over | 0 (0.0%) | 39 (54.9%) |
Disability Class: Self-Care Difficulty
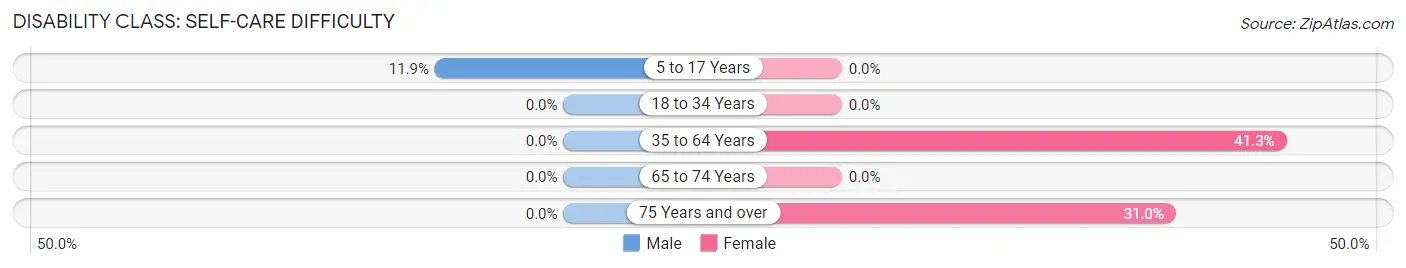
| Age Bracket | Male | Female |
| 5 to 17 Years | 26 (11.9%) | 0 (0.0%) |
| 18 to 34 Years | 0 (0.0%) | 0 (0.0%) |
| 35 to 64 Years | 0 (0.0%) | 85 (41.3%) |
| 65 to 74 Years | 0 (0.0%) | 0 (0.0%) |
| 75 Years and over | 0 (0.0%) | 22 (31.0%) |
Technology Access in North DeLand
Computing Device Access in North DeLand
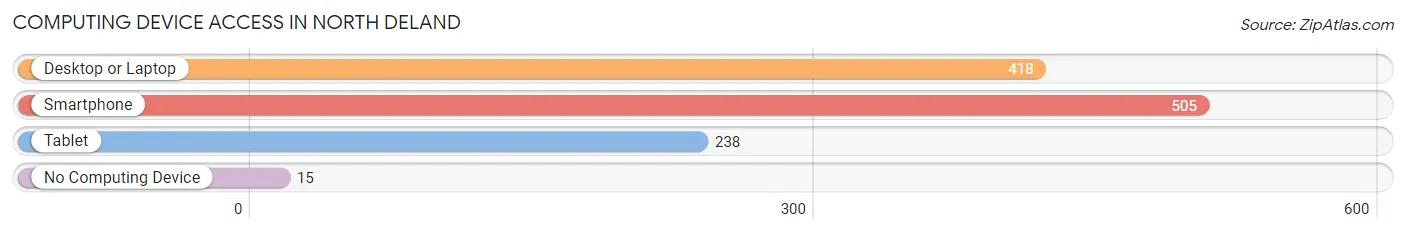
| Device Type | # Households | % Households |
| Desktop or Laptop | 418 | 80.4% |
| Smartphone | 505 | 97.1% |
| Tablet | 238 | 45.8% |
| No Computing Device | 15 | 2.9% |
| Total | 520 | 100.0% |
Internet Access in North DeLand
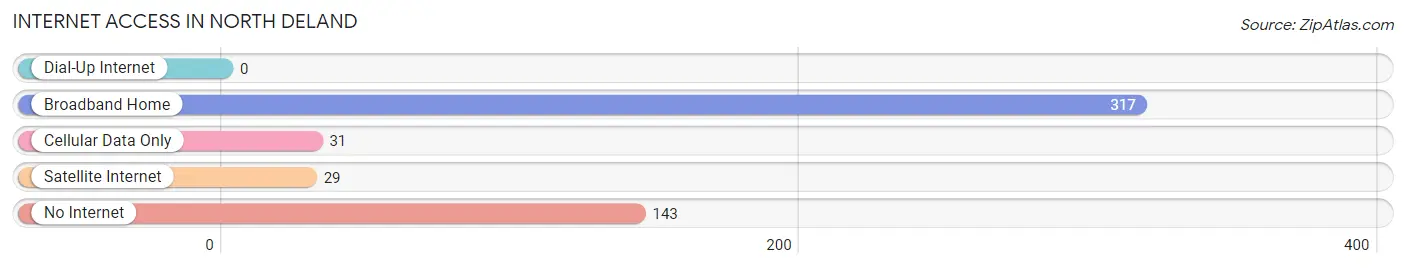
| Internet Type | # Households | % Households |
| Dial-Up Internet | 0 | 0.0% |
| Broadband Home | 317 | 61.0% |
| Cellular Data Only | 31 | 6.0% |
| Satellite Internet | 29 | 5.6% |
| No Internet | 143 | 27.5% |
| Total | 520 | 100.0% |
North DeLand Summary
Deland, Florida is a city located in Volusia County, in the central part of the state. It is the county seat and the largest city in the county. The city is located about 34 miles north of Orlando and is part of the Deltona-Daytona Beach-Ormond Beach metropolitan area. The city has a population of approximately 28,000 people and is known for its historic downtown area, which is listed on the National Register of Historic Places.
History
The area that is now Deland was first inhabited by the Timucua Indians, who were the original inhabitants of the area. The first European settlers arrived in the area in the early 1800s, and the city was officially founded in 1876. The city was named after Henry Addison DeLand, a wealthy New York businessman who purchased the land and donated it to the city.
The city quickly grew and became an important center for the citrus industry. The city was also home to several educational institutions, including Stetson University, which was founded in 1883. The university is the oldest private university in the state and is known for its law school.
Geography
Deland is located in central Florida, about 34 miles north of Orlando. The city is situated on the St. Johns River, which is the longest river in the state. The city is located in a flat, low-lying area, with an elevation of only 30 feet above sea level. The city is surrounded by several lakes, including Lake Beresford, Lake Winnemissett, and Lake Monroe.
The city has a humid subtropical climate, with hot, humid summers and mild winters. The average temperature in the summer is around 90 degrees Fahrenheit, and the average temperature in the winter is around 60 degrees Fahrenheit.
Economy
The economy of Deland is largely based on the service industry, with many businesses providing services to the local population. The city is also home to several manufacturing companies, including a paper mill and a printing company. The city is also home to several educational institutions, including Stetson University and Daytona State College.
The city is also home to several tourist attractions, including the Stetson Mansion, the DeLand Naval Air Station Museum, and the DeLand Historic District. The city is also home to several parks, including the Gemini Springs Park and the Blue Spring State Park.
Demographics
As of the 2010 census, Deland had a population of 28,237 people. The racial makeup of the city was 75.3% White, 17.2% African American, 0.5% Native American, 1.7% Asian, 0.1% Pacific Islander, and 4.2% from other races. Hispanic or Latino of any race were 11.3% of the population.
The median income for a household in the city was $37,845, and the median income for a family was $45,945. The per capita income for the city was $20,945. About 17.2% of the population was below the poverty line.
Deland is a diverse city, with a variety of cultures and backgrounds represented. The city is home to a large number of churches, including Baptist, Methodist, and Catholic churches. The city is also home to several museums, including the DeLand Naval Air Station Museum and the Stetson Mansion. The city is also home to several parks, including Gemini Springs Park and Blue Spring State Park.
Common Questions
What is Per Capita Income in North DeLand?
Per Capita income in North DeLand is $23,191.
What is the Median Family Income in North DeLand?
Median Family Income in North DeLand is $38,056.
What is the Median Household income in North DeLand?
Median Household Income in North DeLand is $39,542.
What is Income or Wage Gap in North DeLand?
Income or Wage Gap in North DeLand is 19.5%.
Women in North DeLand earn 80.5 cents for every dollar earned by a man.
What is Inequality or Gini Index in North DeLand?
Inequality or Gini Index in North DeLand is 0.46.
What is the Total Population of North DeLand?
Total Population of North DeLand is 1,220.
What is the Total Male Population of North DeLand?
Total Male Population of North DeLand is 671.
What is the Total Female Population of North DeLand?
Total Female Population of North DeLand is 549.
What is the Ratio of Males per 100 Females in North DeLand?
There are 122.22 Males per 100 Females in North DeLand.
What is the Ratio of Females per 100 Males in North DeLand?
There are 81.82 Females per 100 Males in North DeLand.
What is the Median Population Age in North DeLand?
Median Population Age in North DeLand is 35.4 Years.
What is the Average Family Size in North DeLand
Average Family Size in North DeLand is 2.7 People.
What is the Average Household Size in North DeLand
Average Household Size in North DeLand is 2.4 People.
How Large is the Labor Force in North DeLand?
There are 459 People in the Labor Forcein in North DeLand.
What is the Percentage of People in the Labor Force in North DeLand?
50.4% of People are in the Labor Force in North DeLand.
What is the Unemployment Rate in North DeLand?
Unemployment Rate in North DeLand is 5.2%.