Venezuelan Married-Couple Family Poverty

COMPARE

Venezuelan
Race
Ancestry
AfghanAfricanAlaska NativeAlaskan AthabascanAlbanianAleutAlsatianAmericanApacheArabArapahoArgentineanArmenianAssyrian/Chaldean/SyriacAustralianAustrianBahamianBangladeshiBarbadianBasqueBelgianBelizeanBermudanBhutaneseBlackfeetBolivianBrazilianBritishBritish West IndianBulgarianBurmeseCajunCambodianCanadianCape VerdeanCarpatho RusynCelticCentral AmericanCentral American IndianCherokeeCheyenneChickasawChileanChineseChippewaChoctawColombianColvilleComancheCosta RicanCreeCreekCroatianCrowCubanCypriotCzechCzechoslovakianDanishDelawareDominicanDutchDutch West IndianEastern EuropeanEcuadorianEgyptianEnglishEstonianEthiopianEuropeanFijianFilipinoFinnishFrenchFrench American IndianFrench CanadianGermanGerman RussianGhanaianGreekGuamanian/ChamorroGuatemalanGuyaneseHaitianHmongHonduranHopiHoumaHungarianIcelanderIndian (Asian)IndonesianInupiatIranianIraqiIrishIroquoisIsraeliItalianJamaicanJapaneseJordanianKenyanKiowaKoreanLaotianLatvianLebaneseLiberianLithuanianLumbeeLuxembourgerMacedonianMalaysianMalteseMarshalleseMenomineeMexicanMexican American IndianMongolianMoroccanNative HawaiianNavajoNepaleseNew ZealanderNicaraguanNigerianNorthern EuropeanNorwegianOkinawanOsageOttawaPaiutePakistaniPalestinianPanamanianParaguayanPennsylvania GermanPeruvianPimaPolishPortuguesePotawatomiPuebloPuerto RicanPuget Sound SalishRomanianRussianSalvadoranSamoanScandinavianScotch-IrishScottishSeminoleSenegaleseSerbianShoshoneSierra LeoneanSiouxSlavicSlovakSloveneSomaliSouth AfricanSouth AmericanSouth American IndianSoviet UnionSpaniardSpanishSpanish AmericanSpanish American IndianSri LankanSubsaharan AfricanSudaneseSwedishSwissSyrianTaiwaneseThaiTlingit-HaidaTohono O'OdhamTonganTrinidadian and TobagonianTsimshianTurkishU.S. Virgin IslanderUgandanUkrainianUruguayanUteVenezuelanVietnameseWelshWest IndianYakamaYaquiYugoslavianYumanYup'ikZimbabwean
Immigration
NonimmigrantsImmigrantsAfghanistanAfricaAlbaniaArgentinaArmeniaAsiaAustraliaAustriaBahamasBangladeshBarbadosBelarusBelgiumBelizeBoliviaBosnia and HerzegovinaBrazilBulgariaBurma/MyanmarCabo VerdeCambodiaCameroonCanadaCaribbeanCentral AmericaChileChinaColombiaCongoCosta RicaCroatiaCubaCzechoslovakiaDenmarkDominicaDominican RepublicEastern AfricaEastern AsiaEastern EuropeEcuadorEgyptEl SalvadorEnglandEritreaEthiopiaEuropeFijiFranceGermanyGhanaGreeceGrenadaGuatemalaGuyanaHaitiHondurasHong KongHungaryIndiaIndonesiaIranIraqIrelandIsraelItalyJamaicaJapanJordanKazakhstanKenyaKoreaKuwaitLaosLatin AmericaLatviaLebanonLiberiaLithuaniaMalaysiaMexicoMicronesiaMiddle AfricaMoldovaMoroccoNepalNetherlandsNicaraguaNigeriaNorth AmericaNorth MacedoniaNorthern AfricaNorthern EuropeNorwayOceaniaPakistanPanamaPeruPhilippinesPolandPortugalRomaniaRussiaSaudi ArabiaScotlandSenegalSerbiaSierra LeoneSingaporeSomaliaSouth AfricaSouth AmericaSouth Central AsiaSouth Eastern AsiaSouthern EuropeSpainSri LankaSt. Vincent and the GrenadinesSudanSwedenSwitzerlandSyriaTaiwanThailandTrinidad and TobagoTurkeyUgandaUkraineUruguayUzbekistanVenezuelaVietnamWest IndiesWestern AfricaWestern AsiaWestern EuropeYemenZaireZimbabweAzores
Select to Compare
Race
Ancestry
AfghanAfricanAlaska NativeAlaskan AthabascanAlbanianAleutAlsatianAmericanApacheArabArapahoArgentineanArmenianAssyrian/Chaldean/SyriacAustralianAustrianBahamianBangladeshiBarbadianBasqueBelgianBelizeanBermudanBhutaneseBlackfeetBolivianBrazilianBritishBritish West IndianBulgarianBurmeseCajunCambodianCanadianCape VerdeanCarpatho RusynCelticCentral AmericanCentral American IndianCherokeeCheyenneChickasawChileanChineseChippewaChoctawColombianColvilleComancheCosta RicanCreeCreekCroatianCrowCubanCypriotCzechCzechoslovakianDanishDelawareDominicanDutchDutch West IndianEastern EuropeanEcuadorianEgyptianEnglishEstonianEthiopianEuropeanFijianFilipinoFinnishFrenchFrench American IndianFrench CanadianGermanGerman RussianGhanaianGreekGuamanian/ChamorroGuatemalanGuyaneseHaitianHmongHonduranHopiHoumaHungarianIcelanderIndian (Asian)IndonesianInupiatIranianIraqiIrishIroquoisIsraeliItalianJamaicanJapaneseJordanianKenyanKiowaKoreanLaotianLatvianLebaneseLiberianLithuanianLumbeeLuxembourgerMacedonianMalaysianMalteseMarshalleseMenomineeMexicanMexican American IndianMongolianMoroccanNative HawaiianNavajoNepaleseNew ZealanderNicaraguanNigerianNorthern EuropeanNorwegianOkinawanOsageOttawaPaiutePakistaniPalestinianPanamanianParaguayanPennsylvania GermanPeruvianPimaPolishPortuguesePotawatomiPuebloPuerto RicanPuget Sound SalishRomanianRussianSalvadoranSamoanScandinavianScotch-IrishScottishSeminoleSenegaleseSerbianShoshoneSierra LeoneanSiouxSlavicSlovakSloveneSomaliSouth AfricanSouth AmericanSouth American IndianSoviet UnionSpaniardSpanishSpanish AmericanSpanish American IndianSri LankanSubsaharan AfricanSudaneseSwedishSwissSyrianTaiwaneseThaiTlingit-HaidaTohono O'OdhamTonganTrinidadian and TobagonianTsimshianTurkishU.S. Virgin IslanderUgandanUkrainianUruguayanUteVietnameseWelshWest IndianYakamaYaquiYugoslavianYumanYup'ikZimbabwean
Immigration
NonimmigrantsImmigrantsAfghanistanAfricaAlbaniaArgentinaArmeniaAsiaAustraliaAustriaBahamasBangladeshBarbadosBelarusBelgiumBelizeBoliviaBosnia and HerzegovinaBrazilBulgariaBurma/MyanmarCabo VerdeCambodiaCameroonCanadaCaribbeanCentral AmericaChileChinaColombiaCongoCosta RicaCroatiaCubaCzechoslovakiaDenmarkDominicaDominican RepublicEastern AfricaEastern AsiaEastern EuropeEcuadorEgyptEl SalvadorEnglandEritreaEthiopiaEuropeFijiFranceGermanyGhanaGreeceGrenadaGuatemalaGuyanaHaitiHondurasHong KongHungaryIndiaIndonesiaIranIraqIrelandIsraelItalyJamaicaJapanJordanKazakhstanKenyaKoreaKuwaitLaosLatin AmericaLatviaLebanonLiberiaLithuaniaMalaysiaMexicoMicronesiaMiddle AfricaMoldovaMoroccoNepalNetherlandsNicaraguaNigeriaNorth AmericaNorth MacedoniaNorthern AfricaNorthern EuropeNorwayOceaniaPakistanPanamaPeruPhilippinesPolandPortugalRomaniaRussiaSaudi ArabiaScotlandSenegalSerbiaSierra LeoneSingaporeSomaliaSouth AfricaSouth AmericaSouth Central AsiaSouth Eastern AsiaSouthern EuropeSpainSri LankaSt. Vincent and the GrenadinesSudanSwedenSwitzerlandSyriaTaiwanThailandTrinidad and TobagoTurkeyUgandaUkraineUruguayUzbekistanVenezuelaVietnamWest IndiesWestern AfricaWestern AsiaWestern EuropeYemenZaireZimbabweAzores
Married-Couple Family Poverty
Income
Poverty
Unemployment
Labor Participation
Family Structure
Vehicle Availability
Education Level
Disability

Venezuelan Married-Couple Family Poverty
Tragic

5.8%
POVERTY | MARRIED-COUPLE FAMILIES
2.7/ 100
METRIC RATING
239th/ 347
METRIC RANK

Venezuelan Married-Couple Family Poverty Correlation Chart

The statistical analysis conducted on geographies consisting of 304,730,206 people shows a slight positive correlation between the proportion of Venezuelans and poverty level among married-couple families in the United States with a correlation coefficient (R) of 0.091 and weighted average of 5.8%. On average, for every 1% (one percent) increase in Venezuelans within a typical geography, there is an increase of 0.020% in poverty level among married-couple families.
Venezuelan Married-Couple Family Poverty
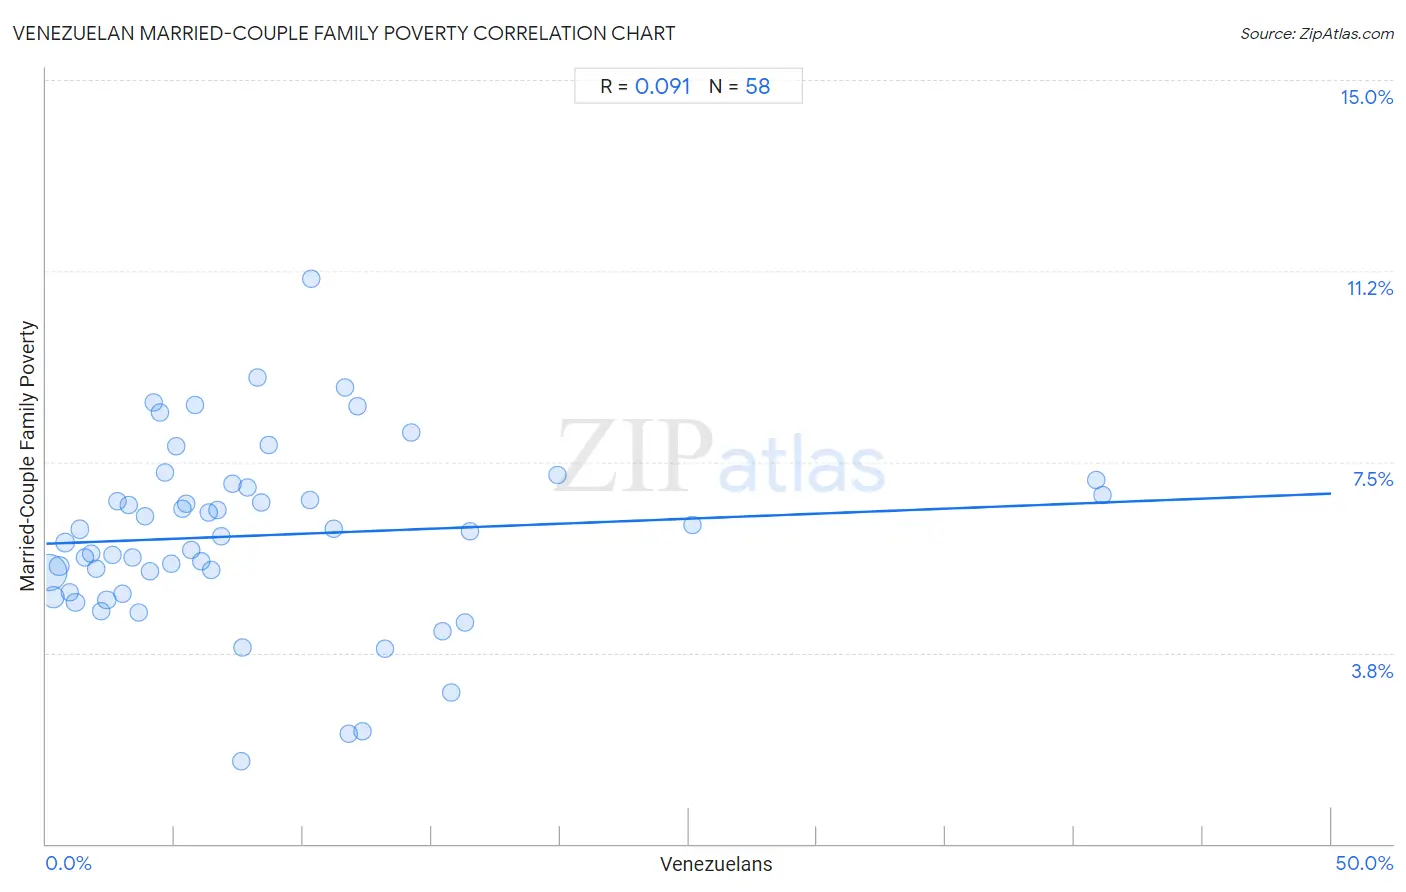
It is essential to understand that the correlation between the percentage of Venezuelans and poverty level among married-couple families does not imply a direct cause-and-effect relationship. It remains uncertain whether the presence of Venezuelans influences an upward or downward trend in the level of poverty level among married-couple families within an area, or if Venezuelans simply ended up residing in those areas with higher or lower levels of poverty level among married-couple families due to other factors.

Demographics Similar to Venezuelans by Married-Couple Family Poverty

In terms of married-couple family poverty, the demographic groups most similar to Venezuelans are Cherokee (5.8%, a difference of 0.020%), Fijian (5.8%, a difference of 0.17%), Immigrants from Panama (5.8%, a difference of 0.19%), Immigrants from Western Africa (5.8%, a difference of 0.28%), and Immigrants from South America (5.7%, a difference of 0.40%).
DemographicsRating | RankMarried-Couple Family Poverty
Immigrants from Laos
4.4
/100
|
#232
Tragic
5.7%
Immigrants from Colombia
3.7
/100
|
#233
Tragic
5.7%
Immigrants from Uruguay
3.7
/100
|
#234
Tragic
5.7%
Immigrants from Sudan
3.5
/100
|
#235
Tragic
5.7%
Ghanaians
3.3
/100
|
#236
Tragic
5.7%
Immigrants from South America
3.1
/100
|
#237
Tragic
5.7%
Cherokee
2.7
/100
|
#238
Tragic
5.8%
Venezuelans
2.7
/100
|
#239
Tragic
5.8%
Fijians
2.5
/100
|
#240
Tragic
5.8%
Immigrants from Panama
2.5
/100
|
#241
Tragic
5.8%
Immigrants from Western Africa
2.4
/100
|
#242
Tragic
5.8%
Somalis
2.3
/100
|
#243
Tragic
5.8%
Chickasaw
2.3
/100
|
#244
Tragic
5.8%
Immigrants from Afghanistan
2.1
/100
|
#245
Tragic
5.8%
Immigrants from Venezuela
1.8
/100
|
#246
Tragic
5.8%

Venezuelan Married-Couple Family Poverty Correlation Summary

MeasurementVenezuelan DataMarried-Couple Family Poverty Data
Minimum0.089%1.6%
Maximum41.1%11.1%
Range41.0%9.5%
Mean8.1%6.1%
Median5.9%6.1%
Interquartile 25% (IQ1)3.0%4.9%
Interquartile 75% (IQ3)11.2%7.0%
Interquartile Range (IQR)8.2%2.1%
Standard Deviation (Sample)8.2%1.8%
Standard Deviation (Population)8.1%1.8%

Correlation Details

Venezuelan PercentileSample SizeMarried-Couple Family Poverty
[
0.0%
-
0.5%
]
0.089%
203,241,9055.3%
[
0.0%
-
0.5%
]
0.29%
46,787,3214.8%
[
0.5%
-
1.0%
]
0.50%
18,295,2925.4%
[
0.5%
-
1.0%
]
0.72%
11,231,9875.9%
[
0.5%
-
1.0%
]
0.92%
5,549,6754.9%
[
1.0%
-
1.5%
]
1.13%
3,530,2254.7%
[
1.0%
-
1.5%
]
1.32%
2,802,1226.2%
[
1.5%
-
2.0%
]
1.53%
1,041,6195.6%
[
1.5%
-
2.0%
]
1.76%
1,527,8295.7%
[
1.5%
-
2.0%
]
1.94%
1,179,4655.4%
[
2.0%
-
2.5%
]
2.16%
927,9784.6%
[
2.0%
-
2.5%
]
2.36%
1,240,9464.8%
[
2.5%
-
3.0%
]
2.55%
703,2965.7%
[
2.5%
-
3.0%
]
2.79%
840,3526.7%
[
2.5%
-
3.0%
]
2.96%
414,5714.9%
[
3.0%
-
3.5%
]
3.20%
305,9496.7%
[
3.0%
-
3.5%
]
3.36%
80,4225.6%
[
3.5%
-
4.0%
]
3.59%
331,8644.5%
[
3.5%
-
4.0%
]
3.82%
291,4266.4%
[
4.0%
-
4.5%
]
4.02%
380,2425.4%
[
4.0%
-
4.5%
]
4.17%
1,048,3358.7%
[
4.0%
-
4.5%
]
4.41%
412,5848.5%
[
4.5%
-
5.0%
]
4.61%
381,4937.3%
[
4.5%
-
5.0%
]
4.88%
31,5465.5%
[
5.0%
-
5.5%
]
5.04%
214,9507.8%
[
5.0%
-
5.5%
]
5.30%
229,6556.6%
[
5.0%
-
5.5%
]
5.44%
117,7356.7%
[
5.5%
-
6.0%
]
5.66%
143,2255.8%
[
5.5%
-
6.0%
]
5.79%
53,5168.6%
[
6.0%
-
6.5%
]
6.02%
74,7035.5%
[
6.0%
-
6.5%
]
6.33%
54,1876.5%
[
6.0%
-
6.5%
]
6.44%
71,2935.4%
[
6.5%
-
7.0%
]
6.68%
293,5566.6%
[
6.5%
-
7.0%
]
6.83%
8,0246.0%
[
7.0%
-
7.5%
]
7.26%
55,2037.1%
[
7.5%
-
8.0%
]
7.58%
25,4181.6%
[
7.5%
-
8.0%
]
7.65%
89,0953.8%
[
7.5%
-
8.0%
]
7.84%
40,4677.0%
[
8.0%
-
8.5%
]
8.21%
7,3169.2%
[
8.0%
-
8.5%
]
8.37%
23,7086.7%
[
8.5%
-
9.0%
]
8.67%
81,6437.8%
[
10.0%
-
10.5%
]
10.25%
19,8956.8%
[
10.0%
-
10.5%
]
10.34%
57,32711.1%
[
11.0%
-
11.5%
]
11.18%
121,0786.2%
[
11.5%
-
12.0%
]
11.61%
14,5579.0%
[
11.5%
-
12.0%
]
11.77%
1,8102.2%
[
12.0%
-
12.5%
]
12.10%
20,0348.6%
[
12.0%
-
12.5%
]
12.28%
26,0212.2%
[
13.0%
-
13.5%
]
13.17%
22,5403.8%
[
14.0%
-
14.5%
]
14.19%
1,0578.1%
[
15.0%
-
15.5%
]
15.42%
68,0294.2%
[
15.5%
-
16.0%
]
15.77%
11,8093.0%
[
16.0%
-
16.5%
]
16.28%
31,5144.4%
[
16.0%
-
16.5%
]
16.50%
26,3646.1%
[
19.5%
-
20.0%
]
19.89%
5487.2%
[
25.0%
-
25.5%
]
25.14%
5,8436.3%
[
40.5%
-
41.0%
]
40.84%
64,7517.1%
[
41.0%
-
41.5%
]
41.11%
74,8916.8%