Sudanese Female Disability
COMPARE
Sudanese
Select to Compare
Female Disability
Sudanese Female Disability
12.0%
DISABILITY | FEMALES
79.1/ 100
METRIC RATING
153rd/ 347
METRIC RANK
Sudanese Female Disability Correlation Chart
The statistical analysis conducted on geographies consisting of 110,131,007 people shows a weak positive correlation between the proportion of Sudanese and percentage of females with a disability in the United States with a correlation coefficient (R) of 0.263 and weighted average of 12.0%. On average, for every 1% (one percent) increase in Sudanese within a typical geography, there is an increase of 0.39% in percentage of females with a disability.
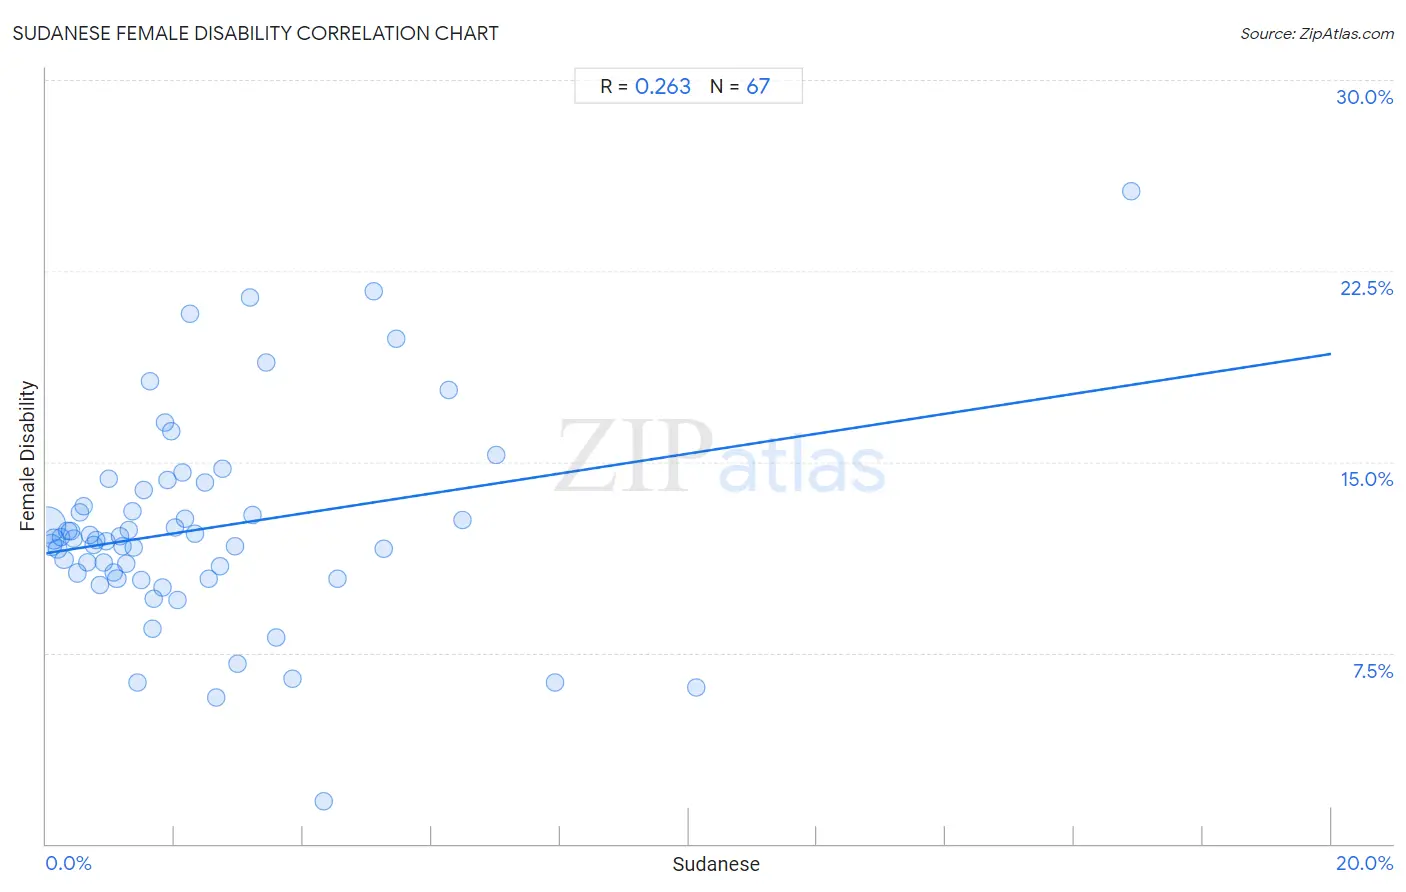
It is essential to understand that the correlation between the percentage of Sudanese and percentage of females with a disability does not imply a direct cause-and-effect relationship. It remains uncertain whether the presence of Sudanese influences an upward or downward trend in the level of percentage of females with a disability within an area, or if Sudanese simply ended up residing in those areas with higher or lower levels of percentage of females with a disability due to other factors.
Demographics Similar to Sudanese by Female Disability
In terms of female disability, the demographic groups most similar to Sudanese are Immigrants from Scotland (12.0%, a difference of 0.010%), Icelander (12.0%, a difference of 0.090%), Syrian (12.1%, a difference of 0.13%), Immigrants from Moldova (12.0%, a difference of 0.14%), and Ghanaian (12.1%, a difference of 0.14%).
| Demographics | Rating | Rank | Female Disability |
| Pakistanis | 84.6 /100 | #146 | Excellent 12.0% |
| Nigerians | 84.0 /100 | #147 | Excellent 12.0% |
| Immigrants from Kenya | 83.1 /100 | #148 | Excellent 12.0% |
| Greeks | 82.0 /100 | #149 | Excellent 12.0% |
| Immigrants from Moldova | 81.4 /100 | #150 | Excellent 12.0% |
| Icelanders | 80.7 /100 | #151 | Excellent 12.0% |
| Immigrants from Scotland | 79.3 /100 | #152 | Good 12.0% |
| Sudanese | 79.1 /100 | #153 | Good 12.0% |
| Syrians | 76.9 /100 | #154 | Good 12.1% |
| Ghanaians | 76.6 /100 | #155 | Good 12.1% |
| Moroccans | 72.9 /100 | #156 | Good 12.1% |
| Danes | 72.5 /100 | #157 | Good 12.1% |
| Immigrants from Middle Africa | 72.4 /100 | #158 | Good 12.1% |
| Immigrants from Central America | 67.7 /100 | #159 | Good 12.1% |
| Immigrants from Guatemala | 66.0 /100 | #160 | Good 12.1% |
Sudanese Female Disability Correlation Summary
| Measurement | Sudanese Data | Female Disability Data |
| Minimum | 0.020% | 1.7% |
| Maximum | 16.9% | 25.6% |
| Range | 16.9% | 23.9% |
| Mean | 2.5% | 12.4% |
| Median | 1.7% | 12.0% |
| Interquartile 25% (IQ1) | 0.83% | 10.4% |
| Interquartile 75% (IQ3) | 3.0% | 13.9% |
| Interquartile Range (IQR) | 2.1% | 3.5% |
| Standard Deviation (Sample) | 2.7% | 4.0% |
| Standard Deviation (Population) | 2.7% | 4.0% |
Correlation Details
| Sudanese Percentile | Sample Size | Female Disability |
[ 0.0% - 0.5% ] 0.020% | 68,861,930 | 12.5% |
[ 0.0% - 0.5% ] 0.075% | 13,846,924 | 11.8% |
[ 0.0% - 0.5% ] 0.13% | 7,057,181 | 12.0% |
[ 0.0% - 0.5% ] 0.18% | 3,642,218 | 11.6% |
[ 0.0% - 0.5% ] 0.22% | 2,485,123 | 12.0% |
[ 0.0% - 0.5% ] 0.28% | 2,244,667 | 11.2% |
[ 0.0% - 0.5% ] 0.33% | 2,748,991 | 12.3% |
[ 0.0% - 0.5% ] 0.38% | 902,675 | 12.3% |
[ 0.0% - 0.5% ] 0.43% | 1,073,442 | 12.0% |
[ 0.0% - 0.5% ] 0.48% | 975,332 | 10.6% |
[ 0.5% - 1.0% ] 0.53% | 1,002,090 | 13.0% |
[ 0.5% - 1.0% ] 0.58% | 529,129 | 13.2% |
[ 0.5% - 1.0% ] 0.65% | 829,757 | 11.0% |
[ 0.5% - 1.0% ] 0.68% | 328,164 | 12.1% |
[ 0.5% - 1.0% ] 0.73% | 394,831 | 11.7% |
[ 0.5% - 1.0% ] 0.78% | 195,444 | 11.9% |
[ 0.5% - 1.0% ] 0.83% | 292,745 | 10.2% |
[ 0.5% - 1.0% ] 0.89% | 230,407 | 11.1% |
[ 0.5% - 1.0% ] 0.93% | 214,821 | 11.9% |
[ 0.5% - 1.0% ] 0.98% | 107,636 | 14.3% |
[ 1.0% - 1.5% ] 1.05% | 205,660 | 10.7% |
[ 1.0% - 1.5% ] 1.10% | 361,784 | 10.4% |
[ 1.0% - 1.5% ] 1.15% | 88,579 | 12.1% |
[ 1.0% - 1.5% ] 1.19% | 49,109 | 11.7% |
[ 1.0% - 1.5% ] 1.24% | 84,796 | 11.0% |
[ 1.0% - 1.5% ] 1.29% | 119,830 | 12.3% |
[ 1.0% - 1.5% ] 1.33% | 266,931 | 13.1% |
[ 1.0% - 1.5% ] 1.37% | 58,210 | 11.6% |
[ 1.0% - 1.5% ] 1.43% | 27,816 | 6.3% |
[ 1.0% - 1.5% ] 1.48% | 62,837 | 10.3% |
[ 1.5% - 2.0% ] 1.52% | 39,237 | 13.9% |
[ 1.5% - 2.0% ] 1.61% | 6,278 | 18.2% |
[ 1.5% - 2.0% ] 1.65% | 11,427 | 8.5% |
[ 1.5% - 2.0% ] 1.68% | 35,223 | 9.6% |
[ 1.5% - 2.0% ] 1.82% | 119,866 | 10.0% |
[ 1.5% - 2.0% ] 1.84% | 21,801 | 16.5% |
[ 1.5% - 2.0% ] 1.89% | 52,472 | 14.3% |
[ 1.5% - 2.0% ] 1.94% | 12,595 | 16.2% |
[ 2.0% - 2.5% ] 2.01% | 29,580 | 12.4% |
[ 2.0% - 2.5% ] 2.04% | 33,194 | 9.6% |
[ 2.0% - 2.5% ] 2.12% | 82,775 | 14.6% |
[ 2.0% - 2.5% ] 2.16% | 43,183 | 12.8% |
[ 2.0% - 2.5% ] 2.23% | 404 | 20.8% |
[ 2.0% - 2.5% ] 2.31% | 29,261 | 12.2% |
[ 2.0% - 2.5% ] 2.47% | 51,386 | 14.2% |
[ 2.5% - 3.0% ] 2.54% | 8,283 | 10.4% |
[ 2.5% - 3.0% ] 2.64% | 13,087 | 5.8% |
[ 2.5% - 3.0% ] 2.71% | 68,762 | 10.9% |
[ 2.5% - 3.0% ] 2.74% | 8,259 | 14.7% |
[ 2.5% - 3.0% ] 2.93% | 25,129 | 11.7% |
[ 2.5% - 3.0% ] 2.97% | 21,583 | 7.1% |
[ 3.0% - 3.5% ] 3.17% | 3,093 | 21.5% |
[ 3.0% - 3.5% ] 3.22% | 31,976 | 12.9% |
[ 3.0% - 3.5% ] 3.42% | 1,082 | 18.9% |
[ 3.5% - 4.0% ] 3.58% | 3,440 | 8.1% |
[ 3.5% - 4.0% ] 3.84% | 1,822 | 6.5% |
[ 4.0% - 4.5% ] 4.32% | 533 | 1.7% |
[ 4.5% - 5.0% ] 4.53% | 22,340 | 10.4% |
[ 5.0% - 5.5% ] 5.10% | 24,028 | 21.7% |
[ 5.0% - 5.5% ] 5.26% | 2,586 | 11.6% |
[ 5.0% - 5.5% ] 5.45% | 9,681 | 19.8% |
[ 6.0% - 6.5% ] 6.27% | 590 | 17.8% |
[ 6.0% - 6.5% ] 6.47% | 9,917 | 12.7% |
[ 7.0% - 7.5% ] 7.01% | 10,086 | 15.3% |
[ 7.5% - 8.0% ] 7.92% | 2,727 | 6.3% |
[ 10.0% - 10.5% ] 10.12% | 1,206 | 6.1% |
[ 16.5% - 17.0% ] 16.88% | 3,056 | 25.6% |