Sri Lankan Married-Couple Family Poverty
COMPARE
Sri Lankan
Select to Compare
Married-Couple Family Poverty
Sri Lankan Married-Couple Family Poverty
5.1%
POVERTY | MARRIED-COUPLE FAMILIES
72.2/ 100
METRIC RATING
156th/ 347
METRIC RANK
Sri Lankan Married-Couple Family Poverty Correlation Chart
The statistical analysis conducted on geographies consisting of 436,204,277 people shows a poor positive correlation between the proportion of Sri Lankans and poverty level among married-couple families in the United States with a correlation coefficient (R) of 0.195 and weighted average of 5.1%. On average, for every 1% (one percent) increase in Sri Lankans within a typical geography, there is an increase of 0.080% in poverty level among married-couple families.
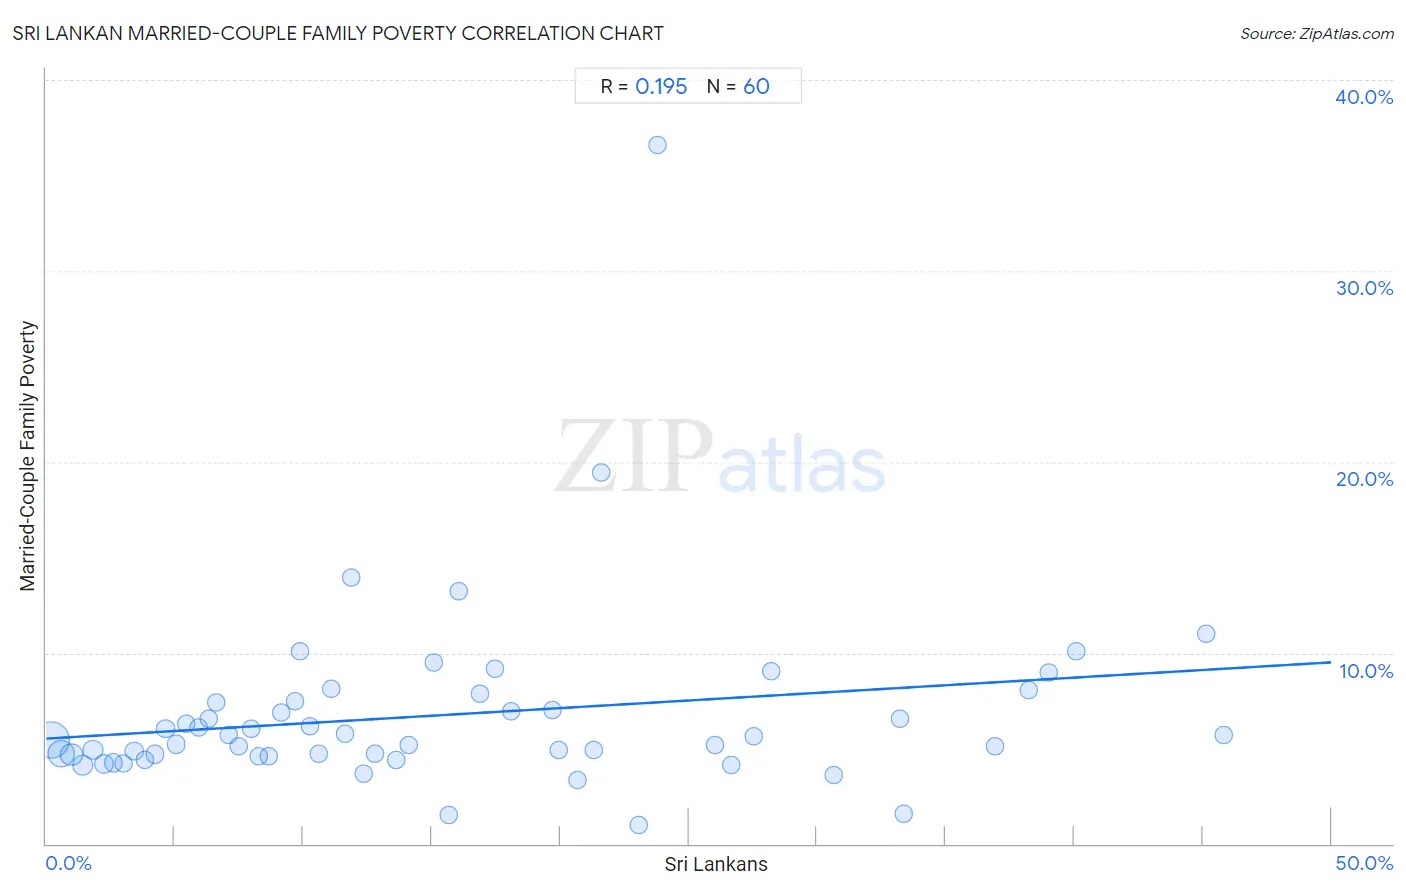
It is essential to understand that the correlation between the percentage of Sri Lankans and poverty level among married-couple families does not imply a direct cause-and-effect relationship. It remains uncertain whether the presence of Sri Lankans influences an upward or downward trend in the level of poverty level among married-couple families within an area, or if Sri Lankans simply ended up residing in those areas with higher or lower levels of poverty level among married-couple families due to other factors.
Demographics Similar to Sri Lankans by Married-Couple Family Poverty
In terms of married-couple family poverty, the demographic groups most similar to Sri Lankans are Immigrants from Ethiopia (5.1%, a difference of 0.040%), Argentinean (5.1%, a difference of 0.22%), Delaware (5.1%, a difference of 0.23%), Immigrants from South Eastern Asia (5.1%, a difference of 0.27%), and Immigrants from Saudi Arabia (5.1%, a difference of 0.27%).
| Demographics | Rating | Rank | Married-Couple Family Poverty |
| Immigrants from Oceania | 78.6 /100 | #149 | Good 5.0% |
| Brazilians | 78.3 /100 | #150 | Good 5.0% |
| Immigrants from Cameroon | 77.3 /100 | #151 | Good 5.0% |
| Albanians | 77.2 /100 | #152 | Good 5.0% |
| Immigrants from Kuwait | 76.3 /100 | #153 | Good 5.0% |
| Delaware | 73.7 /100 | #154 | Good 5.1% |
| Immigrants from Ethiopia | 72.4 /100 | #155 | Good 5.1% |
| Sri Lankans | 72.2 /100 | #156 | Good 5.1% |
| Argentineans | 70.7 /100 | #157 | Good 5.1% |
| Immigrants from South Eastern Asia | 70.4 /100 | #158 | Good 5.1% |
| Immigrants from Saudi Arabia | 70.3 /100 | #159 | Good 5.1% |
| Pennsylvania Germans | 68.5 /100 | #160 | Good 5.1% |
| Ethiopians | 68.1 /100 | #161 | Good 5.1% |
| Immigrants from Jordan | 66.5 /100 | #162 | Good 5.1% |
| Sierra Leoneans | 64.1 /100 | #163 | Good 5.1% |
Sri Lankan Married-Couple Family Poverty Correlation Summary
| Measurement | Sri Lankan Data | Married-Couple Family Poverty Data |
| Minimum | 0.18% | 0.96% |
| Maximum | 45.8% | 36.6% |
| Range | 45.6% | 35.6% |
| Mean | 15.6% | 6.8% |
| Median | 12.1% | 5.5% |
| Interquartile 25% (IQ1) | 6.1% | 4.6% |
| Interquartile 75% (IQ3) | 22.3% | 7.4% |
| Interquartile Range (IQR) | 16.2% | 2.8% |
| Standard Deviation (Sample) | 12.1% | 4.9% |
| Standard Deviation (Population) | 12.0% | 4.9% |
Correlation Details
| Sri Lankan Percentile | Sample Size | Married-Couple Family Poverty |
[ 0.0% - 0.5% ] 0.18% | 205,182,052 | 5.4% |
[ 0.5% - 1.0% ] 0.57% | 97,998,195 | 4.7% |
[ 0.5% - 1.0% ] 0.98% | 50,202,118 | 4.7% |
[ 1.0% - 1.5% ] 1.40% | 22,755,094 | 4.1% |
[ 1.5% - 2.0% ] 1.82% | 16,666,237 | 4.9% |
[ 2.0% - 2.5% ] 2.23% | 9,754,529 | 4.2% |
[ 2.5% - 3.0% ] 2.61% | 7,203,429 | 4.3% |
[ 2.5% - 3.0% ] 2.99% | 5,983,745 | 4.2% |
[ 3.0% - 3.5% ] 3.42% | 3,160,189 | 4.9% |
[ 3.5% - 4.0% ] 3.83% | 2,960,051 | 4.4% |
[ 4.0% - 4.5% ] 4.22% | 2,019,237 | 4.7% |
[ 4.5% - 5.0% ] 4.64% | 1,443,240 | 6.0% |
[ 5.0% - 5.5% ] 5.07% | 1,633,371 | 5.2% |
[ 5.0% - 5.5% ] 5.45% | 531,890 | 6.3% |
[ 5.5% - 6.0% ] 5.93% | 1,531,437 | 6.1% |
[ 6.0% - 6.5% ] 6.32% | 437,158 | 6.6% |
[ 6.5% - 7.0% ] 6.62% | 505,305 | 7.4% |
[ 7.0% - 7.5% ] 7.09% | 468,725 | 5.7% |
[ 7.0% - 7.5% ] 7.49% | 348,917 | 5.1% |
[ 7.5% - 8.0% ] 7.98% | 467,053 | 6.0% |
[ 8.0% - 8.5% ] 8.26% | 325,777 | 4.6% |
[ 8.5% - 9.0% ] 8.64% | 260,952 | 4.6% |
[ 9.0% - 9.5% ] 9.13% | 462,954 | 6.9% |
[ 9.5% - 10.0% ] 9.66% | 35,664 | 7.5% |
[ 9.5% - 10.0% ] 9.89% | 155,153 | 10.1% |
[ 10.0% - 10.5% ] 10.28% | 187,926 | 6.2% |
[ 10.5% - 11.0% ] 10.58% | 131,611 | 4.7% |
[ 11.0% - 11.5% ] 11.09% | 251,722 | 8.1% |
[ 11.5% - 12.0% ] 11.62% | 169,934 | 5.8% |
[ 11.5% - 12.0% ] 11.88% | 2,812 | 14.0% |
[ 12.0% - 12.5% ] 12.33% | 1,095,174 | 3.6% |
[ 12.5% - 13.0% ] 12.78% | 114,382 | 4.7% |
[ 13.5% - 14.0% ] 13.63% | 243,185 | 4.4% |
[ 14.0% - 14.5% ] 14.12% | 221,988 | 5.2% |
[ 15.0% - 15.5% ] 15.09% | 13,719 | 9.5% |
[ 15.5% - 16.0% ] 15.65% | 27,827 | 1.5% |
[ 16.0% - 16.5% ] 16.03% | 61,688 | 13.2% |
[ 16.5% - 17.0% ] 16.88% | 30,260 | 7.9% |
[ 17.0% - 17.5% ] 17.44% | 51,043 | 9.2% |
[ 18.0% - 18.5% ] 18.08% | 78,830 | 6.9% |
[ 19.5% - 20.0% ] 19.68% | 59,851 | 7.0% |
[ 19.5% - 20.0% ] 19.96% | 96,079 | 4.9% |
[ 20.5% - 21.0% ] 20.69% | 7,786 | 3.3% |
[ 21.0% - 21.5% ] 21.31% | 52,555 | 4.9% |
[ 21.5% - 22.0% ] 21.59% | 1,575 | 19.5% |
[ 23.0% - 23.5% ] 23.05% | 859 | 0.96% |
[ 23.5% - 24.0% ] 23.78% | 921 | 36.6% |
[ 26.0% - 26.5% ] 26.04% | 9,832 | 5.2% |
[ 26.5% - 27.0% ] 26.64% | 183,583 | 4.1% |
[ 27.5% - 28.0% ] 27.51% | 53,826 | 5.7% |
[ 28.0% - 28.5% ] 28.22% | 6,563 | 9.0% |
[ 30.5% - 31.0% ] 30.64% | 45,688 | 3.6% |
[ 33.0% - 33.5% ] 33.20% | 171,637 | 6.5% |
[ 33.0% - 33.5% ] 33.39% | 593 | 1.6% |
[ 36.5% - 37.0% ] 36.91% | 36,657 | 5.1% |
[ 38.0% - 38.5% ] 38.21% | 34,188 | 8.1% |
[ 39.0% - 39.5% ] 39.02% | 47,549 | 9.0% |
[ 40.0% - 40.5% ] 40.07% | 16,072 | 10.1% |
[ 45.0% - 45.5% ] 45.14% | 181,268 | 11.0% |
[ 45.5% - 46.0% ] 45.82% | 22,622 | 5.7% |