Slovene Married-Couple Family Poverty

COMPARE

Slovene
Race
Ancestry
AfghanAfricanAlaska NativeAlaskan AthabascanAlbanianAleutAlsatianAmericanApacheArabArapahoArgentineanArmenianAssyrian/Chaldean/SyriacAustralianAustrianBahamianBangladeshiBarbadianBasqueBelgianBelizeanBermudanBhutaneseBlackfeetBolivianBrazilianBritishBritish West IndianBulgarianBurmeseCajunCambodianCanadianCape VerdeanCarpatho RusynCelticCentral AmericanCentral American IndianCherokeeCheyenneChickasawChileanChineseChippewaChoctawColombianColvilleComancheCosta RicanCreeCreekCroatianCrowCubanCypriotCzechCzechoslovakianDanishDelawareDominicanDutchDutch West IndianEastern EuropeanEcuadorianEgyptianEnglishEstonianEthiopianEuropeanFijianFilipinoFinnishFrenchFrench American IndianFrench CanadianGermanGerman RussianGhanaianGreekGuamanian/ChamorroGuatemalanGuyaneseHaitianHmongHonduranHopiHoumaHungarianIcelanderIndian (Asian)IndonesianInupiatIranianIraqiIrishIroquoisIsraeliItalianJamaicanJapaneseJordanianKenyanKiowaKoreanLaotianLatvianLebaneseLiberianLithuanianLumbeeLuxembourgerMacedonianMalaysianMalteseMarshalleseMenomineeMexicanMexican American IndianMongolianMoroccanNative HawaiianNavajoNepaleseNew ZealanderNicaraguanNigerianNorthern EuropeanNorwegianOkinawanOsageOttawaPaiutePakistaniPalestinianPanamanianParaguayanPennsylvania GermanPeruvianPimaPolishPortuguesePotawatomiPuebloPuerto RicanPuget Sound SalishRomanianRussianSalvadoranSamoanScandinavianScotch-IrishScottishSeminoleSenegaleseSerbianShoshoneSierra LeoneanSiouxSlavicSlovakSloveneSomaliSouth AfricanSouth AmericanSouth American IndianSoviet UnionSpaniardSpanishSpanish AmericanSpanish American IndianSri LankanSubsaharan AfricanSudaneseSwedishSwissSyrianTaiwaneseThaiTlingit-HaidaTohono O'OdhamTonganTrinidadian and TobagonianTsimshianTurkishU.S. Virgin IslanderUgandanUkrainianUruguayanUteVenezuelanVietnameseWelshWest IndianYakamaYaquiYugoslavianYumanYup'ikZimbabwean
Immigration
NonimmigrantsImmigrantsAfghanistanAfricaAlbaniaArgentinaArmeniaAsiaAustraliaAustriaBahamasBangladeshBarbadosBelarusBelgiumBelizeBoliviaBosnia and HerzegovinaBrazilBulgariaBurma/MyanmarCabo VerdeCambodiaCameroonCanadaCaribbeanCentral AmericaChileChinaColombiaCongoCosta RicaCroatiaCubaCzechoslovakiaDenmarkDominicaDominican RepublicEastern AfricaEastern AsiaEastern EuropeEcuadorEgyptEl SalvadorEnglandEritreaEthiopiaEuropeFijiFranceGermanyGhanaGreeceGrenadaGuatemalaGuyanaHaitiHondurasHong KongHungaryIndiaIndonesiaIranIraqIrelandIsraelItalyJamaicaJapanJordanKazakhstanKenyaKoreaKuwaitLaosLatin AmericaLatviaLebanonLiberiaLithuaniaMalaysiaMexicoMicronesiaMiddle AfricaMoldovaMoroccoNepalNetherlandsNicaraguaNigeriaNorth AmericaNorth MacedoniaNorthern AfricaNorthern EuropeNorwayOceaniaPakistanPanamaPeruPhilippinesPolandPortugalRomaniaRussiaSaudi ArabiaScotlandSenegalSerbiaSierra LeoneSingaporeSomaliaSouth AfricaSouth AmericaSouth Central AsiaSouth Eastern AsiaSouthern EuropeSpainSri LankaSt. Vincent and the GrenadinesSudanSwedenSwitzerlandSyriaTaiwanThailandTrinidad and TobagoTurkeyUgandaUkraineUruguayUzbekistanVenezuelaVietnamWest IndiesWestern AfricaWestern AsiaWestern EuropeYemenZaireZimbabweAzores
Select to Compare
Race
Ancestry
AfghanAfricanAlaska NativeAlaskan AthabascanAlbanianAleutAlsatianAmericanApacheArabArapahoArgentineanArmenianAssyrian/Chaldean/SyriacAustralianAustrianBahamianBangladeshiBarbadianBasqueBelgianBelizeanBermudanBhutaneseBlackfeetBolivianBrazilianBritishBritish West IndianBulgarianBurmeseCajunCambodianCanadianCape VerdeanCarpatho RusynCelticCentral AmericanCentral American IndianCherokeeCheyenneChickasawChileanChineseChippewaChoctawColombianColvilleComancheCosta RicanCreeCreekCroatianCrowCubanCypriotCzechCzechoslovakianDanishDelawareDominicanDutchDutch West IndianEastern EuropeanEcuadorianEgyptianEnglishEstonianEthiopianEuropeanFijianFilipinoFinnishFrenchFrench American IndianFrench CanadianGermanGerman RussianGhanaianGreekGuamanian/ChamorroGuatemalanGuyaneseHaitianHmongHonduranHopiHoumaHungarianIcelanderIndian (Asian)IndonesianInupiatIranianIraqiIrishIroquoisIsraeliItalianJamaicanJapaneseJordanianKenyanKiowaKoreanLaotianLatvianLebaneseLiberianLithuanianLumbeeLuxembourgerMacedonianMalaysianMalteseMarshalleseMenomineeMexicanMexican American IndianMongolianMoroccanNative HawaiianNavajoNepaleseNew ZealanderNicaraguanNigerianNorthern EuropeanNorwegianOkinawanOsageOttawaPaiutePakistaniPalestinianPanamanianParaguayanPennsylvania GermanPeruvianPimaPolishPortuguesePotawatomiPuebloPuerto RicanPuget Sound SalishRomanianRussianSalvadoranSamoanScandinavianScotch-IrishScottishSeminoleSenegaleseSerbianShoshoneSierra LeoneanSiouxSlavicSlovakSomaliSouth AfricanSouth AmericanSouth American IndianSoviet UnionSpaniardSpanishSpanish AmericanSpanish American IndianSri LankanSubsaharan AfricanSudaneseSwedishSwissSyrianTaiwaneseThaiTlingit-HaidaTohono O'OdhamTonganTrinidadian and TobagonianTsimshianTurkishU.S. Virgin IslanderUgandanUkrainianUruguayanUteVenezuelanVietnameseWelshWest IndianYakamaYaquiYugoslavianYumanYup'ikZimbabwean
Immigration
NonimmigrantsImmigrantsAfghanistanAfricaAlbaniaArgentinaArmeniaAsiaAustraliaAustriaBahamasBangladeshBarbadosBelarusBelgiumBelizeBoliviaBosnia and HerzegovinaBrazilBulgariaBurma/MyanmarCabo VerdeCambodiaCameroonCanadaCaribbeanCentral AmericaChileChinaColombiaCongoCosta RicaCroatiaCubaCzechoslovakiaDenmarkDominicaDominican RepublicEastern AfricaEastern AsiaEastern EuropeEcuadorEgyptEl SalvadorEnglandEritreaEthiopiaEuropeFijiFranceGermanyGhanaGreeceGrenadaGuatemalaGuyanaHaitiHondurasHong KongHungaryIndiaIndonesiaIranIraqIrelandIsraelItalyJamaicaJapanJordanKazakhstanKenyaKoreaKuwaitLaosLatin AmericaLatviaLebanonLiberiaLithuaniaMalaysiaMexicoMicronesiaMiddle AfricaMoldovaMoroccoNepalNetherlandsNicaraguaNigeriaNorth AmericaNorth MacedoniaNorthern AfricaNorthern EuropeNorwayOceaniaPakistanPanamaPeruPhilippinesPolandPortugalRomaniaRussiaSaudi ArabiaScotlandSenegalSerbiaSierra LeoneSingaporeSomaliaSouth AfricaSouth AmericaSouth Central AsiaSouth Eastern AsiaSouthern EuropeSpainSri LankaSt. Vincent and the GrenadinesSudanSwedenSwitzerlandSyriaTaiwanThailandTrinidad and TobagoTurkeyUgandaUkraineUruguayUzbekistanVenezuelaVietnamWest IndiesWestern AfricaWestern AsiaWestern EuropeYemenZaireZimbabweAzores
Married-Couple Family Poverty
Income
Poverty
Unemployment
Labor Participation
Family Structure
Vehicle Availability
Education Level
Disability

Slovene Married-Couple Family Poverty
Exceptional

3.8%
POVERTY | MARRIED-COUPLE FAMILIES
100.0/ 100
METRIC RATING
4th/ 347
METRIC RANK

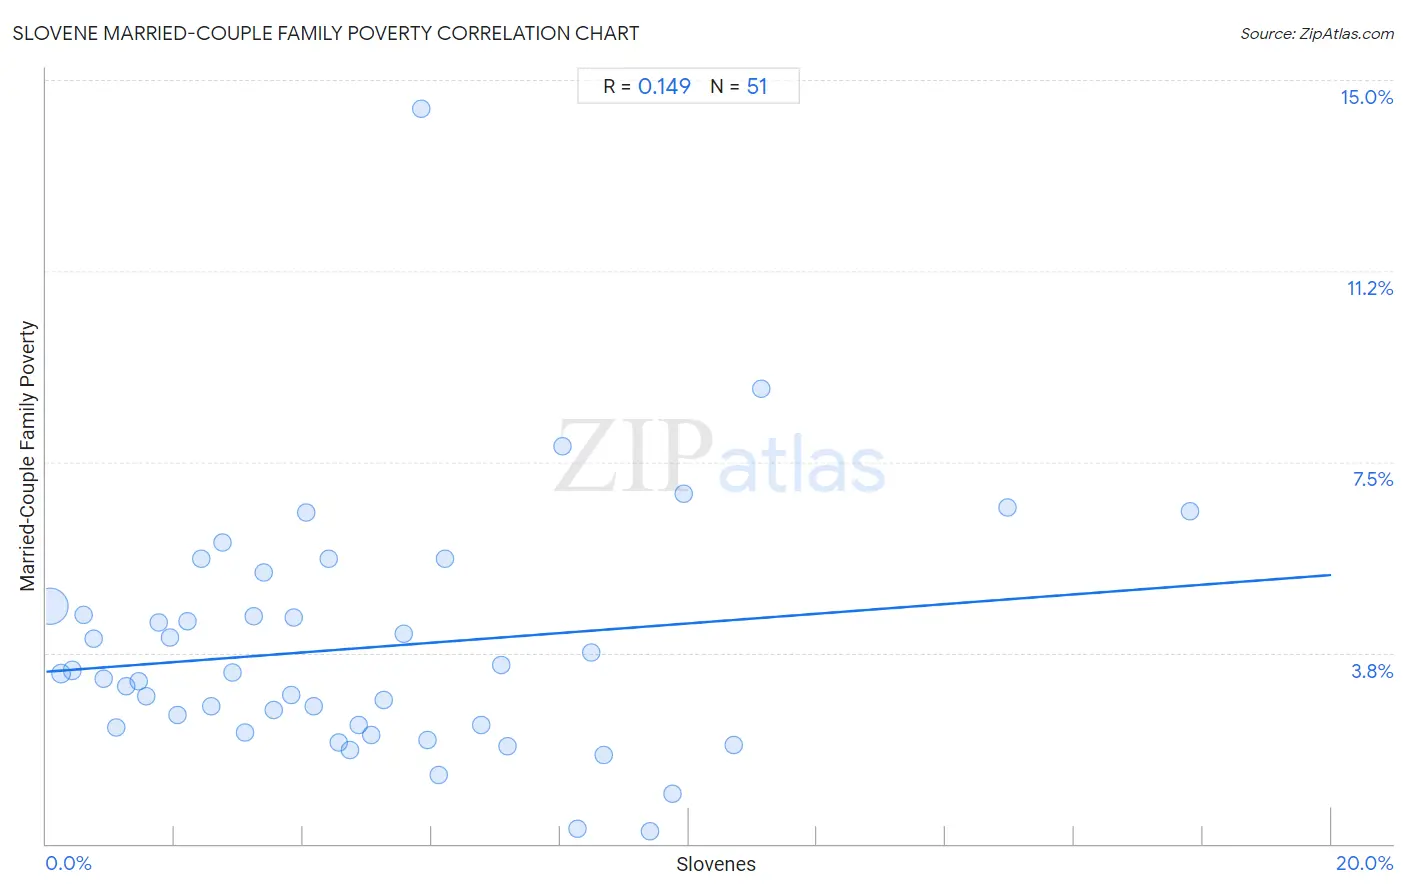
Slovene Married-Couple Family Poverty Correlation Chart

The statistical analysis conducted on geographies consisting of 259,368,188 people shows a poor positive correlation between the proportion of Slovenes and poverty level among married-couple families in the United States with a correlation coefficient (R) of 0.149 and weighted average of 3.8%. On average, for every 1% (one percent) increase in Slovenes within a typical geography, there is an increase of 0.095% in poverty level among married-couple families.
Slovene Married-Couple Family Poverty
It is essential to understand that the correlation between the percentage of Slovenes and poverty level among married-couple families does not imply a direct cause-and-effect relationship. It remains uncertain whether the presence of Slovenes influences an upward or downward trend in the level of poverty level among married-couple families within an area, or if Slovenes simply ended up residing in those areas with higher or lower levels of poverty level among married-couple families due to other factors.

Demographics Similar to Slovenes by Married-Couple Family Poverty

In terms of married-couple family poverty, the demographic groups most similar to Slovenes are Swedish (3.9%, a difference of 0.15%), Luxembourger (3.9%, a difference of 0.76%), Latvian (3.9%, a difference of 1.3%), Thai (3.9%, a difference of 1.8%), and Croatian (3.9%, a difference of 2.3%).
DemographicsRating | RankMarried-Couple Family Poverty
Immigrants from India
100.0
/100
|
#1
Exceptional
3.6%
Chinese
100.0
/100
|
#2
Exceptional
3.6%
Norwegians
100.0
/100
|
#3
Exceptional
3.7%
Slovenes
100.0
/100
|
#4
Exceptional
3.8%
Swedes
100.0
/100
|
#5
Exceptional
3.9%
Luxembourgers
100.0
/100
|
#6
Exceptional
3.9%
Latvians
100.0
/100
|
#7
Exceptional
3.9%
Thais
100.0
/100
|
#8
Exceptional
3.9%
Croatians
100.0
/100
|
#9
Exceptional
3.9%
Carpatho Rusyns
100.0
/100
|
#10
Exceptional
3.9%
Lithuanians
100.0
/100
|
#11
Exceptional
4.0%
Bulgarians
100.0
/100
|
#12
Exceptional
4.0%
Czechs
100.0
/100
|
#13
Exceptional
4.0%
Slovaks
100.0
/100
|
#14
Exceptional
4.0%
Poles
100.0
/100
|
#15
Exceptional
4.0%

Slovene Married-Couple Family Poverty Correlation Summary

MeasurementSlovene DataMarried-Couple Family Poverty Data
Minimum0.049%0.24%
Maximum17.8%14.4%
Range17.8%14.2%
Mean5.0%3.8%
Median4.2%3.3%
Interquartile 25% (IQ1)2.0%2.3%
Interquartile 75% (IQ3)7.1%4.7%
Interquartile Range (IQR)5.0%2.4%
Standard Deviation (Sample)3.8%2.4%
Standard Deviation (Population)3.7%2.4%

Correlation Details

Slovene PercentileSample SizeMarried-Couple Family Poverty
[
0.0%
-
0.5%
]
0.049%
225,525,9834.7%
[
0.0%
-
0.5%
]
0.23%
19,042,5643.3%
[
0.0%
-
0.5%
]
0.40%
5,726,4343.4%
[
0.5%
-
1.0%
]
0.58%
2,931,0114.5%
[
0.5%
-
1.0%
]
0.75%
1,724,1024.0%
[
0.5%
-
1.0%
]
0.90%
1,161,6893.2%
[
1.0%
-
1.5%
]
1.10%
434,1512.3%
[
1.0%
-
1.5%
]
1.25%
740,6723.1%
[
1.0%
-
1.5%
]
1.43%
401,8143.2%
[
1.5%
-
2.0%
]
1.56%
222,5682.9%
[
1.5%
-
2.0%
]
1.75%
264,0914.4%
[
1.5%
-
2.0%
]
1.92%
106,6014.0%
[
2.0%
-
2.5%
]
2.05%
190,8142.5%
[
2.0%
-
2.5%
]
2.21%
51,1574.4%
[
2.0%
-
2.5%
]
2.41%
75,1235.6%
[
2.5%
-
3.0%
]
2.58%
35,2032.7%
[
2.5%
-
3.0%
]
2.75%
45,8515.9%
[
2.5%
-
3.0%
]
2.90%
44,6093.4%
[
3.0%
-
3.5%
]
3.09%
53,2232.2%
[
3.0%
-
3.5%
]
3.23%
12,2754.5%
[
3.0%
-
3.5%
]
3.38%
29,3935.3%
[
3.5%
-
4.0%
]
3.54%
73,3102.6%
[
3.5%
-
4.0%
]
3.81%
13,5762.9%
[
3.5%
-
4.0%
]
3.86%
5,4404.4%
[
4.0%
-
4.5%
]
4.05%
2,7686.5%
[
4.0%
-
4.5%
]
4.17%
3,2352.7%
[
4.0%
-
4.5%
]
4.40%
11,0825.6%
[
4.5%
-
5.0%
]
4.54%
9,8152.0%
[
4.5%
-
5.0%
]
4.74%
24,6391.8%
[
4.5%
-
5.0%
]
4.87%
61,9862.3%
[
5.0%
-
5.5%
]
5.05%
67,1122.1%
[
5.0%
-
5.5%
]
5.25%
89,4392.8%
[
5.5%
-
6.0%
]
5.56%
1,3324.1%
[
5.5%
-
6.0%
]
5.83%
3,50014.4%
[
5.5%
-
6.0%
]
5.93%
38,0042.0%
[
6.0%
-
6.5%
]
6.12%
2,1251.4%
[
6.0%
-
6.5%
]
6.20%
3,4335.6%
[
6.5%
-
7.0%
]
6.76%
38,0362.3%
[
7.0%
-
7.5%
]
7.08%
1,3843.5%
[
7.0%
-
7.5%
]
7.18%
40,8661.9%
[
8.0%
-
8.5%
]
8.03%
8227.8%
[
8.0%
-
8.5%
]
8.27%
12,6610.31%
[
8.0%
-
8.5%
]
8.47%
1,9123.8%
[
8.5%
-
9.0%
]
8.67%
9,9721.7%
[
9.0%
-
9.5%
]
9.40%
17,1380.24%
[
9.5%
-
10.0%
]
9.75%
6,9140.97%
[
9.5%
-
10.0%
]
9.93%
1,3406.9%
[
10.5%
-
11.0%
]
10.70%
5,2971.9%
[
11.0%
-
11.5%
]
11.12%
9988.9%
[
14.5%
-
15.0%
]
14.97%
3146.6%
[
17.5%
-
18.0%
]
17.80%
4106.5%