Serbian Female Disability
COMPARE
Serbian
Select to Compare
Female Disability
Serbian Female Disability
12.3%
DISABILITY | FEMALES
33.1/ 100
METRIC RATING
187th/ 347
METRIC RANK
Serbian Female Disability Correlation Chart
The statistical analysis conducted on geographies consisting of 267,642,282 people shows a moderate positive correlation between the proportion of Serbians and percentage of females with a disability in the United States with a correlation coefficient (R) of 0.412 and weighted average of 12.3%. On average, for every 1% (one percent) increase in Serbians within a typical geography, there is an increase of 0.52% in percentage of females with a disability.
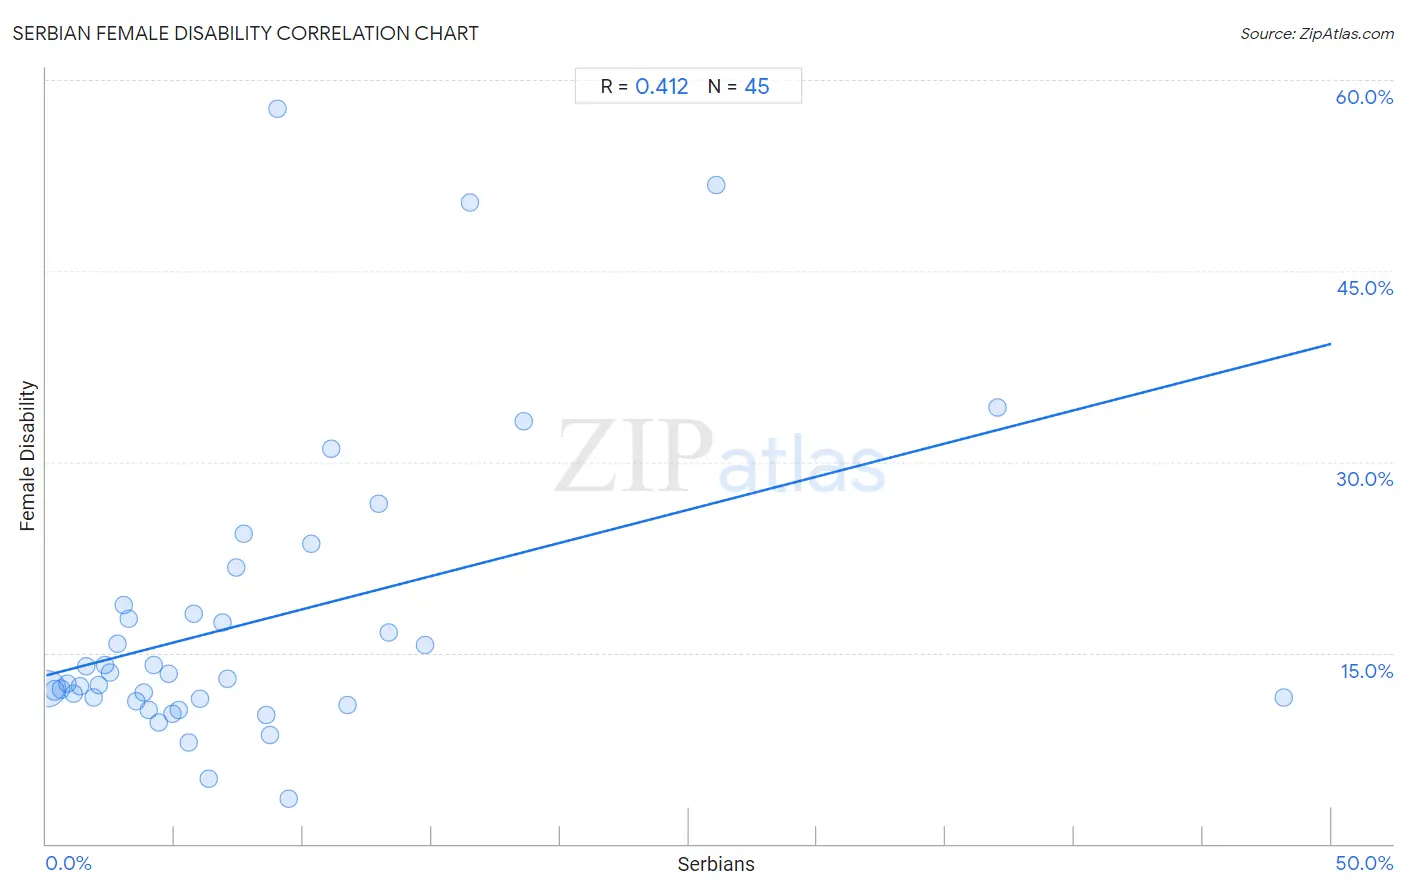
It is essential to understand that the correlation between the percentage of Serbians and percentage of females with a disability does not imply a direct cause-and-effect relationship. It remains uncertain whether the presence of Serbians influences an upward or downward trend in the level of percentage of females with a disability within an area, or if Serbians simply ended up residing in those areas with higher or lower levels of percentage of females with a disability due to other factors.
Demographics Similar to Serbians by Female Disability
In terms of female disability, the demographic groups most similar to Serbians are Austrian (12.3%, a difference of 0.010%), Immigrants from North America (12.3%, a difference of 0.010%), Immigrants from Uzbekistan (12.3%, a difference of 0.030%), Immigrants from Albania (12.3%, a difference of 0.070%), and Immigrants from Honduras (12.3%, a difference of 0.080%).
| Demographics | Rating | Rank | Female Disability |
| Albanians | 37.9 /100 | #180 | Fair 12.3% |
| Immigrants from Canada | 37.2 /100 | #181 | Fair 12.3% |
| Norwegians | 36.9 /100 | #182 | Fair 12.3% |
| Cubans | 36.5 /100 | #183 | Fair 12.3% |
| Iraqis | 36.0 /100 | #184 | Fair 12.3% |
| Immigrants from Uzbekistan | 33.9 /100 | #185 | Fair 12.3% |
| Austrians | 33.3 /100 | #186 | Fair 12.3% |
| Serbians | 33.1 /100 | #187 | Fair 12.3% |
| Immigrants from North America | 32.8 /100 | #188 | Fair 12.3% |
| Immigrants from Albania | 31.6 /100 | #189 | Fair 12.3% |
| Immigrants from Honduras | 31.3 /100 | #190 | Fair 12.3% |
| Armenians | 29.7 /100 | #191 | Fair 12.3% |
| Immigrants from Western Africa | 29.2 /100 | #192 | Fair 12.3% |
| Northern Europeans | 27.5 /100 | #193 | Fair 12.3% |
| Ukrainians | 27.2 /100 | #194 | Fair 12.3% |
Serbian Female Disability Correlation Summary
| Measurement | Serbian Data | Female Disability Data |
| Minimum | 0.068% | 3.5% |
| Maximum | 48.1% | 57.7% |
| Range | 48.1% | 54.2% |
| Mean | 8.2% | 17.5% |
| Median | 5.5% | 12.9% |
| Interquartile 25% (IQ1) | 2.6% | 11.3% |
| Interquartile 75% (IQ3) | 9.9% | 18.4% |
| Interquartile Range (IQR) | 7.3% | 7.2% |
| Standard Deviation (Sample) | 9.3% | 11.8% |
| Standard Deviation (Population) | 9.2% | 11.6% |
Correlation Details
| Serbian Percentile | Sample Size | Female Disability |
[ 0.0% - 0.5% ] 0.068% | 232,554,567 | 12.2% |
[ 0.0% - 0.5% ] 0.32% | 22,552,910 | 12.1% |
[ 0.5% - 1.0% ] 0.58% | 5,977,423 | 12.2% |
[ 0.5% - 1.0% ] 0.83% | 2,567,150 | 12.6% |
[ 1.0% - 1.5% ] 1.09% | 1,546,688 | 11.8% |
[ 1.0% - 1.5% ] 1.32% | 801,103 | 12.4% |
[ 1.5% - 2.0% ] 1.56% | 336,907 | 13.9% |
[ 1.5% - 2.0% ] 1.83% | 586,706 | 11.5% |
[ 2.0% - 2.5% ] 2.05% | 263,527 | 12.5% |
[ 2.0% - 2.5% ] 2.30% | 76,708 | 14.0% |
[ 2.0% - 2.5% ] 2.48% | 97,773 | 13.5% |
[ 2.5% - 3.0% ] 2.78% | 38,361 | 15.7% |
[ 3.0% - 3.5% ] 3.02% | 22,105 | 18.8% |
[ 3.0% - 3.5% ] 3.21% | 31,828 | 17.7% |
[ 3.5% - 4.0% ] 3.53% | 40,755 | 11.2% |
[ 3.5% - 4.0% ] 3.80% | 5,441 | 11.9% |
[ 3.5% - 4.0% ] 3.99% | 48,594 | 10.5% |
[ 4.0% - 4.5% ] 4.21% | 42,032 | 14.0% |
[ 4.0% - 4.5% ] 4.37% | 4,869 | 9.5% |
[ 4.5% - 5.0% ] 4.76% | 5,373 | 13.4% |
[ 4.5% - 5.0% ] 4.89% | 1,839 | 10.2% |
[ 5.0% - 5.5% ] 5.13% | 6,955 | 10.5% |
[ 5.5% - 6.0% ] 5.52% | 3,748 | 7.9% |
[ 5.5% - 6.0% ] 5.74% | 383 | 18.1% |
[ 5.5% - 6.0% ] 5.96% | 4,377 | 11.4% |
[ 6.0% - 6.5% ] 6.34% | 1,136 | 5.1% |
[ 6.5% - 7.0% ] 6.85% | 6,221 | 17.4% |
[ 7.0% - 7.5% ] 7.04% | 1,534 | 12.9% |
[ 7.0% - 7.5% ] 7.39% | 893 | 21.7% |
[ 7.5% - 8.0% ] 7.68% | 1,771 | 24.4% |
[ 8.5% - 9.0% ] 8.58% | 2,203 | 10.2% |
[ 8.5% - 9.0% ] 8.70% | 299 | 8.6% |
[ 8.5% - 9.0% ] 9.00% | 289 | 57.7% |
[ 9.0% - 9.5% ] 9.44% | 1,885 | 3.5% |
[ 10.0% - 10.5% ] 10.33% | 1,472 | 23.6% |
[ 11.0% - 11.5% ] 11.11% | 99 | 31.0% |
[ 11.5% - 12.0% ] 11.71% | 1,683 | 10.9% |
[ 12.5% - 13.0% ] 12.92% | 325 | 26.8% |
[ 13.0% - 13.5% ] 13.33% | 1,448 | 16.6% |
[ 14.5% - 15.0% ] 14.71% | 1,033 | 15.6% |
[ 16.0% - 16.5% ] 16.48% | 182 | 50.3% |
[ 18.5% - 19.0% ] 18.56% | 291 | 33.2% |
[ 26.0% - 26.5% ] 26.09% | 69 | 51.7% |
[ 37.0% - 37.5% ] 37.02% | 1,032 | 34.3% |
[ 48.0% - 48.5% ] 48.14% | 295 | 11.5% |