Samoan Self-Care Disability
COMPARE
Samoan
Select to Compare
Self-Care Disability
Samoan Self-Care Disability
2.6%
SELF-CARE DISABILITY
5.1/ 100
METRIC RATING
212th/ 347
METRIC RANK
Samoan Self-Care Disability Correlation Chart
The statistical analysis conducted on geographies consisting of 224,951,105 people shows a poor negative correlation between the proportion of Samoans and percentage of population with self-care disability in the United States with a correlation coefficient (R) of -0.191 and weighted average of 2.6%. On average, for every 1% (one percent) increase in Samoans within a typical geography, there is a decrease of 0.044% in percentage of population with self-care disability.
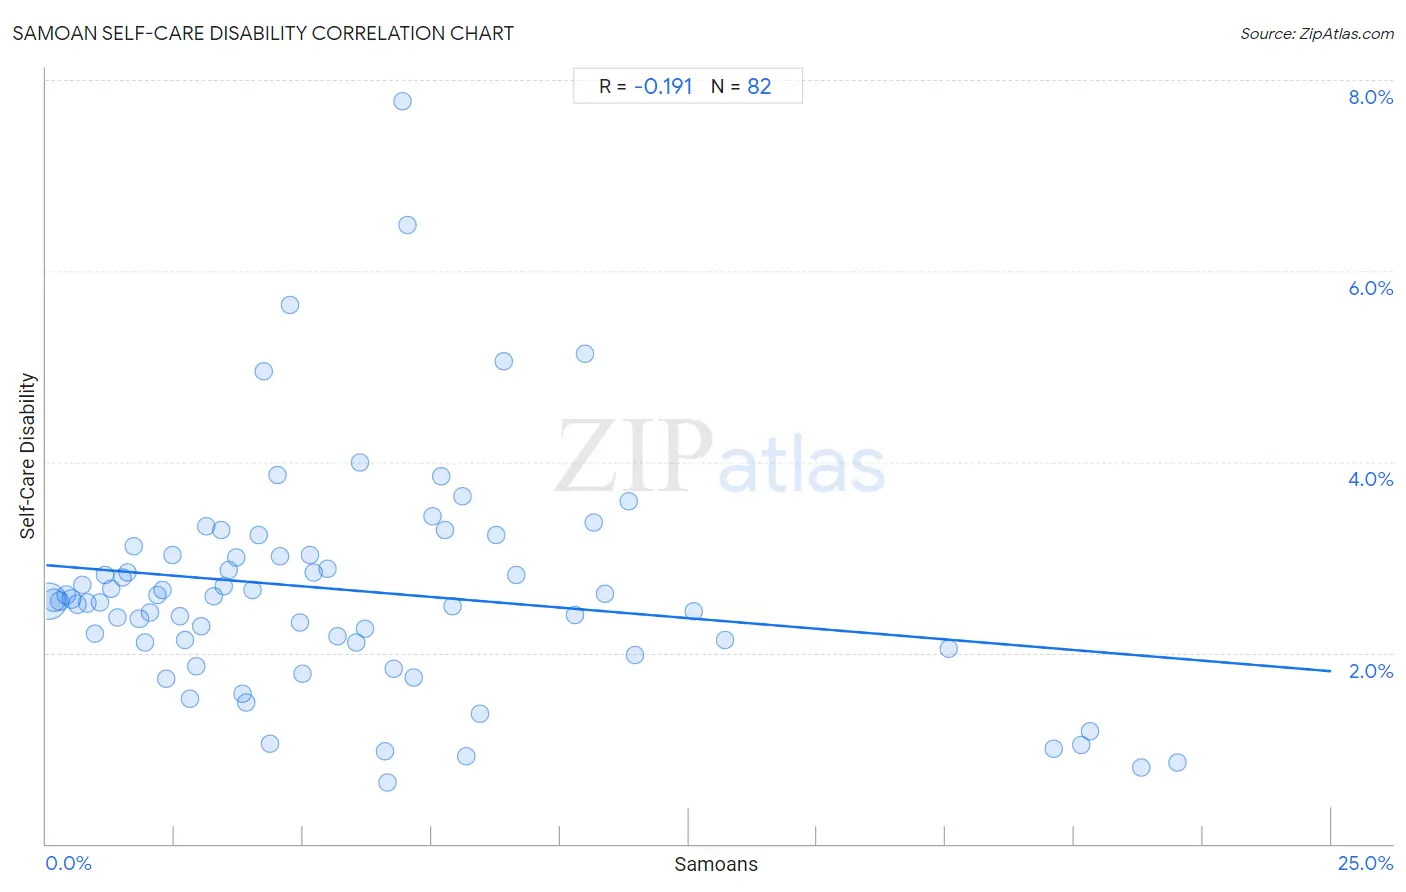
It is essential to understand that the correlation between the percentage of Samoans and percentage of population with self-care disability does not imply a direct cause-and-effect relationship. It remains uncertain whether the presence of Samoans influences an upward or downward trend in the level of percentage of population with self-care disability within an area, or if Samoans simply ended up residing in those areas with higher or lower levels of percentage of population with self-care disability due to other factors.
Demographics Similar to Samoans by Self-Care Disability
In terms of self-care disability, the demographic groups most similar to Samoans are Native Hawaiian (2.6%, a difference of 0.020%), Ecuadorian (2.6%, a difference of 0.10%), Immigrants from Honduras (2.6%, a difference of 0.10%), Immigrants from Thailand (2.6%, a difference of 0.14%), and White/Caucasian (2.6%, a difference of 0.17%).
| Demographics | Rating | Rank | Self-Care Disability |
| Immigrants from Russia | 11.0 /100 | #205 | Poor 2.5% |
| Alaskan Athabascans | 10.4 /100 | #206 | Poor 2.5% |
| French | 9.9 /100 | #207 | Tragic 2.5% |
| Central Americans | 8.7 /100 | #208 | Tragic 2.5% |
| Malaysians | 7.7 /100 | #209 | Tragic 2.5% |
| Panamanians | 6.4 /100 | #210 | Tragic 2.5% |
| Native Hawaiians | 5.1 /100 | #211 | Tragic 2.6% |
| Samoans | 5.1 /100 | #212 | Tragic 2.6% |
| Ecuadorians | 4.7 /100 | #213 | Tragic 2.6% |
| Immigrants from Honduras | 4.7 /100 | #214 | Tragic 2.6% |
| Immigrants from Thailand | 4.5 /100 | #215 | Tragic 2.6% |
| Whites/Caucasians | 4.4 /100 | #216 | Tragic 2.6% |
| Celtics | 4.4 /100 | #217 | Tragic 2.6% |
| Scotch-Irish | 4.1 /100 | #218 | Tragic 2.6% |
| Immigrants from Moldova | 4.0 /100 | #219 | Tragic 2.6% |
Samoan Self-Care Disability Correlation Summary
| Measurement | Samoan Data | Self-Care Disability Data |
| Minimum | 0.040% | 0.64% |
| Maximum | 22.0% | 7.8% |
| Range | 22.0% | 7.1% |
| Mean | 5.9% | 2.7% |
| Median | 4.5% | 2.5% |
| Interquartile 25% (IQ1) | 2.3% | 2.1% |
| Interquartile 75% (IQ3) | 7.9% | 3.0% |
| Interquartile Range (IQR) | 5.6% | 0.92% |
| Standard Deviation (Sample) | 5.2% | 1.2% |
| Standard Deviation (Population) | 5.1% | 1.2% |
Correlation Details
| Samoan Percentile | Sample Size | Self-Care Disability |
[ 0.0% - 0.5% ] 0.040% | 145,321,857 | 2.5% |
[ 0.0% - 0.5% ] 0.15% | 35,694,327 | 2.6% |
[ 0.0% - 0.5% ] 0.26% | 12,910,670 | 2.5% |
[ 0.0% - 0.5% ] 0.38% | 8,682,387 | 2.6% |
[ 0.0% - 0.5% ] 0.49% | 5,647,479 | 2.6% |
[ 0.5% - 1.0% ] 0.60% | 3,127,660 | 2.5% |
[ 0.5% - 1.0% ] 0.71% | 2,386,585 | 2.7% |
[ 0.5% - 1.0% ] 0.81% | 2,042,109 | 2.5% |
[ 0.5% - 1.0% ] 0.94% | 1,418,164 | 2.2% |
[ 1.0% - 1.5% ] 1.05% | 1,087,223 | 2.5% |
[ 1.0% - 1.5% ] 1.14% | 850,885 | 2.8% |
[ 1.0% - 1.5% ] 1.27% | 672,291 | 2.7% |
[ 1.0% - 1.5% ] 1.38% | 699,211 | 2.4% |
[ 1.0% - 1.5% ] 1.49% | 271,643 | 2.8% |
[ 1.5% - 2.0% ] 1.58% | 440,934 | 2.8% |
[ 1.5% - 2.0% ] 1.71% | 386,061 | 3.1% |
[ 1.5% - 2.0% ] 1.81% | 311,604 | 2.4% |
[ 1.5% - 2.0% ] 1.93% | 257,599 | 2.1% |
[ 2.0% - 2.5% ] 2.02% | 165,009 | 2.4% |
[ 2.0% - 2.5% ] 2.16% | 204,349 | 2.6% |
[ 2.0% - 2.5% ] 2.26% | 445,646 | 2.7% |
[ 2.0% - 2.5% ] 2.35% | 44,337 | 1.7% |
[ 2.0% - 2.5% ] 2.46% | 78,160 | 3.0% |
[ 2.5% - 3.0% ] 2.61% | 373,000 | 2.4% |
[ 2.5% - 3.0% ] 2.69% | 172,844 | 2.1% |
[ 2.5% - 3.0% ] 2.80% | 25,082 | 1.5% |
[ 2.5% - 3.0% ] 2.91% | 60,518 | 1.9% |
[ 3.0% - 3.5% ] 3.02% | 68,537 | 2.3% |
[ 3.0% - 3.5% ] 3.11% | 55,856 | 3.3% |
[ 3.0% - 3.5% ] 3.26% | 103,784 | 2.6% |
[ 3.0% - 3.5% ] 3.41% | 38,674 | 3.3% |
[ 3.0% - 3.5% ] 3.47% | 119,589 | 2.7% |
[ 3.5% - 4.0% ] 3.56% | 61,753 | 2.9% |
[ 3.5% - 4.0% ] 3.70% | 51,223 | 3.0% |
[ 3.5% - 4.0% ] 3.82% | 41,455 | 1.6% |
[ 3.5% - 4.0% ] 3.90% | 14,251 | 1.5% |
[ 4.0% - 4.5% ] 4.02% | 27,942 | 2.7% |
[ 4.0% - 4.5% ] 4.13% | 74,292 | 3.2% |
[ 4.0% - 4.5% ] 4.23% | 41,733 | 5.0% |
[ 4.0% - 4.5% ] 4.36% | 16,340 | 1.0% |
[ 4.0% - 4.5% ] 4.49% | 5,905 | 3.9% |
[ 4.5% - 5.0% ] 4.55% | 13,705 | 3.0% |
[ 4.5% - 5.0% ] 4.74% | 1,665 | 5.6% |
[ 4.5% - 5.0% ] 4.93% | 365 | 2.3% |
[ 4.5% - 5.0% ] 4.99% | 28,173 | 1.8% |
[ 5.0% - 5.5% ] 5.12% | 36,489 | 3.0% |
[ 5.0% - 5.5% ] 5.21% | 57,907 | 2.8% |
[ 5.0% - 5.5% ] 5.47% | 25,427 | 2.9% |
[ 5.5% - 6.0% ] 5.67% | 8,205 | 2.2% |
[ 6.0% - 6.5% ] 6.04% | 72,324 | 2.1% |
[ 6.0% - 6.5% ] 6.11% | 229 | 4.0% |
[ 6.0% - 6.5% ] 6.21% | 11,276 | 2.3% |
[ 6.5% - 7.0% ] 6.60% | 2,122 | 0.96% |
[ 6.5% - 7.0% ] 6.65% | 7,551 | 0.64% |
[ 6.5% - 7.0% ] 6.76% | 281 | 1.8% |
[ 6.5% - 7.0% ] 6.93% | 101 | 7.8% |
[ 7.0% - 7.5% ] 7.04% | 696 | 6.5% |
[ 7.0% - 7.5% ] 7.14% | 5,743 | 1.7% |
[ 7.5% - 8.0% ] 7.51% | 17,628 | 3.4% |
[ 7.5% - 8.0% ] 7.69% | 182 | 3.8% |
[ 7.5% - 8.0% ] 7.76% | 2,564 | 3.3% |
[ 7.5% - 8.0% ] 7.90% | 51,367 | 2.5% |
[ 8.0% - 8.5% ] 8.11% | 3,909 | 3.6% |
[ 8.0% - 8.5% ] 8.17% | 465 | 0.92% |
[ 8.0% - 8.5% ] 8.44% | 237 | 1.4% |
[ 8.5% - 9.0% ] 8.74% | 10,042 | 3.2% |
[ 8.5% - 9.0% ] 8.91% | 3,188 | 5.1% |
[ 9.0% - 9.5% ] 9.14% | 38,142 | 2.8% |
[ 10.0% - 10.5% ] 10.30% | 4,555 | 2.4% |
[ 10.0% - 10.5% ] 10.48% | 620 | 5.1% |
[ 10.5% - 11.0% ] 10.66% | 6,606 | 3.4% |
[ 10.5% - 11.0% ] 10.88% | 377 | 2.6% |
[ 11.0% - 11.5% ] 11.33% | 256 | 3.6% |
[ 11.0% - 11.5% ] 11.46% | 759 | 2.0% |
[ 12.5% - 13.0% ] 12.61% | 3,593 | 2.4% |
[ 13.0% - 13.5% ] 13.21% | 12,370 | 2.1% |
[ 17.5% - 18.0% ] 17.56% | 5,713 | 2.0% |
[ 19.5% - 20.0% ] 19.60% | 1,949 | 1.0% |
[ 20.0% - 20.5% ] 20.14% | 1,897 | 1.0% |
[ 20.0% - 20.5% ] 20.32% | 2,274 | 1.2% |
[ 21.0% - 21.5% ] 21.30% | 5,774 | 0.80% |
[ 22.0% - 22.5% ] 22.01% | 5,411 | 0.86% |