Pakistani 1 or more Vehicles in Household
COMPARE
Pakistani
Select to Compare
1 or more Vehicles in Household
Pakistani 1 or more Vehicles in Household
91.3%
1+ VEHICLES AVAILABLE
99.0/ 100
METRIC RATING
97th/ 347
METRIC RANK
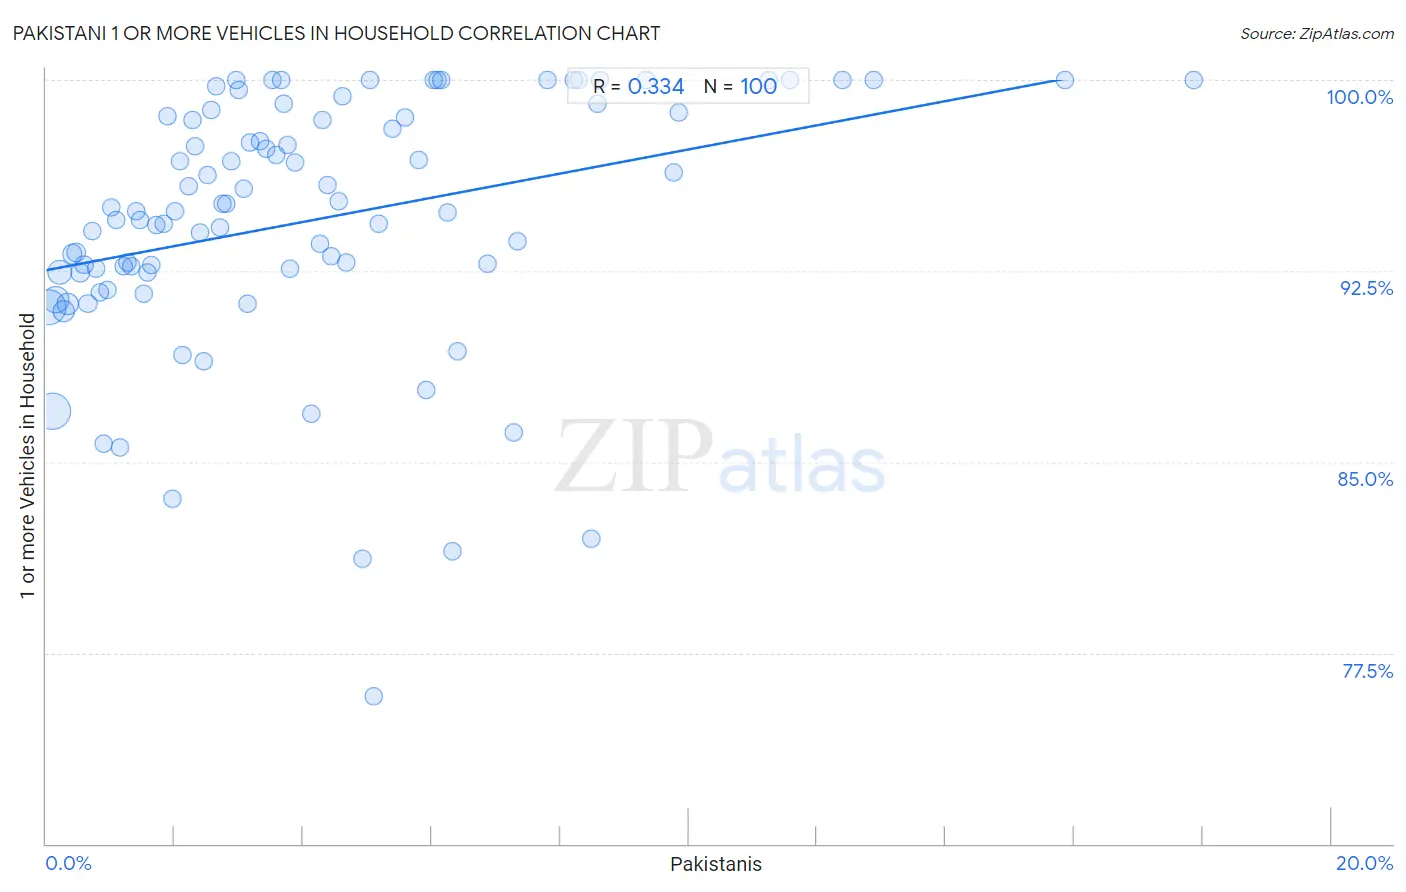
Pakistani 1 or more Vehicles in Household Correlation Chart
The statistical analysis conducted on geographies consisting of 335,009,492 people shows a mild positive correlation between the proportion of Pakistanis and percentage of households with 1 or more vehicles available in the United States with a correlation coefficient (R) of 0.334 and weighted average of 91.3%. On average, for every 1% (one percent) increase in Pakistanis within a typical geography, there is an increase of 0.47% in percentage of households with 1 or more vehicles available.
It is essential to understand that the correlation between the percentage of Pakistanis and percentage of households with 1 or more vehicles available does not imply a direct cause-and-effect relationship. It remains uncertain whether the presence of Pakistanis influences an upward or downward trend in the level of percentage of households with 1 or more vehicles available within an area, or if Pakistanis simply ended up residing in those areas with higher or lower levels of percentage of households with 1 or more vehicles available due to other factors.
Demographics Similar to Pakistanis by 1 or more Vehicles in Household
In terms of 1 or more vehicles in household, the demographic groups most similar to Pakistanis are Potawatomi (91.3%, a difference of 0.010%), Austrian (91.3%, a difference of 0.020%), Immigrants from Cuba (91.3%, a difference of 0.030%), Immigrants from North America (91.4%, a difference of 0.090%), and Immigrants from Canada (91.4%, a difference of 0.10%).
| Demographics | Rating | Rank | 1 or more Vehicles in Household |
| Immigrants from Canada | 99.2 /100 | #90 | Exceptional 91.4% |
| Immigrants from Jordan | 99.2 /100 | #91 | Exceptional 91.4% |
| Bhutanese | 99.2 /100 | #92 | Exceptional 91.4% |
| Immigrants from North America | 99.2 /100 | #93 | Exceptional 91.4% |
| Immigrants from Cuba | 99.1 /100 | #94 | Exceptional 91.3% |
| Austrians | 99.0 /100 | #95 | Exceptional 91.3% |
| Potawatomi | 99.0 /100 | #96 | Exceptional 91.3% |
| Pakistanis | 99.0 /100 | #97 | Exceptional 91.3% |
| Slavs | 98.7 /100 | #98 | Exceptional 91.2% |
| Immigrants from Bolivia | 98.6 /100 | #99 | Exceptional 91.2% |
| Immigrants from Central America | 98.4 /100 | #100 | Exceptional 91.1% |
| Bulgarians | 98.4 /100 | #101 | Exceptional 91.1% |
| Seminole | 98.3 /100 | #102 | Exceptional 91.1% |
| Yugoslavians | 98.3 /100 | #103 | Exceptional 91.1% |
| Asians | 98.2 /100 | #104 | Exceptional 91.1% |
Pakistani 1 or more Vehicles in Household Correlation Summary
| Measurement | Pakistani Data | 1 or more Vehicles in Household Data |
| Minimum | 0.034% | 75.8% |
| Maximum | 17.9% | 100.0% |
| Range | 17.8% | 24.2% |
| Mean | 4.1% | 94.5% |
| Median | 3.2% | 94.8% |
| Interquartile 25% (IQ1) | 1.5% | 92.4% |
| Interquartile 75% (IQ3) | 5.9% | 98.6% |
| Interquartile Range (IQR) | 4.3% | 6.2% |
| Standard Deviation (Sample) | 3.5% | 5.0% |
| Standard Deviation (Population) | 3.5% | 4.9% |
Correlation Details
| Pakistani Percentile | Sample Size | 1 or more Vehicles in Household |
[ 0.0% - 0.5% ] 0.034% | 90,048,742 | 91.1% |
[ 0.0% - 0.5% ] 0.091% | 93,775,193 | 87.0% |
[ 0.0% - 0.5% ] 0.15% | 47,640,084 | 91.4% |
[ 0.0% - 0.5% ] 0.21% | 33,672,595 | 92.4% |
[ 0.0% - 0.5% ] 0.28% | 18,762,992 | 90.9% |
[ 0.0% - 0.5% ] 0.34% | 16,631,346 | 91.2% |
[ 0.0% - 0.5% ] 0.40% | 8,477,207 | 93.2% |
[ 0.0% - 0.5% ] 0.46% | 6,992,935 | 93.2% |
[ 0.5% - 1.0% ] 0.52% | 4,133,068 | 92.4% |
[ 0.5% - 1.0% ] 0.59% | 3,080,272 | 92.8% |
[ 0.5% - 1.0% ] 0.65% | 2,242,509 | 91.2% |
[ 0.5% - 1.0% ] 0.72% | 1,920,789 | 94.1% |
[ 0.5% - 1.0% ] 0.77% | 1,317,313 | 92.6% |
[ 0.5% - 1.0% ] 0.83% | 1,147,157 | 91.7% |
[ 0.5% - 1.0% ] 0.90% | 861,909 | 85.7% |
[ 0.5% - 1.0% ] 0.95% | 752,692 | 91.8% |
[ 1.0% - 1.5% ] 1.02% | 423,632 | 95.0% |
[ 1.0% - 1.5% ] 1.08% | 293,632 | 94.5% |
[ 1.0% - 1.5% ] 1.14% | 231,009 | 85.6% |
[ 1.0% - 1.5% ] 1.21% | 305,694 | 92.7% |
[ 1.0% - 1.5% ] 1.26% | 261,627 | 92.8% |
[ 1.0% - 1.5% ] 1.32% | 235,940 | 92.7% |
[ 1.0% - 1.5% ] 1.39% | 285,454 | 94.8% |
[ 1.0% - 1.5% ] 1.46% | 187,114 | 94.5% |
[ 1.5% - 2.0% ] 1.51% | 260,747 | 91.6% |
[ 1.5% - 2.0% ] 1.57% | 138,478 | 92.5% |
[ 1.5% - 2.0% ] 1.64% | 146,283 | 92.7% |
[ 1.5% - 2.0% ] 1.70% | 151,933 | 94.3% |
[ 1.5% - 2.0% ] 1.83% | 74,625 | 94.3% |
[ 1.5% - 2.0% ] 1.89% | 54,729 | 98.6% |
[ 1.5% - 2.0% ] 1.96% | 52,196 | 83.5% |
[ 2.0% - 2.5% ] 2.01% | 53,593 | 94.8% |
[ 2.0% - 2.5% ] 2.08% | 17,410 | 96.8% |
[ 2.0% - 2.5% ] 2.13% | 66,168 | 89.2% |
[ 2.0% - 2.5% ] 2.21% | 24,707 | 95.8% |
[ 2.0% - 2.5% ] 2.27% | 25,953 | 98.4% |
[ 2.0% - 2.5% ] 2.31% | 1,038 | 97.4% |
[ 2.0% - 2.5% ] 2.39% | 14,274 | 94.0% |
[ 2.0% - 2.5% ] 2.45% | 10,378 | 88.9% |
[ 2.5% - 3.0% ] 2.50% | 9,108 | 96.3% |
[ 2.5% - 3.0% ] 2.56% | 15,140 | 98.8% |
[ 2.5% - 3.0% ] 2.64% | 6,588 | 99.7% |
[ 2.5% - 3.0% ] 2.70% | 5,768 | 94.2% |
[ 2.5% - 3.0% ] 2.74% | 58,031 | 95.2% |
[ 2.5% - 3.0% ] 2.80% | 1,357 | 95.1% |
[ 2.5% - 3.0% ] 2.88% | 11,457 | 96.8% |
[ 2.5% - 3.0% ] 2.95% | 746 | 100.0% |
[ 3.0% - 3.5% ] 3.00% | 3,828 | 99.6% |
[ 3.0% - 3.5% ] 3.07% | 17,806 | 95.7% |
[ 3.0% - 3.5% ] 3.13% | 15,816 | 91.2% |
[ 3.0% - 3.5% ] 3.18% | 3,113 | 97.5% |
[ 3.0% - 3.5% ] 3.33% | 2,762 | 97.6% |
[ 3.0% - 3.5% ] 3.43% | 4,085 | 97.3% |
[ 3.5% - 4.0% ] 3.51% | 1,452 | 100.0% |
[ 3.5% - 4.0% ] 3.59% | 3,373 | 97.1% |
[ 3.5% - 4.0% ] 3.65% | 630 | 100.0% |
[ 3.5% - 4.0% ] 3.69% | 1,002 | 99.1% |
[ 3.5% - 4.0% ] 3.75% | 587 | 97.5% |
[ 3.5% - 4.0% ] 3.80% | 15,200 | 92.6% |
[ 3.5% - 4.0% ] 3.87% | 1,033 | 96.8% |
[ 4.0% - 4.5% ] 4.13% | 1,478 | 86.9% |
[ 4.0% - 4.5% ] 4.25% | 9,756 | 93.6% |
[ 4.0% - 4.5% ] 4.31% | 4,503 | 98.5% |
[ 4.0% - 4.5% ] 4.37% | 7,757 | 95.9% |
[ 4.0% - 4.5% ] 4.44% | 540 | 93.1% |
[ 4.5% - 5.0% ] 4.55% | 2,243 | 95.2% |
[ 4.5% - 5.0% ] 4.62% | 390 | 99.3% |
[ 4.5% - 5.0% ] 4.67% | 664 | 92.8% |
[ 4.5% - 5.0% ] 4.91% | 468 | 81.2% |
[ 5.0% - 5.5% ] 5.03% | 3,120 | 100.0% |
[ 5.0% - 5.5% ] 5.09% | 216 | 75.8% |
[ 5.0% - 5.5% ] 5.18% | 1,235 | 94.4% |
[ 5.0% - 5.5% ] 5.39% | 1,577 | 98.1% |
[ 5.5% - 6.0% ] 5.59% | 2,898 | 98.5% |
[ 5.5% - 6.0% ] 5.80% | 4,187 | 96.9% |
[ 5.5% - 6.0% ] 5.92% | 152 | 87.8% |
[ 6.0% - 6.5% ] 6.03% | 564 | 100.0% |
[ 6.0% - 6.5% ] 6.09% | 197 | 100.0% |
[ 6.0% - 6.5% ] 6.14% | 114 | 100.0% |
[ 6.0% - 6.5% ] 6.24% | 1,217 | 94.8% |
[ 6.0% - 6.5% ] 6.33% | 158 | 81.5% |
[ 6.0% - 6.5% ] 6.40% | 250 | 89.3% |
[ 6.5% - 7.0% ] 6.87% | 262 | 92.8% |
[ 7.0% - 7.5% ] 7.27% | 1,086 | 86.2% |
[ 7.0% - 7.5% ] 7.33% | 2,647 | 93.7% |
[ 7.5% - 8.0% ] 7.81% | 1,268 | 100.0% |
[ 8.0% - 8.5% ] 8.22% | 73 | 100.0% |
[ 8.0% - 8.5% ] 8.28% | 483 | 100.0% |
[ 8.0% - 8.5% ] 8.47% | 177 | 82.0% |
[ 8.5% - 9.0% ] 8.58% | 536 | 99.1% |
[ 8.5% - 9.0% ] 8.61% | 360 | 100.0% |
[ 9.0% - 9.5% ] 9.35% | 2,332 | 100.0% |
[ 9.5% - 10.0% ] 9.76% | 1,475 | 96.4% |
[ 9.5% - 10.0% ] 9.84% | 183 | 98.7% |
[ 11.0% - 11.5% ] 11.24% | 169 | 100.0% |
[ 11.5% - 12.0% ] 11.57% | 1,132 | 100.0% |
[ 12.0% - 12.5% ] 12.39% | 557 | 100.0% |
[ 12.5% - 13.0% ] 12.87% | 404 | 100.0% |
[ 15.5% - 16.0% ] 15.86% | 309 | 100.0% |
[ 17.5% - 18.0% ] 17.86% | 56 | 100.0% |