Liberian Married-Couple Family Poverty
COMPARE
Liberian
Select to Compare
Married-Couple Family Poverty
Liberian Married-Couple Family Poverty
5.4%
POVERTY | MARRIED-COUPLE FAMILIES
26.3/ 100
METRIC RATING
197th/ 347
METRIC RANK
Liberian Married-Couple Family Poverty Correlation Chart
The statistical analysis conducted on geographies consisting of 117,684,322 people shows a poor positive correlation between the proportion of Liberians and poverty level among married-couple families in the United States with a correlation coefficient (R) of 0.107 and weighted average of 5.4%. On average, for every 1% (one percent) increase in Liberians within a typical geography, there is an increase of 0.14% in poverty level among married-couple families.
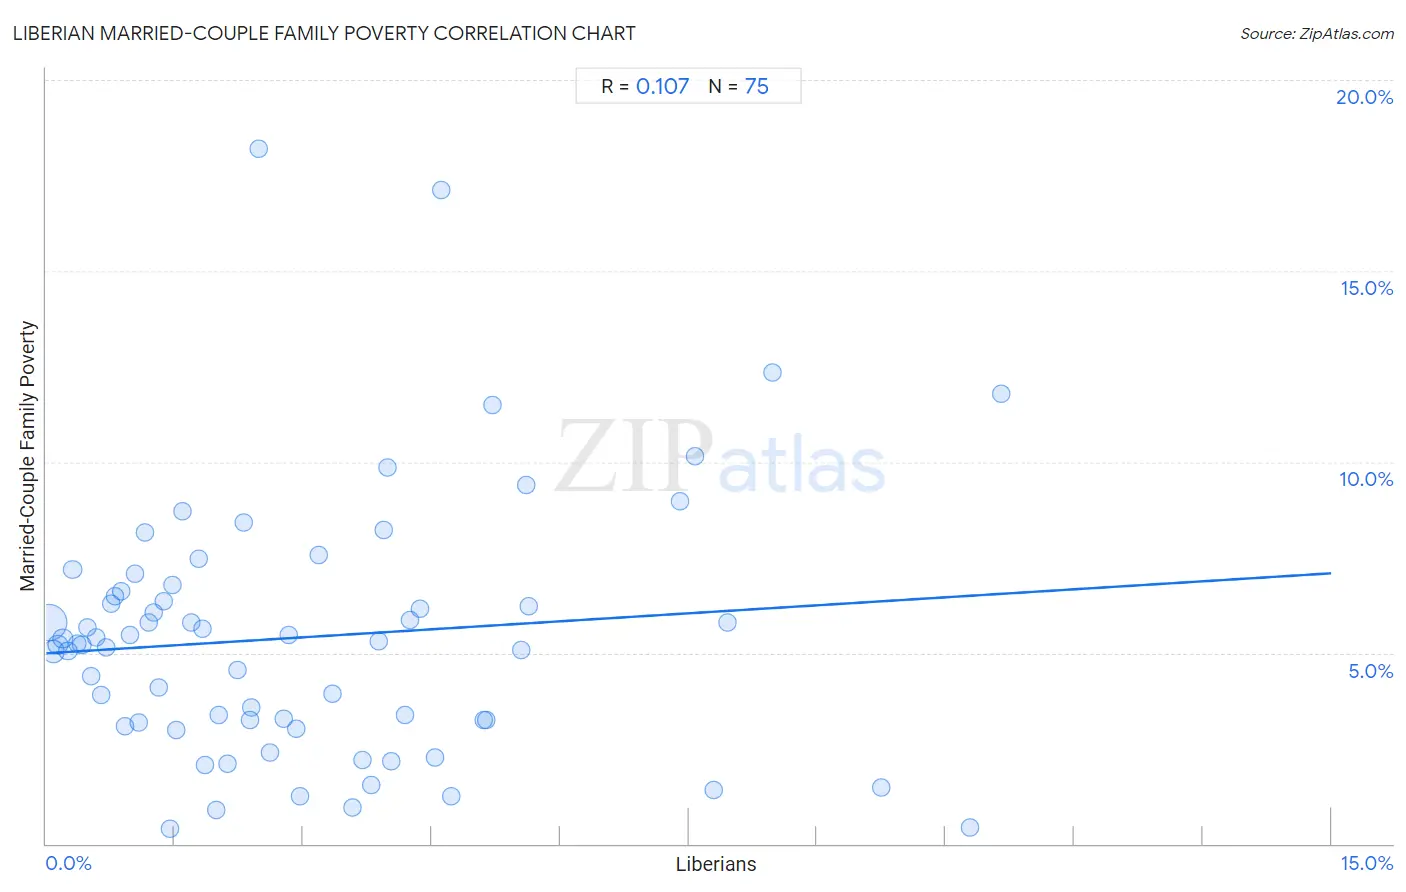
It is essential to understand that the correlation between the percentage of Liberians and poverty level among married-couple families does not imply a direct cause-and-effect relationship. It remains uncertain whether the presence of Liberians influences an upward or downward trend in the level of poverty level among married-couple families within an area, or if Liberians simply ended up residing in those areas with higher or lower levels of poverty level among married-couple families due to other factors.
Demographics Similar to Liberians by Married-Couple Family Poverty
In terms of married-couple family poverty, the demographic groups most similar to Liberians are Immigrants from Belarus (5.4%, a difference of 0.020%), Spaniard (5.4%, a difference of 0.15%), Immigrants from the Azores (5.4%, a difference of 0.17%), Uruguayan (5.4%, a difference of 0.20%), and Immigrants from Israel (5.4%, a difference of 0.22%).
| Demographics | Rating | Rank | Married-Couple Family Poverty |
| Ugandans | 31.6 /100 | #190 | Fair 5.3% |
| Immigrants from Cabo Verde | 30.9 /100 | #191 | Fair 5.3% |
| Cape Verdeans | 30.7 /100 | #192 | Fair 5.3% |
| Malaysians | 29.5 /100 | #193 | Fair 5.4% |
| Immigrants from Israel | 27.8 /100 | #194 | Fair 5.4% |
| Immigrants from the Azores | 27.5 /100 | #195 | Fair 5.4% |
| Spaniards | 27.4 /100 | #196 | Fair 5.4% |
| Liberians | 26.3 /100 | #197 | Fair 5.4% |
| Immigrants from Belarus | 26.2 /100 | #198 | Fair 5.4% |
| Uruguayans | 25.0 /100 | #199 | Fair 5.4% |
| Immigrants from Morocco | 24.3 /100 | #200 | Fair 5.4% |
| Lebanese | 24.1 /100 | #201 | Fair 5.4% |
| Immigrants from Middle Africa | 23.8 /100 | #202 | Fair 5.4% |
| Immigrants from Peru | 21.8 /100 | #203 | Fair 5.4% |
| Immigrants from Costa Rica | 19.4 /100 | #204 | Poor 5.4% |
Liberian Married-Couple Family Poverty Correlation Summary
| Measurement | Liberian Data | Married-Couple Family Poverty Data |
| Minimum | 0.025% | 0.41% |
| Maximum | 11.2% | 18.2% |
| Range | 11.1% | 17.8% |
| Mean | 3.0% | 5.4% |
| Median | 2.3% | 5.2% |
| Interquartile 25% (IQ1) | 1.0% | 3.2% |
| Interquartile 75% (IQ3) | 4.2% | 6.6% |
| Interquartile Range (IQR) | 3.2% | 3.4% |
| Standard Deviation (Sample) | 2.6% | 3.4% |
| Standard Deviation (Population) | 2.6% | 3.4% |
Correlation Details
| Liberian Percentile | Sample Size | Married-Couple Family Poverty |
[ 0.0% - 0.5% ] 0.025% | 72,151,768 | 5.8% |
[ 0.0% - 0.5% ] 0.083% | 16,920,838 | 5.0% |
[ 0.0% - 0.5% ] 0.14% | 6,754,281 | 5.2% |
[ 0.0% - 0.5% ] 0.19% | 6,899,695 | 5.4% |
[ 0.0% - 0.5% ] 0.25% | 2,149,344 | 5.1% |
[ 0.0% - 0.5% ] 0.31% | 3,781,766 | 7.2% |
[ 0.0% - 0.5% ] 0.36% | 1,398,906 | 5.2% |
[ 0.0% - 0.5% ] 0.42% | 782,631 | 5.2% |
[ 0.0% - 0.5% ] 0.48% | 760,711 | 5.7% |
[ 0.5% - 1.0% ] 0.52% | 685,198 | 4.4% |
[ 0.5% - 1.0% ] 0.59% | 586,735 | 5.4% |
[ 0.5% - 1.0% ] 0.64% | 397,435 | 3.9% |
[ 0.5% - 1.0% ] 0.69% | 406,442 | 5.1% |
[ 0.5% - 1.0% ] 0.75% | 414,838 | 6.3% |
[ 0.5% - 1.0% ] 0.81% | 282,654 | 6.5% |
[ 0.5% - 1.0% ] 0.87% | 224,409 | 6.6% |
[ 0.5% - 1.0% ] 0.92% | 159,076 | 3.1% |
[ 0.5% - 1.0% ] 0.97% | 339,641 | 5.5% |
[ 1.0% - 1.5% ] 1.03% | 136,067 | 7.1% |
[ 1.0% - 1.5% ] 1.08% | 108,683 | 3.2% |
[ 1.0% - 1.5% ] 1.15% | 251,502 | 8.1% |
[ 1.0% - 1.5% ] 1.20% | 105,604 | 5.8% |
[ 1.0% - 1.5% ] 1.25% | 260,519 | 6.1% |
[ 1.0% - 1.5% ] 1.32% | 55,474 | 4.1% |
[ 1.0% - 1.5% ] 1.37% | 61,724 | 6.4% |
[ 1.0% - 1.5% ] 1.44% | 6,812 | 0.41% |
[ 1.0% - 1.5% ] 1.47% | 152,010 | 6.8% |
[ 1.5% - 2.0% ] 1.51% | 66,828 | 3.0% |
[ 1.5% - 2.0% ] 1.59% | 5,647 | 8.7% |
[ 1.5% - 2.0% ] 1.69% | 202,789 | 5.8% |
[ 1.5% - 2.0% ] 1.78% | 2,759 | 7.5% |
[ 1.5% - 2.0% ] 1.82% | 97,674 | 5.6% |
[ 1.5% - 2.0% ] 1.86% | 7,003 | 2.1% |
[ 1.5% - 2.0% ] 1.99% | 3,978 | 0.87% |
[ 2.0% - 2.5% ] 2.02% | 127,319 | 3.4% |
[ 2.0% - 2.5% ] 2.11% | 3,264 | 2.1% |
[ 2.0% - 2.5% ] 2.24% | 24,437 | 4.5% |
[ 2.0% - 2.5% ] 2.30% | 35,606 | 8.4% |
[ 2.0% - 2.5% ] 2.37% | 66,702 | 3.2% |
[ 2.0% - 2.5% ] 2.40% | 14,960 | 3.6% |
[ 2.0% - 2.5% ] 2.48% | 12,799 | 18.2% |
[ 2.5% - 3.0% ] 2.61% | 54,042 | 2.4% |
[ 2.5% - 3.0% ] 2.77% | 24,283 | 3.3% |
[ 2.5% - 3.0% ] 2.83% | 12,388 | 5.5% |
[ 2.5% - 3.0% ] 2.92% | 67,773 | 3.0% |
[ 2.5% - 3.0% ] 2.96% | 4,523 | 1.2% |
[ 3.0% - 3.5% ] 3.17% | 39,099 | 7.6% |
[ 3.0% - 3.5% ] 3.34% | 31,812 | 3.9% |
[ 3.5% - 4.0% ] 3.57% | 12,277 | 0.94% |
[ 3.5% - 4.0% ] 3.69% | 34,414 | 2.2% |
[ 3.5% - 4.0% ] 3.79% | 9,507 | 1.5% |
[ 3.5% - 4.0% ] 3.88% | 5,747 | 5.3% |
[ 3.5% - 4.0% ] 3.94% | 1,751 | 8.2% |
[ 3.5% - 4.0% ] 3.98% | 12,860 | 9.9% |
[ 4.0% - 4.5% ] 4.03% | 36,213 | 2.2% |
[ 4.0% - 4.5% ] 4.18% | 5,976 | 3.4% |
[ 4.0% - 4.5% ] 4.24% | 8,630 | 5.9% |
[ 4.0% - 4.5% ] 4.37% | 60,800 | 6.2% |
[ 4.5% - 5.0% ] 4.54% | 84,951 | 2.2% |
[ 4.5% - 5.0% ] 4.61% | 8,244 | 17.1% |
[ 4.5% - 5.0% ] 4.73% | 7,617 | 1.3% |
[ 5.0% - 5.5% ] 5.11% | 23,967 | 3.2% |
[ 5.0% - 5.5% ] 5.13% | 23,856 | 3.2% |
[ 5.0% - 5.5% ] 5.20% | 1,730 | 11.5% |
[ 5.5% - 6.0% ] 5.54% | 13,075 | 5.1% |
[ 5.5% - 6.0% ] 5.60% | 22,493 | 9.4% |
[ 5.5% - 6.0% ] 5.63% | 21,620 | 6.2% |
[ 7.0% - 7.5% ] 7.39% | 4,762 | 9.0% |
[ 7.5% - 8.0% ] 7.57% | 31,018 | 10.2% |
[ 7.5% - 8.0% ] 7.79% | 33,109 | 1.4% |
[ 7.5% - 8.0% ] 7.96% | 32,967 | 5.8% |
[ 8.0% - 8.5% ] 8.47% | 10,682 | 12.4% |
[ 9.5% - 10.0% ] 9.75% | 28,392 | 1.5% |
[ 10.5% - 11.0% ] 10.79% | 4,060 | 0.43% |
[ 11.0% - 11.5% ] 11.15% | 3,156 | 11.8% |