Kiowa Female Disability
COMPARE
Kiowa
Select to Compare
Female Disability
Kiowa Female Disability
15.8%
DISABILITY | FEMALES
0.0/ 100
METRIC RATING
344th/ 347
METRIC RANK
Kiowa Female Disability Correlation Chart
The statistical analysis conducted on geographies consisting of 56,098,208 people shows a slight positive correlation between the proportion of Kiowa and percentage of females with a disability in the United States with a correlation coefficient (R) of 0.098 and weighted average of 15.8%. On average, for every 1% (one percent) increase in Kiowa within a typical geography, there is an increase of 0.11% in percentage of females with a disability.
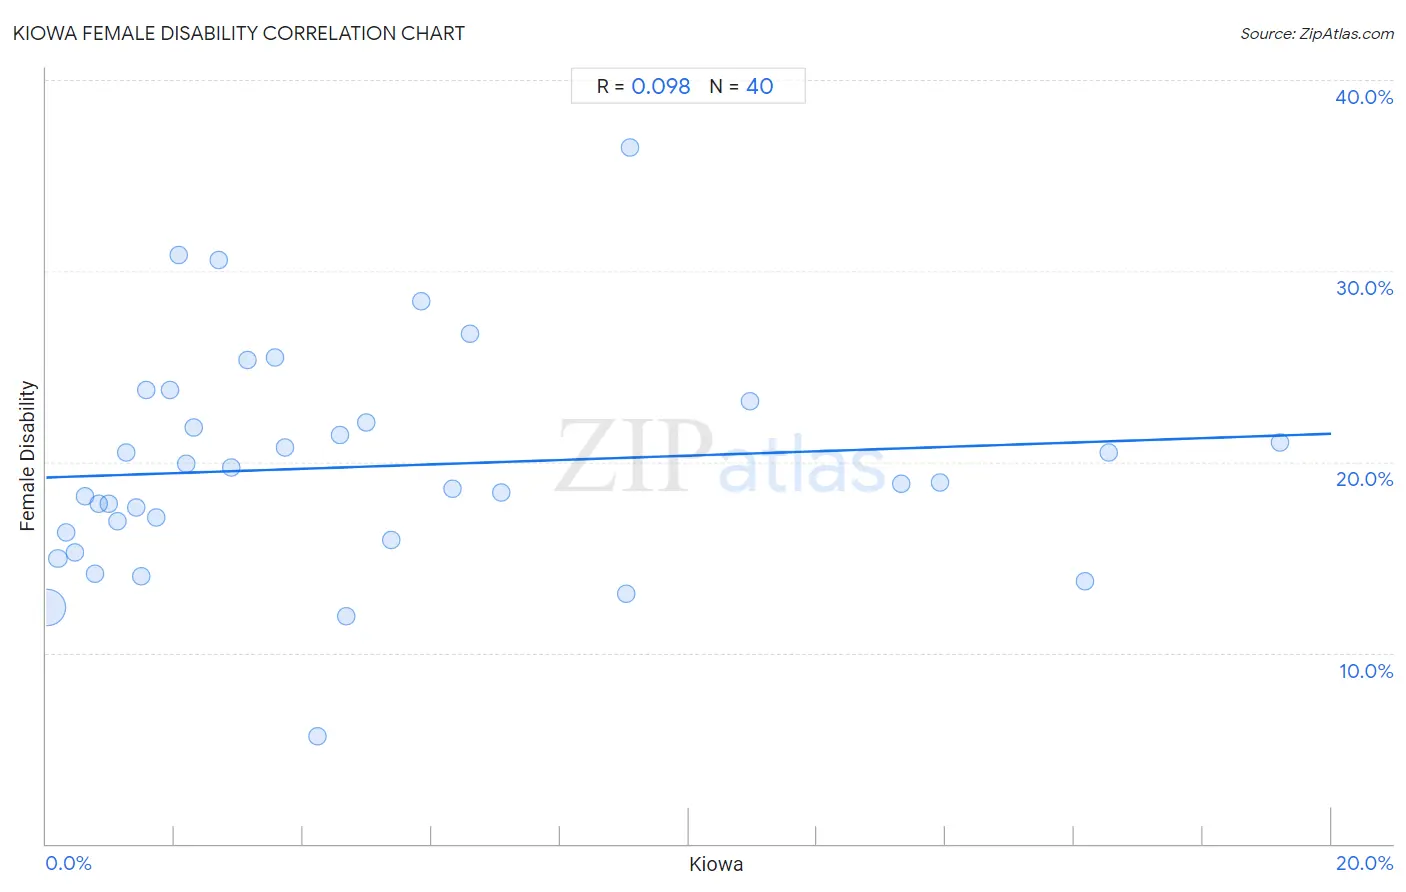
It is essential to understand that the correlation between the percentage of Kiowa and percentage of females with a disability does not imply a direct cause-and-effect relationship. It remains uncertain whether the presence of Kiowa influences an upward or downward trend in the level of percentage of females with a disability within an area, or if Kiowa simply ended up residing in those areas with higher or lower levels of percentage of females with a disability due to other factors.
Demographics Similar to Kiowa by Female Disability
In terms of female disability, the demographic groups most similar to Kiowa are Lumbee (15.8%, a difference of 0.16%), Creek (15.7%, a difference of 0.84%), Choctaw (15.4%, a difference of 2.5%), Chickasaw (15.2%, a difference of 3.9%), and Colville (15.1%, a difference of 4.8%).
| Demographics | Rating | Rank | Female Disability |
| Immigrants from the Azores | 0.0 /100 | #333 | Tragic 14.9% |
| Cherokee | 0.0 /100 | #334 | Tragic 14.9% |
| Cajuns | 0.0 /100 | #335 | Tragic 14.9% |
| Seminole | 0.0 /100 | #336 | Tragic 15.0% |
| Tohono O'odham | 0.0 /100 | #337 | Tragic 15.0% |
| Dutch West Indians | 0.0 /100 | #338 | Tragic 15.0% |
| Colville | 0.0 /100 | #339 | Tragic 15.1% |
| Chickasaw | 0.0 /100 | #340 | Tragic 15.2% |
| Choctaw | 0.0 /100 | #341 | Tragic 15.4% |
| Creek | 0.0 /100 | #342 | Tragic 15.7% |
| Lumbee | 0.0 /100 | #343 | Tragic 15.8% |
| Kiowa | 0.0 /100 | #344 | Tragic 15.8% |
| Puerto Ricans | 0.0 /100 | #345 | Tragic 16.6% |
| Tsimshian | 0.0 /100 | #346 | Tragic 16.8% |
| Houma | 0.0 /100 | #347 | Tragic 16.9% |
Kiowa Female Disability Correlation Summary
| Measurement | Kiowa Data | Female Disability Data |
| Minimum | 0.014% | 5.6% |
| Maximum | 19.2% | 36.4% |
| Range | 19.2% | 30.8% |
| Mean | 4.9% | 19.7% |
| Median | 3.0% | 18.9% |
| Interquartile 25% (IQ1) | 1.3% | 16.1% |
| Interquartile 75% (IQ3) | 6.5% | 22.6% |
| Interquartile Range (IQR) | 5.1% | 6.5% |
| Standard Deviation (Sample) | 5.0% | 5.8% |
| Standard Deviation (Population) | 4.9% | 5.8% |
Correlation Details
| Kiowa Percentile | Sample Size | Female Disability |
[ 0.0% - 0.5% ] 0.014% | 53,191,054 | 12.4% |
[ 0.0% - 0.5% ] 0.18% | 1,500,870 | 14.9% |
[ 0.0% - 0.5% ] 0.31% | 603,478 | 16.3% |
[ 0.0% - 0.5% ] 0.45% | 339,616 | 15.2% |
[ 0.5% - 1.0% ] 0.60% | 91,763 | 18.2% |
[ 0.5% - 1.0% ] 0.75% | 43,569 | 14.2% |
[ 0.5% - 1.0% ] 0.82% | 111,877 | 17.8% |
[ 0.5% - 1.0% ] 0.98% | 3,059 | 17.8% |
[ 1.0% - 1.5% ] 1.11% | 117,253 | 16.9% |
[ 1.0% - 1.5% ] 1.25% | 9,935 | 20.5% |
[ 1.0% - 1.5% ] 1.40% | 1,713 | 17.6% |
[ 1.0% - 1.5% ] 1.47% | 4,747 | 14.0% |
[ 1.5% - 2.0% ] 1.57% | 21,911 | 23.8% |
[ 1.5% - 2.0% ] 1.70% | 176 | 17.1% |
[ 1.5% - 2.0% ] 1.92% | 22,810 | 23.8% |
[ 2.0% - 2.5% ] 2.07% | 1,065 | 30.8% |
[ 2.0% - 2.5% ] 2.17% | 1,196 | 19.9% |
[ 2.0% - 2.5% ] 2.29% | 1,613 | 21.8% |
[ 2.5% - 3.0% ] 2.68% | 783 | 30.6% |
[ 2.5% - 3.0% ] 2.88% | 800 | 19.7% |
[ 3.0% - 3.5% ] 3.14% | 542 | 25.4% |
[ 3.5% - 4.0% ] 3.56% | 478 | 25.4% |
[ 3.5% - 4.0% ] 3.72% | 1,613 | 20.8% |
[ 4.0% - 4.5% ] 4.22% | 166 | 5.6% |
[ 4.5% - 5.0% ] 4.58% | 961 | 21.4% |
[ 4.5% - 5.0% ] 4.68% | 278 | 11.9% |
[ 4.5% - 5.0% ] 4.97% | 1,207 | 22.1% |
[ 5.0% - 5.5% ] 5.36% | 373 | 15.9% |
[ 5.5% - 6.0% ] 5.83% | 240 | 28.4% |
[ 6.0% - 6.5% ] 6.32% | 1,377 | 18.6% |
[ 6.5% - 7.0% ] 6.59% | 1,154 | 26.7% |
[ 7.0% - 7.5% ] 7.08% | 1,526 | 18.4% |
[ 9.0% - 9.5% ] 9.02% | 499 | 13.1% |
[ 9.0% - 9.5% ] 9.09% | 176 | 36.4% |
[ 10.5% - 11.0% ] 10.96% | 292 | 23.2% |
[ 13.0% - 13.5% ] 13.31% | 1,585 | 18.9% |
[ 13.5% - 14.0% ] 13.91% | 2,301 | 18.9% |
[ 16.0% - 16.5% ] 16.16% | 396 | 13.8% |
[ 16.5% - 17.0% ] 16.54% | 8,033 | 20.5% |
[ 19.0% - 19.5% ] 19.20% | 5,723 | 21.0% |