Immigrants from Uruguay Married-Couple Family Poverty
COMPARE
Immigrants from Uruguay
Select to Compare
Married-Couple Family Poverty
Immigrants from Uruguay Married-Couple Family Poverty
5.7%
POVERTY | MARRIED-COUPLE FAMILIES
3.7/ 100
METRIC RATING
234th/ 347
METRIC RANK
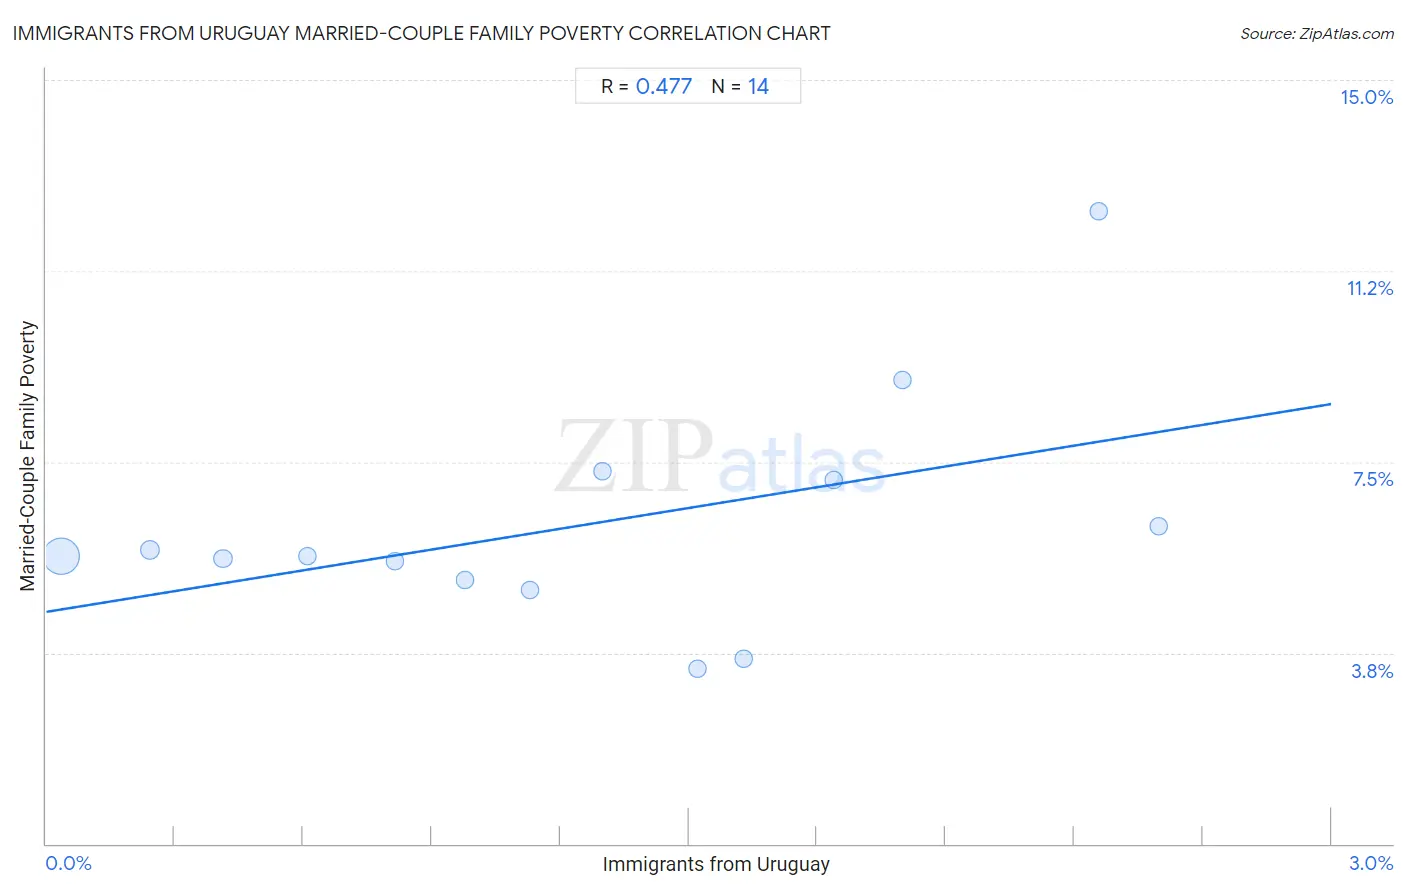
Immigrants from Uruguay Married-Couple Family Poverty Correlation Chart
The statistical analysis conducted on geographies consisting of 132,847,236 people shows a moderate positive correlation between the proportion of Immigrants from Uruguay and poverty level among married-couple families in the United States with a correlation coefficient (R) of 0.477 and weighted average of 5.7%. On average, for every 1% (one percent) increase in Immigrants from Uruguay within a typical geography, there is an increase of 1.4% in poverty level among married-couple families.
It is essential to understand that the correlation between the percentage of Immigrants from Uruguay and poverty level among married-couple families does not imply a direct cause-and-effect relationship. It remains uncertain whether the presence of Immigrants from Uruguay influences an upward or downward trend in the level of poverty level among married-couple families within an area, or if Immigrants from Uruguay simply ended up residing in those areas with higher or lower levels of poverty level among married-couple families due to other factors.
Demographics Similar to Immigrants from Uruguay by Married-Couple Family Poverty
In terms of married-couple family poverty, the demographic groups most similar to Immigrants from Uruguay are Immigrants from Colombia (5.7%, a difference of 0.010%), Immigrants from Sudan (5.7%, a difference of 0.19%), Ghanaian (5.7%, a difference of 0.35%), Immigrants from Laos (5.7%, a difference of 0.44%), and Immigrants from Iraq (5.7%, a difference of 0.50%).
| Demographics | Rating | Rank | Married-Couple Family Poverty |
| Immigrants from Zaire | 5.6 /100 | #227 | Tragic 5.6% |
| Arabs | 5.4 /100 | #228 | Tragic 5.7% |
| Sub-Saharan Africans | 4.9 /100 | #229 | Tragic 5.7% |
| Moroccans | 4.9 /100 | #230 | Tragic 5.7% |
| Immigrants from Iraq | 4.4 /100 | #231 | Tragic 5.7% |
| Immigrants from Laos | 4.4 /100 | #232 | Tragic 5.7% |
| Immigrants from Colombia | 3.7 /100 | #233 | Tragic 5.7% |
| Immigrants from Uruguay | 3.7 /100 | #234 | Tragic 5.7% |
| Immigrants from Sudan | 3.5 /100 | #235 | Tragic 5.7% |
| Ghanaians | 3.3 /100 | #236 | Tragic 5.7% |
| Immigrants from South America | 3.1 /100 | #237 | Tragic 5.7% |
| Cherokee | 2.7 /100 | #238 | Tragic 5.8% |
| Venezuelans | 2.7 /100 | #239 | Tragic 5.8% |
| Fijians | 2.5 /100 | #240 | Tragic 5.8% |
| Immigrants from Panama | 2.5 /100 | #241 | Tragic 5.8% |
Immigrants from Uruguay Married-Couple Family Poverty Correlation Summary
| Measurement | Immigrants from Uruguay Data | Married-Couple Family Poverty Data |
| Minimum | 0.035% | 3.4% |
| Maximum | 2.6% | 12.4% |
| Range | 2.6% | 9.0% |
| Mean | 1.3% | 6.3% |
| Median | 1.2% | 5.7% |
| Interquartile 25% (IQ1) | 0.61% | 5.2% |
| Interquartile 75% (IQ3) | 1.8% | 7.2% |
| Interquartile Range (IQR) | 1.2% | 2.0% |
| Standard Deviation (Sample) | 0.80% | 2.3% |
| Standard Deviation (Population) | 0.77% | 2.2% |
Correlation Details
| Immigrants from Uruguay Percentile | Sample Size | Married-Couple Family Poverty |
[ 0.0% - 0.5% ] 0.035% | 119,799,283 | 5.7% |
[ 0.0% - 0.5% ] 0.24% | 8,800,849 | 5.8% |
[ 0.0% - 0.5% ] 0.41% | 1,996,171 | 5.6% |
[ 0.5% - 1.0% ] 0.61% | 1,012,261 | 5.7% |
[ 0.5% - 1.0% ] 0.81% | 542,700 | 5.6% |
[ 0.5% - 1.0% ] 0.98% | 194,499 | 5.2% |
[ 1.0% - 1.5% ] 1.13% | 199,552 | 5.0% |
[ 1.0% - 1.5% ] 1.30% | 124,606 | 7.3% |
[ 1.5% - 2.0% ] 1.52% | 26,557 | 3.4% |
[ 1.5% - 2.0% ] 1.63% | 3,868 | 3.6% |
[ 1.5% - 2.0% ] 1.84% | 135,172 | 7.2% |
[ 1.5% - 2.0% ] 2.00% | 6,005 | 9.1% |
[ 2.0% - 2.5% ] 2.46% | 3,864 | 12.4% |
[ 2.5% - 3.0% ] 2.60% | 1,849 | 6.2% |