Immigrants from Taiwan Married-Couple Family Poverty
COMPARE
Immigrants from Taiwan
Select to Compare
Married-Couple Family Poverty
Immigrants from Taiwan Married-Couple Family Poverty
4.1%
POVERTY | MARRIED-COUPLE FAMILIES
99.9/ 100
METRIC RATING
25th/ 347
METRIC RANK
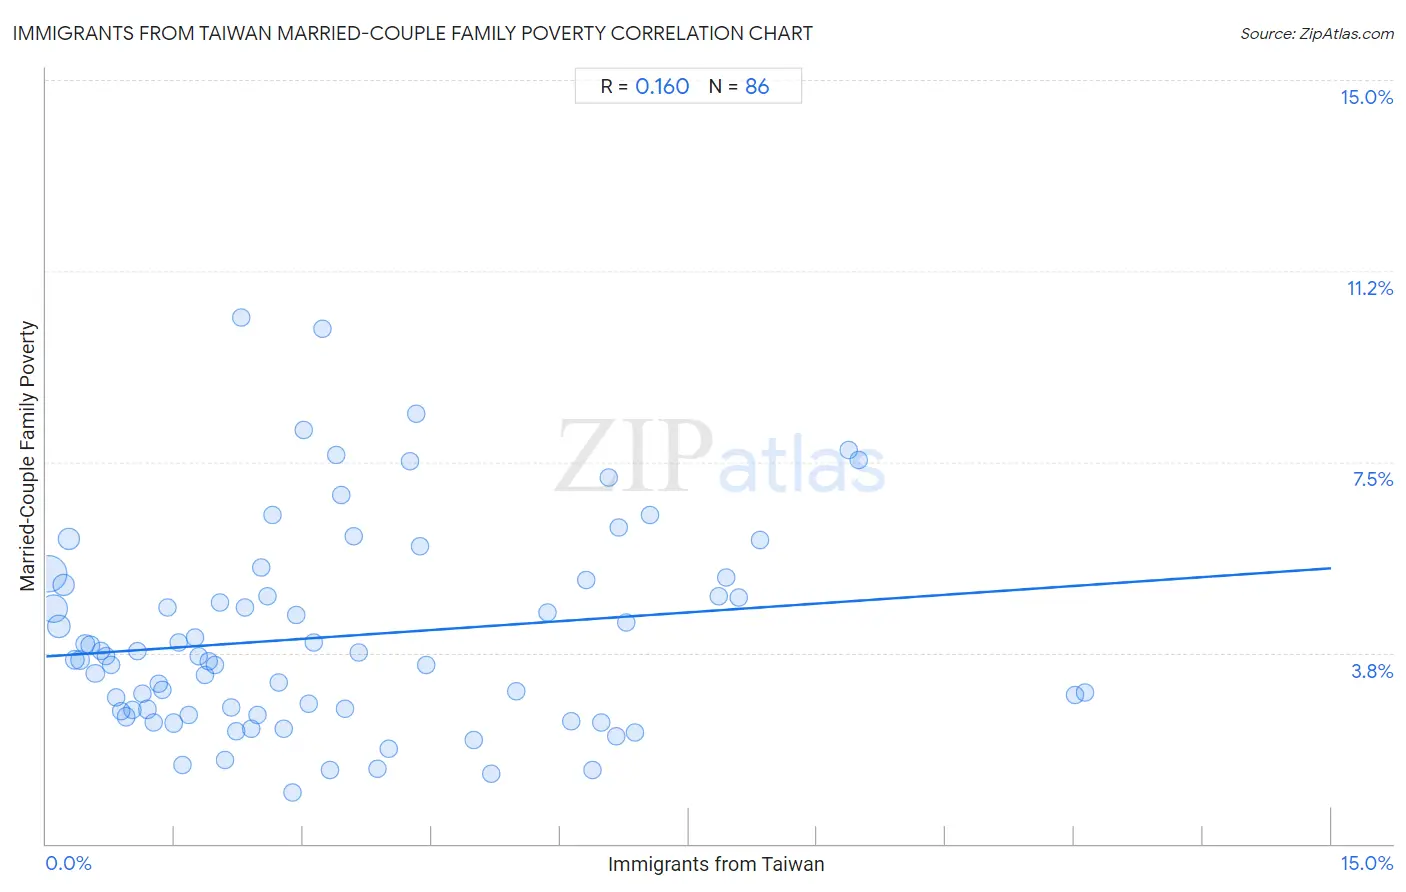
Immigrants from Taiwan Married-Couple Family Poverty Correlation Chart
The statistical analysis conducted on geographies consisting of 295,998,361 people shows a poor positive correlation between the proportion of Immigrants from Taiwan and poverty level among married-couple families in the United States with a correlation coefficient (R) of 0.160 and weighted average of 4.1%. On average, for every 1% (one percent) increase in Immigrants from Taiwan within a typical geography, there is an increase of 0.12% in poverty level among married-couple families.
It is essential to understand that the correlation between the percentage of Immigrants from Taiwan and poverty level among married-couple families does not imply a direct cause-and-effect relationship. It remains uncertain whether the presence of Immigrants from Taiwan influences an upward or downward trend in the level of poverty level among married-couple families within an area, or if Immigrants from Taiwan simply ended up residing in those areas with higher or lower levels of poverty level among married-couple families due to other factors.
Demographics Similar to Immigrants from Taiwan by Married-Couple Family Poverty
In terms of married-couple family poverty, the demographic groups most similar to Immigrants from Taiwan are Cypriot (4.1%, a difference of 0.27%), Danish (4.1%, a difference of 0.38%), Scandinavian (4.1%, a difference of 0.49%), Immigrants from Scotland (4.2%, a difference of 0.53%), and Eastern European (4.1%, a difference of 0.57%).
| Demographics | Rating | Rank | Married-Couple Family Poverty |
| Italians | 100.0 /100 | #18 | Exceptional 4.0% |
| Immigrants from Ireland | 99.9 /100 | #19 | Exceptional 4.1% |
| Maltese | 99.9 /100 | #20 | Exceptional 4.1% |
| Zimbabweans | 99.9 /100 | #21 | Exceptional 4.1% |
| Immigrants from Singapore | 99.9 /100 | #22 | Exceptional 4.1% |
| Bhutanese | 99.9 /100 | #23 | Exceptional 4.1% |
| Eastern Europeans | 99.9 /100 | #24 | Exceptional 4.1% |
| Immigrants from Taiwan | 99.9 /100 | #25 | Exceptional 4.1% |
| Cypriots | 99.9 /100 | #26 | Exceptional 4.1% |
| Danes | 99.9 /100 | #27 | Exceptional 4.1% |
| Scandinavians | 99.9 /100 | #28 | Exceptional 4.1% |
| Immigrants from Scotland | 99.9 /100 | #29 | Exceptional 4.2% |
| Finns | 99.9 /100 | #30 | Exceptional 4.2% |
| Estonians | 99.9 /100 | #31 | Exceptional 4.2% |
| Greeks | 99.9 /100 | #32 | Exceptional 4.2% |
Immigrants from Taiwan Married-Couple Family Poverty Correlation Summary
| Measurement | Immigrants from Taiwan Data | Married-Couple Family Poverty Data |
| Minimum | 0.032% | 1.0% |
| Maximum | 12.1% | 10.3% |
| Range | 12.1% | 9.3% |
| Mean | 3.4% | 4.1% |
| Median | 2.6% | 3.6% |
| Interquartile 25% (IQ1) | 1.3% | 2.6% |
| Interquartile 75% (IQ3) | 5.0% | 5.1% |
| Interquartile Range (IQR) | 3.7% | 2.5% |
| Standard Deviation (Sample) | 2.8% | 2.0% |
| Standard Deviation (Population) | 2.7% | 2.0% |
Correlation Details
| Immigrants from Taiwan Percentile | Sample Size | Married-Couple Family Poverty |
[ 0.0% - 0.5% ] 0.032% | 111,110,269 | 5.3% |
[ 0.0% - 0.5% ] 0.084% | 60,624,157 | 4.6% |
[ 0.0% - 0.5% ] 0.15% | 28,148,135 | 4.3% |
[ 0.0% - 0.5% ] 0.21% | 23,433,146 | 5.1% |
[ 0.0% - 0.5% ] 0.26% | 20,663,086 | 6.0% |
[ 0.0% - 0.5% ] 0.33% | 9,630,383 | 3.6% |
[ 0.0% - 0.5% ] 0.39% | 6,406,247 | 3.6% |
[ 0.0% - 0.5% ] 0.46% | 4,396,034 | 3.9% |
[ 0.5% - 1.0% ] 0.51% | 3,740,130 | 3.9% |
[ 0.5% - 1.0% ] 0.58% | 3,917,404 | 3.3% |
[ 0.5% - 1.0% ] 0.64% | 3,460,009 | 3.8% |
[ 0.5% - 1.0% ] 0.70% | 2,437,053 | 3.7% |
[ 0.5% - 1.0% ] 0.76% | 1,602,661 | 3.5% |
[ 0.5% - 1.0% ] 0.82% | 1,343,233 | 2.9% |
[ 0.5% - 1.0% ] 0.88% | 1,167,355 | 2.6% |
[ 0.5% - 1.0% ] 0.94% | 1,093,533 | 2.5% |
[ 0.5% - 1.0% ] 1.00% | 900,627 | 2.6% |
[ 1.0% - 1.5% ] 1.06% | 1,015,052 | 3.8% |
[ 1.0% - 1.5% ] 1.12% | 760,073 | 2.9% |
[ 1.0% - 1.5% ] 1.18% | 758,472 | 2.6% |
[ 1.0% - 1.5% ] 1.25% | 578,361 | 2.4% |
[ 1.0% - 1.5% ] 1.31% | 153,008 | 3.1% |
[ 1.0% - 1.5% ] 1.35% | 1,678,558 | 3.0% |
[ 1.0% - 1.5% ] 1.42% | 230,993 | 4.6% |
[ 1.0% - 1.5% ] 1.48% | 494,348 | 2.4% |
[ 1.5% - 2.0% ] 1.54% | 657,491 | 4.0% |
[ 1.5% - 2.0% ] 1.59% | 106,109 | 1.5% |
[ 1.5% - 2.0% ] 1.67% | 255,758 | 2.5% |
[ 1.5% - 2.0% ] 1.74% | 96,533 | 4.0% |
[ 1.5% - 2.0% ] 1.78% | 56,135 | 3.7% |
[ 1.5% - 2.0% ] 1.86% | 407,550 | 3.3% |
[ 1.5% - 2.0% ] 1.90% | 265,354 | 3.6% |
[ 1.5% - 2.0% ] 1.97% | 611,870 | 3.5% |
[ 2.0% - 2.5% ] 2.02% | 99,729 | 4.7% |
[ 2.0% - 2.5% ] 2.09% | 195,581 | 1.6% |
[ 2.0% - 2.5% ] 2.15% | 141,361 | 2.7% |
[ 2.0% - 2.5% ] 2.22% | 68,062 | 2.2% |
[ 2.0% - 2.5% ] 2.28% | 96,497 | 10.3% |
[ 2.0% - 2.5% ] 2.32% | 424,738 | 4.6% |
[ 2.0% - 2.5% ] 2.39% | 45,572 | 2.3% |
[ 2.0% - 2.5% ] 2.47% | 283,978 | 2.5% |
[ 2.5% - 3.0% ] 2.51% | 100,939 | 5.4% |
[ 2.5% - 3.0% ] 2.58% | 198,983 | 4.9% |
[ 2.5% - 3.0% ] 2.64% | 112,854 | 6.5% |
[ 2.5% - 3.0% ] 2.71% | 77,540 | 3.2% |
[ 2.5% - 3.0% ] 2.78% | 11,994 | 2.3% |
[ 2.5% - 3.0% ] 2.88% | 38,003 | 1.0% |
[ 2.5% - 3.0% ] 2.91% | 212,221 | 4.5% |
[ 3.0% - 3.5% ] 3.00% | 49,927 | 8.1% |
[ 3.0% - 3.5% ] 3.06% | 273,341 | 2.8% |
[ 3.0% - 3.5% ] 3.13% | 46,906 | 4.0% |
[ 3.0% - 3.5% ] 3.23% | 310 | 10.1% |
[ 3.0% - 3.5% ] 3.31% | 17,826 | 1.4% |
[ 3.0% - 3.5% ] 3.39% | 52,587 | 7.6% |
[ 3.0% - 3.5% ] 3.45% | 1,277 | 6.8% |
[ 3.0% - 3.5% ] 3.49% | 24,692 | 2.7% |
[ 3.5% - 4.0% ] 3.59% | 61,940 | 6.0% |
[ 3.5% - 4.0% ] 3.64% | 40,981 | 3.8% |
[ 3.5% - 4.0% ] 3.86% | 20,052 | 1.5% |
[ 3.5% - 4.0% ] 4.00% | 1,876 | 1.9% |
[ 4.0% - 4.5% ] 4.25% | 34,904 | 7.5% |
[ 4.0% - 4.5% ] 4.31% | 1,577 | 8.4% |
[ 4.0% - 4.5% ] 4.37% | 5,474 | 5.9% |
[ 4.0% - 4.5% ] 4.44% | 31,335 | 3.5% |
[ 4.5% - 5.0% ] 4.99% | 98,350 | 2.0% |
[ 5.0% - 5.5% ] 5.19% | 8,441 | 1.4% |
[ 5.0% - 5.5% ] 5.48% | 62,451 | 3.0% |
[ 5.5% - 6.0% ] 5.85% | 35,556 | 4.5% |
[ 6.0% - 6.5% ] 6.13% | 767 | 2.4% |
[ 6.0% - 6.5% ] 6.31% | 36,909 | 5.2% |
[ 6.0% - 6.5% ] 6.38% | 31,688 | 1.4% |
[ 6.0% - 6.5% ] 6.47% | 61,414 | 2.4% |
[ 6.5% - 7.0% ] 6.57% | 4,463 | 7.2% |
[ 6.5% - 7.0% ] 6.65% | 90,534 | 2.1% |
[ 6.5% - 7.0% ] 6.69% | 110,950 | 6.2% |
[ 6.5% - 7.0% ] 6.76% | 33,367 | 4.3% |
[ 6.5% - 7.0% ] 6.88% | 53,464 | 2.2% |
[ 7.0% - 7.5% ] 7.04% | 24,169 | 6.5% |
[ 7.5% - 8.0% ] 7.85% | 73,363 | 4.9% |
[ 7.5% - 8.0% ] 7.94% | 54,534 | 5.2% |
[ 8.0% - 8.5% ] 8.09% | 84,393 | 4.8% |
[ 8.0% - 8.5% ] 8.33% | 45,303 | 6.0% |
[ 9.0% - 9.5% ] 9.37% | 43,851 | 7.7% |
[ 9.0% - 9.5% ] 9.48% | 47,209 | 7.5% |
[ 12.0% - 12.5% ] 12.01% | 12,559 | 2.9% |
[ 12.0% - 12.5% ] 12.12% | 12,442 | 3.0% |