Immigrants from Spain Married-Couple Family Poverty

COMPARE

Immigrants from Spain
Race
Ancestry
AfghanAfricanAlaska NativeAlaskan AthabascanAlbanianAleutAlsatianAmericanApacheArabArapahoArgentineanArmenianAssyrian/Chaldean/SyriacAustralianAustrianBahamianBangladeshiBarbadianBasqueBelgianBelizeanBermudanBhutaneseBlackfeetBolivianBrazilianBritishBritish West IndianBulgarianBurmeseCajunCambodianCanadianCape VerdeanCarpatho RusynCelticCentral AmericanCentral American IndianCherokeeCheyenneChickasawChileanChineseChippewaChoctawColombianColvilleComancheCosta RicanCreeCreekCroatianCrowCubanCypriotCzechCzechoslovakianDanishDelawareDominicanDutchDutch West IndianEastern EuropeanEcuadorianEgyptianEnglishEstonianEthiopianEuropeanFijianFilipinoFinnishFrenchFrench American IndianFrench CanadianGermanGerman RussianGhanaianGreekGuamanian/ChamorroGuatemalanGuyaneseHaitianHmongHonduranHopiHoumaHungarianIcelanderIndian (Asian)IndonesianInupiatIranianIraqiIrishIroquoisIsraeliItalianJamaicanJapaneseJordanianKenyanKiowaKoreanLaotianLatvianLebaneseLiberianLithuanianLumbeeLuxembourgerMacedonianMalaysianMalteseMarshalleseMenomineeMexicanMexican American IndianMongolianMoroccanNative HawaiianNavajoNepaleseNew ZealanderNicaraguanNigerianNorthern EuropeanNorwegianOkinawanOsageOttawaPaiutePakistaniPalestinianPanamanianParaguayanPennsylvania GermanPeruvianPimaPolishPortuguesePotawatomiPuebloPuerto RicanPuget Sound SalishRomanianRussianSalvadoranSamoanScandinavianScotch-IrishScottishSeminoleSenegaleseSerbianShoshoneSierra LeoneanSiouxSlavicSlovakSloveneSomaliSouth AfricanSouth AmericanSouth American IndianSoviet UnionSpaniardSpanishSpanish AmericanSpanish American IndianSri LankanSubsaharan AfricanSudaneseSwedishSwissSyrianTaiwaneseThaiTlingit-HaidaTohono O'OdhamTonganTrinidadian and TobagonianTsimshianTurkishU.S. Virgin IslanderUgandanUkrainianUruguayanUteVenezuelanVietnameseWelshWest IndianYakamaYaquiYugoslavianYumanYup'ikZimbabwean
Immigration
NonimmigrantsImmigrantsAfghanistanAfricaAlbaniaArgentinaArmeniaAsiaAustraliaAustriaBahamasBangladeshBarbadosBelarusBelgiumBelizeBoliviaBosnia and HerzegovinaBrazilBulgariaBurma/MyanmarCabo VerdeCambodiaCameroonCanadaCaribbeanCentral AmericaChileChinaColombiaCongoCosta RicaCroatiaCubaCzechoslovakiaDenmarkDominicaDominican RepublicEastern AfricaEastern AsiaEastern EuropeEcuadorEgyptEl SalvadorEnglandEritreaEthiopiaEuropeFijiFranceGermanyGhanaGreeceGrenadaGuatemalaGuyanaHaitiHondurasHong KongHungaryIndiaIndonesiaIranIraqIrelandIsraelItalyJamaicaJapanJordanKazakhstanKenyaKoreaKuwaitLaosLatin AmericaLatviaLebanonLiberiaLithuaniaMalaysiaMexicoMicronesiaMiddle AfricaMoldovaMoroccoNepalNetherlandsNicaraguaNigeriaNorth AmericaNorth MacedoniaNorthern AfricaNorthern EuropeNorwayOceaniaPakistanPanamaPeruPhilippinesPolandPortugalRomaniaRussiaSaudi ArabiaScotlandSenegalSerbiaSierra LeoneSingaporeSomaliaSouth AfricaSouth AmericaSouth Central AsiaSouth Eastern AsiaSouthern EuropeSpainSri LankaSt. Vincent and the GrenadinesSudanSwedenSwitzerlandSyriaTaiwanThailandTrinidad and TobagoTurkeyUgandaUkraineUruguayUzbekistanVenezuelaVietnamWest IndiesWestern AfricaWestern AsiaWestern EuropeYemenZaireZimbabweAzores
Select to Compare
Race
Ancestry
AfghanAfricanAlaska NativeAlaskan AthabascanAlbanianAleutAlsatianAmericanApacheArabArapahoArgentineanArmenianAssyrian/Chaldean/SyriacAustralianAustrianBahamianBangladeshiBarbadianBasqueBelgianBelizeanBermudanBhutaneseBlackfeetBolivianBrazilianBritishBritish West IndianBulgarianBurmeseCajunCambodianCanadianCape VerdeanCarpatho RusynCelticCentral AmericanCentral American IndianCherokeeCheyenneChickasawChileanChineseChippewaChoctawColombianColvilleComancheCosta RicanCreeCreekCroatianCrowCubanCypriotCzechCzechoslovakianDanishDelawareDominicanDutchDutch West IndianEastern EuropeanEcuadorianEgyptianEnglishEstonianEthiopianEuropeanFijianFilipinoFinnishFrenchFrench American IndianFrench CanadianGermanGerman RussianGhanaianGreekGuamanian/ChamorroGuatemalanGuyaneseHaitianHmongHonduranHopiHoumaHungarianIcelanderIndian (Asian)IndonesianInupiatIranianIraqiIrishIroquoisIsraeliItalianJamaicanJapaneseJordanianKenyanKiowaKoreanLaotianLatvianLebaneseLiberianLithuanianLumbeeLuxembourgerMacedonianMalaysianMalteseMarshalleseMenomineeMexicanMexican American IndianMongolianMoroccanNative HawaiianNavajoNepaleseNew ZealanderNicaraguanNigerianNorthern EuropeanNorwegianOkinawanOsageOttawaPaiutePakistaniPalestinianPanamanianParaguayanPennsylvania GermanPeruvianPimaPolishPortuguesePotawatomiPuebloPuerto RicanPuget Sound SalishRomanianRussianSalvadoranSamoanScandinavianScotch-IrishScottishSeminoleSenegaleseSerbianShoshoneSierra LeoneanSiouxSlavicSlovakSloveneSomaliSouth AfricanSouth AmericanSouth American IndianSoviet UnionSpaniardSpanishSpanish AmericanSpanish American IndianSri LankanSubsaharan AfricanSudaneseSwedishSwissSyrianTaiwaneseThaiTlingit-HaidaTohono O'OdhamTonganTrinidadian and TobagonianTsimshianTurkishU.S. Virgin IslanderUgandanUkrainianUruguayanUteVenezuelanVietnameseWelshWest IndianYakamaYaquiYugoslavianYumanYup'ikZimbabwean
Immigration
NonimmigrantsImmigrantsAfghanistanAfricaAlbaniaArgentinaArmeniaAsiaAustraliaAustriaBahamasBangladeshBarbadosBelarusBelgiumBelizeBoliviaBosnia and HerzegovinaBrazilBulgariaBurma/MyanmarCabo VerdeCambodiaCameroonCanadaCaribbeanCentral AmericaChileChinaColombiaCongoCosta RicaCroatiaCubaCzechoslovakiaDenmarkDominicaDominican RepublicEastern AfricaEastern AsiaEastern EuropeEcuadorEgyptEl SalvadorEnglandEritreaEthiopiaEuropeFijiFranceGermanyGhanaGreeceGrenadaGuatemalaGuyanaHaitiHondurasHong KongHungaryIndiaIndonesiaIranIraqIrelandIsraelItalyJamaicaJapanJordanKazakhstanKenyaKoreaKuwaitLaosLatin AmericaLatviaLebanonLiberiaLithuaniaMalaysiaMexicoMicronesiaMiddle AfricaMoldovaMoroccoNepalNetherlandsNicaraguaNigeriaNorth AmericaNorth MacedoniaNorthern AfricaNorthern EuropeNorwayOceaniaPakistanPanamaPeruPhilippinesPolandPortugalRomaniaRussiaSaudi ArabiaScotlandSenegalSerbiaSierra LeoneSingaporeSomaliaSouth AfricaSouth AmericaSouth Central AsiaSouth Eastern AsiaSouthern EuropeSri LankaSt. Vincent and the GrenadinesSudanSwedenSwitzerlandSyriaTaiwanThailandTrinidad and TobagoTurkeyUgandaUkraineUruguayUzbekistanVenezuelaVietnamWest IndiesWestern AfricaWestern AsiaWestern EuropeYemenZaireZimbabweAzores
Married-Couple Family Poverty
Income
Poverty
Unemployment
Labor Participation
Family Structure
Vehicle Availability
Education Level
Disability

Immigrants from Spain Married-Couple Family Poverty
Good

5.0%
POVERTY | MARRIED-COUPLE FAMILIES
79.9/ 100
METRIC RATING
145th/ 347
METRIC RANK

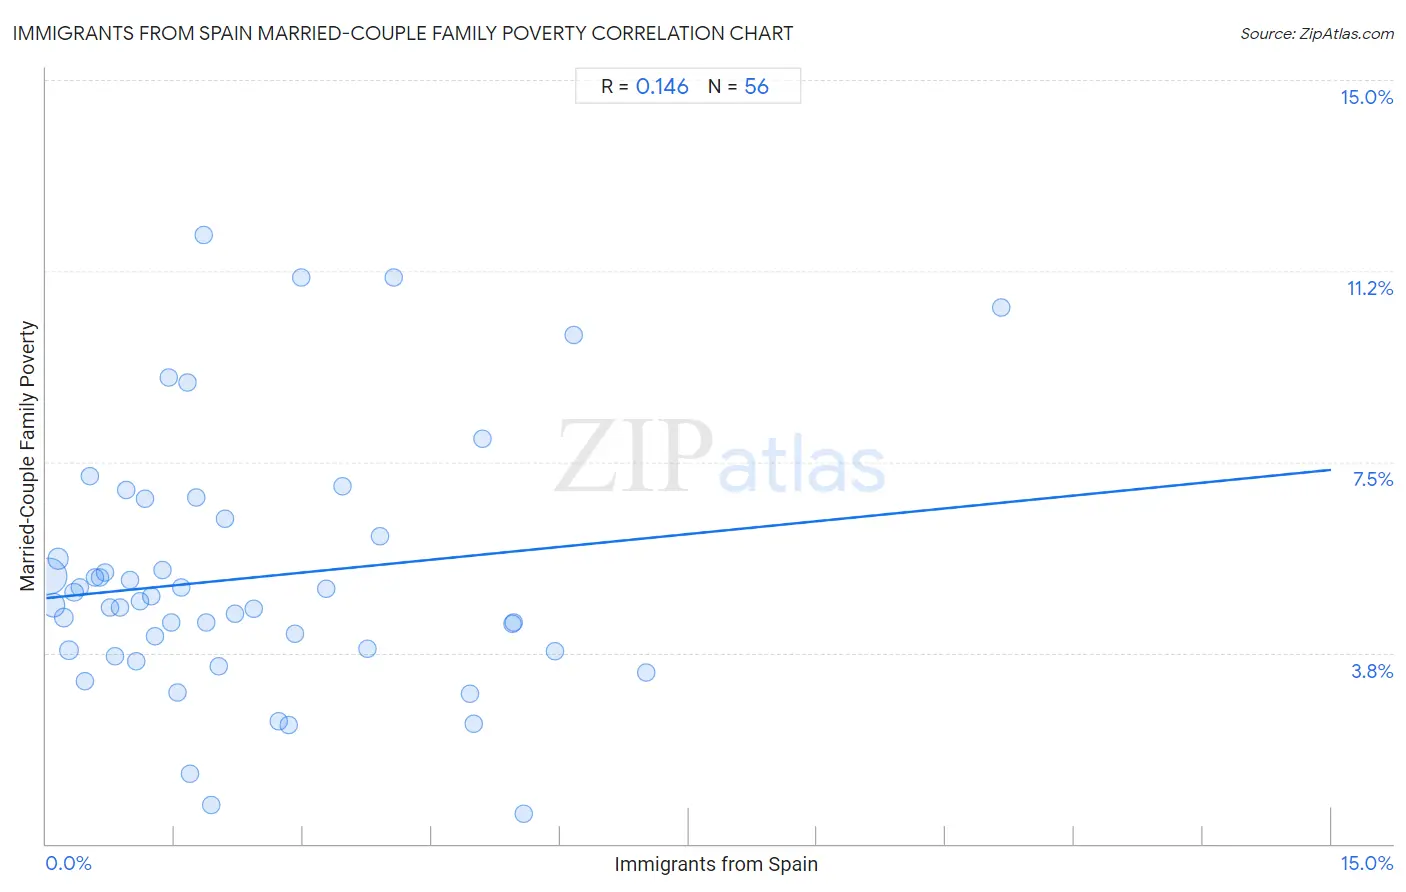
Immigrants from Spain Married-Couple Family Poverty Correlation Chart

The statistical analysis conducted on geographies consisting of 238,548,596 people shows a poor positive correlation between the proportion of Immigrants from Spain and poverty level among married-couple families in the United States with a correlation coefficient (R) of 0.146 and weighted average of 5.0%. On average, for every 1% (one percent) increase in Immigrants from Spain within a typical geography, there is an increase of 0.17% in poverty level among married-couple families.
Immigrants from Spain Married-Couple Family Poverty
It is essential to understand that the correlation between the percentage of Immigrants from Spain and poverty level among married-couple families does not imply a direct cause-and-effect relationship. It remains uncertain whether the presence of Immigrants from Spain influences an upward or downward trend in the level of poverty level among married-couple families within an area, or if Immigrants from Spain simply ended up residing in those areas with higher or lower levels of poverty level among married-couple families due to other factors.

Demographics Similar to Immigrants from Spain by Married-Couple Family Poverty

In terms of married-couple family poverty, the demographic groups most similar to Immigrants from Spain are Mongolian (5.0%, a difference of 0.020%), Syrian (5.0%, a difference of 0.21%), Immigrants from Russia (5.0%, a difference of 0.21%), Immigrants from Oceania (5.0%, a difference of 0.24%), and Brazilian (5.0%, a difference of 0.29%).
DemographicsRating | RankMarried-Couple Family Poverty
Chileans
86.0
/100
|
#138
Excellent
4.9%
German Russians
85.1
/100
|
#139
Excellent
5.0%
Immigrants from Portugal
84.8
/100
|
#140
Excellent
5.0%
Immigrants from Brazil
84.6
/100
|
#141
Excellent
5.0%
Immigrants from China
84.6
/100
|
#142
Excellent
5.0%
Immigrants from Egypt
83.4
/100
|
#143
Excellent
5.0%
Hmong
83.2
/100
|
#144
Excellent
5.0%
Immigrants from Spain
79.9
/100
|
#145
Good
5.0%
Mongolians
79.8
/100
|
#146
Good
5.0%
Syrians
78.7
/100
|
#147
Good
5.0%
Immigrants from Russia
78.7
/100
|
#148
Good
5.0%
Immigrants from Oceania
78.6
/100
|
#149
Good
5.0%
Brazilians
78.3
/100
|
#150
Good
5.0%
Immigrants from Cameroon
77.3
/100
|
#151
Good
5.0%
Albanians
77.2
/100
|
#152
Good
5.0%

Immigrants from Spain Married-Couple Family Poverty Correlation Summary

MeasurementImmigrants from Spain DataMarried-Couple Family Poverty Data
Minimum0.029%0.58%
Maximum11.1%12.0%
Range11.1%11.4%
Mean2.4%5.2%
Median1.7%4.7%
Interquartile 25% (IQ1)0.83%3.8%
Interquartile 75% (IQ3)3.4%6.2%
Interquartile Range (IQR)2.5%2.4%
Standard Deviation (Sample)2.2%2.5%
Standard Deviation (Population)2.2%2.5%

Correlation Details

Immigrants from Spain PercentileSample SizeMarried-Couple Family Poverty
[
0.0%
-
0.5%
]
0.029%
140,312,3215.3%
[
0.0%
-
0.5%
]
0.085%
43,744,4794.7%
[
0.0%
-
0.5%
]
0.14%
27,535,2055.6%
[
0.0%
-
0.5%
]
0.21%
8,531,8264.4%
[
0.0%
-
0.5%
]
0.26%
5,855,4793.8%
[
0.0%
-
0.5%
]
0.33%
3,545,3894.9%
[
0.0%
-
0.5%
]
0.39%
1,950,2375.0%
[
0.0%
-
0.5%
]
0.45%
1,351,2273.2%
[
0.5%
-
1.0%
]
0.51%
1,858,6107.2%
[
0.5%
-
1.0%
]
0.57%
840,7905.2%
[
0.5%
-
1.0%
]
0.63%
674,4315.2%
[
0.5%
-
1.0%
]
0.69%
317,4295.3%
[
0.5%
-
1.0%
]
0.74%
173,5344.6%
[
0.5%
-
1.0%
]
0.81%
286,9713.7%
[
0.5%
-
1.0%
]
0.86%
203,5904.6%
[
0.5%
-
1.0%
]
0.93%
157,2746.9%
[
0.5%
-
1.0%
]
0.98%
140,9895.2%
[
1.0%
-
1.5%
]
1.05%
169,7213.6%
[
1.0%
-
1.5%
]
1.10%
174,1164.8%
[
1.0%
-
1.5%
]
1.16%
80,4846.8%
[
1.0%
-
1.5%
]
1.23%
67,1714.9%
[
1.0%
-
1.5%
]
1.27%
39,3924.1%
[
1.0%
-
1.5%
]
1.36%
82,8485.4%
[
1.0%
-
1.5%
]
1.44%
6279.2%
[
1.0%
-
1.5%
]
1.46%
95,9494.4%
[
1.5%
-
2.0%
]
1.53%
22,8243.0%
[
1.5%
-
2.0%
]
1.58%
5,1295.0%
[
1.5%
-
2.0%
]
1.65%
1,3969.0%
[
1.5%
-
2.0%
]
1.68%
1,4901.4%
[
1.5%
-
2.0%
]
1.75%
5,2606.8%
[
1.5%
-
2.0%
]
1.84%
60,11612.0%
[
1.5%
-
2.0%
]
1.87%
8,7024.3%
[
1.5%
-
2.0%
]
1.92%
4680.75%
[
2.0%
-
2.5%
]
2.01%
53,9763.5%
[
2.0%
-
2.5%
]
2.08%
2886.4%
[
2.0%
-
2.5%
]
2.20%
88,5684.5%
[
2.0%
-
2.5%
]
2.42%
2,0694.6%
[
2.5%
-
3.0%
]
2.72%
7,7952.4%
[
2.5%
-
3.0%
]
2.83%
14,4412.3%
[
2.5%
-
3.0%
]
2.90%
18,8564.1%
[
2.5%
-
3.0%
]
2.97%
1,95211.1%
[
3.0%
-
3.5%
]
3.27%
3,6985.0%
[
3.0%
-
3.5%
]
3.45%
1,0147.0%
[
3.5%
-
4.0%
]
3.75%
22,5403.8%
[
3.5%
-
4.0%
]
3.89%
5656.0%
[
4.0%
-
4.5%
]
4.06%
56611.1%
[
4.5%
-
5.0%
]
4.95%
1,3333.0%
[
4.5%
-
5.0%
]
4.99%
1,1232.4%
[
5.0%
-
5.5%
]
5.10%
8248.0%
[
5.0%
-
5.5%
]
5.44%
14,6394.3%
[
5.0%
-
5.5%
]
5.46%
14,5724.3%
[
5.5%
-
6.0%
]
5.57%
2,3680.58%
[
5.5%
-
6.0%
]
5.94%
7073.8%
[
6.0%
-
6.5%
]
6.16%
14610.0%
[
7.0%
-
7.5%
]
7.00%
7143.4%
[
11.0%
-
11.5%
]
11.14%
36810.5%