Immigrants from Singapore 1 or more Vehicles in Household
COMPARE
Immigrants from Singapore
Select to Compare
1 or more Vehicles in Household
Immigrants from Singapore 1 or more Vehicles in Household
87.2%
1+ VEHICLES AVAILABLE
0.1/ 100
METRIC RATING
275th/ 347
METRIC RANK
Immigrants from Singapore 1 or more Vehicles in Household Correlation Chart
The statistical analysis conducted on geographies consisting of 137,467,600 people shows a poor positive correlation between the proportion of Immigrants from Singapore and percentage of households with 1 or more vehicles available in the United States with a correlation coefficient (R) of 0.191 and weighted average of 87.2%. On average, for every 1% (one percent) increase in Immigrants from Singapore within a typical geography, there is an increase of 2.0% in percentage of households with 1 or more vehicles available.
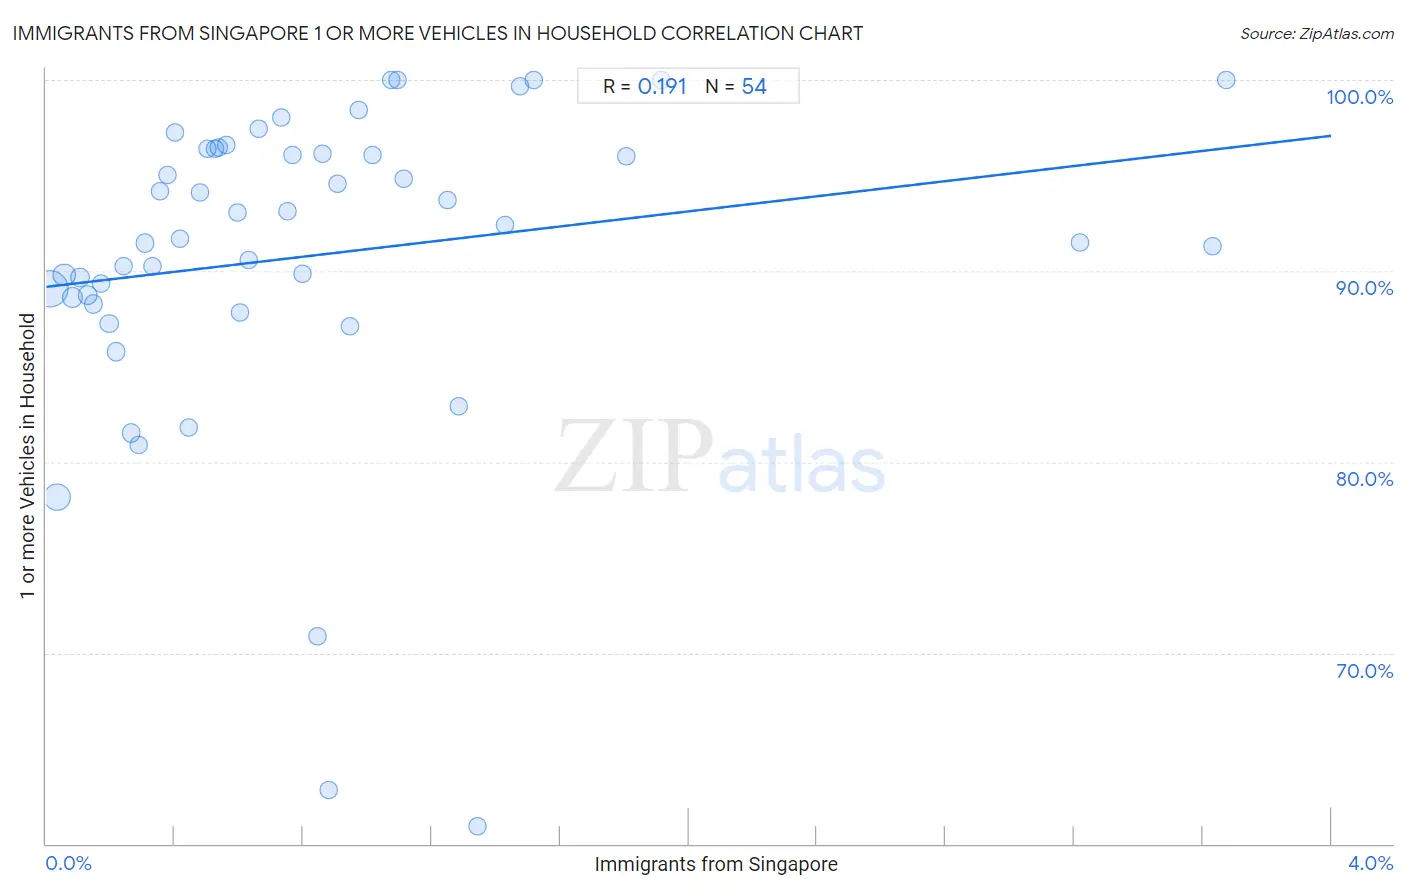
It is essential to understand that the correlation between the percentage of Immigrants from Singapore and percentage of households with 1 or more vehicles available does not imply a direct cause-and-effect relationship. It remains uncertain whether the presence of Immigrants from Singapore influences an upward or downward trend in the level of percentage of households with 1 or more vehicles available within an area, or if Immigrants from Singapore simply ended up residing in those areas with higher or lower levels of percentage of households with 1 or more vehicles available due to other factors.
Demographics Similar to Immigrants from Singapore by 1 or more Vehicles in Household
In terms of 1 or more vehicles in household, the demographic groups most similar to Immigrants from Singapore are Immigrants from France (87.1%, a difference of 0.070%), Alsatian (87.1%, a difference of 0.13%), Immigrants from Southern Europe (87.1%, a difference of 0.17%), Immigrants from Albania (87.1%, a difference of 0.17%), and Immigrants from Croatia (87.0%, a difference of 0.20%).
| Demographics | Rating | Rank | 1 or more Vehicles in Household |
| Immigrants from Europe | 0.2 /100 | #268 | Tragic 87.6% |
| Immigrants from Africa | 0.2 /100 | #269 | Tragic 87.6% |
| Panamanians | 0.2 /100 | #270 | Tragic 87.5% |
| Bermudans | 0.2 /100 | #271 | Tragic 87.5% |
| Aleuts | 0.2 /100 | #272 | Tragic 87.5% |
| Immigrants from Northern Africa | 0.2 /100 | #273 | Tragic 87.4% |
| Immigrants from Morocco | 0.1 /100 | #274 | Tragic 87.4% |
| Immigrants from Singapore | 0.1 /100 | #275 | Tragic 87.2% |
| Immigrants from France | 0.1 /100 | #276 | Tragic 87.1% |
| Alsatians | 0.1 /100 | #277 | Tragic 87.1% |
| Immigrants from Southern Europe | 0.1 /100 | #278 | Tragic 87.1% |
| Immigrants from Albania | 0.1 /100 | #279 | Tragic 87.1% |
| Immigrants from Croatia | 0.0 /100 | #280 | Tragic 87.0% |
| Mongolians | 0.0 /100 | #281 | Tragic 87.0% |
| Colville | 0.0 /100 | #282 | Tragic 86.8% |
Immigrants from Singapore 1 or more Vehicles in Household Correlation Summary
| Measurement | Immigrants from Singapore Data | 1 or more Vehicles in Household Data |
| Minimum | 0.011% | 60.9% |
| Maximum | 3.7% | 100.0% |
| Range | 3.7% | 39.1% |
| Mean | 0.83% | 90.8% |
| Median | 0.62% | 92.0% |
| Interquartile 25% (IQ1) | 0.31% | 88.6% |
| Interquartile 75% (IQ3) | 1.1% | 96.4% |
| Interquartile Range (IQR) | 0.76% | 7.8% |
| Standard Deviation (Sample) | 0.80% | 8.3% |
| Standard Deviation (Population) | 0.80% | 8.3% |
Correlation Details
| Immigrants from Singapore Percentile | Sample Size | 1 or more Vehicles in Household |
[ 0.0% - 0.5% ] 0.011% | 65,010,269 | 89.1% |
[ 0.0% - 0.5% ] 0.033% | 32,526,451 | 78.1% |
[ 0.0% - 0.5% ] 0.056% | 13,827,368 | 89.8% |
[ 0.0% - 0.5% ] 0.080% | 8,978,294 | 88.6% |
[ 0.0% - 0.5% ] 0.10% | 4,213,494 | 89.7% |
[ 0.0% - 0.5% ] 0.13% | 3,197,689 | 88.7% |
[ 0.0% - 0.5% ] 0.15% | 2,378,019 | 88.3% |
[ 0.0% - 0.5% ] 0.17% | 1,264,126 | 89.3% |
[ 0.0% - 0.5% ] 0.20% | 1,191,584 | 87.2% |
[ 0.0% - 0.5% ] 0.22% | 1,178,213 | 85.8% |
[ 0.0% - 0.5% ] 0.24% | 839,095 | 90.3% |
[ 0.0% - 0.5% ] 0.26% | 644,658 | 81.5% |
[ 0.0% - 0.5% ] 0.29% | 449,062 | 80.9% |
[ 0.0% - 0.5% ] 0.31% | 258,045 | 91.5% |
[ 0.0% - 0.5% ] 0.33% | 214,453 | 90.2% |
[ 0.0% - 0.5% ] 0.35% | 51,876 | 94.2% |
[ 0.0% - 0.5% ] 0.38% | 192,754 | 95.0% |
[ 0.0% - 0.5% ] 0.40% | 87,319 | 97.2% |
[ 0.0% - 0.5% ] 0.42% | 85,662 | 91.7% |
[ 0.0% - 0.5% ] 0.44% | 154,009 | 81.8% |
[ 0.0% - 0.5% ] 0.48% | 71,878 | 94.1% |
[ 0.5% - 1.0% ] 0.50% | 74,105 | 96.4% |
[ 0.5% - 1.0% ] 0.53% | 86,272 | 96.4% |
[ 0.5% - 1.0% ] 0.54% | 18,866 | 96.5% |
[ 0.5% - 1.0% ] 0.56% | 56,293 | 96.6% |
[ 0.5% - 1.0% ] 0.60% | 59,632 | 93.1% |
[ 0.5% - 1.0% ] 0.60% | 31,978 | 87.8% |
[ 0.5% - 1.0% ] 0.63% | 44,965 | 90.6% |
[ 0.5% - 1.0% ] 0.66% | 10,285 | 97.5% |
[ 0.5% - 1.0% ] 0.73% | 6,972 | 98.0% |
[ 0.5% - 1.0% ] 0.75% | 2,136 | 93.1% |
[ 0.5% - 1.0% ] 0.77% | 69,385 | 96.1% |
[ 0.5% - 1.0% ] 0.80% | 16,903 | 89.9% |
[ 0.5% - 1.0% ] 0.84% | 3,676 | 70.9% |
[ 0.5% - 1.0% ] 0.86% | 27,042 | 96.1% |
[ 0.5% - 1.0% ] 0.88% | 12,039 | 62.8% |
[ 0.5% - 1.0% ] 0.90% | 22,106 | 94.6% |
[ 0.5% - 1.0% ] 0.95% | 31,185 | 87.1% |
[ 0.5% - 1.0% ] 0.97% | 2,464 | 98.4% |
[ 1.0% - 1.5% ] 1.02% | 10,517 | 96.1% |
[ 1.0% - 1.5% ] 1.07% | 10,534 | 100.0% |
[ 1.0% - 1.5% ] 1.09% | 11,989 | 100.0% |
[ 1.0% - 1.5% ] 1.11% | 180 | 94.8% |
[ 1.0% - 1.5% ] 1.25% | 17,624 | 93.7% |
[ 1.0% - 1.5% ] 1.28% | 3,426 | 82.9% |
[ 1.0% - 1.5% ] 1.34% | 4,474 | 60.9% |
[ 1.0% - 1.5% ] 1.43% | 3,571 | 92.4% |
[ 1.0% - 1.5% ] 1.48% | 6,368 | 99.6% |
[ 1.5% - 2.0% ] 1.52% | 395 | 100.0% |
[ 1.5% - 2.0% ] 1.80% | 1,219 | 96.0% |
[ 1.5% - 2.0% ] 1.91% | 2,089 | 100.0% |
[ 3.0% - 3.5% ] 3.22% | 3,169 | 91.5% |
[ 3.5% - 4.0% ] 3.63% | 606 | 91.3% |
[ 3.5% - 4.0% ] 3.67% | 817 | 100.0% |