Immigrants from Philippines 1 or more Vehicles in Household
COMPARE
Immigrants from Philippines
Select to Compare
1 or more Vehicles in Household
Immigrants from Philippines 1 or more Vehicles in Household
91.5%
1+ VEHICLES AVAILABLE
99.4/ 100
METRIC RATING
77th/ 347
METRIC RANK
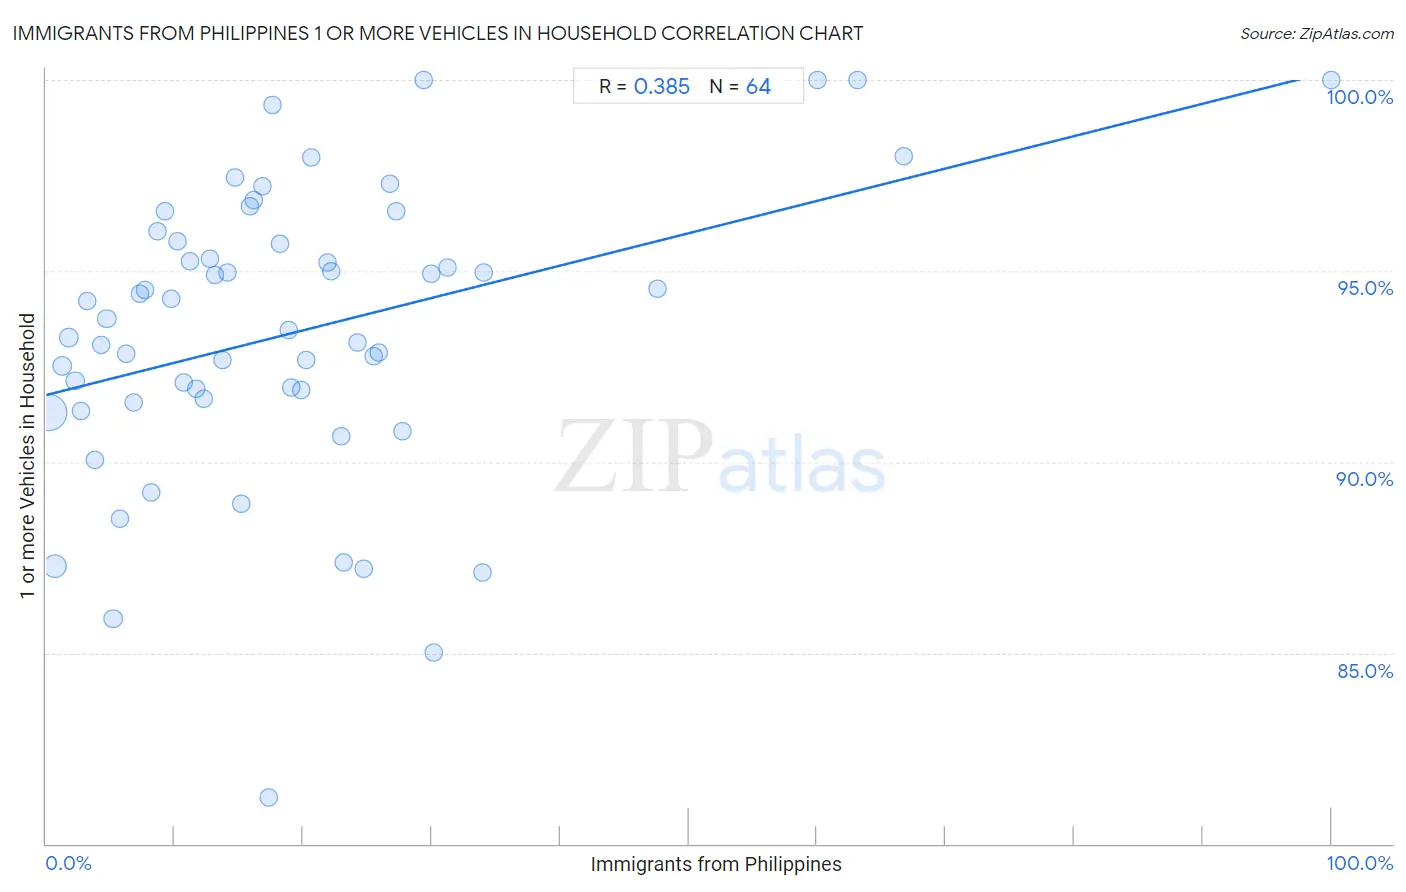
Immigrants from Philippines 1 or more Vehicles in Household Correlation Chart
The statistical analysis conducted on geographies consisting of 471,073,729 people shows a mild positive correlation between the proportion of Immigrants from Philippines and percentage of households with 1 or more vehicles available in the United States with a correlation coefficient (R) of 0.385 and weighted average of 91.5%. On average, for every 1% (one percent) increase in Immigrants from Philippines within a typical geography, there is an increase of 0.085% in percentage of households with 1 or more vehicles available.
It is essential to understand that the correlation between the percentage of Immigrants from Philippines and percentage of households with 1 or more vehicles available does not imply a direct cause-and-effect relationship. It remains uncertain whether the presence of Immigrants from Philippines influences an upward or downward trend in the level of percentage of households with 1 or more vehicles available within an area, or if Immigrants from Philippines simply ended up residing in those areas with higher or lower levels of percentage of households with 1 or more vehicles available due to other factors.
Demographics Similar to Immigrants from Philippines by 1 or more Vehicles in Household
In terms of 1 or more vehicles in household, the demographic groups most similar to Immigrants from Philippines are Iranian (91.5%, a difference of 0.0%), Immigrants from South Central Asia (91.5%, a difference of 0.020%), Bolivian (91.5%, a difference of 0.030%), Cuban (91.5%, a difference of 0.040%), and Portuguese (91.6%, a difference of 0.060%).
| Demographics | Rating | Rank | 1 or more Vehicles in Household |
| Lithuanians | 99.7 /100 | #70 | Exceptional 91.7% |
| Poles | 99.7 /100 | #71 | Exceptional 91.7% |
| Cajuns | 99.7 /100 | #72 | Exceptional 91.7% |
| Immigrants from Iran | 99.7 /100 | #73 | Exceptional 91.7% |
| Immigrants from Lebanon | 99.6 /100 | #74 | Exceptional 91.6% |
| Portuguese | 99.5 /100 | #75 | Exceptional 91.6% |
| Cubans | 99.5 /100 | #76 | Exceptional 91.5% |
| Immigrants from Philippines | 99.4 /100 | #77 | Exceptional 91.5% |
| Iranians | 99.4 /100 | #78 | Exceptional 91.5% |
| Immigrants from South Central Asia | 99.4 /100 | #79 | Exceptional 91.5% |
| Bolivians | 99.4 /100 | #80 | Exceptional 91.5% |
| Immigrants from South Eastern Asia | 99.3 /100 | #81 | Exceptional 91.4% |
| Lebanese | 99.3 /100 | #82 | Exceptional 91.4% |
| Immigrants from England | 99.3 /100 | #83 | Exceptional 91.4% |
| Jordanians | 99.3 /100 | #84 | Exceptional 91.4% |
Immigrants from Philippines 1 or more Vehicles in Household Correlation Summary
| Measurement | Immigrants from Philippines Data | 1 or more Vehicles in Household Data |
| Minimum | 0.21% | 81.2% |
| Maximum | 100.0% | 100.0% |
| Range | 99.8% | 18.8% |
| Mean | 19.3% | 93.4% |
| Median | 16.0% | 93.6% |
| Interquartile 25% (IQ1) | 7.9% | 91.6% |
| Interquartile 75% (IQ3) | 25.1% | 95.7% |
| Interquartile Range (IQR) | 17.1% | 4.1% |
| Standard Deviation (Sample) | 17.5% | 3.8% |
| Standard Deviation (Population) | 17.3% | 3.8% |
Correlation Details
| Immigrants from Philippines Percentile | Sample Size | 1 or more Vehicles in Household |
[ 0.0% - 0.5% ] 0.21% | 296,598,475 | 91.3% |
[ 0.5% - 1.0% ] 0.70% | 80,962,732 | 87.3% |
[ 1.0% - 1.5% ] 1.23% | 28,782,670 | 92.5% |
[ 1.5% - 2.0% ] 1.72% | 17,181,475 | 93.2% |
[ 2.0% - 2.5% ] 2.23% | 13,515,408 | 92.1% |
[ 2.5% - 3.0% ] 2.71% | 8,734,441 | 91.3% |
[ 3.0% - 3.5% ] 3.21% | 8,074,682 | 94.2% |
[ 3.5% - 4.0% ] 3.78% | 3,517,550 | 90.1% |
[ 4.0% - 4.5% ] 4.24% | 3,123,273 | 93.1% |
[ 4.5% - 5.0% ] 4.71% | 1,742,619 | 93.8% |
[ 5.0% - 5.5% ] 5.20% | 729,927 | 85.9% |
[ 5.5% - 6.0% ] 5.77% | 1,389,285 | 88.5% |
[ 6.0% - 6.5% ] 6.20% | 992,525 | 92.8% |
[ 6.5% - 7.0% ] 6.76% | 774,924 | 91.6% |
[ 7.0% - 7.5% ] 7.28% | 529,914 | 94.4% |
[ 7.5% - 8.0% ] 7.72% | 876,959 | 94.5% |
[ 8.0% - 8.5% ] 8.17% | 739,884 | 89.2% |
[ 8.5% - 9.0% ] 8.66% | 247,972 | 96.0% |
[ 9.0% - 9.5% ] 9.21% | 276,931 | 96.6% |
[ 9.5% - 10.0% ] 9.71% | 10,409 | 94.3% |
[ 10.0% - 10.5% ] 10.22% | 154,825 | 95.8% |
[ 10.5% - 11.0% ] 10.68% | 1,666 | 92.1% |
[ 11.0% - 11.5% ] 11.23% | 98,961 | 95.2% |
[ 11.5% - 12.0% ] 11.66% | 265,513 | 91.9% |
[ 12.0% - 12.5% ] 12.28% | 424,455 | 91.7% |
[ 12.5% - 13.0% ] 12.79% | 117,644 | 95.3% |
[ 13.0% - 13.5% ] 13.15% | 27,412 | 94.9% |
[ 13.5% - 14.0% ] 13.71% | 184,375 | 92.7% |
[ 14.0% - 14.5% ] 14.15% | 152,755 | 94.9% |
[ 14.5% - 15.0% ] 14.73% | 52,271 | 97.5% |
[ 15.0% - 15.5% ] 15.14% | 3,766 | 88.9% |
[ 15.5% - 16.0% ] 15.88% | 52,871 | 96.7% |
[ 16.0% - 16.5% ] 16.13% | 130,885 | 96.9% |
[ 16.5% - 17.0% ] 16.82% | 220 | 97.2% |
[ 17.0% - 17.5% ] 17.35% | 4,748 | 81.2% |
[ 17.5% - 18.0% ] 17.61% | 426 | 99.3% |
[ 18.0% - 18.5% ] 18.22% | 4,628 | 95.7% |
[ 18.5% - 19.0% ] 18.83% | 13,347 | 93.5% |
[ 19.0% - 19.5% ] 19.07% | 1,500 | 91.9% |
[ 19.5% - 20.0% ] 19.86% | 65,125 | 91.9% |
[ 20.0% - 20.5% ] 20.28% | 208,714 | 92.7% |
[ 20.5% - 21.0% ] 20.61% | 6,531 | 98.0% |
[ 21.5% - 22.0% ] 21.94% | 20,127 | 95.2% |
[ 22.0% - 22.5% ] 22.22% | 2,255 | 95.0% |
[ 22.5% - 23.0% ] 22.94% | 7,179 | 90.7% |
[ 23.0% - 23.5% ] 23.15% | 4,820 | 87.4% |
[ 24.0% - 24.5% ] 24.18% | 28,783 | 93.1% |
[ 24.5% - 25.0% ] 24.71% | 52,328 | 87.2% |
[ 25.0% - 25.5% ] 25.49% | 26,509 | 92.8% |
[ 25.5% - 26.0% ] 25.90% | 72,605 | 92.8% |
[ 26.5% - 27.0% ] 26.79% | 922 | 97.3% |
[ 27.0% - 27.5% ] 27.24% | 16,457 | 96.6% |
[ 27.5% - 28.0% ] 27.75% | 7,994 | 90.8% |
[ 29.0% - 29.5% ] 29.41% | 255 | 100.0% |
[ 29.5% - 30.0% ] 29.98% | 1,461 | 94.9% |
[ 30.0% - 30.5% ] 30.16% | 63 | 85.0% |
[ 31.0% - 31.5% ] 31.18% | 3,576 | 95.1% |
[ 33.5% - 34.0% ] 33.96% | 45,457 | 87.1% |
[ 34.0% - 34.5% ] 34.06% | 4,342 | 95.0% |
[ 47.5% - 48.0% ] 47.52% | 766 | 94.5% |
[ 60.0% - 60.5% ] 60.00% | 35 | 100.0% |
[ 63.0% - 63.5% ] 63.10% | 84 | 100.0% |
[ 66.5% - 67.0% ] 66.69% | 2,996 | 98.0% |
[ 99.5% - 100.0% ] 100.00% | 22 | 100.0% |