Immigrants from Lebanon Married-Couple Family Poverty

COMPARE

Immigrants from Lebanon
Race
Ancestry
AfghanAfricanAlaska NativeAlaskan AthabascanAlbanianAleutAlsatianAmericanApacheArabArapahoArgentineanArmenianAssyrian/Chaldean/SyriacAustralianAustrianBahamianBangladeshiBarbadianBasqueBelgianBelizeanBermudanBhutaneseBlackfeetBolivianBrazilianBritishBritish West IndianBulgarianBurmeseCajunCambodianCanadianCape VerdeanCarpatho RusynCelticCentral AmericanCentral American IndianCherokeeCheyenneChickasawChileanChineseChippewaChoctawColombianColvilleComancheCosta RicanCreeCreekCroatianCrowCubanCypriotCzechCzechoslovakianDanishDelawareDominicanDutchDutch West IndianEastern EuropeanEcuadorianEgyptianEnglishEstonianEthiopianEuropeanFijianFilipinoFinnishFrenchFrench American IndianFrench CanadianGermanGerman RussianGhanaianGreekGuamanian/ChamorroGuatemalanGuyaneseHaitianHmongHonduranHopiHoumaHungarianIcelanderIndian (Asian)IndonesianInupiatIranianIraqiIrishIroquoisIsraeliItalianJamaicanJapaneseJordanianKenyanKiowaKoreanLaotianLatvianLebaneseLiberianLithuanianLumbeeLuxembourgerMacedonianMalaysianMalteseMarshalleseMenomineeMexicanMexican American IndianMongolianMoroccanNative HawaiianNavajoNepaleseNew ZealanderNicaraguanNigerianNorthern EuropeanNorwegianOkinawanOsageOttawaPaiutePakistaniPalestinianPanamanianParaguayanPennsylvania GermanPeruvianPimaPolishPortuguesePotawatomiPuebloPuerto RicanPuget Sound SalishRomanianRussianSalvadoranSamoanScandinavianScotch-IrishScottishSeminoleSenegaleseSerbianShoshoneSierra LeoneanSiouxSlavicSlovakSloveneSomaliSouth AfricanSouth AmericanSouth American IndianSoviet UnionSpaniardSpanishSpanish AmericanSpanish American IndianSri LankanSubsaharan AfricanSudaneseSwedishSwissSyrianTaiwaneseThaiTlingit-HaidaTohono O'OdhamTonganTrinidadian and TobagonianTsimshianTurkishU.S. Virgin IslanderUgandanUkrainianUruguayanUteVenezuelanVietnameseWelshWest IndianYakamaYaquiYugoslavianYumanYup'ikZimbabwean
Immigration
NonimmigrantsImmigrantsAfghanistanAfricaAlbaniaArgentinaArmeniaAsiaAustraliaAustriaBahamasBangladeshBarbadosBelarusBelgiumBelizeBoliviaBosnia and HerzegovinaBrazilBulgariaBurma/MyanmarCabo VerdeCambodiaCameroonCanadaCaribbeanCentral AmericaChileChinaColombiaCongoCosta RicaCroatiaCubaCzechoslovakiaDenmarkDominicaDominican RepublicEastern AfricaEastern AsiaEastern EuropeEcuadorEgyptEl SalvadorEnglandEritreaEthiopiaEuropeFijiFranceGermanyGhanaGreeceGrenadaGuatemalaGuyanaHaitiHondurasHong KongHungaryIndiaIndonesiaIranIraqIrelandIsraelItalyJamaicaJapanJordanKazakhstanKenyaKoreaKuwaitLaosLatin AmericaLatviaLebanonLiberiaLithuaniaMalaysiaMexicoMicronesiaMiddle AfricaMoldovaMoroccoNepalNetherlandsNicaraguaNigeriaNorth AmericaNorth MacedoniaNorthern AfricaNorthern EuropeNorwayOceaniaPakistanPanamaPeruPhilippinesPolandPortugalRomaniaRussiaSaudi ArabiaScotlandSenegalSerbiaSierra LeoneSingaporeSomaliaSouth AfricaSouth AmericaSouth Central AsiaSouth Eastern AsiaSouthern EuropeSpainSri LankaSt. Vincent and the GrenadinesSudanSwedenSwitzerlandSyriaTaiwanThailandTrinidad and TobagoTurkeyUgandaUkraineUruguayUzbekistanVenezuelaVietnamWest IndiesWestern AfricaWestern AsiaWestern EuropeYemenZaireZimbabweAzores
Select to Compare
Race
Ancestry
AfghanAfricanAlaska NativeAlaskan AthabascanAlbanianAleutAlsatianAmericanApacheArabArapahoArgentineanArmenianAssyrian/Chaldean/SyriacAustralianAustrianBahamianBangladeshiBarbadianBasqueBelgianBelizeanBermudanBhutaneseBlackfeetBolivianBrazilianBritishBritish West IndianBulgarianBurmeseCajunCambodianCanadianCape VerdeanCarpatho RusynCelticCentral AmericanCentral American IndianCherokeeCheyenneChickasawChileanChineseChippewaChoctawColombianColvilleComancheCosta RicanCreeCreekCroatianCrowCubanCypriotCzechCzechoslovakianDanishDelawareDominicanDutchDutch West IndianEastern EuropeanEcuadorianEgyptianEnglishEstonianEthiopianEuropeanFijianFilipinoFinnishFrenchFrench American IndianFrench CanadianGermanGerman RussianGhanaianGreekGuamanian/ChamorroGuatemalanGuyaneseHaitianHmongHonduranHopiHoumaHungarianIcelanderIndian (Asian)IndonesianInupiatIranianIraqiIrishIroquoisIsraeliItalianJamaicanJapaneseJordanianKenyanKiowaKoreanLaotianLatvianLebaneseLiberianLithuanianLumbeeLuxembourgerMacedonianMalaysianMalteseMarshalleseMenomineeMexicanMexican American IndianMongolianMoroccanNative HawaiianNavajoNepaleseNew ZealanderNicaraguanNigerianNorthern EuropeanNorwegianOkinawanOsageOttawaPaiutePakistaniPalestinianPanamanianParaguayanPennsylvania GermanPeruvianPimaPolishPortuguesePotawatomiPuebloPuerto RicanPuget Sound SalishRomanianRussianSalvadoranSamoanScandinavianScotch-IrishScottishSeminoleSenegaleseSerbianShoshoneSierra LeoneanSiouxSlavicSlovakSloveneSomaliSouth AfricanSouth AmericanSouth American IndianSoviet UnionSpaniardSpanishSpanish AmericanSpanish American IndianSri LankanSubsaharan AfricanSudaneseSwedishSwissSyrianTaiwaneseThaiTlingit-HaidaTohono O'OdhamTonganTrinidadian and TobagonianTsimshianTurkishU.S. Virgin IslanderUgandanUkrainianUruguayanUteVenezuelanVietnameseWelshWest IndianYakamaYaquiYugoslavianYumanYup'ikZimbabwean
Immigration
NonimmigrantsImmigrantsAfghanistanAfricaAlbaniaArgentinaArmeniaAsiaAustraliaAustriaBahamasBangladeshBarbadosBelarusBelgiumBelizeBoliviaBosnia and HerzegovinaBrazilBulgariaBurma/MyanmarCabo VerdeCambodiaCameroonCanadaCaribbeanCentral AmericaChileChinaColombiaCongoCosta RicaCroatiaCubaCzechoslovakiaDenmarkDominicaDominican RepublicEastern AfricaEastern AsiaEastern EuropeEcuadorEgyptEl SalvadorEnglandEritreaEthiopiaEuropeFijiFranceGermanyGhanaGreeceGrenadaGuatemalaGuyanaHaitiHondurasHong KongHungaryIndiaIndonesiaIranIraqIrelandIsraelItalyJamaicaJapanJordanKazakhstanKenyaKoreaKuwaitLaosLatin AmericaLatviaLiberiaLithuaniaMalaysiaMexicoMicronesiaMiddle AfricaMoldovaMoroccoNepalNetherlandsNicaraguaNigeriaNorth AmericaNorth MacedoniaNorthern AfricaNorthern EuropeNorwayOceaniaPakistanPanamaPeruPhilippinesPolandPortugalRomaniaRussiaSaudi ArabiaScotlandSenegalSerbiaSierra LeoneSingaporeSomaliaSouth AfricaSouth AmericaSouth Central AsiaSouth Eastern AsiaSouthern EuropeSpainSri LankaSt. Vincent and the GrenadinesSudanSwedenSwitzerlandSyriaTaiwanThailandTrinidad and TobagoTurkeyUgandaUkraineUruguayUzbekistanVenezuelaVietnamWest IndiesWestern AfricaWestern AsiaWestern EuropeYemenZaireZimbabweAzores
Married-Couple Family Poverty
Income
Poverty
Unemployment
Labor Participation
Family Structure
Vehicle Availability
Education Level
Disability

Immigrants from Lebanon Married-Couple Family Poverty
Tragic

6.6%
POVERTY | MARRIED-COUPLE FAMILIES
0.0/ 100
METRIC RATING
292nd/ 347
METRIC RANK

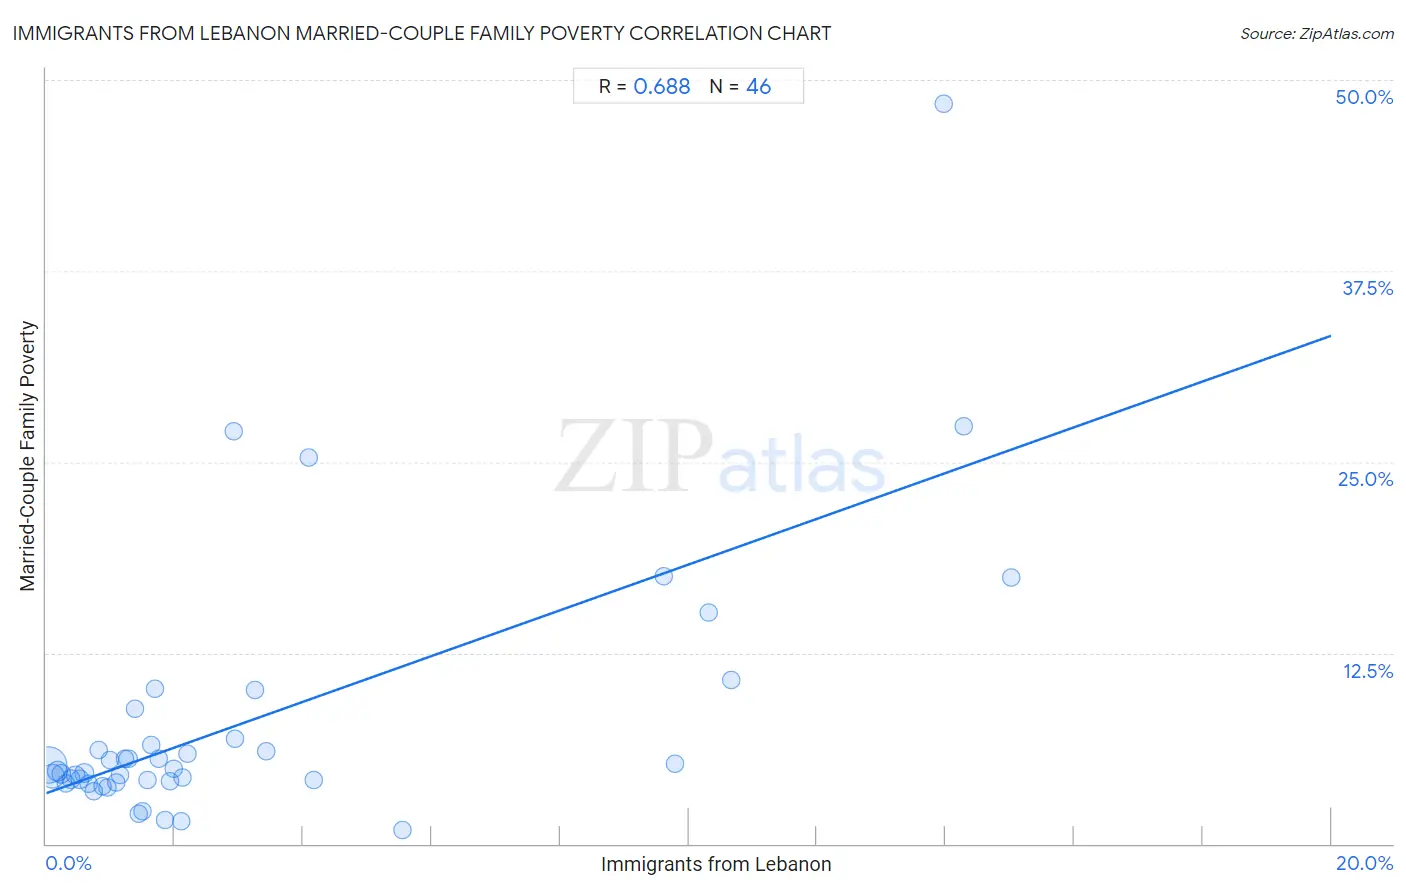
Immigrants from Lebanon Married-Couple Family Poverty Correlation Chart

The statistical analysis conducted on geographies consisting of 216,189,753 people shows a significant positive correlation between the proportion of Immigrants from Lebanon and poverty level among married-couple families in the United States with a correlation coefficient (R) of 0.688 and weighted average of 6.6%. On average, for every 1% (one percent) increase in Immigrants from Lebanon within a typical geography, there is an increase of 1.5% in poverty level among married-couple families.
Immigrants from Lebanon Married-Couple Family Poverty
It is essential to understand that the correlation between the percentage of Immigrants from Lebanon and poverty level among married-couple families does not imply a direct cause-and-effect relationship. It remains uncertain whether the presence of Immigrants from Lebanon influences an upward or downward trend in the level of poverty level among married-couple families within an area, or if Immigrants from Lebanon simply ended up residing in those areas with higher or lower levels of poverty level among married-couple families due to other factors.

Demographics Similar to Immigrants from Lebanon by Married-Couple Family Poverty

In terms of married-couple family poverty, the demographic groups most similar to Immigrants from Lebanon are Arapaho (6.6%, a difference of 0.080%), Belizean (6.5%, a difference of 0.17%), Immigrants from Barbados (6.5%, a difference of 0.21%), Nepalese (6.5%, a difference of 0.44%), and Salvadoran (6.5%, a difference of 0.61%).
DemographicsRating | RankMarried-Couple Family Poverty
Blacks/African Americans
0.0
/100
|
#285
Tragic
6.5%
Guyanese
0.0
/100
|
#286
Tragic
6.5%
Ecuadorians
0.0
/100
|
#287
Tragic
6.5%
Salvadorans
0.0
/100
|
#288
Tragic
6.5%
Nepalese
0.0
/100
|
#289
Tragic
6.5%
Immigrants from Barbados
0.0
/100
|
#290
Tragic
6.5%
Belizeans
0.0
/100
|
#291
Tragic
6.5%
Immigrants from Lebanon
0.0
/100
|
#292
Tragic
6.6%
Arapaho
0.0
/100
|
#293
Tragic
6.6%
Bahamians
0.0
/100
|
#294
Tragic
6.6%
Immigrants from Uzbekistan
0.0
/100
|
#295
Tragic
6.6%
U.S. Virgin Islanders
0.0
/100
|
#296
Tragic
6.6%
Kiowa
0.0
/100
|
#297
Tragic
6.6%
Immigrants from Guyana
0.0
/100
|
#298
Tragic
6.7%
Nicaraguans
0.0
/100
|
#299
Tragic
6.7%

Immigrants from Lebanon Married-Couple Family Poverty Correlation Summary

MeasurementImmigrants from Lebanon DataMarried-Couple Family Poverty Data
Minimum0.032%0.93%
Maximum15.0%48.5%
Range15.0%47.6%
Mean3.2%8.0%
Median1.6%4.8%
Interquartile 25% (IQ1)0.82%4.1%
Interquartile 75% (IQ3)3.3%6.8%
Interquartile Range (IQR)2.4%2.8%
Standard Deviation (Sample)4.0%8.8%
Standard Deviation (Population)4.0%8.7%

Correlation Details

Immigrants from Lebanon PercentileSample SizeMarried-Couple Family Poverty
[
0.0%
-
0.5%
]
0.032%
131,873,4075.2%
[
0.0%
-
0.5%
]
0.096%
44,393,5344.4%
[
0.0%
-
0.5%
]
0.17%
17,852,0114.7%
[
0.0%
-
0.5%
]
0.24%
7,541,9934.6%
[
0.0%
-
0.5%
]
0.31%
4,136,4813.9%
[
0.0%
-
0.5%
]
0.38%
2,671,2604.2%
[
0.0%
-
0.5%
]
0.46%
1,589,8354.5%
[
0.5%
-
1.0%
]
0.53%
1,500,7284.2%
[
0.5%
-
1.0%
]
0.59%
1,202,2254.6%
[
0.5%
-
1.0%
]
0.66%
485,1903.9%
[
0.5%
-
1.0%
]
0.73%
223,5573.4%
[
0.5%
-
1.0%
]
0.82%
322,3876.2%
[
0.5%
-
1.0%
]
0.87%
396,0723.8%
[
0.5%
-
1.0%
]
0.95%
392,1673.7%
[
1.0%
-
1.5%
]
1.00%
131,8995.5%
[
1.0%
-
1.5%
]
1.09%
231,2954.0%
[
1.0%
-
1.5%
]
1.15%
32,9274.5%
[
1.0%
-
1.5%
]
1.23%
210,3785.6%
[
1.0%
-
1.5%
]
1.27%
358,2855.6%
[
1.0%
-
1.5%
]
1.38%
67,4168.8%
[
1.0%
-
1.5%
]
1.43%
26,5362.0%
[
1.0%
-
1.5%
]
1.49%
33,2782.1%
[
1.5%
-
2.0%
]
1.57%
2554.2%
[
1.5%
-
2.0%
]
1.63%
6,0836.5%
[
1.5%
-
2.0%
]
1.69%
22,08210.2%
[
1.5%
-
2.0%
]
1.75%
40,6015.6%
[
1.5%
-
2.0%
]
1.85%
12,8401.5%
[
1.5%
-
2.0%
]
1.93%
35,4084.1%
[
1.5%
-
2.0%
]
1.98%
6,2604.9%
[
2.0%
-
2.5%
]
2.09%
24,2291.4%
[
2.0%
-
2.5%
]
2.11%
15,3774.3%
[
2.0%
-
2.5%
]
2.20%
3,5445.9%
[
2.5%
-
3.0%
]
2.93%
20527.0%
[
2.5%
-
3.0%
]
2.94%
22,8316.8%
[
3.0%
-
3.5%
]
3.25%
98410.0%
[
3.0%
-
3.5%
]
3.42%
34,0466.1%
[
4.0%
-
4.5%
]
4.08%
8,91925.3%
[
4.0%
-
4.5%
]
4.17%
2,5894.2%
[
5.5%
-
6.0%
]
5.54%
3,2520.93%
[
9.5%
-
10.0%
]
9.61%
108,41417.6%
[
9.5%
-
10.0%
]
9.79%
4295.3%
[
10.0%
-
10.5%
]
10.31%
62,47415.1%
[
10.5%
-
11.0%
]
10.66%
12,40510.8%
[
13.5%
-
14.0%
]
13.97%
22948.5%
[
14.0%
-
14.5%
]
14.27%
53,04427.3%
[
15.0%
-
15.5%
]
15.03%
40,39217.4%