Immigrants from Ghana Married-Couple Family Poverty
COMPARE
Immigrants from Ghana
Select to Compare
Married-Couple Family Poverty
Immigrants from Ghana Married-Couple Family Poverty
5.9%
POVERTY | MARRIED-COUPLE FAMILIES
1.0/ 100
METRIC RATING
251st/ 347
METRIC RANK
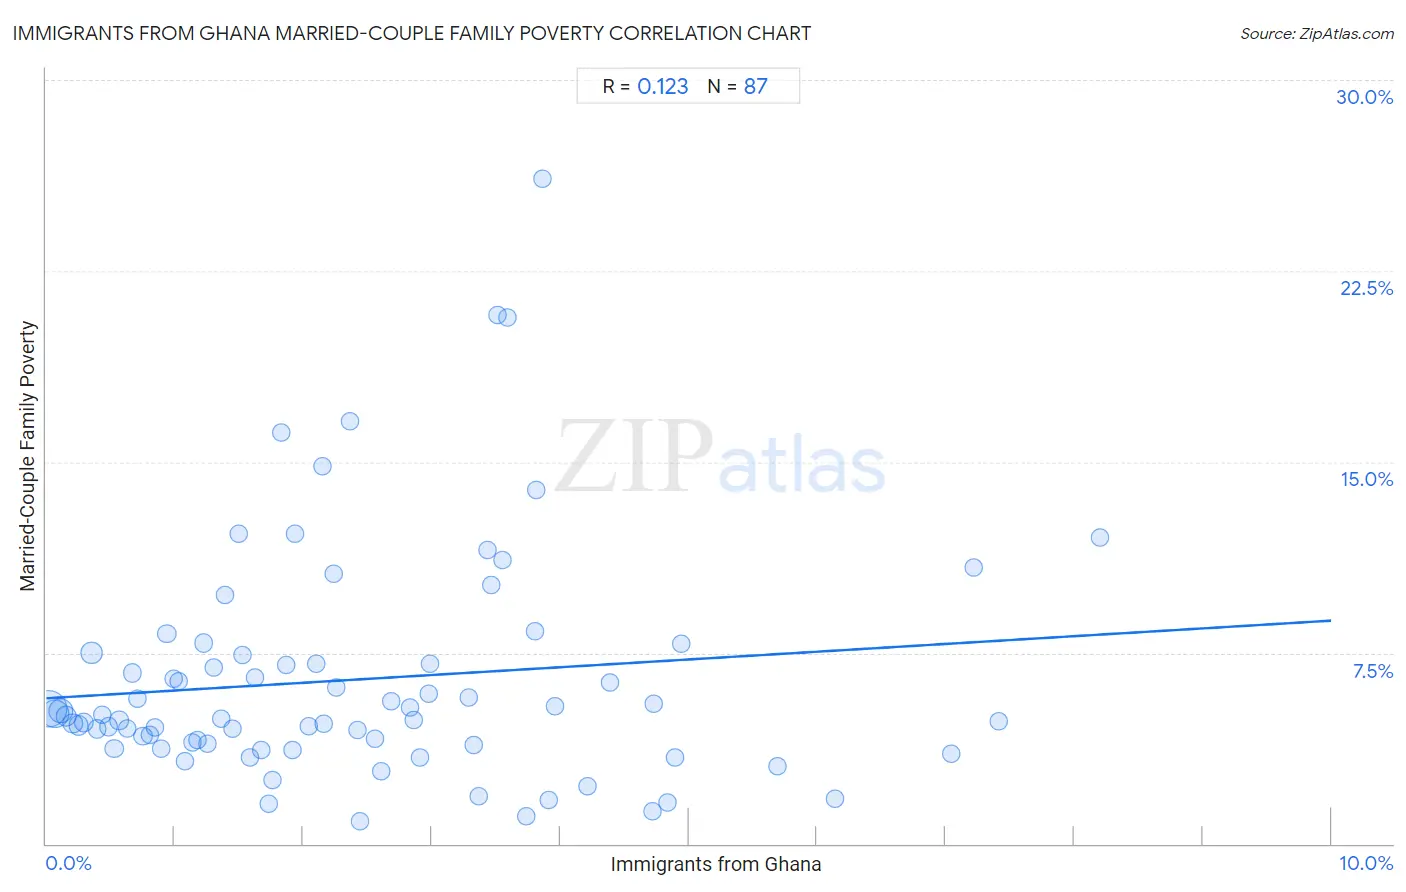
Immigrants from Ghana Married-Couple Family Poverty Correlation Chart
The statistical analysis conducted on geographies consisting of 198,995,588 people shows a poor positive correlation between the proportion of Immigrants from Ghana and poverty level among married-couple families in the United States with a correlation coefficient (R) of 0.123 and weighted average of 5.9%. On average, for every 1% (one percent) increase in Immigrants from Ghana within a typical geography, there is an increase of 0.30% in poverty level among married-couple families.
It is essential to understand that the correlation between the percentage of Immigrants from Ghana and poverty level among married-couple families does not imply a direct cause-and-effect relationship. It remains uncertain whether the presence of Immigrants from Ghana influences an upward or downward trend in the level of poverty level among married-couple families within an area, or if Immigrants from Ghana simply ended up residing in those areas with higher or lower levels of poverty level among married-couple families due to other factors.
Demographics Similar to Immigrants from Ghana by Married-Couple Family Poverty
In terms of married-couple family poverty, the demographic groups most similar to Immigrants from Ghana are Immigrants from Eritrea (5.9%, a difference of 0.25%), Tsimshian (5.9%, a difference of 0.46%), Cree (5.9%, a difference of 0.57%), Immigrants from Western Asia (6.0%, a difference of 0.64%), and African (6.0%, a difference of 0.73%).
| Demographics | Rating | Rank | Married-Couple Family Poverty |
| Chickasaw | 2.3 /100 | #244 | Tragic 5.8% |
| Immigrants from Afghanistan | 2.1 /100 | #245 | Tragic 5.8% |
| Immigrants from Venezuela | 1.8 /100 | #246 | Tragic 5.8% |
| Iraqis | 1.4 /100 | #247 | Tragic 5.9% |
| Cree | 1.2 /100 | #248 | Tragic 5.9% |
| Tsimshian | 1.1 /100 | #249 | Tragic 5.9% |
| Immigrants from Eritrea | 1.1 /100 | #250 | Tragic 5.9% |
| Immigrants from Ghana | 1.0 /100 | #251 | Tragic 5.9% |
| Immigrants from Western Asia | 0.7 /100 | #252 | Tragic 6.0% |
| Africans | 0.7 /100 | #253 | Tragic 6.0% |
| Immigrants from Somalia | 0.7 /100 | #254 | Tragic 6.0% |
| Comanche | 0.7 /100 | #255 | Tragic 6.0% |
| Bangladeshis | 0.5 /100 | #256 | Tragic 6.0% |
| Immigrants from Burma/Myanmar | 0.5 /100 | #257 | Tragic 6.0% |
| Immigrants | 0.5 /100 | #258 | Tragic 6.0% |
Immigrants from Ghana Married-Couple Family Poverty Correlation Summary
| Measurement | Immigrants from Ghana Data | Married-Couple Family Poverty Data |
| Minimum | 0.023% | 0.88% |
| Maximum | 8.2% | 26.1% |
| Range | 8.2% | 25.3% |
| Mean | 2.4% | 6.4% |
| Median | 2.0% | 5.0% |
| Interquartile 25% (IQ1) | 0.99% | 3.9% |
| Interquartile 75% (IQ3) | 3.5% | 7.4% |
| Interquartile Range (IQR) | 2.5% | 3.6% |
| Standard Deviation (Sample) | 1.8% | 4.5% |
| Standard Deviation (Population) | 1.8% | 4.5% |
Correlation Details
| Immigrants from Ghana Percentile | Sample Size | Married-Couple Family Poverty |
[ 0.0% - 0.5% ] 0.023% | 71,929,166 | 5.3% |
[ 0.0% - 0.5% ] 0.068% | 38,191,202 | 5.1% |
[ 0.0% - 0.5% ] 0.11% | 27,270,552 | 5.2% |
[ 0.0% - 0.5% ] 0.16% | 10,083,265 | 5.0% |
[ 0.0% - 0.5% ] 0.21% | 7,557,037 | 4.7% |
[ 0.0% - 0.5% ] 0.25% | 6,266,464 | 4.6% |
[ 0.0% - 0.5% ] 0.30% | 4,434,816 | 4.7% |
[ 0.0% - 0.5% ] 0.35% | 11,720,284 | 7.5% |
[ 0.0% - 0.5% ] 0.39% | 3,155,727 | 4.5% |
[ 0.0% - 0.5% ] 0.44% | 1,803,968 | 5.1% |
[ 0.0% - 0.5% ] 0.48% | 1,683,895 | 4.6% |
[ 0.5% - 1.0% ] 0.53% | 1,218,848 | 3.7% |
[ 0.5% - 1.0% ] 0.57% | 1,437,392 | 4.8% |
[ 0.5% - 1.0% ] 0.63% | 1,944,939 | 4.5% |
[ 0.5% - 1.0% ] 0.67% | 1,059,979 | 6.7% |
[ 0.5% - 1.0% ] 0.71% | 512,546 | 5.7% |
[ 0.5% - 1.0% ] 0.75% | 737,997 | 4.2% |
[ 0.5% - 1.0% ] 0.81% | 796,799 | 4.3% |
[ 0.5% - 1.0% ] 0.84% | 473,327 | 4.6% |
[ 0.5% - 1.0% ] 0.89% | 646,840 | 3.7% |
[ 0.5% - 1.0% ] 0.94% | 274,678 | 8.3% |
[ 0.5% - 1.0% ] 0.99% | 514,521 | 6.5% |
[ 1.0% - 1.5% ] 1.03% | 316,559 | 6.4% |
[ 1.0% - 1.5% ] 1.08% | 308,379 | 3.3% |
[ 1.0% - 1.5% ] 1.14% | 257,914 | 4.0% |
[ 1.0% - 1.5% ] 1.18% | 138,594 | 4.1% |
[ 1.0% - 1.5% ] 1.23% | 625,687 | 7.9% |
[ 1.0% - 1.5% ] 1.26% | 327,487 | 3.9% |
[ 1.0% - 1.5% ] 1.30% | 146,006 | 6.9% |
[ 1.0% - 1.5% ] 1.36% | 108,982 | 4.9% |
[ 1.0% - 1.5% ] 1.39% | 142,154 | 9.8% |
[ 1.0% - 1.5% ] 1.45% | 154,911 | 4.5% |
[ 1.0% - 1.5% ] 1.50% | 109,880 | 12.2% |
[ 1.5% - 2.0% ] 1.53% | 140,371 | 7.4% |
[ 1.5% - 2.0% ] 1.58% | 334,906 | 3.4% |
[ 1.5% - 2.0% ] 1.63% | 68,032 | 6.5% |
[ 1.5% - 2.0% ] 1.67% | 63,130 | 3.7% |
[ 1.5% - 2.0% ] 1.73% | 55,782 | 1.6% |
[ 1.5% - 2.0% ] 1.77% | 29,115 | 2.5% |
[ 1.5% - 2.0% ] 1.83% | 27,033 | 16.2% |
[ 1.5% - 2.0% ] 1.86% | 240,968 | 7.0% |
[ 1.5% - 2.0% ] 1.91% | 2,770 | 3.7% |
[ 1.5% - 2.0% ] 1.94% | 160,730 | 12.2% |
[ 2.0% - 2.5% ] 2.04% | 25,568 | 4.6% |
[ 2.0% - 2.5% ] 2.10% | 60,268 | 7.1% |
[ 2.0% - 2.5% ] 2.15% | 88,575 | 14.8% |
[ 2.0% - 2.5% ] 2.16% | 24,158 | 4.7% |
[ 2.0% - 2.5% ] 2.24% | 76,720 | 10.6% |
[ 2.0% - 2.5% ] 2.26% | 95,097 | 6.1% |
[ 2.0% - 2.5% ] 2.37% | 113,017 | 16.6% |
[ 2.0% - 2.5% ] 2.42% | 7,528 | 4.5% |
[ 2.0% - 2.5% ] 2.44% | 15,522 | 0.88% |
[ 2.5% - 3.0% ] 2.56% | 59,318 | 4.1% |
[ 2.5% - 3.0% ] 2.60% | 384 | 2.9% |
[ 2.5% - 3.0% ] 2.68% | 78,884 | 5.6% |
[ 2.5% - 3.0% ] 2.83% | 60,046 | 5.3% |
[ 2.5% - 3.0% ] 2.86% | 16,620 | 4.8% |
[ 2.5% - 3.0% ] 2.91% | 17,792 | 3.4% |
[ 2.5% - 3.0% ] 2.98% | 8,630 | 5.9% |
[ 2.5% - 3.0% ] 2.99% | 208,736 | 7.1% |
[ 3.0% - 3.5% ] 3.29% | 18,054 | 5.7% |
[ 3.0% - 3.5% ] 3.33% | 3,157 | 3.9% |
[ 3.0% - 3.5% ] 3.36% | 16,680 | 1.9% |
[ 3.0% - 3.5% ] 3.43% | 55,168 | 11.6% |
[ 3.0% - 3.5% ] 3.46% | 1,705 | 10.1% |
[ 3.5% - 4.0% ] 3.51% | 427 | 20.8% |
[ 3.5% - 4.0% ] 3.56% | 36,538 | 11.1% |
[ 3.5% - 4.0% ] 3.59% | 78,624 | 20.7% |
[ 3.5% - 4.0% ] 3.73% | 6,295 | 1.1% |
[ 3.5% - 4.0% ] 3.80% | 8,291 | 8.3% |
[ 3.5% - 4.0% ] 3.81% | 79,817 | 13.9% |
[ 3.5% - 4.0% ] 3.86% | 3,056 | 26.1% |
[ 3.5% - 4.0% ] 3.91% | 1,894 | 1.7% |
[ 3.5% - 4.0% ] 3.96% | 23,110 | 5.4% |
[ 4.0% - 4.5% ] 4.22% | 3,202 | 2.3% |
[ 4.0% - 4.5% ] 4.38% | 30,819 | 6.3% |
[ 4.5% - 5.0% ] 4.71% | 1,315 | 1.3% |
[ 4.5% - 5.0% ] 4.73% | 72,215 | 5.5% |
[ 4.5% - 5.0% ] 4.84% | 10,316 | 1.6% |
[ 4.5% - 5.0% ] 4.89% | 19,938 | 3.4% |
[ 4.5% - 5.0% ] 4.94% | 4,793 | 7.9% |
[ 5.5% - 6.0% ] 5.69% | 1,107 | 3.1% |
[ 6.0% - 6.5% ] 6.14% | 1,010 | 1.8% |
[ 7.0% - 7.5% ] 7.04% | 22,114 | 3.5% |
[ 7.0% - 7.5% ] 7.22% | 40,724 | 10.9% |
[ 7.0% - 7.5% ] 7.42% | 22,505 | 4.8% |
[ 8.0% - 8.5% ] 8.20% | 2,219 | 12.0% |